2q 2016 results - axiata group berhad - investor...
TRANSCRIPT

2Q 2016 Results
25 August 2016
Tan Sri Jamaludin Ibrahim, President & Group CEO
Chari TVT, Group CFO
2Q 2016 2
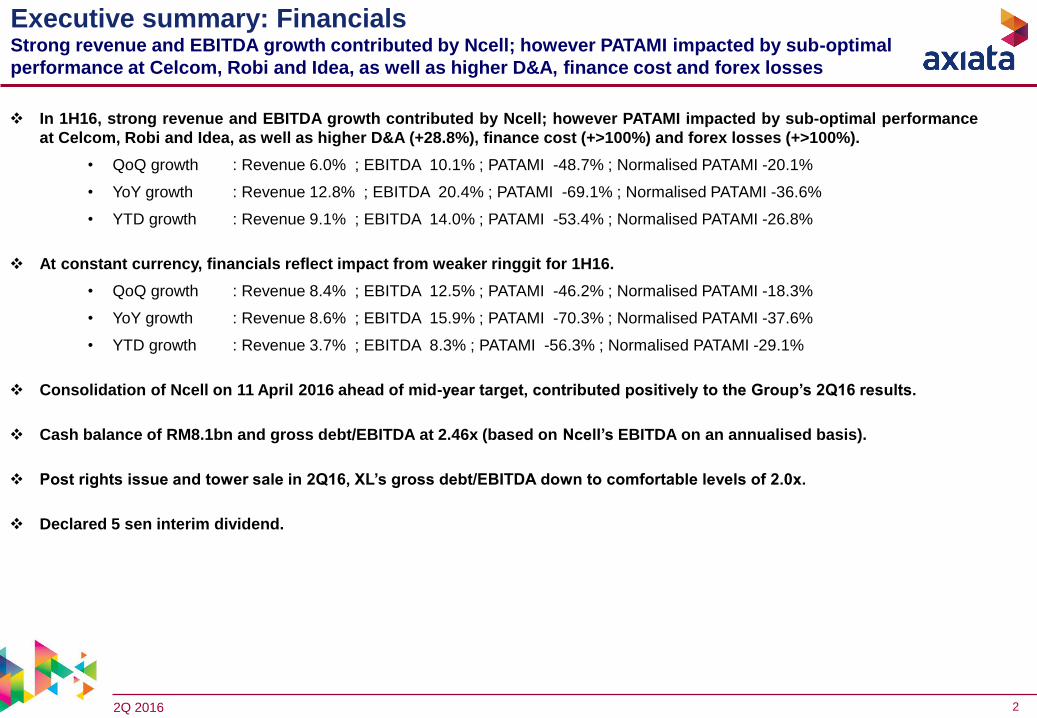
Executive summary: FinancialsStrong revenue and EBITDA growth contributed by Ncell; however PATAMI impacted by sub-optimal
performance at Celcom, Robi and Idea, as well as higher D&A, finance cost and forex losses
In 1H16, strong revenue and EBITDA growth contributed by Ncell; however PATAMI impacted by sub-optimal performance
at Celcom, Robi and Idea, as well as higher D&A (+28.8%), finance cost (+>100%) and forex losses (+>100%).
• QoQ growth : Revenue 6.0% ; EBITDA 10.1% ; PATAMI -48.7% ; Normalised PATAMI -20.1%
• YoY growth : Revenue 12.8% ; EBITDA 20.4% ; PATAMI -69.1% ; Normalised PATAMI -36.6%
• YTD growth : Revenue 9.1% ; EBITDA 14.0% ; PATAMI -53.4% ; Normalised PATAMI -26.8%
At constant currency, financials reflect impact from weaker ringgit for 1H16.
• QoQ growth : Revenue 8.4% ; EBITDA 12.5% ; PATAMI -46.2% ; Normalised PATAMI -18.3%
• YoY growth : Revenue 8.6% ; EBITDA 15.9% ; PATAMI -70.3% ; Normalised PATAMI -37.6%
• YTD growth : Revenue 3.7% ; EBITDA 8.3% ; PATAMI -56.3% ; Normalised PATAMI -29.1%
Consolidation of Ncell on 11 April 2016 ahead of mid-year target, contributed positively to the Group’s 2Q16 results.
Cash balance of RM8.1bn and gross debt/EBITDA at 2.46x (based on Ncell’s EBITDA on an annualised basis).
Post rights issue and tower sale in 2Q16, XL’s gross debt/EBITDA down to comfortable levels of 2.0x.
Declared 5 sen interim dividend.

2Q 2016 3
Key Group highlights (1/5):Celcom: Continued sub-par performance due to lower revenue contribution from VAS
and OFW
Note: Growth number based on results in local currency in respective operating markets
• Sub-par YTD performance primarily due to the decline in revenue contribution from VAS (-39.4%)and overseas foreign workers (-26.3%).
• Celcom’s YTD revenue, normalised EBITDA and normalised PATAMI growth is -10.2%, -13.3%,and -23.3%, respectively.
• Continued positive postpaid traction post launching of new data-led plan First Gold 80 inFebruary, adding 57k subscribers in 2Q16 (+37K in 1Q16).
• Prepaid subscriber base declined 9.7% QoQ due to competition and delay in the launch of newproducts.
• YTD16 mobile data revenue grew by 7.6% driven by an increase in mobile internet revenue of18.8%.
2Q 2016 4
Note: Growth number based on results in local currency in respective operating markets
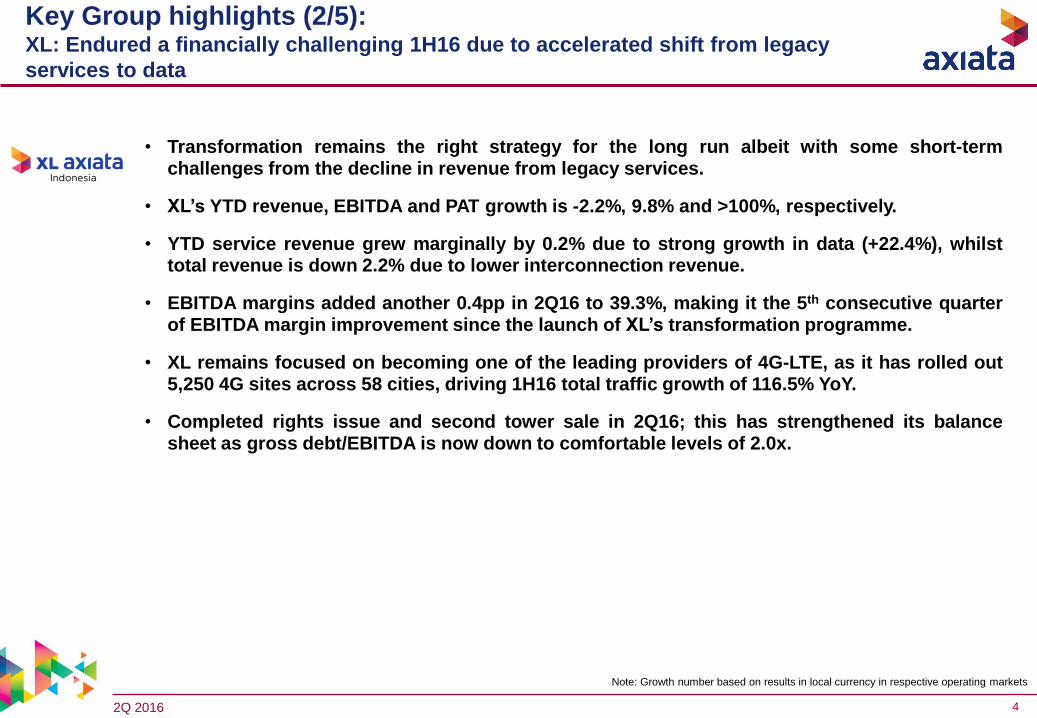
Key Group highlights (2/5):XL: Endured a financially challenging 1H16 due to accelerated shift from legacy
services to data
• Transformation remains the right strategy for the long run albeit with some short-termchallenges from the decline in revenue from legacy services.
• XL’s YTD revenue, EBITDA and PAT growth is -2.2%, 9.8% and >100%, respectively.
• YTD service revenue grew marginally by 0.2% due to strong growth in data (+22.4%), whilsttotal revenue is down 2.2% due to lower interconnection revenue.
• EBITDA margins added another 0.4pp in 2Q16 to 39.3%, making it the 5th consecutive quarterof EBITDA margin improvement since the launch of XL’s transformation programme.
• XL remains focused on becoming one of the leading providers of 4G-LTE, as it has rolled out5,250 4G sites across 58 cities, driving 1H16 total traffic growth of 116.5% YoY.
• Completed rights issue and second tower sale in 2Q16; this has strengthened its balancesheet as gross debt/EBITDA is now down to comfortable levels of 2.0x.

2Q 2016 5
Note: Growth number based on results in local currency in respective operating markets
• Flat performance post the completion of SIM bio-metric registration but PAT impacted by higherdepreciation (for network swap), interest expense and revised tax rate.
• Robi’s YTD revenue, normalised EBITDA and normalised PAT growth is -3.4%, -10.6% and -43.1%respectively.
• Data subscribers grew 4.6% YoY to 13.3m, driving YTD data revenue growth of 24.8%. YTD datarevenue accounted for 12.2% of Robi’s total revenue.
Key Group highlights (3/5):Smart and Dialog maintained strong YTD growth, while Robi was impacted by higher
D&A, interest expense and revised tax rate
• Continues to deliver strong performance across all business units with YTD revenue growth formobile, fixed and pay-TV operations at 20.3%, 23.6% and 12.1%, respectively.
• Dialog’s YTD revenue, EBITDA and PAT growth is 20.4%, 18.3% and 27.5% respectively.
• Dialog’s 2Q16 revenue was flat QoQ impacted by adverse weather conditions and introduction ofVAT and NBT at 15% and 2% respectively in early May.
• Mobile data revenue grew by 56.5% YTD, as data accounted for 21.1% of Dialog’s mobile revenue.
• Rising smartphone penetration and strong data traffic growth delivers further improvement inSmart’s profitability.
• Smart’s YTD revenue, EBITDA and PAT growth is 8.6%, 8.6% and 29.2% respectively.
• Data subscribers grew 45.9% YoY to 3.3m, driving YTD data revenue growth of 44.6%. YTD datarevenue accounted for 39.2% of Smart’s total revenue.

2Q 2016 6
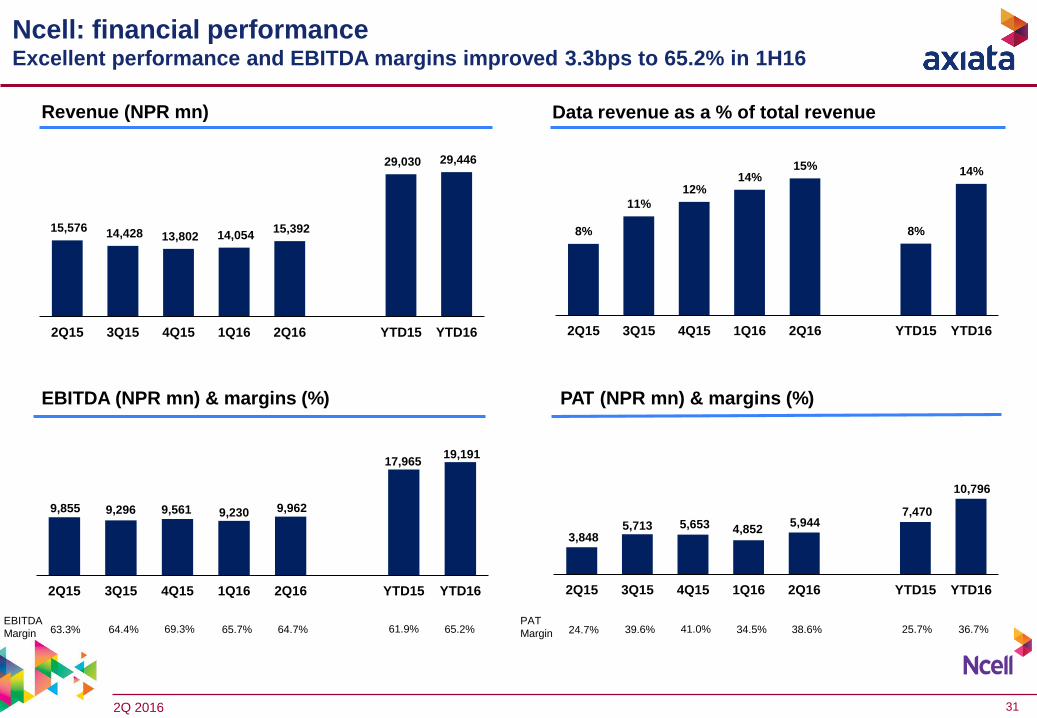
Key Group highlights (4/5):Ncell: Completion of acquisition on 11 April contributed 2.5 months to Group’s
2Q16 results; 2Q16 performance better than investment plan
Note: Growth number based on results in local currency in respective operating markets
• Axiata completed the acquisition of Ncell ahead of schedule on 11 April 2016 and consolidated2.5 months of Ncell’s results. Thus far, performance is better than investment plan.
• Ncell’s YTD revenue, EBITDA and PAT growth is 1.4%, 6.8% and 44.5%, respectively.
• YTD EBITDA margin increased 3.3pp to 65.2%, largely driven by lower direct expenses.
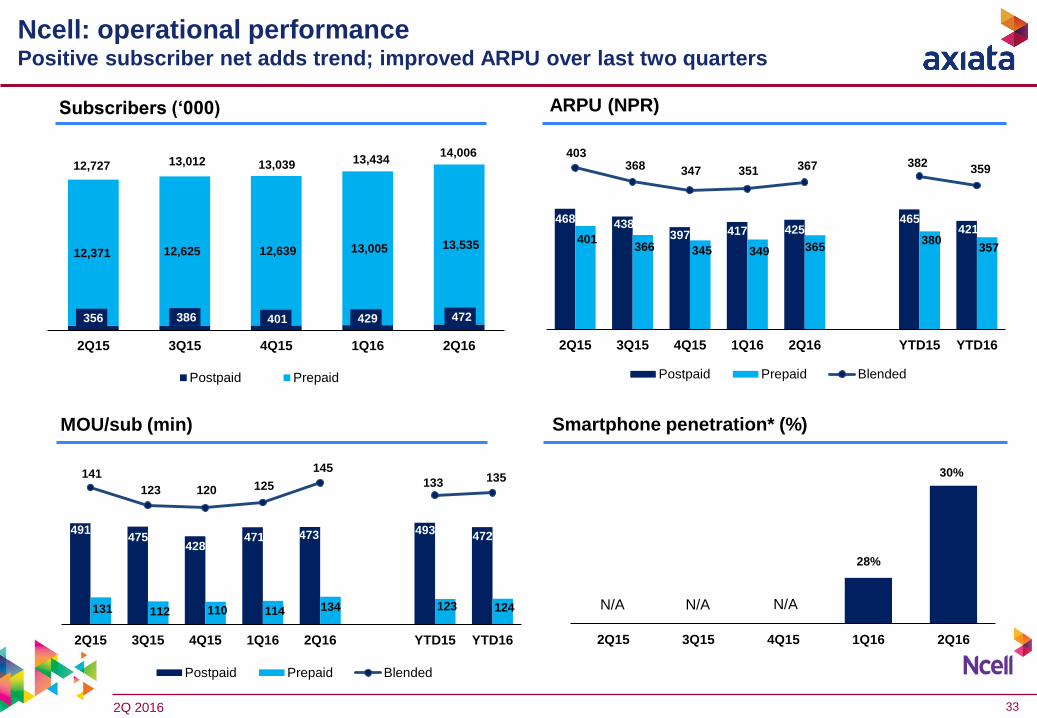
• Subscriber base increased 10.0% YoY from both prepaid (+9.4%) and postpaid (+32.6%).
• Data subscribers grew 22.8% YoY to 5.8m, driving YTD data revenue growth of 86.3%. YTDdata revenue accounted for 14.4% of Ncell’s total revenue.
• Post acquisition, purchase price allocation (PPA) accounting adjustment of RM30.1m toGroup’s PATAMI in 2Q16. This is a non-cash item.
Nepal

2Q 2016 7
Key Group highlights (5/5):Associates: Weaker QoQ performance from Idea
Note: Growth number based on results in local currency in respective operating markets
Associates
• Slower growth trends in India. 1QFY17 YoY revenue and EBITDA growth of 7.9% and 3.2%respectively; however PAT growth was -74.5% as a result from higher depreciation andfinance cost. YTD16 Idea contributed RM79.9m to Axiata, versus RM199.2m in YTD15,accounting for 9.6% of normalised Group PATAMI.
• From this quarter, Idea has for the first time adopted Indian Accounting Standards (IAS)with transition date of 1st April 2015.
• YTD revenue, EBITDA and PAT growth of -12.9%, -0.9% and -7.2% respectively. YTD16 M1contributed RM71.0m to Axiata, versus RM81.1m in YTD15, accounting for 8.5% ofnormalised Group PATAMI.

2Q 2016 8
*OFCF= EBITDA- Capex- Net Interest-Tax
^ Annualised Ncell, ROIC – 6.5%, ROCE – 6.1%
Financial highlights
RM mn 2Q16 YTD
QoQ
growth
YoY
growth
YTD
growth
Revenue 5,310 10,319 6.0% 12.8% 9.1% 3.7%
EBITDA 2,066 3,941 10.1% 20.4% 14.0% 8.3%
EBITDA margin % 38.9% 38.2% +1.5pp +2.5pp +1.7pp +1.7pp
Depreciation -1,391 -2,556 19.4% 39.0% 28.8% 20.7%
Net finance cost -282 -486 37.9% 129.4% 101.2% 89.9%
PAT 232 633 -42.1% -63.1% -45.7% -48.9%
Normalised PAT 403 862 -12.1% -34.7% -27.0% -29.1%
PATAMI 189 557 -48.7% -69.1% -53.4% -56.3%
Normalised PATAMI 371 835 -20.1% -36.6% -26.8% -29.1%
ROIC %^ - 5.8% - - -2.2pp 5.7%
ROCE %^ - 5.0% - - -1.9pp 4.9%
Capex 1,236 2,289 17.4% 3.5% 0.2%
Operating Free
Cash Flow*
371 838 -20.7% 51.9% 34.6%
Financial highlights
% of revenue 23.3%
% of revenue 7.0%
YTD growth
(constant
currency)
22.2%
8.1%
FinancialsStrong revenue and EBITDA growth contributed by Ncell; however PATAMI impacted by sub-optimal
performance at Celcom, Robi and Idea, as well as higher D&A, finance cost and forex losses

2Q 2016 9
Normalised Group PATAMI: YTD15 → YTD16Normalised performance decreased by 26.8% largely due to Celcom, XL, Robi and Idea,
cushioned by Ncell, Smart and Dialog
YTD16 Normalised itemYTD15 Normalised item Underlying operational
performance
RM Million 1,196 1,142
835 557
10 44 307 122 300
30 70
YT
D J
un
'15
FO
RE
X g
ain
XL
ga
in o
n d
isp
osa
lo
f to
we
rs
No
rma
lise
d Y
TD
Ju
n'1
5
Op
era
tio
ns
No
rma
lise
d Y
TD
Ju
n'1
6
XL
ga
in o
n d
isp
osa
lo
f to
we
rs
FO
RE
X l
os
s
Nce
ll P
PA
XL
ac
cele
rate
dd
ep
recia
tio
n
YT
D J
un
'16
Normalised Growth:
YTD Growth:
-26.8%
-53.4%
Norm PATAMI YTD Jun'15 YTD Growth Rates Norm PATAMI YTD Jun'16
Celcom 731 Celcom 545
XL (25) XL (70)
Dialog 96 Dialog 129
Robi 75 Robi 19
Smart 87 Smart 138
Ncell - Ncell 119
Associates & Others 178 Associates & Others (45)
GROUP 1,142 GROUP 835
-25.4%
-180.0%
+34.4%
-74.7%
+58.6%
-125.3%
-26.8%
(-186)
(-45)
(+33)
(-56)
(+51)
(-223)
(-307)
(+119) na
YT
D1
6
No
rma
lis
ed
YT
D1
5
No
rma
lis
ed
YT
D1
6
Ncell P
urc
hase
Pri
ce
Allo
ca
tio
n
YT
D1
5
Norm. PATAMI YTD15 Norm. PATAMI YTD16

2Q 2016 10
521 678
553
822 830
1,172
1,652
2Q15 3Q15 4Q15 1Q16 2Q16 YTD15 YTD16
244
431
(3)
467 371
623
838
2Q15 3Q15 4Q15 1Q16 2Q16 YTD15 YTD16
Capital expenditureCapex intensity of 22.2% in YTD16
Note:
Numbers may not add up due to rounding
FCF=EBITDA-Capex
OFCF= EBITDA- Capex- Net Interest-Tax
n/a = not available
FCF
RM mn
OFCF
RM mn+59.1% +51.9%
+0.9%
Capex (RM mn) YTD15 YTD16
Celcom 342 446
XL 894 796
Dialog 159 239
Robi 690 582
Smart 133 145
Ncell n/a 25
Others 66 56
Total 2,284 2,289
+40.9%
-20.7%
+34.6%

2Q 2016 11
Group borrowings Group cash balance
* Based on Ncell’s EBITDA on an annualised basis.
^ Based on Ncell’s EBITDA of 8.5 months in FY16 (extrapolated).
In million Loan Currency USD Local Total (RM)
Hold co & Non OpCoUSD 2,213 - 8,943
Sub-total 2,213 - 8,943
OpCos USD 753 3,043
RM 4,593 4,593
IDR 13,324,600 4,127
BDT 8,700 444
SLR 10,000 305
PKR 911 43
Sub-Total 753 12,555
Total Group 2,966 21,498
2.03 1.92
2.25
2.84 / 2.43*
2.58^ / 2.46*
1.25 1.31 1.49 1.39 /
1.79*
1.61^ / 1.53*
30-Jun-15 30-Sep-15 31-Dec-15 31-Mar-16 30-Jun-16
Gross debt to EBITDA Net debt to EBITDA
5,447
4,357
5,511
10,879
8,101
30-Jun-15 30-Sep-15 31-Dec-15 31-Mar-16 30-Jun-16
Cash and Bank
RM Million Currency Amount
Hold co & Non OpCo USD & Other FCY 1,658
Local (RM) 1,423
Sub-total 3,081
OpCos USD 2,104
Local (RM) 841
Local (ex-RM) 2,075
Sub-total 5,020
Total Group 8,101
Group statements of financial position Annualising Ncell’s contribution, gross debt/EBITDA is below debt covenants
requirements; healthy XL balance sheet post completion of rights issue and tower sale

2Q 2016 12
Headline KPIs(based on Bloomberg*
estimate in mid-Oct 2015 for 2016 forex)
GuidanceHeadline KPIs
(based on constant currency)
Guidance
Revenue growth 12.2%Marginally
lower9.8%
Marginally lower
EBITDA growth 16.0%Marginally
lower13.7%
Marginally lower
ROIC 6.8% Below 6.6% Below
ROCE 6.1% Below 6.0% Below
Capex ** RM5.7bn Above RM5.5bn Above
FY16 headline KPIs
*1 USD = RM4.20
** Capex is not a headline KPI
2Q 2016 13
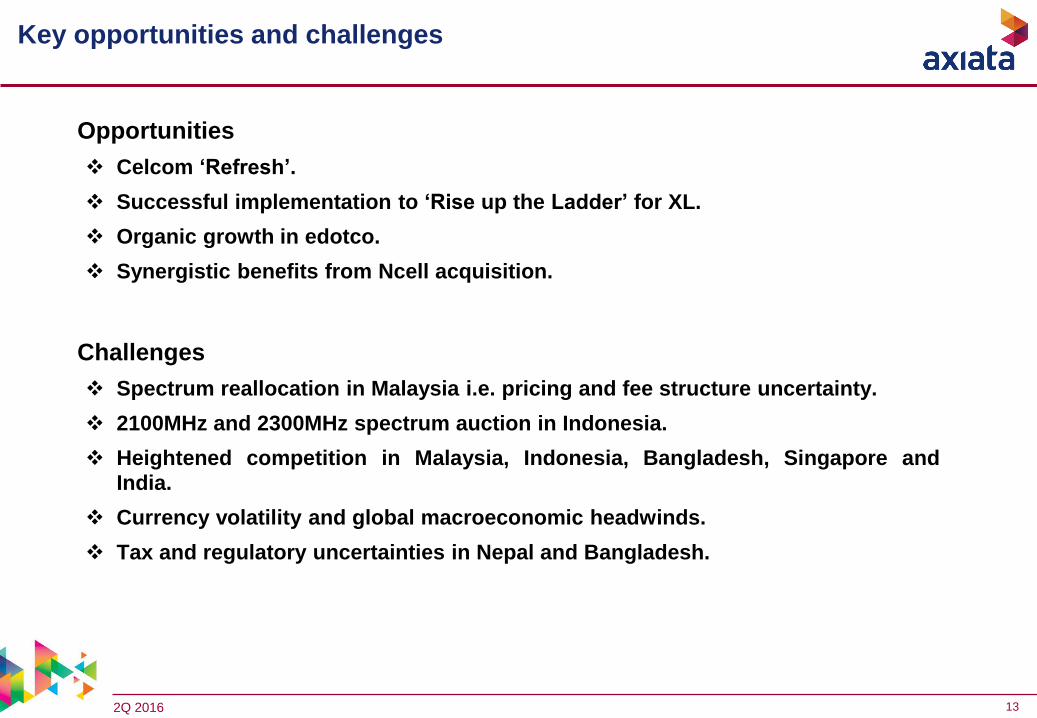
Key opportunities and challenges
Opportunities
Celcom ‘Refresh’.
Successful implementation to ‘Rise up the Ladder’ for XL.
Organic growth in edotco.
Synergistic benefits from Ncell acquisition.
Challenges
Spectrum reallocation in Malaysia i.e. pricing and fee structure uncertainty.
2100MHz and 2300MHz spectrum auction in Indonesia.
Heightened competition in Malaysia, Indonesia, Bangladesh, Singapore and
India.
Currency volatility and global macroeconomic headwinds.
Tax and regulatory uncertainties in Nepal and Bangladesh.

2Q 2016 14
Key opportunity: Celcom ‘Refresh’
Accelerate momentum built by current management team:
Product introduction (data-led, convergence)
Sales and distribution revamp (increase active dealers, improve distributorperformance, redesign sales role)
Network (Klang Valley swap and LTE rollout)
Fixed Mobile Convergence (Celcom and TM collaboration)
Analytics (monetisation and customer retention)
Introduce new initiatives / Refresh organisation:
Digitisation (sales & marketing, customer care, and at a later stage, network)
Organisation (structure, people, process and culture)

2Q 2016 15
Appendix

2Q 2016 16
Group revenue: YTD15 → YTD16 YTD revenue growth lifted by forex, consolidation of Ncell, and growth in Dialog (mobile,
fixed and pay TV) and Smart (data revenue)
YTD15 Revenue YTD16 RevenueYTD movement
9,458
10,319
376 204 232 94 93 484 130
Rev
enu
eYT
D'1
5
Celc
om XL
Dia
log
Rob
i
Nce
ll
Smar
t
Mul
tine
t &O
ther
s
Rev
enu
eYT
D'1
6
Revenue Growth: 9.1%Revenue Growth: 9.1%
RM Million
Revenue YTD June 15 FY Growth Rates Revenue YTD June 16
Celcom 3,717 Celcom 3,341
XL 3,117 XL 3,321
Dialog 959 Dialog 1,191
Robi 1,174 Robi 1,268
Smart 420 Smart 513
Ncell - Ncell 484
Multinet & Others 71 Multinet & Others 201
GROUP 9,458 GROUP 10,319
-10.1%+6.6%
+24.2%
+8.0%
+22.2%
+183.1%
+9.1%
(-376)(+204)(+232)
(+94)
(+93)
(+130)(+861)
(+484) na
Revenue YTD15 Revenue YTD16
YT
D1
6
YT
D1
5
YTD Growth Rates

2Q 2016 17
Group EBITDA: YTD15 → YTD16YTD EBITDA growth lifted by forex, consolidation of Ncell, XL (lower direct cost) Dialog
and Smart
YTD15 EBITDA YTD16 EBITDAYTD movement
3,456 3,941 193 240 72 8 48 310 16
EBIT
DA
FY20
14
Celc
om XL
Dia
log
Rob
i
Smar
t
Nce
ll
Mul
tine
t &O
ther
s
EBIT
DA
FY20
15
EBITDA Growth: 14.0%RM Million
EBITDA YTD June 15 FY Growth Rates EBITDA YTD June 16
Celcom 1,395 Celcom 1,202
XL 1,128 XL 1,368
Dialog 325 Dialog 397
Robi 425 Robi 417
Smart 211 Smart 259
Ncell - Ncell 310
Multinet & Others (28) Multinet & Others (12)
GROUP 3,456 GROUP 3,941
-13.8%+21.3%
+22.1%
-1.9%
+22.6%
+57.1%+14.0%
(-193)
(+240)
(+72)
(-8)
(+48)
(+16)(+485)
na(+310)
3,456
EBITDA YTD15 EBITDA YTD16YTD Growth Rates
YT
D1
6
YT
D1
5
2Q 2016 18
1,196
557
172 204 28 60 51 125
815 P
AT
AM
I YT
D'1
5
Ce
lco
m XL
Dia
log
Ro
bi
Sma
rt
Nce
ll
Ass
oci
ate
s &
Oth
ers
PA
TA
MI Y
TD
'16
PATAMI Growth: -53.4%
PA
TA
MI
YT
D1
6
PA
TA
MI
YT
D1
5
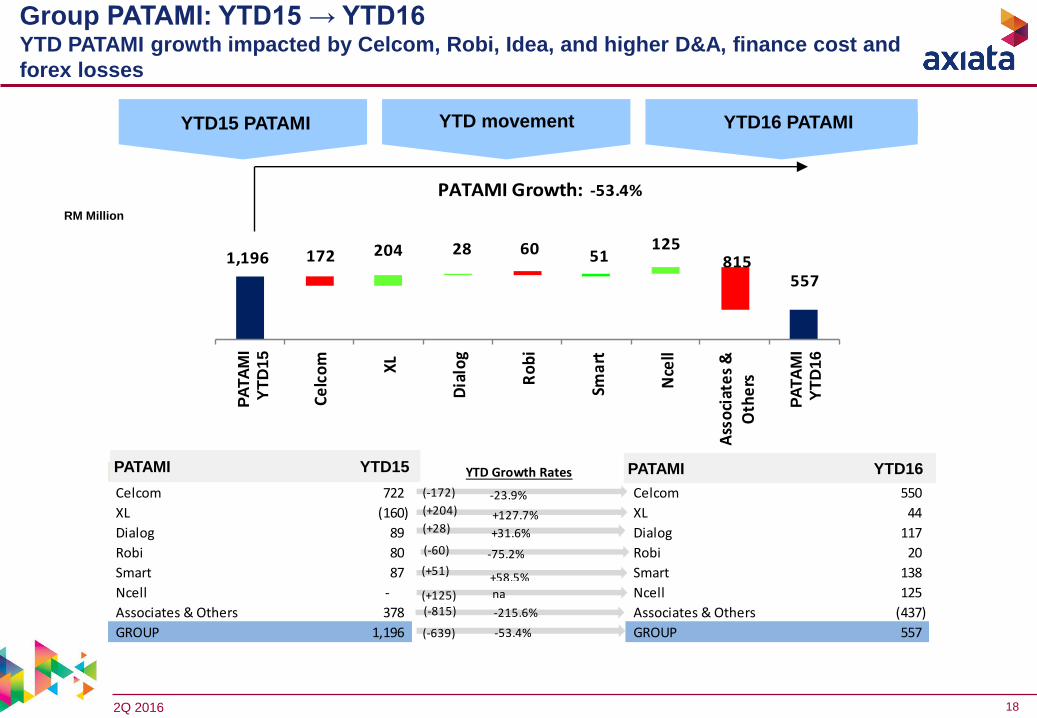
Group PATAMI: YTD15 → YTD16YTD PATAMI growth impacted by Celcom, Robi, Idea, and higher D&A, finance cost and
forex losses
RM Million
PATAMI YTD June 15 YTD Growth Rates PATAMI YTD June 16
Celcom 722 Celcom 550
XL (160) XL 44
Dialog 89 Dialog 117
Robi 80 Robi 20
Smart 87 Smart 138
Ncell - Ncell 125
Associates & Others 378 Associates & Others (437)
GROUP 1,196 GROUP 557
-23.9%
+127.7%
+31.6%
-75.2%
+58.5%
-215.6%
-53.4%
(-172)
(+204)
(+28)
(-60)
(+51)
(-815)
(-639)
na(+125)
YTD15 PATAMI YTD16 PATAMIYTD movement
PATAMI YTD15 PATAMI YTD16

2Q 2016 19
663 677 666 625 596
1,373 1,222
750 737 809 678 642
1,522 1,320
2Q15 3Q15 4Q15 1Q16 2Q16 YTD15 YTD16
EBITDA Normalised EBITDA
Celcom: financial performance Impacted by lower revenue contributions from VAS and OFW segments
* Normalisation excludes holding company charge, impact of Edotco disposal, Escape, Celcom Planet, Employee Wish Plan, Sukuk interest
Revenue (RM mn) Data revenue as a % of total revenue
EBITDA* (RM mn) & margins (%)
Normalised
EBITDA
Margin
41.6% 40.9% 44.5% 40.7% 38.2%
PATAMI* (RM mn) & margins (%)
Normalised
PATAMI
Margin
23.5% 22.6% 24.7% 21.1% 19.1%
Service
revenue 93.0% 93.7% 90.5% 91.2% 88.2%
1,802 1,801 1,819 1,665 1,682
3,725
3,346
2Q15 3Q15 4Q15 1Q16 2Q16 YTD15 YTD16
91.5% 89.7%
40.9% 39.4%
328 333 255 288 261
704
550 424 407 449
351 320
876
672
2Q15 3Q15 4Q15 1Q16 2Q16 YTD15 YTD16
PATAMI Normalised PATAMI
23.5% 20.1%
27%29% 29% 31%
33%
27%
32%
2Q15 3Q15 4Q15 1Q16 2Q16 YTD15 YTD16

2Q 2016 20
Celcom: financial performanceEBITDA impacted by higher network cost, but offset by lower direct expenses
^ OPEX and EBITDA Margin excludes holding company charge, impact of Edotco disposal, Escape and Employee Wish Pllan
Operating Expenses^
30 June 15 30 Sept 15 31 Dec 15 31 Mar 16 30 June 16
Capex 344 558 885 174 446
Cash and Cash Equivalents 1,506 1,312 1,535 1,695 841
Gross Debt 5,037 4,482 4,526 4,488 4,535
Net Assets -1,472 -1,133 -878 -591 -1,330
Gross Debt / Equity (x) n/m n/m n/m n/m n/m
Gross Debt / EBITDA (x) 1.7 1.5 1.5 1.7 1.7
% of Revenue 2Q15 3Q15 4Q15 1Q16 2Q16 YTD15 YTD16
Direct Expenses 27.6% 27.4% 27.4% 23.3% 23.6% 28.7% 23.5%
Sales and Marketing 7.5% 6.7% 7.3% 8.3% 7.9% 6.9% 8.1%
Network Cost 13.3% 14.1% 11.5% 13.6% 15.8% 11.4% 14.7%
Staff Cost 5.7% 5.4% 4.5% 8.2% 6.3% 6.5% 7.3%
Bad Debts 0.3% 0.2% 0.1% 0.5% -0.2% 0.4% 0.2%
Others 4.0% 5.2% 4.8% 5.3% 8.4% 5.2% 6.9%
Total Expenses 58.4% 59.1% 55.5% 59.3% 61.8% 59.1% 60.6%
Normalised EBITDA Margin 41.6% 40.9% 44.5% 40.7% 38.2% 40.9% 39.4%
Depreciation & Amortisation 12.0% 11.7% 12.8% 12.9% 13.0% 11.1% 13.0%
Financial Position (RM mn)
2Q 2016 21
Celcom: operational performancePostpaid subscribers continue to trend up in 2Q16
Subscribers (‘000)
MOU/sub (min) Smartphone penetration (%)
ARPU* (RM)
* ARPU re-stated to exclude inbound roaming revenue
2,851 2,802 2,803 2,840 2,897
9,489 9,707 9,447 9,235 8,338
12,340 12,509 12,250 12,075 11,234
2Q15 3Q15 4Q15 1Q16 2Q16
Postpaid Prepaid
86 84 85
76 76
84
75
32 32 31 29 29 32
29
43 42 42
39 39
43
39
2Q15 3Q15 4Q15 1Q16 2Q16 YTD15 YTD16
Postpaid Prepaid Blended
286 285 300 282 317 286 299
169 161 151 149 152
170 150
195 189 185 180 193 195 186
2Q15 3Q15 4Q15 1Q16 2Q16 YTD15 YTD16
Postpaid Prepaid Blended
55%
59% 59%62%
66%
2Q15 3Q15 4Q15 1Q16 2Q16

2Q 2016 22
5,632 5,855 5,974 5,636 5,251
11,131 10,887
2Q15 3Q15 4Q15 1Q16 2Q16 YTD15 YTD16
2,000 2,196 2,320 2,191 2,065
3,877 4,256
2Q15 3Q15 4Q15 1Q16 2Q16 YTD15 YTD16
XL: financial performanceChallenging 1H16 due to the accelerated shift from legacy services to data
Revenue (IDR bn) Data revenue as a % of total revenue
EBITDA (IDR bn) & margins (%)
EBITDA
Margin 35.5% 37.5% 38.8% 38.9% 39.3%
26% 26%30%
32%34%
26%
33%
2Q15 3Q15 4Q15 1Q16 2Q16 YTD15 YTD16
34.8% 39.1%
PAT (IDR bn) & margins (%)
Normalised
PAT
Margin
2.1% -0.2% -0.4% -2.8% -0.2% 0.8% -1.5%
(93)
344 481
169 55
(851)
225 118
(10) (22) (159) (9)84 (168)
(1,000)
(500)
-
500
1,000
1,500
2,000
2Q15 3Q15 4Q15 1Q16 2Q16 YTD15 YTD16
PAT Normalisation

2Q 2016 23
XL: financial performance5th quarter of sequential EBITDA margin uplift; stronger balance sheet with gross
debt/EBITDA down to 2.0x
Operating Expenses
30 Jun 15 30 Sept 15 31 Dec 15 31 Mar 16 30 Jun 16
Capitalised Capex 2,890 4,330 4,848 1,048 2,263
Cash and Cash Equivalents 5,500 3,644 3,312 2,222 6,217
Gross Debt 29,198 27,049 26,953 25,229 17,888
Net Assets 13,242 13,620 14,092 14,270 21,018
Gross Debt / Equity (x) 2.2 2.0 1.9 1.8 0.9
Gross Debt / EBITDA (x) 3.5 3.2 3.2 2.9 2.0
% of Revenue 2Q15 3Q15 4Q15 1Q16 2Q16 YTD15 YTD16
Direct Expenses 9.2% 9.1% 9.3% 7.2% 8.0% 11.0% 7.6%
Sales and Marketing 4.5% 5.2% 5.7% 5.8% 5.2% 4.4% 5.5%
Network Cost 42.0% 40.3% 38.7% 39.3% 40.0% 41.4% 39.6%
Staff Cost 4.8% 4.7% 4.8% 5.8% 5.3% 4.7% 5.6%
Others incl. discount 4.0% 3.1% 2.7% 3.0% 2.2% 3.6% 2.5%
Total Expenses 64.5% 62.5% 61.2% 61.1% 60.7% 65.2% 60.9%
EBITDA Margin 35.5% 37.5% 38.8% 38.9% 39.3% 34.8% 39.1%
Depreciation & Amortisation 31.6% 28.7% 31.5% 33.2% 39.8% 32.1% 36.4%
Financial Position (IDR bn)

2Q 2016 24
46.0 45.1 60.2
85.2
112.1 91.1
197.3
2Q15 3Q15 4Q15 1Q16 2Q16 YTD15 YTD16
428 431 437 438 490
45,555 41,038 41,465 42,034 43,482
45,983
41,469 41,902 42,472 43,972
2Q15 3Q15 4Q15 1Q16 2Q16
Postpaid Prepaid
XL: operational performancePositive QoQ subscriber trend continues into 2Q16, and smartphone penetration
climbs to 53%
Total traffic (‘000 TB) Smartphone penetration (%)
ARPU (IDR ‘000)Subscribers (‘000)
104 108 110 116
100 104 108
31 38 41 38 34
29 36
32 38
41 39 35
30
37
(14)
(4)
6
16
26
36
-
20
40
60
80
100
120
140
160
180
2Q15 3Q15 4Q15 1Q16 2Q16 YTD15 YTD16
Postpaid Prepaid Blended
36%39%
42%
48%
53%
2Q15 3Q15 4Q15 1Q16 2Q16
2Q 2016 25
Dialog: financial performanceStrong YTD performance, in spite of tax impact in 2Q16
Revenue (SLR mn) Data revenue as a % of total mobile revenue*
EBITDA (SLR mn) & margins (%)
EBITDA
Margin 33.4% 33.6% 28.0% 33.2%
PAT (SLR mn) & margins (%)
PAT
Margin 10.7% 3.6% 3.1% 12.6%33.5% 10.9%
17,745 18,816 20,039 21,157 21,065
35,075
42,222
2Q15 3Q15 4Q15 1Q16 2Q16 YTD15 YTD16
17%19% 19%
20%22%
16%
21%
2Q15 3Q15 4Q15 1Q16 2Q16 YTD15 YTD16
5,919 6,314 5,613 7,019 7,057
11,897
14,076
2Q15 3Q15 4Q15 1Q16 2Q16 YTD15 YTD16
33.9% 33.3%
1,907
679 620
2,670 2,287
3,888
4,958
2Q15 3Q15 4Q15 1Q16 2Q16 YTD15 YTD16
11.1% 11.7%
* Total Mobile Revenue includes Mobile, Data & Digital Services and excludes Dialog Tele-Infrastructure & International

2Q 2016 26
Dialog: financial performanceYTD EBITDA growth of 18.3% driven by strong revenue growth of 20.4%
Operating Expenses
30 Jun 15 30 Sept 15 31 Dec 15 31 Mar 16 30 Jun 16
Capex¹ 5,276 8,959 19,577 2,942 7,091
Cash and Cash Equivalents² 7,542 8,208 4,429 9,741 3,653
Gross Debt 24,542 26,187 22,910 31,540 31,850
Net Assets 47,643 48,285 47,317 49,935 49,609
Gross Debt / Equity (x) 0.5 0.5 0.5 0.6 0.6
Gross Debt / EBITDA (x) 1.0 1.1 1.0 1.1 1.1
% of Revenue 2Q15 3Q15 4Q15 1Q16 2Q16 YTD15 YTD16
Direct Expenses 29.6% 29.0% 28.5% 29.9% 27.7% 28.9% 28.8%
Sales and Marketing 13.1% 13.3% 15.6% 13.7% 13.8% 12.7% 13.7%
Network Cost 9.9% 10.1% 10.5% 9.6% 9.8% 10.4% 9.7%
Staff Cost 8.0% 7.8% 9.9% 7.8% 7.5% 8.1% 7.7%
Bad debts 1.1% 1.0% 1.1% 1.0% 2.5% 1.0% 1.7%
Others 4.9% 5.2% 6.4% 4.7% 5.2% 5.1% 5.0%
Total Expenses 66.6% 66.4% 72.0% 66.8% 66.5% 66.1% 66.7%
EBITDA Margin 33.4% 33.6% 28.0% 33.2% 33.5% 33.9% 33.3%
Depreciation & Amortisation 19.8% 18.8% 20.1% 17.4% 18.1% 19.4% 17.8%
Financial Position (SLR mn)
¹ Capex excludes Customer Premises Equipment investments and spectrum acquisition & license renewal
² Excludes cash from overdraft facilities
2Q 2016 27
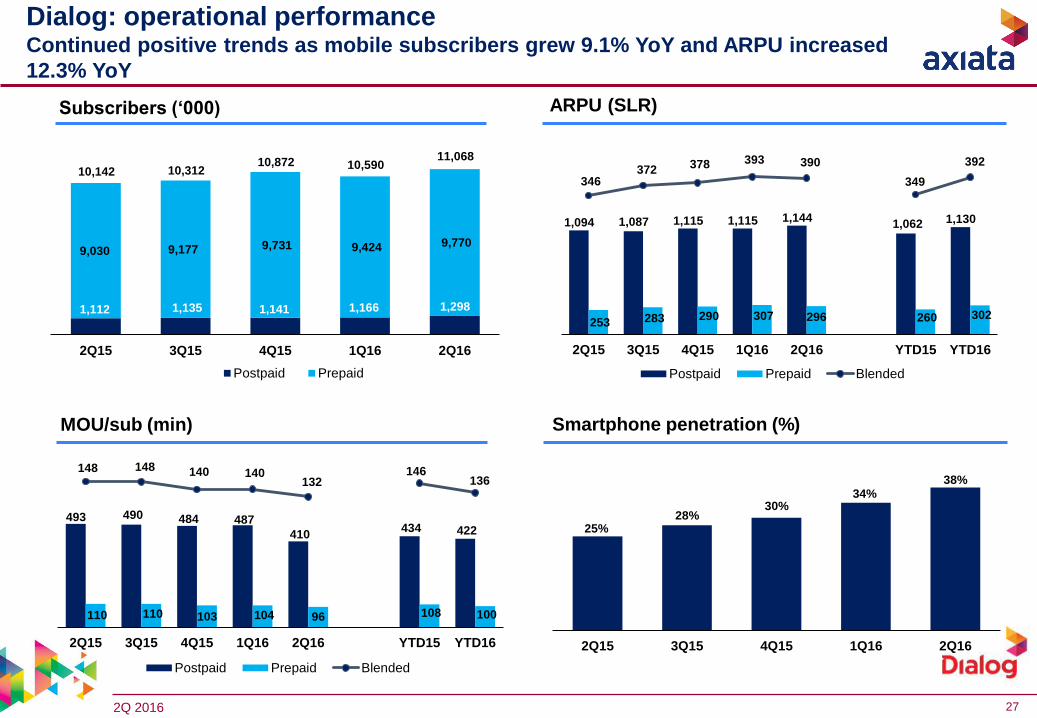
Dialog: operational performanceContinued positive trends as mobile subscribers grew 9.1% YoY and ARPU increased
12.3% YoY
MOU/sub (min) Smartphone penetration (%)
ARPU (SLR)Subscribers (‘000)
1,112 1,135 1,141 1,166 1,298
9,030 9,177 9,731 9,424 9,770
10,142 10,312 10,872 10,590
11,068
2Q15 3Q15 4Q15 1Q16 2Q16
Postpaid Prepaid
1,094 1,087 1,115 1,115 1,144 1,062 1,130
253 283 290 307 296 260 302
346 372 378 393 390
349
392
-
50
100
150
200
250
300
350
400
450
-
200
400
600
800
1,000
1,200
1,400
1,600
1,800
2Q15 3Q15 4Q15 1Q16 2Q16 YTD15 YTD16
Postpaid Prepaid Blended
493 490 484 487
410 434 422
110 110 103 104 96 108 100
148 148 140 140 132
146 136
-
20
40
60
80
100
120
140
160
-
100
200
300
400
500
600
700
800
2Q15 3Q15 4Q15 1Q16 2Q16 YTD15 YTD16
Postpaid Prepaid Blended
25%28%
30%34%
38%
2Q15 3Q15 4Q15 1Q16 2Q16
2Q 2016 28
Robi: financial performanceQoQ revenue growth driven by higher device sales
Revenue (BDT mn) Data revenue as a % of total revenue
EBITDA1 (BDT mn) & margins (%) PAT1 (BDT mn) & margins (%)
EBITDA
Margin 36.7% 36.0% 33.6% 37.0% PAT
Margin
Normalised
EBITDA
Margin
Normalised
PAT
Margin
1. Normalisation excludes impact of edotco carve out in 3Q15
35.1%
32.9%
34.3%
12,952 13,409 13,871 11,835 12,435
2Q15 3Q15 4Q15 1Q16 2Q16 YTD 15 YTD 16
25,115 24,271
9%10% 10%
12% 12%
9%
12%
2Q15 3Q15 4Q15 1Q16 2Q16 YTD 15 YTD 16
4,749 4,832 4,979 3,981 4,005
9,303 7,986
5,323 5,127 4,160 4,157
8,317
2Q15 3Q15 4Q15 1Q16 2Q16 YTD 15 YTD 16
EBITDA Normalisation
39.7%
35.9%
37.0%
32.2%
33.4%
939 1,131
1,006
397 (34)
1,867
363
1,075 1,078
568 494
1,062
2Q15 3Q15 4Q15 1Q16 2Q16 YTD 15 YTD 16
PAT Normalisation
7.3% 8.4% 3.4% 7.4%
4.8%
1.5%
4.4%8.0%
7.3%
7.8%
-0.3%
4.0%

2Q 2016 29
Operating Expenses
30 Jun 15 30 Sep 15 31 Dec 15 31 Mar 16 30 Jun 16
Capex 13,542 17,844 19,996 4,435 9,991
Cash and Cash Equivalents 820 2,604 1,943 3,395 4,968
Gross Debt 13,326 13,141 15,004 22,029 21,720
Net Assets 46,614 53,884 54,890 55,287 55,253
Gross Debt / Equity (x) 0.3 0.2 0.3 0.4 0.4
Gross Debt / EBITDA (x) 0.7 0.7 0.8 1.4 1.4
% of Revenue 2Q15 3Q15 4Q15 1Q16 2Q16 YTD15 YTD16
Direct Expenses 33.3% 37.3% 39.4% 30.7% 36.6% 33.3% 33.7%
Sales and Marketing 4.5% 5.5% 5.1% 6.9% 5.1% 5.1% 6.0%
Network Cost 11.7% 11.3% 9.0% 14.1% 13.4% 11.5% 13.8%
Staff Cost 5.2% 5.4% 5.3% 5.8% 5.6% 5.1% 5.7%
Bad debts 2.0% 0.6% -1.5% 0.4% -0.9% 1.7% -0.2%
Others 6.5% 0.2% 5.8% 6.9% 6.7% 6.3% 6.8%
Total Expenses 63.3% 60.3% 63.0% 64.9% 66.6% 63.0% 65.7%
Normalised EBITDA Margin 36.7% 39.7% 37.0% 35.1% 33.4% 37.0% 34.3%
Depreciation & Amortisation 21.5% 20.9% 20.4% 27.8% 29.7% 21.3% 28.8%
Financial Position (BDT mn)
Robi: financial performanceHigher network cost and D&A charges in 1H16 due to network swap and rollout

2Q 2016 30
Robi: operational performanceSubscriber base stable despite SIM bio-metric registration and heightened competition
MOU/sub (min) Smartphone penetration (%)
ARPU (BDT)
* SME billing base reclassified from postpaid to prepaid from 1Q15 onwards.
Subscribers (‘000)
- SME subbase reclassification reported to BTRC from July 15 onwards
759 158 170 176 187
26,609 28,215 28,147 27,274 27,255
27,368 28,373 28,317 27,450 27,442
2Q15 3Q15 4Q15 1Q16 2Q16
Postpaid Prepaid
839*
27,534*
992*
27,325*
1,098*
26,351*
1,287*
26,156*335
304 289 280 286
221
283
143 140 134 133 133 146 133
144 142 136 135 135 147
135
2Q15 3Q15 4Q15 1Q16 2Q16 YTD 15 YTD 16
Postpaid Prepaid Blended
129*
203*
141*
219*
137*
219*
130*
235*
129*
203*
129*
203*
144*
214*
234 203 202 199 200
214 199
138 131 123 126 120 140
123
139 132
123 127 121
141
124
2Q15 3Q15 4Q15 1Q16 2Q16 YTD 15 YTD 16
Postpaid Prepaid Blended
138*
196*
136*
203*
131*
190*
123*
187*
126*
186*
120*
180*
123*
183*
16%17%
20%18%
24%
2Q15 3Q15 4Q15 1Q16 2Q16
2Q 2016 31
15,576 14,428 13,802 14,054
15,392
29,030 29,446
2Q15 3Q15 4Q15 1Q16 2Q16 YTD15 YTD16
9,855 9,296 9,561 9,230 9,962
17,965 19,191
2Q15 3Q15 4Q15 1Q16 2Q16 YTD15 YTD16
Ncell: financial performanceExcellent performance and EBITDA margins improved 3.3bps to 65.2% in 1H16
Revenue (NPR mn) Data revenue as a % of total revenue
EBITDA (NPR mn) & margins (%)
EBITDA
Margin 63.3% 64.4% 69.3% 65.7% 64.7%
PAT (NPR mn) & margins (%)
PAT
Margin 24.7% 39.6% 41.0% 34.5% 38.6%
8%
11%
12%14%
15%
8%
14%
2Q15 3Q15 4Q15 1Q16 2Q16 YTD15 YTD16
61.9% 65.2%
3,848 5,713 5,653 4,852
5,944 7,470
10,796
2Q15 3Q15 4Q15 1Q16 2Q16 YTD15 YTD16
25.7% 36.7%
Nepal

2Q 2016 32
Ncell: financial performanceEBITDA margins improvement driven by lower direct expense
Operating Expenses
30 Jun 15 30 Sept 15 31 Dec 15 31 Mar 16 30 June 16
Capitalised Capex 4,746 8,035 11,409 1,323 2,570
Cash and Cash Equivalents 31,256 35,305 41,523 42,711 41,985
Gross Debt - - - - -
Net Assets 56,673 62,386 68,039 72,892 78,835
Gross Debt / Equity (x) - - - - -
Gross Debt / EBITDA (x) - - - - -
% of Revenue 2Q15 3Q15 4Q15 1Q16 2Q16 YTD15 YTD16
Direct Expenses 9.6% 9.3% 8.3% 8.2% 8.7% 11.2% 8.5%
Sales and Marketing 4.5% 5.0% 3.8% 4.9% 5.2% 4.9% 5.1%
Network Cost 7.7% 6.8% 4.0% 7.0% 7.2% 7.8% 7.1%
Staff Cost 5.7% 6.0% 5.5% 5.8% 5.6% 5.5% 5.7%
Bad debts - - 1.5% - 0.3% - 0.2%
Others 9.2% 8.4% 7.6% 8.4% 8.3% 8.7% 8.3%
Total Expenses 36.7% 35.6% 30.7% 34.3% 35.3% 38.1% 34.8%
EBITDA Margin 63.3% 64.4% 69.3% 65.7% 64.7% 61.9% 65.2%
Depreciation & Amortisation 15.8% 16.4% 17.9% 18.1% 16.6% 16.5% 17.4%
Financial Position (NPR mn)
Nepal
2Q 2016 33
28%
30%
0.27
0.275
0.28
0.285
0.29
0.295
0.3
0.305
2Q15 3Q15 4Q15 1Q16 2Q16
Nepal
Ncell: operational performancePositive subscriber net adds trend; improved ARPU over last two quarters
MOU/sub (min) Smartphone penetration* (%)
ARPU (NPR)Subscribers (‘000)
356 386 401 429 472
12,371 12,625 12,639 13,005 13,535
2Q15 3Q15 4Q15 1Q16 2Q16
Postpaid Prepaid
12,727 13,012 13,039 13,43414,006
468 438 397 417 425
465 421
401 366 345 349 365
380 357
403 368 347 351 367 382
359
-
50
100
150
200
250
300
350
400
450
-
100
200
300
400
500
600
700
2Q15 3Q15 4Q15 1Q16 2Q16 YTD15 YTD16
Postpaid Prepaid Blended
491 475
428 471 473 493
472
131 112 110 114 134 123 124
141
123 120 125
145
133 135
-
20
40
60
80
100
120
140
160
180
-
100
200
300
400
500
600
700
800
2Q15 3Q15 4Q15 1Q16 2Q16 YTD15 YTD16
Postpaid Prepaid Blended
N/A N/A N/A

2Q 2016 34
Foreign exchange
Source: Bloomberg
Average Rate
YTD Jun'15
Average Rate
Q1'16
Average Rate
Q2'16
Average Rate
YTD Jun'16
QoQ
Appreciation/
(Depreciation)
against MYR
YTD
Appreciation/
(Depreciation)
against MYR
QoQ Appreciation/
(Depreciation)
against USD
YTD Appreciation/
(Depreciation)
against USD
(%) (%) (%) (%)
INDONESIAN RUPIAH, IDR 0.000281 0.000310 0.000301 0.000306 (2.90) 8.90 1.71 (3.48)
SRI LANKA RUPEE, LKR 0.027333 0.029006 0.027417 0.028211 (5.48) 3.21 (0.99) (8.51)
BANGLADESHI TAKA, BDT 0.046742 0.053408 0.051112 0.052260 (4.30) 11.81 0.25 (0.90)
US DOLLAR, USD 3.636542 4.197858 4.007443 4.102651 (4.54) 12.82 0.00 0.00
SINGAPORE DOLLAR, SGD 2.695373 2.990634 2.950140 2.970386 (1.35) 10.20 3.33 (2.32)
PAKISTAN RUPEE, PKR 0.035808 0.040070 0.038281 0.039175 (4.46) 9.40 0.07 (3.03)
INDIAN RUPEE, INR 0.057888 0.062189 0.059917 0.061053 (3.65) 5.47 0.92 (6.51)
NEPALESE RUPEE, NPR NA 0.037534 0.037534 0.037534 0.00 NA 4.75 NA
Local Currency
NA
