2nd quarter 2020 investment outlook - cccu
TRANSCRIPT

Graystone Consulting 2nd Quarter 2020 Investment Outlook
This material has been prepared for informational purposes only and is not an offer to buy or sell or a solicitation of any offer to buy or sell any security or other financial instrument or to participate in any trading strategy. Past performance is not necessarily a guide to future performance. Please refer to important information, disclosures and qualifications at the end of this material. Illustration from Wikipedia Commons/CDC
George T. Cook Managing Director
Institutional Consulting Director [email protected]
Carl H. Viard
Senior Vice President Institutional Consulting Director
Mary L. Tomanek
Senior Vice President Institutional Consulting Director
760 W. Main, Barrington, Il

2 2nd Quarter Investment Outlook
How Will Covid-19 Impact Higher Education?
Covid-19 Crisis of 2020 The Covid-19 Crisis has infected most of the population centers of the world, leading to Lock Down of businesses and Universities
Source: Johns Hopkins https://coronavirus.jhu.edu/map.html as of 04-15-2020

3 2nd Quarter Investment Outlook
Most Rapid Stock Market Correction in Decades
Source: Alliance Bernstein CMO April, 2020 Chart shows all drawdowns greater than 5% since 1965. Global equities are represented by MSCI World (USD). of March 19, 2020
Market Response The Covid-19 Crisis precipitated the fastest equity decline in several decades – Impacting both revenue and Endowment valuation.
2020
2008 1974
Three of the Biggest Down Days since 2000 occurred in March 2020

4 2nd Quarter Investment Outlook
The VIX Attains a New High-Water Mark
Source: Alliance Bernstein CMO April 2020 Data from March 1, 2008, through March 31, 2020
Market Response
VIX is a real-time market index on CBOE that represents the market's expectation of 30-day forward-looking volatility. Proxy for market fear.
COVID-19 (All-Time
High)
“Flash Crash”
S&P Downgrade of US/ Euro Sovereign Debt
Crisis China &
EM Concerns
Global Financial
Crisis
Trade War/ Fed
Hawkish
“Vol-mageddon”

5 2nd Quarter Investment Outlook
Not a One Spared: S&P 500 and Sector Total Returns
Source: Alliance Bernstein CMO April 2020 Data first quarter ending March 31, 2020
Market Response
While no sector was spared, Value sectors: Energy, Financials and Industrials were impacted worse than others.

6 2nd Quarter Investment Outlook
Corporate Spreads ‘Blow Wide Open’
Ice Data Indices, LLC, ICE BofA US High Yield Index Option-Adjusted Spread [BAMLH0A0HYM2], retrieved from FRED, Federal Reserve Bank of St. Louis; https://fred.stlouisfed.org/series/BAMLH0A0HYM2, April 14, 2020.
Market Response
A spread of 8% or more over Treasury indicates a fear by bond buyers that recession is coming and defaults may rise.

7 2nd Quarter Investment Outlook
Real (After Inflation) Yield of 10 Year Treasury
Board of Governors of the Federal Reserve System (US), 10-Year Treasury Constant Maturity Rate [DGS10], https://fred.stlouisfed.org/series/DGS10, April 21, 2020. U.S. Bureau of Labor Statistics, Consumer Price Index for All Urban Consumers: All Items in U.S. City Average [CPIAUCSL]
Market Response
Negative Yielding Bonds creates difficulty for Endowment Funds trying to distribute funds for spending or grow for future needs.
10 Year Treasury Yield After Inflation

8 2nd Quarter Investment Outlook
-40
-30
-20
-10
0
10
20
08:0
0 PM
09:5
5 PM
11:5
0 PM
01:5
0 AM
03:4
5 AM
05:4
0 AM
07:3
5 AM
09:3
0 AM
11:2
5 AM
01:2
0 PM
03:1
5 PM
05:1
0 PM
07:0
5 PM
Oil Prices Collapse
Federal Reserve Bank of St. Louis, Spot Crude Oil Price: West Texas Intermediate (WTI) [WTISPLC], retrieved from FRED, Federal Reserve Bank of St. Louis; https://fred.stlouisfed.org/series/WTISPLC, April 14, 2020 Reuters April 20-2020.
Market Response
When there is nowhere to deliver or store crude oil, traders sell at any price – but one day $60 price drop to -$40 was beyond imaginable.
04-20-2020: May Futures Last 50 Years
Unprecedented Drop to $-40
Closest Comparison to current was 6 month drop of $100 in GFC June – Dec

9 2nd Quarter Investment Outlook
Commodity Prices Collapse
Source IMF World Economic Outlook 04-14-2020
Market Response
Demand for Energy and Industrial Metals has plummeted While Gold and Groceries stay in Demand

10 2nd Quarter Investment Outlook
Energy Storage Capacity
Source: Energy Information Administration 04-20-20
Market Response
At current projection, all storage will be full in 2 months; and that assumes perfectly efficient distribution, which is unlikely.
Barrels 1,000
Weeks till full
1,676 2,015
13,650 14,943
19,061
196
162
23 20 15
-
20
40
60
80
100
120
140
160
180
200
-
5,000
10,000
15,000
20,000
25,000
13-Mar-20 20-Mar-20 27-Mar-20 3-Apr-20 10-Apr-20
Excess Energy for Storage (US Only)
Excess Production Needing Storage Weeks to Capacity at Current Rate

11 2nd Quarter Investment Outlook
Strategic Petroleum Reserves
Source: Energy.gov https://www.energy.gov/fe/services/petroleum-reserves/strategic-petroleum-reserve/spr-storage-sites, https://primis.phmsa.dot.gov/
Market Response
The SPR provides an emergency source of energy. On April 20, Trump suggested buying oil or leasing the storage to oil companies.
A typical cavern holds 10 million barrels and is cylindrical in shape with a diameter of 200 feet and a height of 2,500 feet.
To withdraw crude oil, fresh water is pumped into the bottom of a cavern.
SPR Total Storage Capacity 713.5MMB Current Available78.5MMB
SPR Storage Locations

12 2nd Quarter Investment Outlook
Emerging Markets Sovereign Spreads ‘Blow Out’
IMF World Economic Outlook April 14-2020
Market Response
Bond yields in EM countries climbed, especially commodity exporting countries.
Sovereign Spreads: Basis Points

13 2nd Quarter Investment Outlook
ASSET CLASS INDEX IN USD 1-MONTH YTD 1-YR 3-YR ANN 5-YR ANN Global Equity Global Equity MSCI All Country World -13.4% -21.3% -10.8% 2.0% 3.4% US Equity S&P 500 -12.4% -19.6% -7.0% 4.0% 6.2% International Equity MSCI All Country World ex US -14.4% -23.3% -15.1% -1.5% -0.2% Emerging Markets Equity MSCI Emerging Markets -15.4% -23.6% -17.4% -1.3% -0.2% Global Fixed Income IG Fixed Income
Barclays US Aggregate
-0.6%
3.1%
8.9%
4.8%
3.3%
Inflation-Linked Barclays Inflation-Linked -3.4% 0.3% 4.5% 3.7% 3.6% High Yield Barclays Global High Yield (H) -13.4% -14.5% -9.2% -0.3% 2.6% EM Fixed Income JP Morgan EM Bonds in USD -11.1% -15.2% -6.5% -1.3% 1.0% Alternative Investments Global REITs FTSE EPRA/NAREIT Gl REITs -22.3% -28.4% -23.0% -2.4% -0.8% Commodities Bloomberg Commodities -12.8% -23.3% -22.3% -9.2% -8.4% MLPs Alerian MLP -47.2% -57.2% -61.0% -29.6% -21.1% Hedged Strategies HFRX Hedge Fund Index -5.9% -6.9% -1.4% -0.6% -0.7% Managed Futures HFRX Macro/CTA Index -1.0% -1.3% 4.4% 1.1% -1.1% Private Real Estate NCREIF Private Real Estate - 0.0% 6.4% 6.7% 8.2% Global Cash Cash Citigroup 3-month T- Bill 0.1% 0.4% 2.0% 1.7% 1.1% Other Fixed Income Municipal Fixed Income Barclays Municipal Bond -3.6% -0.6% 3.8% 4.0% 3.2%
Market Returns
Source: Morgan Stanley Wealth Management As of March 31, 2020; Private Real Estate as of January 31, 2020
Market Response
Stocks which had been down 34% finished the quarter -19.6. Energy, Commodities and REITs suffered severely.

14 2nd Quarter Investment Outlook
University of Michigan Consumer Sentiment
University of Michigan, University of Michigan: Consumer Sentiment [UMCSENT], retrieved from FRED, Federal Reserve Bank of St. Louis; https://fred.stlouisfed.org/series/UMCSENT, April 13, 2020.
Consumer Response The speed of Consumer Sentiment decline is unmatched. Consumers make up more than 70% of U.S. GDP.
Last 45 Years Last 2 Months
Sentiment Now Matches Severe Recession in the US Index of Consumer Sentiment – Seven Day Moving Average

15 2nd Quarter Investment Outlook
Auto ‘Crash’
U.S. Bureau of Economic Analysis, Total Vehicle Sales [TOTALSA], retrieved from FRED, Federal Reserve Bank of St. Louis; https://fred.stlouisfed.org/series/TOTALSA, April 14, 2020
Consumer Response
As “discretionary” items, auto sales often drop precipitously in economic crisis and typically recover over 2 to 5 years.
‘Shelter in Place’ has shut down production and halted auto sales

16 2nd Quarter Investment Outlook
Initial Unemployment Claims
U.S. Employment and Training Administration, Initial Claims [ICSA], retrieved from FRED, Federal Reserve Bank of St. Louis; https://fred.stlouisfed.org/series/ICSA, April 13, 2020.
Consumer Response
Approximately 22 million applied for unemployment insurance. Jobs build confidence. Without confidence consumer spending may drop.
“a good thing because it means you’re getting the transfers to the people that are being disrupted by this health-ordered shutdown,” Bullard

17 2nd Quarter Investment Outlook
OECD Outlook for GDP
Source: OECD Annual National Accounts as of 3-26-2020
Economic Outlook
Organization for Economic Co-operation and Development has 36 member countries. Organized to support trade and economic stimulus.
The potential impact of partial or complete shutdowns on activity in the selected G7 economies

18 2nd Quarter Investment Outlook
OECD Outlook for GDP
As of 03-26-2020
Economic Outlook
The Great Lock Down has impacted all World Economies

19 2nd Quarter Investment Outlook
Real GDP Growth Year on Year Percent Change
Source: IMF World Economic Outlook 04-14-2020
Economic Outlook
The Great Lock Down will likely be more severe than the Global Financial Crisis of 2008 according to IMF.

20 2nd Quarter Investment Outlook
IMF GDP Forecast
IMF World Economic Outlook April 14-2020
Economic Outlook
The estimated Downturn in GSP for 2020 may not be fully made up in 2021 according to IMF.
United States Europe
21 2nd Quarter Investment Outlook
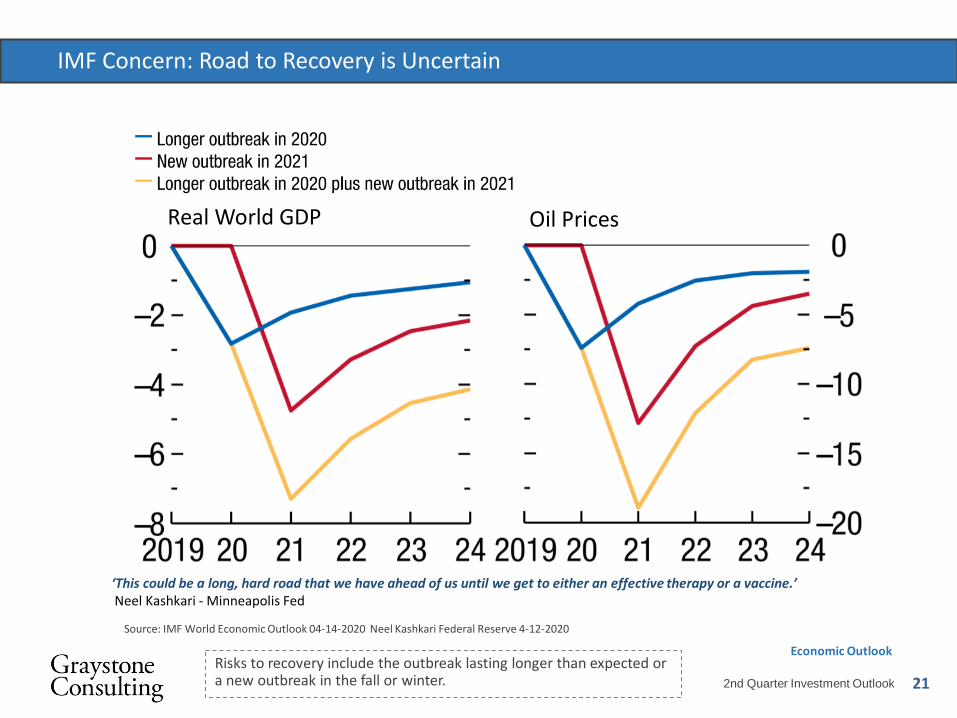
IMF Concern: Road to Recovery is Uncertain
Source: IMF World Economic Outlook 04-14-2020 Neel Kashkari Federal Reserve 4-12-2020
Economic Outlook
Risks to recovery include the outbreak lasting longer than expected or a new outbreak in the fall or winter.
Real World GDP Oil Prices
‘This could be a long, hard road that we have ahead of us until we get to either an effective therapy or a vaccine.’ Neel Kashkari - Minneapolis Fed

22 2nd Quarter Investment Outlook
Covid-19 Case Curve in Theory
Source: Alliance Bernstein CMO April 2020 Data as of March 31, 2020 Centers for Disease Control and Prevention (CDC), Drew Harris, Johns Hopkins University
The Covid-19 Curve Goals of “Lockdown:” 1. Delay outbreak peak 2. Decompress burden on hospitals 3. Diminish overall cases 4. Decrease fatalities

23 2nd Quarter Investment Outlook
Covid-19 Case Curve in Real Time
Source: Johns Hopkins https://coronavirus.jhu.edu/map.html as of 04-21-2020
The Covid-19 Curve Fortunately, the number of new cases appears to have peaked in several developed market economies, preparing the way to recovery.

24 2nd Quarter Investment Outlook
Covid-19 Case Curve
The Covid-19 Curve
Projections for “return to work” vary by state but may be realized in part by May or June
Analysis provided for illustrative purposes only and is subject to revision. Source: Alliance Bernstein CMO April 2020
Reported Cases
Projected Date of Peak
Resource Use* Projected Date
of Zero Daily Deaths*
US 374,329 April 15, 2020 June 19, 2020
New York 141,100 April 8, 2020 May 8, 2020
New Jersey 41,090 April 15, 2020 May 12, 2020
Michigan 17,221 April 8, 2020 April 29, 2020
Louisiana 14,867 April 1, 2020 April 24, 2020
California 14,336 April 14, 2020 May 20, 2020
Massachusetts 13,837 April 18, 2020 May 31, 2020
Florida 13,214 April 21, 2020 June 14, 2020
Pennsylvania 12,980 April 11, 2020 May 13, 2020
Illinois 12,262 April 16, 2020 May 6, 2020

25 2nd Quarter Investment Outlook
Unprecedented Response
Source: Alliance Bernstein CMO April 2020 Central Bank Action
The response to crisis in 2007-2009 took almost 2 years for Fed Intervention. The Covid-19 Crisis took 2 weeks.
Federal Reserve Action
Two emergency rate cuts by the Fed Rate cuts of 50 b.p. and 100 b.p. leave rates at the zero bound
Unlimited quantitative easing Fed’s initial pledge to purchase $700 billion in US Treasuries and agency mortgage-backed securities (MBS) is changed to unlimited amounts—including commercial mortgage-backed securities (CMBS)
Fed’s emergency powers to create facilities to expand liquidity* Primary Dealer Credit Facility (PDCF) Commercial Paper Funding Facility (CPFF) Money Market Mutual Fund Liquidity Facility (MMLF) Primary Market Corporate Credit Facility (PMCCF) Secondary Market Corporate Credit Facility (SMCCF) Term Asset-Backed Securities Loan Facility (TALF) Main Street Lending Facility (MSLF) FIMA Repo Lending Facility
Purchase of Commercial Paper, Muni’s, CLOs, CMBS, Corporate Bonds, ETFs, Junk Bonds, ABS: Student Loans, Auto Loans, Credit Cards

26 2nd Quarter Investment Outlook
Source: Alliance Bernstein CMO April 2020*The Fed has “emergency powers” through Section 13(3) of the Federal Reserve Act. These powers allow the Fed to create programs or facilities to get liquidity into distressed areas of the economy. As of March 31, 2020. Source: Bloomberg, CNBC, US Federal Reserve, Wall Street Journal and AB
Unprecedented Response
Congressional Action Congress has acted quickly to put money in the hands of consumers and small businesses.
Congressional Relief
Backstop businesses $350 billion in small business loans $500 billion in corporate aid and loans—administered by US Department of the Treasury $25 billion in grants for airlines, along with $25 billion in loans $17 billion in loans to companies (e.g., Boeing) deemed critical to national security
Backstop incomes Direct payments of $1,200 per individual, $500 per child Tax and interest relief, including from mortgages and student loans
Employees Paid sick leave (Phase 2) Expanded unemployment insurance (Phases 2 & 3)

27 2nd Quarter Investment Outlook
Unprecedented Global Response
Source: Morgan Stanley Wealth Management 03-27-2020
Global Government Action
Rapid Central Government response may mitigate the impact of severely tested economies.

28 2nd Quarter Investment Outlook
1Q:2020 Edition
Source: Alliance Bernstein CMO April 2020US high yield (HY) represented by Bloomberg Barclays US High-Yield; emerging-market (EM) corporate by Bloomberg Barclays USD Emerging Markets Corporate; US municipal HY by Bloomberg Barclays Municipal High-Yield; non-agency BBB CMBS by Bloomberg Barclays Non-Agency BBB CMBS; US investment-grade (IG) BBB Corporate by Bloomberg Barclays US Corporate Investment-Grade BBB; CRT 2015 Last Cash Flow/High Loan to Value
‘Beaten Down’ Assets may offer Opportunity in Rebound
Bonds that have been hit hardest often have the strongest recovery
Index Returns 2008 and 2009
A Look Back to 2008–2009
Potential Opportunity

29 2nd Quarter Investment Outlook
Source: Alliance Bernstein CMO April 2020 Bloomberg Barclays and ABUS investment grade (IG) represented by Bloomberg Barclays US Corporate Investment-Grade BBB; emerging markets (EM) by Bloomberg Barclays USD Emerging Markets Sovereign; credit risk–transfer (CRT) securities by a representative set of bonds; US high yield (HY) by Bloomberg Barclays US High-Yield. *Subordinated Financials is the Tier 1 component of Bloomberg Barclays Global Capital Securities Index. As of March 25, 2020
‘Beaten Down’ Assets may offer Opportunity in Rebound
Potential Opportunity
Spreads on most fixed income instruments moved to widest since 2008.
One-Year Range Current Levels
Current Spread vs. Past 12 Months

30 2nd Quarter Investment Outlook
Strategy: Look for ‘Beaten Down’ Sector at the Recession Trough
Source:, Morgan Stanley Wealth Management.
Potential Opportunity
The worst performing sector is often the best performer in a rebound.

31 2nd Quarter Investment Outlook
Opportunity Set
Potential Opportunity
Pimco differentiates liquidity risk from solvency risk. The Feds have stepped in to buy bonds: Liquidity Congress may aid business solvency.
‘V’ Recovery ‘U’ Recovery ‘L’ Recovery

32 2nd Quarter Investment Outlook
Agency Mortgages
Freddie Mac, 30-Year Fixed Rate Mortgage Average in the United States [MORTGAGE30US], retrieved from FRED, Federal Reserve Bank of St. Louis; https://fred.stlouisfed.org/series/MORTGAGE30US, April 13, 2020.
Potential Opportunity
Agency Mortgages are near record spread relative to U.S. Treasuries.
30 Year Fixed Rate Mortgage vs. 10 Year Treasury Yield

33 2nd Quarter Investment Outlook
Muni/Treasury Ratio State Rainy-Day Funds at Highs
*Source: Alliance Bernstein CMO April 2020 Municipal Market Data, National Association of State Budget Officers Figures for fiscal 2020 are projected based on states’ enacted budgets. Data as of March 31, 2020
Municipal Bonds
Municipal Bonds, in theory, should yield less than Treasuries due to favorable tax treatment. They may currently offer potential value.
2020 Estimate*
10-Year
Average
Potential Opportunity

34 2nd Quarter Investment Outlook
Potential Municipal Opportunity BBB Spreads (Percent)
*Source: Alliance Bernstein CMO April 2020 Credit rating is a measure of the quality and safety of a bond or portfolio, based on an issuer’s financial condition. AAA is the highest (best) and D is the lowest (worst). Investment-grade securities are those rated BBB and above. Ratings are subject to change. *Industrial development revenue
Municipal Bonds
Potential Opportunity
Municipal Bonds appear cheap across the spectrum of sectors.

35 2nd Quarter Investment Outlook
7.0
5.0
3.0
1.0
-1.0
-3.0
-5.0
15.0
13.0
11.0
9.0
-30% -25% 5% 10%
Loss
-adj
uste
d yi
eld (
%)
-20% -15% -10% -5% 0% 2–year national home price depreciation / appreciation
Unlevered loss adjusted yield s in a range of home price scenarios
Legacy Non-Agency MBS
Residential Mortgage Backed Bonds
For illustrative purposes only. Past performance is not a guarantee or a reliable indicator of future results. As of 22 March 2020. Source: PIMCO, Bloomberg
Potential Opportunity
There may be an opportunity in residential mortgage backed bonds.
Seniority: Emphasis on senior tranches of very seasoned loans. Even in an economic slowdown, we expect these bonds to be relatively insulated
Favorable fundamentals: Homeowners underlying the bonds have been making payments for over a decade with high levels of equity / low LTVs
Resiliency even in economic downturns
Focus on resiliency across a wide range of economic environments
Above is Pimco Commentary

36 2nd Quarter Investment Outlook
*uses HY peaks in '01/02 recession, GFC, 2011 debt crisis, 2015/16 shale bust
Average Returns Around HY Spreads Peaking*
Months Before/After HY Spreads Peaked
-3 mths
-1 mths
+3 mths
+6 mths
+12 mths
+24 mths
Barclays Agg HY Index -14% -9% 12% 25% 39% 53%
Bloomberg Barclays Agg IG Index 2% 1% 1% 2% 5% 7%
S&P 500 -19% -9% 5% 12% 26% 41%
Bloomberg Commodity Index -15% -9% 5% 8% 18% 23%
Forward Returns of Various Asset Classes After HY Spreads Peak As of March 31, 2020
Source: Bloomberg, Morgan Stanley Wealth Management GIC Past performance is no guarantee of future results. Estimates of future performance are based on assumptions that may not be realized..
If Looking for a ‘V’ Recovery: High Yield Bonds
MS Analysts suggest that High Yield may snap back before equities
Potential Opportunity
37 2nd Quarter Investment Outlook
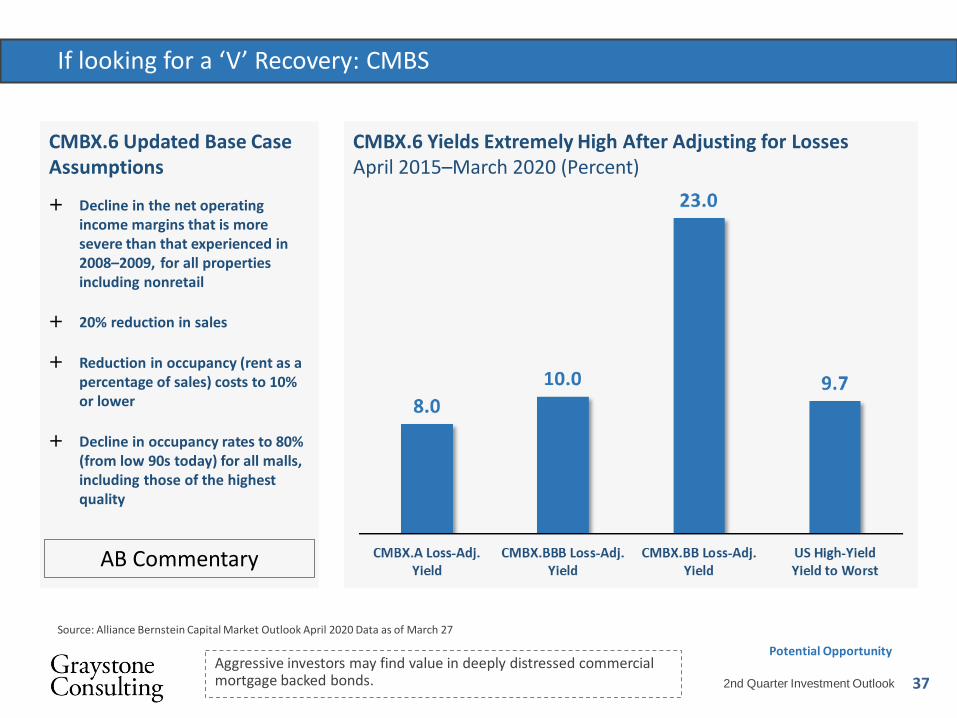
If looking for a ‘V’ Recovery: CMBS
Source: Alliance Bernstein Capital Market Outlook April 2020 Data as of March 27
Potential Opportunity
Aggressive investors may find value in deeply distressed commercial mortgage backed bonds.
CMBX.6 Updated Base Case Assumptions
Decline in the net operating income margins that is more severe than that experienced in 2008–2009, for all properties including nonretail
20% reduction in sales
Reduction in occupancy (rent as a percentage of sales) costs to 10% or lower
Decline in occupancy rates to 80% (from low 90s today) for all malls, including those of the highest quality
CMBX.6 Yields Extremely High After Adjusting for Losses April 2015–March 2020 (Percent)
AB Commentary

38 2nd Quarter Investment Outlook
If Looking for a ‘V’ Recovery: ABS and CRT
Potential Opportunity
Institutional Investors may want to consider the unusually wide spreads in Asset Backed Securities.

39 2nd Quarter Investment Outlook
If looking for a ‘V’ Recovery: Stocks
Source: Alliance Bernstein CMO April 2020, Standard and Poor’s
Stocks have already reflected the hope of a strong earnings recovery.
S&P EPS $126 $132 $138 $145 $151 $157 $163 $170 $176
P/E
Ratio
19 2394 2508 2622 2755 2869 2983 3097 3230 3344
18 2268 2376 2484 2610 2718 2826 2934 3060 3168
17 2142 2244 2346 2465 2567 2669 2771 2890 2992
16 2016 2112 2208 2320 2416 2512 2608 2720 2816
15 1890 1980 2070 2175 2265 2355 2445 2550 2640
14 1764 1848 1932 2030 2114 2198 2282 2380 2464
13 1638 1716 1794 1885 1963 2041 2119 2210 2288
12 1512 1584 1656 1740 1812 1884 1956 2040 2112
11 1386 1452 1518 1595 1661 1727 1793 1870 1936
Potential Opportunity

40 2nd Quarter Investment Outlook
8.1
11.8
14.1
16.4 15.9
17.7 17.7
16.0
14.5
10.8
0
2
4
6
8
10
12
14
16
18
20
-2% -1-2% -1-0% 0-1% 1-2% 2-3% 3-4% 4-5% 5-6% >6%
Trai
ling
PE R
atio
Real 10 Year Treasury Yield, %
What’s Fair Value for S&P Earnings?
Source: KKR kkr.com/global-perspectives/publications/keep-calm-and-carry-on
As KKR notes explain, current real yield is -1.5%. The current trailing PE is higher than PE ratios in previous negative real yield environments.
Today Real 10-Yr yield = -1.5% P/E Ratio = 17.5x
Median Trailing P/E Under Various Real 10-Year Yield Environments, 1948-Current
Potential Opportunity

41 2nd Quarter Investment Outlook
For a Patient Investor: Energy
Sources: Short-Term Energy Outlook, April 2020, and CME Group
Potential Opportunity
The path to oil recovery is uncertain. The Energy Information Administration believes oil will rebound to low 40s by 2022.
Recovery Expectations

42 2nd Quarter Investment Outlook
87
89
91
93
95
97
99
101
103
Q1 Q2 Q3 Q4 Q1 Q2 Q3 Q4 Q1 Q2 Q3 Q4 Q1 Q2 Q3 Q4 Q1 Q2 Q3 Q4 Q1 Q2 Q3 Q4 Q1 Q2 Q3 Q4
2015 2016 2017 2018 2019 2020 2021
world production world consumption
-202468
1012
implied stock build implied stock draw
For a Patient Investor: Energy
Source: Short-Term Energy Outlook, April 2020
The current glut in oil may come back to equilibrium by increased demand and lower production.
million barrels per day
Potential Opportunity

43 2nd Quarter Investment Outlook
Watch The ‘Smart’ Money
Source: Morgan Stanley Wealth Management 03-17-2020
Potential Opportunity
Insiders often have more insight into the future prospects of a company. Consider Money Managers who monitor insider buying.
Global Insider Buy/Sell Ratio

44 2nd Quarter Investment Outlook
Peak
Trough
Total Drawdown
Total Bear Market Duration (months)
Time to 20% Bear Market Threshold
(Months)
Performance After Initial 20%
Downside to Trough
Time to Trough from 20% Threshold
(Months)
T+12M Performance After
Trough
16-Sep-29 13-Nov-29 -45% 1.9 1.4 -22% 0.5 -6% 10-Apr-30 16-Dec-30 -44% 8.3 2.2 -30% 6.1 -45% 24-Feb-31 2-Jun-31 -33% 3.3 2.1 -15% 1.1 -62% 26-Jun-31 5-Oct-31 -43% 3.4 2.7 -27% 0.7 -16% 9-Nov-31 1-Jun-32 -62% 6.8 0.8 -51% 6.1 121% 7-Sep-32 27-Feb-33 -41% 5.8 0.2 -25% 5.5 95% 18-Jul-33 19-Oct-33 -29% 3.1 0.1 -11% 3.0 5% 6-Feb-34 14-Mar-35 -32% 13.4 3.8 -14% 9.5 77%
10-Mar-37 31-Mar-38 -54% 12.9 6.0 -42% 6.8 29% 9-Nov-38 11-Apr-39 -24% 5.1 4.7 -5% 0.4 19%
25-Oct-39 10-Jun-40 -32% 7.6 6.7 -13% 0.9 9% 7-Nov-40 28-Apr-42 -34% 17.9 13.0 -18% 4.9 54%
29-May-46 19-May-47 -28% 11.8 3.4 -8% 8.4 19% 15-Jun-48 13-Jun-49 -21% 12.1 12.1 0% 0.0 42% 2-Aug-56 22-Oct-57 -22% 14.9 14.8 0% 0.0 31%
12-Dec-61 26-Jun-62 -28% 6.5 5.6 -6% 1.0 33% 9-Feb-66 7-Oct-66 -22% 8.0 6.7 -2% 1.3 33%
29-Nov-68 26-May-70 -36% 18.1 14.2 -19% 3.9 44% 11-Jan-73 3-Oct-74 -48% 21.0 10.7 -35% 10.3 38%
28-Nov-80 12-Aug-82 -27% 20.7 15.0 -8% 5.7 58% 25-Aug-87 4-Dec-87 -34% 3.4 1.8 0% 1.5 21% 24-Mar-00 21-Sep-01 -37% 18.2 11.8 -18% 6.4 -12%
4-Jan-02 9-Oct-02 -34% 9.3 6.2 -16% 3.0 34% 9-Oct-07 20-Nov-08 -52% 13.6 9.1 -40% 4.5 45% 6-Jan-09 9-Mar-09 -28% 2.1 1.6 -9% 0.5 69%
Average -36% 10 6.3 -17% 3.7 29% Median -34% 8 5.6 -15% 3.0 33%
Appendix: History of Bear Markets since 1929
Source: Bloomberg, Morgan Stanley Wealth Management. Note: Grey shades represent recession within 12 months from Peak S&P 500 date based on Bloomberg Recession Index price returns.
Grey bars indicate periods of recession Drawdown is the peak-to-trough decline during a specific period. Data as of March 31, 2020

The views expressed herein are those of the author and do not necessarily reflect the views of Graystone or Morgan Stanley or its affiliates. All opinions are subject to change without notice. Neither the information provided nor any opinion expressed constitutes a solicitation for the purchase or sale of any security. Past performance is no guarantee of future results. This material does not provide individually tailored investment advice. It has been prepared without regard to the individual financial circumstances and objectives of persons who review it. The strategies and/or investments discussed in this material may not be suitable for al investors. Morgan Stanley Smith Barney LLC recommends that investors independently evaluate particular investments and strategies, and encourages investors to seek the advice of a Financial Advisor. The appropriateness of a particular investment or strategy will depend on an investor’s individual circumstances and objectives. Tax laws are complex and subject to change. Morgan Stanley Smith Barney LLC, its affiliates and Morgan Stanley Smith Barney’s Financial Advisors do not provide tax or legal advice and are not “fiduciaries” (under ERISA, the Internal Revenue Code or otherwise) with respect to the services or activities described herein except as otherwise agreed to in writing by Morgan Stanley Smith Barney. This material was not intended or written to be used for the purpose of avoiding tax penalties that may be imposed on the taxpayer. Individuals are urged to consult their tax or legal advisors before establishing a retirement plan and to understand the tax, ERISA and related consequences of any investments made under such plan. The information set forth was obtained from sources believed to be reliable, but we do not guarantee its accuracy or completeness. Past performance is no guarantee of future results. Actual results may vary and past performance is no guarantee of future results. Investing in commodities entails significant risks. Commodity prices ay be affected by a variety of factors at any time, including but not limited to, (i)changes in supply and demand relationships, (ii) governmental programs and policies, (iii) national and international political and economic events, war and terrorist events, (iv) changes in interest and exchange rates, (v) trading activities I commodities and related contracts, (vi) pestilence, technological change an weather, and (vii) the price volatility of a commodity. In addition, the commodities markets are subject to temporary distortions or other disruptions due to various factors, including lack of liquidity, participation of speculators and government intervention. As further described in the offering documents, an investment in alternative investments can be highly illiquid, are speculative and not suitable for all investors. Investing in alternative investments is only intended for experienced and sophisticated investors who are willing to bear the high economic risks associated with such an investment. Investors should carefully review and consider potential risks before investing. Certain of these risks may include: loss of all or a substantial portion of the investment due to leveraging, short-selling, or other speculative practices; lack of liquidity in that there may be no secondary market for the fund and none is expected to develop; volatility of returns; restrictions on transferring interests in the Fund; potential lack of diversification and resulting higher risk due to concentration of trading authority when a single advisor is utilized; absence of information regarding valuations and pricing; complex tax structures and delays in tax reporting; less regulation and higher fees than mutual funds; and manager risk. Individual funds will have specific risks related to their investment programs that will vary from fund to fund. REITs are subject to special risk considerations similar to those associated with the direct ownership of real estate. Real estate valuations may be subject to factors such as changing general and local economic, financial, competitive, and environmental conditions. REITs may not be suitable for every investor. Dividend income from REITs will generally not be treated as qualified dividend income and therefore will not be eligible for reduced rates of taxation. Interest in municipal bonds is generally exempt from federal income tax. However, some bonds may be subject to the alternative minimum tax (AMT). Typically, state tax-exemption applies if securities are issued within one’s state of residence and, local tax-exemption typically applies if securities are issued within one’s city of residence. International investing may not be suitable for every investor and is subject to additional risks, including currency fluctuations, political factors, withholding, lack of liquidity, the absence of adequate financial information, and exchange control restrictions impacting foreign issuers. These risks may be magnified in emerging markets. S&P 500 Index is an unmanaged, market value-weighted index of 500 stocks generally representative of the broad stock market. An investment cannot be made directly in a market index. Russell 2000® Index measures the performance of the 2,000 smallest companies in the Russell 3000 Index, which represents approximately 8% of the total market capitalization of the Russell 3000 Index. An investment cannot be made directly in a market index. Investing in smaller companies involves greater risks than those associated with investing in more established companies, including significant stock price fluctuations and illiquidity. The Barclays Capital U.S. Aggregate Index covers the U.S. Dollar-denominated, investment-grade, fixed-rate, taxable bond market segment of SEC-registered securities. The inde3x includes bonds from the U.S. Treasury, Government-Related Corporate, Mortgage-Backed, Asset-Backed, and Commercial Mortgage-Backed Securities sectors. An investment cannot be made directly in a market index. Bonds are affected by a number of risks, including fluctuations in interest rates, credit risk and prepayment risk. In general, as prevailing interest rates rise, fixed income securities prices will fall. Bonds face credit risk if a decline in an issuer's credit rating, or creditworthiness, causes a bond's price to decline. Finally, bonds can be subject to prepayment risk. When interest rates fall, an issuer may choose to borrow money at a lower interest rate, while paying off its previously issued bonds. As a consequence, underlying bonds will lose the interest payments from the investment and will be forced to reinvest in a market where prevailing interest rates are lower than when the initial investment was made. NOTE: High yield bonds are subject to additional risks such as increased risk of default and greater volatility because of the lower credit quality of the issues. Barclays Capital U.S. Credit Bond Index is composed of all publicly issued, fixed-rate, non-convertible, investment-grade, domestic corporate debt (collateralized mortgage obligations are not included). Total return comprises price appreciation/deprecation and income as a percentage of the original investment. This index is rebalanced monthly by market capitalization. An investment cannot be made directly in a market index.
Important Information

Barclays Capital Municipal Bond Index is a broad measure of the municipal bond market with maturities of at least one year. The index has four main sectors: state and local general obligation bonds, revenue bonds, insured bonds, and pre-refunded bonds. An investment cannot be made directly in a market index. The MSCI EAFE© Index (Europe, Australasia, Far East) is a free float-adjusted market capitalization index that is designed to measure developed market equity performance, excluding the US & Canada. As of May 2005 the MSCI EAFE Index consisted of the following 21 developed market county indices: Australia, Austria, Belgium, Denmark, Finland, France, Germany, Greece, Hong Kong, Ireland, Italy, Japan, the Netherlands, New Zealand, Norway, Portugal, Singapore, Spain, Sweden, Switzerland and the United Kingdom. An investment cannot be made directly in a market index. The MSCI World Index is a free float-adjusted market capitalization weighted index designed to measure the equity market performance of 23 developed-country markets. An investment cannot be made directly in a market index. HFR Indices are compiled by Hedge Fund Research, Inc. ("HFR"), an industry service provider. They are based on the performance of hedge funds in various strategies as reported by the hedge fund managers to HFR. While the HFRI Indices are frequently used, they have limitations (some of which are typical of other widely used indices). These limitations include survivorship bias (the returns of the indices may not be representative of all the hedge funds in the universe because of the tendency of lower performing funds to leave the index); heterogeneity (not all hedge funds are alike or comparable to one another, and the index may not accurately reflect the performance of a described style); and limited data (many hedge funds do not report to indices, and the index may omit funds, the inclusion of which might significantly affect the performance shown. The HFRI Indices are based on information self-reported by hedge fund managers that decide on their own, at any time, whether or not they want to provide, or continue to provide, information to HFR Asset Management, L.L.C. Results for funds that go out of business are included in the index until the date that they cease operations. Therefore, these indices may not be complete or accurate representations of the hedge fund universe, and may be biased in several ways. All data is net of all fees, denominated in U.S. dollar and equal-weighted. The information underlying the indices and the classification of the underlying funds have not been independently verified by either HFR or Morgan Stanley Smith Barney, and neither HFR nor Morgan Stanley Smith Barney make any representation as to their accuracy. Past performance does not guarantee future results. Real results may vary. The Alerian MLP Index is a composite of the 50 most prominent energy Master Limited Partnerships (MLP)s that provides investors with an unbiased, comprehensive benchmark for this emerging asset class. The index, which is calculated using a float-adjusted, capitalization-weighted methodology, is disseminated real-time on a price-return bases. An investment cannot be made directly in a market index. © 2014 Investments and services offered through Morgan Stanley Smith Barney LLC. Member SIPC. Graystone Consulting, a business of Morgan Stanley. This material does not provide individually tailored investment advice. It has been prepared without regard to the individual financial circumstances and objectives of persons who receive it. The strategies and/or investments discussed in this material may not be suitable for all investors. Morgan Stanley Wealth Management recommends that investors independently evaluate particular investments and strategies, and encourages investors to seek the advice of a Financial Advisor. The appropriateness of a particular investment or strategy will depend on an investor’s individual circumstances and objectives. Tax laws are complex and subject to change. Morgan Stanley Smith Barney LLC (“Morgan Stanley”) , its affiliates and Morgan Stanley Financial Advisors and Private Wealth Advisors do not provide tax or legal advice and are not “fiduciaries” (under ERISA, the Internal Revenue Code or otherwise) with respect to the services or activities described herein except as otherwise agreed to in writing by Morgan Stanley. Individuals are encouraged to consult their tax and legal advisors (a) before establishing a retirement plan or account, and (b) regarding any potential tax, ERISA and related consequences of any investments made under such plan or account. The views expressed herein are those of the author and do not necessarily reflect the views of Morgan Stanley Wealth Management or its affiliates. All opinions are subject to change without notice. Neither the information provided nor any opinion expressed constitutes a solicitation for the purchase or sale of any security. Past performance is no guarantee of future results. Morgan Stanley Smith Barney LLC, member SIPC CRC 3052279 04/2019
Important Information, continued