2h & fy 2020 financial results
TRANSCRIPT

2H & FY 2020 Financial Results28 January 2021

2
• Address by CEO
• Group Financial Highlights by CFO
Scope of Briefing

3
Address by CEO

Executing Vision 2030Achieved good progress on our 100-day plan launched at end-Sep 2020, and will
continue to accelerate execution of Vision 2030 to create value.
ransformation officeT• Established to drive the Group’s transformation and
delivery of Vision 2030 goals, and serve as change catalyst to build greater agility and discipline
• Focused on 6 workstreams:
1. Growth initiatives across four business segments
2. Asset monetisation & portfolio optimisation
3. Cost & cash management
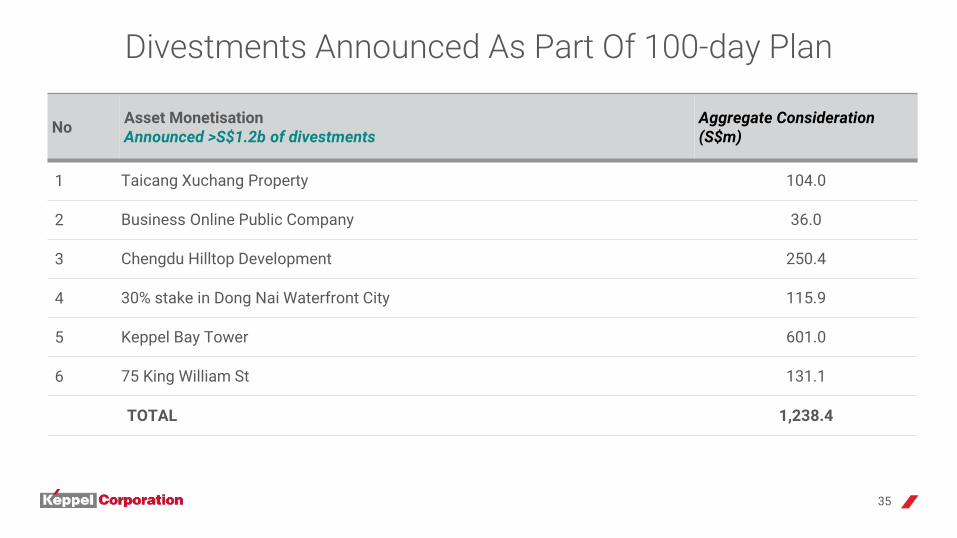
• Announced >S$1.2b of divestments since Oct 2020, in line with 3-year target of S$3-5b
• Progressed with strategic reviews of offshore & marine and logistics businesses
• Pursued new growth opportunities, including securing new renewables projects and launching new funds
• Embarking on second wave of initiatives
100day plan
4
4. Sustainability
5. People & organisation
6. Technology & innovation

5
Strategic Review of Keppel O&M• Keppel O&M will undergo bold transformation to ensure that it is relevant, competitive and well-placed to
support the global energy transition. • Keppel will concurrently continue to explore inorganic options.
Separating construction and ownership of legacy drilling rig assets from core operations.
Keppel O&M
Focused on putting completed rigs to work or selling them.
Rig Co will sell the rigs or work with Keppel Capital to seek funding from external investors when market improves.
Self-sustaining with minimal funding required.
Rig Co can be monetised or spun off when cashflow generative.
Focused on completing rigs under construction, prioritising projects with firm contracts, while prudently managing cashflows.
Completed rigs will be delivered to customers or transferred to Rig Co.
Transient entities created to hold legacy completed and uncompleted rig assets worth S$2.9b.To be provided net funding of S$500m, mainly for Dev Co, and which will be repaid over time.
Rig Co2
Development Company (Dev Co)
3
Keppel O&M, less the legacy rig assets, will be transformed into an agile, asset-light, people-light Op Co focused on developing and integrating offshore energy and infrastructure assets.
Focused on higher value-adding design, engineering & procurement, with fabrication subcontracted to 3rd parties.
Exit offshore rig building, and progressively exit low value-adding repairs and other activities with low bottom line contribution.
Operating Company (Op Co)
1
ORGANIC RESTRUCTURING

6
Strategic Review of Keppel O&MWe aim to create a nimble industry leader that is well-positioned for the global energy transition.
Operating Company will seek opportunities in floating infrastructure and infrastructure-like projects, and collaborate with other Keppel business units to provide diverse solutions for sustainable urbanisation.
Focused on higher value-adding work as developer & integrator
Undistracted by legacy rig assets
Repurpose offshore rig technology for other uses
Expected to be self-financing, financially independent and profitable over time
Nearshore & Offshore Data Centre Parks
Infr
astr
uctu
re
RenewablesGas New Energy
Ener
gy

7
Strategic Review of Logistics Business
• Rising demand for e-commerce accelerated by COVID-19 pandemic:
• Logistics business benefited from increased demand for e-commerce and urban logistics over the past year with last mile deliveries, gross merchandise value, and channel management orders growing significantly
• To sharpen our focus, we have decided to divest our logistics and channel management business to a third party, who may provide a better eco-system to scale up the business
• Good interest with many potential buyers signing NDAs; first bids expected in Feb 2021
• Keppel T&T may divest its entire interest or retain a minority stake
• More details will be disclosed when there are material developments
Keppel T&T has completed the strategic review and is currently engaging potential buyers through a competitive bidding process.

8
Group PerformanceNet Profit by Segment • Net loss was S$506m for FY 2020, vs net profit of S$707m for
FY 2019
• FY 2020 net loss includes S$952m of impairments, mainly from the Offshore & Marine business
• All key business units were profitable in FY 2020, except for Keppel O&M
• Excluding impairments in both years, FY 2020 net profit was S$446m, vs S$828m in FY 2019
• Free cash inflow of S$497m in FY 2020 vs outflow of S$653m in FY 2019
• Net gearing was 0.91x as at end-Dec 2020 vs 0.96x as at end-Sep 2020
• Proposed final dividend per share of 7.0 cts, total dividend per share of 10.0 cts for FY 2020
(101)
(1,181)
483 438
136 13
214
280
(25)
(56)
FY 2019 FY 2020
Energy & Environment Urban DevelopmentConnectivity Asset ManagementCorporate & Others
707
(506)
S$m
0

9
Multiple Income StreamsAs part of Vision 2030, the Group will focus on improving earnings quality with more recurring income
Net Profit by Income Type
Artist’s impression of Keppel Data Centres’ first greenfield data centre in China
260 220
369 79
229
112
103
111
(254)
(1,028)
FY 2019 FY 2020
Recurring Income
EPC/Development for Sale
Revaluation
Profit from Capital Recycling
Corporate Costs,
(506)S$
m
0
707
Impairments & others

10
Energy & Environment Net Profit
Energy & Environment• Energy & Environment segment recorded net loss of S$1,181m
for FY 2020, due mainly to losses in the Offshore & Marine business
• Keppel O&M’s net loss was S$1,194m for FY 2020, due mainly to:
• Significant impairments recorded in 2Q 2020
• Reduced top line from COVID-19 related disruptions
• Higher share of losses from associates
• Keppel O&M made a gross profit of S$250m for FY 2020
• Keppel O&M’s offshore renewables and LNG solutions made up 65% of ~S$1b new contracts secured in 2020, bringing net orderbook to S$3.3b as at end-2020
• Workforce of ~19,500 returned to work in Singapore yards as at end-2020 with safe management measures in place
10
(1,194)
129 144
(240)
(131)
FY 2019 FY 2020
Keppel O&M Keppel Infrastructure Others
S$m
0
(1,181)
(101)
i ii
i Does not include contribution from business trustii Includes contributions from KrisEnergy, Keppel Renewable Energy, Keppel Prince Engineering, financing cost, impairment of an associated company and other group adjustments

11
Energy & Environment
• Keppel Infrastructure’s FY 2020 contributioni
grew 12% yoy to S$144m, while FY 2020 EBITDA was S$165m, underpinned by improved performance in Energy Infrastructure and Environmental Infrastructure businesses
• Keppel Infrastructure secured S$2.1bii worth of WTE and district cooling contracts across Singapore, India and Thailand in FY 2020
• Keppel Renewable Energy announced first solar farm project with a minimum capacity of 500 MW in Queensland, Australia
i Does not include contribution from business trustii Based on gross contract values
Keppel Marina East Desalination Plant contributes to the Group’s recurring income stream from the operation & maintenance phase

Keppel Land announced asset divestments of over [S$1.2b] in 2020, and acquired a co-living solutions provider as well as new projects in
China and India
12
Urban Development Net Profit
Urban Development
• Urban Development segment recorded net profit of S$438m for FY 2020
• Keppel Land’s contributioni of S$406m for FY 2020 was 10% lower yoy mainly due to absence of tax write-backs
• 53% of contribution from property trading and 47% from property investment businesses
• Keppel Land announced asset divestments of ~S$1.3b in 2020, and acquired a stake in a co-living solutions provider as well as new projects in China and India
S$m
0
452 406
38 67
(7) (35)
FY 2019 FY 2020
Keppel Land SSTEC Others
438483
i Does not include contributions from REITs and private fundsii Includes contributions from Keppel Urban Solutions and other group adjustments
i ii
13
Units
0
i Refers to Keppel Land’s home sales
Sales value: S$3.2b Sales value:
S$2.5b
3,400
2,110
950
550
250
370
300
140
250
170
FY 2019 FY 2020
China Vietnam Singapore Indonesia India
3,340
5,150
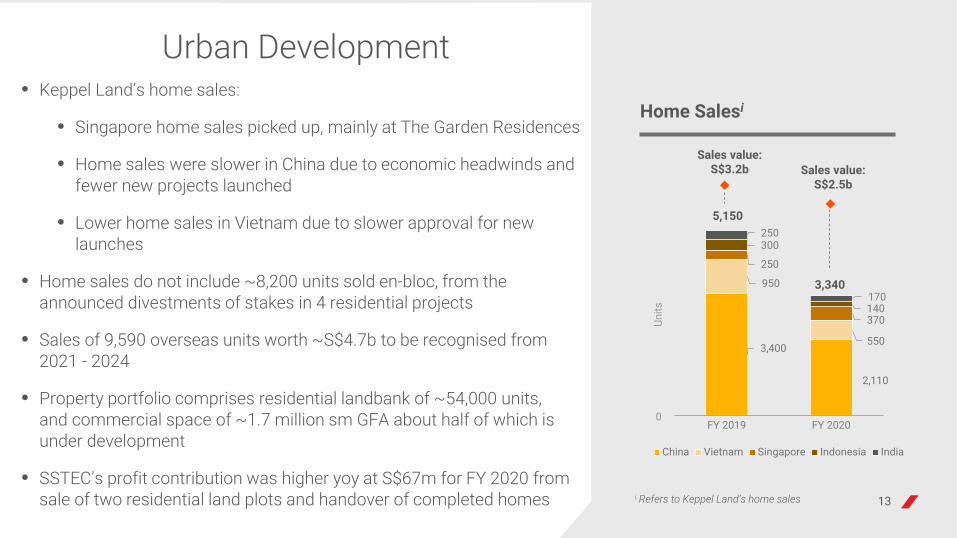
Home Salesi• Keppel Land’s home sales:
• Singapore home sales picked up, mainly at The Garden Residences
• Home sales were slower in China due to economic headwinds and fewer new projects launched
• Lower home sales in Vietnam due to slower approval for new launches
• Home sales do not include ~8,200 units sold en-bloc, from the announced divestments of stakes in 4 residential projects
• Sales of 9,590 overseas units worth ~S$4.7b to be recognised from 2021 - 2024
• Property portfolio comprises residential landbank of ~54,000 units, and commercial space of ~1.7 million sm GFA about half of which is under development
• SSTEC’s profit contribution was higher yoy at S$67m for FY 2020 from sale of two residential land plots and handover of completed homes
Urban Development

14
Connectivity Net Profit
Connectivity
• Connectivity segment recorded net profit of S$13m for FY 2020
• Keppel Data Centres’ contributioni was negative S$12m for FY 2020, vs positive S$11m for FY 2019, mainly due to absence of divestment gain as compared to 2019
• S$74m in contributions from the data centre REIT and private fund was segmentalised to Asset Management for FY 2020
• Keppel Data Centres added two new data centre development projects in Singapore and China
S$m
011
(12)
73 65
(26)(22)
78
(18)FY 2019 FY 2020
Keppel Data Centres M1 Keppel Logistics Others
13
136
i Does not include contributions from REITs and private funds ii Prior to Mar 2019, M1 relates to the share of associated companies’ resultsiii Includes amortisation of intangibles, financing cost and other group adjustments
i ii iii

15
Connectivity
M1 enables smart home solutions with its new digital connectivity platform
• M1’s contributioni of S$65m was 11% lower yoydue to COVID-19 impact on roaming and prepaid revenue, while EBITDA was relatively resilient at S$264m for FY 2020
• Second largest in Singapore by postpaidcustomer base and postpaid revenueii
• M1’s transformation progressing well:
• M1 continues to roll out 5G network, collaborating with industry leaders to conduct trials of 5G use cases
• Refreshed brand identity and will soon launch a new digital connectivity platform to significantly improve customer experience
i Prior to Mar 2019, M1 relates to the share of associated companies’ resultsii Based on data available as at 9M 2020

16
Asset Management
• Asset Management segment’s net profit grew 31% yoy to S$280m for FY 2020
• Keppel Capital’s contributioni grew 6% yoy to S$85m for FY 2020 mainly due to gains from divestments
• Asset management feesii were S$165m for FY 2020, vs S$149m for FY 2019
• REITs & Trust’s contribution was S$193m, higher yoy mainly due to gain from reclassification of Keppel Infrastructure Trust
• Private funds’ contribution was lower yoy mainly due to holdings in fewer funds
i Includes 100% contribution from the manager of Keppel DC REITii Includes 100% fees from subsidiary managers, joint ventures and associated entities, as well as share of
fees based on shareholding stake in associate with which Keppel has strategic alliance.
Asset Management Net Profit
iii
iii Share of results and contributions from associates and investments apart from those held under Keppel Capital
iiii
80 85
70
193 64
2
FY 2019 FY 2020
Keppel Capital REITs & Trust Private Funds
280
S$m
0
214
17
Asset Management
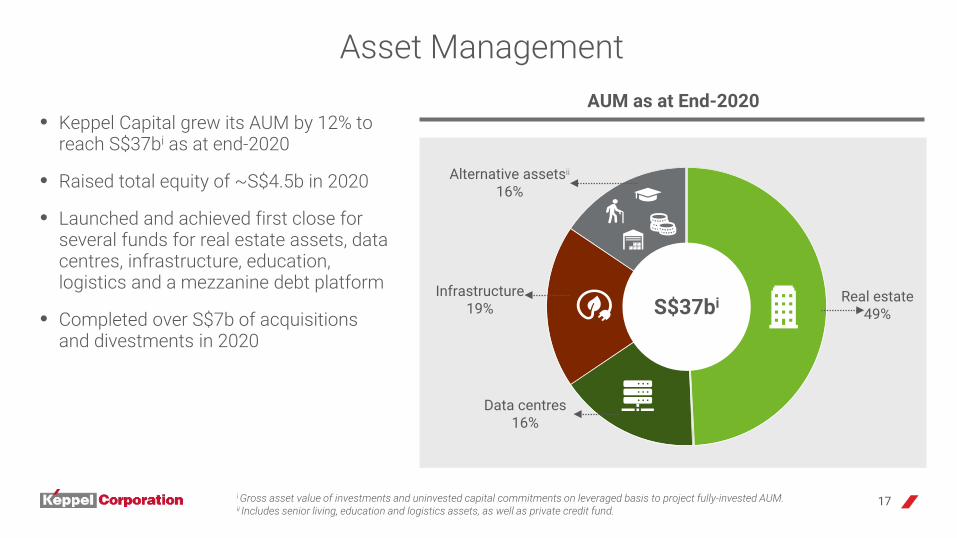
• Keppel Capital grew its AUM by 12% to reach S$37bi as at end-2020
• Raised total equity of ~S$4.5b in 2020
• Launched and achieved first close for several funds for real estate assets, data centres, infrastructure, education, logistics and a mezzanine debt platform
• Completed over S$7b of acquisitions and divestments in 2020
i Gross asset value of investments and uninvested capital commitments on leveraged basis to project fully-invested AUM.ii Includes senior living, education and logistics assets, as well as private credit fund.
AUM as at End-2020
Real estate49%
Data centres16%
Infrastructure19%
Alternative assetsii
16%
S$37bi
18
We will continue to advance towards Vision 2030, creating value and building a sustainable future for all our stakeholders.
Artist’s impression of Bulim district cooling system plant in Jurong Innovation District, Singapore

19
Group Financial Highlights by CFO

20
Net Profit
Key highlights
2H 2020 Financial Performance
↑ from S$351m to S$31m
S$m 2H 2020 2H 2019 % Change
Revenue 3,392 4,265 (20)
EBITDA 370 601 (38)
Operating Profit 157 395 (60)
Profit Before Tax 102 465 (78)
Net Profit 31 351 (91)
EPS (cents) 1.7 19.3 (91)
EPS from 19.3cts to 1.7cts↑

21
2H 2020 Revenue by Segment
S$m 2H 2020 % 2H 2019 % % Change
Energy & Environment 1,919 57 2,818 66 (32)
Urban Development 764 22 708 17 8
Connectivity 633 19 665 15 (5)
Asset Management 75 2 73 2 3
Subtotal 3,391 100 4,264 100 (20)
Corporate & Others 1 - 1 - -
Total 3,392 100 4,265 100 (20)

22
2H 2020 Pre-tax Profit by Segment
S$m 2H 2020 2H 2019 % Change
Energy & Environment (309) (54) 472
Urban Development 373 384 (3)
Connectivity 16 35 (54)
Asset Management 34 123 (72)
Subtotal 114 488 (77)
Corporate & Others (12) (23) (48)
Total 102 465 (78)

23
2H 2020 Net Profit by Segment
S$m 2H 2020 2H 2019 % Change
Energy & Environment (223) (31) >500
Urban Development 223 275 (19)
Connectivity 13 18 (28)
Asset Management 22 109 (80)
Subtotal 35 371 (91)
Corporate & Others (4) (20) (80)
Total 31 351 (91)
24
Key highlights
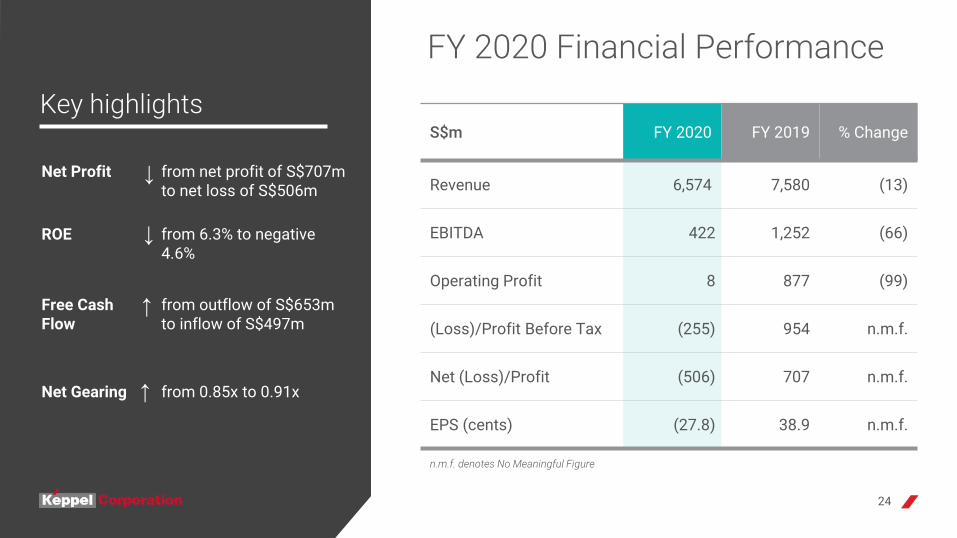
FY 2020 Financial Performance
S$m FY 2020 FY 2019 % Change
Revenue 6,574 7,580 (13)
EBITDA 422 1,252 (66)
Operating Profit 8 877 (99)
(Loss)/Profit Before Tax (255) 954 n.m.f.
Net (Loss)/Profit (506) 707 n.m.f.
EPS (cents) (27.8) 38.9 n.m.f.
↑
↑
Net Profit from net profit of S$707m to net loss of S$506m
ROE from 6.3% to negative 4.6%
Free CashFlow
from outflow of S$653m to inflow of S$497m
Net Gearing from 0.85x to 0.91x
n.m.f. denotes No Meaningful Figure
↑
↑

25
FY 2020 Revenue by Segment
S$m FY 2020 % FY 2019 % % Change
Energy & Environment 3,943 60 4,969 66 (21)
Urban Development 1,275 19 1,336 18 (5)
Connectivity 1,220 19 1,128 15 8
Asset Management 135 2 145 1 (7)
Subtotal 6,573 100 7,578 100 (13)
Corporate & Others 1 - 2 - (50)
Total 6,574 100 7,580 100 (13)

26
FY 2020 Pre-tax Profit by Segment
S$m FY 2020 FY 2019 % Change
Energy & Environment (1,251) (121) >500
Urban Development 720 676 7
Connectivity 29 196 (85)
Asset Management 304 239 27
Subtotal (198) 990 n.m.f.
Corporate & Others (57) (36) 58
Total (255) 954 n.m.f.
n.m.f. denotes No Meaningful Figure

27
FY 2020 Net Profit by Segment
S$m FY 2020 FY 2019 % Change
Energy & Environment (1,181) (101) >500
Urban Development 438 483 (9)
Connectivity 13 136 (90)
Asset Management 280 214 31
Subtotal (450) 732 n.m.f.
Corporate & Others (56) (25) 124
Total (506) 707 n.m.f.
n.m.f. denotes No Meaningful Figure

28
FY 2020 ImpairmentsS$m FY 2020 FY 2019
Doubtful debt on receivables in O&M business (184) -
Contract assets in O&M business (358) -
Stocks in O&M business (42) -
Fixed assets and right-of-use assets, and share of impairment from associated companies in O&M business (24) (4)
Intangible assets in O&M business (23) -
Share of Floatel's impairment of vessels (228) (20)
Fair value loss on investment in Floatel (10) (11)
Investment in KrisEnergy (39) (37)
Others (44) (49)
Total Impairments i (952) (121)i Impairments herein refers to provisions on receivables, contract assets, stocks, intangible assets, fixed assets, right-of-use assets, associated companies, fair value loss on investment in associated company, as well as share of impairment provisions from associated companies

29
Key highlights
FY 2020 Financial Performance(excluding impairments)
S$m FY 2020 FY 2019 % Change
Revenue 6,574 7,580 (13)
EBITDA 1,221 1,351 (10)
Operating Profit 807 976 (17)
Profit Before Tax 775 1,077 (28)
Net Profit 446 828 (46)
EPS (cents) 24.5 45.6 (46)
↑
↑Net Profit from S$828m to S$446m
ROE from 7.3% to 3.9%

19.8 11.6 13.9 18.6 11.2
21.9
11.3 9.413.7
8.4
20.0
12.4 14.612.5
8.8
22.3
7.9 6.9 7.5
10.5
EPS (Cents)
1Q 2Q 3Q 4Q
(29.5)
1.7
38.9
(27.8)
360 211 252 337 203
397
205 171249
153
363
225 265227
159
405
143 127 135
192
Net profit (S$m)
1Q 2Q 3Q 4Q
(537)
31
30
Net Profit & EPS
1,525 84.0
784 43.2815 44.8948 52.3
i Excludes one-off financial penalty from global resolution & related costs
i i
707
(506)
1H 2H 1H 2H
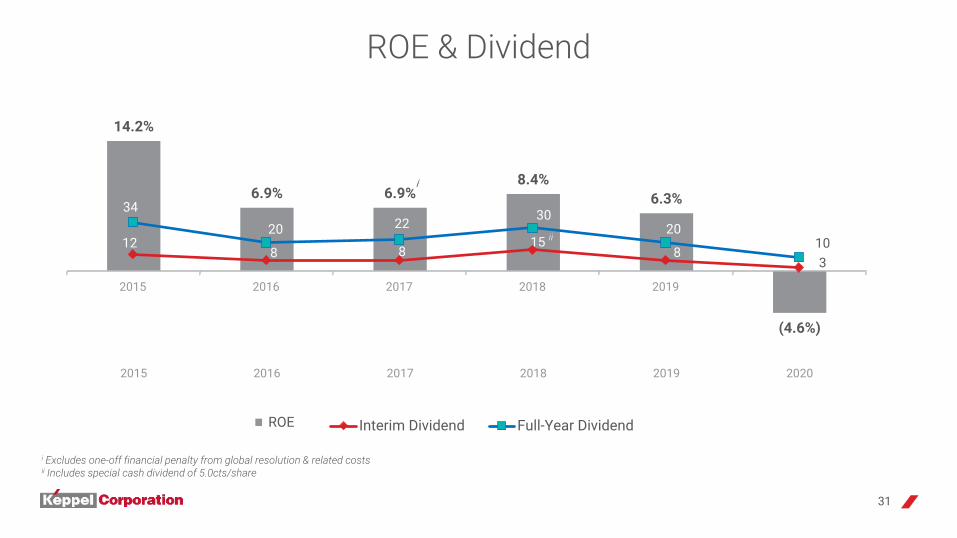
14.2%
6.9% 6.9%8.4%
6.3%
(4.6%)
2015 2016 2017 2018 2019 2020
128 8
158
3
34 20 22 30
2010
2015 2016 2017 2018 2019 2020
Interim Dividend Full-Year DividendROE
i Excludes one-off financial penalty from global resolution & related costsii Includes special cash dividend of 5.0cts/share
i
ii
31
ROE & Dividend

32
Free Cash Flow
S$m FY 2020 FY 2019
Operating profit 8 877
Depreciation & other non-cash items 30 117
Provisions made for stocks, contract assets and doubtful debts 701 39
Working capital changes (107) (1,476)
Interest & tax paid (430) (382)
Net cash from/(used in) operating activities 202 (825)
Investments & capex (451) (338)
Divestments & dividend income 687 413
Advances to/from associated companies 59 97
Net cash from investing activities 295 172
Cash inflow/(outflow) 497 (653)
Free cash flow excludes expansionary acquisitions and capex, and major divestments.

33
Questions & Answers

34
Additional Information
35
Divestments Announced As Part Of 100-day Plan
No Asset MonetisationAnnounced >S$1.2b of divestments
Aggregate Consideration (S$m)
1 Taicang Xuchang Property 104.0
2 Business Online Public Company 36.0
3 Chengdu Hilltop Development 250.4
4 30% stake in Dong Nai Waterfront City 115.9
5 Keppel Bay Tower 601.0
6 75 King William St 131.1
TOTAL 1,238.4

Vision 2030 Segments & Income StreamsEnergy & Environment Urban Development Connectivity Asset Management
Recurring Income
• Repairs & conversions • Keppel O&M associates in
charter business • Keppel Infrastructure (KI)
Operations & Maintenance• Keppel Renewable Energy• KrisEnergy
• Rental income from investment properties
• Hospitality
• M1 • Data Centres (DCs)• Logistics
• Keppel Capital• Share of profit from KREIT,
KDCREIT and ADCF, dividend income from KIT
• Investment income from Alpha Funds
Project based/Profit from recycling
• New Builds • KI EPC• Keppel Prince Engineering• Divestment of assets
• Property trading (incl. en-bloc sales)
• Keppel Urban Solutions• Sino-Singapore Tianjin
Eco-City• Divestment of Investment
Properties
• Divestment of DCs & Logistics assets
• Divestment gain on REITs
Revaluation
• Fair value on investments • Fair value on Investment Properties
• Fair value on investments
• Fair value on DCs• Fair value on investments
• Fair value on Investment Properties held by REITs
• Dilution gain on REITs• Fair value on investments
Others (incl. impairment)
• E.g. One-off gain on M1 (incl. amortisation of intangibles arising from M1 acquisition)
• E.g. Gain from reclassification of KIT
36

• 41% of total revenue came from overseas customers
Revenue by Geography
FY 2020 Total(S$m)
Overseas Customers(%)
Singapore Customers
(%)
Energy & Environment 3,943 39 61
Urban Development 1,275 86 14
Connectivity 1,220 2 98
Asset Management 135 12 88
Subtotal 6,573 41 59
Corporate & Others 1 86 14
Total 6,574 41 59
37

38
EBITDA by Segment
S$m FY 2020 % FY 2019 % % Change
Energy & Environment (671) (159) 268 21 n.m.f.
Urban Development 645 153 545 44 18
Connectivity 259 61 385 31 (33)
Asset Management 276 66 123 10 124
Subtotal 509 121 1,321 106 (61)
Corporate & Others (87) (21) (69) (6) 26
Total 422 100 1,252 100 (66)
n.m.f. denotes No Meaningful Figure

39
Capital/Gearing/ROE
S$m 31 Dec 2020 31 Dec 2019
Shareholders’ Funds 10,728 11,211
Total Equity 11,156 11,646
Net Debt 10,123 9,874
Net Gearing Ratio 0.91x 0.85x
ROE (4.6%) 6.3%
i Net debt and net gearing ratio included lease liabilities
i
i
40
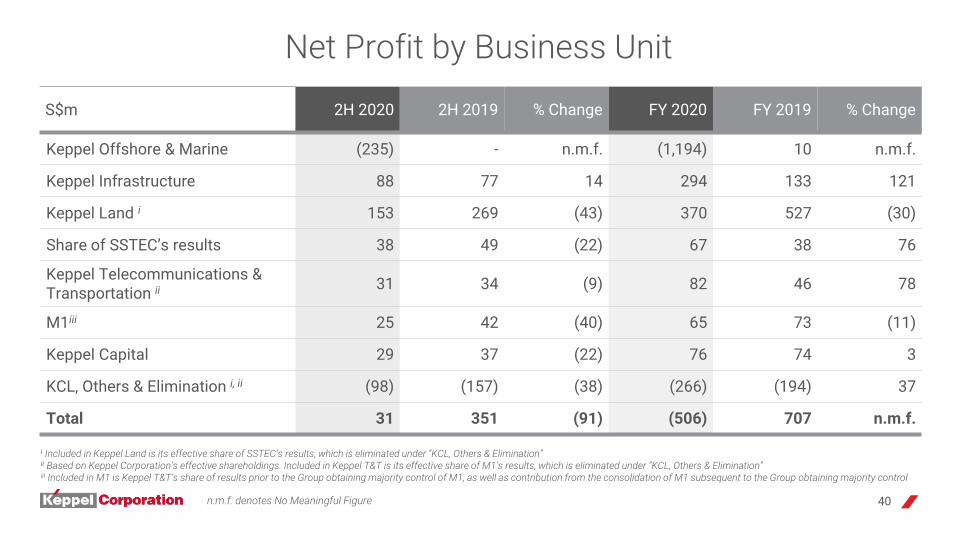
Net Profit by Business Unit
S$m 2H 2020 2H 2019 % Change FY 2020 FY 2019 % Change
Keppel Offshore & Marine (235) - n.m.f. (1,194) 10 n.m.f.
Keppel Infrastructure 88 77 14 294 133 121
Keppel Land i 153 269 (43) 370 527 (30)
Share of SSTEC’s results 38 49 (22) 67 38 76
Keppel Telecommunications & Transportation ii 31 34 (9) 82 46 78
M1iii 25 42 (40) 65 73 (11)
Keppel Capital 29 37 (22) 76 74 3
KCL, Others & Elimination i, ii (98) (157) (38) (266) (194) 37
Total 31 351 (91) (506) 707 n.m.f.
i Included in Keppel Land is its effective share of SSTEC’s results, which is eliminated under “KCL, Others & Elimination”ii Based on Keppel Corporation’s effective shareholdings. Included in Keppel T&T is its effective share of M1’s results, which is eliminated under “KCL, Others & Elimination”iii Included in M1 is Keppel T&T’s share of results prior to the Group obtaining majority control of M1, as well as contribution from the consolidation of M1 subsequent to the Group obtaining majority control
n.m.f. denotes No Meaningful Figure

41
Net Profit by Business Unit
S$mKeppel
Offshore & Marine
Keppel Infrastructure Keppel Land Keppel
T&T M1 Keppel Capital
KCL, SSTEC, Others &
Elimination
Net Profit by BU (1,194) 294 370 82 65 76 (199)
• Share of SSTEC’s results - - 67 - - - (67)
• REITs & Trust - (150) 39 (73) - 193 (9)
• Private Funds - - (3) (1) - 1 3
• Others & Elimination (131) (35) (60) 10 216
Net Profit by Segment (1,181) 438 13 280 (56)
Energy & Environment
Urban Development Connectivity Asset
ManagementCorporate &
Others

42
Energy & Environment

43
Financial Highlights – Energy & Environment
S$m 2H 2020 2H 2019 % Change FY 2020 FY 2019 % Change
Revenue 1,919 2,818 (32) 3,943 4,969 (21)
EBITDA (114) 173 n.m.f. (671) 268 n.m.f.
Operating (Loss)/Profit (189) 92 n.m.f. (822) 116 n.m.f.
Loss Before Tax (309) (54) 472 (1,251) (121) >500
Net Loss (223) (31) >500 (1,181) (101) >500
n.m.f. denotes No Meaningful Figure

44
Keppel O&M’s Operational Review
• Secured ~S$1.0b of new orders in FY 2020:
• A wind turbine installation vessel, fabricationof leg component for an offshore wind turbine installation vessel, 3 FPSO topside fabrication & integration, an FSRU conversion, and a trailing suction hopper dredger
• Project deliveries in FY 2020:
• 2 jackup rig, 1 dual-fuel bunker tanker, an FPSO modification and upgrade project, an LNG carrier, a trailing suction hopper dredger and a production barge
1.0 0.2
0.2
0.2
0.1
0.2
2.4
1.7
0.7
1.0
End-2019 End-2020
Oil rigs FPSOsSpecialised vessels Gas solutionsRenewables
S$b
0
3.3
4.4
Net Orderbooki
i Excludes semis for Sete Brasil

45
Keppel O&M’s Orderbook S$m Contract Value
Gross Net ClientFor delivery in 2021
5 JUs/1 Semi*/3 FPSO Modules Fabrication & Integration*/1 FPSO Topside Integration*/2 FPSO Topside Fabrication & Integration/2 Dredgers/2 offshore wind farm substations/1 FSRU conversion/1 LNG Carrier/2 LNG Bunkering Vessels/2 LNG Containerships/1 FLNG Turret 4,169 416
Clearwater/Fecon/TS Offshore /Petrobras/Modec/*Name withheld /Ørsted/Van Oord/Stolt-Nielsen/ShturmanKoshelev/FueLNG/Pasha Hawaii/SOFEC
For delivery in 20225 JUs/2 FLNG Conversions/1 Dredger/Gas Scrubber and BWTs Retrofit*/Fabrication of leg component for an offshore wind turbine installation vessel*/1 FPSO Topside Fabrication & Integration* 3,959 1,743
Borr Drilling/Golar/Van Oord/*Name withheld
For delivery in 2023 onwards1 offshore HVDC converter station and an onshore converter station/1 Dredger/1Wind turbine installation vessel 1,304 1,118
TenneT Offshore GmbH/Manson Construction/Dominion Energy
Total i 9,432 3,277
i Excludes semis for Sete BrasilAs at end-2020

46
Urban Development

47
Financial Highlights - Urban Development
S$m 2H 2020 2H 2019 % Change FY 2020 FY 2019 % Change
Revenue 764 708 8 1,275 1,336 (5)
EBITDA 336 253 33 645 545 18
Operating Profit 314 236 33 605 507 19
Profit Before Tax 373 384 (3) 720 676 7
Net Profit 223 275 (19) 438 483 (9)

48
Sales Achieved - Overseas
Key Projects Location Units Sold in FY 2020
Sales Value inFY 2020
Latest Avg. Selling Price
China (RMB’m) (RMB’psm)City Park Chengdu 99 296 ~22,100Waterfront Residences
Wuxi330 1,188 ~24,000
Park Avenue Heights 437 892 ~17,300Seasons Residences 568 1,484 ~20,600China Chic Nanjing 306 1,207 ~31,300
Total 1,740 5,067
Vietnam (US$’m) (US$’psm)Celesta Rise HCMC 519 90 ~1,900
Indonesia (US$’m) (US$’psm)West Vista at Puri Jakarta 115 7 ~1,500
India (US$’m) (US$’psm)Provident Park Square Bangalore 82 6 ~840Urbania Township Mumbai 93 14 ~1,510
Total 175 20

* Remaining units for sale of Corals at Keppel Bay and Reflections at Keppel Bay includes 1 unit and 7 units committed to buyers under deferred payment schemes respectively.As of end-December 2020
49
Residential Landbank - Singapore
Stake Tenure Total GFA (sf)
Total Units
Units Launched
UnitsSold
RemainingUnits
For Sale
Remaining Area
For Sale (sf)
Launched Projects
The Garden Residences 60% 99-yr 462,561 613 613 568 45 52,771
Corals at Keppel Bay* 100% 99-yr 509,998 366 366 319 47 110,900
Reflections at Keppel Bay* 100% 99-yr 2,081,738 1,129 1,129 1,095 34 146,186
19 Nassim 100% 99-yr 99,629 101 25 2 99 93,780
Upcoming Projects
The Reef at King's Dock 39% 99-yr 344,448 429 - - 429 334,195
Keppel Bay Plot 6 100% 99-yr 226,044 86 - - 86 207,959
Total 3,724,418 2,724 2,133 1,984 740 945,791

As of end-December 2020 50
Residential Landbank - China
Location Stake Total GFA (sm)
Total Units
Units Launched
UnitsSold
RemainingUnits
For Sale
Remaining Area
For Sale (sm)
8 Park Avenue
Shanghai
99% 131,957 918 918 911 7 2,218 Seasons Residences 100% 125,552 1,185 1,185 1,143 42 5,147 Sheshan Riviera 99.4% 90,109 217 112 69 148 45,425 Upview 15.0% 168,770 1,566 - - 1,566 163,460 Hill Crest Villas
Chengdu100% 163,147 274 - - 274 149,908
Serenity Villas 100% 289,994 1,058 228 101 957 240,504 City Park 30% 94,102 772 772 772 - -Waterfront Residences
Wuxi100% 315,117 1,403 1,347 1,335 68 2,388
Park Avenue Heights 100% 171,000 1,281 1,281 1,113 168 17,759 Seasons Residences 100% 360,525 2,904 1,112 909 1,995 236,000 Serenity Villas
Tianjin
100% 81,391 340 340 290 50 18,870 Mixed-use Devt 100% 1,993,919 15,857 - - 15,857 1,693,787 Tianjin Eco-City 100% 462,744 4,152 4,152 4,152 - -Waterfront Residences 100% 63,251 341 341 340 1 348 Waterfront Residences II 100% 85,248 572 284 83 489 73,640 China Chic
Nanjing40% 190,036 1,589 1,589 1,586 3 357
Noblesse IX (formerly Xuanwu 3.8-ha25% 111,114 181 73 64 117 33,219
Mixed-use Devt)Hill Crest Residences Kunming 68.8% 48,819 263 166 132 131 24,758
Total 4,946,795 34,873 13,900 13,000 21,873 2,707,788

As of end-December 2020 51
Residential Landbank - Other Overseas
Location Stake Total GFA (sm)
Total Units
Units Launched
UnitsSold
RemainingUnits
For Sale
Remaining Area
For Sale (sm)Vietnam
Saigon Sports City
HCMC
100% 780,878 4,261 - - 4,261 453,768Palm City 42% 492,471 3,043 1,587 1,529 1,514 151,087Empire City 40% 661,372 2,777 1,396 1,361 1,416 156,528Riviera Point 75% 430,163 2,421 1,889 1,851 570 61,839Celesta 60% 258,919 2,342 519 519 1,823 163,543Dong Nai Waterfront City Dong Nai 30% 1,125,236 6,536 - - 6,536 838,893
3,749,039 21,380 5,391 5,260 16,120 1,825,658Indonesia
West Vista at Puri
Jakarta
100% 153,464 2,855 1,404 542 2,313 96,108Daan Mogot 100% 275,266 4,523 - - 4,523 226,800The Riviera at Puri 50% 73,984 510 510 494 16 3,520BCA Site 100% 61,458 451 - - 451 49,167Wisteria 50% 69,962 557 205 165 392 40,854
634,134 8,896 2,119 1,201 7,695 416,449India
Provident Park Square Bangalore 51% 167,517 2,082 1,652 1,112 970 80,975Urbania Township Mumbai 49% 659,653 7,100 414 93 7,007 632,478
827,170 9,182 2,066 1,205 7,977 713,453Total 5,210,343 39,458 9,576 7,666 31,792 2,955,560

52
Residential Launch Readiness – China
Project LocationUnits Ready to Launch
2021 2022 20238 Park Avenue
Shanghai7 - -
Seasons Residences 42 - -Sheshan Riviera 21 22 -Serenity Villas Chengdu 187 180 179Waterfront Residences
Wuxi12 56 -
Park Avenue Heights 168 - -Seasons Residences 1,064 931 -Serenity Villas
Tianjin29 21 -
Waterfront Residences 1 - -Waterfront Residences II 221 84 92China Chic
Nanjing3 - -
Noblesse IX (formerly Xuanwu 3.8-ha Mixed-use Devt) 117 - -
Hill Crest Residences Kunming - 82 49Total 1,872 1,376 320

53
Residential Launch Readiness – Other Overseas
^ Riviera Point and Celesta are in District 7 and Nha Be District, respectively. The other projects in HCMC are in District 2.
Project Location Units Ready to Launch2021 2022 2023
VietnamSaigon Sports City
HCMC
Velona 714 360 117 Natura - 768 384 Lumina - - 444
Riviera Point ^The Infiniti 38 - -
Palm CityPalm Garden 58 - -Palm Spring - 487 -
Empire CityCove Residences 1 - -Narra Residences 34 - -Empire City (Subsequent phases) 481 635 142
CelestaCelesta Rise 404 - -Celesta Heights 638 160 -Celesta Gold - 497 124
IndonesiaWest Vista at Puri
Jakarta
247 350 265 The Riviera at Puri 16 - -BCA Site 300 151 -Wisteria 392 - -
IndiaProvident Park Square Bangalore 376 594 -Urbania Township Mumbai 407 317 794
Total 4,106 4,319 2,270

54
Expected Completion for Launched Projects Projects/Phases Launched Location Total
UnitsUnits Launched as at end-Dec 2020
Units Sold as at end-Dec 2020
Units Remaining as at end-Dec 2020 Expected Completion
ChinaSeasons Residences (Ph 3B) Tianjin 346 346 346 - 1H2021 Waterfront Residences II 572 284 83 489 1H2022 Waterfront Residences (Ph 6)
Wuxi
468 468 462 6 1H2021 Seasons Residences (Ph 2) 584 584 564 20 1H2021 Seasons Residences (Ph 3) 348 348 193 155 2H2021 Park Avenue Heights (Ph 3B) 232 232 231 1 2H2021 Park Avenue Heights (Ph 4) 373 373 206 167 1H2022 City Park Chengdu 772 772 772 - 1H2021 Serenity Villas (Ph 2) 144 144 22 122 1H2021 China Chic (Ph 2)
Nanjing
591 591 591 - 2H2021 China Chic (Ph 3) 704 704 702 2 2H2022 Noblesse IX (Ph 1) (formerly Xuanwu
3.8-ha Mixed-use Devt) 71 31 26 45 1H2022
Noblesse IX (Ph 2) (formerly Xuanwu 3.8-ha Mixed-use Devt) 110 42 38 72 2H2022
VietnamLinden Residences
HCMC
510 510 510 - 1H2021 Tilia Residences 472 472 472 - 2H2021 Cove Residences 136 136 135 1 2H2021 Narra Residences 278 278 244 34 1H2023 The Infiniti 822 822 784 38 2H2023 Palm Garden 636 636 578 58 1H2024 Celesta Rise 923 519 519 404 1H2023
IndonesiaThe Riviera at Puri (Ph 3) Jakarta 164 164 155 9 2H2021 Wisteria (Ph 1) 205 205 165 40 2H2021
IndiaProvident Park Square Bangalore 2,082 1,652 1,112 970 1H2022 Urbania Township (Azziano D & L) Mumbai 264 264 37 227 1H2024
Total 11,807 10,577 8,947 2,860
55
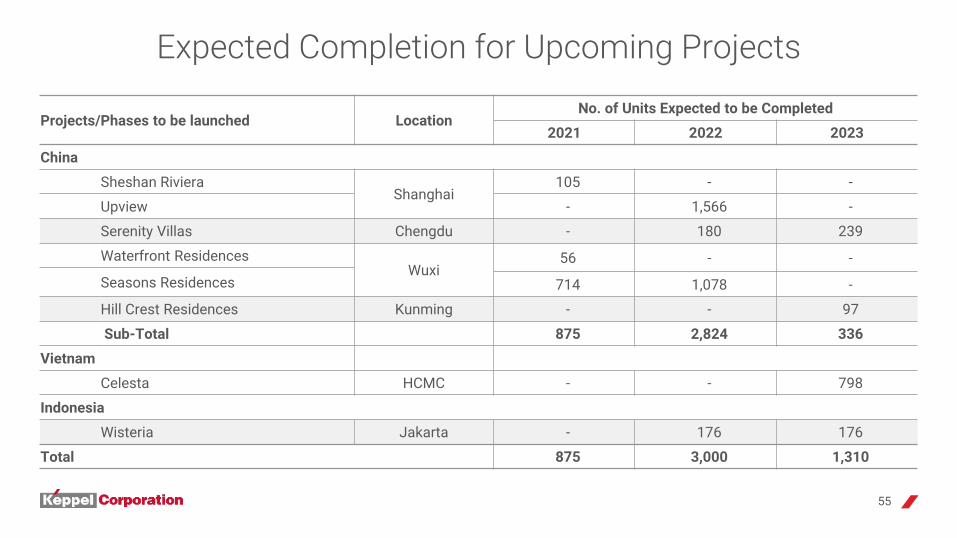
Expected Completion for Upcoming Projects
Projects/Phases to be launched LocationNo. of Units Expected to be Completed
2021 2022 2023
China
Sheshan RivieraShanghai
105 - -
Upview - 1,566 -
Serenity Villas Chengdu - 180 239
Waterfront ResidencesWuxi
56 - -
Seasons Residences 714 1,078 -
Hill Crest Residences Kunming - - 97
Sub-Total 875 2,824 336
Vietnam
Celesta HCMC - - 798
Indonesia
Wisteria Jakarta - 176 176
Total 875 3,000 1,310

TBC: To be confirmed^ Excluding land cost * Investment cost for 40% stake
Commercial Projects - Under Development
56
Projects under Development Location Stake GFA (sm) Development Cost ^ Expected Completion
SingaporeKeppel Towers Singapore 100% 59,200 TBC 2024
ChinaPark Avenue Central Shanghai 99% 113,220 RMB 3.8b 2023Seasons City Tianjin 100% 162,450 RMB 2.6b 2021
Vietnam
Empire City HCMC 40%
86,400 (Office)
US$705m 2026106,000 (Retail) 35,000 (Hotel)
25,000 (Service Apt) Indonesia
IFC Jakarta Tower 1 Jakarta 100% 92,500 TBC TBC India
KPDL Grade-A Office Tower Bangalore 51% 116,800 S$212m 2025Myanmar
Junction City Ph 2 Yangon 40% 50,000 US$48.6m * 2023

* I12 Katong is closed for AEI with effect from 1 Mar 2020. ** Renovation completed in 2018. As at end-December 2020
57
Commercial Projects - CompletedKey Completed Projects Location Stake GFA (sm) Net Lettable Area (sm) CompletionSingapore
Keppel Bay Tower Singapore 100% 41,910 35,920 2002I12 Katong 100% 26,210 19,640 2011 *
ChinaTrinity Tower
Shanghai
30% 70,000 48,600 2015International Bund Gateway
(formerly North Bund Plaza) 29.8% 74,340 62,900 2018
K Plaza 99.4% 40,900 30,510 2016 **The Kube 100% 14,520 10,890 2004Linglong Tiandi Tower D Beijing 100% 12,620 10,640 2012Shangdi Neo 100% 4,240 4,240 2003Westmin Plaza Guangzhou 30% 42,520 34,990 2008
VietnamSaigon Centre Ph 1
HCMC
61.3% 17,200 (Office) 11,680 (Office) 1996
Saigon Centre Ph 2 61.3% 55,000 (Retail) 37,600 (Retail) 2016 (Retail)44,000 (Office) 34,000 (Office) 2017 (Office)
Estella Place 98% 37,000 (Retail) 25,480 (Retail) 2018Indonesia
IFC Jakarta Tower 2 Jakarta 100% 61,300 50,200 2016Myanmar
Junction City Tower Yangon 40% 53,100 33,400 2017Philippines
SM-KL Project Manila 27.4% 80,000 (Retail) 46,600 (Retail) 2017 (Retail)119,000 (Office) 89,300 (Office) 2019 (Office)
UK75 King William Street London 100% 11,900 11,700 1989 **

Plot Date Sales Value(RMB’m)
Land Area(Hectare) Plot Ratio GFA
(sm)
Selling Price
Based on Land Area
(RMB’m/hectare)
Based on GFA(RMB/sm)
Plot 18b Oct 2020 669 7.22 1.11 79,700 93 8,400Plot 36 Apr 2020 1,174 10.86 1.6 167,400 108 7,000Plot 30c Sep 2019 438 2.77 3.1 84,500 158 5,200Plot 34 Aug 2019 1,017 9.21 1.6 141,800 110 7,200Plot 20b Dec 2018 1,070 10.97 0.8 87,800 98 12,200Plot 31 Sep 2018 1,460 8.77 2.5 219,100 166 6,700Plot 26 Aug 2018 835 7.94 1.1 79,500 105 10,500Plot 57b
Jan 2017 1,317 8.73
1.196,000 151 13,700
Plot 57c (1) 1,761 11.63 127,900 151 13,800Plot 57c (2) 1,906 12.47 137,100 153 13,900Plot 32
Jul 2016380 3.71 1.3 46,000 102 8,300
Plot 41 1,222 8.52 1.8 153,400 143 8,000
Plot 25 Jan 2016 257 9.61 1.1 99,900 27 2,600
Source: Tianjin Municipal Bureau of Land Resources and Housing Administration http://gtzyfwgl.tj.gov.cn/ 58
Residential Land Sales at Tianjin Eco-City

59
Connectivity

60
Financial Highlights - Connectivity
S$m 2H 2020 2H 2019 % Change FY 2020 FY 2019 % Change
Revenue 633 665 (5) 1,220 1,128 8
EBITDA 127 143 (11) 259 385 (33)
Operating Profit 17 41 (59) 46 210 (78)
Profit Before Tax 16 35 (54) 29 196 (85)
Net Profit 13 18 (28) 13 136 (90)

542 506
166 186
36 27
392 355
FY 2019 FY 2020
Mobile services Fixed servicesInternational call services Equipment sales
1,0741,135
61
M1 Operational Highlights
Revenue Customers
1,535 1,611
573 238
222
228
End-2019 End-2020
Postpaid Prepaid Fibre broadband
2,077
2,329
S$m
0 0
‘000

62
Asset Management

63
Financial Highlights - Asset Management
S$m 2H 2020 2H 2019 % Change FY 2020 FY 2019 % Change
Revenue 75 73 3 135 145 (7)
EBITDA 48 70 (31) 276 123 124
Operating Profit 46 69 (33) 273 120 128
Profit Before Tax 34 123 (72) 304 239 27
Net Profit 22 109 (80) 280 214 31

64
Stakes in REITs/ Trust & Private Funds
Asset Classi Valueiii (S$m)
Real estate 2,222
Data centres 983
Infrastructure 529
Alternative assetsii 192
Total 3,926
i Comprises listed REITs/Trust and private funds.ii Includes senior living, education and logistics vehicles, as well as private credit fund.iii Represents market values of listed entities and carrying values of private funds and other investments as at 31 Dec 2020, or the latest available date.