29. well logging of the sediments and basement complex on the
TRANSCRIPT

29. WELL LOGGING OF THE SEDIMENTS AND BASEMENT COMPLEX ON THE WALVIS RIDGE1
Philip D. Rabinowitz, Department of Oceanography, Texas A&M University, College Station, Texasand
Peter E. Borella, Deep Sea Drilling Project, Scripps Institution of Oceanography, La Jolla, California
ABSTRACT
The results of two geophysical well logs obtained during Glomar Challenger Cruise 74 on the Walvis Ridge arepresented. A density log was obtained on the sediments at Site 527; a sonic log was obtained on the sediments and upper75 m of the basement complex at Site 528. Natural gamma ray and caliper traces accompanied each log. The sedimentsconsisted primarily of oozes and chalk, the latter increasing with depth. Varying amounts of volcanogenic sediments arepresent; they increase toward the bottom of the hole. The top of the basement complex is characterized by smoothacoustic reflectors on seismic profiles. The rocks recovered within the basement complex consisted of basalts with inter-layered sediments.
The correlation of the downhole well logs with the recovered sediments is excellent. The clayey areas, slumpdeposits, and breccias all give relatively high gamma ray and low density and sonic readings. Most of the interval be-tween the Cretaceous/Tertiary boundary and the basement complex is identified by relatively high gamma ray values,owing to the enriched amounts of clay and volcanogenic materials found there as compared to carbonate sections.
Within the basement complex, where the recovery is poorest, the sonic log enables us to reconstruct the hole. In theupper 75 m of the basement complex, approximately half the material is believed to be igneous and the other half sedi-mentary in origin. We recovered most of the basalts we drilled (88%) and much less of the sediments (32%). Oursonobuoy results indicate that the ratio of sediments to basalt increases with depth for a further 225 m, until trueoceanic basement with a typical oceanic velocity structure is observed. Paleontological results strongly suggest that theprocesses forming this upper 300 m of the basement complex of the Walvis Ridge were completed within a short time in-terval. Sound sources of greater energy than previously used in the Walvis Ridge area should enable us to profile thetrue oceanic basement here.
INTRODUCTION
During Leg 74, a suite of closely spaced holes wasdrilled at different water depths on the flank of the Wal-vis Ridge in the southeast Atlantic Ocean (Fig. 1). Sam-pling of sediments in close geographic proximity over awide range of water depths allows us to assume that arather uniform supply of carbonate material reached theseafloor at any given time and makes it possible to ad-dress several problems relating to the history of carbon-ate preservation and the timing and nature of changesin the bottom water circulation of the South AtlanticOcean. Further, the composition and origin of the rocksforming the Walvis Ridge and hence its evolution havenot been fully understood. The primary objectives ofthe Leg 74 cruise were to address the very fundamen-tal problems relating to the paleoenvironments of theSouth Atlantic Ocean during the late Mesozoic and Ce-nozoic and to the origin of the Walvis Ridge (Moore,Rabinowitz, et al., in press).
Of the five sites drilled in water depths ranging from- 1000 to 4000 m (Fig. 1, Table 1), three penetrated the"smooth" basement reflectors observed on seismic re-flection profiles of the area and recovered rocks that areimportant for our understanding of the evolution of theWalvis Ridge. We attempted in-hole logging experi-ments on two of the holes in which basement was pene-trated (Holes 527 and 528). Although we did not obtain
Moore, T. C, Jr., Rabinowitz, P. D., et al., Init. Repts. DSDP, 74: Washington (U.S.Govt. Printing Office).
complete suites of well logs for each of these holes, weobtained information significant enough to warrant dis-cussion. This included a density log in the sediments ofHole 527, although within the basement complex the log-ging did not penetrate deeply enough to enable us todraw useful conclusions, and a sonic log in both the sed-iments and basement complex of Hole 528.
The downhole logs could be relatively well correlatedwith the sediments recovered at Sites 527 and 528. With-in the basement complex the recovery was much poorerthan in the sediment column above, and major use ofthe downhole data here is to identify rock types whererecovery was poor. The well logs, when considered to-gether with the rocks recovered in the basement complexand the sonobuoy wide-angle reflection/refraction in-formation, give us important new information aboutthe composition of the upper part of the Walvis Ridge—that is, the part characterized by the smooth basementreflectors.
There are few published logging data for basaltic oce-anic basement. Kirkpatrick (1979 a, b) reported datafrom DSDP Hole 396 (Leg 46) for the upper 200 m of10 m.y. old ocean crust in the central Atlantic Ocean.Salisbury et al. (1980) presented geophysical loggingdata for the upper 366 m of early Aptian ocean crustfrom DSDP Hole 417D at the southern end of the Ber-muda Rise in the central Atlantic Ocean. The resultsfrom these two holes present comprehensive geophysicaldata on the in situ properties of the oceanic basement.Boyce (1981) discussed the basalt logs in a major Cre-taceous sill complex in a region of Jurassic ocean crust
827
Rock Type Age
100-
200-
300-
400^
500
Site 528Site 525
- 3
Ship Course Track
Glomar Challenger
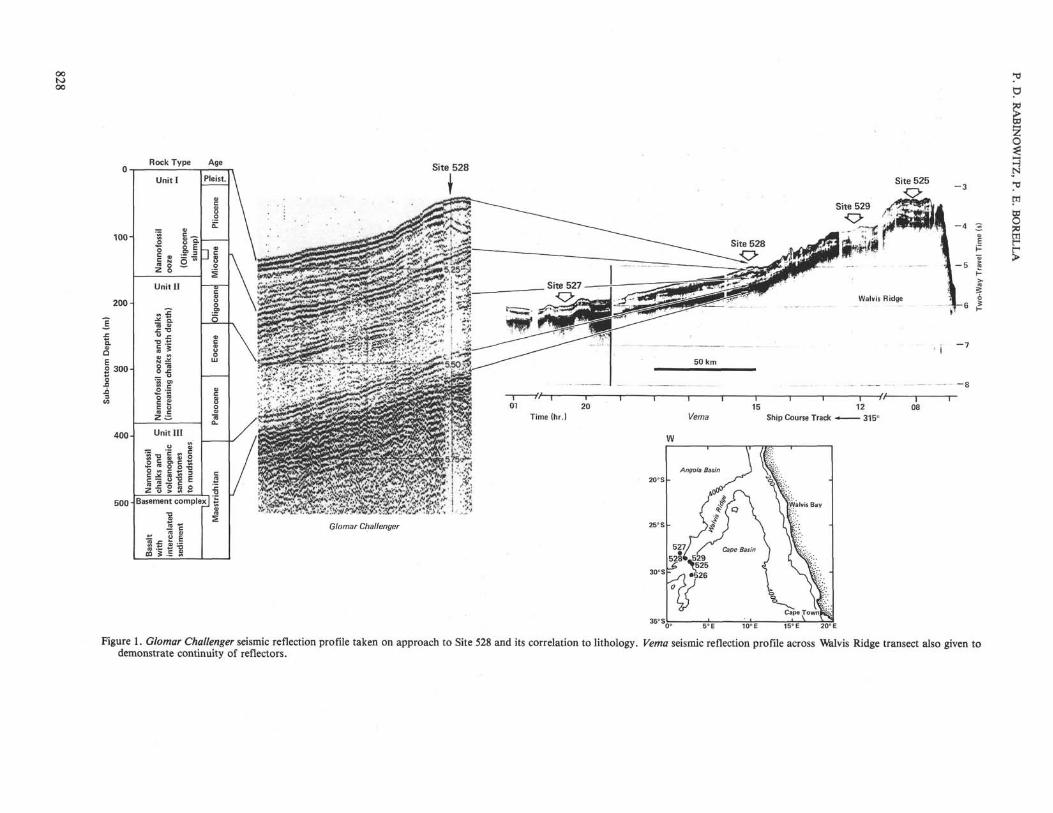
Figure 1. Glomar Challenger seismic reflection profile taken on approach to Site 528 and its correlation to lithology. Feme seismic reflection profile across Walvis Ridge transect alsodemonstrate continuity of reflectors.
given to
WELL LOGGING OF SEDIMENTS AND BASEMENT COMPLEX
Table 1. Leg 74 coring summary.
Hole
525525A525B526526A526B526C527528528A529
Latitude
29°04.24'S29°04.24'S29°04.24'S30°07.36'S30°07.36'S30°07.36'S30°07.36'S28°02.49'S28°31.49'S28°31.16'S28°5.83'S
Longitude
02°59.12'E02°59.12'E02°59.12'E03°08.28'E03°08.28'E03°08.28'EO3°O8.28'E01°45.80'E02°19.44'E02°18.97'E02°46.08'E
WaterDepth(m)
24672467246710541054105410544428380038153035
Penetration(m)
3.6678.1285.6
6.3228.828.3
356.0384.5555.0130.5417.0
in the Nauru Basin of the western Pacific Ocean. We be-lieve that the basement logging results presented in thischapter are the first published for an oceanic aseismicridge.
LOGGING METHODS
Accompanying the density log obtained at Site 527 and the soniclog at Site 528 were natural gamma ray and caliper trace. The instru-ments used were standard oilfield downhole logging tools with surfacerecording equipment. Gearhart-Owen provided the apparatus and anoperating engineer. A brief description of the tools used in Holes 527and 528 follows; the reader is referred to Schlumberger (1972a, b) andPirson (1963), among others, for a more comprehensive discussion ofthe logging tools and interpretations.
The density tool consists of a directional gamma ray source andtwo directional gamma ray detectors spaced along the tool at differentdistances from the source. The emitted gamma rays interact with theelectrons of matter around the borehole and the gamma ray detectorsrespond to the back-scattered rays. The intensity of the back-scatteredrays depends on the electron density of the matter penetrated; this inturn is related to the density of the surrounding rock. The tool investi-gates to a maximum depth of about 15 cm; however, most of the sig-nal comes from within about 7-8 cm of the formation.
The sonic velocity tool consists of two sets, each consisting of onetransducer and two receivers. The transit time of the elastic wave sig-nal is measured over approximately 0.6 m along the borehole wall.Thus, the measured velocities can be correct only for intervals thickerthan 0.6 m. The first arrival signals penetrate only a few centimetersinto the formation. The velocities obtained are thus greatly affectedby fractures, irregular porosity, or drilling damage. Accordingly, thevelocity obtained by the sonic tool is quite typically the minimumvelocity in that interval.
The natural gamma ray tool measures the total natural gamma rayemission of rocks from the formation. Nearly all of the radiation weencounter is the result of gamma rays produced by potassium 40 andthe decay daughter products in uranium and thorium series. Since thetool used on Leg 74 was nonspectral, no distinction can be made be-tween radiation arising from the decay of K40 and the elements of theuranium and thorium decay series. The distance investigated by thegamma ray log was —0.30 m in the sediments and —0.15 m in thebasalts.
The caliper tool measures the changes in diameter of the hole withdepth, simultaneously with the other measurements. The rugosity ofthe hole is obviously an important criterion to be considered in evalu-ating the logs. Another important test of the precision of the logs in-volves cross-plotting the different logged measurements (e.g., sonicversus density) and comparing the results with the laboratory data,but we did not obtain enough different logs from each hole to ac-complish this.
RELATIONSHIP OF LITHOLOGY AND AGE TOSEISMIC REFLECTION PROFILES
A single-channel analog seismic reflection profile col-lected aboard Vema, from Lamont-Doherty Geological
Observatory, across the Walvis Ridge transect is givenin Figure 1. The original site selections were made fromthis profile. Minor modifications in the site selectionswere made on the basis of the seismic data collected dur-ing a preliminary site survey by Thomas B. Davie of theUniversity of Capetown (Rabinowitz and Simpson, 1979,and this volume). Figure 1 also includes an enlargedportion of the seismic profile taken in the vicinity ofDSDP Site 528 by instruments aboard Glomar Chal-lenger while the ship was en route to the site, as well asthe lithology, age, and depth summary of the drilling re-sults at Site 528. The basal dark reflector (acoustic base-ment) observed along the entire profile is rather smooth,in comparison to oceanic basement normally associatedwith seafloor spreading processes (e.g., Ewing and Ew-ing, 1971). This reflector coincides with the top of thebasement complex and recovered basalts drilled at Sites525, 527, and 528, and its "smoothness" may be amanifestation of that complex, which consists of basaltwith intercalated sediments. The top of the prominentreflector observed at =0.06 s (two-way traveltime)above the basement reflector at Site 528 correspondswell to the top of Lithologic Unit III drilled there (veryclose to the Cretaceous/Tertiary boundary) and to thelithologic change from nannofossil oozes and chalks tonannofossil chalks and volcanogenic mudstones andsiltstones. This reflecting horizon is continuous fromSite 525 in the shallow part of the transect to the base ofthe transect at Site 527. In all four sites drilled on thisseismic line (Sites 525, 527, 528, and 529) this reflectorcorresponds well with rocks recovered near the Creta-ceous/Tertiary boundary. At 0.22 s (two-way travel-time) above basement, there is a reflector which corre-sponds well to the Eocene/Oligocene boundary and thelithologic change from oozes to oozes and chalks nearthe top of Unit II. At 0.33 s (two-way traveltime)above basement another prominent reflector near thebase of Unit I may relate to reworked material ofOligocene to Eocene age observed within the Miocene atSite 528.
THE SEDIMENT COLUMNThe sediment recovered at Sites 527 and 528 consists
of oozes for the top 110 m below the seafloor, fol-lowed by alternating beds of oozes and chalks; theamounts of chalks increase with depth. There are vary-ing amounts of volcanogenic sediments, which also in-crease toward the bottom of the holes. The sedimentsare cyclic in nature; cycles are small-scale (10-100 cm),probably of slump and turbidite origin, and appearmore dominant toward the bottom of the hole. Oxida-tion/reduction and dissolution cycles are also observed(Borella, this volume).
The density log obtained at Site 527 is given in Figure2; the sonic log obtained at Site 528 is given in Figure 3.Associated with each figure is a gamma ray calipertrace. Also included are plots of the laboratory-deter-mined wet-bulk densities and sonic velocities. Thesedensities are for the most part less than the densities ob-served on the logging record, primarily because of theeffect of overburden pressure (Hamilton, 1965, 1976).Laboratory-determined sonic velocities are also general-
829
P. D. RABINOWITZ, P. E. BORELLA
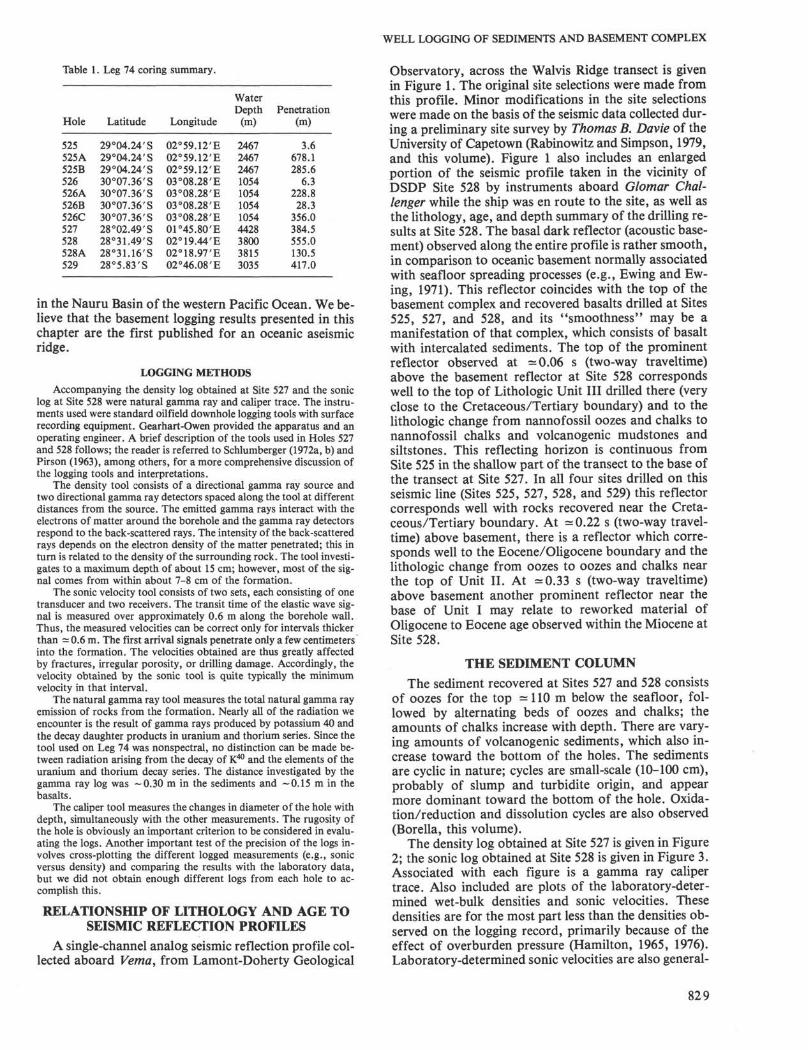
Figure 2. Density log at Site 527. Key to symbols (right graph): = P(B) bulkdensity (1.5-2.5 g/cm3); = <£(CDL) compensated density log; =ΔP correction factor for mudcake density and hole rugosity; o = laboratory-deter-mined wet-bulk density. Key to symbols fleft graph): = GR (gamma raylog); = caliper trace (9-18 in.).
830

WELL LOGGING OF SEDIMENTS AND BASEMENT COMPLEX
ly less than those determined from the downhole logs(Boyce, 1980), though in some parts of the hole they aregreater. In these instances, hole washout, observed fromthe caliper traces, explains the discrepancy. At Site 528,the sediment part of the hole above basement was forlarge portions unstable, thus creating difficulties in in-terpreting the sonic log.
Site 527 Sediment LogThe correlation of the density and the gamma ray
logs with the recovered sediment is excellent at Site 527.An increase in density with depth (=1.85 to 2.00 g/cm3) is consistent with the increase in the chalk/ooze ra-tio with depth. From 104-118 m and 131-140 m sub-bottom, there are large increases in the gamma ray logand large negative spikes in the density log (Fig. 2) thatcorrespond to recovered pelagic clay layers. The CaCO3content in these layers is less than 20%, compared withover 90% above and below. These two clay units weredeposited between middle Eocene and late Miocenetime, when sedimentation rates ranged from close tozero to 0.16 cm/103 y. Cyclic sedimentation patternsrepeat about every 1 m, with gradational contacts be-tween the cycles. There is no significant change in grainsize between the clay layers and the ooze and chalks(Borella, this volume). Hiatuses are recognized betweenthe early Oligocene and middle Miocene and betweenthe late Miocene and early Pliocene (see site reports, thisvolume). The clay layers probably represent dissolutioncycles. Site 527, the deepest site in the transect, wasprobably at or close to a fluctuating CCD during thetime intervals of deposition of the clay layers.
At =168 and 182 m sub-bottom, negative densityspikes are again observed. The cores show a decrease incarbonates and an increase in silt-sized material (Borel-la, this volume). Distinct color changes can also be ob-served at these intervals. There is no increase in the gam-ma ray log to correspond with the density decrease. Thecoarser-grained sediment in these layers may not be ra-diogenic. The negative spike at 182 m (an area of poorrecovery) is located just above the Paleocene/Eoceneboundary. Both of the negative spike areas are locatedin alternating cycles of ooze and chalk which repeatevery 10-50 cm.
Positive density and gamma ray spikes are observedat 202 m and 240 m sub-bottom. They correlate witha red clay and a dark brown layer, respectively. Car-bonate content in the red clay layer is - 1% and in thedark brown layer =58% (see site reports, this volume).The increased density is attributed to a higher degree ofcompaction.
A large negative density spike and positive gammaray spike are observed just above the Cretaceous/Ter-tiary boundary. Carbonate content within this interval(274-380 m sub-bottom) is very low (< 15%). Colors al-ternate with red and dark brown beds dominant. The al-ternating colored cycles and sediments are interpreted torepresent oxidation/reduction cycles superimposed onepisodic submarine movements (Borella, this volume) orslumps. The recovered sediments are brecciated. Sincesimilar sedimentary sequences are found above the Cre-
taceous/Tertiary boundary at three other sites along ourtransect, we believe that the breccias and the cyclic sedi-ments are indicative of the geological environment atthis time.
A significant increase in the gamma ray record fromthe interval immediately above the Cretaceous/Tertiaryboundary to the contact with the basement (341.5 msub-bottom) is attributed to the increased amount ofclays and volcanogenic and shallow-water sedimentswhich were transported to the deposition site, either byturbidity currents or slumps. A large positive spike inthe gamma ray log at 308 m sub-bottom correlates withan ash layer overlying a nannofossil mudstone layer.Evidence of current activity is preserved in the sedi-ments in the form of parallel and cross laminations,graded bedding, and displaced shallow-water sediments.The positive spike in the density log at 327.6 m sub-bot-tom corresponds to a distinct color change in the sedi-ment. The sediments below have a lower carbonate con-tent than the beds immediately above.
Site 528 Sediment LogThe irregularity of the sonic velocity log record with-
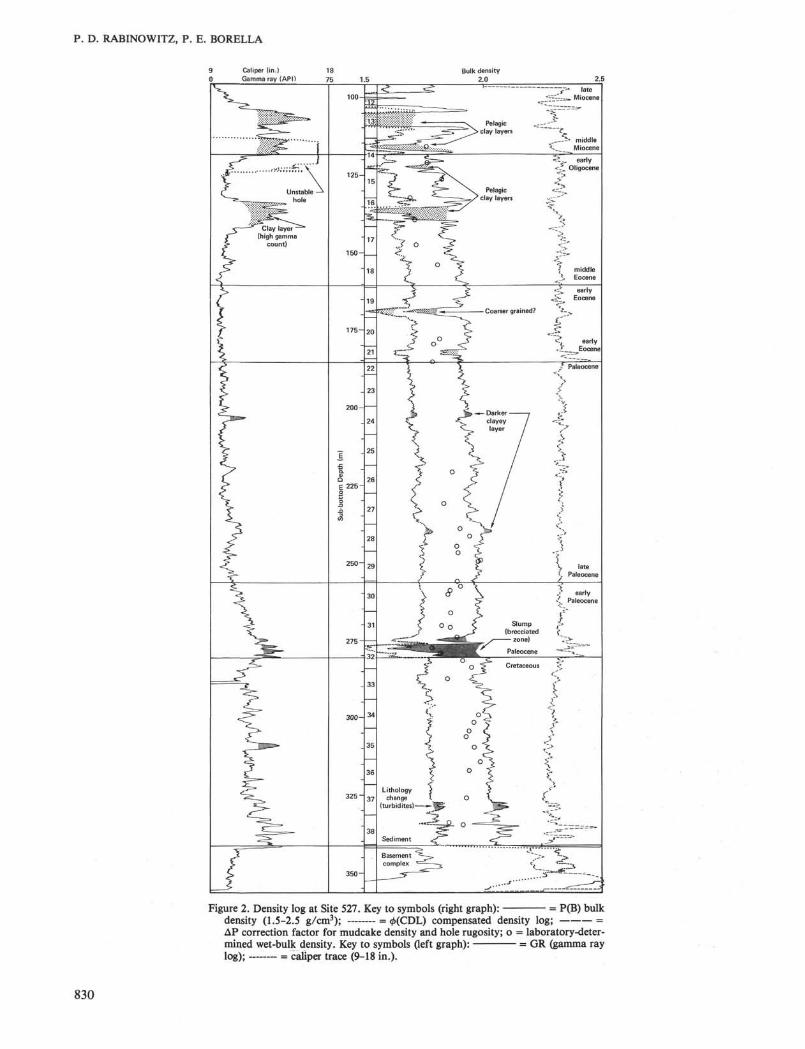
in the sediments is a reflection of the poor hole condi-tions (see caliper trace, Fig. 3). However, in areas wherethe caliper indicates a narrow hole diameter several ob-servations and correlations can be made.
In the upper 170 m of the hole, the velocities arenearly constant (1.80 km/s) and consistently above thesonic velocities measured in the laboratory. Then veloci-ties gradually increase to the maximum value found inthe sediments at =370 m (2.37 km/s).
An increase in the gamma ray log record indicateshigher clay content just above the Cretaceous/Tertiaryboundary, as do the observations at Site 527. This issupported by low carbonate values within this interval(see site reports, this volume). Red clayey beds alter-nating with light gray pelagic intervals are commonlyobserved in this interval. The sonic velocity recordshows a decrease in velocities. The sediments here, likethose at Site 527, are brecciated and are interpreted tobe slump or turbidite deposits.
From below the Cretaceous/Tertiary boundary (407 m)to the contact with the basement complex, the gammaray log shows a similar increase to that observed in Hole527. The sedimentary sequence consists of alternatingbeds of slump deposits and pelagic oozes with highamounts of volcaniclastic sediments. Greenish-coloredturbidites and slump deposits alternate with lighter-colored pelagic oozes.
THE BASEMENT COMPLEXThe top of the basement complex was first encoun-
tered in Hole 528 at 474 m sub-bottom (core 39; 4274 mbelow sea level) and consisted of massive Plagioclasephyric basaltic rocks. After 15 m of basalt recovery,we encountered sediment units intercalated between ba-saltic rock units. These sequences of alternating basalticrocks and sedimentary units were observed for the entire80 m that the basement complex was cored. The basaltswere all subophitic in texture. They consisted of units of
831
P. D. RABINOWITZ, P. E. BORELLA
Caliper (in.) 18Gamma ray (API) 50
Sonic velocity (km/s)
8 1.1 1.25 1.43 1.69 2.0 2.5 3.3 5.0 10.0
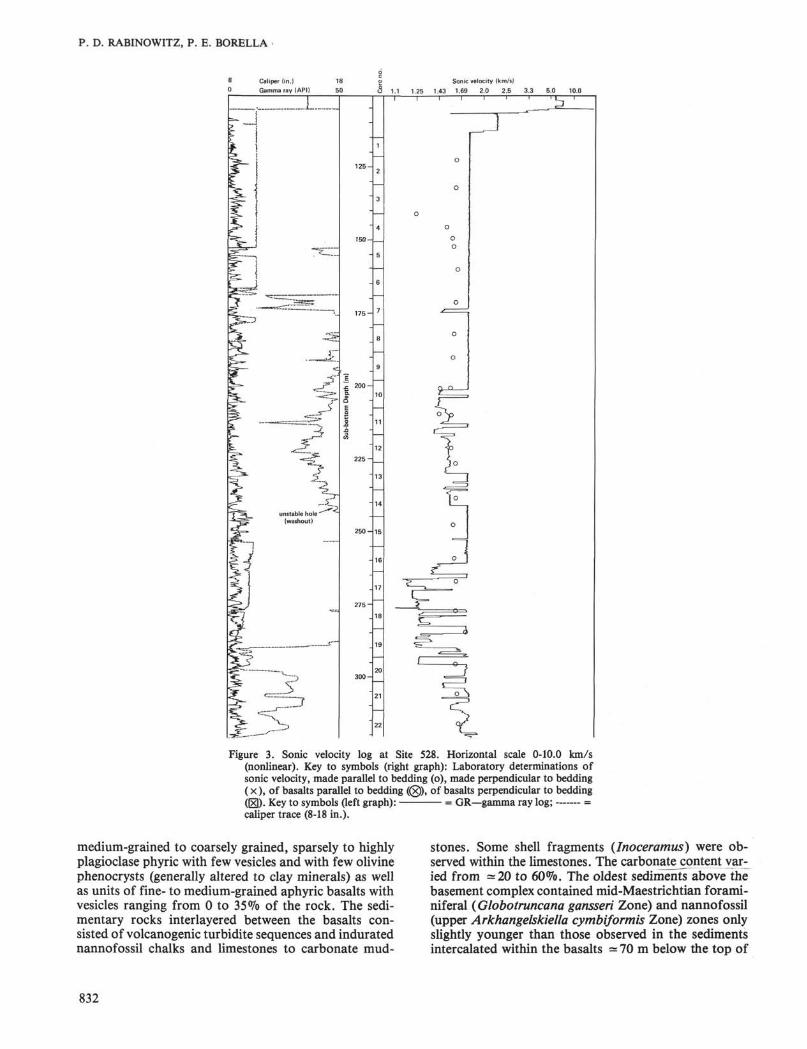
Figure 3. Sonic velocity log at Site 528. Horizontal scale 0-10.0 km/s(nonlinear). Key to symbols (right graph): Laboratory determinations ofsonic velocity, made parallel to bedding (o), made perpendicular to bedding(×), of basalts parallel to bedding ((×)), of basalts perpendicular to bedding(0). Key to symbols (left graph): = GR—gamma ray log; =caliper trace (8-18 in.).
medium-grained to coarsely grained, sparsely to highlyPlagioclase phyric with few vesicles and with few olivinephenocrysts (generally altered to clay minerals) as wellas units of fine- to medium-grained aphyric basalts withvesicles ranging from 0 to 35% of the rock. The sedi-mentary rocks interlayered between the basalts con-sisted of volcanogenic turbidite sequences and induratednannofossil chalks and limestones to carbonate mud-
stones. Some shell fragments (Inoceramus) were ob-served within the limestones. The carbonatejgontent var-ied from - 20 to 60%. The oldest sediments above thebasement complex contained mid-Maestrichtian forami-niferal (Globotruncana gansseri Zone) and nannofossil(upper Arkhangelskiella cymbiformis Zone) zones onlyslightly younger than those observed in the sedimentsintercalated within the basalts 70 m below the top of
832

WELL LOGGING OF SEDIMENTS AND BASEMENT COMPLEX
1.1 1.25 1.43 1.69 2.0 2.5 3.3 5.0 10.0
Figure 3. (Continued).
the basement complex (G. tricarinata Zone and low-er A. cymbiformis Zone, respectively). We recovered= 34 m of basaltic rocks and 11.6 m of sedimentaryrocks, for a total of = 45.6 m of the 80.0 m cored withinthe basement complex (57% recovery rate). We believethat the sonic logging accomplished within the basementcomplex here allows us to reconstruct the hole accu-rately.
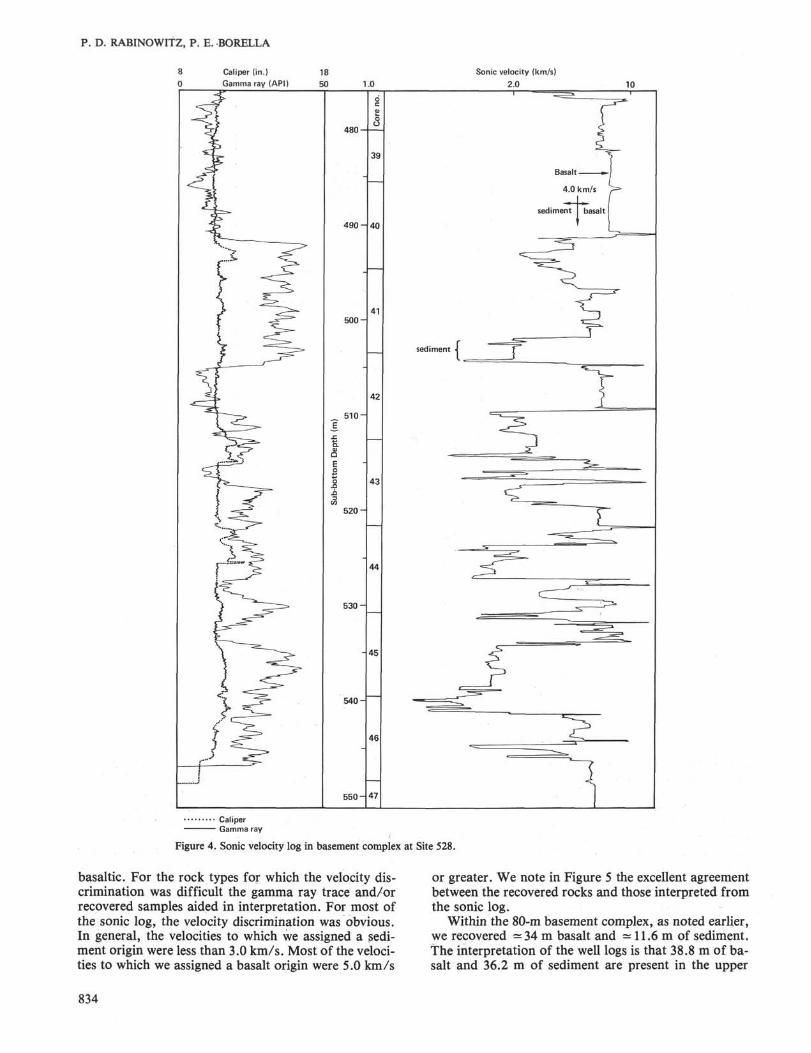
The sonic log within the basement complex is shownin Figure 4. The caliper trace indicates that within thebasement complex the hole was reasonably uniform inwidth and without major washouts. In general, there isa very good correlation between recorded high sonicvelocities, low gamma ray activity, and basalt recovery
and between recorded low sonic velocities, high gammaray activity, and sediment recovery. Though a quantita-tive interpretation will not be given here, we believe thatthe interval of high gamma ray activity corresponds tothe high potassium content of the sedimentary rockswithin the basement complex.
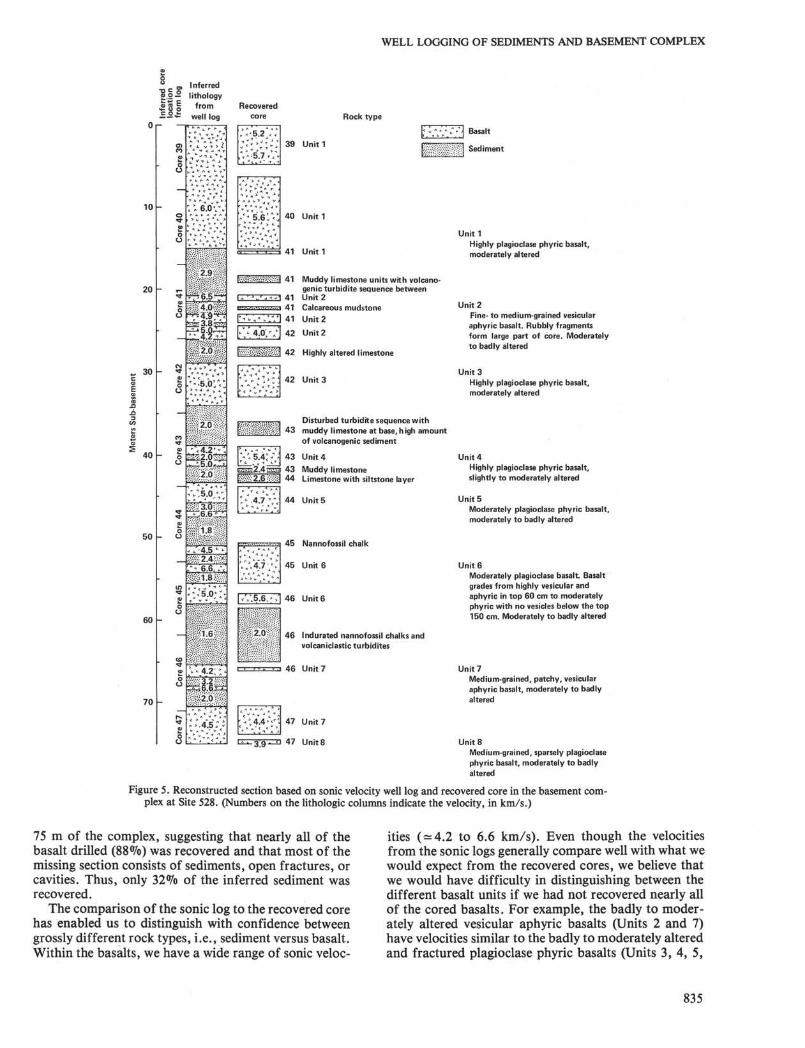
We show in Figure 5 what we believe to be our bestinterpretation of the sonic log. Next to the reconstructedsection we show the actual recovery and rock type. Son-ic velocities from the well log and from the shipboardphysical properties measurements are also included. Inreconstructing the hole, we assume, in most cases, thatvelocities of less than 4.0 km/s are of sedimentary ori-gin. Velocities > 4.0 km/s are generally assumed to be
833
P. D. RABINOWITZ, P. E. BORELLA
Sonic velocity (km/s)2.0
Figure 4. Sonic velocity log in basement complex at Site 528.
basaltic. For the rock types for which the velocity dis-crimination was difficult the gamma ray trace and/orrecovered samples aided in interpretation. For most ofthe sonic log, the velocity discrimination was obvious.In general, the velocities to which we assigned a sedi-ment origin were less than 3.0 km/s. Most of the veloci-ties to which we assigned a basalt origin were 5.0 km/s
or greater. We note in Figure 5 the excellent agreementbetween the recovered rocks and those interpreted fromthe sonic log.
Within the 80-m basement complex, as noted earlier,we recovered 34 m basalt and 11.6 m of sediment.The interpretation of the well logs is that 38.8 m of ba-salt and 36.2 m of sediment are present in the upper
834
WELL LOGGING OF SEDIMENTS AND BASEMENT COMPLEX
° c σ> Inferred£.2— lithologyJ> g | from-•S>t well log
10
20
„ 30
40
50
60
70
6.0 \\
.5.0:
.5.0
3J5
?1.6v
•5.2
5.7
.4.7
'
Rock type
39 Uniti
40 Uniti
41 Unit 1
41 Muddy limestone units with volcano-genie turbidite sequence between
41 Unit 241 Calcareous mudstone
41 Unit 2
42 Unit 2
42 Highly altered limestone
42 Unit 3
Disturbed turbidite sequence with43 muddy limestone at base,high amount
of volcanogenic sediment
43 Unit 4
43 Muddy limestone44 Limestone with siltstone layer
44 Unit 5
45 Nannofossil chalk
45 Unit6
46 Indurated nannofossil chalks andvolcaniclastic turbidites
46 Unit 7
47 Unit 7
47 Unitδ
U n i t iHighly Plagioclase phyric basalt,moderately altered
Unit 2Fine- to medium-grained vesicularaphyric basalt. Rubbly fragmentsform large part of core. Moderatelyto badly altered
Unit 3Highly Plagioclase phyric basalt,moderately altered
Unit 4Highly Plagioclase phyric basalt,slightly to moderately altered
Unit 5Moderately Plagioclase phyric basalt,moderately to badly altered
UnitβModerately Plagioclase basalt Basaltgrades from highly vesicular andaphyric in top 60 cm to moderatelyphyric with no vesicles below the top150 cm. Moderately to badly altered
Unit 7Medium-grained, patchy, vesicularaphyric basalt, moderately to badlyaltered
UnitδMedium-grained, sparsely Plagioclasephyric basalt, moderately to badlyaltered
Figure 5. Reconstructed section based on sonic velocity well log and recovered core in the basement com-plex at Site 528. (Numbers on the lithologic columns indicate the velocity, in km/s.)
75 m of the complex, suggesting that nearly all of thebasalt drilled (88%) was recovered and that most of themissing section consists of sediments, open fractures, orcavities. Thus, only 32% of the inferred sediment wasrecovered.
The comparison of the sonic log to the recovered corehas enabled us to distinguish with confidence betweengrossly different rock types, i.e., sediment versus basalt.Within the basalts, we have a wide range of sonic veloc-
ities ( = 4.2 to 6.6 km/s). Even though the velocitiesfrom the sonic logs generally compare well with what wewould expect from the recovered cores, we believe thatwe would have difficulty in distinguishing between thedifferent basalt units if we had not recovered nearly allof the cored basalts. For example, the badly to moder-ately altered vesicular aphyric basalts (Units 2 and 7)have velocities similar to the badly to moderately alteredand fractured Plagioclase phyric basalts (Units 3, 4, 5,
835
P. D. RABINOWITZ, P. E. BORELLA
and 8). The velocities of these units are generally from4.2 to 5.0 km/s, with a few thin layers of greater veloc-ity. The massive Plagioclase phyric basalt of Unit 1 ischaracterized by a higher seismic velocity (6.0 km/s), asone would expect. Most of the sediment velocities with-in the basement complex range from 1.6 to 3.0 km/s.We find little correlation between sediment type andvelocity structure, owing most probably to large wash-outs and poor recovery of these sediments within thebasement complex. We consider the rock types with ve-locities of 4.0 and 3.8 km/s near the top of the section(Core 528-41) to be of sediment origin, based on the re-covery of a small amount of calcareous mudstone (0.3 m)in this part of the section. An alternative explanation(and perhaps equally valid) is that the mudstone was notrecovered in place, but derives from farther up the hole,and that the 3.8 and 4.0 km/s rocks are part of Unit 2,consisting of lower velocity vesicular phyric basalts.
SONOBUOY CRUSTAL SECTION
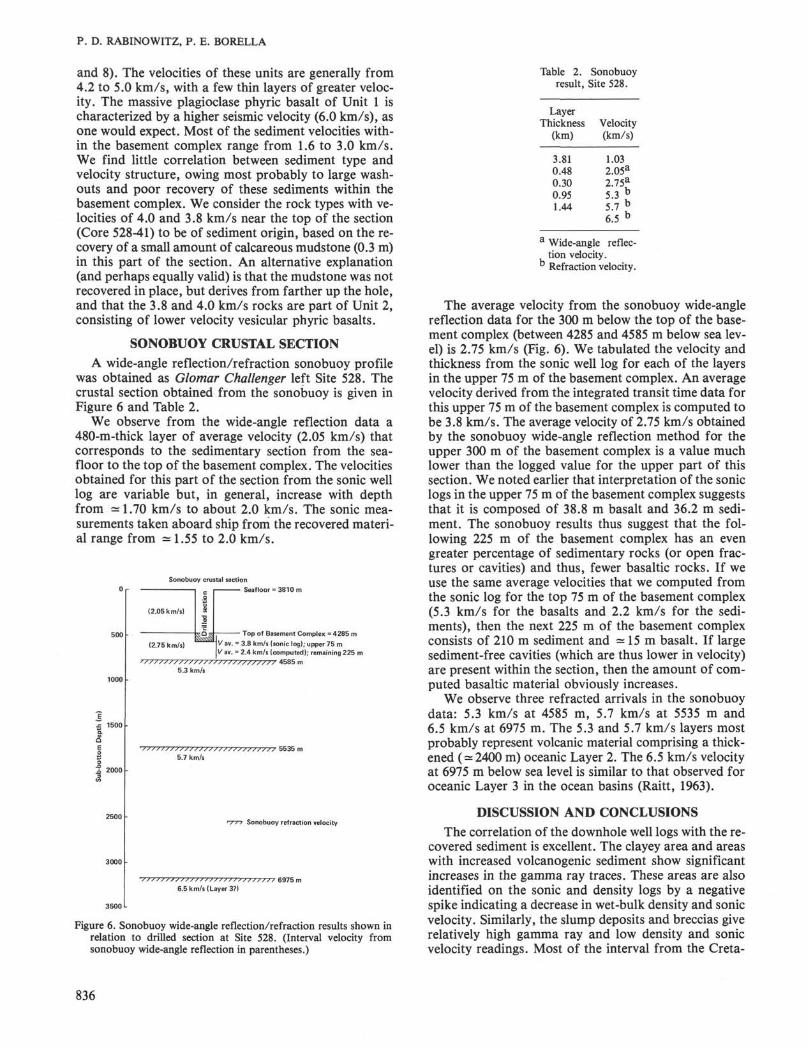
A wide-angle reflection/refraction sonobuoy profilewas obtained as Glomar Challenger left Site 528. Thecrustal section obtained from the sonobuoy is given inFigure 6 and Table 2.
We observe from the wide-angle reflection data a480-m-thick layer of average velocity (2.05 km/s) thatcorresponds to the sedimentary section from the sea-floor to the top of the basement complex. The velocitiesobtained for this part of the section from the sonic welllog are variable but, in general, increase with depthfrom 1.70 km/s to about 2.0 km/s. The sonic mea-surements taken aboard ship from the recovered materi-al range from =1.55 to 2.0 km/s.
Table 2. Sonobuoyresult, Site 528.
Sonobuoy crustal section
Seafloor
(2.75 km/s)
Top of Basement Complex = 4285 m
V av. = 3.8 km/s (sonic log); upper 75 mV av. = 2.4 km/s (computed); remaining 225 π
'/////// 4585 m5.3 km/s
Sonobuoy refraction velocity
6.5 km/s (Layer 3?)
Figure 6. Sonobuoy wide-angle reflection/refraction results shown inrelation to drilled section at Site 528. (Interval velocity fromsonobuoy wide-angle reflection in parentheses.)
LayerThickness
(km)
3.810.480.300.951.44
Velocity(km/s)
1.032.05a
2.75a
5 . 3 *5 7 u6.5 b
a Wide-angle reflec-tion velocity.
•3 Refraction velocity.
The average velocity from the sonobuoy wide-anglereflection data for the 300 m below the top of the base-ment complex (between 4285 and 4585 m below sea lev-el) is 2.75 km/s (Fig. 6). We tabulated the velocity andthickness from the sonic well log for each of the layersin the upper 75 m of the basement complex. An averagevelocity derived from the integrated transit time data forthis upper 75 m of the basement complex is computed tobe 3.8 km/s. The average velocity of 2.75 km/s obtainedby the sonobuoy wide-angle reflection method for theupper 300 m of the basement complex is a value muchlower than the logged value for the upper part of thissection. We noted earlier that interpretation of the soniclogs in the upper 75 m of the basement complex suggeststhat it is composed of 38.8 m basalt and 36.2 m sedi-ment. The sonobuoy results thus suggest that the fol-lowing 225 m of the basement complex has an evengreater percentage of sedimentary rocks (or open frac-tures or cavities) and thus, fewer basaltic rocks. If weuse the same average velocities that we computed fromthe sonic log for the top 75 m of the basement complex(5.3 km/s for the basalts and 2.2 km/s for the sedi-ments), then the next 225 m of the basement complexconsists of 210 m sediment and 15 m basalt. If largesediment-free cavities (which are thus lower in velocity)are present within the section, then the amount of com-puted basaltic material obviously increases.
We observe three refracted arrivals in the sonobuoydata: 5.3 km/s at 4585 m, 5.7 km/s at 5535 m and6.5 km/s at 6975 m. The 5.3 and 5.7 km/s layers mostprobably represent volcanic material comprising a thick-ened ( 2400 m) oceanic Layer 2. The 6.5 km/s velocityat 6975 m below sea level is similar to that observed foroceanic Layer 3 in the ocean basins (Raitt, 1963).
DISCUSSION AND CONCLUSIONS
The correlation of the downhole well logs with the re-covered sediment is excellent. The clayey area and areaswith increased volcanogenic sediment show significantincreases in the gamma ray traces. These areas are alsoidentified on the sonic and density logs by a negativespike indicating a decrease in wet-bulk density and sonicvelocity. Similarly, the slump deposits and breccias giverelatively high gamma ray and low density and sonicvelocity readings. Most of the interval from the Creta-
836
WELL LOGGING OF SEDIMENTS AND BASEMENT COMPLEX
ceous/Tertiary boundary to the basement complex isidentified by relatively high gamma ray values, owing tothe enriched amounts of clay and volcanogenic materi-als found there.
One of the important uses of the downhole loggingdata is in identifying the rock types in the intervalswhere recovery is poor. Within the basement complexthe comparison of the logs to the recovered cores clearlydemonstrates that the boundaries between the majorrock types (e.g., sediment versus basalt) are generallydistinguishable. The logs that we used here merely de-tect differences in select physical properties (density atSite 527; sonic velocity at Site 528) of the rocks sur-rounding the hole. Since these physical properties arenot unique to any one rock type, we obviously cannotunequivocally resolve all of the intervals, especiallywithin the basaltic part of the basement complex (e.g.,basalts with different chemistries and textures may havesimilar velocities).
Our reconstruction of the upper 75 m of the base-ment complex shows that approximately half of the ma-terial is igneous and the other half sedimentary in ori-gin. We recovered most of the basalts we drilled (88%).We were less successful with the sediments (32% recov-ery) owing most probably to washouts resulting fromthe large downhole water pressures that accompanydrilling through the hard rock.
The seismic reflection records show that the top ofthe basement complex is smooth in character, comparedto oceanic basement generally observed in the workTsoceans. The basement consists of basalts intercalatedwith sediments. Similar observations of "smooth acous-tic basement" and recovered basalts with the inter-calated sediments were made at Site 462 in Jurassicocean crust in the Nauru Basin of the western PacificOcean (Larson, Schlanger, et al., 1981). It is interestingto note that the intercalated sedimentary units in theNauru Basin were characterized by abundant contribu-tions of sediment transported and redeposited to thesite, in a fashion similar to that observed at Site 528 onthe Walvis Ridge.
A smooth basement reflector was drilled at Sites 338and 342 on the V0ring Plateau bordering the continentalmargin of Norway (Talwani, Udintsev, et al., 1976). Therocks recovered by drilling showed the smooth basementreflector to be basaltic in origin; it was believed by Tal-wani and Udintsev (1976) to be the top of oceanic base-ment. However, subsequent multichannel seismic reflec-tion measurements (Hinz and Weber, 1976) show that inthe vicinity of drilling the prominent smooth "base-ment" reflector is underlain by closely spaced dippingreflectors and that the true oceanic basement lies somedistance below the smooth reflector. An important ob-servation off Norway was that the age of the oldest sedi-ments (early Eocene) above the smooth basaltic reflectoris in reasonable agreement with the age obtained frommagnetic anomalies (between Anomalies 24 and 25).This suggests that the processes active from the timeoceanic crust began forming to the time the smooth base-ment reflector formed occurred very quickly. Talwaniand Udintsev (1976) suggest that the basaltic reflector
penetrated at Sites 338 and 342 is only slightly youngerthan the basement underneath and that the interveningreflectors may represent rapidly depositing pyroclasticsassociated with volcanic activity during the early open-ing of the Norwegian Sea. We noted earlier that at Site528 on the Walvis Ridge, the oldest sediments above thebasement complex were only slightly younger than thoseobserved in the sediments intercalated within the basalts,at a depth close to 80 m below the top of the basementcomplex. A similar observation was made at Site 525where a lower Maestrichtian-upper Campanian nanno-fossil zone (Quadrum trifidum zone) was observed justabove the basement complex and 75 m below the topof the recovered basalts. Our sonobuoy results suggestthat at Site 528 we have - 300 m of basalt with interca-lated sediments and that the ratio of sediments to ba-salts increases with depth. Below this 300-m interval weobserve a velocity structure similar to Layers 2 and 3 inthe ocean basins.
We believe that our observations with respect to ageversus depth within the part of the basement complexthat was drilled strongly suggest that the processes form-ing the upper part of the Walvis Ridge were accomplishedrather quickly, a conclusion supportive of the similar re-sults suggested by Talwani and Udintsev (1976) for theV0ring Plateau.
Houtz and Ludwig (1979) report that the southwestPacific Ocean contains significant accumulations ofacoustically reverberant material, called "smooth acous-tic basement," that is difficult to penetrate, especiallywith the small air gun types (328-656 cm3) used in theWalvis Ridge study. They note that the misidentificationof the reverberant material as oceanic Layer 2 wouldresult in the attribution of basement depths in placesthat are in fact up to 2000 m too shallow. DSDP sam-ples and other velocity information indicate that the re-verberant material is volcanogenic in places and calcare-ous in others (Lancelot and Larson, 1976; Winterer,Ewing, et al., 1973; Larson, 1976). The limited numberof repeat seismic profiler traverses with large air guns(7628 cm3) demonstrate that true oceanic basement issituated below the reverberant or smooth acoustic base-ment. We believe that a similar result will be found if theWalvis Ridge is traversed with a higher energy soundsource.
ACKNOWLEDGMENTS
We wish to thank Captain Clarke and the crew of the Glomar Chal-lenger for their assistance in gathering the data during the logging op-eration. Robert Houtz assisted in the reduction of the sonobuoy. Thiswork was supported in part by the Deep Sea Drilling Project, JOI,Inc., and the National Science Foundation.
REFERENCES
Boyce, R. E., 1980. Determination of the relationships of electrical re-sistivity, sound velocity, and density/porosity of sediment androck by laboratory techniques and well logs from Deep Sea Drill-ing Project Sites 415 and 416 off the coast of Morocco. In Lance-lot, Y., Winterer, E. L., et al., Init. Repts. DSDP, 50: Washington(U.S. Govt. Printing Office), 305-318.
, 1981. Electrical resistivity, sound velocity, thermal conduc-tivity, density-porosity, and temperature, obtained by laboratorytechniques and well logs: Site 462 in the Nauru Basin of the Pacific
837
P. D. RABINOWITZ, P. E. BORELLA
Ocean. In Larson, R. L., Schlanger, S. O., et al., Init. Repts.DSDP, 61: Washington (U.S. Govt. Printing Office), 743-762.
Ewing, J., and Ewing, M., 1971. Seismic reflection. In Maxwell, A.(Ed.), The Sea (Vol. 4, Pt. 1): New York (John Wiley), 1-51.
Hamilton, E. L., 1965. Sound speed and related physical properties ofsediments from experimental Mohole (Guadalupe site). Geophys-ics, 35:995.
, 1976. Variations of density and porosity with depth in deepsea sediments. J. Sed. Petrol., 46:280.
Hinz, K., and Weber, J., 1976. Zum geologischen Aufbau des Nor-wegischen Kontinentalrandes und der Barents-See nach Reflexionsseismischen Messungen. Erdol Kohle, Erdg., Petrochem., Com-pendium, 75/76:3-29.
Houtz, R. E., and Ludwig, W. J., 1979. Distribution of reverberantsub-bottom layers in the southwest Pacific Basin. J. Geophys.Res., 84:3497-3504.
Kirkpatrick, R. J., 1979a. Results of downhole geophysical loggingHole 396B, DSDP Leg 46. In Dmitriev, L., Heirtzler, J., et al., In-it. Repts. DSDP, 46: Washington (U.S. Govt. Printing Office),401-407.
, 1979b. The physical state of the oceanic crust: Results ofdownhole geophysical logging in the Mid-Atlantic Ridge at 23 °N./ . Geophys. Res., 84:178-188.
Lancelot, Y., and Larson, R. L., 1975. Sedimentary and tectonic evo-lution of northwestern Pacific. In Larson, R. L., Moberly, R., etal., Init. Repts. DSDP, 32: Washington (U.S. Govt. Printing Of-fice), 925-939.
Larson, R., 1976. Late Jurassic and Early Cretaceous evolution of thewestern central Pacific Ocean. J. Geomag. Geoelec, 28:219-236.
Larson, R. L., Schlanger, S. O., et al., 1981. Site 462. In Larson, R.L., Schlanger, S. O., et al., Init. Repts. DSDP, 61: Washington(U.S. Govt. Printing Office), 19-394.
Moore, T. C , Jr., Rabinowitz, P. D., and Shipboard Scientific Party,in press. The Walvis Ridge transect, DSDP Leg 74: The geologicevolution of an oceanic plateau in the South Atlantic Ocean. Geol.Soc. Am. Bull.
Pirson, S. J., 1963. Handbook of Well Log Analysis: EnglewoodCliffs, N. J. (Prentice Hall).
Rabinowitz, P. D., and Simpson, E. S. W., 1979. Results of IPODSite Surveys aboard R/V Thomas B. Davie Cruise 388. L-DGOTech. Rept., JOI, Inc., UCT. Tech. Rept. #7.
Raitt, T. W., 1963. The crustal rocks. In Hill, M. N. (Ed.), The Sea(Vol. 3): New York (John Wiley), 85-102.
Salisbury, M. H., Donnelly, T. W., and Francheteau, J., 1980. Geo-physical logging in Deep Sea Drilling Project Hole 417D. In Don-nelly, T., Francheteau, J., Bryan, W., Robinson, P., Flower, M.Salisbury, M., et al., Init. Repts. DSDP, 51, 52, 53, Pt. 1: Wash-ington (U.S. Govt. Printing Office), 705-713.
Schlumberger, Ltd., 1972a. Log Interpretation (Vol. 1), Principles:, 1972b. Log Interpretations (Vol. 2), Charts.
Talwani, M., and Udintsev, G., 1976. Tectonic synthesis. In Talwani,M., Udintsev, G., et al., Init. Repts. DSDP, 38: Washington (U.S.Govt. Printing Office), 1213-1242.
Talwani, M., Udintsev, G., et al., 1976. Sites 338-343. In TalwaniM., Udintsev, G., et al., Init. Repts. DSDP, 38: Washington (U.S.Govt. Printing Office), 151-388.
Winterer, E. L., Ewing, J. I., et al., 1973. Init. Repts. DSDP, 17:Washington (U.S. Govt. Printing Office).
838