27 september, 2016 ommodity insight -...
TRANSCRIPT

News and Developments Australian gold production for the 2015-16 year was the highest for 15 years, according to Melbourne gold mining
consultants Surbiton Associates. Macquarie recently upgraded Northern Star and St Barbara from neutral to outperform
and Deutsche Bank upgraded its Alacer Gold recommendation to a "buy". After a few years of incredible consolidation
and movement in the industry, 14 Australasian gold mines and 23 per cent of Australian gold production had changed
hands in little more than two years, things tend to be slightly quieter on that front, though exploration budgets are
looking generous, which is flowing through to the junior explorers. Saracen Minerals has allocated $42 million for
exploration, Goldfields is looking to spend $100 million and Northern Star is pouring up to $90 million into projects.
India’s gold demand will remain high which
accounts for almost a quarter of global demand for
the precious metal, as falling unemployment and
steady inflation spur buying of jewelry, coins and
gold bonds. India which is the world’s second-
largest country by population after China will see its
economy expand at about 8 percent a year through
2021, according to Citi researchers. The country’s
working-age population will increase by 220 million
over the next 20 years, and about 240 million
people will move to cities.
Technical Outlook
On weekly chart, the COMEX Gold prices have been trading in “Rising Channel” pattern from past 8 months and price
has taken support near its upper band of channel pattern at $1315 levels. On weekly chart, COMEX Gold price has given
breakout of its “Falling Channel” pattern $1215 levels with bolstering volumes. On daily chart, MCX Gold price has
shown breakout of “Ascending Triangle” pattern at Rs.31050 levels. Moreover, on weekly time frame, COMEX Gold
prices have been trading above its 200 Weekly exponential moving average, which indicates long term trend is positive.
So any dip in MCX Gold up to Rs.30900 can be used as buying opportunity for the upside target of Rs.32250 levels with
the Stop loss of Rs.30500 levels. On the other hand, MCX Gold momentum indicator RSI has taken support of horizontal
line at 52 levels on a weekly chart, which suggests further bullish momentum can be seen in the prices. Overall, we hold
our bullish view in Gold for the next three months.
27th September, 2016
SEBI Registered - Research Analyst Equities I Commodities I Currencies I Mutual Funds
GOLD
Commodity Insight
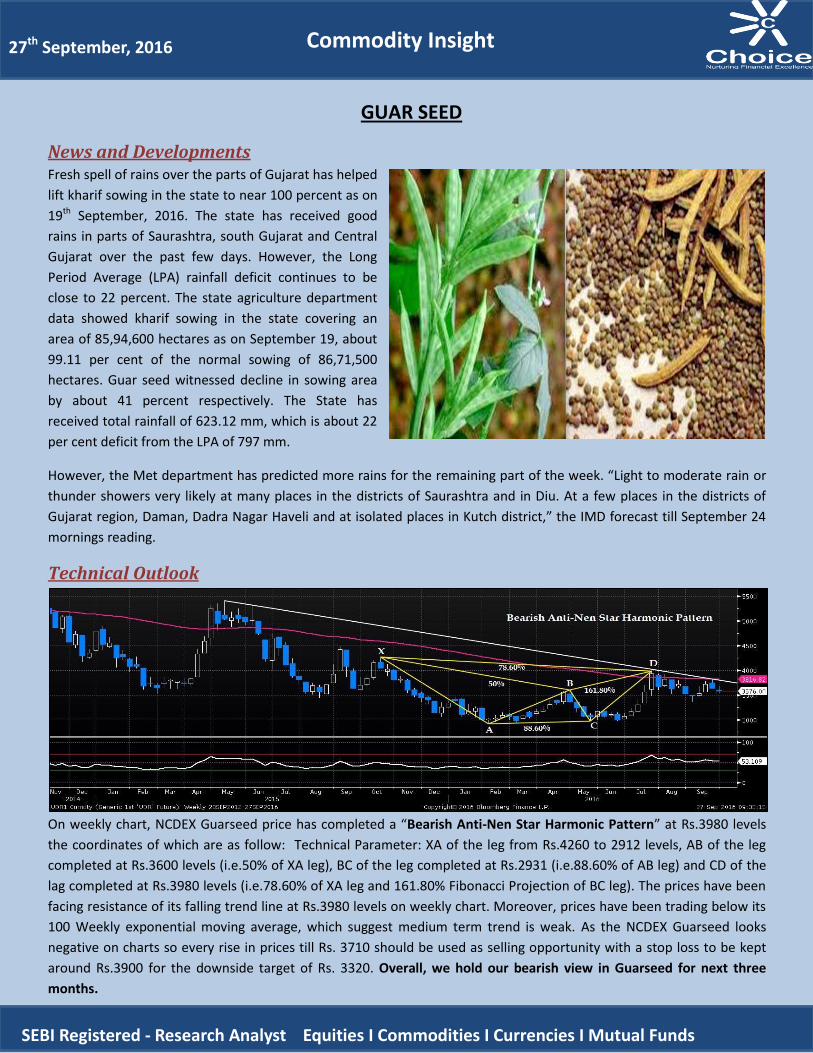
News and Developments Fresh spell of rains over the parts of Gujarat has helped
lift kharif sowing in the state to near 100 percent as on
19th September, 2016. The state has received good
rains in parts of Saurashtra, south Gujarat and Central
Gujarat over the past few days. However, the Long
Period Average (LPA) rainfall deficit continues to be
close to 22 percent. The state agriculture department
data showed kharif sowing in the state covering an
area of 85,94,600 hectares as on September 19, about
99.11 per cent of the normal sowing of 86,71,500
hectares. Guar seed witnessed decline in sowing area
by about 41 percent respectively. The State has
received total rainfall of 623.12 mm, which is about 22
per cent deficit from the LPA of 797 mm.
However, the Met department has predicted more rains for the remaining part of the week. “Light to moderate rain or
thunder showers very likely at many places in the districts of Saurashtra and in Diu. At a few places in the districts of
Gujarat region, Daman, Dadra Nagar Haveli and at isolated places in Kutch district,” the IMD forecast till September 24
mornings reading.
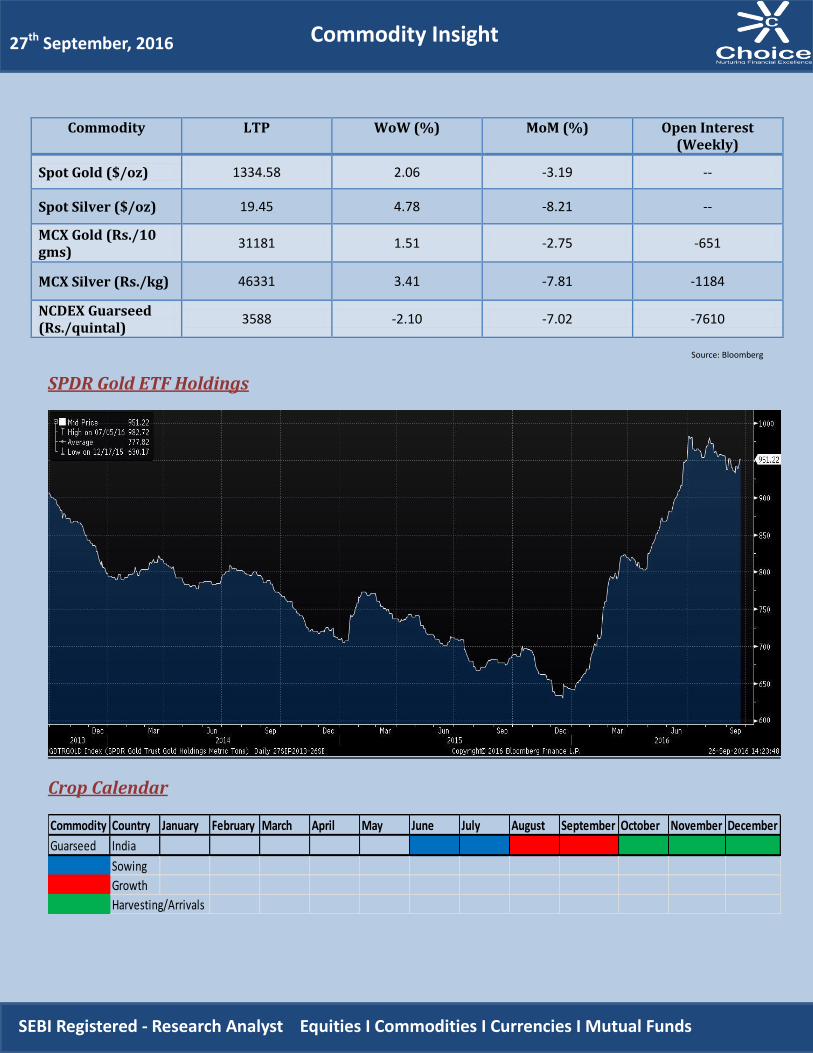
Technical Outlook
On weekly chart, NCDEX Guarseed price has completed a “Bearish Anti-Nen Star Harmonic Pattern” at Rs.3980 levels
the coordinates of which are as follow: Technical Parameter: XA of the leg from Rs.4260 to 2912 levels, AB of the leg
completed at Rs.3600 levels (i.e.50% of XA leg), BC of the leg completed at Rs.2931 (i.e.88.60% of AB leg) and CD of the
lag completed at Rs.3980 levels (i.e.78.60% of XA leg and 161.80% Fibonacci Projection of BC leg). The prices have been
facing resistance of its falling trend line at Rs.3980 levels on weekly chart. Moreover, prices have been trading below its
100 Weekly exponential moving average, which suggest medium term trend is weak. As the NCDEX Guarseed looks
negative on charts so every rise in prices till Rs. 3710 should be used as selling opportunity with a stop loss to be kept
around Rs.3900 for the downside target of Rs. 3320. Overall, we hold our bearish view in Guarseed for next three
months.
GUAR SEED
27th September, 2016
SEBI Registered - Research Analyst Equities I Commodities I Currencies I Mutual Funds
Commodity Insight
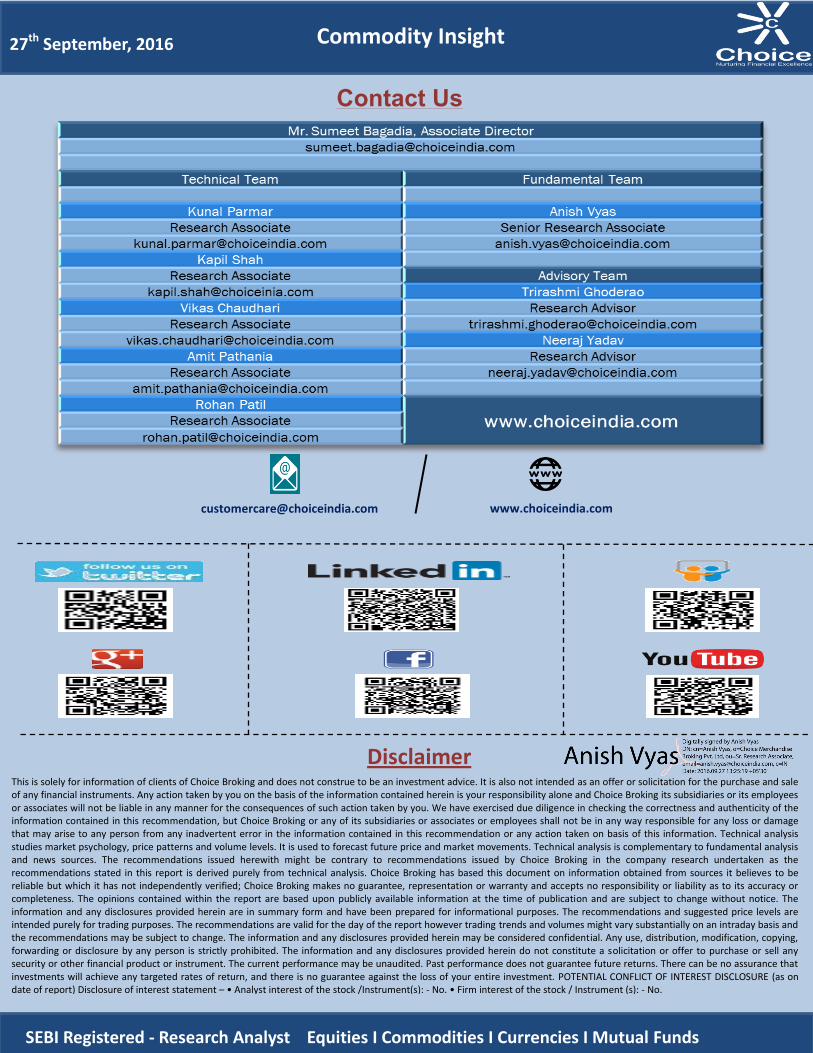
SPDR Gold ETF Holdings
Crop Calendar
Commodity Country January February March April May June July August September October November December
Guarseed India
Sowing
Growth
Harvesting/Arrivals
Commodity LTP WoW (%) MoM (%) Open Interest (Weekly)
Spot Gold ($/oz) 1334.58 2.06 -3.19 --
Spot Silver ($/oz) 19.45 4.78 -8.21 --
MCX Gold (Rs./10 gms)
31181 1.51 -2.75 -651
MCX Silver (Rs./kg) 46331 3.41 -7.81 -1184
NCDEX Guarseed (Rs./quintal)
3588 -2.10 -7.02 -7610
SEBI Registered - Research Analyst Equities I Commodities I Currencies I Mutual Funds
Commodity Insight 27th September, 2016
Source: Bloomberg
This is solely for information of clients of Choice Broking and does not construe to be an investment advice. It is also not intended as an offer or solicitation for the purchase and sale of any financial instruments. Any action taken by you on the basis of the information contained herein is your responsibility alone and Choice Broking its subsidiaries or its employees or associates will not be liable in any manner for the consequences of such action taken by you. We have exercised due diligence in checking the correctness and authenticity of the information contained in this recommendation, but Choice Broking or any of its subsidiaries or associates or employees shall not be in any way responsible for any loss or damage that may arise to any person from any inadvertent error in the information contained in this recommendation or any action taken on basis of this information. Technical analysis studies market psychology, price patterns and volume levels. It is used to forecast future price and market movements. Technical analysis is complementary to fundamental analysis and news sources. The recommendations issued herewith might be contrary to recommendations issued by Choice Broking in the company research undertaken as the recommendations stated in this report is derived purely from technical analysis. Choice Broking has based this document on information obtained from sources it believes to be reliable but which it has not independently verified; Choice Broking makes no guarantee, representation or warranty and accepts no responsibility or liability as to its accuracy or completeness. The opinions contained within the report are based upon publicly available information at the time of publication and are subject to change without notice. The information and any disclosures provided herein are in summary form and have been prepared for informational purposes. The recommendations and suggested price levels are intended purely for trading purposes. The recommendations are valid for the day of the report however trading trends and volumes might vary substantially on an intraday basis and the recommendations may be subject to change. The information and any disclosures provided herein may be considered confidential. Any use, distribution, modification, copying, forwarding or disclosure by any person is strictly prohibited. The information and any disclosures provided herein do not constitute a solicitation or offer to purchase or sell any security or other financial product or instrument. The current performance may be unaudited. Past performance does not guarantee future returns. There can be no assurance that investments will achieve any targeted rates of return, and there is no guarantee against the loss of your entire investment. POTENTIAL CONFLICT OF INTEREST DISCLOSURE (as on date of report) Disclosure of interest statement – • Analyst interest of the stock /Instrument(s): - No. • Firm interest of the stock / Instrument (s): - No.
Disclaimer
Contact Us
www.choiceindia.com [email protected]
Commodity Insight 27th September, 2016
SEBI Registered - Research Analyst Equities I Commodities I Currencies I Mutual Funds