256-29: basic sas procedures for generating quick · pdf filepaper 256-29 basic sas procedures...
TRANSCRIPT

Paper 256-29
Basic SAS PROCedures for Generating Quick Results Kirk Paul Lafler, Software Intelligence Corporation
Abstract As an IT professional, saving time is critical. So is delivering timely and quality looking reports to management, end users, and customers. The SAS System provides numerous "canned" PROCedures for generating quick results to take care of both... and more. Attendees will learn how basic SAS PROCedures such as SORT, PRINT, SQL, and FORMS are used to create detail reports; how CHART, FREQ, MEANS, PLOT, and UNIVARIATE are used to summarize and create graphical, tabular, or statistical output; how SORT and DATASETS are used to manipulate one or more columns of data and manage data libraries; and several useful techniques including how to inform the SAS System which data set to use as input to a procedure, how to subset data using a WHERE statement (or WHERE= clause), and how to perform BY-group processing to separate data into groups of like information. Introduction Once data has been collected and stored in a SAS data set, results can be produced quickly using one or more procedures. The SAS System provides numerous ready-to-use procedures designed for data analysis and presentation. Procedures are designed to be simple to use, and are what differentiate SAS from other software products. SAS’ built-in procedures offer users with a unique ability to generate quick results – requiring little, if any, programming skills. Using a procedure, or PROC, is similar to filling out a simple request form. By specifying the name of procedure and one or more options, you can produce results quickly and easily. Procedures frequently write their results to the Output window (in SAS Display Manager), an output SAS data set, or an output file. When output is produced, it is often customized so it satisfies certain requirements such as automatic centering, printing or displaying dates and page numbers, and so on. Having the ability to customize the way output appears as well as the type of information that is produced is what makes procedures an indispensable tool for users everywhere. SAS supports four categories of procedures: 1) reporting, 2) statistical, 3) scoring, and 4) utility. This paper investigates the use of several base-SAS procedures to enable the production of quick and useful reports, statistics, and tables of data, and will also look at procedures that can be used to perform simple data set management tasks. The Anatomy of a PROC Each procedure (or PROC) has unique characteristics and elements, but many common ones too. Each PROC consists of a keyword, one or more statements, and options – of which some are required and others are basically – optional. Although the statements and options vary from PROC to PROC, the basic anatomy of a PROC looks something like the following:
PROC procname DATA= __________________; TITLE ______________________________; FOOTNOTE ___________________________; BY _________________________________; LABEL ______________________________; FORMAT _____________________________; RUN; <or> QUIT;
The PROC Statement Every PROC begins with the keyword PROC and is a required element. This keyword signals to the SAS supervisor (the internal traffic cop that controls everything that goes on in the SAS System) that a “canned” procedure is being launched, and not a DATA step or MACRO program. The name of the PROC follows the keyword PROC – our example above references the anatomy PROC. In its simplest and purest form this is all that is required by a few procedures to run. As you might expect though, the results may also tend to be basic and output will appear without any customizations. Once the name of the PROC is specified, you may then specify one or more options available with the PROC, and in any order. In our basic skeletal example above, the DATA= option appears. This option, if specified, informs the SAS System what data set to use as input to the PROC. If omitted, it automatically defaults to the most recently created data set – which may not be the most data set most recently used. (Readers will see several PROCs and their various options on the following pages).
SUGI 29 Tutorials
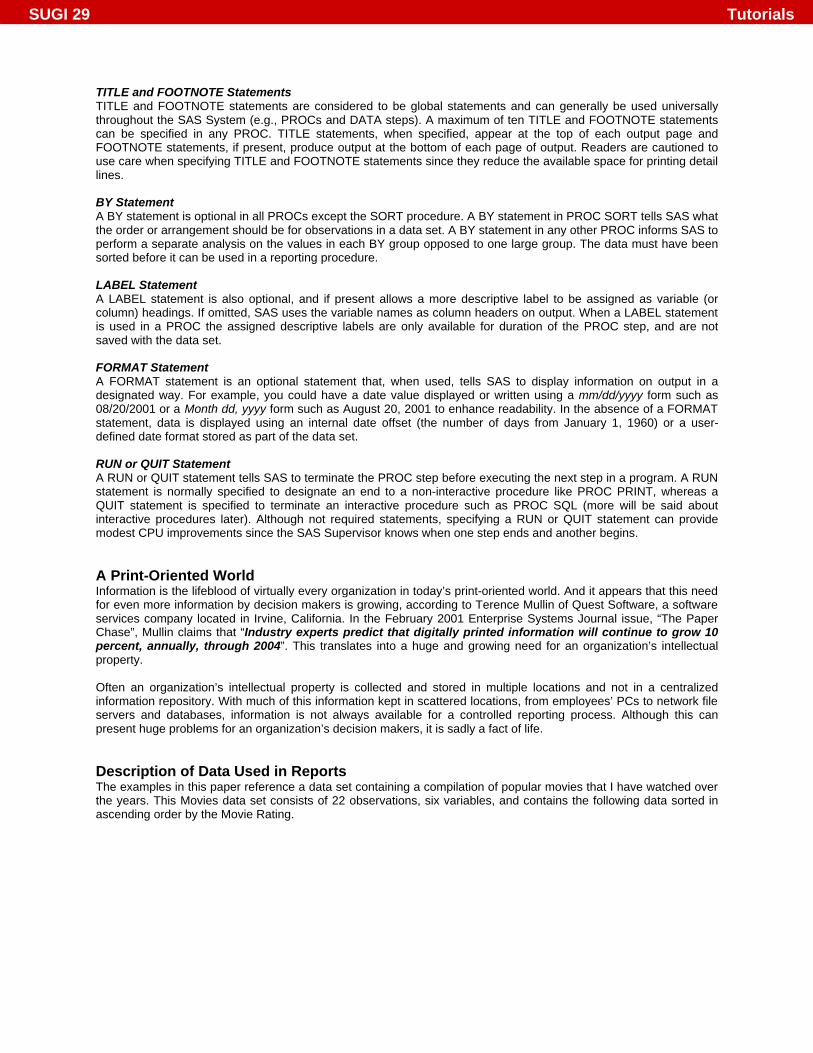
TITLE and FOOTNOTE Statements TITLE and FOOTNOTE statements are considered to be global statements and can generally be used universally throughout the SAS System (e.g., PROCs and DATA steps). A maximum of ten TITLE and FOOTNOTE statements can be specified in any PROC. TITLE statements, when specified, appear at the top of each output page and FOOTNOTE statements, if present, produce output at the bottom of each page of output. Readers are cautioned to use care when specifying TITLE and FOOTNOTE statements since they reduce the available space for printing detail lines. BY Statement A BY statement is optional in all PROCs except the SORT procedure. A BY statement in PROC SORT tells SAS what the order or arrangement should be for observations in a data set. A BY statement in any other PROC informs SAS to perform a separate analysis on the values in each BY group opposed to one large group. The data must have been sorted before it can be used in a reporting procedure. LABEL Statement A LABEL statement is also optional, and if present allows a more descriptive label to be assigned as variable (or column) headings. If omitted, SAS uses the variable names as column headers on output. When a LABEL statement is used in a PROC the assigned descriptive labels are only available for duration of the PROC step, and are not saved with the data set. FORMAT Statement A FORMAT statement is an optional statement that, when used, tells SAS to display information on output in a designated way. For example, you could have a date value displayed or written using a mm/dd/yyyy form such as 08/20/2001 or a Month dd, yyyy form such as August 20, 2001 to enhance readability. In the absence of a FORMAT statement, data is displayed using an internal date offset (the number of days from January 1, 1960) or a user-defined date format stored as part of the data set. RUN or QUIT Statement A RUN or QUIT statement tells SAS to terminate the PROC step before executing the next step in a program. A RUN statement is normally specified to designate an end to a non-interactive procedure like PROC PRINT, whereas a QUIT statement is specified to terminate an interactive procedure such as PROC SQL (more will be said about interactive procedures later). Although not required statements, specifying a RUN or QUIT statement can provide modest CPU improvements since the SAS Supervisor knows when one step ends and another begins. A Print-Oriented World Information is the lifeblood of virtually every organization in today’s print-oriented world. And it appears that this need for even more information by decision makers is growing, according to Terence Mullin of Quest Software, a software services company located in Irvine, California. In the February 2001 Enterprise Systems Journal issue, “The Paper Chase”, Mullin claims that “Industry experts predict that digitally printed information will continue to grow 10 percent, annually, through 2004”. This translates into a huge and growing need for an organization’s intellectual property. Often an organization’s intellectual property is collected and stored in multiple locations and not in a centralized information repository. With much of this information kept in scattered locations, from employees’ PCs to network file servers and databases, information is not always available for a controlled reporting process. Although this can present huge problems for an organization’s decision makers, it is sadly a fact of life. Description of Data Used in Reports The examples in this paper reference a data set containing a compilation of popular movies that I have watched over the years. This Movies data set consists of 22 observations, six variables, and contains the following data sorted in ascending order by the Movie Rating.
SUGI 29 Tutorials

SAS Reporting Procedures You may be wondering how the SAS System and its many PROCs can help with your reporting needs. The answer is simple. SAS software and its many “canned, ready-to-go” PROCs turn information into structured and meaningful reports. As of 2001, more than 3.5 million software customers in 115 countries, and 98% of the Fortune 100 companies and 90% of the Fortune 500 companies can attest to the fact that producing detailed reports with the SAS System has never been easier.
SAS and its many “canned, ready-to-go” PROCs turn information into structured and meaningful reports.
Being able to put a powerful reporting tool in the hands of so many users, and not only programmers, is also an asset – not a liability. Having said this – it remains critical that an organization maintain a controlled environment to ensure information being dispensed in any report does not violate privacy and security issues. It is also critical to maintain a high level of accuracy in all reported information. SAS reporting PROCs consist of a broad range of easy-to-use report formats. Because output is frequently requested in a variety of formats to satisfy a vast number of requirements, SAS is ready and able to help by bundling base-SAS PROCs that produce reports in the following formats: 1) Detail – prints one or more observations without collapsing data that meet specific report criteria. 2) Summary – collapses and prints information. 3) Tabular – collapses and prints information with borders. 4) Statistical – computes and prints descriptive statistics. 5) Graphical – prints information as simple line-oriented bar and pie charts, and line plots. An alphabetical list of several SAS reporting PROCs and their output formats is illustrated in table 1 below. Report Output Style PROC Detail Output FORMS PRINT REPORT SQL Summary Output CHART FREQ MEANS PLOT SQL UNIVARIATE Tabular Output FREQ TABULATE Statistical Output MEANS SQL
SUGI 29 Tutorials

UNIVARIATE Graphical Output CHART PLOT
Table 1. PROCs and Report Formats PROCs for All That Detail Sometimes a report must show all the detail it can. When this is the case, SAS provides the PRINT, REPORT, and SQL procedures to generate detail reports and the FORMS procedure to produce repetitive forms and labels. Although each PROC is relatively easy to use, they can also provide the level of support needed by even the most demanding programmer. By using one or more statements and options each PROC can produce simple to semi-custom reports. Using PROC PRINT The PRINT procedure is a popular reporting tool that is used by users everywhere. In its simplest form, PROC PRINT prints all variables for all observations in a data set. The SAS System writes a default title line at the top of each report page automatically. Suppose you had to create a report containing all Movie data (all observations and variables) with the littlest amount of code possible. The PROC PRINT statement illustrated below produces a detail-oriented report consisting of all observations and variables. Procedure Code:
PROC PRINT DATA=SUGI.MOVIES; RUN;
When the PROC PRINT code is executed, the SAS System applies certain defaults in creating report output including the default title, the number of observations, and list and order of variables that are displayed. Results:
Let’s take it a step further. Suppose you did not want all the variables from the Movies data set – say you wanted only the Movie Title, Length, and Rating in that order. You could start with the PROC PRINT code from the previous example and insert a VAR statement between the PROC and RUN statements to tell SAS what variables to output along with their specific order on the report. Procedure Code:
PROC PRINT DATA=SUGI.MOVIES; VAR TITLE LENGTH RATING; RUN;
SUGI 29 Tutorials

Results:
Although the PROC PRINT code from the previous example printed the three variables you asked for, it also printed the Observation number as column one on the report. The observation number is automatically displayed as the first column on all PROC PRINT output – but can be suppressed by specifying the NOOBS option. Suppose you wanted to remove the observation column and change the current title appearing at the top of the report. Procedure Code:
PROC PRINT DATA=SUGI.MOVIES NOOBS; TITLE ‘Movie Classics’; VAR TITLE LENGTH RATING; RUN;
Results:
It is frequently necessary to subset the rows of data generated on output with a WHERE statement. Suppose you wanted to generate a report on PG and PG-13 rated movies. Procedure Code:
PROC PRINT DATA=SUGI.MOVIES NOOBS; TITLE ‘Movie Classics’; VAR TITLE LENGTH RATING; WHERE RATING IN (‘PG’,’PG-13’); RUN;
Results:
SUGI 29 Tutorials
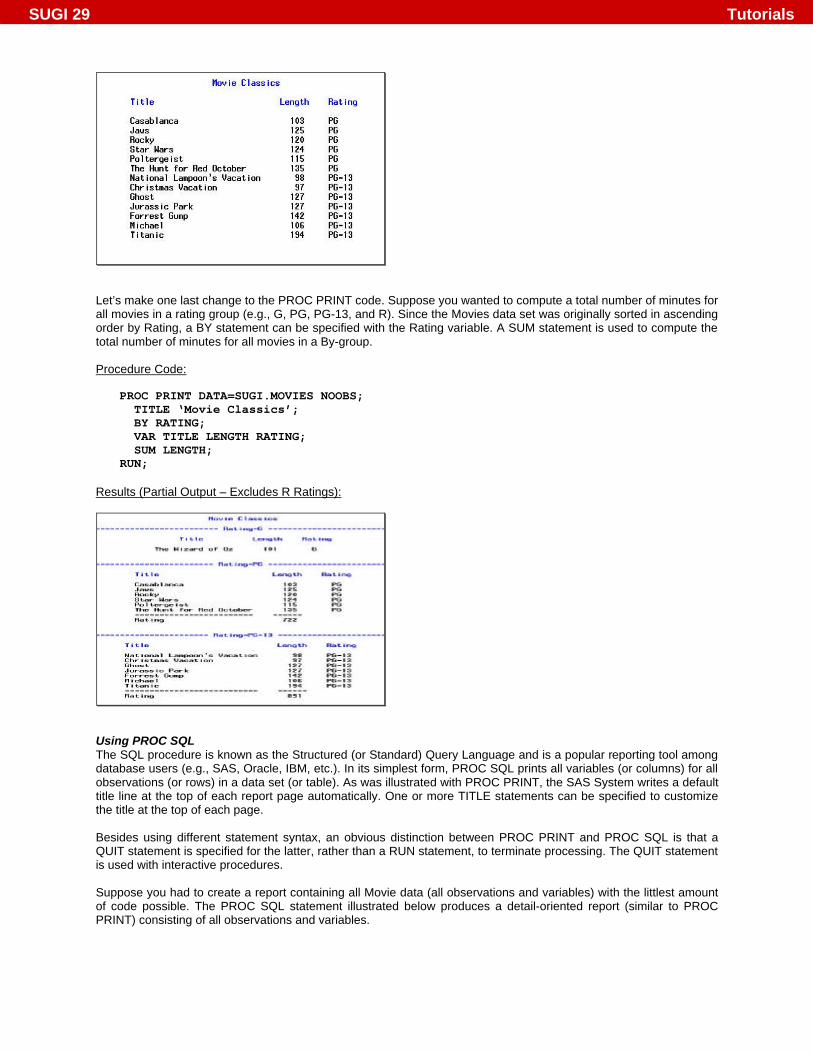
Let’s make one last change to the PROC PRINT code. Suppose you wanted to compute a total number of minutes for all movies in a rating group (e.g., G, PG, PG-13, and R). Since the Movies data set was originally sorted in ascending order by Rating, a BY statement can be specified with the Rating variable. A SUM statement is used to compute the total number of minutes for all movies in a By-group. Procedure Code:
PROC PRINT DATA=SUGI.MOVIES NOOBS; TITLE ‘Movie Classics’; BY RATING; VAR TITLE LENGTH RATING; SUM LENGTH; RUN;
Results (Partial Output – Excludes R Ratings):
Using PROC SQL The SQL procedure is known as the Structured (or Standard) Query Language and is a popular reporting tool among database users (e.g., SAS, Oracle, IBM, etc.). In its simplest form, PROC SQL prints all variables (or columns) for all observations (or rows) in a data set (or table). As was illustrated with PROC PRINT, the SAS System writes a default title line at the top of each report page automatically. One or more TITLE statements can be specified to customize the title at the top of each page. Besides using different statement syntax, an obvious distinction between PROC PRINT and PROC SQL is that a QUIT statement is specified for the latter, rather than a RUN statement, to terminate processing. The QUIT statement is used with interactive procedures. Suppose you had to create a report containing all Movie data (all observations and variables) with the littlest amount of code possible. The PROC SQL statement illustrated below produces a detail-oriented report (similar to PROC PRINT) consisting of all observations and variables.
SUGI 29 Tutorials

Procedure Code:
PROC SQL; TITLE ‘Movie Classics’; SELECT * FROM SUGI.MOVIES; QUIT;
When the PROC SQL code is executed, the SAS System applies certain defaults in creating report output including the default title, the number of observations, and list of variables. Results:
PROC SQL allows for the subsetting of observations as was illustrated earlier with a WHERE statement in PROC PRINT. The only difference is that a WHERE clause is used in PROC SQL. Procedure Code:
PROC SQL; TITLE ‘Movie Classics’; SELECT * FROM SUGI.MOVIES WHERE RATING IN (‘PG’,’PG-13’); QUIT;
Results:
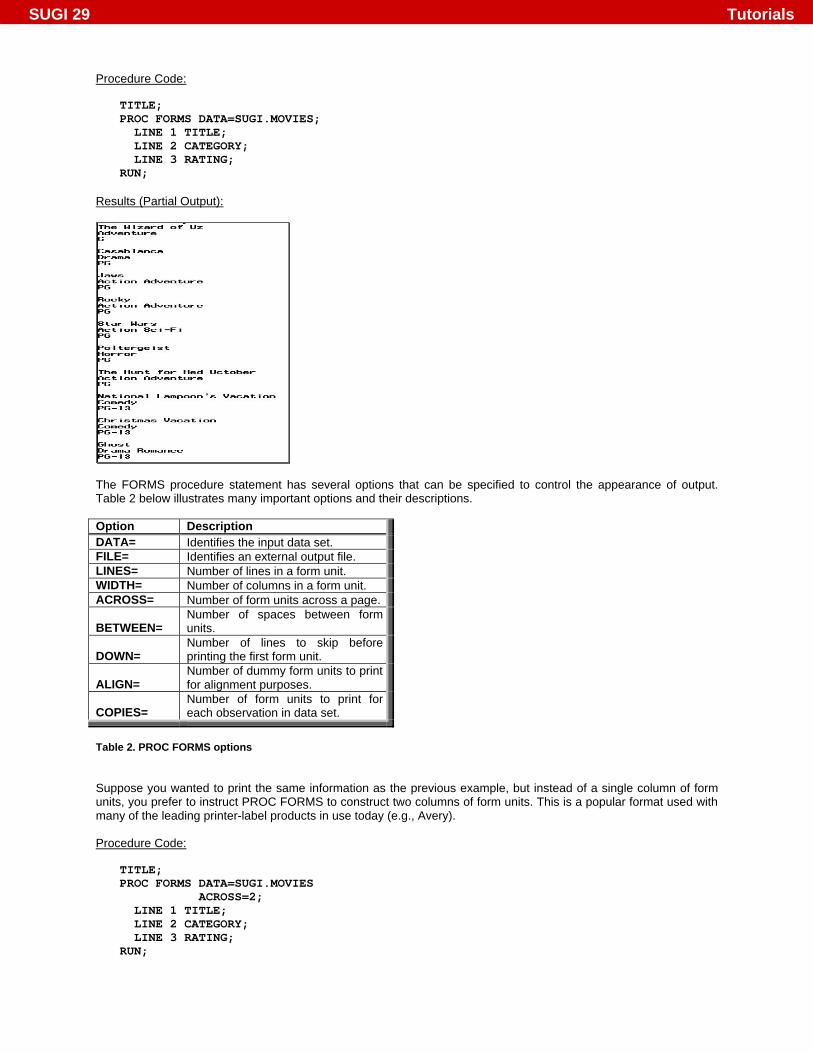
Using PROC FORMS The FORMS procedure provides a handy tool for printing label and form information. Generally the FORMS procedure is used when information is of a repetitive nature, such as mailing labels. In its simplest form, PROC FORMS prints just the information you specify using one or more LINE statements. Suppose you wanted to output the Movie Title, Category, and Rating variables for each observation in a single column.
SUGI 29 Tutorials
Procedure Code:
TITLE; PROC FORMS DATA=SUGI.MOVIES; LINE 1 TITLE; LINE 2 CATEGORY; LINE 3 RATING; RUN;
Results (Partial Output):
The FORMS procedure statement has several options that can be specified to control the appearance of output. Table 2 below illustrates many important options and their descriptions. Option Description DATA= Identifies the input data set. FILE= Identifies an external output file. LINES= Number of lines in a form unit. WIDTH= Number of columns in a form unit. ACROSS= Number of form units across a page. BETWEEN=
Number of spaces between form units.
DOWN=
Number of lines to skip before printing the first form unit.
ALIGN=
Number of dummy form units to print for alignment purposes.
COPIES=
Number of form units to print for each observation in data set.
Table 2. PROC FORMS options Suppose you wanted to print the same information as the previous example, but instead of a single column of form units, you prefer to instruct PROC FORMS to construct two columns of form units. This is a popular format used with many of the leading printer-label products in use today (e.g., Avery). Procedure Code:
TITLE; PROC FORMS DATA=SUGI.MOVIES ACROSS=2; LINE 1 TITLE; LINE 2 CATEGORY; LINE 3 RATING; RUN;
SUGI 29 Tutorials

Results:
PROCs That Summarize Detail reports are great in many situations – but sometimes contain so much information that it makes understanding their contents nearly impossible. When this is the case, a summary report may be in order. The purpose of a summary report is to collapse all the detail information in a report into easy-to-understand summary-level information. This helps to digest the enormous amounts of data frequently stored in a data set. SAS provides the CHART, FREQ, MEANS, PLOT, SQL, TABULATE, and UNIVARIATE procedures to generate summary-level reports. For purposes of illustration, CHART, FREQ, MEANS, and UNIVARIATE will be presented. As illustrated with the detail-level reporting procedures, each PROC is relatively easy to use, but each can also provide the level of support needed by even the most demanding programmer. By using one or more statements and options each PROC can produce simple to semi-custom reports. Using PROC CHART The CHART procedure is a line-oriented graphics tool that is used to print simple histograms (horizontal and vertical bar charts), block charts, and pie charts for numeric and character data. In its simplest form, PROC CHART summarizes the observations in a data set based on the variables listed in the type of chart being produced. Suppose you wanted to display the number of movies grouped by their rating in a vertical bar chart. Procedure Code:
PROC CHART DATA=SUGI.MOVIES; TITLE ‘Chart by Movie Rating’; VBAR RATING; RUN;
SUGI 29 Tutorials

Results:
Suppose you wanted to see the number of movies grouped by their rating as a horizontal bar chart. Notice that basic-level statistics (e.g., frequency, cumulative frequency, percent, and cumulative percent) are automatically displayed with a horizontal bar chart. Procedure Code:
PROC CHART DATA=SUGI.MOVIES; TITLE ‘Chart by Movie Rating’; HBAR RATING; RUN;
Results:
Using PROC FREQ The FREQ procedure produces one-way to n-way frequency and cross-tabulation tables for numeric or character variables. In it simplest form, PROC FREQ produces a one-way frequency table. Procedure Code:
PROC FREQ DATA=SUGI.MOVIES; TITLE ‘Frequency by Movie Rating’; TABLES RATING; RUN;
SUGI 29 Tutorials

Results:
To see a cross-tabulation table for two variables, you will need to specify two variable names separated with an asterisk ‘*’. Procedure Code:
PROC FREQ DATA=SUGI.MOVIES; TITLE ‘2-Way Frequency Table’; TABLES RATING * CATEGORY; RUN;
Results (Partial Output):
Using PROC MEANS The MEANS procedure produces descriptive statistics for numeric variables only. In it simplest form, PROC MEANS produces descriptive statistics for all numeric variables in a data set. Procedure Code:
PROC MEANS DATA=SUGI.MOVIES; TITLE ‘Descriptive Statistics’; RUN;
SUGI 29 Tutorials

Results:
Analysis can be performed to help understand the data by using a numeric or character categorical variable in a CLASS statement. Using the CLASS statement creates descriptive statistics as subgroups. The next example illustrates descriptive statistics for each subgroup of movie by Movie Rating. Procedure Code:
PROC MEANS DATA=SUGI.MOVIES; TITLE ‘Descriptive Statistics’; CLASS RATING; RUN;
Results:
Using PROC UNIVARIATE The UNIVARIATE procedure works similar to the MEANS procedure, except it provides a larger number of descriptive statistics. In its simplest form, PROC UNIVARIATE produces descriptive statistics for all numeric variables in a data set. Procedure Code:
PROC UNIVARIATE DATA=SUGI.MOVIES; TITLE ‘Descriptive Statistics’; RUN;
SUGI 29 Tutorials

Results (Partial Output):
As with PROC MEANS, analysis can be performed to help understand the data by using a numeric or character categorical variable in a CLASS statement. Using the CLASS statement creates descriptive statistics as subgroups. The next example illustrates descriptive statistics for each subgroup of movie by Movie Rating. Procedure Code:
PROC UNIVARIATE DATA=SUGI.MOVIES; TITLE ‘Descriptive Statistics’; CLASS RATING; RUN;
Results (Partial Output):
Utility PROCs for Data Manipulation and Management We will now look at two utility procedures that help with data manipulation and management tasks: the SORT and DATASETS procedures. Their designed purposes as utility tools permit the manipulation of SAS data sets and the management of SAS libraries. Unlike reporting procedures that generate results automatically to output, utility-oriented procedures produce and display results as informative messages on the SAS Log. The first utility tool we will look at is known as PROC SORT. Used to rearrange one or more columns of data in either ascending or descending order, users are able to change the order of data for a more “custom” look and feel. In its most simplistic form, the syntax of PROC SORT appears below.
PROC SORT DATA=SAS-Dataset <OUT=SAS-Dataset>; BY <DESCENDING> variable-1; RUN;
SUGI 29 Tutorials
Using PROC SORT Suppose you had to rearrange the order of data in a SAS data set to reflect some other order. The SORT procedure enables one or more columns of data to be physically ordered in a SAS data set. The name of a data set is specified in the PROC SORT DATA= option and the name of the variable to rearrange data for in a BY statement. The following example illustrates the SORT procedure rearranging the MOVIES data set by the LENGTH (Movie Length) variable so the data appears in the data set in ascending order (shortest to longest movie length). Procedure Code:
PROC SORT DATA=SUGI.MOVIES; BY LENGTH; RUN;
The next example illustrates a two-way sort where the first variable, RATING, is ordered in ascending order and the second variable, LENGTH, is ordered in descending order as follows. Procedure Code:
PROC SORT DATA=SUGI.MOVIES; BY RATING DESCENDING LENGTH; RUN;
The second utility procedure, PROC DATASETS, is a powerful PROC for any SAS user to know. It provides all the tools necessary to manage a SAS data library and the members within it. Table 3 below illustrates the various statements and tasks the DATASETS procedure can perform. Since the DATASETS procedure is an interactive procedure (like the SQL procedure), it remains active even after a RUN statement is issued. To turn it off you issue a QUIT statement. The general form looks something like the following:
PROC DATASETS LIBRARY=libref; Datasets-statement _________________; QUIT;
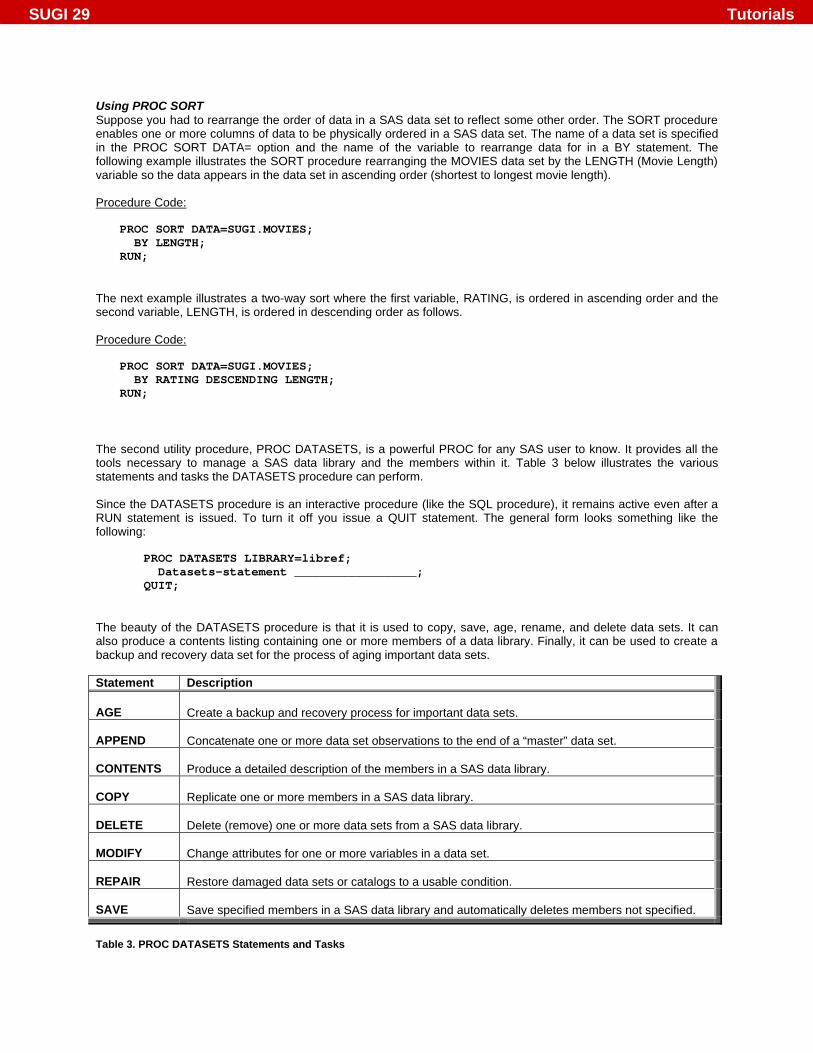
The beauty of the DATASETS procedure is that it is used to copy, save, age, rename, and delete data sets. It can also produce a contents listing containing one or more members of a data library. Finally, it can be used to create a backup and recovery data set for the process of aging important data sets. Statement Description AGE
Create a backup and recovery process for important data sets.
APPEND
Concatenate one or more data set observations to the end of a “master” data set.
CONTENTS
Produce a detailed description of the members in a SAS data library.
COPY
Replicate one or more members in a SAS data library.
DELETE
Delete (remove) one or more data sets from a SAS data library.
MODIFY
Change attributes for one or more variables in a data set.
REPAIR
Restore damaged data sets or catalogs to a usable condition.
SAVE
Save specified members in a SAS data library and automatically deletes members not specified.
Table 3. PROC DATASETS Statements and Tasks
SUGI 29 Tutorials

Describing Members of a Data Library Suppose you were asked to produce a contents listing of an important SAS data library. By using PROC DATASETS, a detailed member listing of any SAS data library can be generated easily and quickly. Procedure Code:
PROC DATASETS LIBRARY=SUGI; QUIT;
Results:
Aging for Backup and Recovery Purposes Being able to create a backup and recovery process for important data sets can be critical should disaster strike. One or more related data sets can be assigned an aging number corresponding to when it was last updated. Suppose you wanted to age the Movies data set by creating a safety net consisting of three versions of the data. The most recent version would be called MOVIES1, the next most recent version would be called MOVIES2, and the oldest and least recent version would be called MOVIES3. Procedure Code:
PROC DATASETS LIBRARY=SUGI; AGE MOVIES MOVIES1-MOVIES3; QUIT;
Analysis: When the DATASETS procedure is executed, the aging process automatically begins. Because only three data sets are specified in the AGE statement member list, a maximum of three aged data sets are retained. The process begins by first renaming the base data set MOVIES to the first member name in the list, the next most recent data set in the member list is renamed to the second name in the member list, the next most recent data set in the member list is renamed to the third name in the member list, and the oldest data set in the member list is deleted. The aging process is especially useful for important data sets that are updated frequently and a need exists for a simple and effective data recovery process to be implemented. Repairing Damaged Data Sets On rare instances where a system failure occurs (e.g., during a power brownout or electrical storm) during an update operation, a data set may become damaged an unusable. To fix a problem like this and restore a data set to a usable condition, it may be necessary to try to rebuild data set indexes. The PROC DATASETS REPAIR statement can be a life-saving statement (at least as it related to rescuing your damaged data set). Suppose during an unexpected power outage our computer system experienced a problem that caused the Movies data set to become damaged. You could the PROC DATASETS REPAIR statement to attempt to restore the data set back to usability. Procedure Code:
PROC DATASETS LIBRARY=SUGI; REPAIR MOVIES; QUIT;
SUGI 29 Tutorials

Results:
Conclusion Delivering timely and quality looking reports to management, end users, and customers is critical. With the SAS System’s "canned" PROCedures for generating quick results, users around the world appreciate the benefits of using these “tried and proven” productivity tools. Basic SAS PROCedures such as PRINT, SQL, and FORMS are frequently used for detail reporting; CHART, FREQ, MEANS, and UNIVARIATE provide the tools for summary reporting; and SORT and DATASETS are powerful tools for data manipulation and management. Each of these PROCedures are worth their weight in gold. So learn their syntax, use them wisely, and you will be quickly and frequently rewarded. Happy computing! Acknowledgments The author would like to thank the Tutorials Section Chairs Debbie Buck and Helen-Jean Talbott for their support and encouragement in the creation of this paper and presentation, and for inviting me as a speaker in the Tutorials Section at SUGI 29. I would also like to thank Duke Owen, SUGI 29 Conference Chair for all his hard work and for doing a great job as SUGI 29 Conference Chair. Thank you! References Delwiche, Lora D. and Susan J. Slaughter, “The Little SAS Book, A Primer (Second Edition)” SAS Institute Inc, 1998. Lafler, Kirk Paul, SAS® Fundamentals, Version 8 Course Notes, Revised and Updated 2001, Software Intelligence
Corporation, Spring Valley, CA, USA. Lafler, Kirk Paul, Basic “SAS PROCedures for Generating Quick Results,” SSU 2001. Trademark Citations SAS, SAS Alliance Partner, and SAS Certified Professional are registered trademarks of SAS Institute Inc. in the USA and other countries. ® indicates USA registration. About the Author Kirk Paul Lafler, a SAS Certified Professional® and SAS Alliance Partner® (1996 – 2002) with more than 25 years of SAS software experience, provides SAS consulting services and hands-on training around the world. Kirk has written four books including Power SAS by Apress and more than one hundred articles for professional journals and SAS User Group proceedings. His popular SAS Tips column, Kirk’s Korner, appears regularly in the BASAS, HASUG, SANDS, and SESUG Newsletters. His expertise includes application design and development, training, and programming using base-SAS, PROC SQL, ODS, SAS/FSP, SAS/AF, SCL, FRAME, and SAS/EIS software.
Comments and suggestions can be sent to:
Kirk Paul Lafler Author, Trainer, and Consultant
Software Intelligence Corporation P.O. Box 1390
Spring Valley, California 91979-1390 E-mail: [email protected]
Voice: 619.660.2400
SUGI 29 Tutorials