2.3 soil biology and ecology - center for agroecology ... soil biology and ecology introduction 85...
TRANSCRIPT
2.3
Soil Biology and EcologyIntroduction 85
Lecture 1: Soil Biology and Ecology 87
Demonstration 1: Organic Matter Decomposition in Litter Bags
Instructor’s Demonstration Outline 101
Step-by-Step Instructions for Students 103
Demonstration 2: Soil Respiration
Instructor’s Demonstration Outline 105
Step-by-Step Instructions for Students 107
Demonstration 3: Assessing Earthworm Populations as Indicators of Soil Quality
Instructor’s Demonstration Outline 111
Step-by-Step Instructions for Students 113
Demonstration 4: Soil Arthropods
Instructor’s Demonstration Outline 115
Assessment Questions and Key 117
Resources 119
Appendices
1. Major Organic Components of Typical Decomposer 121 Food Sources
2. Litter Bag Data Sheet 122
3. Litter Bag Data Sheet Example 123
4. Soil Respiration Data Sheet 124
5. Earthworm Data Sheet 125
6. Arthropod Data Sheet 126

Soil Biology & EcologyPart 2 – 84 | Unit 2.3

Soil Biology & Ecology Unit 2.3 | Part 2 – 85
Introduction
UNIT OVERVIEW
This unit introduces students to the biological properties and ecosystem processes of agricultural soils.
The lecture reviews the constituents of soils and the physical characteristics and soil ecosystem processes that can be managed to improve soil quality. Demonstrations and exercises introduce students to techniques used to assess the biological properties of soils. Such assessments help inform deci-sions about soil management with the goal of maintaining crop productivity and soil health in organic farming and gardening systems.
Introduction: Soil Biology & EcologyMODES OF INSTRUCTION
> LECTURE (1 LECTURE, 1.5 HOURS)The lecture covers the basic biology and ecosystem pro-cesses of soils, focusing on ways to improve soil quality for organic farming and gardening systems.
> DEMONSTRATION 1: ORGANIC MATTER DECOMPOSITION (1.5 HOURS)In Demonstration 1, students will learn how to assess the capacity of different soils to decompose organic matter. Discussion questions ask students to reflect on what envi-ronmental and management factors might have influenced the test results and what the results suggest about nutrient cycling rates and the quality/health of the soils tested.
> DEMONSTRATION 2: SOIL RESPIRATION (1 HOUR)Demonstration 2 covers the use of Draeger gas detection tubes for measuring carbon dioxide levels liberated from soils as an indicator of soil biological activity and soil qual-ity/health.
> DEMONSTRATION 3: EARTHWORM POPULATION (1 HOUR)Demonstration 3 takes students through the process of sampling soil for earthworm types. Discussion questions ask students to consider the presence and abundance of certain earthworm types as indicators of soil quality/health.
> DEMONSTRATION 4: SOIL ARTHROPODS (1 HOUR)Demonstration 4 covers the preparation and materials used to collect and identify soil arthropods. Discussion questions ask students to consider the presence and diversity of soil arthropods as indicators of soil quality/health.
> ASSESSMENT QUESTIONS (1 HOUR)Assessment questions reinforce key unit concepts and skills.
LEARNING OBJECTIVES
CONCEPTS
Soil Biology & Ecology Part 2 – 86 | Unit 2.3
Introduction
SKILLS
through measuring the rate of decomposition of cellulose
measuring soil respiration
earthworm census
through a soil arthropod census
Soil Biology & Ecology Unit 2.3 | Part 2 – 87
Lecture 1: Soil Biology & Ecology
Lecture 1: Soil Biology & EcologyPre-Assessment Questions 1. What is soil? 2. What forms of life exist in soil ecosystems? 3. How would you define a “healthy” agricultural soil? 4. What is a food web? 5. Can you describe a decomposer food web that may exist in the soil? 6. What might be some negative effects of the long-term practice of monoculture cropping
and the use of synthetic chemical fertilizers and pest control agents on the soil ecosystem?
A. What Is Soil? (should be a review in part; see also Unit 2.1, Soils and Soil Physical Properties) 1. Soil components a) Mineral i. Derived from parent material b) Soil organic matter c) Water and air i. 1/2 soil volume = pore space ii. Importance of gas diffusion: When diffusion is slow, as with water-saturated soil,
respiration byproducts (such as CO2) accumulate and inhibit aerobic processes (such as respiration itself )
iii. CO2 is about 1% in dry soil, up to 10% in saturated soil d) Biota: The smallest life forms are inseparable from soil organic matter 2. Soil structure vs. soil texture a) Soil texture, a native characteristic i. Soil texture: The relative percentage of sand, silt, and clay particles ii. The bricks, boards, and mortar (the physical materials) that make up soil iii. The particle sizes have surface area:volume effects. This influences properties such as
cation exchange capacity (CEC), pore space, water holding capacity, and aggregate formation.
b) Soil structure, a manageable characteristic i. Soil structure: The arrangement of soil particles. The “architecture” of soil—what
shapes you build with the “bricks, boards and mortar.” ii. Determines movement of gases and water in soil iii. Creates small habitat spaces iv. Water stability: Aggregates that retain shape when wetted maintain a more stable
soil structure v. Influences soil tilth/soil health
B. What Is a Healthy Soil? (see also Unit 1.1, Managing Soil Health) 1. Question: Is soil merely a solid medium that holds nutrients for plant growth or does soil
serve other functions? 2. Soil health and soil quality are generally synonymous 3. Definition of soil health: “Capacity of a soil to function, within land use and ecosystem
boundaries, to sustain biological productivity, maintain environmental quality, and promote plant, animal, and human health.”
Soil Biology & Ecology Part 2 – 88 | Unit 2.3
Lecture 1: Soil Biology & Ecology
a) Soil is recognized as an essential component of the biosphere b) Soil is required for significant production of food and fiber c) Soil contributes to maintaining and enhancing air and water quality d) Soil filters and chemically alters water e) The definition of soil health must be broad enough to encompass the many functions of
soil 4. Assessment of soil health a) Analogous to monitoring human health b) Indicators needed to identify problems and to monitor the effects of management c) Requires a holistic approach d) Should include physical, chemical, and biological attributes of soil e) Indicators must be measurable by as many people as possible, at many different skill
levels f ) Definition and assessment of soil quality is complicated by the fact that soil is not
(typically) directly consumed by animals and humans, unlike air and water g) Basic data set of soil health indicators i. Soil texture ii. Rooting depth iii. Water infiltration iv. Bulk density v. Water holding capacity vi. Soil organic matter vii. pH viii. Cation exchange capacity (CEC) ix. Extractable N, P, and K x. Microbial biomass C and N xi. Potentially mineralizable N xii. Soil respiration xiii. Soil temperature 5. Protection of soil health as a national priority a) National Research Council recommendation (1993): “Protecting soil quality,
like protecting air and water quality, should be a fundamental goal of national environmental policy”
b) National Resource Conservation Service (2012): Healthy soils initiative called “Unlock the Secrets of the Soil” (www.nrcs.usda.gov/wps/portal/nrcs/main/national/soils/health/)
c) USDA Sustainable Agriculture Research and Education program (2014): Organized National Conference on Soil Health and Cover Crops (www.sare.org/Events/National-Conference-on-Cover-Crops-and-Soil-Health)
C. Nutrient Cycling and Decomposition 1. Mineralization/immobilization a) Soil nutrients occur as parts of: i. Inorganic compounds: Some of these are available to plants ii. Organic compounds: Are part of living organisms and decaying organic matter.
These nutrients are stored (“immobilized”) in the biomass of the organisms and are unavailable until released during decay or consumption.
b) Soil organisms are constantly transforming nutrients between these 2 forms

Soil Biology & Ecology Unit 2.3 | Part 2 – 89
Lecture 1: Soil Biology & Ecology
c) Mineralization: Soil organisms excrete inorganic waste compounds that may adhere to CEC sites and/or dissolve in soil water (soil solution) for possible uptake by crop plants. Net mineralization must be greater than net immobilization for nutrients to be available to crop plants.
d) Immobilization: Soil organisms consume inorganic compounds to construct living tissues. These nutrients are temporarily stored and unavailable for plant uptake.
2. Soil organic matter (SOM): Includes all organic substances in or on the soil a) Living organisms—include plant roots and all soil biota (< 5% of SOM) i. Cellulose, the major carbohydrate structural building block for plants, is the most
abundant compound on earth and the major component of soil organic matter ii. Lignin is the second largest input into SOM b) Fresh and decomposing organic residues (40–60% of SOM) i. Easily decomposable (active, labile) fraction: The quantity of this fraction of SOM
changes quickly in response to management practices and is the organic matter fraction from which the majority of plant nutrients are liberated into the soil solution for uptake by plants
ii. Moderately decomposable fraction: This fraction is physically and/or chemically more complex than labile OM. Its decomposition is slower and therefore fewer nutrients are mineralized from it in a given season.
c) Resistant (recalcitrant) fraction: Also called humus, and is resistant to further decomposition (33–50% of SOM). Has greater influence on the structure/physical properties of soils than on nutrient availability.
d) See Appendix 1, Major Organic Components of Typical Decomposer Food Sources e) Physical factors influencing decomposition i. Particle size: High surface area:volume = more rapid decomposition. For example, flail
mowing breaks cover crops into smaller pieces for more rapid decomposition prior to planting a subsequent crop.
ii. Some surface properties of plants (e.g., waxes, pubescence) decrease the rate of decomposition
iii. High content of structural compounds, e.g., lignin that supports woody plant stems, decreases the rate of decomposition
f ) Limiting factors in decomposition of SOM i. Nutrient availability: Decomposers tend to concentrate the nutrients that are in short
supply, e.g., N, P, and K. Micronutrients are not usually a limiting factor. ii. C:N ratio of organic matter: High abundance of C compared to N slows the
decomposition process. If C:N < 20–30:1 = net mineralization. If C:N > 20–30:1 = net immobilization
iii. Soil moisture: Necessary for respiration by organisms doing the decomposition iv. Oxygen levels: Also necessary for respiration by decomposers g) Plant secondary compounds may inhibit decomposition (such as polyphenols, tannins
found in many woody perennials) 3. Nitrogen cycle (see t Figure 2.10 in Unit 2.2, Soil Chemistry and Fertility) a) Proteins break down —> amino acids —> ammonium (form of N usable by some plants)
—> nitrate (form of N usable by most plants) b) Ammonification (aerobic or anaerobic): The biochemical process in the N cycle above
whereby ammonium is released from nitrogen-containing organic compounds (amino acids)
Soil Biology & Ecology Part 2 – 90 | Unit 2.3
Lecture 1: Soil Biology & Ecology
c) Nitrification (aerobic): The biochemical process in the N cycle above whereby bacteria convert ammonium to nitrate
i. Inhibited by low oxygen or low temperatures ii. This leads to ammonium build-up in cold, wet soils
D. Soil Food Webs 1. Soil food web ecology a) Food webs trace the path of energy or nutrients passing from one organism to the next 2. Heterotrophs vs. autotrophs in food webs a) Autotrophs form the base of food webs, and acquire their own C from the atmosphere.
In the soil food web, this begins with C fixation by plants, which is photosynthesis. Energy for most life is derived from sunlight that has been transformed by photosynthetic plants into organic compounds.
b) Heterotrophs in food webs consume organic matter to acquire carbohydrates for respiration. By consuming organic matter, they release nutrients, making them available to other plants and animals, or become food themselves for other organisms.
c) Energy loss = 80–90% at each step in the food chain d) Food web structure and properties i. Resilience = speed of recovery after disturbance. Resilience decreases with increasing
number of trophic levels due to increasing complexity—it takes longer to reestablish complex food web relationships
ii. Disturbance selects for shorter food chains: In farmed soils, disturbance can be chemical (pesticides, fertilizers) or physical (cultivation, organic matter incorporation, removal of surface organic layer)
*The frequency of soil disturbance by physical or chemical agricultural inputs and other disturbances is important to the overall assemblage of soil biota and food chain length
iii. Fungi:bacteria biomass ratio characteristics of soil ecosystems
bacterial-dominated food webs with rapid cycling of nutrients.
e) Some heterotrophic roles in soil food webs i. Shredders: Shred organic matter, increasing the surface area and making the food
available to more microorganisms. These include earthworms and arthropods. ii. Grazers: Feed on bacteria and fungi, stimulating and controlling the growth of those
populations. Grazers include protozoa, nematodes, and microarthropods. iii. Higher-level predators: Consume other heterotrophs, like grazers and shredders,
helping control the lower trophic-level predator populations f ) Unique food web for each ecosystem, determined by: i. Climate ii. Soil/parent material iii. Vegetation iv. Land management practices
Soil Biology & Ecology Unit 2.3 | Part 2 – 91
Lecture 1: Soil Biology & Ecology
E. Soil Biota 1. Community characteristics a) High diversity of organisms in soil can rival that of coral reef ecosystems b) High abundance of organisms, on the order of hundreds of millions to billions of
microbes in 1 g of soil c) High biomass of organisms, e.g., from hundreds to thousands of pounds of microbes per
acre of soil 2. Habitats a) Habitats within soil ecosystems are unevenly distributed b) Habitats are concentrated at organic matter sites i. Root zone (rhizosphere)
sugars and amino acids) may stimulate microorganisms and thus increase labile SOM
ii. Litter (dead organic matter on the soil surface) iii. Surfaces of soil aggregates iv. Incorporated organic matter 3. Functional classification a) Microorganisms i. Colonial growth forms (cells about 1/25,000 inch wide)
byproducts of which help in the formation of soil aggregates), pathogens ii. Mycelial growth forms (hyphae length ranges from a few cells to many yards)
nematode-trapping fungi) iii. Algae
available, too
b) Microfauna Note: This section and the macrofauna section below are based on information from the
European Atlas of Soil Biodiversity; see Resources for details i. Protozoans (1/5000 inch to 1/50 inch wide)

Soil Biology & Ecology Part 2 – 92 | Unit 2.3
Lecture 1: Soil Biology & Ecology
– Colpoda divide once or twice per day at 12oC
– Ciliates have fringe of small hairs used for locomotion – Amoebae have an amorphous body shape – Flagellates have a whip-like tail for locomotion
(feed on detritus) ii. Nematodes (1/500 inch in diameter, 1/20 inch in length)
2
iii. Rotifers (1/50 to 1/120 inch long)
or litter (32,000 to 2 million per m2)
filter feeding on bacteria, yeast, and algae in the soil water
iv. Tardigrades (1/25 inch)
rotifers or nematodes and suck out fluids; others consume whole microfauna
v. Functional roles of microfauna do not include shredding of organic matter into smaller pieces
c) Mesofauna i. Potworms (Enchytraeida, 1/50 to 2 inches long)
2 in high organic matter soil
ii. Collembolans (springtails, 1/100 to 4 inches long)
arthropods

Soil Biology & Ecology Unit 2.3 | Part 2 – 93
Lecture 1: Soil Biology & Ecology
iii. Mites (acari, 1/125 to 1/30 inches long)
arthropods (1000 to 10,000 per m2)
iv. Insect larvae
order Diptera) can play a key role in consuming organic matter, on par with earthworms
(feeding on detritus) v. Symphyla (1/125 to 1/30 inches)
root hairs in agroecosystems, thus damaging crops when they do
vi. Overall, mesofauna regulate microfauna (and other mesofauna!) by grazing vii. Minor shredding of organic matter viii. Total of 500 to 200,000 per square meter, far less abundant and with lower biomass
than microfauna d) Macrofauna i. Earthworms (1/3 to 45 inches long)
on litter from the surface mixed with ingested soil; endogeic—small, live in temporary burrows in the soil, feed on rich soils to obtain nutrients from organic matter; epigeic—small, live at the soil surface in litter, feed on litter there
microbes living on the organic residues they ingest
substrates, soil structure, etc.
ii. Myriapods
11 inches long)
organic matter, others are predators on arthropods or earthworms, others pierce and suck plant cells. More common in soils high in calcium carbonate (e.g., from limestone); 15 to 800 per m2.
and narrow species of centipedes live in deeper soil layers. They are primarily generalist predators consuming insect adults and larvae, collembolans, mites, nematodes, potworms and earthworms, and occasionally leaf litter; 20-300 per m2.

Soil Biology & Ecology Part 2 – 94 | Unit 2.3
iii. Isopods (woodlice, 1/15 to 2 inches long)
predators of bacteria, fungivores, or herbivores iv. Mollusks (snails and slugs, ¼ inch to 10 inches)
conditions)
ecological significance (especially when populations near ½ million per acre)
near the ground, but also detritivores v. Insects
roles in the soil food web. Two examples include: – Ants: Ant diversity can be very high, with tens to hundreds of species in a few
acres. Ants fulfill multiple trophic roles, e.g., herbivores, predators, scavengers, parasites.
– Carabid beetles: Both larvae and adults may live in the soil. May be predators, e.g., feeding on snails or collembola, fungivores, frugivores (eating seeds), or herbivores.
vi. Macrofauna shred and incorporate plant remains (may become pests by feeding on living plants if insufficient organic residues present)
vii. Also alter the soil structure, e.g., by burrowing, mixing, defecating, and helping form soil aggregates
e) Megafauna i. Large invertebrates, vertebrates, including moles, mice, rabbits, gophers, snakes, and
lizards ii. Primary ecosystem engineers of the soil: Important for moving and turning soil,
contributing to nutrient cycling, aeration, and drainage iii. Fill a range of functional roles: Herbivores and predators of invertebrates and small
vertebrates
F. Rhizosphere Ecology 1. Definitions a) Rhizosphere (R): The narrow zone of soil subject to the influence of living roots, as
manifested by the leakage or exudation of substances that promote or inhibit microbial activity
b) Rhizoplane (r): The actual root surface, which provides a highly favorable nutrient base for many species of bacteria, archaea and fungi
c) Edaphosphere (S): Soil beyond root influence d) Rhizosphere Effect: Soil microorganisms are stimulated by the roots i. R:S ratio generally greater than 1 (i.e., more biota in R than in S) e) Rhizosphere succession: The sequence of changes in the composition and densities of
soil microbes and fauna in the area surrounding a growing root (see below)
Lecture 1: Soil Biology & Ecology

Soil Biology & Ecology Unit 2.3 | Part 2 – 95
Lecture 1: Soil Biology & Ecology
2. Roots a) Root environment i. Determined by above-ground processes (products of photosynthesis are
translocated to roots) ii. Exudates (see below), sloughed hairs, and epidermal (root’s surface) cells feed soil
organisms in R and r iii. Plant roots also can release bicarbonate (HCO3-), which raises the soil pH. This can
make some cations (e.g., Fe+3, Ca+2, Mg+2, and K+1) unavailable to plants. Irrigation water may also contain bicarbonate and affect soil pH and availability of some nutrients.
iv. Oxygen decreases, CO2 increases in root zone over time due to plant and R organism respiration
b) Root form i. Fibrous roots
ii. Tap roots
iii. Root depth
c) Root structure i. Root cap
ii. Meristematic zone: 2 mm (.08 inch) zone where most cell division happens iii. Zone of elongation: Rapid growth, cells from meristem iv. Mucilage
with nutrient uptake, prevents drying, fills spaces between root and soil and helps bind soil aggregates, food for microbes, including beneficial microbes
v. Root hair (differentiation) zone
per day
and water uptake. Root hairs make up the majority of root surface area.
of soil organic matter vi. Lateral roots

Soil Biology & EcologyPart 2 – 96 | Unit 2.3
vii. Vascular bundle
products (sugars) to the roots and of water and nutrients from the soil up to the aboveground portion of the plant
rhizosphere were suppressed by the streptomycin d) Root nutrition i. Maximum nutrient uptake occurs behind meristem (in the elongation and root hair
zones) ii. Water and nutrients are withdrawn from narrow band around roots iii. Replenished from surrounding soil by mass flow (the movement of nutrients with
the overall flow of water to plant roots); all ions in solution move towards root during mass flow
iv. If mass flow is slower than uptake, a depletion zone is created around the root, resulting in lack of some nutrients
v. If uptake is slower than mass flow for a particular ion (or even nonexistent if the ion is not used by the plant) certain ions may accumulate around the root
e) Root exudates i. Amounts
is present as fibrous roots at end of growing season = substantial contribution to SOM
– Wetting, after a drying spell – Physical or chemical injury (e.g., mowing, grazing of perennial grass cover crop) – Abrasion, phytotoxic residues, osmotic stress
ii. Types
– 10 sugars, glucose and fructose most common – 25 amino acids
factors
iii. Exudates released from meristem zone
f ) Management effects on rhizosphere i. Synthetic fertilizers
R:S indirectly through stimulation of plant growth ii. Organic manures
R:S
Lecture 1: Soil Biology & Ecology

Soil Biology & Ecology Unit 2.3 | Part 2 – 97
Lecture 1: Soil Biology & Ecology
R:S ratio since edaphic (S) microbes are also stimulated by organic matter input
R:S generally increases 3. Soil organisms a) Bacteria and archaea i. Most responsive to plant exudates ii. 2 to 20 fold increase in bacterial populations in R vs. S iii. Pseudomonas most consistently abundant in rhizosphere iv. Also Rhizobium (some are used in DNA transfer as part of genetic engineering) and
Achromobacter v. Azotobacter, non-symbiotic nitrogen fixer
vi. Rhizobium, Nitrosomonas, and Nitrobacter, all important to the nitrogen cycle (see t Figure 2.10 in Unit 2.2), common in R
b) Fungi i. Average increase of 10 to 20 fold in R of crop plants from S ii. Fusarium is a dominant genera of R fungi iii. Mycorrhizae can provide physical and chemical suppression of pathogens c) Protozoans i. Mainly bacteria grazers, so some increase is expected in R ii. Example: In a wheat field, bacteria R:S was 23:1, protozoan R:S was 2:1 iii. Some large amoebae may provide biocontrol of some fungi d) Nematodes i. Root substances stimulate egg hatching of some parasitic nematodes ii. Host and non-host plants may stimulate hatching of nematodes, e.g., some crucifers
and chenopods stimulate Heterodera hatching, but don’t support root invasion by larvae. Some plants will cause eggs of parasitic nematodes to hatch, but then are not susceptible to attack by the parasite. Therefore the plant stays healthy, and the nematodes fail to thrive.
iii. Nematodes tend to congregate around elongation zone of roots iv. Degree of nematode attraction is proportional to root growth rate v. Some root exudates repel nematodes (e.g., isothiocyanates in mustard) e) Microarthropods i. Some grazers consistently more abundant around roots f ) Rhizosphere succession i. Root tip releases labile carbon ii. Labile carbon stimulates rapid increase of microbes and thus nutrient immobilization
in R iii. Grazers increase, tracking the microbe population increases iv. Water and carbon in root hair zone decrease v. Microbes eventually decrease; grazers cause net mineralization and release of
nutrients from SOM vi. Later, grazers encyst or migrate

Soil Biology & Ecology Part 2 – 98 | Unit 2.3
G. Management Effects on Soil Ecosystems 1. No-tillage or reduced-tillage cropping systems a) Organic litter is retained on the soil surface b) Physical disturbance is minimized c) Surface soil stays cooler and moister d) More surface organic matter available as food substrate e) Ratio of fungi to bacteria increases over time f ) Earthworms and arthropods become more plentiful g) Effects on nutrient cycling: May increase total soil N, improve N use efficiency of plants,
but may increase N2O emissions h) Effects on soil physical properties: May increase SOM and aggregation 2. Rotations a) Monocultures and clean cultivation i. Create little habitat for soil organisms, leading to less abundant and diverse soil
ecosystems ii. Consistent plant hosts may serve to develop populations of pathogenic organisms,
causing pest problems and crop losses that facilitate the need for pesticide use. b) Complex rotations i. Result in greater variety of microbial food sources (roots, root exudates, and residues) ii. Increase diversity of soil organisms, leading to increased competition for resources,
as well as predation of pathogens and pests iii. Interrupt plant-host pest cycles c) Multiculture or polyculture i. Growing more than one crop in one field ii. More closely mimics natural ecosystem iii. Likely to support even greater diversity of soil organisms, especially invertebrates iv. Also interrupts plant-host pest cycles 3. Biocides (insecticides, herbicides, fungicides) a) Effects vary depending on: i. Type of chemical ii. Species of soil organism in question iii. Concentration and other exposure factors b) High levels of pesticide use generally reduce food web complexity i. Methyl bromide and other fumigants are extreme examples, resulting in temporary
soil sterilization ii. Eliminate most organisms iii. Some bacteria quickly return iv. Other organisms only slowly return c) Biocides and predator-release phenomenon i. In cases where biocides selectively eliminate predators, lower trophic levels may
become more abundant ii. Destabilizing effect on food webs
Lecture 1: Soil Biology & Ecology

Soil Biology & Ecology Unit 2.3 | Part 2 – 99
necessarily compatible with crop needs. May result in leaching of water-soluble nutrients, especially forms of N.
d) Earthworms i. Most strongly affected (negatively) by fungicides and fumigants ii. Herbicides
4. Food web structures a) Fungi/bacteria ratio b) Dominant microbe influences other trophic levels 5. Interaction with fertility needs (also see Unit 1.1) a) Measures of available nitrogen i. Conventional cropping systems
available to plants
ii. Cropping systems based on organic matter management
levels of N at any given time because much of soil N is immobilized
conventional system
incorporation of high-OM nutrient amendments, irrigation) by soil food web becomes more critical
Lecture 1: Soil Biology & Ecology

Soil Biology & Ecology Part 2 – 100 | Unit 2.3
Soil Biology & Ecology Unit 2.3 | Part 2 – 101
Instructor’s Demonstration 1 Outline
Demonstration 1: Organic Matter Decomposition in Litter Bags for the instructorOVERVIEW
To demonstrate the capacity of different soils to decompose organic matter, this exercise requires you to bury cellulose disks (Whatman filter paper) in a variety of locations. This should be done at least two weeks prior to the class to allow decomposition to proceed before the disks are retrieved on the day of the class. To accelerate decomposition, filter paper disks can be dipped in a bucket of water with some fish emulsion added just before burial.
MATERIALS NEEDED
†
†obtained from a local feed and seed supply. It is a 3/8-inch polypropylene mesh. Cut the mesh into 6-inch x 12-inch pieces, fold in half, then fold the edges over and staple the edges shut. Other sources are the mesh bags that bulbs are sold in, garlic or onion bags, or the mesh bags that imported rice noodles are packed in. The smaller the
from the bag. This feature can be exploited by comparing decomposition rates of organic matter buried in bags of
mesh will be decomposed primarily by microflora and microfauna. Organic matter in larger mesh bags will also be decomposed by larger fauna.
PREPARATION
A minimum of 3 bags should be placed in each
vermicompost bins, weedy borders, and on the soil
Soil Biology & Ecology Part 2 – 102 | Unit 2.3
Instructor’s Demonstration 1 Outline
PROCEDURE
1. After two weeks, bring students out to the sites and ask them to observe the biotic, abiotic, and human management elements of the soil habitat that each bag was in, noting features such as relative soil moisture,
cover and shading, and prior cultivation.
2. Students or the instructor can unbury the bags. This should be done very gently, as the
decomposition makes this demonstration
cotton is entirely degraded, the polyester matrix will remain intact. Strips would have to be weighed before and after burial to
3. Gently brush soil from discs. Ask students to visually estimate the percentage of the disc remaining. You may wish to provide a sheet showing examples of visual estimates of
percentage of the disc remaining for each habitat selected. A sample form is provided
recording data. Appendix 3 provides an
PREPARATION TIME
1 hour to make 24 bags, 1 hour to bury 24 bags
DEMONSTRATION TIME
1.5 hours
DISCUSSION QUESTIONS
1. After retrieving the litter bags, ask students to offer hypotheses about why the disks decompose more rapidly in some habitats than others.
influenced the results?
influenced the results?
4. Can you see any signs of biological activity
cycling rates in the soils tested?
6. Can these observations for cellulose decomposition rates be extrapolated to other types of organic matter?
VARIATIONS
If possible, pair the litter bag demonstration with other methods of assessing biological activity, such as:
requires more extensive lab work, but you might check with local agricultural or ecological researchers to see if anyone doing similar work could accommodate a few samples and help

Soil Biology & Ecology Unit 2.3 | Part 2 – 103
Students’ Step-by-Step Instructions, Demonstration 1
Demonstration 1: Organic Matter Decomposition in Litter Bags step-by-step instructions for students
INTRODUCTION
The decomposition of organic matter is an important soil process for organically managed farms and gardens. Organic matter includes a vast array of compounds that are biologically decomposed at various rates, depending on the compounds’ physical and chemical complexity. Physical factors such as temperature and moisture as well as biological factors such as activity of soil organisms heavily influence decomposition rates, and are all influenced by management practices.
We can use discs of filter paper to represent uniform pieces of cellulose-rich organic matter. If discs are placed in the soil for a set period and then retrieved, we can begin to understand the capacity of various soils to decompose cellulose. By placing the discs in plastic mesh bags prior to putting them in the soil, we make it easier to retrieve the discs intact. Decomposition can be esti-mated by a visual estimate of percentage surface area remaining. A more quantitative method is to weigh the discs prior to put-ting them in the field, then collecting them, rinsing them, drying them (e.g., in a drying oven) and reweighing them to estimate mass loss.
MATERIALS NEEDED
PREPARATION
1. Litter bags, each consisting of a filter paper disc placed inside a plastic mesh bag, were placed in soil at least two weeks prior to this class. They were placed vertically in the soil, all at the same depth. For a 10 cm disc, 0 to 10 cm is a convenient depth, but your instructor will tell you the actual depth used.
Depth of litter bags:______________________.
PROCEDURE
1. With your instructor, visit each site where the litter bags have been buried. At each site, observe the biotic, abiotic, and human management elements of the soil habitat that each bag was in.
dry, or in between?
organisms? Are there burrows or tunnels, and if so, are they large or small? What kind of organisms might be using them?
(grasses, broad-leaf plants, woody shrubs, weeds, crops) and what size (overhead, several feet, close to the ground)? Do the plants shade the soil?
2. Unbury the litter bags. This should be done very gently, as the paper is likely to be very fragile.
3. Gently brush soil from discs. Visually estimate the percentage of the disc remaining.
Soil Biology & EcologyPart 2 – 104 | Unit 1.1
4. Record results and calculate the average percentage of the disc remaining for each habitat, using the data sheet supplied.n.
DISCUSSION QUESTIONS
1. After retrieving the litter bags, ask students to offer hypotheses about why the disks decompose more rapidly in some habitats than others:
a. What environmental factors might have influenced the results?
b. What management factors might have influenced the results?
c. Can you see any signs of biological activity on the disks (e.g., fungal mycelia, soil animals, invertebrate feces)?
2. What do the results suggest about nutrient cycling rates in the soils tested?
3. Can these observations for cellulose decomposition rates be extrapolated to other types of organic matter?
4. What are the limitations of this method?
Students’ Step-by-Step Instructions, Demonstration 1

Soil Biology & Ecology Unit 2.3 | Part 2 – 105
Instructor’s Demonstration 2 Outline
Demonstration 2: Soil Respirationfor the instructor
OVERVIEW
Soil microbes breathe in oxygen and breathe out carbon dioxide; using Draeger gas detection tubes to measure the carbon dioxide output gives an indication of the relative activity of the microbes. The brief instructions below point the instructor to comprehensive directions in the Soil Quality Test Kit Guide published by the NRCS: www.nrcs.usda.gov/wps/portal/nrcs/detail/soils/health/assessment/?cid=nrcs142p2_053873. Follow the link to Soil Respiration Test for directions and photos.
MATERIALS
Guide for the full list. Among more common items such as a soil thermometer and stopwatch, you will also need to
holes with stoppers, allowing equipment such as soil ther-mometers and Draeger tubes to be inserted. The Draeger tubes will need to be specially ordered, e.g., from a scien-
PREPARATION
www.nrcs.usda.gov/wps/por-tal/nrcs/detail/soils/health/assessment/?cid=nrcs142p2_053873.
Soil Respiration Test for directions and photos for the complete preparation needed for the demon-stration. In addition to gathering and constructing materi-als, the site will need to be brought to proper soil moisture.
dry, a second respiration measurement should be made at
saturated, soil respiration is inhibited, and this test should not be run.”To save time during the demonstration, rings can be placed and soils wetted the previous day. It may be
respiration measurements, allowing students to compare results from two different methods of measuring soil bio-logical activity.
the litter bag demonstration, select a variety of habitats to
weedy borders.
PROCEDURE
Divide class in teams of two or more, and assign each team
equipment prepared at different stages, à la Julia Child. Use one ring to show how rings should be placed and head-
Soil Biology & Ecology Part 2 – 106 | Unit 2.3
Instructor’s Demonstration 2 Outline
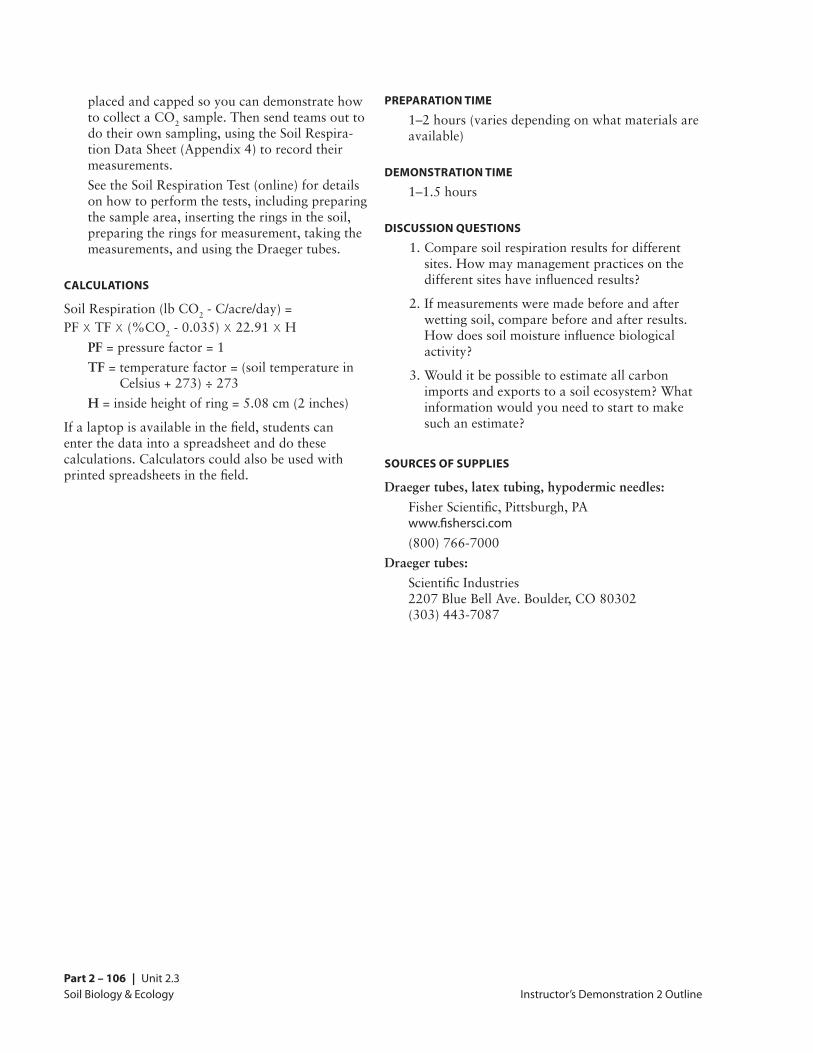
placed and capped so you can demonstrate how to collect a CO2 sample. Then send teams out to
-
measurements.
on how to perform the tests, including preparing the sample area, inserting the rings in the soil, preparing the rings for measurement, taking the measurements, and using the Draeger tubes.
CALCULATIONS
2 x x 2 x 22.91 xPFTF
H
enter the data into a spreadsheet and do these calculations. Calculators could also be used with
PREPARATION TIME
DEMONSTRATION TIME
1–1.5 hours
DISCUSSION QUESTIONS
1. Compare soil respiration results for different
different sites have influenced results?
2. If measurements were made before and after wetting soil, compare before and after results.
activity?
information would you need to start to make such an estimate?
SOURCES OF SUPPLIES
Draeger tubes, latex tubing, hypodermic needles:
www.fishersci.com
Draeger tubes:

Soil Biology & Ecology Unit 2.3 | Part 2 – 107
Students’ Step-by-Step Instructions, Demonstration 2
Demonstration 2: Soil Respirationstep-by-step instructions for students
INTRODUCTION
Soil is alive, teeming with organisms that are eating, growing, breathing, and reproducing. Many of these organisms, from microorganisms such as bacteria and archaea, to macroorganisms such as earthworms and insects, and even plant roots, take in oxygen (O2) and release carbon dioxide (CO2). The release of CO2 from the soil is called soil respira-tion and is a key component of healthy agroecosystems.
Soil respiration can be limited by soil mois-ture, temperature, and oxygen availability Optimal respiration rates usually occur around 60% of water-filled pore space, with lower rates when the soil is either dry or saturated with water. Biological activity doubles for every 18˚F rise in temperature until the optimal temperature is reached, although this optimum level varies for different organ-isms. Activity then declines as temperature rises above optimum. The most efficient soil organic matter decomposers are aerobic, so soil respiration rates are highest where there is high O2 availability, such as in well-aggregated soil with many macropores, and decline when O2 concentrations are low, as in soils that are saturated with water. Note that soil respiration is highly variable both spatially and seasonally, especially as soil moisture, temperature, and oxygen availability change, so it’s important to keep these factors in mind when interpreting your results.
Soil respiration also depends on the availability of decomposable organic substrates, that is, all the bits of organic matter of various sizes that are food for micro- and macroorganisms. Additions of organic materials will generally increase soil respiration. Organic materials with low carbon to nitrogen (C:N) ratios (e.g., manure, leguminous cover crops) are easily decomposed, so the addi-tion of these materials to soil will increase soil respiration quickly. Materials with high C:N ratios (e.g., compost, sawdust) decom-pose more slowly but provide a more stable, long-term supply of organic material than legumes and manure. C:N that is too high has drawbacks: Soil microbes will compete with crop plants for the limited nitrogen supply when soil is amended with products hav-ing C:N ratios higher than 25:1.
The history of the sampling site is also important. Tillage or cultivation loosens the soil and creates better O2 accessibility, increasing decomposition of organic matter and respiration rates. However, high respiration rates without adequate replenishing of organic materials can result in net loss of soil carbon. Use of agricultural chemicals that directly kill or otherwise impair soil microorganisms, such as fungicides and nematocides, on the site is also important to consider. Although these pesticides target pathogenic organisms, they may also impair the beneficial organisms and temporarily decrease soil respiration.

Soil Biology & EcologyPart 2 – 108 | Unit 2.3
Management factors influencing soil respiration
INCREASES SOIL RESPIRATION
• Adding organic amendments, such as cover crops, composts (including composted manure), and crop residues
• Irrigating to proper moisture content
• Tillage
DECREASES SOIL RESPIRATION
• Removing or burning crop residues
• Continuous tillage without organic matter replacement
• Chemical pesticides (e.g., fungicides and nematocides)
MATERIALS
Soil Respiration Test in the NRCS Soil Quality Test Kit Guide Procedure
Follow the instructions from the Soil Respiration Test, as provided by your instructor.
CALCULATIONS:
Soil Respiration (lb CO2 -C/acre/day) = PF x TF x (%CO2 - 0.035) x 22.91 x H
PF = pressure factor = 1
TF = temperature factor = (soil temperature in Celsius + 273) ÷ 273
H = inside height of ring = 5.08 cm (2 inches) if not measured
Interpretation of soil respiration values In general, a higher respiration rate indicates better soil quality. A high soil respiration rate, indicative of high bio-logical activity, can be a good sign of rapid decomposition of organic residues into nutrients avail-able for plant growth. A low respiration rate, when soil temperature and moisture are favorable for biological activity, would indicate too little organic matter input (i.e., the soil organisms have too little organic matter to consume). Some general guidelines to interpreting respiration values are presented in u Table 2.13. These are only guidelines and should not be applied to every soil type and management situation.
Students’ Step-by-Step Instructions, Demonstration 2
u TABLE 2.13 | GENERAL SOIL RESPIRATION CLASS RATINGS AND SOIL CONDITION AT OPTIMUM SOIL TEMPERATURE AND MOISTURE CONDITIONS, PRIMARILY FOR AGRICULTURAL LAND USES (Woods End Research, 1997)
SOIL RESPIRATION CLASS SOIL CONDITION(lbs. CO2-C/ac/day)
0 No soil activity Soil has no biological activity and is virtually sterile
< 9.5 Very low soil activity Soil is very depleted of available organic matter and has little biological activity
9.5 – 16 Moderately low soil activity Soil is somewhat depleted of available organic matter, and biological activity is low
16 – 32 Medium soil activity Soil is approaching or declining from an ideal state of biologi-cal activity
32 – 64 Ideal soil activity Soil is in an ideal state of biological activity and has adequate organic matter and active populations of microorganisms
> 64 Unusually high soil activity Soil has a very high level of microbial activity and has high levels of available organic matter, possibly from the addition of large quantities of fresh organic matter or manure

Soil Biology & Ecology Unit 2.3 | Part 2 – 109
DISCUSSION QUESTIONS
1. Compare soil respiration results for different sites. How may management practices on the different sites influence results?
2. If measurements were made before and after wetting soil, compare the before and after results. How does soil moisture influence biological activity?
3. Would it be possible to estimate all carbon imports and exports to a soil ecosystem? What information would you need to start to make such an estimate?
These guidelines are rules of thumb, but the soil respi-ration rate must be interpreted within the context of other indicators. For example, if the soil has very low nitrate concentrations and high respiration rates, there may be high nitrogen immobilization (when microbes bind up nitrogen in organic forms, so it’s not available to other organisms, such as plants); this can result from adding soil amendments that have high C:N ratios.
Similarly, as mentioned in the introduction, high respi-ration rates without adequate input of organic matter can indicate too much decomposition, leading to a de-crease in the stable component of soil organic matter. This then decreases the key properties of soil organic matter, such as aggregation, cation exchange, and water holding capacity, that make it such an important part of soil health. High respiration rates can hap-pen immediately following a tillage operation, due to exposure of organic matter to organisms and oxygen, as well as after rainfall. The increase in soil respiration is affected by the length of time the soil is dry before the rainfall event.
Spatial differences, even on a small scale, are helpful to consider in interpreting soil respiration rates. Under dry conditions, soil respiration tends to be higher in the crop row than between the rows, due to respira-tion from the crop roots. This difference disappears during wet conditions, when pore space is filled and oxygen availability drops in both microhabitats. How-ever, when the soil between rows has been compacted (e.g., by wheels) and the soil is wet, soil respiration tends to be lower than in the row, because of lower soil porosity under compaction.
Students’ Step-by-Step Instructions, Demonstration 2

Soil Biology & EcologyPart 2 – 110 | Unit 2.3
Soil Biology & Ecology Unit 2.3 | Part 2 – 111
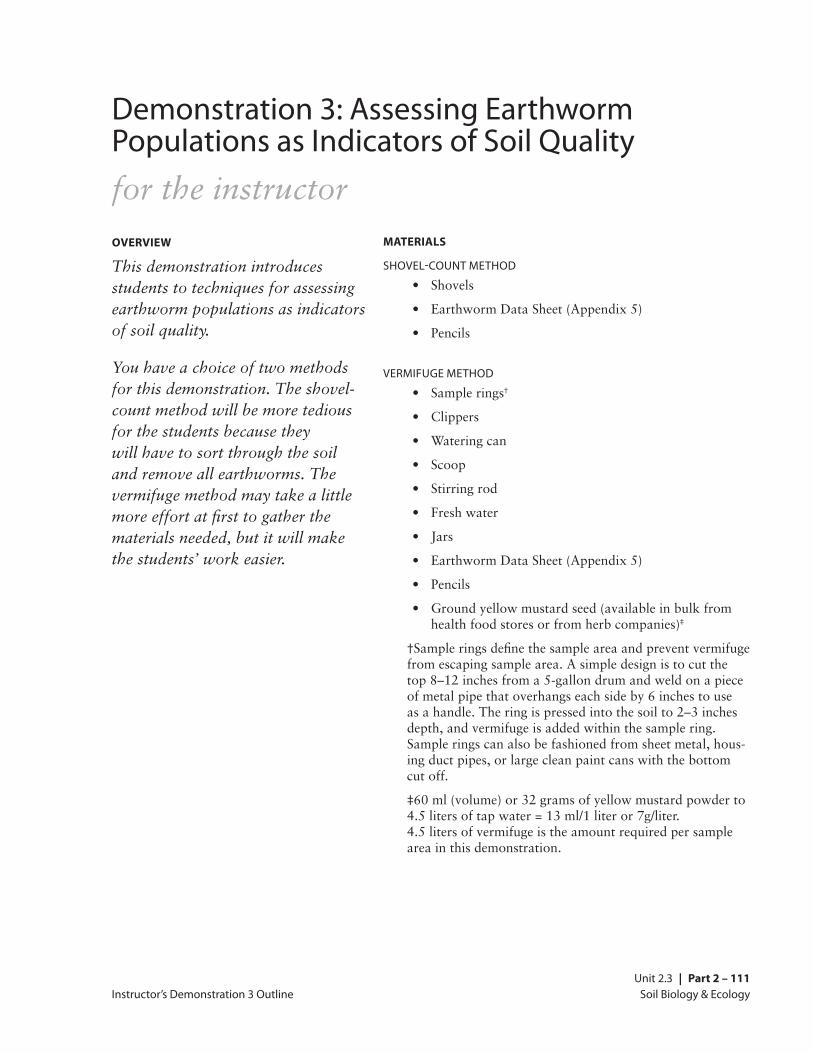
Demonstration 3: Assessing Earthworm Populations as Indicators of Soil Qualityfor the instructorOVERVIEW
This demonstration introduces students to techniques for assessing earthworm populations as indicators of soil quality.
You have a choice of two methods for this demonstration. The shovel-count method will be more tedious for the students because they will have to sort through the soil and remove all earthworms. The vermifuge method may take a little more effort at first to gather the materials needed, but it will make the students’ work easier.
MATERIALS
SHOVEL-COUNT METHOD
VERMIFUGE METHOD†
‡
†from escaping sample area. A simple design is to cut the top 8–12 inches from a 5-gallon drum and weld on a piece of metal pipe that overhangs each side by 6 inches to use as a handle. The ring is pressed into the soil to 2–3 inches depth, and vermifuge is added within the sample ring. Sample rings can also be fashioned from sheet metal, hous-ing duct pipes, or large clean paint cans with the bottom cut off.
‡
4.5 liters of vermifuge is the amount required per sample area in this demonstration.
Instructor’s Demonstration 3 Outline

Soil Biology & EcologyPart 2 – 112 | Unit 2.3
PREPARATION
SHOVEL-COUNT METHOD
-ration is required. Identify sample areas, try to collect a similar soil volume at each location, and record results.
VERMIFUGE METHOD
The vermifuge method requires more prepara-tion. Sample rings must be obtained or made.
the amount of time needed for the demonstra-tion, sample rings can be set out the day before. Ideally a minimum of 4 can be set out per habi-tat. Select areas with contrasting management
To begin the demonstration, gather group at one sample ring to explain technique. Divide class evenly among the number of sample rings
at each site for comparison. Collect results and derive an average abundance per habitat. Ob-serve species differences and discuss results.
PROCEDURE
1. Select sample area.
and push them several inches into the soil.
3. Carefully clip vegetation and removed all litter from inside sample area.
4. Slowly sprinkle 4.5 liters of vermifuge into each sample area, distributing it evenly over the entire surface.
6. Collect all earthworms that surface inside the sample area.
of the second vermifuge application, use a hand spade to dig through the surface layer
earthworms found there.
in containers inside an insulated cooler with
9. An alternate method that does not require a sample ring can be found in the USDA Soil
PREPARATION TIME
hours or more may needed to gather materials.
DEMONSTRATION TIME
1.5–2 hours
DISCUSSION QUESTIONS
soils in the U.S. were not present in those
came from?
3. Determine what ecological types of earthworm were present in each sample area
u you think these results were influenced by soil management practices in those areas. Consider factors such as amount and type of soil disturbance, organic matter inputs, presence of surface organic layer, etc.
productivity and sustainability?
5. If you were in charge of management decisions for the farm soils that were sampled, would you alter any practices based
Instructor’s Demonstration 3 Outline

Soil Biology & Ecology Unit 2.3 | Part 2 – 113
Demonstration 3: Assessing Earthworm Populations as Indicators of Soil Quality step-by-step instructions for students
INTRODUCTION
Earthworms are representative of the many organisms that make up soil food webs, and their abundance can be an indicator of soil biological activity.
There are a number of ways to estimate how many earthworms are living in a particular field. Perhaps the simplest is the shovel-count: turn over a shovel-full of soil and count the worms present. Dig down 8 inches to a foot, and count every earthworm you can find in the shovel-full. Do this in half-a-dozen or more spots in each soil type on your land and come up with an average for each. If you find 5 to 10 worms per shovel-full, that represents a fairly healthy earthworm community. If this is done at about the same time each year the results will give some indication of how man-agement practices are affecting earthworm populations.
Keep in mind that earthworm populations are very patchily distributed, and their location and abundance are heavily influenced by soil moisture, temperature, organic matter, time of year, and probably several other variables such as barometric pressure. For these rea-sons, a sufficient number of samples must be collected in order to accurately characterize earthworm populations in a particular field. Using more standardized sampling methods may also help.
Another method for sampling earthworms uses a vermifuge, or chemical irritant, which causes the earthworms to burrow to the soil surface, where they can be collected by hand. For many years the standard vermifuge has been a very dilute solution of formalin (about 8 ml formalin in 4.5 liters of water). However, recent studies have shown that mustard pow-der in water can be equally as effective.
Those interested in developing an even greater depth of under-standing about earthworm ecology and how it interacts with farming may want to do more than just count numbers of earth-worms present. Earthworms can be classified according to some simple physical characteristics that are directly related to their ecological roles in soil. u Table 2.14 (next page) highlights the three types of earthworms.
Try using u Table 2.14 to determine if you have more than one type of earthworm in your samples. Most California farm soils have endogeic earthworms, but epigeic and anecic species are rare. Epigeic species are more likely to be found in fields that have a permanent organic mulch on the surface. They may be added along with composts, but are not likely to thrive in the absence of an organic cover. Anecic species are desirable because of the work they do incorporating organic matter into the soil, mixing surface and deeper soil horizons, and creating deep channels for aeration, infiltration, and easy root penetration. Anecic earthworms could be introduced by direct inoculation, but transferring blocks of soil (one cubic foot each) from an area with a large earthworm popula-tion into a farm soil might work better.
Another idea is to set aside a small portion of a farm to be man-aged as an earthworm reservoir. If needed, the soil could be limed to bring it near pH 7, fertilized, irrigated regularly, and a cover crop established and cut periodically to provide an organic mulch as food and cover. A population of an anecic species could be intro-duced into this area and built up. Nightcrawlers can be purchased from bait dealers, who generally get them from nightcrawler harvesters in the Pacific Northwest.
From this reservoir, blocks could periodically be taken and intro-duced into the field. This might be done each year in the fall when earthworm activity is increasing. Remember to provide an organic mulch. The rate of spread would vary with species and conditions in the field. Lumbricus terrestris, the nightcrawler, is capable of trav-eling at least 19 meters (62 feet) on the soil surface in the course of one evening foray.
Students’ Step-by-Step Instructions, Demonstration 3
Soil Biology & EcologyPart 2 – 114 | Unit 2.3
MATERIALS NEEDED
Assemble materials as per instructor’s outline
SHOVEL-COUNT METHOD
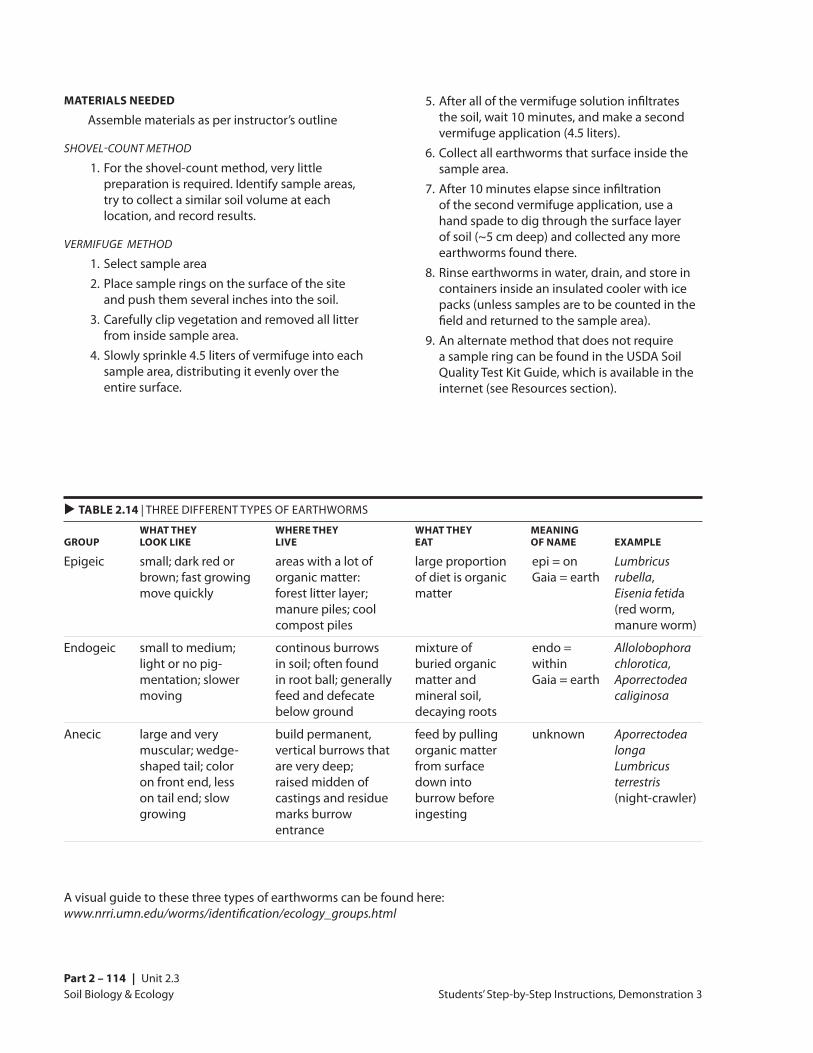
1. For the shovel-count method, very little preparation is required. Identify sample areas, try to collect a similar soil volume at each location, and record results.
VERMIFUGE METHOD
1. Select sample area 2. Place sample rings on the surface of the site
and push them several inches into the soil. 3. Carefully clip vegetation and removed all litter
from inside sample area. 4. Slowly sprinkle 4.5 liters of vermifuge into each
sample area, distributing it evenly over the entire surface.
5. After all of the vermifuge solution infiltrates the soil, wait 10 minutes, and make a second vermifuge application (4.5 liters).
6. Collect all earthworms that surface inside the sample area.
7. After 10 minutes elapse since infiltration of the second vermifuge application, use a hand spade to dig through the surface layer of soil (~5 cm deep) and collected any more earthworms found there.
8. Rinse earthworms in water, drain, and store in containers inside an insulated cooler with ice packs (unless samples are to be counted in the field and returned to the sample area).
9. An alternate method that does not require a sample ring can be found in the USDA Soil Quality Test Kit Guide, which is available in the internet (see Resources section).
u TABLE 2.14 | THREE DIFFERENT TYPES OF EARTHWORMS
WHAT THEY WHERE THEY WHAT THEY MEANING GROUP LOOK LIKE LIVE EAT OF NAME EXAMPLE
Epigeic small; dark red or areas with a lot of large proportion epi = on Lumbricus brown; fast growing organic matter: of diet is organic Gaia = earth rubella, move quickly forest litter layer; matter Eisenia fetida manure piles; cool (red worm, compost piles manure worm)
Endogeic small to medium; continous burrows mixture of endo = Allolobophora light or no pig- in soil; often found buried organic within chlorotica, mentation; slower in root ball; generally matter and Gaia = earth Aporrectodea moving feed and defecate mineral soil, caliginosa below ground decaying roots
Anecic large and very build permanent, feed by pulling unknown Aporrectodea muscular; wedge- vertical burrows that organic matter longa shaped tail; color are very deep; from surface Lumbricus on front end, less raised midden of down into terrestris on tail end; slow castings and residue burrow before (night-crawler) growing marks burrow ingesting entrance
Students’ Step-by-Step Instructions, Demonstration 3
A visual guide to these three types of earthworms can be found here: www.nrri.umn.edu/worms/identification/ecology_groups.html

Soil Biology & Ecology Unit 2.3 | Part 2 – 115
Demonstration 4: Soil Arthropodsfor the instructor
OVERVIEW
This demonstration introduces students to techniques for sampling soil arthropods and familiarizes them with their functional roles.
For this short demonstration, both of these exercises provide a hands-on, show-and-tell of soil arthropods. You should have identification keys available, and some familiarity with what kinds of animals students are likely to find.
A pitfall trap is buried so the top sits flush with the soil surface, allowing surface-dwelling arthropods to fall in. Preserving liquid can be used in the bottom of the trap to keep the arthropods there for easy removal and identification. A Tullgren funnel uses light to dry out a soil or compost sample, driving out organisms so they can be collected and identified.
MATERIALS
PITFALL TRAPPING
one-time installation, or 2 per trap if you wish to repeat the
glycol, especially for demonstrations that will run several
TULLGREN FUNNELS†
‡
cm in the jar below the funnel.
†bottles work, and inverted polypropylene Erlenmeyer flasks
5 xlitter samples.
‡
mouth of or in the middle the funnel, as its role is to hold the sample in place in the funnel while it dries out.
FOR BOTH METHODS
www.cals.ncsu.edu/course/ent525/soil/soilpix/index.html
Instructor’s Demonstration 4 Outline

Soil Biology & EcologyPart 2 – 116 | Unit 2.3
PREPARATION
PITFALL TRAPPING
Select sampling areas in different habitats. Try for a minimum of 3 or 4 samples per habitat. Traps can be set 24 to 48 hours in advance of the demonstra-tion. Traps can also be collected before the dem-onstration if time is at a minimum, although it will
see where and how the traps were set.
At each sampling site, bury a cup so that the top
together, one inside the other, and then remove the top cup to have a clear working cup below. If you are using two cups for your trap, set the lower one down enough so the top cup is flush with the soil surface. The top of the cup may be left open, cov-ered with hardware cloth, or covered with a board, leaving enough room between the board and pitfall trap for free access by surface roaming creatures
If collected frequently, pitfalls may be left empty so that live specimens are obtained. You may also
in the bottom of the trap, or by using a preservative
-
TULLGREN FUNNELS
Collect samples from various habitats. You can use x 5 cm2 -
ter, or compost.
a piece of screen across the mouth of or part-way down a funnel. Carefully place the sample on the screen . If too much sample material falls through the funnel, add more screens, or a piece of coarse
funnel, with the light above, but not touching, the sample. Do not shake or disturb funnels, keeping the
stand in funnels with the lights on for 5–7 days.
Samples can be collected and extracted in advance of the demonstration, although as with pitfall traps,
can see how the samples were collected and how the Tullgren funnels work.
PROCEDURE
-tion, either with dissecting scopes or hand lenses. If live collections are made from the pitfall traps, students can observe behavioral adaptations of the
predators like centipedes and mesostigmatid mites,
have students count species or functional groups and calculate a diversity index, e.g., the Shannon index
www.tiem.utk.edu/~gross/bioed/bealsmod-ules/shannonDI.htmlhabitats.
PREPARATION TIME
2 hours to 7 days, depending on which exercises
materials are available or need to be obtained.
DEMONSTRATION TIME
students observe samples previously collected, to 1 to 2 hours if students are involved in collect-ing samples, observing, and quantifying.
DISCUSSION QUESTIONS
1. Can you guess which animals might be
functional group, that is, how they feed?
of creatures, diversity, food-web interactions, and pigmentation.
soil management practices have on soil arthropods? Besides the various effects of organic matter inputs, think about the influence of physical disturbance.
Instructor’s Demonstration 4 Outline

Soil Biology & Ecology Unit 2.3 | Part 2 – 117
Assessment Questions
Assessment Questions
1) What is soil?
2) What forms of life exist in soil ecosystems?
3) How would you define a “healthy” agricultural soil?
4) What is a soil food web?
5) What might be some negative effects of the long-term practice of monoculture cropping and the use of synthetic chemical fertilizer and pest control agents on the soil ecosystem?
Soil Biology & Ecology Part 2 – 118 | Unit 2.3
Assessment Questions Key
Assessment Questions Key
1) What is soil?
minerals (sand, silt, clay, and nutrients), pore spaces, water, gases, organic matter, living organisms, and plants
2) What forms of life exist in soil ecosystems?
isopods, mollusks, insects, insect larvae, worms and many small vertebrate animals such as gophers, ground squirrels, moles, etc.
3) How would you define a “healthy” agricultural soil?
chemical properties which has the capacity to sustain biological productivity, maintain environmental quality, and promote plant, animal, and human health. This would include many of the following general characteristics:
a) adequate rooting depth for the crop(s) to be grown
b) a 3–5% organic matter content c) maintains stable soil aggregates d) allows for rapid water infiltration without
soil erosion e) a low bulk density (good structure with
minimal compaction) f) pH between 6 and 7 g) an extractable nutrient profile within the
optimal range of physiological tolerance for the crops to be grown
h) good water holing capacity and well-drained i) high soil biological diversity and activity (soil
respiration) j) adequate supplies of labile organic matter
with potentially mineralizable nitrogen k) seasonal soil temperatures from 60–85ºF
4) What is a soil food web?
(producers, consumers and decomposers) in a soil ecosystem interacting among and between trophic levels
5) What might be some negative effects of the long-term practice of monoculture cropping and the use of synthetic chemical fertilizer and pest control agents on the soil ecosystem?
reduction in nutrient- and water-holding capacity, reduction in soil biological diversity and activity, increased pest and disease incidence

Soil Biology & Ecology Unit 2.3 | Part 2 – 119
Resources
ResourcesPRINT RESOURCES
Coleman, David, and Dak Crossley. 1996. Funda-mentals of Soil Ecology. San Diego, CA: Academic
The best textbook introduction to the subject that I know of. Gives an overview of the basics, and attempts to consider the applications.
A weighty tome, with chapters including taxonomic keys and basic biology/ecology on virtually all organisms found in soils.
for Assessing Soil Quality.
Soil quality is the current buzzword in soil science circles. This volume explores the application of the idea to sustainable environmental management.
*Gershuny, Grace, and Joseph Smillie. 1999. The
Farmers and Gardeners, 4th Edition.
above works, this book is aimed at plant growers and has lots of practical information.
soil like dirt? National Geographic, pp 351-388.An overview of US soils, from soil biota to bankrupt farmers, done in classic NG style, with lots of great photos and drawings.
Agroecology: Ecologi-cal Processes in Sustainable Agriculture. Chelsea,
Provides a brief overview of the most commonly used conventional agricultural practices and the environmental and agroecological consequences of their use.
Edition.Society.
An excellent overview of soil biology, loaded with glossy photos and colorful chart. Available from www.nrcs.usda.gov/wps/portal/nrcs/main/soils/health/biology/.
WEB-BASED RESOURCES
attra.ncat.org/publication.html#soils
www.ext.colostate.edu/mg/gardennotes/212.html
Introduces various types of beneficial soil organisms and their roles, as well as how to encourage beneficial organisms by creating a favorable soil environment.
European Atlas of Soil Biodiversityeusoils.jrc.ec.europa.eu/library/maps/Biodiver-sity_Atlas/
Information-rich resource on soil organisms offers a comprehensive guide to soil biology, soil ecosystem functions, and the ecosystem services that soil organisms provide (e.g., nutrient cycling).
www.fao.org/agriculture/crops/thematic-sitemap/theme/spi/soil-biodiversity/agriculture-and-soil-biodiversity/en/
Discusses the effect of different agricultural practices on soil organisms. Includes information on how to improve soil biodiversity through soil management, sustainable agriculture, and agroecological farming options.
www.fao.org/docrep/009/a0100e/a0100e0d.htm
Describes the categories and characteristics of soil organisms, including beneficial and harmful organisms in agricultural soils. Includes a

Soil Biology & Ecology Part 2 – 120 | Unit 2.3
discussion of the effects of organic matter on soil properties.
www.nrri.umn.edu/worms/identification/ecol-ogy_groups.html
Excellent description of earthworm ecological groups
and Everything in Betweenwww.nature.com/scitable/knowledge/library/the-rhizosphere-roots-soil-and-67500617Comprehensive description of the rhizosphere, including an excellent description and graphics of legume-rhizobia symbiosis, mycorrhizal fungi and nutrient acquisition, and root system architecture. Includes a useful glossary
www.nrcs.usda.gov/wps/portal/nrcs/main/soils/health/biology/www.nrcs.usda.gov/wps/portal/nrcs/main/soils/health/resource/Resources and publications on soil health, including information sheets and technical notes on soil organic matter, soil erosion, soil biodiversity, and soil quality evaluation
http://www.nrcs.usda.gov/wps/portal/nrcs/detail-full/soils/health/biology/?cid=nrcs142p2_053868
Thorough discussion of the soil food web, written by Elaine Ingham.
SOIL QUALITY
www.attra.org/attra-pub/soil-lab.html#Soil%20Healthº
www.aces.uiuc.edu/~asap/resources/isqi/soil-health.html
www.crcslm.waite.adelaide.edu.au
www.soilandhealth.org/index.html
Soil Biological Communitieswww.blm.gov/nstc/soil/index.html
Resources
Soil Ecology Societyvax.wcsu.edu/ses/ses.html
www.nrcs.usda.gov/wps/portal/nrcs/main/soils/health/
www.rain.org/~sals/ingham.html
University of California Sustainable Agriculture
www.sarep.ucdavis.edu/soil/websites.htm
SOURCES OF SUPPLIES
www.fishersci.com

Soil Biology & Ecology Unit 2.3 | Part 2 – 121
SIMPLE HEMI- PROTEINS FATS CARBOS CELLULOSE CELLULOSE LIGNIN ASHOak leaf (young) 9 8 22 13 16 21 6
Oak leaf (old) 3 4 15 16 18 30 5
Pine needle 2 24 7 19 16 23 2
Grass leaf 2 2 13 24 33 14 0
Corn stem 1 2 15 18 30 11 8
Wood 0 4 2 22 47 22 1
Horse manure 7 2 5 24 28 14 9
Bacteria 50–60 10–35 5–30 4–32 0 0 5–15
Fungi 14–52 1–42 8–60 2–15 0 0 5–12
Earthworm 54–72 2–17 11–17 0 0 0 9–23
Arthropods 38–50 13–26 14–31 5–9 0 0 0
Appendix 1: Major Organic Components of Typical Decomposer Food Sources
Appendix 1: Major Organic Components of Decomposer Food Sources

Soil Biology & Ecology Part 2 – 122 | Unit 2.3
Appendix 2: Litter Bag Data SheetMatter Decomposition in Litter Bags
burial date: location:
retrieval date: details:
LITTER BAG % REMAINING AVERAGE PER OTHER # HABITAT (VISUAL ASSESSMENT) HABITAT OBSERVATIONS
1
2
3
4
5
6
7
8
9
10
11
12
13
14
15
16
17
18
19
20
21
22
23
24
25
26
27
28
Appendix 2: Litter Bag Data Sheet for Demonstration 1

Soil Biology & Ecology Unit 2.3 | Part 2 – 123
Appendix 3: Litter Bag Data Sheet ExampleOrganic Matter Decomposition in Litter Bags Example
burial date: location:
retrieval date: details:
LITTER BAG % REMAINING AVERAGE PER OTHER # HABITAT (VISUAL ASSESSMENT) HABITAT OBSERVATIONS
1 compost 5
2 compost 25
3 compost 80
4 compost 90 50.0
5 orchard soil 100
6 orchard soil 100
7 orchard soil 70
8 orchard soil 90 90.0
9 raised garden bed 97
10 raised garden bed 99
11 raised garden bed 72
12 raised garden bed 95 90.8
13 row crop 97
14 row crop 95
15 row crop 94
16 row crop 96 95.5
17 soil surface 100
18 soil surface 100
19 soil surface 100
20 soil surface 99 99.8
Appendix 3: Litter Bag Data Sheet Example for Demonstration 1

Soil Biology & Ecology Part 2 – 124 | Unit 2.3
Appendix 4: Soil Respiration Data Sheet Soil Respiration (at Initial Field W
ater Content) D
ate:
Sample
Ring Start
End Soil
Draeger
Soil D
raeger Soil
site
height tim
e tim
e tem
p ºC tube
respiriration tube
respiration
%
CO2 (n=1)
lbs C/A/ day* %
CO2 (n=5)
lbs C/A/day*
1
0.0
0.0
2
0.0
0.0
3
0.0
0.0
4
0.0
0.0
5
0.0
0.0
6
0.0
0.0
7
0.0
0.0
8
0.0
0.0
Soil Respiration (at least 6 hours after irrigation or soil wetting)
Date:
1
0.0
0.0
2
0.0
0.0
3
0.0
0.0
4
0.0
0.0
5
0.0
0.0
6
0.0
0.0
7
0.0
0.0
8
0.0
0.0
* Soil respiration = PF x ((Soil Temp C + 273)/273) x (CO
2 % - 0.035) x 22.91 x Ring H
t = lbs CO 2 -C/acre/day
PF = Pressure Factor = ‘raw’ barom
etric pressure in inches Hg/29.9 inches.
Note: This adjustm
ent is necessary at elevations > 3,000 ft.; otherwise PF = 1
H = 5.08 cm
(if not measured)
Conversion: Degrees Celsius = 5/9 x (D
egrees Fahrenheit - 32)N
otes:
Appendix 4: Soil Respiration Data Sheet for Demonstration 2

Soil Biology & Ecology Unit 2.3 | Part 2 – 125
Appendix 5: Earthworm Data Sheet
SAMPLE EPIGEIC ENDOGEIC ANECIC TOTAL EARTHWORMS SITE EARTHWORMS EARTHWORMS EARTHWORMS EARTHWORMS PER SQ METER
1
2
3
4
5
6
7
8
9
10
11
12
NOTES:
Epigeic: Small; dark red or brown color; fast growing; move quickly Endogeic: Small to medium; light or no pigmentation; slower moving Anecic: Large and very muscular; wedge-shaped tail; color on front end, less on tail end; slow growing
DATE:
Appendix 5: Earthworm Data Sheet for Demonstration 3
Soil Biology & Ecology Part 2 – 126 | Unit 2.3
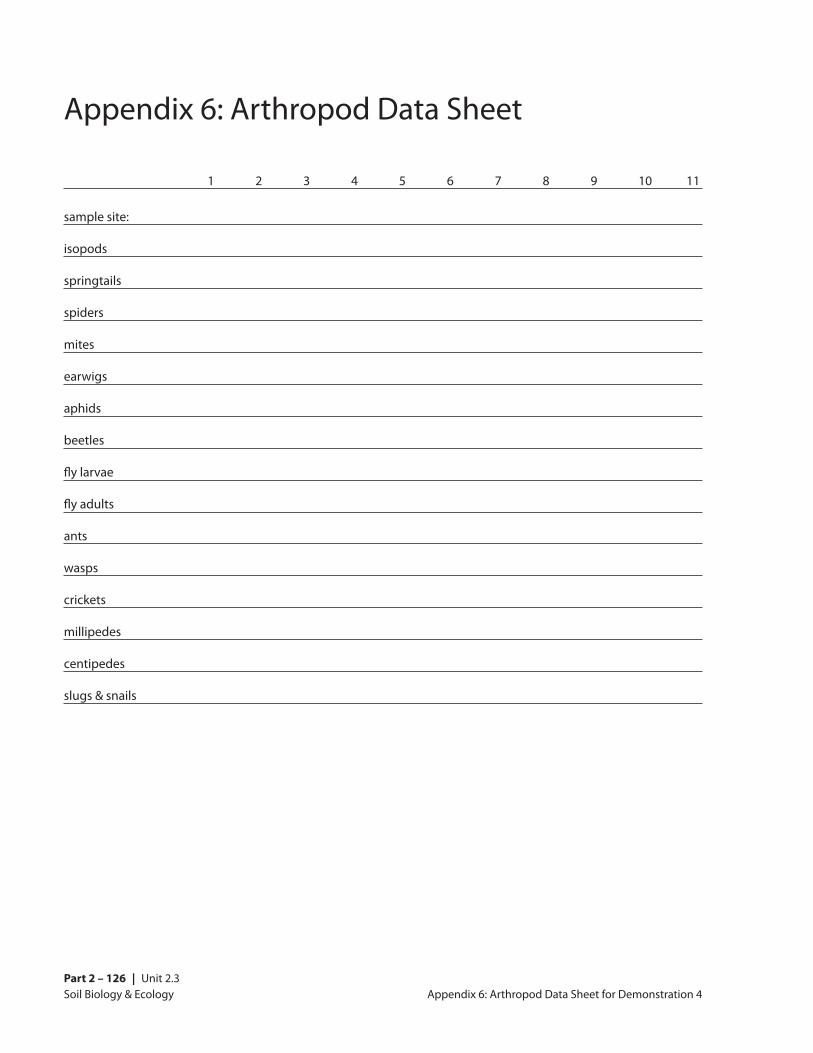
Appendix 6: Arthropod Data Sheet
sample site:
isopods
springtails
spiders
mites
earwigs
aphids
beetles
fly larvae
fly adults
ants
wasps
crickets
millipedes
centipedes
slugs & snails
1 2 3 4 5 6 7 8 9 10 11
Appendix 6: Arthropod Data Sheet for Demonstration 4