2.3 north fork nooksack river 2419wria1project.whatcomcounty.org/uploads/usu/wria 1 phaseii...2494...
TRANSCRIPT

85
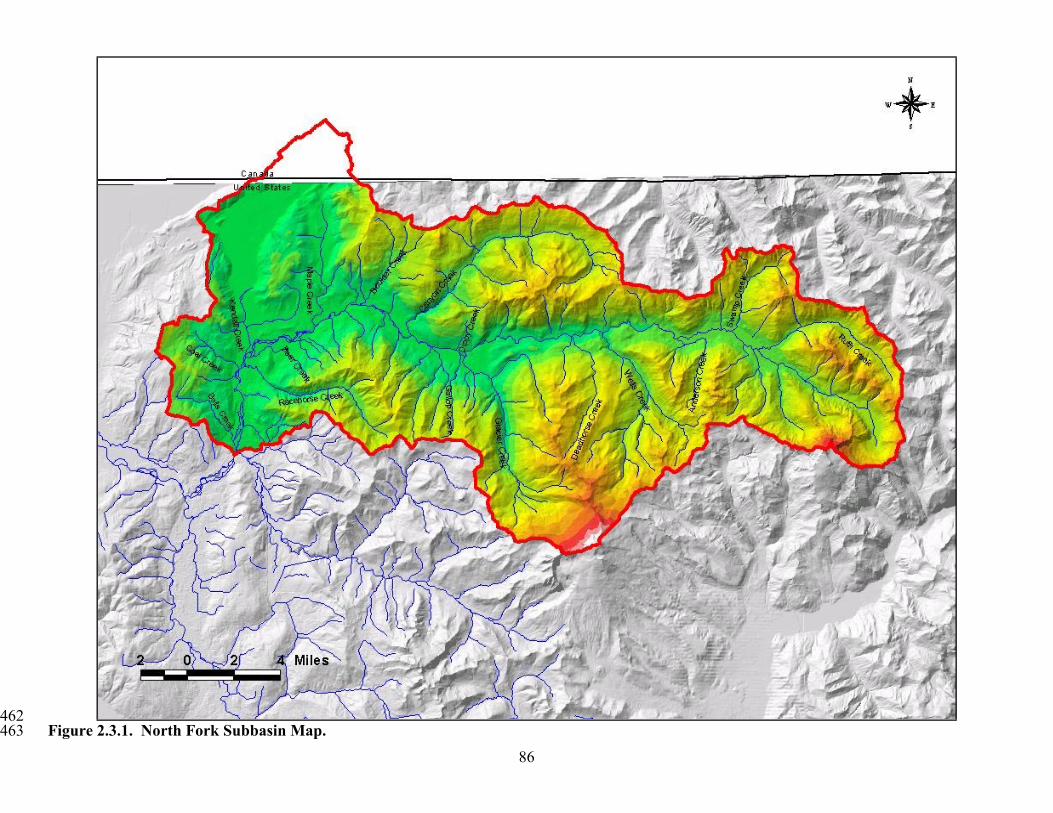
2.3 North Fork Nooksack River 2418 2419 2.3.1 Introduction 2420 2421 The North Fork of the Nooksack River is a 297 mi2 drainage with elevation ranging from 10,781 2422 at Grant Peak atop Mt. Baker to approximately 300 feet at the confluence of the North Fork with 2423 the Middle Fork. The North Fork is approximately 40 miles in length, with flows driven by 2424 glaciers on the north and western slopes of Mt. Baker. Most of the watershed is made up of 2425 steep, mountainous terrain, with the exception of the lower watershed where the flood plain 2426 widens and the relief is less dramatic. Nearly 68% of the land use in the North Fork subbasin is 2427 made up of forested land with some smaller areas of urban and agricultural lands (approximately 2428 1% combined) in the lower basin near the town of Kendall (Cassidy, 1997). There are also areas 2429 of perennial snow, ice, and unforested land (approximately 28% combined) associated with the 2430 higher elevations. The remaining 3% is associated with wetlands and riparian areas. Human 2431 impacts in the North Fork appear to be mainly the result of timber harvesting, although there is a 2432 potential for urban and agricultural impacts in the lower portions of the basin. Figure 2.3.1 2433 shows a relief map of the North Fork subbasin. 2434 2435 2.3.2 Water Quality Summary 2436 2437 The overall water quality in the North Fork Nooksack subbasin in comparison to Washington 2438 state water quality standards appears to be good from a chemical and microbiological 2439 perspective. There are seven 303(d) listings in the North Fork, five for temperature and two for 2440 fine sediment. Water temperatures in the main stem of the North Fork are generally below the 2441 criterion, however, elevated temperatures can exist in the tributaries during summer periods, 2442 particularly July and August, when flows are low and ambient air temperatures are high. Lower 2443 dissolved oxygen concentrations have also been observed in many of the tributaries during the 2444 same summer periods. Fecal coliform levels appear to be low, although few fecal coliform data 2445 have been collected in the North Fork and most existing data were collected by the Forest 2446 Service in the 1970s. Very few recent data are available for nutrients, suspended solids, and 2447 turbidity, and generalizations about these parameters are again likely unsupportable. 2448 2449 Figure 2.3.2 shows all water quality station locations for the North Fork that have been identified 2450 by the USU surface water quality team. Some of the stations have been placed on the map by 2451 USU using either site descriptions or maps from agencies showing sampling sites when exact 2452 geographic coordinates were unavailable. Table B-1 gives more information on the water quality 2453 station locations and the agency that collected the data. Table C-1 shows water quality data 2454 summaries for the water quality stations in Figure 2.3.2. 2455 2456 2.3.3 Stream designation 2457 2458 Figure 2.3.3 shows the stream designations for the North Fork of the Nooksack according to 2459 Water Quality Standards for Surface Waters of the State of Washington (WDOE, 1997b). The 2460 North Fork and tributaries from the confluence with the Middle Fork upstream to Maple Creek 2461
86
462 Figure 2.3.1. North Fork Subbasin Map. 463

87
464 Figure 2.3.2. Water Quality Stations in the North Fork Nooksack Subbasin. 465

88
466 Figure 2.3.3. Washington State Surface Water Classifications for the North Fork Nooksack Subbasin. 467

89
are designated Class A (Excellent). The remainder of the North Fork, including tributaries, from 2468 Maple Creek to the headwaters is designated Class AA (Extraordinary). 2469 2470 2.3.4 Water Quality Impairments 2471 2472 The principal water quality concern in the North Fork is water temperature. Although 2473 temperature is not a concern in the glacially driven flows of the main stem North Fork, five of its 2474 tributaries are listed for temperature. These listings are primarily of concern for fisheries. There 2475 are also two 303(d) listings for fine sediment, one in the North Fork itself and one in Racehorse 2476 Creek. Figure 2.3.4 shows the location of the 303(d) listed streams within the North Fork 2477 Nooksack subbasin, and Table E-3 in Appendix E lists the justification for each of the 303(d) 2478 listings. Again, the impacts of water quality on fisheries will not be discussed in detail in this 2479 report, but will be studied further in Phase III. 2480 2481 2.3.4.1 Water Quality Analysis for Listed Segments 2482 2483 Racehorse Creek (WA-01-1145) 2484 Racehorse Creek is on the 303(d) list for both temperature and fine sediment. The temperature 2485 listing is based on average hourly temperature data collected by LNR (Neff, 1993a) that show 2486 excursions beyond the Class A criterion on 32 out of 41 days that were sampled between 7/24/92 2487 and 9/4/92, including several days within that period in which the temperature never dipped 2488 below the 18°C criterion. These data have not been made available to USU in electronic format, 2489 although Figure 2.3.5 taken from the data report (Neff, 1993a) shows the data clearly. The 2490 303(d) listing of Racehorse Creek for fine sediment is based on habitat alteration documented by 2491 Schuett-Hames (1984, 1988). As there is currently no sediment related water quality data for 2492 Racehorse Creek in the WRIA 1 Surface Water Quality Database, the focus of this assessment 2493 will be on water temperature. Additional information and investigation is needed to evaluate the 2494 impacts of sediment. 2495 2496 Figure 2.3.6 shows temperature data collected by the Nooksack Tribe in 1996 (Nooksack Water 2497 Department, 1998) at the same location that the LNR data were collected. Figure 2.3.6 shows 2498 that monthly temperatures recorded by the Nooksack Tribe approach the criterion, but no 2499 exceedences of the criterion were recorded. It is likely, however, that if the Nooksack Tribe had 2500 collected hourly temperature observations during the month of July they would have observed 2501 temperatures in exceedence of the criterion as daily temperature fluctuations in North Fork 2502 tributaries have been observed to be as much as 4–5°C. 2503 2504 Although the Nooksack Tribe data do not show any observations above the water quality 2505 criterion, the LNR data presented show clear temperature impairment in Racehorse Creek at this 2506 location. Both acute and extended periods of sub-lethal temperature levels were observed during 2507 the critical period for salmon (July through September) during the sampling period in 1992. 2508 2509

90
510 Figure 2.3.4. North Fork Nooksack 303(d) Listed Stream Segments. 511

91
2512 Figure 2.3.5. LNR Temperature Data for Racehorse Creek. 2513 Note: Water quality criterion shown is incorrect – should be 18°C. 2514 Plot Source: Neff, 1993a 2515 2516
Water Quality Criterion, 18
2.5
5.0
7.5
10.0
12.5
15.0
17.5
Jan 96 Apr Jul Oct Jan 97
Time Series for Racehorse Creek
Te
mp
era
ture
- w
ate
r, C
Date 2517 Figure 2.3.6. Nooksack Tribe Temperature Data for Racehorse Creek (Nooksack-22). 2518

92
Boulder Creek (WA-01-1155) 2519 Boulder Creek was listed for temperature based on data collected by LNR (Neff, 1993b) during 2520 the summer of 1993. Five out of 10 daily maximum water temperature observations recorded 2521 during the months of July and August were above the 16°C Class AA criterion. These data are 2522 shown in Figure 2.3.7. 2523 2524
2525 Figure 2.3.7. LNR Temperature Data for Boulder Creek. 2526 Plot Source: Neff, 1993b. 2527 2528 Figure 2.3.7 shows that the criterion is exceeded by 50% of the observations, which qualifies 2529 Boulder Creek for listing. It is unclear whether these data are representative of the variability in 2530 conditions that occur in Boulder Creek. Daily temperature fluctuations in North Fork tributaries 2531 have been observed to be as high as 4-5°C, indicating that temperatures in Boulder Creek during 2532 the period in which this data was collected would likely have been below the criterion for the 2533 better part of the day. The data in Figure 2.3.7 are maximum daily temperatures, and as such 2534 give no indication of the diurnal fluctuations that actually occur in Boulder Creek. 2535 2536 Figure 2.3.8 shows data collected by the Nooksack Tribe (Nooksack Water Department, 1998) at 2537 the same location in 1996. None of the Nooksack temperature observations, including those 2538 within the critical months of July through September, are above the 16°C criterion. Taken 2539 together, the Nooksack Tribe and LNR data show a 19% criterion exceedence (5 out of 26 total 2540 observations), which still meets the criteria for listing; however, very different conclusions 2541 would be drawn from these two studies if they were evaluated separately. 2542 2543

93
No observations of temperature in the range that would have acute effects on salmon were 2544 recorded in Boulder Creek, although the LNR data show periods in July and August during 2545 which maximum daily temperatures are in the range where sub-lethal effects may occur. With 2546 the limited number of observations available, and with no characterization of the diurnal 2547 variability in water temperature in Boulder Creek at this location it is difficult to assess the extent 2548 of the temperature impairment or its impact on fish in Boulder Creek. 2549 2550
2.5
5.0
7.5
10.0
12.5
15.0
Jan 96 Apr Jul Oct Jan 97
Time Series for Boulder Creek at Mount Baker Highway
Te
mp
era
ture
- w
ate
r, C
Date 2551 Figure 2.3.8. Nooksack Tribe Temperature data for Boulder Creek (Noooksack-20). 2552 2553 Canyon Creek (WA-01-1160) 2554 Canyon Creek was listed for temperature based on data collected by LNR in 1996 (submitted by 2555 Leroy Deardorf on 10/27/97) that show 14% of all observations in July of 1996 in exceedence of 2556 the 16°C criterion. Figure 2.3.9 shows a time series and probability plot for all of the 1996 LNR 2557 temperature data collected in Canyon Creek (LNT-2482), and Figure 2.3.10 shows a time series 2558 and probability plot for the month July. 2559 2560 Figures 2.3.9 and 2.3.10 show that although approximately 14% of the July observations exceed 2561 the criterion, only about 7% of all of the temperature observations (July – September) exceed the 2562 criterion. Based on the entire dataset, Canyon Creek would not meet the 10% criterion and 2563 would not qualify for listing on the 303(d) list. 2564 2565 There are no observations at this location that fall in the range that would cause acute 2566 temperature effects on fish. During July of 1996, however, there was a 10-day period in which 2567 temperatures during the afternoon reached the sub-lethal effects range. The data collected during 2568 Phase II and presented here, however, are insufficient to determine the level of impacts to fish 2569 that would be realized during such an event. 2570

94
Water Quality Criterion, 16
8
9
10
11
12
13
14
15
16
17
18
19
8 MonJul 96
15 Mon 22 Mon 1 Aug 8 Thu 15 Thu 22 Thu 1 Sep 8 Sun 15 Sun
Time Series for Canyon CreekT
em
pe
ratu
re -
wa
ter,
C
Date 2571 2572
Median = 12.26 C
Median
Water Quality Criterion, 16
0.02 99.980.1 99.91 992 985 9510 9020 8030 7040 60500.01 99.99
Frequency Distribution for Canyon Creek
Te
mp
era
ture
- w
ate
r, C
Cumulative frequency < stated value, %
8.0
9.0
10.0
11.0
12.0
13.0
14.0
15.0
16.0
17.0
18.0
19.0
2573 Figure 2.3.9. LNR Temperature Data for Canyon Creek (LNT-2482). 2574 2575 2576 2577

95
Water Quality Criterion, 16
8
9
10
11
12
13
14
15
16
17
18
19
15 MonJul 96
22 Mon 1 Aug
Time Series for Canyon CreekT
em
pe
ratu
re -
wa
ter,
C
Date 2578 2579
Median = 12.56 C
Median
Water Quality Criterion, 16
0.02 99.980.1 99.91 992 985 9510 9020 8030 7040 60500.01 99.99
Frequency Distribution for Canyon Creek
Te
mp
era
ture
- w
ate
r, C
Cumulative frequency < stated value, %
8.0
9.0
10.0
11.0
12.0
13.0
14.0
15.0
16.0
17.0
18.0
19.0
2580 Figure 2.3.10. July LNR Temperature Data for Canyon Creek (LNT-2482). 2581 2582 2583 2584

96
Cornell Creek (WA-01-1170) 2585 According to the Washington State 303(d) list, the temperature listing of Cornell Creek is based 2586 on data collected by LNR during July and August of 1992 (Neff, 1993a) that show 32 excursions 2587 beyond that criterion between 7/30/92 and 8/30/92. Figure 2.3.11 shows a time series plot of 2588 these data taken from the LNR data report (Neff, 1993a). 2589 2590
2591 Figure 2.3.11. 1992 LNR Temperature Data for Cornell Creek. 2592 Note: Water quality criterion shown is incorrect – should be 16°C. 2593 Plot Source: Neff, 1993a 2594 2595 According to Neff (1993a), the thermograph used to collect the data malfunctioned on August 2596 18, 1992, as indicated in Figure 2.3.11, and data collected after this date were considered 2597 unreliable. It is interesting to note that Cornell Creek was listed for 32 excursions above the 2598 temperature criterion, or 32 days in which the criterion was exceeded, when only 20 days of data 2599 were collected before the probe malfunction – only 16 of which had temperatures exceeding the 2600 criterion. 2601 2602 Data collected in July and August of 1993 by LNR (Neff, 1993b)(Figure 2.3.12 top panel) show 2603 5 out of 10 days with maximum temperatures exceeding the 16°C criterion, and data collected by 2604 the Nooksack Tribe at the same location (Nooksack Water Department, 1998) (Figure 2.3.12 2605 bottom panel) show a single observation in July of 1996 in exceedence of 16°C. 2606 2607 2608

97
2609 2610
Water Quality Criterion, 16
2.5
5.0
7.5
10.0
12.5
15.0
17.5
20.0
Jan 96 Apr Jul Oct Jan 97
Time Series for Cornell Creek at Mount Baker Highway Bridge
Te
mp
era
ture
- w
ate
r, C
Date 2611 Figure 2.3.12. 1993 LNR and 1996 Nooksack Tribe (Nooksack-18) Temperature Data for 2612 Cornell Creek. 2613 Plot Source (top panel): Neff, 1993b. 2614 2615

98
Although there is an inconsistency between the justification for 303(d) listing and the actual 2616 1992 LNR data due to a malfunction of the temperature probe, it appears that the 1993 LNR data 2617 and the 1996 Nooksack Tribe data support the 1992 data and show that temperatures beyond the 2618 16°C criterion are relatively common from mid July to mid August. The 1992 LNR data show 2619 temperatures within the range for acute effects on salmon and also show extended periods within 2620 the sub-lethal effects range indicating that impairment to fish may be occurring at this location. 2621 Again, however, the data collected during Phase II is insufficient to determine the extent of these 2622 impairments. 2623 2624 Gallop Creek (WA-01-1175) 2625 Gallop Creek was also listed for temperature based on the 1992 LNR study (Neff, 1993a) in 2626 which 26 excursions beyond the criterion were observed between 7/30/92 and 8/30/92. Figure 2627 2.3.13 shows a time series plot of these data that was taken from the data report (Neff, 1993a). 2628 2629
2630 Figure 2.3.13. 1992 LNR Temperature Data for Gallup Creek. 2631 Note: Water quality criterion shown is incorrect – should be 16°C. 2632 Plot Source: Neff, 1993a. 2633 2634 The 1992 LNR temperature data for Gallop Creek is very similar to that of Cornell Creek 2635 indicating that these two creeks have very similar temperature regimes. Hourly observations 2636 show impairment during the months of July and August. The 1996 Nooksack Tribe data in 2637 Gallop Creek (Nooksack-17) is also similar to that of Cornell Creek, showing a single 2638 observation above the criterion in July (Figure 2.3.14), although again it is likely that if the 2639 Nooksack Tribe had collected hourly data during the critical months they would have observed 2640 temperatures in exceedence of the criterion. Since it appears that the temperature regime in 2641 Gallop Creek is similar to that of Cornell Creek and similar temperature ranges have been 2642 observed, it is likely that similar temperature impairment exists. 2643

99
Water Quality Criterion, 16
2.5
5.0
7.5
10.0
12.5
15.0
17.5
Jan 96 Apr Jul Oct Jan 97
Time Series for Gallop Creek at Mount Baker Highway BridgeT
em
pe
ratu
re -
wa
ter,
C
Date 2644 Figure 2.3.14. 1996 Nooksack Tribe Temperature Data for Gallop Creek (Nooksack-17). 2645 2646 North Fork Nooksack River (WA-01-1080) 2647 The 303(d) listing of the North Fork of the Nooksack River for fine sediment is based on habitat 2648 alteration documented by Schuett-Hames (1984, 1988). As there is currently no sediment related 2649 water quality data for the North Fork in the WRIA 1 Surface Water Quality Database at this 2650 location, and since the fine sediment issue is related to fish habitat, no water quality assessment 2651 with respect to fine sediment is included in this report. Additional information and investigation 2652 is needed to evaluate sediment impacts. 2653 2654 2.3.4.2 Potential Water Quality Impaired Segments 2655 2656 Maple Creek 2657 Temperature data collected by the Nooksack Tribe in Maple Creek show a single observation 2658 above the 16°C criterion during July of 1996 (Figure 2.3.15 top panel). This is consistent with 2659 higher temperatures observed by the Nooksack Tribe study in many of the North Fork tributaries 2660 during that month. This single observation above the criterion does not qualify Maple Creek for 2661 listing, but it is likely that intensive data collected during July would reveal impairment similar 2662 to what has been observed in the other tributaries (Gallop Creek and Cornell Creek for example). 2663 2664 The bottom panel of Figure 2.3.15 shows dissolved oxygen data collected as part of the same 2665 Nooksack Tribe study. Two out of 13 (15.4%) of the observations are below the Class AA 2666 criterion and could qualify Maple Creek for 303(d) listing. Additional sampling focused on 2667 diurnal fluctuations of dissolved oxygen in Maple Creek would help in determining impairment. 2668

100
Water Quality Criterion, 16
2.5
5.0
7.5
10.0
12.5
15.0
17.5
20.0
Jan 96 Apr Jul Oct Jan 97
Time Series for Maple Creek at Mount Baker Highway BridgeT
em
pe
ratu
re -
wa
ter,
C
Date 2669 2670
Water Quality Criterion, 9.5
8.5
9.0
9.5
10.0
10.5
11.0
11.5
12.0
12.5
13.0
13.5
Jan 96 Apr Jul Oct Jan 97
Time Series for Maple Creek at Mount Baker Highway Bridge
Oxy
ge
n -
dis
solv
ed
, m
g/L
Date 2671 Figure 2.3.15. Nooksack Tribe Temperature and Dissolved Oxygen Data for Maple Creek 2672 at Mt. Baker Highway (Nooksack-19). 2673 2674 2675

101
Boulder Creek, Cornell Creek, Gallop Creek, Thompson Creek, and Deadhorse Creek 2676 The 1996 Nooksack Tribe study (Nooksack Water Department, 1998) recorded dissolved oxygen 2677 concentrations near the mouths of each of these creeks that are at or below the Class AA 2678 criterion (9.5 mg/L). Figures 2.3.16 – 2.3.20 show time series of the dissolved oxygen 2679 observations at each of these locations. 2680 2681 In each case, minimum dissolved oxygen concentrations were observed in the months of July 2682 and August, which corresponds with the periods of maximum air and water temperature. 2683 However, the bimonthly data collected by the Nooksack Tribe do not account for diurnal 2684 fluctuations in dissolved oxygen concentrations. Characterization of the diurnal fluctuations 2685 could help in determining whether dissolved oxygen concentrations are related mainly to 2686 fluctuations in water temperature or other causative factors like oxygen demanding material, 2687 groundwater effects, or primary productivity dynamics. While it remains uncertain whether 2688 dissolved oxygen concentrations in these creeks are controlled primarily by water temperature, 2689 dissolved oxygen will likely remain a potential problem as long as some of the creeks are 2690 reaching temperatures at which the solubility of oxygen as predicted by Henry’s Law is below 2691 the water quality criterion. 2692 2693 Three of these creeks potentially qualify for 303(d) listing based on the 1996 Nooksack Tribe 2694 data: Cornell Creek with 2 out of 16 (12.5%) observations below the criterion, Gallop Creek 2695 with 6 out of 16 (37.5%) observations below the criterion, and Thompson Creek with 2 out of 15 2696 (13.3%) observations below the criterion. The 1992 LNR study (Neff, 1993a) recorded a single 2697 dissolved oxygen observation in Gallop, Cornell, Canyon, Boulder, and Maple Creeks, all of 2698 which were below the water quality criterion. 2699 2700
Water Quality Criterion, 9.5
9.0
9.5
10.0
10.5
11.0
11.5
12.0
12.5
13.0
13.5
Jan 96 Apr Jul Oct Jan 97
Time Series for Boulder Creek at Mount Baker Highway
Oxy
ge
n -
dis
solv
ed
, m
g/L
Date 2701 Figure 2.3.16. 1996 Nooksack Tribe Dissolved Oxygen Data for Boulder Creek (Nooksack-2702 20). 2703

102
Water Quality Criterion, 9.5
8.5
9.0
9.5
10.0
10.5
11.0
11.5
12.0
12.5
13.0
13.5
Jan 96 Apr Jul Oct Jan 97
Time Series for Cornell Creek at Mount Baker Highway BridgeO
xyg
en
- d
isso
lve
d,
mg
/L
Date 2704 Figure 2.3.17. 1996 Nooksack Tribe Dissolved Oxygen Data for Cornell Creek (Nooksack-2705 18). 2706 2707
Water Quality Criterion, 9.5
8.0
8.5
9.0
9.5
10.0
10.5
11.0
11.5
12.0
12.5
13.0
13.5
Jan 96 Apr Jul Oct Jan 97
Time Series for Gallop Creek at Mount Baker Highway Bridge
Oxy
ge
n -
dis
solv
ed
, m
g/L
Date 2708 Figure 2.3.18. 1996 Nooksack Tribe Dissolved Oxygen Data for Gallop Creek (Nooksack-2709 17). 2710

103
Water Quality Criterion, 9.59.5
10.0
10.5
11.0
11.5
12.0
12.5
13.0
13.5
Jan 96 Apr Jul Oct Jan 97
Time Series for Thompson Creek (Bridge)O
xyg
en
- d
isso
lve
d,
mg
/L
Date 2711 Figure 2.3.19. 1996 Nooksack Tribe Dissolved Oxygen Data for Thompson Creek 2712 (Nooksack-15). 2713 2714
Water Quality Criterion, 9.5
9.0
9.5
10.0
10.5
11.0
11.5
12.0
12.5
13.0
13.5
Dec95
Jan 96 Feb Mar Apr May Jun Jul Aug Sep Oct
Time Series for Deadhorse Creek
Oxy
ge
n -
dis
solv
ed
, m
g/L
Date 2715 Figure 2.3.20. 1996 Nooksack Tribe Dissolved Oxygen Data for Deadhorse Creek 2716 (Nooksack-14). 2717
104
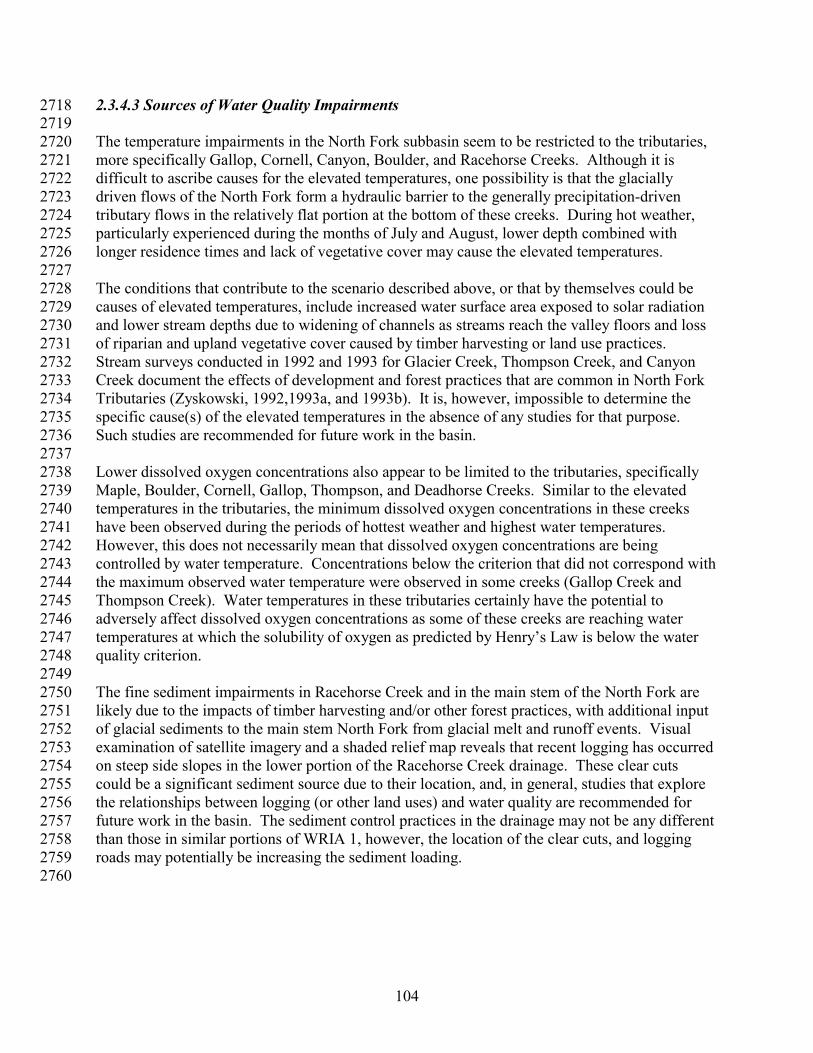
2.3.4.3 Sources of Water Quality Impairments 2718 2719 The temperature impairments in the North Fork subbasin seem to be restricted to the tributaries, 2720 more specifically Gallop, Cornell, Canyon, Boulder, and Racehorse Creeks. Although it is 2721 difficult to ascribe causes for the elevated temperatures, one possibility is that the glacially 2722 driven flows of the North Fork form a hydraulic barrier to the generally precipitation-driven 2723 tributary flows in the relatively flat portion at the bottom of these creeks. During hot weather, 2724 particularly experienced during the months of July and August, lower depth combined with 2725 longer residence times and lack of vegetative cover may cause the elevated temperatures. 2726 2727 The conditions that contribute to the scenario described above, or that by themselves could be 2728 causes of elevated temperatures, include increased water surface area exposed to solar radiation 2729 and lower stream depths due to widening of channels as streams reach the valley floors and loss 2730 of riparian and upland vegetative cover caused by timber harvesting or land use practices. 2731 Stream surveys conducted in 1992 and 1993 for Glacier Creek, Thompson Creek, and Canyon 2732 Creek document the effects of development and forest practices that are common in North Fork 2733 Tributaries (Zyskowski, 1992,1993a, and 1993b). It is, however, impossible to determine the 2734 specific cause(s) of the elevated temperatures in the absence of any studies for that purpose. 2735 Such studies are recommended for future work in the basin. 2736 2737 Lower dissolved oxygen concentrations also appear to be limited to the tributaries, specifically 2738 Maple, Boulder, Cornell, Gallop, Thompson, and Deadhorse Creeks. Similar to the elevated 2739 temperatures in the tributaries, the minimum dissolved oxygen concentrations in these creeks 2740 have been observed during the periods of hottest weather and highest water temperatures. 2741 However, this does not necessarily mean that dissolved oxygen concentrations are being 2742 controlled by water temperature. Concentrations below the criterion that did not correspond with 2743 the maximum observed water temperature were observed in some creeks (Gallop Creek and 2744 Thompson Creek). Water temperatures in these tributaries certainly have the potential to 2745 adversely affect dissolved oxygen concentrations as some of these creeks are reaching water 2746 temperatures at which the solubility of oxygen as predicted by Henry’s Law is below the water 2747 quality criterion. 2748 2749 The fine sediment impairments in Racehorse Creek and in the main stem of the North Fork are 2750 likely due to the impacts of timber harvesting and/or other forest practices, with additional input 2751 of glacial sediments to the main stem North Fork from glacial melt and runoff events. Visual 2752 examination of satellite imagery and a shaded relief map reveals that recent logging has occurred 2753 on steep side slopes in the lower portion of the Racehorse Creek drainage. These clear cuts 2754 could be a significant sediment source due to their location, and, in general, studies that explore 2755 the relationships between logging (or other land uses) and water quality are recommended for 2756 future work in the basin. The sediment control practices in the drainage may not be any different 2757 than those in similar portions of WRIA 1, however, the location of the clear cuts, and logging 2758 roads may potentially be increasing the sediment loading.2759
2760