22@ barcelona - economic activity analysis (june 2015)
TRANSCRIPT

22@ Barcelona22@ Barcelona
Economic activity analysisEconomic activity analysisy yy y
June 2015

22
1 METHODOLOGY
2 BUSINESS CONTEXT
3 WORKERS
4
5
BUSINESS ACTIVITY
BUSINESS ENVIRONMENT
6 ANNEX

33
1 CONTEXT1. METHODOLOGY1. METHODOLOGY1. METHODOLOGY1. METHODOLOGY
2 OBJECTIVES
3 INFORMATION SOURCES
4 MAP OF DISTRICT 22@
5 CLASSIFICATION CRITERIA

878‐206‐60 22@ BARCELONA. ECONOMIC ACTIVITY ANALYSIS
1 CONTEXT
METHODOLOGY11. CONTEXT
Barcelona City Council is promoting key economic sectors that are knowledge‐intensive, bringing high added value as a driving strategy behind the city’s growth model. These activities act as a magnet and a generator of jobs.
This commitment to transform traditional industrial areas into an innovation cluster is most obvious in the district called 22@.
The Council is well aware of the challenges that leading and managing this process brings. To do so, it is essential to have indicators to measure trends systematically in order to take appropriate strategic decisions.
In the following pages, GAPS will present a proposal that aims to collect and analyse available information on the overall economic activity of district 22@, with special attention to knowledge‐intensive sectors (@activity).
For GAPS, this project represents the 6th wave in a series of analyses that it has carried out on the business district, starting in 2007 and that have been repeated periodically in the years 2008, 2009, 2010 and 2012.
44

878‐206‐60 22@ BARCELONA. ECONOMIC ACTIVITY ANALYSIS
2 OBJECTIVES
METHODOLOGY12. OBJECTIVES
The main objectives that GAPS wants to cover are:
Broaden the business data available in official records by obtaining first hand 1 Broaden the business data available in official records by obtaining first-hand information by getting in touch with companies.
2 Diagnosis of the economic activity in 22@Barcelona in 2014.
3Identify and analyze the results of the district’s strategic sectors (knowledge intensive activities or ‘@activity’).
4Analysis of the evolution of business activity in 22@ by comparing current data with that of previous periods.
55

878‐206‐60 22@ BARCELONA. ECONOMIC ACTIVITY ANALYSIS
3 INFORMATION SOURCES
METHODOLOGY13. INFORMATION SOURCES
The data in this document is from two different methodologies: firstly, using and updating the 22@ Company Census, and secondly, including the results of a survey on a representative sample of companies located in 22@.
The development of the 22@ Company Census for the year 2014 used the following base information:
• 22@Barcelona Company Census for the year 2012.• Acquisition of commercial databases.
From these databases, the following tasks were carried out:• Adding additional contact information and/or activity detected in the survey
process of 2012. • Incorporation of information provided by municipal technicians during the data
cleaning processcleaning process.• Removing businesses that were no longer active during the period 2012‐2014.• Incorporation of new companies set up during the same period.• Cleaning final adjusted census sections that make up 22@.
C ti t d t ith th i id t d t t d i th l d d i th• Correction to data with those incidents detected in the early rounds during the process of telephone surveys.
Finally, we added an identification field for those companies that are knowledge‐intensive economic activities according to their CNAE 09 classification as defined in methodology
66
economic activities, according to their CNAE_09 classification as defined in methodology carried out by the European Commission Eurostat.

878‐206‐60 22@ BARCELONA. ECONOMIC ACTIVITY ANALYSIS
METHODOLOGY13 INFORMATION SOURCES3. INFORMATION SOURCES
Information obtained from a survey of a representative sample of all companies located in Barcelona’s 22‐@.
The selection of companies reflects the real distribution of businesses in the Business Census of the area, generated by using a company database acquired for the development of this project. In some cases, information was supplemented by interviews with industry experts and business leadersinterviews with industry experts and business leaders.
The Census has not included the self‐employed and sole traders.
Th d t i h t k i t t th f ll i t tifi tiThe data processing has taken into account the following stratification:
Data cleaning of the initial census of more than 9,500 companies. There are 8,223 firms in 22@, according to the 2015 Census. More than 900 companies have contributed via the survey additional information on their main activity number ofMore than 900 companies have contributed via the survey, additional information on their main activity, number of
employees and turnover. A specific note was made on large companies (> 100 employees) 400 companies were selected, according to representation criteria and these answered a wider questionnaire.
Companies that develop knowledge‐intensive activities have been considered, with a control population group.
77

878‐206‐60 22@ BARCELONA. ECONOMIC ACTIVITY ANALYSIS
METHODOLOGY14 MAP OF DISTRICT 22@4. MAP OF DISTRICT 22@
Geographical boundaries of 22@
88
C. Wellington / Av. Meridiana / Pl. de las Glòries Catalanes / Gran Via de les Corts Catalanes / Rambla de Prim / Pl. de Llevant / C. del Taulat / Ronda del Litoral / (seafront)

878‐206‐60 22@ BARCELONA. ECONOMIC ACTIVITY ANALYSIS
METHODOLOGY14 MAP OF DISTRICT 22@4. MAP OF DISTRICT 22@
0801910042080191004308019100440801910048
0801910064080191006508019100660801910067
0801910090080191009108019100920801910093
0801910049080191005008019100510801910052
0801910068080191006908019100700801910071
0801910094080191009508019100960801910097
0801910053080191005408019100550801910056
0801910072080191007308019100740801910075
0801910098080191009908019101000801910101
0801910057080191005808019100590801910060
0801910076080191007708019100780801910079
0801910102080191010308019101040801910235
080191006108019100620801910063
080191008008019100810801910089
08019102360801910237
99
1010
1 NUMBER OF COMPANIES
2. BUSINESS CONTEXT2. BUSINESS CONTEXT2. BUSINESS CONTEXT2. BUSINESS CONTEXT
2 LANDING PERIODS
3 HEADQUARTERS
4 ECONOMIC SECTORS
5 KNOWLEDGE‐INTENSIVE ACTIVITIESACTIVITIES

878‐206‐60 22@ BARCELONA. ECONOMIC ACTIVITY ANALYSIS
METHODOLOGY15 CLASSIFICATION CRITERIA
Classification criteria of knowledge‐intensive economic activities
MANUFACTURING INDUSTRIES (1) SERVICES(2)
5. CLASSIFICATION CRITERIA
HIGH‐TECHNOLOGY: KNOWLEDGE‐INTENSIVE SERVICES
CCAE_2/3 CCAE Description CCAE_2 CCAE Description
21 Manufacture of pharmaceutical products 50 – 51 Maritime and air transport
26 Manufacture of computer and electronic products 58 – 60 Editing; film and video; radio and televisionp p g; ;
30.3 Manufacture of air and spacecraft 61 – 63 Telecommunications services, information technology; information services
MEDIUM‐HIGH‐TECHNOLOGY: 64 – 66 Financial and insurance activities
CCAE_2/3 CCAE Description 69 – 70 Legal and accounting activities; of headquarters and business consultancy
20 M f t f h i l d h i l d t 71 T h i l i f hit t d i i20 Manufacture of chemicals and chemical products 71 Technical services of architecture and engineering
25.4 Manufacture of weapons and ammunition 72 Research and development
27 Manufacture of electrical equipment 73 – 74 Advertising and market research; Other professional, scientific and technical activities
28 Manufacture of machinery and equipment n.e.c. 75 Veterinary activities
29 Manufacture of motor vehicles, trailers and semi‐trailers 78 Activities related to employment
30 Manufacture of other transport equipment 80 Investigation and security activities
32.5 Manufacture of medical and dental instruments and supplies 84 Public administration, defence and compulsory social security
85 Education
86 – 88 Healthcare and social services
90 ‐ 93 Arts, entertainment and recreation
(1) Aggregation of manufacturing industries defined by Eurostat in relation to their technological intensity.
1111
(1) Aggregation of manufacturing industries defined by Eurostat in relation to their technological intensity.(2) Aggregation of services defined by Eurostat as knowledge intensive.Source: European Commission Eurostat; NACE Rev. adaptation base CCAE second base.

878‐206‐60 22@ BARCELONA. ECONOMIC ACTIVITY ANALYSIS
1 NUMBER OF COMPANIES
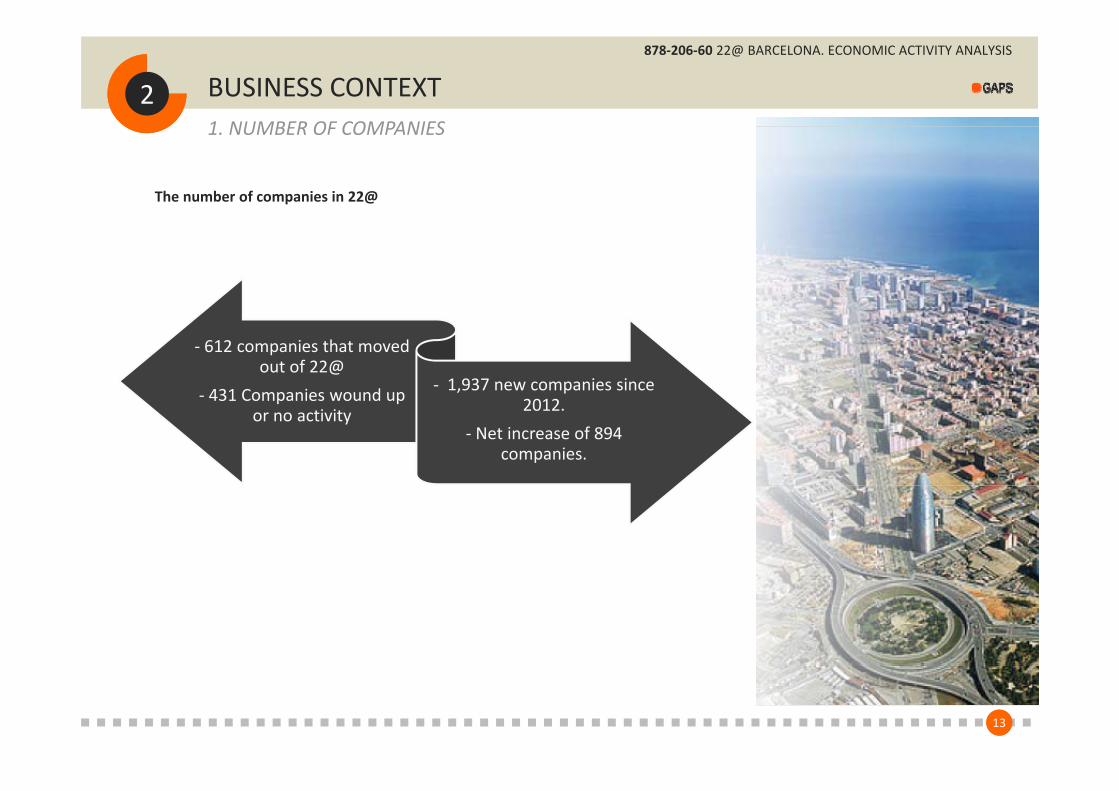
BUSINESS CONTEXT21. NUMBER OF COMPANIES
The number of companies in 22@
8.2238.000
9.000
7.0647.329
5 000
6.000
7.000
8.000
3.437
2 000
3.000
4.000
5.000+12%
+4%
0
1.000
2.000
2000 2010 2012 20152000 2010 2012 2015
1212
878‐206‐60 22@ BARCELONA. ECONOMIC ACTIVITY ANALYSIS
1 NUMBER OF COMPANIES
BUSINESS CONTEXT2
The number of companies in 22@
1. NUMBER OF COMPANIES
‐ 612 companies that movedout of 22@
‐ 431 Companies wound up ‐ 1,937 new companies since ‐ 431 Companies wound up or no activity 2012.
‐ Net increase of 894 companies.
1313
878‐206‐60 22@ BARCELONA. ECONOMIC ACTIVITY ANALYSIS
2 LANDING PERIODS
BUSINESS CONTEXT2
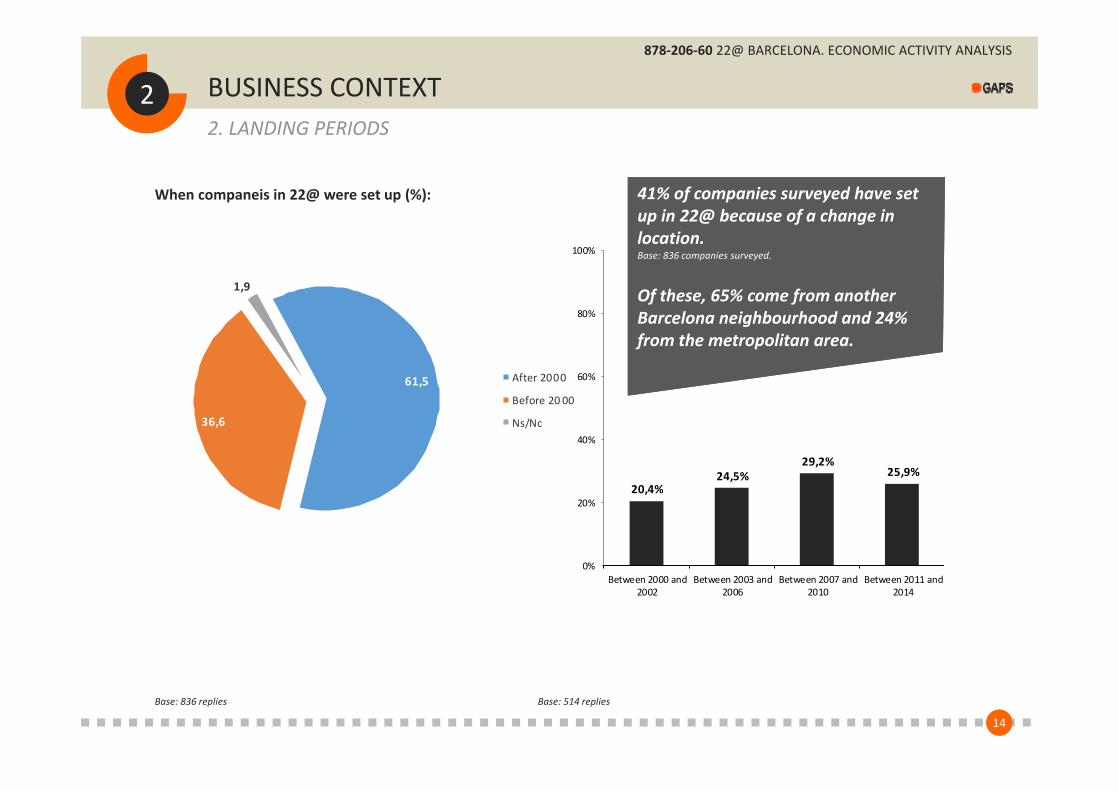
When companeis in 22@ were set up (%):
2. LANDING PERIODS
41% of companies surveyed have set up in 22@ because of a change in41% of companies surveyed have set up in 22@ because of a change in
1,9
100%
up in 22@ because of a change in location.Base: 836 companies surveyed.
Of these, 65% come from another
up in 22@ because of a change in location.Base: 836 companies surveyed.
Of these, 65% come from another
61,5 After 2000 60%
80% Barcelona neighbourhood and 24% from the metropolitan area.Barcelona neighbourhood and 24% from the metropolitan area.
36,6
Before 20 00
Ns/Nc
20 4%24,5%
29,2%25,9%
40%
20,4%
0%
20%
Between 2000 and2002
Between 2003 and2006
Between 2007 and2010
Between 2011 and2014
1414
Base: 836 replies Base: 514 replies

878‐206‐60 22@ BARCELONA. ECONOMIC ACTIVITY ANALYSIS
3 HEADQUARTERS
BUSINESS CONTEXT23. HEADQUARTERS
Location of headquarters (%):Location in 22@ (%):
85,1
93,4
77,280
100
2,9
77,2
Another neighbourhood of Barcelona
22@
40
60
1,1
15,8
Catalonia
Metropolitan Area of Barcelona
14,9
6,6
22,820
1,9
0,4
EU
Spain
0Headquarters Branch/office
2010 2012 2015
0,7
0 20 40 60 80 100
Outside EU
1515
Base: 835 replies

878‐206‐60 22@ BARCELONA. ECONOMIC ACTIVITY ANALYSIS
4 ECONOMIC SECTORS
BUSINESS CONTEXT24. ECONOMIC SECTORS
1,4 1,8 0,7 0,5 0,8100%
22@ companies’ economic activity sector
80%
75,680,1 84,5 87,1 87,7
40%
60%
Others
Services
Manufacturing
20%
40%
22,918,1 14,8 12,5 11,5
0%2001 2005 2010 2012 2015
1616
Base: 8,101 companies with CCAE registration

878‐206‐60 22@ BARCELONA. ECONOMIC ACTIVITY ANALYSIS
5 KNOWLEDGE INTENSIVE ACTIVITIES
BUSINESS CONTEXT25. KNOWLEDGE‐INTENSIVE ACTIVITIES
Knowledge‐intensive activity, 2015
DISTRIBUTION OF ACTIVITIES IN 22@ ACCORDING TO INTENSITY. 2015
32,32%12,42%
Knowledge‐intensiveactivities
Activities notintensive in
High‐intensity activities 32,3%High‐tech manufacturing 0,5%Medium‐high technology manufacturing 1,9%Knowledge‐intensive services 30,0%Lo intensit acti ities 55 3%
55,26%
intensive inknowledge
Not classified
Low‐intensity activities 55,3%Lower‐middle manufacturing technology 2,3%Low‐tech manufacturing 6,8%Services not intensive in knowledge 46,1%Not classified 12 4%Not classified 12,4%
Population: 8,223 companies
1717
Base: 8,101 companies and CCAE information

878‐206‐60 22@ BARCELONA. ECONOMIC ACTIVITY ANALYSIS
5 KNOWLEDGE INTENSIVE ACTIVITIES
BUSINESS CONTEXT2
Trends in knowledge‐intensive activities
5. KNOWLEDGE‐INTENSIVE ACTIVITIES
1818
Population: 8,223 companiesBase: 8,101 companies and CCAE information

878‐206‐60 22@ BARCELONA. ECONOMIC ACTIVITY ANALYSIS
5 KNOWLEDGE INTENSIVE ACTIVITIES
BUSINESS CONTEXT2
Distribution of high‐intensity activities in 22@
5. KNOWLEDGE‐INTENSIVE ACTIVITIES
HIGH‐INTENSITY ACTIVITIES 22@. 2015HIGH‐INTENSITY ACTIVITIES (Base CCAE_09) 32.3%High‐technology manufacturers 0.5%Manufacture of pharmaceutical products (21) 0.1%
Information and communications 9%Editing, film, video, radio and television and sound.Manufacture of pharmaceutical products (21) 0.1%
Manufacture of computer and electronic products (26) 0.4%Manufacture of air and spacecraft (303) 0.0%Medium‐high‐technology manufacturers: 1.9%Manufacture of chemicals (20) 0.5%
f f ( )
Telecommunications, information technology, information services.
Manufacture of weapons and ammunition (254) 0.0%Manufacture of machinery, electrical equipment and transport material (27 to 30) 1.2%
Manufacture of medical and dental instruments and supplies (325) 0.2%Knowledge‐intensive services 30.0%
Professional, scientific and technical activities: 13.4%
Maritime and air transport (50 a 51) 0.0%Information and communications (58 to 63) 9.0%Financial and insurance activities (64 to 66) 2.2%Professional, scientific and technical activities (69 to 75) 13.4%Activities related to employment (78) 0 2%
technical activities: 13.4%Law and accounting, consulting, architecture and engineering.R&D, advertising, market research, design photography translationActivities related to employment (78) 0.2%
Investigation and security activities (80) 0.3%Education (85) 1.2%Healthcare and social services (86 to 88) 1.4%Arts, entertainment and recreation activities (90 to 93) 2.3%
design, photography, translation.Veterinary services.
1919
878‐206‐60 22@ BARCELONA. ECONOMIC ACTIVITY ANALYSIS
5 KNOWLEDGE INTENSIVE ACTIVITIES
BUSINESS CONTEXT2
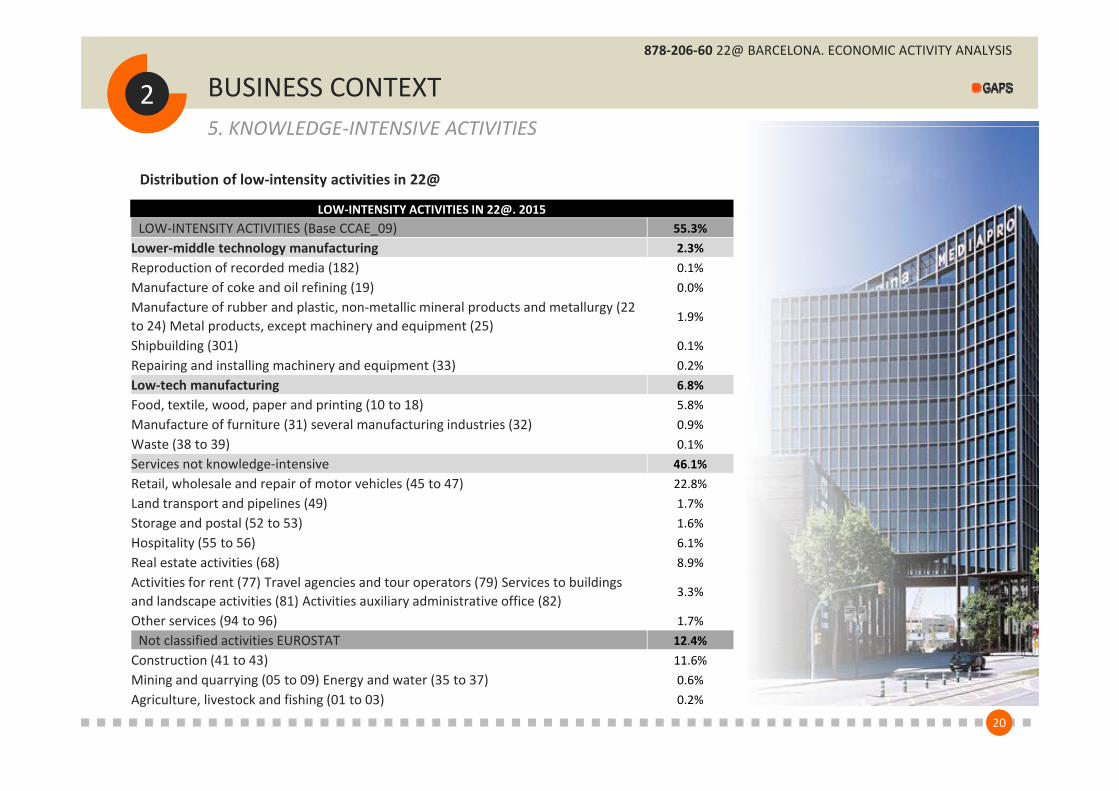
Distribution of low‐intensity activities in 22@
5. KNOWLEDGE‐INTENSIVE ACTIVITIES
LOW‐INTENSITY ACTIVITIES IN 22@. 2015LOW‐INTENSITY ACTIVITIES (Base CCAE_09) 55.3%
Lower‐middle technology manufacturing 2.3%Reproduction of recorded media (182) 0.1%Manufacture of coke and oil refining (19) 0.0%Manufacture of rubber and plastic non metallic mineral products and metallurgy (22Manufacture of rubber and plastic, non‐metallic mineral products and metallurgy (22 to 24) Metal products, except machinery and equipment (25)
1.9%
Shipbuilding (301) 0.1%Repairing and installing machinery and equipment (33) 0.2%Low‐tech manufacturing 6.8%Food, textile, wood, paper and printing (10 to 18) 5.8%Manufacture of furniture (31) several manufacturing industries (32) 0.9%Waste (38 to 39) 0.1%Services not knowledge‐intensive 46.1%Retail wholesale and repair of motor vehicles (45 to 47) 22 8%Retail, wholesale and repair of motor vehicles (45 to 47) 22.8%Land transport and pipelines (49) 1.7%Storage and postal (52 to 53) 1.6%Hospitality (55 to 56) 6.1%Real estate activities (68) 8.9%Activities for rent (77) Travel agencies and tour operators (79) Services to buildings and landscape activities (81) Activities auxiliary administrative office (82)
3.3%
Other services (94 to 96) 1.7%Not classified activities EUROSTAT 12.4%
Construction (41 to 43) 11.6%
2020
( )Mining and quarrying (05 to 09) Energy and water (35 to 37) 0.6%Agriculture, livestock and fishing (01 to 03) 0.2%

2121
1 TOTAL OF BUSINESSES
3. WORKERS3. WORKERS3. WORKERS3. WORKERS
2 VOLUME OF WORKERS
3 PROFILE OF WORKERS
878‐206‐60 22@ BARCELONA. ECONOMIC ACTIVITY ANALYSIS
1 TOTAL OF BUSINESSES
WORKERS31. TOTAL OF BUSINESSES
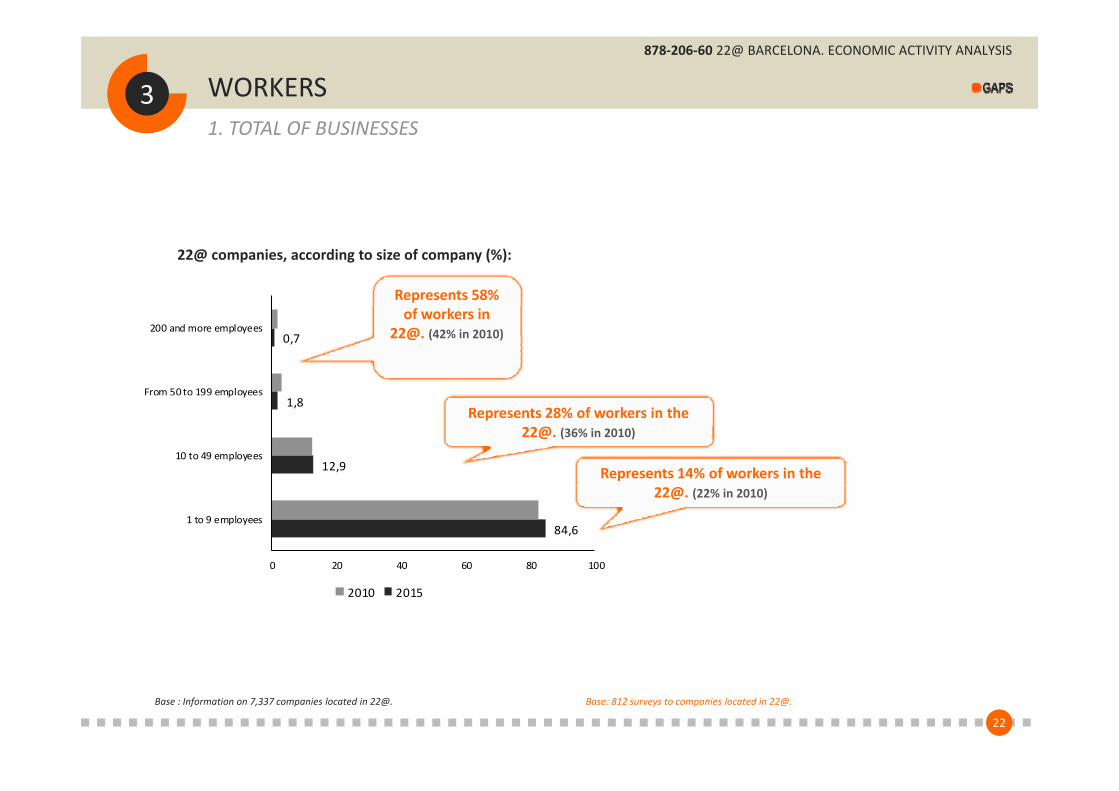
22@ companies, according to size of company (%):
Represents 58%
0,7
From 50 to 199 employees
200 and more employeesof workers in
22@. (42% in 2010)
12,9
1,8
10 to 49 employees
p y
Represents 14% of workers in the
Represents 28% of workers in the 22@. (36% in 2010)
84,6
0 20 40 60 80 100
1 to 9 employees
22@. (22% in 2010)
2010 2015
2222
Base : Information on 7,337 companies located in 22@. Base: 812 surveys to companies located in 22@.

878‐206‐60 22@ BARCELONA. ECONOMIC ACTIVITY ANALYSIS
2 VOLUME OF WORKERS
WORKERS32. VOLUME OF WORKERS
Estimated number of workers in 22@
‐6% +10%
2323

878‐206‐60 22@ BARCELONA. ECONOMIC ACTIVITY ANALYSIS
3 PROFILE OF WORKERS
WORKERS33. PROFILE OF WORKERS
Women represent on average 35.5% Women represent on average 35.5% p gof all workers in 22@.
p gof all workers in 22@.
Workers with university degrees represent on average 32.2% of all workers in 22@
Workers with university degrees represent on average 32.2% of all workers in 22@workers in [email protected] in 22@.
Foreign workers represent on average 11% of all workers in 22@. 2 out of 3 firms do not have any of these.
Foreign workers represent on average 11% of all workers in 22@. 2 out of 3 firms do not have any of these.
2424
Base: 836 replies

2525
1 TURNOVER
4. 4. BUSINESS ACTIVITYBUSINESS ACTIVITY4. 4. BUSINESS ACTIVITYBUSINESS ACTIVITY
2 STRATEGIC CLUSTERS
3 EXPORTS
R D ACTIVITY4
5
R+D ACTIVITY
2.0 ENVIRONMENT
6 INNOVATION
7 BRAND IMAGE

878‐206‐60 22@ BARCELONA. ECONOMIC ACTIVITY ANALYSIS
1 TURNOVER
BUSINESS ACTIVITY41. TURNOVER
Estimation of the turnover of companies in 22@(Millions of Euros)
+2%
2626

878‐206‐60 22@ BARCELONA. ECONOMIC ACTIVITY ANALYSIS
2 STRATEGIC CLUSTERS
BUSINESS ACTIVITY42. STRATEGIC CLUSTERS
Companies with their main business activity in a sector cluster (%):
YesNo
Yes40,4%
59,6%
0,0%
0,0%
4 out of 10 companies surveyed believe that their main activity is part of a proposed sector cluster. Unlike in 2012, retail has been included as a business sector cluster.Additionally, 2.3% of companies surveyed believe that their secondary activity is also part of a sector cluster.
2727
Base: 812 replies

878‐206‐60 22@ BARCELONA. ECONOMIC ACTIVITY ANALYSIS
2 STRATEGIC CLUSTERS
BUSINESS ACTIVITY4
Main activity cluster (%):
2. STRATEGIC CLUSTERS
6,3
7,8
Design / Culture / Media
Information and communications technology (ICT) / Mobile
3,0
4,1
Logistics and freight
Tourism
1,5
1,6
Bi t h l bi di i d di l t h l
Agrifoods
Logistics and freight
0,2
1,1Energy and environment / Electric Vehicle
Biotechnology, biomedicine and medical technology
59 6
14,9
0,2
Retail
Higher education and research
2828
59,6
0 20 40 60 80 100
No part of any cluster sector
2015 2012
Base: 812 replies

878‐206‐60 22@ BARCELONA. ECONOMIC ACTIVITY ANALYSIS
3 EXPORTS
BUSINESS ACTIVITY4
Companies according to export activity (%)
3. EXPORTS
Type of internationalization process (%)
100
Companies according to export activity (%)
1,7Ns / Nc
Type of internationalization process (%)
74,8 75,1 72,6
60
80
16,5
8,7
Commercial operations abroad
Production operations abroad
23,5 24,9 27,4
20
40
40,9
50,4
Sporadic exports
Consolidated exports
0
20
Exporters Not exporters On average 38% of exporting
0 20 40 60 80 100Base: 136 multiple responses from 115 companies.
Base: 836 replies.
2010 2012 2015O a e age 38% o e po t gcompanies' revenues come fromsales abroad. Base: 89 replies
2929
878‐206‐60 22@ BARCELONA. ECONOMIC ACTIVITY ANALYSIS
3 EXPORTS
BUSINESS ACTIVITY4
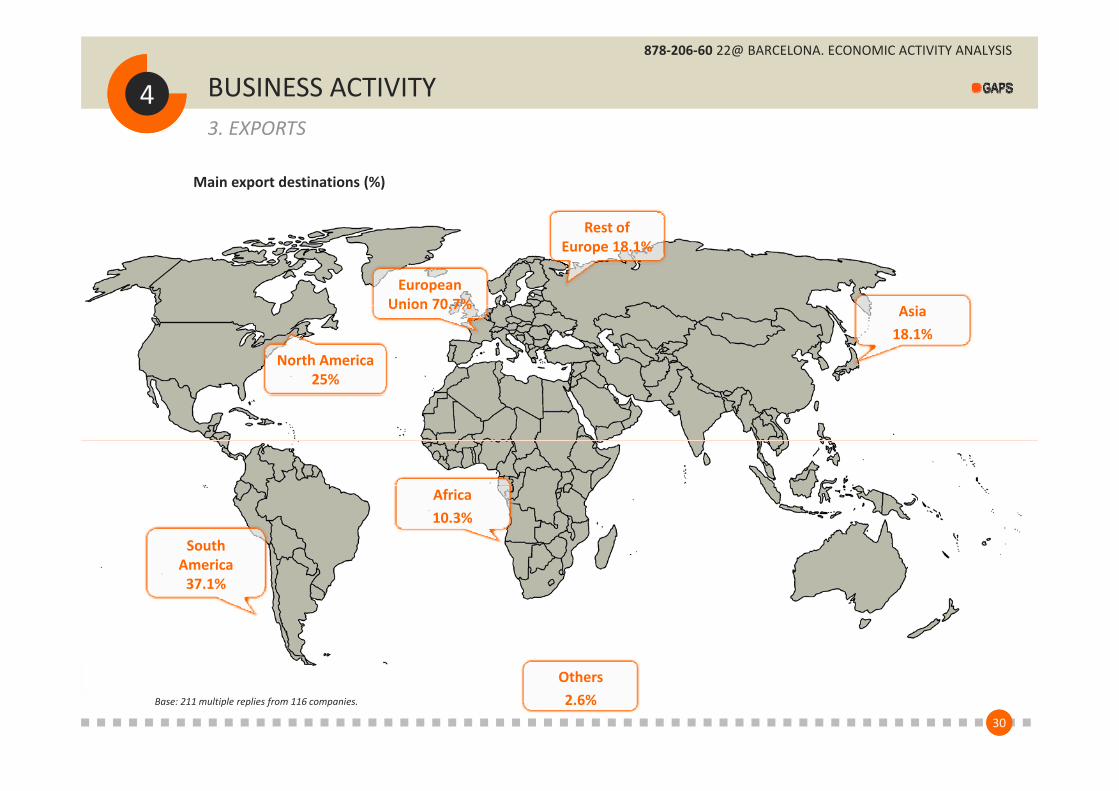
Main export destinations (%)
3. EXPORTS
Rest of Europe 18.1%
i
EuropeanUnion 70 7% Asia
18.1%
North America25%
Union 70.7%
Africa10.3%
SouthAmerica37.1%
3030
Base: 211 multiple replies from 116 companies.
Others2.6%
878‐206‐60 22@ BARCELONA. ECONOMIC ACTIVITY ANALYSIS
4 R+D ACTIVITY
BUSINESS ACTIVITY4
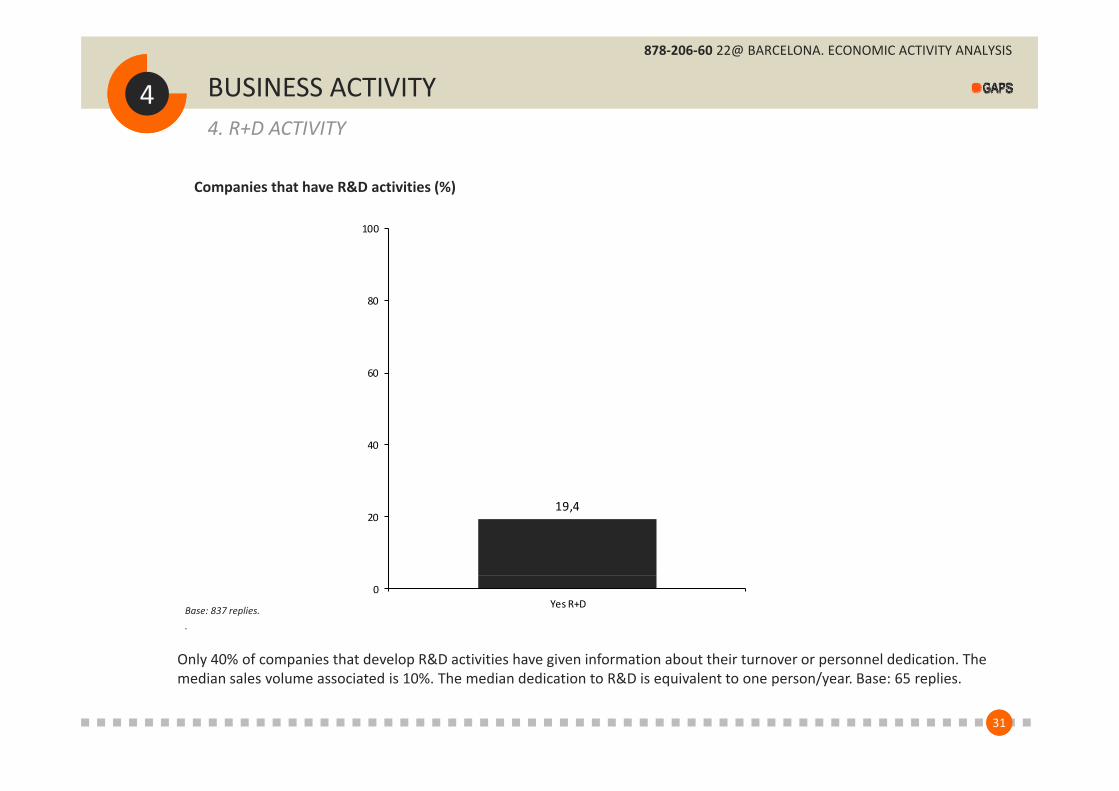
Companies that have R&D activities (%)
4. R+D ACTIVITY
80
100
60
40
19,420
Base: 837 replies..
0Yes R+D
Only 40% of companies that develop R&D activities have given information about their turnover or personnel dedication. The
3131
y p p g pmedian sales volume associated is 10%. The median dedication to R&D is equivalent to one person/year. Base: 65 replies.
878‐206‐60 22@ BARCELONA. ECONOMIC ACTIVITY ANALYSIS
4 R+D ACTIVITY
BUSINESS ACTIVITY44. R+D ACTIVITY
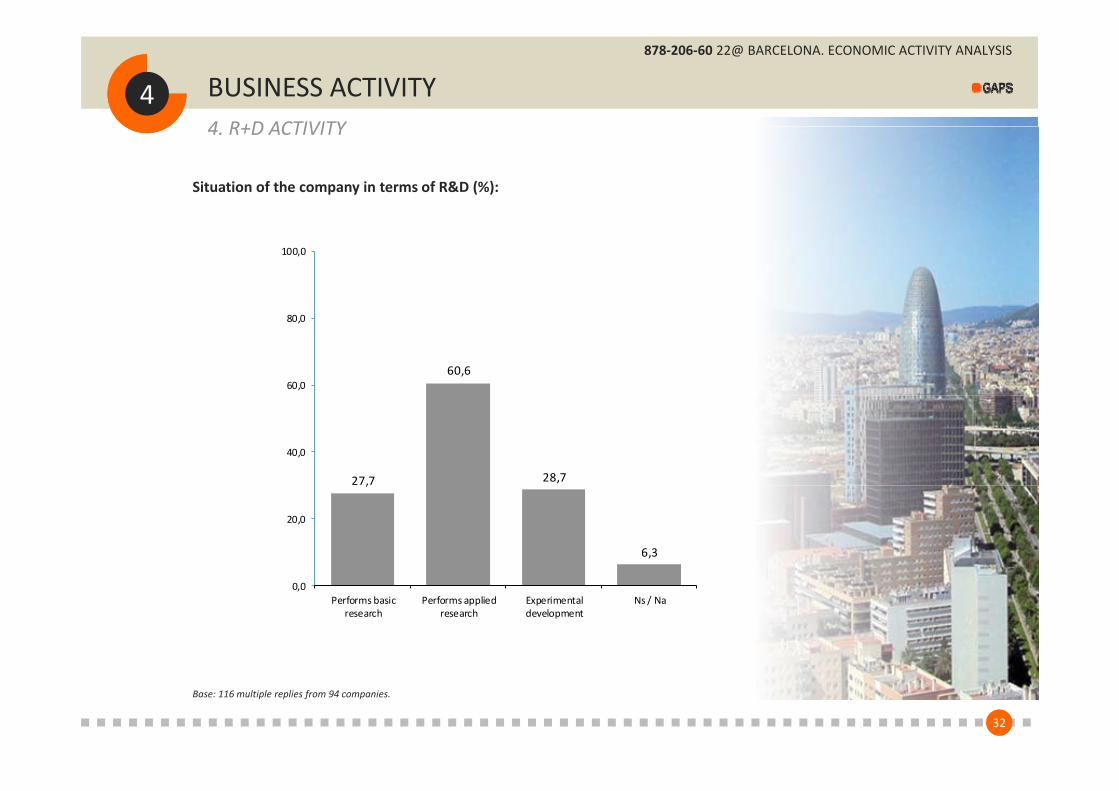
Situation of the company in terms of R&D (%):
100,0
60,660,0
80,0
27,7 28,7
40,0
,
6,3
20,0
0,0Performs basic
researchPerforms applied
researchExperimentaldevelopment
Ns / Na
3232
Base: 116 multiple replies from 94 companies.

878‐206‐60 22@ BARCELONA. ECONOMIC ACTIVITY ANALYSIS
5 2 0 ENVIRONMENT
BUSINESS ACTIVITY45. 2.0 ENVIRONMENT
A corporate website and use of social media and e‐commerce are used by
th h lf f th iCompanies that regularly use the following tools (%)
more than half of the companies surveyed with knowledge‐intensive activities.
28 1
2,2
Telework ‐ Distance Work
Ns / Na
.
.
39 7
33,2
28,1
Intranet internalweb work
Mobile applications
Telework Distance Work
55 7
42,4
39,7
Purchase / sale online
Applications in the cloud ‐ Cloud computing
Intranet, internal web work
65,4
55,7
C b i
Social networks (twitter, facebook, linkedin ...)
Purchase / sale online
76,5
0,0 20,0 40,0 60,0 80,0 100,0
Corporate website
3333
Base: 1,270 multiple replies from 370 companies.
878‐206‐60 22@ BARCELONA. ECONOMIC ACTIVITY ANALYSIS
6 INNOVATION
BUSINESS ACTIVITY4
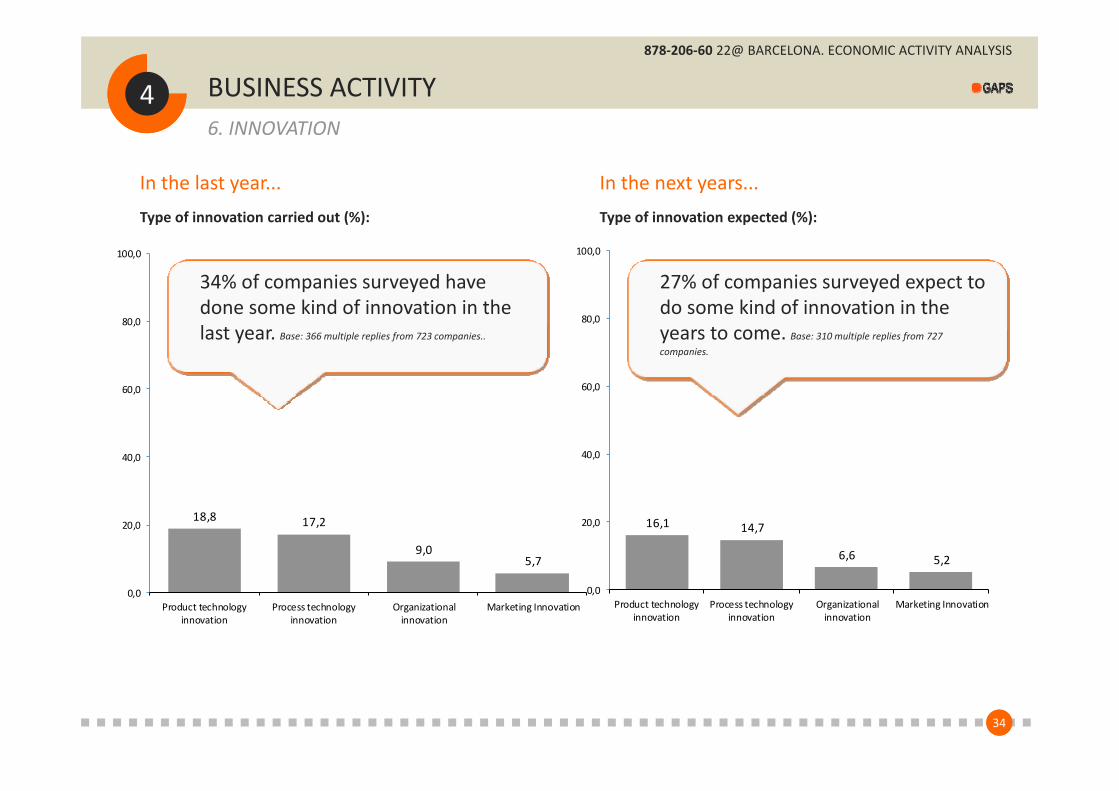
Type of innovation carried out (%):
6. INNOVATION
In the last year...Type of innovation expected (%):
In the next years...
100,0
Type of innovation carried out (%):
34% of companies surveyed have done some kind of innovation in the
100,0
Type of innovation expected (%):
27% of companies surveyed expect to do some kind of innovation in the
60,0
80,0done some kind of innovation in the last year. Base: 366 multiple replies from 723 companies..
60,0
80,0do some kind of innovation in the years to come. Base: 310 multiple replies from 727 companies.
40,0 40,0
18,8 17,2
9,05,7
20,0 16,1 14,7
6,6 5,2
20,0
0,0Product technology
innovationProcess technology
innovationOrganizationalinnovation
Marketing Innovation0,0
Product technologyinnovation
Process technologyinnovation
Organizationalinnovation
Marketing Innovation
3434
3535
1 22@ BRAND IMAGE
5. BUSINESS ENVIRONMENT5. BUSINESS ENVIRONMENT5. BUSINESS ENVIRONMENT5. BUSINESS ENVIRONMENT
2 LAST THREE YEARS
OUTLOOK FOR THE NEXT YEARS3

878‐206‐60 22@ BARCELONA. ECONOMIC ACTIVITY ANALYSIS
BUSINESS ENVIRONMENT5 1. BRAND IMAGE
What word do you identify 22@ with? :
BRAND IMAGE
37% of respondents believe that the 22@ brand adds value to their company.
3636
Base: 370 replies.

878‐206‐60 22@ BARCELONA. ECONOMIC ACTIVITY ANALYSIS
BUSINESS ENVIRONMENT52 LAST THREE YEARS
In the last three years...
2. LAST THREE YEARS
Your company’s business performance has been... (%):
2012 2015
38%
2015
37%22%
3%
Increasing Stable Decreasing NS/NA
The perception that business performance has been improving over the past three years is on the up, growing from 12% in 2012 to 37% today; for the next year, the forecast is up to 61% The main risk fa tor remains ‘ eak demand’ hile the fa tor ‘ ompetition’ is no
Base: 370 responses to a comprehensive questionnaire
3737
61%. The main risk factor remains ‘weak demand’, while the factor ‘competition’ is now more important than ‘financing’.

878‐206‐60 22@ BARCELONA. ECONOMIC ACTIVITY ANALYSIS
BUSINESS ENVIRONMENT52 LAST THREE YEARS
Ri k f t t b i (%)
In the last three years...
2. LAST THREE YEARS
Risk factors to your business are (%):
Base: 370 replies
3838

878‐206‐60 22@ BARCELONA. ECONOMIC ACTIVITY ANALYSIS
BUSINESS ENVIRONMENT53 OUTLOOK FOR THE NEXT YEAR
Outlook for the next year…
3. OUTLOOK FOR THE NEXT YEAR
...The business performance of your company will (%):
2012
61%
34%
3%
2%2%Increase Remain stable Decrease Ns/Na
3939
Base: 370 replies.

878‐206‐60 22@ BARCELONA. ECONOMIC ACTIVITY ANALYSIS
BUSINESS ENVIRONMENT53 OUTLOOK FOR THE NEXT YEAR
Outlook for the next year ...
3. OUTLOOK FOR THE NEXT YEAR
The price level of your products / services will (%):2012
The number of people employed in your company will (%):
59% 2012
35%
2%4%
4040
Increase Remain stable Decrease Ns/NaBase: 370 replies

878‐206‐60 22@ BARCELONA. ECONOMIC ACTIVITY ANALYSIS
BUSINESS ENVIRONMENT53 OUTLOOK FOR THE NEXT YEAR
Outlook for the next year ...
3. OUTLOOK FOR THE NEXT YEAR
Investments in general will:2012
53%
37%
5%5%
Increase Remain stable Decrease Ns/Na
4141
Base: 370 resplies

878‐206‐60 22@ BARCELONA. ECONOMIC ACTIVITY ANALYSIS
BUSINESS ENVIRONMENT53 OUTLOOK FOR THE NEXT YEAR
Outlook for the next year...
3. OUTLOOK FOR THE NEXT YEAR
Turnover abroad will : 2012
1%2%
65%
Increase
Remain stable
21%
11% Decrease
Ns/Na
No export sales
4242
Base: 370 replies
878‐206‐60 22@ BARCELONA. ECONOMIC ACTIVITY ANALYSIS
5 BUSINESS ENVIRONMENT3 OUTLOOK FOR THE NEXT YEAR
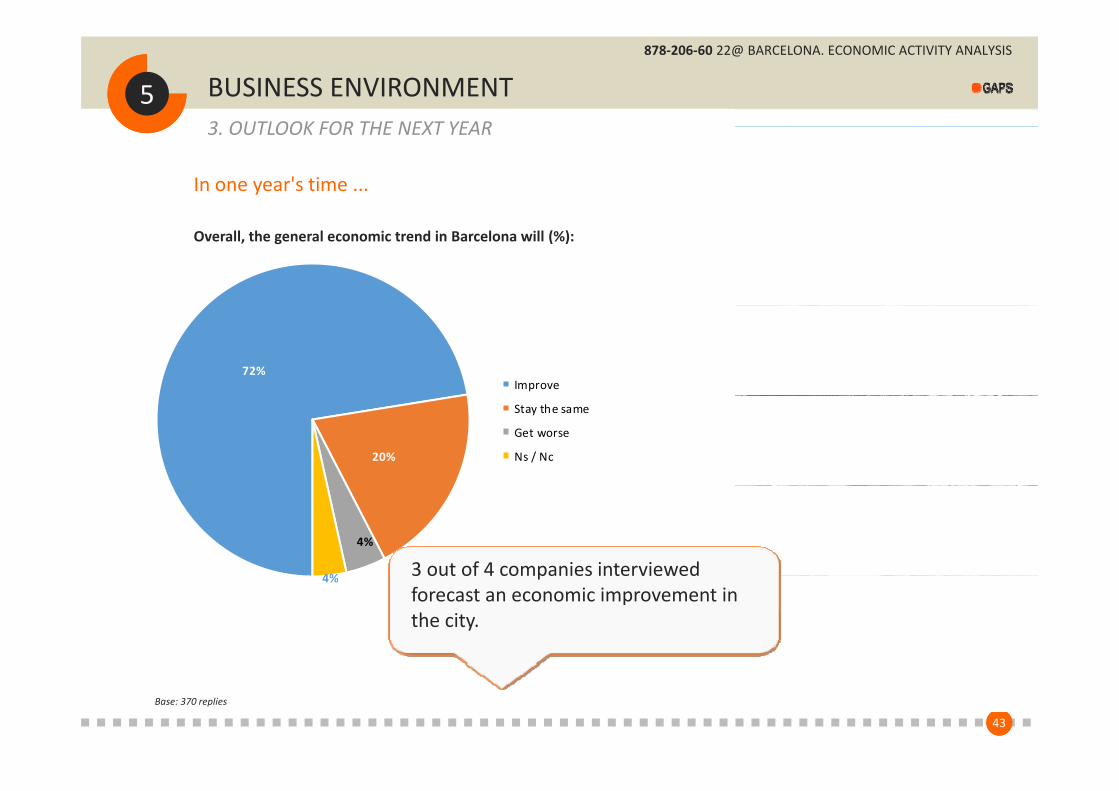
In one year's time ...
3. OUTLOOK FOR THE NEXT YEAR
Overall, the general economic trend in Barcelona will (%):
72%Improve
20%
Stay the same
Get worse
Ns / Nc
4%
4% 3 out of 4 companies interviewed4% 3 out of 4 companies interviewed forecast an economic improvement in the city.
4343
Base: 370 replies

4444
1 TECHNICAL INFORMATION
6. ANNEX6. ANNEX6. ANNEX6. ANNEX
2SURVEY

878‐206‐60 22@ BARCELONA. ECONOMIC ACTIVITY ANALYSIS
1 TECHNICAL INFORMATION
ANNEX6
h ll h ll
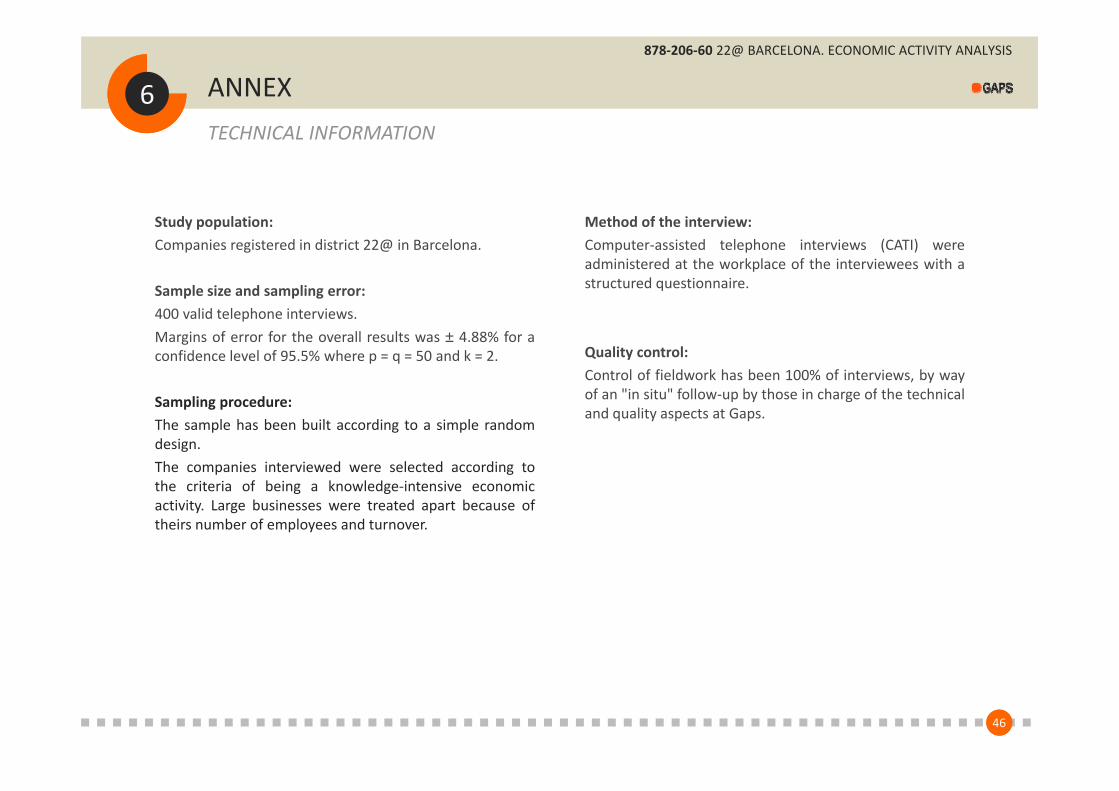
1. TECHNICAL INFORMATION
Focus on the major companies in 22@Barcelona
Special attention was given to companies with more than 100 workers, with the aim of obtaining information from as many of these as possible given their relative weight
Telephone calls to 22@ companies
To achieve objectives, we used the following methodological procedure:
as many of these as possible, given their relative weight across the entire business district.
Besides Gaps’ extraordinary job collecting data from these large companies, it is critical to have the direct
Telephone calls to a sample of registered companies to detect changes, new companies and those wound up.Up to five telephone calls on different days and different times If effective participation was not achieved it was g p ,
collaboration of municipal officials in order to ensure maximum participation.
times. If effective participation was not achieved it was classified as ‘rejected’ or ‘unreachable’.’
Brief form was completed for each company (CATI survey) to validate and broaden information available on the registers. In the case of knowledge‐intensive companies and/or technology‐intensive companies the following information was sought: company name, address, cluster, web and e‐mail, the number of workers in 22@, turnover, R&D carried out origin of majority of share capital yearR&D carried out, origin of majority of share capital, year when set up in 22@ or when founded.
4545
878‐206‐60 22@ BARCELONA. ECONOMIC ACTIVITY ANALYSIS
TECHNICAL INFORMATION
ANNEX6
h d f hd l
TECHNICAL INFORMATION
Method of the interview:Computer‐assisted telephone interviews (CATI) wereadministered at the workplace of the interviewees with astructured questionnaire.
Study population:Companies registered in district 22@ in Barcelona.
Sample size and sampling error:
Quality control:Control of fieldwork has been 100% of interviews, by wayof an "in situ" follow‐up by those in charge of the technical
400 valid telephone interviews.Margins of error for the overall results was ± 4.88% for aconfidence level of 95.5% where p = q = 50 and k = 2.
of an in situ follow‐up by those in charge of the technicaland quality aspects at Gaps.
Sampling procedure:The sample has been built according to a simple randomdesign.The companies interviewed were selected according tothe criteria of being a knowledge intensive economicthe criteria of being a knowledge‐intensive economicactivity. Large businesses were treated apart because oftheirs number of employees and turnover.
4646

878‐206‐60 22@ BARCELONA. ECONOMIC ACTIVITY ANALYSIS
6 ANNEX2 SURVEY2. SURVEY
4747

878‐206‐60 22@ BARCELONA. ECONOMIC ACTIVITY ANALYSIS
6 ANNEX2 SURVEY2. SURVEY
4848

878‐206‐60 22@ BARCELONA. ECONOMIC ACTIVITY ANALYSIS
6 ANNEX2 SURVEY2. SURVEY
4949

878‐206‐60 22@ BARCELONA. ECONOMIC ACTIVITY ANALYSIS
6 ANNEX2 SURVEY2. SURVEY
5050

Còrsega, 391, entl. 2a ‐ 08037 Barcelona Tel. 93 208 25 90www.gaps.cat