2147 sacn hidden urbanities report 2016 - sa … hidden...executive summary apartheid planning left...
TRANSCRIPT


ForewordThis study forms the third in a series of exploratory papers that seek to � nd understanding and give
practical expression to what is meant by the ‘differentiated approach to governance.’ In 2012, we worked
with strategic partners to de� ne South Africa’s ‘secondary cities’. In 2014, we went further and undertook
a deeper qualitative study into six secondary or intermediary cities, in an effort to � nd what might be
different or unique about these places compared to, for example, metropolitan municipalities.
This issue of differentiation is becoming increasingly important, as shown by the forthcoming Global
Report on Decentralization and Local Democracy (GOLD IV). United Cities and Local Governments (UCLG)
has also established an international Working Group and is consolidating a position on intermediate
cities to be included in Habitat III (UN Habitat),
We are pleasantly surprised to � nd that, through this series of exploratory studies, South Africa is a
signi� cant contributor to the global discourse on the subject, as a result of our early empirical and intellectual
efforts. Indeed, this is the kind of space that the South African Cities Network has always sought to occupy
– that of contributing to de� ning and seeking answers to local questions and issues, while linking into the
global communities of practice that have an interest in urban governance issues.
Locally, we continue to view the explorations, analyses and debates on differentiation as important for
achieving a holistic urban agenda. With the rati� cation of South Africa’s � rst Integrated Urban
Development Framework (www.iudf.net), we hope that we are getting closer to consolidating some
knowledge-based, insightful positions about how spatial development and transformation can be
achieved meaningfully, and for all, across the various urban spaces.
As always, we look forward to continuing the explorations and conversations.
Sithole Mbanga
CEO, SA Cities Network
ii

Acknowledgements Lead Author: Prof Lochner Marais
Manager: Dr Geci Karuri-Sebina
Editor: Write to the Point
Design: Ink Design
This project results from ongoing cooperation and conversations relating to differentiated approaches to
urban development with a number of key strategic partners, including the South African Local Government
Association (SALGA) and the Department of Cooperative Governance (COGTA). The ongoing study series
has also bene� ted greatly from the continued partnership and effort of the research team at the University
of the Free State’s Centre for Development Support (CDS), under the stewardship of Prof Lochner Marais.
Due recognition is also given to the range of local and other informants who willingly provided information
and data for the study.
The full case studies (which are available on the SACN website) were respectively authored by:
Botshabelo: Lochner Marais, Lejone Ntema, Kholisa Rani, Mole� Lenka and Jan Cloete
Mdantsane: Pakama Siyongwana and Nelson Chanza (Nelson Mandela Metro University)
Seshego: Jan Cloete and Ruth Massey
Winterveld: John Ntema and Deidré van Rooyen
Photo Credits:
All photos are credited to the respective case study authors unless otherwise indicated.
ISBN No. 978-0-620-69819-1
2016
iii

Contents
Foreword . . . . . . . . . . . . . . . . . . . . . . . . . . . . . . . . . . . . . . . . . . . . . . . . . . . . . . . . . ii
Acknowledgements . . . . . . . . . . . . . . . . . . . . . . . . . . . . . . . . . . . . . . . . . . . . . . . .iii
Contents . . . . . . . . . . . . . . . . . . . . . . . . . . . . . . . . . . . . . . . . . . . . . . . . . . . . . . . . . iv
List of Figures . . . . . . . . . . . . . . . . . . . . . . . . . . . . . . . . . . . . . . . . . . . . . . . . . . . . . vi
List of Tables . . . . . . . . . . . . . . . . . . . . . . . . . . . . . . . . . . . . . . . . . . . . . . . . . . . . . . vi
Executive Summary . . . . . . . . . . . . . . . . . . . . . . . . . . . . . . . . . . . . . . . . . . . . . . . . vii
Part 1: Introduction
Background . . . . . . . . . . . . . . . . . . . . . . . . . . . . . . . . . . . . . . . . . . . . . . . . . . . . . . . . . . 2
Existing research . . . . . . . . . . . . . . . . . . . . . . . . . . . . . . . . . . . . . . . . . . . . . . . . . . . . . . 4
Justi� cation for this study . . . . . . . . . . . . . . . . . . . . . . . . . . . . . . . . . . . . . . . . . . . . . . 5
Methodology . . . . . . . . . . . . . . . . . . . . . . . . . . . . . . . . . . . . . . . . . . . . . . . . . . . . . . . . . 6
Post-apartheid spatial planning frameworks . . . . . . . . . . . . . . . . . . . . . . . . . . . . . . . . 7
Part 2: Overview of the Case Studies
CASE 1. Botshabelo – Place of refugees . . . . . . . . . . . . . . . . . . . . . . . . . . . . . . . . . . 13
CASE 2. Mdantsane – The apartheid ‘paradise’ . . . . . . . . . . . . . . . . . . . . . . . . . . . . 17
CASE 3. Seshego – From township to suburbia . . . . . . . . . . . . . . . . . . . . . . . . . . . . . 21
CASE 4. Winterveld – The once forgotten folk. . . . . . . . . . . . . . . . . . . . . . . . . . . . . . 25
Summary of � ndings . . . . . . . . . . . . . . . . . . . . . . . . . . . . . . . . . . . . . . . . . . . . . . . . . 29

Contents
Part 3: Comparing the cases 32
Government investment in infrastructure . . . . . . . . . . . . . . . . . . . . . . . . . . . . . . . . . . 33
Municipal amalgamation and spatial targeting . . . . . . . . . . . . . . . . . . . . . . . . . . . . . 34
Population and population growth . . . . . . . . . . . . . . . . . . . . . . . . . . . . . . . . . . . . . . . 35
Economic growth . . . . . . . . . . . . . . . . . . . . . . . . . . . . . . . . . . . . . . . . . . . . . . . . . . . . . 37
Poverty levels . . . . . . . . . . . . . . . . . . . . . . . . . . . . . . . . . . . . . . . . . . . . . . . . . . . . . . . 38
Employment and unemployment . . . . . . . . . . . . . . . . . . . . . . . . . . . . . . . . . . . . . . . . . 41
Spatial integration . . . . . . . . . . . . . . . . . . . . . . . . . . . . . . . . . . . . . . . . . . . . . . . . . . . 44
Private investment in housing . . . . . . . . . . . . . . . . . . . . . . . . . . . . . . . . . . . . . . . . . . . 44
Transport expenditure . . . . . . . . . . . . . . . . . . . . . . . . . . . . . . . . . . . . . . . . . . . . . . . . . 45
Schools and education . . . . . . . . . . . . . . . . . . . . . . . . . . . . . . . . . . . . . . . . . . . . . . . . 46
Part 4: Some Lessons for Programmes and Policy
1. Displaced settlements have multiple functional roles . . . . . . . . . . . . . . . . . . . . . . 48
2. The quest for spatial integration and improved densities continues . . . . . . . . . . . 49
3. Large-scale infrastructure investments have locked people in . . . . . . . . . . . . . . . 50
4. An open debate on transport and housing subsidies is needed . . . . . . . . . . . . . . 51
5. Tension between service delivery and strategic spatial planning . . . . . . . . . . . . . 51
Concluding Remarks . . . . . . . . . . . . . . . . . . . . . . . . . . . . . . . . . . . . . . . . . . . . . . . 52
References . . . . . . . . . . . . . . . . . . . . . . . . . . . . . . . . . . . . . . . . . . . . . . . . . . . . . . 53

List of FiguresFigure 1: Location of Botshabelo in Mangaung . . . . . . . . . . . . . . . . . . . . . . . . . . . . . . . . . . . 13
Figure 2: Location of Mdantsane in Buffalo City . . . . . . . . . . . . . . . . . . . . . . . . . . . . . . . . . . 17
Figure 3: Location of Seshego in Polokwane . . . . . . . . . . . . . . . . . . . . . . . . . . . . . . . . . . . . . 21
Figure 4: Location of Winterveld in Tshwane . . . . . . . . . . . . . . . . . . . . . . . . . . . . . . . . . . . . . 26
Figure 5: Improvements in basic service levels in the four settlements (1996, 2001 and 2013) . . . . . . . . . . . . . . . . . . . . . . . . . . . . . . . . . . . . . . . . . . . . . . . 33
Figure 6: Annual population growth rate (2001–2011) . . . . . . . . . . . . . . . . . . . . . . . . . . . . . 35
Figure 7: Annual economic growth rates (1996–2013) . . . . . . . . . . . . . . . . . . . . . . . . . . . . . 37
Figure 8: Human development index (1996 and 2013) . . . . . . . . . . . . . . . . . . . . . . . . . . . . . . 38
Figure 9: Percentage of people living in poverty (2013) . . . . . . . . . . . . . . . . . . . . . . . . . . . . . 39
Figure 10: Percentages of household expenditure spent on food . . . . . . . . . . . . . . . . . . . . . . 40
Figure 11: People employed (1996 and 2013) . . . . . . . . . . . . . . . . . . . . . . . . . . . . . . . . . . . . . . 41
Figure 12: Employment in manufacturing (1996 and 2013) . . . . . . . . . . . . . . . . . . . . . . . . . . . 42
Figure 13: Unemployment in manufacturing (1996 and 2013) . . . . . . . . . . . . . . . . . . . . . . . . . 43
Figure 14: Employment in the household sector (1996 and 2013) . . . . . . . . . . . . . . . . . . . . . . 43
Figure 15: House size and household size, 1996 and 2011 . . . . . . . . . . . . . . . . . . . . . . . . . . . 45
Figure 16: Percentage of household expenditure on public transport (1996 and 2013) . . . . . 46
Figure 17: Percentage of people without any education, 1996 and 2011 . . . . . . . . . . . . . . . . 47
List of TablesTable 1: Geographical terms used for comparing the case studies . . . . . . . . . . . . . . . . . . . . 7
Table 2: A comparison of key attributes related to the four case studies . . . . . . . . . . . . . . 29
Table 3: Population share per age segment (1996 and 2011) . . . . . . . . . . . . . . . . . . . . . . . . 36
vi HIDDEN URBANITIES: SOUTH AFRICA’S DISPLACED SETTLEMENTS

Executive SummaryApartheid planning left South Africa with a distinctive spatial legacy. In� ux control, forced removals and
channelled urbanisation were instrumental in preventing blacks from living in the core urban areas of
South Africa. R293 towns were created expressly to channel black urbanisation away from the core
urban areas to these ‘displaced settlements’ located behind so-called ‘homeland’ boundaries. These
settlements are also sometimes referred to as ‘hidden urbanities’, describing how the apartheid
government tried to hide the urbanisation of black people behind homeland boundaries. They differ from
the ‘black township’ areas created under apartheid, mainly because most of them are further away from
economic core areas. The government introduced incentives, including transport subsidies and tax
holidays, to encourage companies to locate in these areas. However, post-apartheid, the subsidies were
discontinued, leading to companies disinvesting from many of these settlements.
Four case studies were selected to provide a geographical spread. Three case studies were chosen
because of their functional location in relation to existing metropolitan areas, while the fourth case study
was chosen because of its linkages with a secondary city.
CASE STUDIESIn 1979, Botshabelo (Mangaung) was created some 55 km east of Bloemfontein to divert black urbanisation
from Mangaung, Bloemfontein’s historically black township. Post-apartheid, manufacturing declined, as
subsidies fell away, and population growth has been slow, especially compared to the substantial population
growth in Bloemfontein. There was (and still is) pressure from within Botshabelo to have the area declared a
‘special urban development node’, but this has not happened. With the amalgamation of Botshabelo with
Bloemfontein to form one local government structure, considerable investments were made in local services.
However, investment in basic services – in itself a signi� cant driver of investment in housing – together with
a continued bus subsidy may have served to reinforce the spatial deprivation created under apartheid.
In 1959, Mdantsane (Buffalo City) was created halfway between East London and King William’s Town
in order to channel urbanisation from Duncan Village (East London’s original black township) to behind the
Ciskei border. The Regional Industrial Decentralisation Programme led to the establishment of highly
subsidised border industries from 1962 and increased employment – nearly 40 000 job opportunities by
the end of the 1980s. However, from the 1990s, with the withdrawal of subsidies, employment declined
to just over 10 000 jobs in 2013. Post-apartheid, East London and Mdantsane were amalgamated to form
one local government structure – the East London Transitional Local Council, and in 2001 Mdantsane was
declared an urban renewal node. Access to basic services (water, sanitation and electricity) has improved,
but the quality of schools is poor. Despite the large-scale exodus of industries, signi� cant public-sector
investment has occurred through urban renewal projects. However, as in the case of Botshabelo, the
question is whether increased investment in basic services only serves to increase residents' spatial
deprivation, as shown by the fact that Mdantsane’s population has declined in real terms.
viiEXECUTIVE SUMMARY

In 1971, Seshego (Polokwane) was established as the interim capital of Lebowa (a self-governing state in
line with apartheid policies) to channel urbanisation away from Pietersburg (now Polokwane). Seshego was
further developed in terms of both Regulation 293 of 1962 and the regulations for the administration and
control of townships of the Lebowa government. Compared to the other case studies, Seshego is much closer
to its core urban area, only 10 km away from Polokwane. Post-apartheid, deliberate attempts were made to
integrate planning and to develop the corridor between Seshego and Polokwane. Although the population
growth rate declined in Seshego with the demise of apartheid, household income has grown substantially,
suggesting functional and economic integration with Polokwane. The Seshego case study con� rms the
importance of being close to the urban core. This, combined with favourable topography, enabled the in� ll
development between Seshego and Polokwane. As a result, what was once a dormitory town became a
functional neighbourhood and a good example of urban integration in post-apartheid South Africa.
Winterveld (Tshwane) was established as a farming area for black farmers in the mid-1930s. In 1977
it of� cially became part of the ‘independent’ Republic of Bophuthatswana. As apartheid policies resulted
in the forced removal of black people from Attridgeville, Saulsville and Mamelodi and their resettlement
north of Pretoria, Winterveld became a fast-growing squatter settlement. In 2001, Winterveld was
integrated with the Tshwane Metropolitan Municipality and declared a Special Presidential Lead Project.
Signi� cant infrastructure investments followed, including the construction of new houses and the
upgrading of schools. A number of agricultural initiatives were also introduced, with the aim of promoting
rural development in the area. The jury is still out on whether the post-apartheid investments will prove
to be sustainable in the long run. While the investments in Winterveld represent an example of good
intergovernmental cooperation, the long-term cost of sprawling urban infrastructure is not known, and it
is unclear whether Winterveld is an urban or rural settlement.
COMMON ATTRIBUTES OF THESE SETTLEMENTSThe four case studies revealed that care should be taken not to generalise about these displaced
settlements or hidden urbanities. The contexts are different, with (for example) Seshego, and to a lesser
degree Mdantsane, is integrated, whereas Botshabelo and Winterveld are not. However, the four
settlements do share some common attributes: ■ Substantial government investment in basic infrastructure (water, sanitation and electricity)
since the demise of apartheid. ■ Amalgamation with urban core, with the aim of creating integrated functional economic regions and
planning systems, and distributing resources and institutional capacity to the displaced settlements. Only
one case study – Seshego – achieved some spatial integration with its core economic area. ■ Spatial targeting for industrial development is part of the settlements’ history, which
meant that very few of the industries survived the withdrawal of government subsidies after the
end of apartheid. The post-apartheid investment in these areas is another form of spatial targeting
and, in the absence of key economic drivers, may prove to be unsustainable in the long term. ■ Population growth has been slower than that of their respective municipalities.
Mdantsane’s population declined in real terms between 2001 and 2011. The advantage has been
viii HIDDEN URBANITIES: SOUTH AFRICA’S DISPLACED SETTLEMENTS

fewer informal settlements developing compared to the municipal areas. All four areas have seen a
considerable decrease in the percentage of those younger than 35 years old, while the percentage
of the population older than 60 years old has increased. ■ Economic growth was higher in the host municipal areas than in the four settlements.
The exception was between 2008 and 2011, i.e. just after the global � nancial crisis, when
Botshabelo (1.20%), Seshego (2.68%) and Mdantsane (2.97%) experienced higher annual growth
rates than Mangaung (0.36%), Polokwane (2.02%) and Buffalo City (2.79%). This is probably
because the settlements were less directly dependent on the � nance sector. ■ Signi� cant retail investments in three of the four areas (excluding Winterveld), but there is little
evidence to suggest that these retail developments promote other economic activity in the area. ■ Residents are generally poorer than residents in former black townships near the
economic core areas, but better off than their rural counterparts. The human development index
� gures are generally lower and household expenditure on food is consistently higher in the
displaced settlements compared to the black population in the core economic areas. ■ Expenditure on public transport is signi� cantly higher for households in the settlements than
in the municipalities. ■ Quality of schools played a crucial role in creating (or not) a sense of place in at least two
of the case studies. In Winterveld, considerable investment in the school system served to attract
learners to schools in the area, whereas in Botshabelo the out� ow of people resulted in the closure
of at least three schools.
LESSONS FOR PROGRAMMES AND POLICY1. Displaced settlements have multiple functional roles. These need to be understood, contextualised
and incorporated into local planning frameworks, even if the economic potential of these areas is limited.
A more nuanced understanding of places can lead to more appropriate and strategic investments that
begin to work towards the vision of a post-apartheid, spatially transformed city.
2. The quest for spatial integration and improved densities continues. Innovative ways are needed
to increase densities and achieve spatial integration within the regional context. This will require planning
explicitly for spatial integration between the displaced settlements and their respective municipality.
3. Large-scale infrastructure investments have locked people in. The remarkable achievements in
delivering basic services suggest spatial justice has been pursued at a basic level, but other principles
such as spatial ef� ciency and quality appear not to have been accomplished. Therefore, the question is
whether it is appropriate to continue with large-scale infrastructure investments in these areas.
4. An open debate on transport and housing subsidies is needed. An open debate on subsidisation
is needed, including the rationale for using a bus subsidy and a settlement grant in the same place,
and how this may effectively lock in locational inef� ciencies.
5. Tension between service delivery and spatial planning. Local integrated and strategic
planning is needed. The danger is that extending service delivery may in fact reinforce existing
spatial inequalities. Different subsidies need to be reconciled and questions asked about the long-
term viability of these settlements.
ixEXECUTIVE SUMMARY

HIDDEN URBANITIES: SOUTH AFRICA’S DISPLACED SETTLEMENTSHIDDEN URBANITIES: SOUTH AFRICA’S DISPLACED SETTLEMENTS
This report builds on work previously done on differentiation in
response to a commission from the SA Cities Network (SACN).
The earlier reports argued that intermediate cities generally
require differentiated approaches to planning, � nance and
institutional development. The present report on apartheid’s
displaced settlements discusses ■ the need for a more nuanced articulation of differentiation; ■ the need for outcomes-based perspectives on spatial
policies; ■ the need for truly informed future spatial strategies; ■ the need for a recognition of differentiated outcomes and
their causes; and ■ a realisation that there is a dearth of research on
settlements of this kind.
Further re� ection is required in connection with displaced
settlements because: ■ They appear to be a differentiated spatial subcategory
within the municipalities in which they
are located. ■ Their histories suggest some unique characteristics. ■ They have policy/planning experiences and implications that
will need to be clearly understood.
This introductory section deals with the history of these
settlements (the post-apartheid spatial planning policy
frameworks). It scrutinises existing research on displaced
settlements (including policy implications), furnishes a more
detailed justi� cation for the study and describes research
methods. The second part of the report brie� y describes the four
case studies and lays the foundation for identifying themes that
are subsequently examined in the third part. The � nal section
deals with key policy considerations. The full case studies are
available on the SA Cities website www.sacities.net
1
Part 1:
Introduction

2PART 1: INTRODUCTION
BACKGROUNDApartheid planning left South Africa with a distinctive spatial legacy. In� ux control, forced removals and
channelled urbanisation were instrumental in preventing blacks from moving into the urban centres
(Platzky and Walker, 1985). Homeland towns were created (Bekker, 1991), with the aim of redirecting
black urbanisation away from the country’s main urban centres to towns and settlements behind
homeland boundaries. Yet these settlements had to be located close to core urban areas in order to be
able to make use of black labour. Within this context, R293 towns were created under Proclamation 293
of 1962, which suggested that these towns were to be developed jointly by the Department of
Development Aid and the homeland authorities (Bekker, 1991).
However, not all R293 towns were initially part of the homelands, and their inclusion had to be negotiated
with the governments of the various Bantustans. These displaced settlements were distinctly different
from the historically black townships. They were usually created in a homeland/self-governing territory
and were further away from the main urban centres. In some cases, they were extensions (or performed
the function) of a black township within the apartheid planning framework.
Terminology used in the report
R293 towns: Proclamation R293 of 1962 allowed the South African government to manage these towns located in former homeland areas. As at the time the towns were managed by South African government departments, local revenues were limited and local decision-making was absent.
Displaced settlements: R293 towns are commonly referred to as displaced settlements. Unlike black townships, these settlements were generally further away from the core urban areas. In many cases, a subsidised bus system had to be created to make allowance for long-distance commuting to and from these displaced settlements
Hidden urbanities: A name commonly given to displaced settlements to signify that the apartheid government had tried to hide the urbanisation of black people behind homeland boundaries, thereby keeping those people rural
Attempts were made to increase the overall viability of these settlements, by offering incentives such as
foundation grants, labour grants, power and transport subsidies and tax holidays (Christopher, 1994).
Subsidised commuter systems were introduced to transport workers between their places of residence
and work. Thus, ‘[L]ong distance commuting on a daily basis became a signi� cant aspect of Black urban
life as an increasing number of workers were forced to live in these homelands’ (Christopher, 1994: 88).
To stimulate economic development, the apartheid government offered decentralisation subsidies and
developed growth points that created job opportunities in these homeland towns or in border industries.
3 HIDDEN URBANITIES: SOUTH AFRICA’S DISPLACED SETTLEMENTS
However, ‘in a number of cases, sites were only indicated
vaguely on a map in order to provide each of the homelands
with at least one decentralization point for political rather
than economic reasons’ (Christopher, 1994: 91). Attempts
were also made to entice investors from South-East Asia,
attracting large numbers of Taiwanese entrepreneurs.
In 1985, in� ux control was abolished and replaced by a policy
of orderly urbanisation. In theory, the repeal of in� ux control
ended channelled urbanisation but, in practice, the policy of
orderly urbanisation meant that the free � ow of people was
not possible (Harrison, 1992). Only in the early 1990s – when
large-scale land invasions by the poor (Wolfson, 1991) made
a mockery of orderly urbanisation – did some degree of
‘normalisation’ start to in� uence urbanisation patterns.
Some examples of approximately 20 R293 towns are: ■ Winterveld, Mabopane and Ga-Rankuwa, currently linked to the Tshwane Metropolitan Municipality1
■ Botshabelo, currently linked to the Mangaung Metropolitan Municipality ■ Seshego in Polokwane ■ Pietermaritzburg, Edendale and Vulindlela ■ Queenstown and Wittlesea ■ King William’s Town and Zwelitsha, Dimbaza ■ East London and Mdantsane (Buffalo City) ■ Durban (much of the historical urbanisation was to homeland areas adjacent to Durban) ■ Bushbuckridge ■ Siyabuswa, linked to Tshwane ■ Mondlo, linked to Vryheid ■ Loskop, linked to Estcourt ■ Grahamstown and Glenmore.
This report considers four case studies selected from the above list: Botshabelo (Mangaung), Mdantsane
(Buffalo City), Seshego (Polokwane) and Winterveld (Tshwane). In conducting the case studies, three
overarching questions were asked: ■ How have the socioeconomic pro� les of the various displaced settlements changed over the past
two to three decades, and what drove these changes? ■ How have local, provincial and national government policies positively/negatively affected these
displaced settlements? ■ What is the main direction (and the drivers) of change in these displaced settlements?
1. Note: Winterveld performed similar functions but was never managed in terms of proclamation R293.

4PART 1: INTRODUCTION
EXISTING RESEARCHAcademic re� ection on displaced settlements remains limited, looking mostly at the impact of subsidies
and the characteristics of these urban spaces.
At the time of the Reconstruction and Development Programme, the focus was exclusively on racial
inequalities and failed to contextualise spatial inequalities (Crankshaw and Parnell, 1996). Scholars asked
whether ‘it is enough for the new government to simply try to improve the housing conditions of these
disadvantaged groups when their poverty is caused by their lack of access to urban jobs?’ (Crankshaw and
Parnell, 1996: 54). Furthermore, the housing subsidy was available to households irrespective of their
location, and subsidies to rural districts would reinforce the apartheid patterns of urbanisation.
The residents of these displaced urban settlements all qualify for state housing subsidies which
will enable them to purchase formal homes or upgrade their existing accommodation. But is
this in their best long-term interests? The problem with these displaced settlements is that they
are unlikely ever to become anything but dormitory towns. Although the policy of servicing
these settlements with water and providing formal housing may provide short-term employment
in construction, it offers no long-term work opportunities. (Crankshaw and Parnell, 1996: 57)
Nearly two decades later, Parnell and Crankshaw (2013: 55) found that ‘despite a considerable amount
of lip service to urban reconstruction, policy directions to address the spatial legacies in South Africa
(both within cities and between different areas) were mostly vague and dif� cult to implement’.
Other policy considerations were the continuation/discontinuation of transport (bus) subsidies and the
infrastructure levels to be applied in these areas (Tomlinson and Krige, 1997). In this regard, the Centre
for Development and Enterprise (CDE) argued that, although public investment in many of these displaced
urbanities had increased, private-sector investments had declined considerably (CDE, 1998).
The majority of these settlements had slow or low population growth, although the population in some
areas had grown (CDE, 1998) – e.g. the low and slow population growth in Botshabelo (Krige, 1996;
Tomlinson and Krige, 1997). A number of studies have re� ected on the changing characteristics of the
people living in these settlements. The CDE (1998) study came to the following conclusions: ■ While large percentages of people living in these settlements indicated that they would leave such
areas, equally large percentages indicated that they did not intend moving. ■ Conversely, other people had moved into these areas. ■ Although people in these settlements were better off than their rural counterparts, they were worse
off than people living in the main urban areas. ■ High levels of dependency existed (for example on old-age pensions). ■ The average monthly travelling costs of the people living in these settlements were nearly 75%
higher than those of black workers in South Africa as a whole.

5 HIDDEN URBANITIES: SOUTH AFRICA’S DISPLACED SETTLEMENTS
Of the roughly 40% of people who indicated they would leave, half were planning to move and the other
half would move if they could � nd employment elsewhere. For others, the main reason for not moving
was because they owned their houses, and ‘[f]or poor people, these are very signi� cant assets’ (CDE,
1998:12). In effect, this meant that they were stuck.
Unemployment � gures in the displaced settlements were found to be similar to those in rural areas and
higher than those in urban areas, while household incomes were slightly lower (by 10–20%) than in main
urban centres but higher than in rural areas. (CDE, 1998).
Enterprises that had settled in these speci� c areas relocated/disinvested to other areas following the
discontinuation of the apartheid government’s subsidies (Nel and Hill, 2001). The situation in Botshabelo
was somewhat different. Occupancy of industrial stands in Botshabelo was nearly 90% in 2004 (Marais
et al., 2005) but had dropped to around 80% by 2013 (Marais et al., 2014). This occupancy � gure is likely
to decline further, as overall employment in these industries also declined.
JUSTIFICATION FOR THIS STUDYSeveral factors justify renewed re� ection on displaced urban settlements:
Need for � ner spatial articulation and differentiation: South Africa’s larger cities are commonly
labelled as areas of considerable population and economic growth, as highlighted in the Integrated
Urban Development Framework (IUDF) (COGTA, 2016). However, this growth is fairly uneven within the
respective urban areas. The case studies suggest either negative or slow population growth in most of
these historically displaced settlements. Yet slow or low population growth is seldom contextualised in
literature on urban planning frameworks in respect of the larger urban areas in South Africa.
Limited research on displaced settlements: The overall body of research into these areas remains
small. While Parnell and Crankshaw (2013) have remarked that the ‘where’ of development is pivotal in
South Africa, the amount of research remains limited.
Informing future spatial strategies: There is a renewed emphasis on ‘spatial targeting’ in South
Africa. Although the concept is probably seen in a much broader context, a large part of the historical
planning around displaced settlements was linked to spatial targeting. Yet any renewed emphasis on
spatial targeting (which might or might not include some of these displaced settlements) requires a full
understanding of the economies of the areas in question.

6PART 1: INTRODUCTION
An outcomes-based perspective on spatial policies:
The policy responses have generally been fairly sterile and, in
essence, inconsistent. For example, industrial subsidies were
phased out and industries consequently closed down, but
national government retained the long-distance commuting
subsidy implemented under the apartheid regime.
Furthermore, households in these areas could receive housing
subsidies, which meant the post-apartheid enabled long-
term assets to be generated in such areas. There is generally
very little evidence of a systematic and integrated policy
response that accounts for the various subsidies.
Recognising differentiated outcomes and their
causes: As mentioned, these areas are not all similar.
Although the history has largely been the same, the
outcomes have been different, more than 20 years after
the demise of structured apartheid. In this respect, key
questions to be asked about why this is the case and what
the key drivers of change have been since 1994.
METHODOLOGYFour case studies (Botshabelo, Mdantsane, Seshego and Winterveld) were selected in order to obtain
geographical spread. Each case study is located in a different province, but no case study from KwaZulu-
Natal was included because of budgetary constraints. For each case study, the literature review covered
existing academic research, local planning documents, a media search, and analysis of available data
from Global Insight and Stats SA. Although the primary aim was to identify trends, these settlements
were also compared with the historically black townships of the main urban areas. This was not possible
for Seshego, which was both a homeland town and the former black township of Pietersburg (now
Polokwane). In addition, in-depth interviews were held with 15 key informants in the respective areas,
including of� cials from the respective municipalities (except for Tshwane), current councillors, teachers,
community leaders and members of community-based organisations.
Defining key termsThe term ‘displaced settlements’ is used in the discussion of the four case studies. These settlements
are inherently different from the ‘black township’ areas created under apartheid, mainly because most of
them are further from the economic core areas. The various geographical terms are used to compare the
case studies are explained in Table 1.
7 HIDDEN URBANITIES: SOUTH AFRICA’S DISPLACED SETTLEMENTS
Table 1: Geographical terms used for comparing the case studies
ATTRIBUTE BOTSHABELO MDANTSANE SESHEGO WINTERVELD2
Main case study area
Mainly the urban settlement of Botshabelo; lately, a small rural population has also developed (less than 2%)
The urban settlements of Mdantsane
The urban settlement of Seshego
The historical rural settlement in Winterveld, the informal settlements under apartheid and the newly established township areas
Core economic area Bloemfontein East London Polokwane City Pretoria
Former black township of core economic area
Mangaung township
Duncan Village None Attridgeville, Saulsville and Mamelodi
Municipality Mangaung Buffalo City Polokwane Tshwane
Black population of urban core
Refers to the black population in the magisterial district of Bloemfontein
Refers to the black population in the magisterial district of East London
Refers to the black population of the magisterial district of Pietersburg
Refers to the black population in Attridgeville, Saulsville, Mamelodi and the magisterial district of Pretoria
Limitations of the studyThe study is essentially an exploration, intended to raise key questions and voice concerns, not to develop
‘grand’ � ndings and speci� c recommendations for these displaced settlements. The case studies
represent just four of the former R293 towns, and their realities probably differ from some of the other
R293 towns. Three of the four case studies were selected because of their functional location in relation
to existing metropolitan areas, while the fourth case study was chosen because of its linkages with one
of South Africa’s secondary cities.
POST-APARTHEID SPATIAL PLANNING FRAMEWORKSSpatial integration is a common theme that runs through post-apartheid spatial planning policy
frameworks. Integration is needed because apartheid planning created spatial divides, fragmented
planning frameworks and low-density urban development. While post-apartheid policy frameworks
emphasise spatial integration and higher densities, achieving this in practice has not been easy.
Ambiguity has characterised the application of some of the basic principles, which are not uniformly
understood and, in some cases, simply ignored.
2. The overall emphasis in this section is on Winterveld. As some of the data is not available for Winterveld, the data for the greater Ga-Rankuwa Magisterial District – which includes Mabopane and Shoshanguve – is used

8PART 1: INTRODUCTION
This re� ection on the post-apartheid spatial planning policy frameworks is not intended to be a
comprehensive commentary but to highlight how applying these powerful and important principles may
be contradictory in different contexts, and may therefore need to be considered in contextualised and
holistic manners, rather than on an ad hoc basis. For example, the principle of spatial justice is evident
through the considerable effort put into upgrading basic infrastructure, but the principle of spatial
ef� ciency is not adhered to, as the large investments in the four case studies did not assist urban
integration and bring people closer to employment opportunities. Furthermore, while policy emphasises
densi� cation, few cities have recorded large increases in densities, apart from Johannesburg (from a low
basis). Indeed, Turok (2011) argues that the government’s appetite for increasing densities has been
limited, despite the policy rhetoric.
The Development Facilitation Act (No. 107 of 1995)The Development Facilitation Act (DFA) was promulgated as a mechanism to increase land release and, at
the same time, to ensure a larger degree of urban integration. In 2010, parts of the Act were declared
unconstitutional and the Spatial Planning and Land-Use Management Act (SPLUMA) repealed the remaining
sections of the Act. Section 3 of Chapter 1 sets out the principles related to land development, which include: ■ To promote integrated land development in rural and urban areas in support of each other. ■ To promote the availability of residential and employment opportunities in close proximity to or
integrated with each other. ■ To discourage the phenomenon of ‘urban sprawl’ in urban areas and contribute to the development
of more compact towns and cities. ■ To correct the historically distorted spatial patterns of settlement and to use existing infrastructure
optimally. ■ To promote the establishment of viable communities. ■ To meet the basic needs of all citizens in an affordable way [own emphasis added].

9 HIDDEN URBANITIES: SOUTH AFRICA’S DISPLACED SETTLEMENTS
The key intentions of initial policy approaches in the democratic period were to increase densities and to
counter urban sprawl in order to deal with the spatial legacy of apartheid planning.
The Urban Development Framework (1997) The Urban Development Framework (UDF) envisaged South Africa’s desired urban future. However, the
UDF was never formally adopted as a government policy and at best remained a framework that had to
guide post-apartheid spatial planning. By 2020, cities and towns will: ■ Be spatially and socioeconomically integrated; free from racial and gender discrimination
and segregation; ■ Be centres of economic and social opportunities where people can live and work in safety and in peace; ■ Be characterised by good housing, infrastructure and effective services for households and for
business, as the basis for an equitable standard of living; ■ Integrate industrial, commercial, residential, information and education centres, thereby providing
easy access to a range of urban resources; ■ Be � nanced via government subsidies and mobilising additional resources through partnerships,
capital markets and off-budget methods.
The UDF suggested � ve key programmes: (1) integrating the city, with the aim of doing away with
apartheid-induced segregation, fragmentation and inequality; (2) improving housing and infrastructure;
(3) building habitable and safe communities; (4) promoting urban economic development; and (5) creating
institutions for delivery.
The National Spatial Development Perspective (2003)The National Spatial Development Perspective (NSDP) was an attempt to develop a countrywide
approach to investment. The NSDP proposes that substantial capital and infrastructure should occur in
large urban agglomerations, where most economic growth and more poor people (in real numbers) are
found. Investments in peripheral areas should concentrate on skills development (education) that will
enable poor people to contribute to the urban economy should they migrate at some stage of their life
cycle. These ideas gained only limited acceptance in government circles, which explains why the NSDP
was labelled a perspective and not a policy or a policy framework.
The National Development PlanChapter Eight of the National Development Plan (NDP) considers the urban settlement system and states,
‘[w]here people live and work matters. Apartheid planning consigned the majority of South Africans to
places far away from work, where services could not be sustained, and where it was dif� cult to access
the bene� ts of society and participate in the economy’ (NPC, 2012: 260). The NDP proposes � ve principles
of spatial planning (NPC, 2012: 277): ■ Spatial justice. The historical policy of con� ning particular groups to limited space (i.e.
ghettoisation and segregation) and the unfair allocation of public resources between areas must be
reversed so that the needs of the poor are addressed � rst rather than last.

10PART 1: INTRODUCTION
■ Spatial sustainability. Sustainable consumption and production patterns should be supported, and
ways of living promoted that do not damage the natural environment. ■ Spatial resilience. Vulnerability to environmental degradation, resource scarcity and climatic shocks
must be reduced. Ecological systems should be protected and replenished. ■ Spatial quality. The aesthetic and functional features of housing and the built environment need
to be improved to create liveable, vibrant and valued places that allow for access and inclusion of
people with disabilities. ■ Spatial ef� ciency. Productive activity and jobs should be supported, and burdens on business
minimised. Ef� cient commuting patterns and circulation of goods and services should be
encouraged, with regulatory procedures that do not impose unnecessary costs on development.
The NDP also emphasises strategic spatial decision-making and calls for a review of existing housing-
subsidy � nance instruments in order to ensure that ‘state funding does not support the further provision
of non-strategic housing investments in poorly located areas’ (NPC, 2012: 287).
The Spatial Planning and Land Use Management Act (No. 16 of 2013)The Spatial Planning and Land Use Management Act (SPLUMA) was rati� ed in 2013. Its main objectives are:
■ To provide a uniform and coherent framework for spatial planning and land-use management. ■ To specify the relationship between the spatial planning and the land-use management system. ■ To provide for inclusive, developmental, equitable and ef� cient spatial planning in the different
spheres of government. ■ To address the legacy of past spatial planning and regulatory imbalances. ■ To promote greater ef� ciency, consistency and uniformity in decision-making by the authorities
responsible for land-development decisions.
On the whole, SPLUMA attempts to bridge the gap between land-use planning and spatial planning, and
envisages wall-to-wall land-use schemes. It promotes the development principles of: ■ Spatial justice, with reference to the inclusion of rural areas, informal settlements and areas in
former homelands. ■ Spatial sustainability, suggesting (i) that land development should ‘consider all current and future
costs to all parties for the provision of infrastructure and social services in land developments’; (ii)
the aim is to ‘promote land developments in locations that are sustainable’ and (iii) to ‘limit urban
sprawl’ – note the emphasis on viable communities and the intent to minimise urban sprawl. ■ Spatial ef� ciency, emphasising the importance of optimally using infrastructure and resources and
cautioning that decisions should minimise negative social, economic or environmental impacts. ■ Spatial resilience, referring to the ability to deal with economic and social shocks.
SPLUMA is more technocratic than DFA and the UDF. Although this shift of approach should most likely
be viewed in a positive light, it probably underemphasises some of the main principles in both the DFA
and the UDF.

11 HIDDEN URBANITIES: SOUTH AFRICA’S DISPLACED SETTLEMENTS
The Integrated Urban Development Framework (2016)The IUDF was rati� ed in 2016 and states that the apartheid spatial legacy is ‘one of sprawl, low
densities, functional segregation between home and work, and overlapping racial and class
separations’ (COGTA, 2015: 15) and is still present. As a result, the country’s cities and towns are
highly inef� cient and wasteful of scarce resources (especially land and infrastructure networks).
Continuous urbanisation and considerable economic growth in some of the core economic areas add
to the problems. The IUDF also acknowledges the importance of urban-rural linkages, and the need
to reduce climate change and disaster risks, and to improve urban safety.
The IUDF’s vision is ‘[l]iveable, safe, resource-ef� cient cities and towns that are socially integrated,
economically inclusive and globally competitive, where residents actively participate in urban life’
(COGTA, 2016: 38). Eight policy levers are proposed to achieve the four strategic goals of access,
growth, governance and spatial transformation: ■ Integrated spatial planning ■ Integrated transport and mobility ■ Integrated sustainable human settlements ■ Integrated urban infrastructure ■ Ef� cient land governance and management ■ Inclusive economic growth ■ Empowered active communities ■ Effective urban governance.
The IUDF also calls for a national debate on transport subsidisation.

PART 2: OVERVIEW OF THE CASE STUDIES PART 2: OVERVIEW OF THE CASE STUDIES
For each case study, an explanation is given of why the
settlement was developed, followed by the changes that
occurred after the repeal of in� ux control in 1985 and the
challenging of the ‘orderly urbanisation’ policy after 1990.
The post-apartheid intent is then examined, supported by
re� ections from community members, and concluding
with some � nal thoughts or considerations.
12
Part 2:
Overview of the Case Studies

13 HIDDEN URBANITIES: SOUTH AFRICA’S DISPLACED SETTLEMENTS
CA
SE
1
CASE 1
BOTSHABELOP L A C E O F R E F U G E E S
O r i g i n a l i n t e n t To divert black urbanisation from Mangaung (Bloemfontein’s historically black township), Botshabelo was
created in 1979 on a site approximately 55 km east of the town (Figure 1). With the independence of
Bophuthatswana in 1979, the Sesotho-speaking population was no longer welcome in Thaba Nchu (because
the latter was a Tswana enclave), where they had been moved from Bloemfontein after 1968 (Krige, 1991).
They therefore became the � rst residents of Botshabelo and were joined by a second group of Sesotho-
speaking people from Sterkspruit, which had become a Xhosa enclave (Krige, 1996). Thereafter, black
urbanisation that would normally have occurred in Bloemfontein continued to be redirected to Botshabelo.
As a result, Botshabelo’s population grew from about 60 000 in 1979 to 175 000 in 1991 (Krige, 1996) and
180 000 in 2011.
Figure 1: Location of Botshabelo in Mangaung

14CASE 1: BOTSHABELO – PLACE OF REFUGEES
CASE 1
BOTSHABELOP L A C E O F R E F U G E E S
Various mechanisms were put in place to maintain this form of channelled urbanisation to Botshabelo: ■ By 1980, a subsidised bus system was introduced to transport commuters the 55 km between
Botshabelo and Bloemfontein. ■ In 1982, the area was declared an industrial development point, which paved the way for large-scale
industrial subsidies (Krige, 1991). Despite these subsidies, workers received meagre wages (Cobbet,
1987). Female employees working in the textile manufacturing industry constituted the largest
percentage of workers. ■ In the mid-1980s, a border industry, Bloemdustria, was established halfway between Bloemfontein
and Botshabelo.
The apartheid state also attempted to include Botshabelo in the self-governing Qwaqwa homeland, but the
Botshabelo community successfully went to court to prevent this move (Twala and Barnard, 2006).
C h a n g i n g t r e n d sEmployment Between 1996 and 2013, jobs in Botshabelo’s manufacturing industry declined from nearly 7 000 to a mere
1 000, while manufacturing’s share of employment creation fell from nearly 24% to 5.7%. Following the 2009
recession, occupancy of manufacturing premises declined to 80% in 2013 (Marais, et al., 2014).
Over the past 20 years, the numbers of daily commuters have also decreased substantially. The community
services sector accounts for approximately 35% of all employees, suggesting an increased dependency on
government services for new jobs in Botshabelo.
PopulationWhile the population in Bloemfontein has grown substantially since 1991, the
Botshabelo population has experienced low or slow growth, currently standing at
183 000 (2011) – up from 175 000 in 1991 – and is ageing. According to a local
councillor when asked what they would do if they won the lottery, ‘young and old
people … would tell me one thing: they will immediately leave Botshabelo’.
'young and old people … would tell me one
thing: they will immediately leave
Botshabelo'

15 HIDDEN URBANITIES: SOUTH AFRICA’S DISPLACED SETTLEMENTS
Informal settlements/land invasionsMangaung, Bloemfontein’s former black township area, has experienced large-scale development of
informal settlements and increased land invasions, which coincided with the settling in the area of many
former Botshabelo residents (Marais and Ntema, 2013). Some informal settlements have also developed in
Botshabelo, but on a considerably smaller scale compared to Bloemfontein (Mokoena and Marais, 2008).
P o s t- a p a r t h e i d i n t e n tFrom within Botshabelo, there was (and still is) continued pressure to have the area declared a ‘special urban
development node’, similar to the Alexandra Township urban renewal programme in Johannesburg. To this
end, the Botshabelo Investment Study was commissioned in 1995/96, with a view to developing an appropriate
investment plan. The resultant report suggested careful investment in basic services (though not beyond basic
levels), but apparently received a rather lukewarm response from the authorities (Tomlinson and Krige, 1997).
In 2001, Botshabelo was amalgamated with Bloemfontein and Thaba Nchu to form the Mangaung Local
Municipality (which in 2011 became the Mangaung Metropolitan Municipality). This created both the � scal
base and the institutional capacity for large-scale investment in basic infrastructure in Botshabelo. Many of
these investments have probably exceeded the original expectations of the Botshabelo Investment Study.
Since 2001, the number of households with water-borne sanitation, water on the stand, electricity and
refuse removal has increased considerably. Investment in housing has also increased, with improvements
to the size of houses and to formal housing units, and a new trading mall is being developed.
C o m m u n i t y r e f l e c t i o n sBotshabelo played an important role in addressing urbanisation (i.e. � nding a place to stay other than on a
commercial farm), even if it was in the wrong location. For many residents, Botshabelo represented freedom.
As one of the residents said, ‘We worked and stayed at a farm and the relationship between us and our
employers was not always great and so we wanted to make sure that if they ever chase us away we would
have our own place to stay.’
Many people are prevented from moving because of the assets that they have generated over the past 30 years. As a middle-income earner in Botshabelo explained,
I would have also loved to move to Bloemfontein especially now that I am closer to retiring
and my children attend tertiary education in Bloemfontein but I will not be able to as this
means I have to sell this house and get another one there. Selling this house would not be
pro� table enough to afford me the same type of house in Bloemfontein.
Perceived poor quality education and health services mean that many children from Botshabelo attend
school elsewhere (in Bloemfontein, Thaba Nchu and Tweespruit), while some schools in the south of
Botshabelo have been closed because of declining numbers.

16CASE 1: BOTSHABELO – PLACE OF REFUGEES
CASE 1
K e y c o n s i d e r at i o n sThe Botshabelo case study re� ects one of South Africa’s appalling creations under apartheid: the inhumane and
inef� cient system of channelling workers to live in places far from their places of employment. The inef� cient
location of Botshabelo 55 km east of Bloemfontein (ironically, with settlement densities exceeding those of
Bloemfontein by 10:1) placed pressures on households and government to ensure access to employment.
Amalgamating Botshabelo with Bloemfontein to form one local government structure led to considerable
investment in local services and the provision of some housing subsidies. Improved basic services seem to
have contributed to extensive investment in housing, but the bus subsidy remains intact because the dislocation
has been dif� cult to fundamentally address, and attempts to create local economies through industrial schemes
failed. Under these circumstances, the question becomes whether investments in basic services and the
continued bus subsidy have merely served to reinforce the spatial deprivation created under apartheid.

HIDDEN URBANITIES: SOUTH AFRICA’S DISPLACED SETTLEMENTS17
CASE 2
MDANTSANET H E A P A R T H E I D ‘ P A R A D I S E ’
O r i g i n a l i n t e n tIn 1959, Mdantsane was created about 20 km from East London (now Buffalo City) and halfway to King
William’s Town, to channel urbanisation from Duncan Village (East London’s original black township since
1950) to behind the Ciskei border (Figure 2). The unsatisfactory living conditions in Duncan Village enabled
the apartheid regime to use the ‘sanitary syndrome’3 excuse to relocate the black population. Although not
initially established as a R293 town, Mdantsane was managed in terms of Regulation R293, which was
promulgated in 1962.
Figure 2: Location of Mdantsane in Buffalo City
3. Apartheid planning often used unsatisfactory or lack of adequate sanitary facilities to justify relocation, displacement and segregation.
CA
SE
2

CASE 2: MDANTSANE – THE APARTHEID ‘PARADISE’
CASE 2
MDANTSANET H E A P A R T H E I D ‘ P A R A D I S E ’
18
Mdantsane grew at a tremendous pace after 1961, when the � rst residents moved into the settlement. The
available employment opportunities were strong magnets for attracting people: the Regional Industrial
Decentralisation Programme (introduced in 1962) led to the establishment of border industries (for example,
in Wilsonia) and industries in Mdantsane (Fort Jackson) after 1979. Most of the jobs were in the textile
industry, which received high subsidises but paid women very low wages (Nel, 1990). A subsidised bus
system was introduced to facilitate commuting between East London and Mdantsane but did not last long
because of bus boycotts in the late 1970s; it was replaced by a non-subsidised taxi system.
Although the apartheid state propaganda described Mdantsane as a model town that boasted a diversity
of amenities, the relocation meant that much of the community spirit and social cohesion characteristic
of Duncan Village (known to some residents as Tsolo) was eroded. One respondent captured the impact of
the relocation:
When I was in Tsolo there were [a] lot of activities that used to keep the youth busy. These
included playing cricket and rugby in township schools; going to Victory cinema; watching
karate and boxing; accompanying our parents to town and, in turn, they would give us lift in
their bicycles. This good life in Tsolo came to an end when the government made a ruling that
the blacks in Tsolo should be relocated to the homeland in Mdantsane.
C h a n g i n g t r e n d s EmploymentBy the end of the 1980s, nearly 30 000 job opportunities were available in Wilsonia and nearly 7 500 in Fort
Jackson (Nel, 1990) but from the early 1990s employment declined following the withdrawal of
decentralisation subsidies and the rise of labour unions. As such, the number of formally employed people
in Mdantsane dropped from 40 000 in 1996 to just over 10 000 in 2013. Manufacturing saw the biggest
decline of more than 10 000 jobs between 1996 and 2001. However, over the past 20 years, the expanding
automotive industry in East London has largely absorbed the unemployment created by the decline of the
local industrial base of Mdantsane.

HIDDEN URBANITIES: SOUTH AFRICA’S DISPLACED SETTLEMENTS19
PopulationOver the past 20 years, Mdantsane’s population has
declined in real terms, from approximately 195 000 in
1996 to approximately 165 000 in 2011. However, the
number of households increased between 1996 and
2001. Interestingly, Duncan Village also lost people,
while Buffalo City grew at a moderate pace.
Mdantsane’s population is ageing, with the percentages
of people aged 15–34 years dropping from 39% in
1996, to 36% in 2011.
P o s t- a p a r t h e i d i n t e n tIn the mid-1990s, East London and Mdantsane were
merged into one local government structure: the East
London Transitional Local Council. Then in 2001, Buffalo
City Municipality was created, comprising Buffalo City
(East London), King William’s Town, Bisho and the
surrounding rural areas. Mdantsane – located between
East London and King William’s Town – started to
perform the role of in� lling and was declared an urban
renewal node in 2001. However, the initial euphoria was
short-lived because only limited funds were available.
The European Union then agreed to fund a substantial
portion of the development, but this folded upon the
discovery that the municipality had not followed correct
� nancial accounting procedures.
Nonetheless, access to water, sanitation and electricity
has improved, although the levels of basic services in
Mdantsane were already relatively high in 1996 (e.g.
76% of households had water on the stand). Access to
electricity has risen from 46% in 1996 to nearly 80% in
2011. The automotive industry has also invested in the
municipal area, while other private investors have
contributed towards ‘changing the face’ of Mdantsane,
by, for example, the establishment of the NU6 Mall.

CASE 2: MDANTSANE – THE APARTHEID ‘PARADISE’ 20
CASE 2
C o m m u n i t y r e f l e c t i o n sAlthough basic services seem to have improved in Mdantsane, school results are poor, and some schools
have closed. Despite concerns about road accidents between Mdantsane and East London, many children
attend schools in East London because, as a community member explained:
Sending our children to schools in East London is not only meant to
enable them [to] access better quality education, but also to make sure
that we equally enjoy the new democratic dispensation of racial
integration. We want our kids to also learn in those schools previously
reserved for whites, Indians and coloureds.
The quality of health and social infrastructure is also in decline (van Rensburg-
Bonthuyzen, et al., 2003). One resident said that ‘the municipalities are neglecting
the sporting infrastructure and stadiums. The swimming pools, tennis courts,
boxing houses are now down and defunct.’ Overall, community perceptions
about life in Mdantsane are negative, many people have already left the town
and those that remain are increasingly dependent on government grants.
K e y c o n s i d e r at i o n sThe issues facing Mdantsane are not very different from those in Botshabelo, with the exception of the
transport subsidy. Despite a large-scale industrial exodus, signi� cant public-sector investment in basic
service delivery has occurred through urban renewal projects. However, planning documents do not
acknowledge that nearly 30 000 people left Mdantsane between 1996 and 2011. As in the case of
Botshabelo, the question of whether increased investment in basic services only serves to increase the
spatial deprivation of residents is also relevant in Mdantsane.
'Sending our children to schools in East London is not only meant to enable them [to] access better quality education, but also to make sure that
we equally enjoy the new democratic dispensation
of racial integration.'

HIDDEN URBANITIES: SOUTH AFRICA’S DISPLACED SETTLEMENTS21
CASE 3
SESHEGOF R O M T O W N S H I P T O S U B U R B I A
O r i g i n a l i n t e n tTo channel urbanisation away from Pietersburg (now Polokwane), Seshego was established in 1971 as the
interim capital of Lebowa (a self-governing state in line with apartheid policies) and to locate black people
who had been forcibly removed from Polokwane and from proclaimed white group areas (Donaldson, 2001).
Seshego was further developed in terms of both Regulation 293 of 1962 and the regulations for the
administration and control of townships of the Lebowa government. At only 10 km from Polokwane, Seshego
is much closer to its core urban area than the other R293 towns covered in this report.
Figure 3: Location of Seshego in Polokwane
CA
SE
3
CASE 3: SESHEGO – FROM TOWNSHIP TO SUBURBIA
CASE 3
SESHEGOF R O M T O W N S H I P T O S U B U R B I A
22
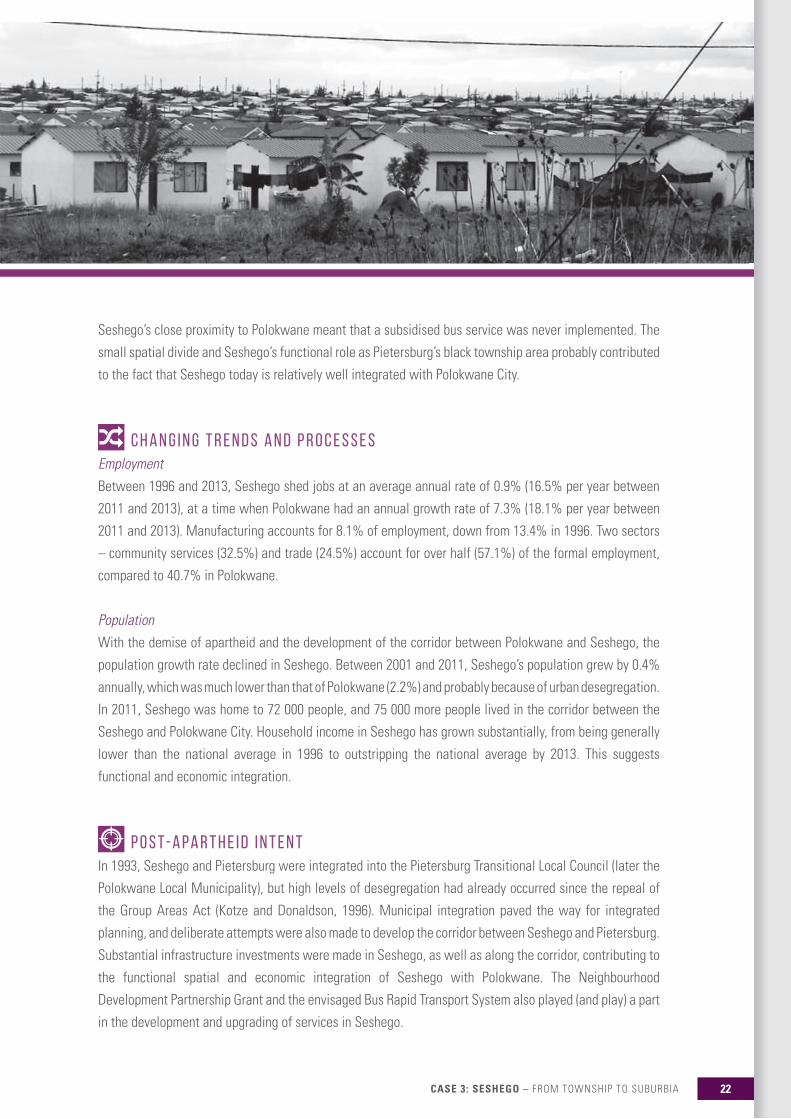
Seshego’s close proximity to Polokwane meant that a subsidised bus service was never implemented. The
small spatial divide and Seshego’s functional role as Pietersburg’s black township area probably contributed
to the fact that Seshego today is relatively well integrated with Polokwane City.
C h a n g i n g t r e n d s a n d p r o c e s s e sEmploymentBetween 1996 and 2013, Seshego shed jobs at an average annual rate of 0.9% (16.5% per year between
2011 and 2013), at a time when Polokwane had an annual growth rate of 7.3% (18.1% per year between
2011 and 2013). Manufacturing accounts for 8.1% of employment, down from 13.4% in 1996. Two sectors
– community services (32.5%) and trade (24.5%) account for over half (57.1%) of the formal employment,
compared to 40.7% in Polokwane.
PopulationWith the demise of apartheid and the development of the corridor between Polokwane and Seshego, the
population growth rate declined in Seshego. Between 2001 and 2011, Seshego’s population grew by 0.4%
annually, which was much lower than that of Polokwane (2.2%) and probably because of urban desegregation.
In 2011, Seshego was home to 72 000 people, and 75 000 more people lived in the corridor between the
Seshego and Polokwane City. Household income in Seshego has grown substantially, from being generally
lower than the national average in 1996 to outstripping the national average by 2013. This suggests
functional and economic integration.
P o s t- a p a r t h e i d i n t e n tIn 1993, Seshego and Pietersburg were integrated into the Pietersburg Transitional Local Council (later the
Polokwane Local Municipality), but high levels of desegregation had already occurred since the repeal of
the Group Areas Act (Kotze and Donaldson, 1996). Municipal integration paved the way for integrated
planning, and deliberate attempts were also made to develop the corridor between Seshego and Pietersburg.
Substantial infrastructure investments were made in Seshego, as well as along the corridor, contributing to
the functional spatial and economic integration of Seshego with Polokwane. The Neighbourhood
Development Partnership Grant and the envisaged Bus Rapid Transport System also played (and play) a part
in the development and upgrading of services in Seshego.

HIDDEN URBANITIES: SOUTH AFRICA’S DISPLACED SETTLEMENTS23
C o m m u n i t y r e f l e c t i o n sCommunity perceptions suggest that Seshego has largely developed as a suburb within Polokwane, and the
quality of education and health services is not a serious concern: ‘We see lots of rich people in Seshego now;
there are people with nice houses and big cars. […] ‘We see more shops and
more businesses – people are making money’. People appear to be less
dependent on the state, with comments such as: ‘In Seshego you make a job if
you don’t � nd a job’ – sentiments that were not evident in the other case studies.
K e y c o n s i d e r at i o n sThe Seshego case study con� rms the importance of being close to the urban core. This, combined with
favourable topography, has enabled the in� ll development between Seshego and Polokwane. As a result,
what was once a dormitory town became a functional neighbourhood and is probably a prime example of
urban integration in post-apartheid South Africa.
‘We see more shops and more businesses – people
are making money’.

CASE 3: SESHEGO – FROM TOWNSHIP TO SUBURBIA 24
CASE 3

25 HIDDEN URBANITIES: SOUTH AFRICA’S DISPLACED SETTLEMENTS
CASE 4
WINTERVELDT H E O N C E F O R G O T T E N F O L K
O r i g i n a l i n t e n tWinterveld became a sanctuary for homeless, unemployed Africans caught between rural landlessness and
urban illegality (Horn, 1997: 113), or as a community member explained:4
You know I was there when the apartheid government came with trucks full of people from black
spot removals and literally dumping them in the streets next to our plots … because of Ubuntu,
we could not just ignore our brothers and sisters who literally had nowhere to go, and we invited
them to come and stay with us … that is how this thing of tenants started in Winterveld.
For reasons of pro� tability, the demand for land gave rise to shack farming and to the subletting of land
(Horn et al., 1992: 115). Yet despite cultural differences among the people of Winterveld, the area became
‘living proof that residents of a multi-ethnic, diverse African community could coexist and live together’ (de
Clerq, 1994: 381).
In 1977, Winterveld of� cially became part of the ‘independent’ Republic of Bophuthatswana, but the
Bophuthatswana government was reluctant to absorb non-Tswana residents into Bophuthatswana.
Eventually, the South African and Bophuthatswana governments reached a compromise and an
intergovernmental management committee was formed.5 However, this committee became unpopular and
to some extent sparked dissatisfaction and resistance among community members.
C h a n g i n g t r e n d s a n d p r o c e s s e sEmploymentEmployment in the manufacturing sector decreased from 30.5% in 1996 to 18.3% in 2013. However,
considerable growth in the automotive sector in Rosslyn probably helped to soften the impact of jobs lost as
a result of subsidies being phased out. Although unemployment remains stubbornly high, evidence indicates
that some of the successful job-creation initiatives in Winterveld are those funded either solely by government
or by government in partnership with individual small-scale farmers in the rural 10-morgen areas. Thus, while
employment in more urban 5-morgen areas is predominantly in the informal urban economy such as motor
mechanics, spaza shops, etc., the majority of the residents in the rural 10-morgen areas are mainly employed
in agriculture-related economic activities such as poultry farming, citrus farming, etc.
4. Landlord Seven. 2014. Focus group discussion with plot owners in 5-Morgen, Winterveld.
5. Pretoria News. 1979. Determine status for Winterveld, 21 August 1979, p. 3; Financial Mail. 1979 Winterveld. People are living there, 20 April 1979, p. 207.
CA
SE
4

26CASE 4: WINTERVELD – THE ONCE FORGOTTEN FOLK
CASE 4
WINTERVELDT H E O N C E F O R G O T T E N F O L K
Figure 4: Location of Winterveld in Tshwane
Note: ■ Mabopane and Ga-Rankuwa: areas in the former Bophuthatswana homeland that exclusively accommodated
Tswana people who had been displaced from white South Africa. ■ Soshanguve: formerly an extension and part of Mabopane, which was later reincorporated into white South
Africa speci� cally to accommodate the Sotho, Shangaan, Nguni and Venda people displaced both from
Mabopane and Ga-Rankuwa in Bophuthatswana, and from white Pretoria in South Africa.
EducationThe community of Winterveld is very proud of its school infrastructure. Contrary to what some longserving
current school principals have referred to as ‘the past dif� cult times in the history of education in Winterveld
schools when most Winterveld children were schooling in Mabopane and Soshanguve’, the latest of� cial
statistics (Gauteng DBE, 2014) indicate that the total number of schoolchildren in Winterveld has increased
signi� cantly from 16 081 in 2007 to 28 184 in 2014.

27 HIDDEN URBANITIES: SOUTH AFRICA’S DISPLACED SETTLEMENTS
Further con� rmation of both the improved standard of education
and the signi� cant increase in the numbers of schoolchildren
has come from community interviews. In these interviews,
schools in Winterveld were widely mentioned as alternatives
not only to schools in Ga-Rankuwa, Soshanguve, Mabopane
and to certain parts of the former white suburbs of Pretoria
North, but also to schools in the Madibeng Local Municipality
in the North West Province.
PopulationBetween 1995 and 2011, Winterveld’s population grew by
15 000, increasing from 122 551 to 137 436. After declining
between 1996 and 2001, its annual average growth rate was
1.49% between 2001 and 2011. This growth rate was lower
than for Tshwane as a whole and is possibly the result of the
government’s investment in infrastructure in Winterveld. The
economically active population grew between 1996 and 2011,
with the 15–34 year age group increasing from 38.8%– 41% and the 35–59 year group increasing from
21.3%–23.6%. This could be because of the growing number of former residents of Winterveld returning
home from Gauteng and surrounding areas.
P o s t- a p a r t h e i d i n t e n tIn 2001, Winterveld was integrated with the Tshwane Metropolitan Municipality and declared a Special
Presidential Lead Project by national government.6 This led to an urban renewal project managed by the
provincial government.7,8 The Tshwane Metropolitan Municipality did a cost assessment of upgrading the area,
which resulted in several developments in Winterveld: approximately 12 000 new houses were constructed
(and a further 18 000 envisaged) as part of the Housing Subsidy Programme; electricity access for lighting in
Winterveld increased from 19.9% in 1996 to 81.1% in 2011; schools were upgraded and school feeding
schemes were introduced. These infrastructural improvements have contributed to increasing population
numbers in Winterveld but have also led to con� ict between the original settlers (those on farmland) and the
state over compensation for the land. A number of agricultural initiatives have been introduced, including an
agricultural secondary school, with the aim of promoting rural development in the area.9
6. Pretoria News. 2004. Winterveld set to be upgraded, 22 July 2004, p. 5.
7. Bateman B. 2010. Blaming apartheid won’t wash – Zuma. Pretoria News, 29 April 2010, p. 5.
8. Hlahla P. 2009. Project celebrates bumper orange harvest. Pretoria News, 13 July 2009, p. 5.
9. Hlahla, P. (2009, July 13). Project celebrates bumper orange harvest. Pretoria News, p. 5.; Mashala, P. (2011, June 10). Small-scale farmers establish agri school to save their community. Farmers weekly, p. 33.; Xaba, V. (2010, Nov 22). Project to fight hunger on track. Sowetan, p. 14.
28CASE 4: WINTERVELD – THE ONCE FORGOTTEN FOLK
CASE 4
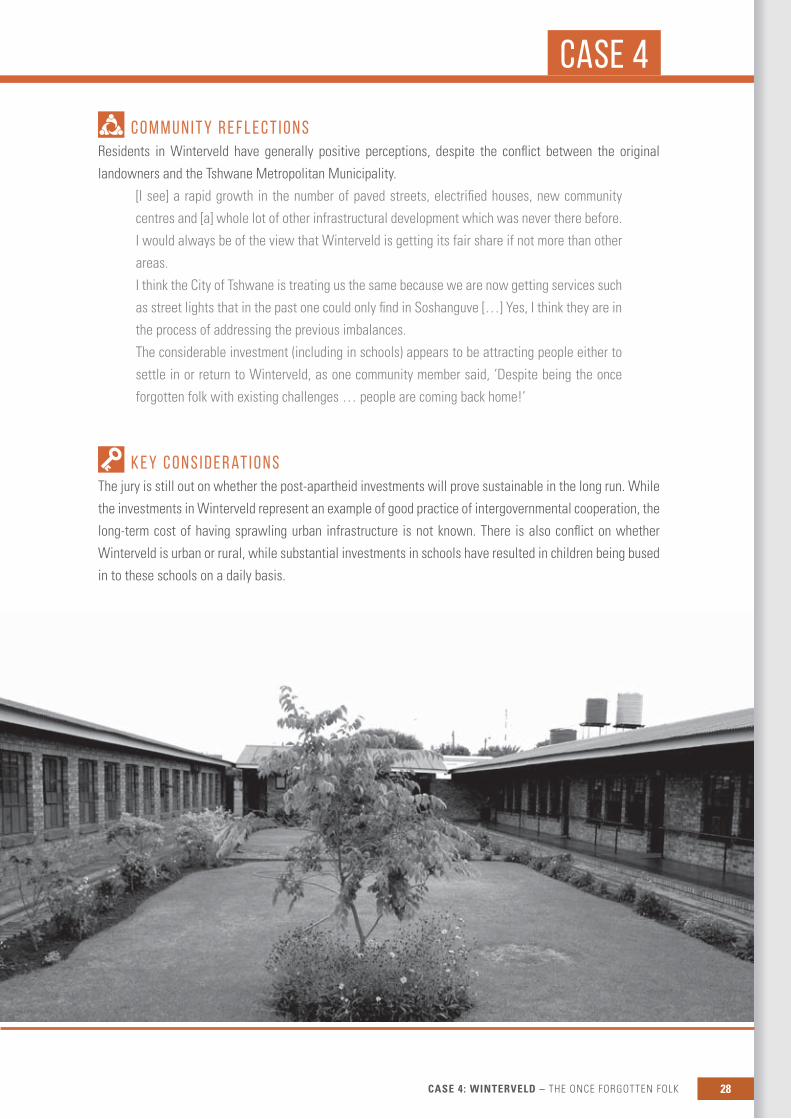
C o m m u n i t y r e f l e c t i o n sResidents in Winterveld have generally positive perceptions, despite the con� ict between the original
landowners and the Tshwane Metropolitan Municipality.
[I see] a rapid growth in the number of paved streets, electri� ed houses, new community
centres and [a] whole lot of other infrastructural development which was never there before.
I would always be of the view that Winterveld is getting its fair share if not more than other
areas.
I think the City of Tshwane is treating us the same because we are now getting services such
as street lights that in the past one could only � nd in Soshanguve […] Yes, I think they are in
the process of addressing the previous imbalances.
The considerable investment (including in schools) appears to be attracting people either to
settle in or return to Winterveld, as one community member said, ‘Despite being the once
forgotten folk with existing challenges … people are coming back home!’
K e y c o n s i d e r at i o n sThe jury is still out on whether the post-apartheid investments will prove sustainable in the long run. While
the investments in Winterveld represent an example of good practice of intergovernmental cooperation, the
long-term cost of having sprawling urban infrastructure is not known. There is also con� ict on whether
Winterveld is urban or rural, while substantial investments in schools have resulted in children being bused
in to these schools on a daily basis.

29 HIDDEN URBANITIES: SOUTH AFRICA’S DISPLACED SETTLEMENTS29 HIDDEN URBANITIES: SOUTH AFRICA’S DISPLACED SETTLEMENTS
SUMMARY OF FINDINGS The main � ndings for the four case studies are summarised in Table 2.
Table 2: A comparison of key attributes related to the four case studies
ATTRIBUTE BOTSHABELO MDANTSANE SESHEGO WINTERVELD
GEOGRAPHY & ADMINISTRATION
Date established 1979 1959 1971 1938 (� rst black ownership in the area)
R293 status Yes Yes – 1962 Yes No, but Mabopane was managed in terms of this regulation
Homeland linked to
Intended to be part of self-governing Qwaqwa – never materialised
Ciskei (independent homeland)
Lebowa (self-governing)
Bophuthatswana (independent homeland)
Urban core linked to and distance from the core
Bloemfontein – 55km
East London – 29km Polokwane (Pietersburg) – 10km
Pretoria – 50km
Former black township in urban core
Mangaung Township
Duncan Village None Attridgeville, Mamelodi and Soshanguve
Current municipality
Mangaung Buffalo City Polokwane Tshwane
Type of municipality
Metro Metro Local Municipality Metro
DEMOGRAPHICS
Population growth/decline
Slow growth Decline Growth Growth
Population size 1996 176 000 195 165 57 699 122 551
Population size 2001 178 000 184 600 69 269 118 523
Population size 2011 183 000 164 681 72 182 137 436
Evidence of ageing population
Signi� cant Signi� cant Evident but not signi� cantly more than in Polokwane
Evident but not signi� cantly more than in Tshwane

30PART 2: OVERVIEW OF THE CASE STUDIES 30PART 2: OVERVIEW OF THE CASE STUDIES
ATTRIBUTE BOTSHABELO MDANTSANE SESHEGO WINTERVELD
ECONOMY
Industrial development initiatives
Declared industrial development point in 1982; Bloemdustria developed as border industry
Fort Jackson created in the late 1970s. Wilsonia an example of a border industry
Went hand-in-hand with the industrialisation of Pietersburg – less dependent on state subsidies
The development of Rosslyn
Post-apartheid industrial trends
Decline in manufacturing employment; decline in � rm occupancy; Bloemdustria never developed
Large decline in occupancy levels in Fort Jackson; yet growth in the automotive industry absorbed large numbers of people
Sharp decline in employment
Number of jobs lost in manufacturing between 1996 and 2013
5 758 1 077 2 134 81 589
% of original jobs in manufacturing lost
84.4 79.6 48.3 61.5
New growth sectors
Community services (government)
Community services (government)
Community services (government)
Community services (government)
Annual economic growth rate (1996 – 2013)
Slow, substantially slower than Mangaung; 1.6%
Average, substantially slower than Buffalo City; 2.0%
Average, substantially slower than Polokwane; 2.8%
Average, substantially slower than Tshwane; 2.4%
TRANSPORTATION
Commuting systems
Subsidised bus system – considerable decline in the number of commuters
Originally bus system – later replaced by taxis
No formal bus system
Subsidised bus system – considerable decline in the number of commuters
Post-apartheid trends in bus system
Declining daily commuters; higher levels on Fridays / Mondays
Originally bus system – replaced in mid 1980s by taxis
Never had a bus system
Daily commuters considerably fewer than at the beginning of the 1990s
SERVICES
Investment in basic services delivery post 1994
Very high – mainly funded through the Mangaung Metro since 2001
Intentions were to invest heavily – in practice probably only moderate investments
High – some investments done prior to 1996
Very high (national, provincial and local governments are involved)
Basic service levels
Substantial improvements
Substantial improvements
Moderate improvements as existing levels of infrastructure was fairly good
Substantial improvements

31 HIDDEN URBANITIES: SOUTH AFRICA’S DISPLACED SETTLEMENTS31 HIDDEN URBANITIES: SOUTH AFRICA’S DISPLACED SETTLEMENTS
In conclusion, three main points must be made.
1. Despite initial expectations, developing policy prescripts that would apply equally to all four
settlements was not possible because of the different contexts. Therefore, care should be taken
not to generalise about these settlements. Spatially, Seshego (and to a lesser degree Mdantsane)
is integrated, whereas Botshabelo and Winterveld display very few characteristics of integration.
The historically rural character of Winterveld also brings considerably different dynamics to the fore.
2. People settled in these towns for a number of different reasons. Therefore, care should be taken not
to simplistically label any of these places with a singular theme or function. For example, while some
people were channelled to Botshabelo away from Bloemfontein, other people considered Botshabelo
as a functional home away from a commercial farm. In Winterveld, a signi� cant percentage of people
see themselves as part of the agricultural sector.
3. Any future policy response must acknowledge the reality that some people did not choose to reside
in these settlements but were sent there as a result of the apartheid government’s forced removal
and displacement policies.
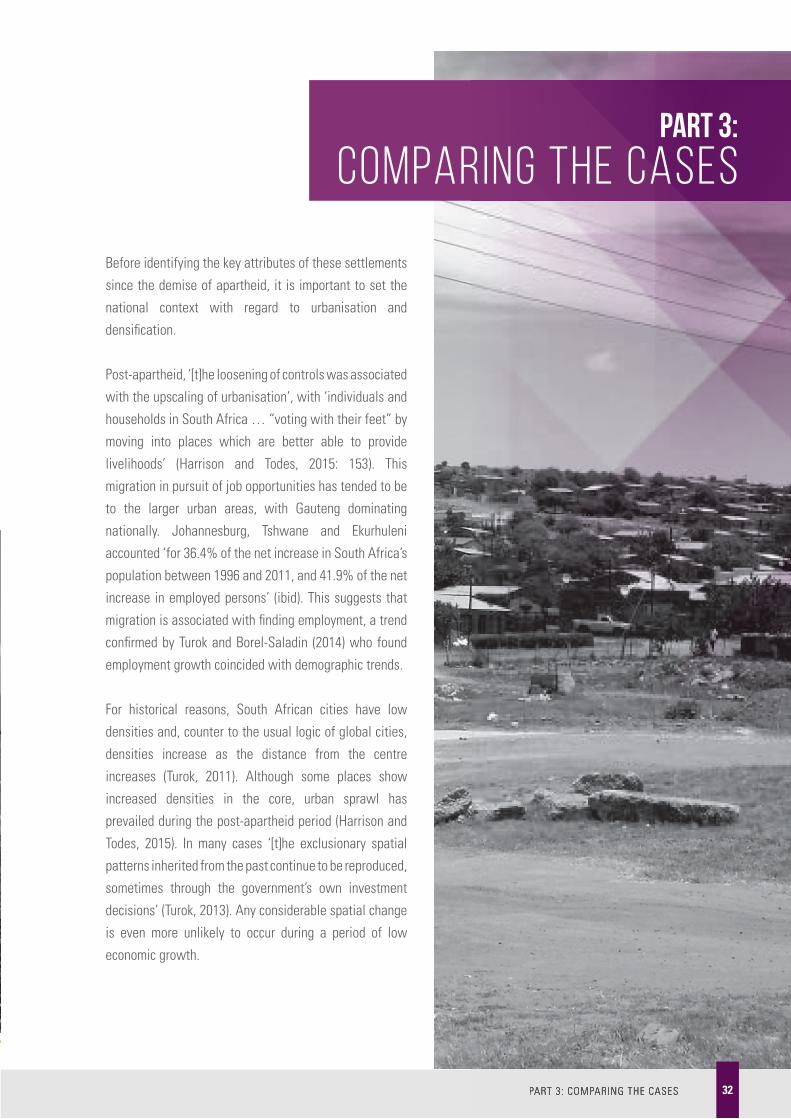
PART 3: COMPARING THE CASES PART 3: COMPARING THE CASES
Before identifying the key attributes of these settlements
since the demise of apartheid, it is important to set the
national context with regard to urbanisation and
densi� cation.
Post-apartheid, ‘[t]he loosening of controls was associated
with the upscaling of urbanisation’, with ‘individuals and
households in South Africa … “voting with their feet” by
moving into places which are better able to provide
livelihoods’ (Harrison and Todes, 2015: 153). This
migration in pursuit of job opportunities has tended to be
to the larger urban areas, with Gauteng dominating
nationally. Johannesburg, Tshwane and Ekurhuleni
accounted ‘for 36.4% of the net increase in South Africa’s
population between 1996 and 2011, and 41.9% of the net
increase in employed persons’ (ibid). This suggests that
migration is associated with � nding employment, a trend
con� rmed by Turok and Borel-Saladin (2014) who found
employment growth coincided with demographic trends.
For historical reasons, South African cities have low
densities and, counter to the usual logic of global cities,
densities increase as the distance from the centre
increases (Turok, 2011). Although some places show
increased densities in the core, urban sprawl has
prevailed during the post-apartheid period (Harrison and
Todes, 2015). In many cases ‘[t]he exclusionary spatial
patterns inherited from the past continue to be reproduced,
sometimes through the government’s own investment
decisions’ (Turok, 2013). Any considerable spatial change
is even more unlikely to occur during a period of low
economic growth.
32
Part 3:
Comparing the cases

33 HIDDEN URBANITIES: SOUTH AFRICA’S DISPLACED SETTLEMENTS33 HIDDEN URBANITIES: SOUTH AFRICA’S DISPLACED SETTLEMENTS
GOVERNMENT INVESTMENT IN INFRASTRUCTURESince the demise of apartheid, government has invested heavily in basic infrastructure in all four case
study areas. These improvements (in access to water, sanitation and electricity) are evident in Figure 5.
The scale of this delivery record re� ects the dif� cult legacy of ‘backlogs’ that the post-apartheid
government was confronted with as an urgent political and social imperative.
Figure 5: Improvements in basic service levels in the four settlements (1996, 2001 and 2013)
% of households with a � ush toilet 2011
% of households with a � ush toilet 2001
% of households with a � ush toilet 1996
% of households with access to electricity 2011
% of households with access to electricity 2001
% of households with access to electricity 1996
% of households with water on the stand 2011
% of households with water on the stand 2001
% of households with water on the stand 1996
0 20 40 60 80 100
Winterveld Seshego Mdantsane Botshabelo
The percentages of households with access to water, sanitation and electricity
have increased considerably in all four settlements, most notably in Botshabelo
and Winterveld. Between 1996 and 2013, households with water on the stand
increased from 40% to 92.3% in Botshabelo and from 34.4% to 74.7% in Winterveld.
Access to electricity has also improved in all four towns. Although substantial
improvements in respect of waterborne sewerage are evident, the percentages are
still relatively low (approximately 35%) in Botshabelo and Winterveld.
The percentages of households with access to water, sanitation and
electricity have increased considerably in all four settlements
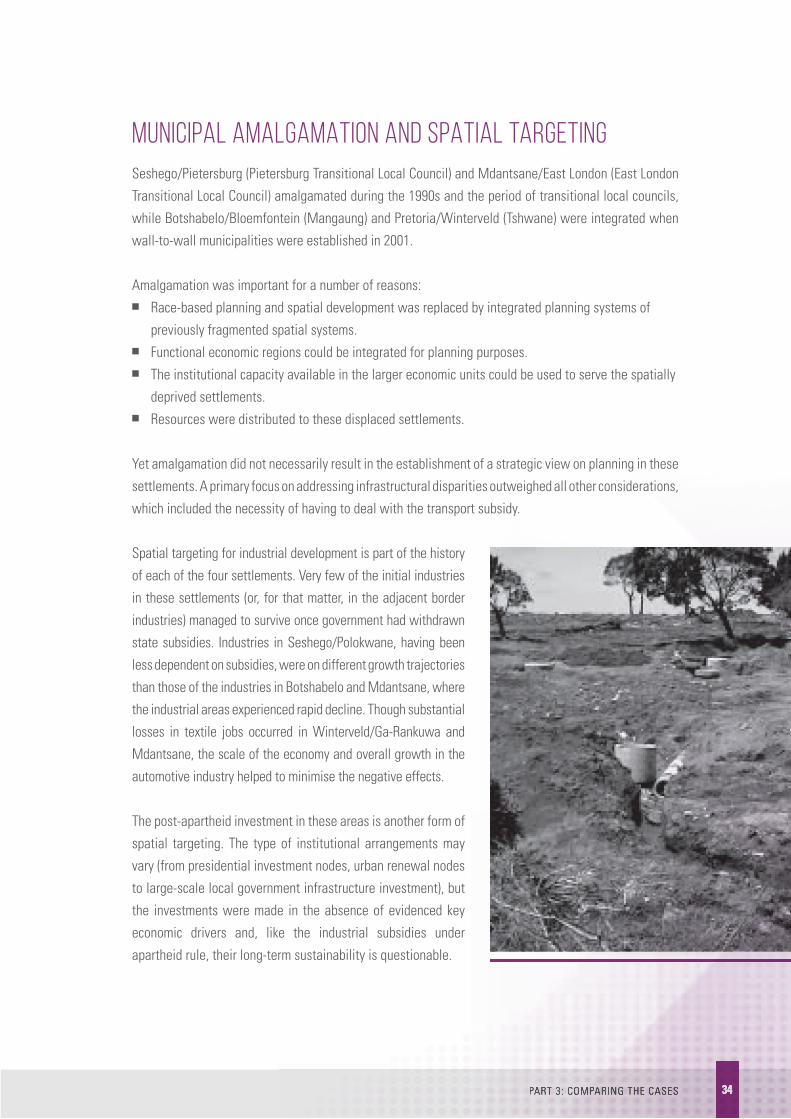
34PART 3: COMPARING THE CASES 34PART 3: COMPARING THE CASES
MUNICIPAL AMALGAMATION AND SPATIAL TARGETINGSeshego/Pietersburg (Pietersburg Transitional Local Council) and Mdantsane/East London (East London
Transitional Local Council) amalgamated during the 1990s and the period of transitional local councils,
while Botshabelo/Bloemfontein (Mangaung) and Pretoria/Winterveld (Tshwane) were integrated when
wall-to-wall municipalities were established in 2001.
Amalgamation was important for a number of reasons: ■ Race-based planning and spatial development was replaced by integrated planning systems of
previously fragmented spatial systems. ■ Functional economic regions could be integrated for planning purposes. ■ The institutional capacity available in the larger economic units could be used to serve the spatially
deprived settlements. ■ Resources were distributed to these displaced settlements.
Yet amalgamation did not necessarily result in the establishment of a strategic view on planning in these
settlements. A primary focus on addressing infrastructural disparities outweighed all other considerations,
which included the necessity of having to deal with the transport subsidy.
Spatial targeting for industrial development is part of the history
of each of the four settlements. Very few of the initial industries
in these settlements (or, for that matter, in the adjacent border
industries) managed to survive once government had withdrawn
state subsidies. Industries in Seshego/Polokwane, having been
less dependent on subsidies, were on different growth trajectories
than those of the industries in Botshabelo and Mdantsane, where
the industrial areas experienced rapid decline. Though substantial
losses in textile jobs occurred in Winterveld/Ga-Rankuwa and
Mdantsane, the scale of the economy and overall growth in the
automotive industry helped to minimise the negative effects.
The post-apartheid investment in these areas is another form of
spatial targeting. The type of institutional arrangements may
vary (from presidential investment nodes, urban renewal nodes
to large-scale local government infrastructure investment), but
the investments were made in the absence of evidenced key
economic drivers and, like the industrial subsidies under
apartheid rule, their long-term sustainability is questionable.
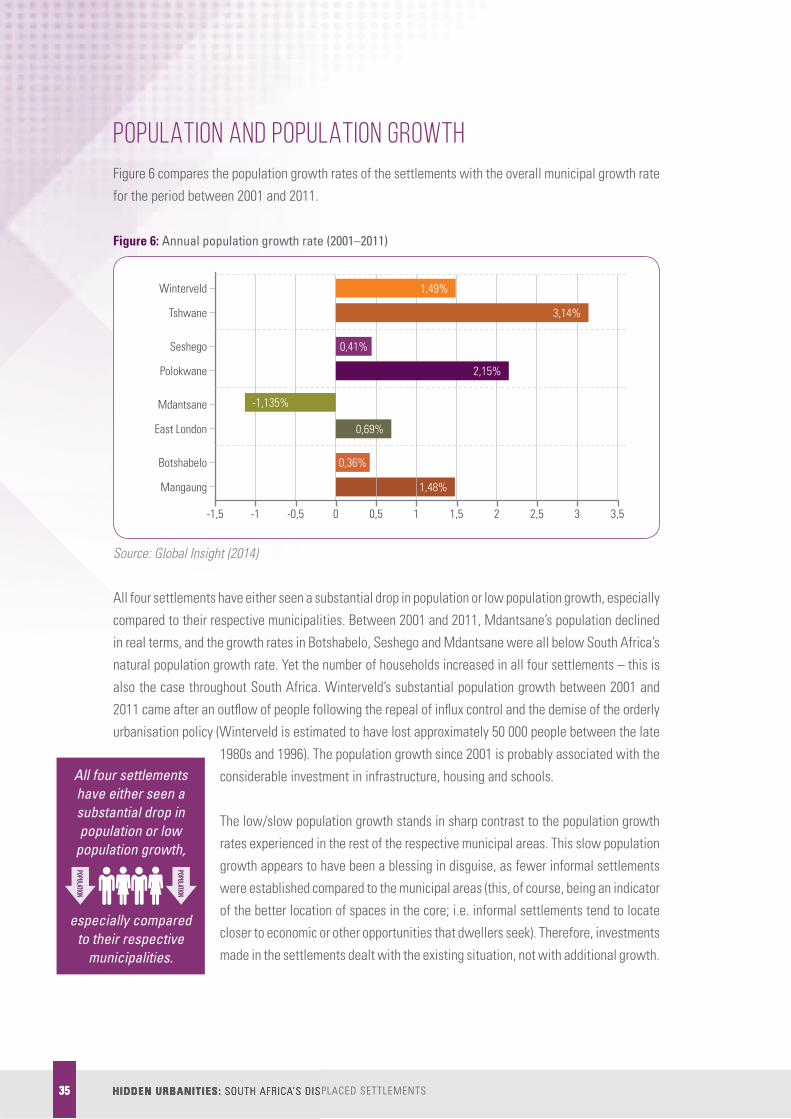
35 HIDDEN URBANITIES: SOUTH AFRICA’S DISPLACED SETTLEMENTS35 HIDDEN URBANITIES: SOUTH AFRICA’S DISPLACED SETTLEMENTS
POPULATION AND POPULATION GROWTHFigure 6 compares the population growth rates of the settlements with the overall municipal growth rate
for the period between 2001 and 2011.
Figure 6: Annual population growth rate (2001–2011)
1,48%Mangaung
Botshabelo
East London
Mdantsane
Polokwane
Seshego
Tshwane
Winterveld 1,49%
3,14%
0,41%
2,15%
-1,135%
0,69%
0,36%
-1,5 -1 -0,5 0 0,5 1 1,5 2 2,5 3 3,5
Source: Global Insight (2014)
All four settlements have either seen a substantial drop in population or low population growth, especially
compared to their respective municipalities. Between 2001 and 2011, Mdantsane’s population declined
in real terms, and the growth rates in Botshabelo, Seshego and Mdantsane were all below South Africa’s
natural population growth rate. Yet the number of households increased in all four settlements – this is
also the case throughout South Africa. Winterveld’s substantial population growth between 2001 and
2011 came after an out� ow of people following the repeal of in� ux control and the demise of the orderly
urbanisation policy (Winterveld is estimated to have lost approximately 50 000 people between the late
1980s and 1996). The population growth since 2001 is probably associated with the
considerable investment in infrastructure, housing and schools.
The low/slow population growth stands in sharp contrast to the population growth
rates experienced in the rest of the respective municipal areas. This slow population
growth appears to have been a blessing in disguise, as fewer informal settlements
were established compared to the municipal areas (this, of course, being an indicator
of the better location of spaces in the core; i.e. informal settlements tend to locate
closer to economic or other opportunities that dwellers seek). Therefore, investments
made in the settlements dealt with the existing situation, not with additional growth.
All four settlements have either seen a substantial drop in population or low
population growth,
POPULATION
POPULATION
especially compared to their respective
municipalities.

36PART 3: COMPARING THE CASES 36PART 3: COMPARING THE CASES
Table 3 shows the population structure and different age categories for 1996 and 2011.
Table 3: Population share per age segment (1996 and 2011)
AGE
BOTSHABELO MANGAUNG MDANTSANE BUFFALO CITY SESHEGO POLOKWANE WINTERVELD TSHWANE
1996%
2011%
1996%
2011%
1996%
2011%
1996%
2011%
1996%
2011%
1996%
2011%
1996%
2011%
1996%
2011%
0–14 years 35.8 31.6 29.7 26.8 32.1 24.9 33.7 29 33.7 29 30.4 26.4 33.7 29 27.2 23.2
15–34 years 38.9 37.5 39.5 36.3 41.3 42.8 39.4 41 39.4 41 37.6 36.2 39.4 41 39.7 40.6
35–60 years 19.4 23.6 24.7 27.9 21.6 25.7 21.6 23.6 21.6 23.6 24.5 28.6 21.6 23.6 26.4 28.7
60+ years 5.9 7.3 6.1 8.9 5 6.7 5.2 6.4 5.2 6.4 7.4 8.8 5.2 6.4 6.7 7.5
Source: Stats SA (2013)
The percentage of the population under the age of 35 has decreased
considerably in all the case study areas, indicating that the working
age population is leaving the settlements. While normal
demographic change may account for some of this decrease, the
scale suggests an out� ow of younger working-class people from
these areas. The outmigration of working-age people is higher in
Mdantsane and Botshabelo than in Seshego or in Winterveld
(where people appear to be returning or moving into the areas).
The share of population older than 60 has increased, and the
average age has increased more rapidly than in their respective
municipalities. The percentage of people older than 60 living in
Mdantsane was 0.1% higher than in Buffalo City, which is surprising
considering the older white population segment in Buffalo City. The
percentage of people older than 60 in Botshabelo increased by
1.4% (from 5.9% in 1996 to 7.3% in 2011), compared to just 0.6%
in Mangaung. The other settlements display a similar trend.
Essentially, large increases in the percentages of aged populations
mean that these settlements could increasingly be viewed as
places where non-economically active populations live.
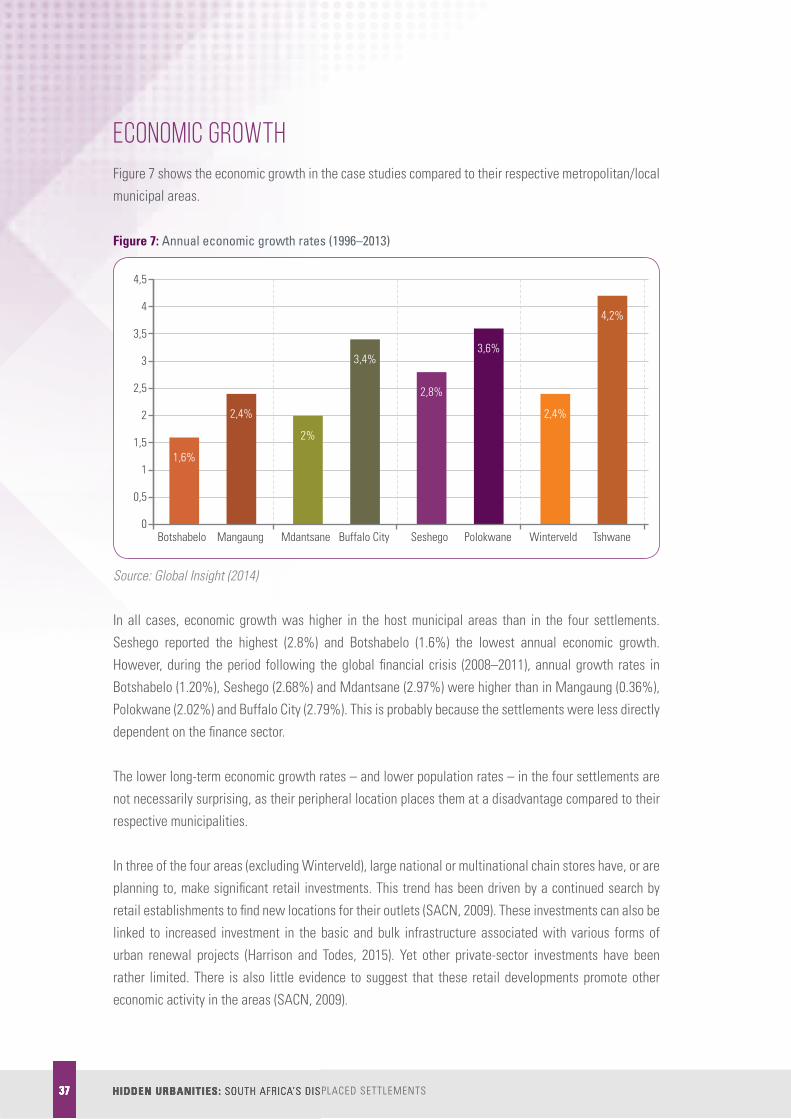
37 HIDDEN URBANITIES: SOUTH AFRICA’S DISPLACED SETTLEMENTS37 HIDDEN URBANITIES: SOUTH AFRICA’S DISPLACED SETTLEMENTS
ECONOMIC GROWTHFigure 7 shows the economic growth in the case studies compared to their respective metropolitan/local
municipal areas.
Figure 7: Annual economic growth rates (1996–2013)
4,5
4
3,5
3
2,5
2
1,5
1
0,5
0
1,6%
2,4%
2%
3,4%
2,8%
3,6%
2,4%
4,2%
Botshabelo Mangaung Mdantsane Buffalo City Seshego Polokwane Winterveld Tshwane
Source: Global Insight (2014)
In all cases, economic growth was higher in the host municipal areas than in the four settlements.
Seshego reported the highest (2.8%) and Botshabelo (1.6%) the lowest annual economic growth.
However, during the period following the global � nancial crisis (2008–2011), annual growth rates in
Botshabelo (1.20%), Seshego (2.68%) and Mdantsane (2.97%) were higher than in Mangaung (0.36%),
Polokwane (2.02%) and Buffalo City (2.79%). This is probably because the settlements were less directly
dependent on the � nance sector.
The lower long-term economic growth rates – and lower population rates – in the four settlements are
not necessarily surprising, as their peripheral location places them at a disadvantage compared to their
respective municipalities.
In three of the four areas (excluding Winterveld), large national or multinational chain stores have, or are
planning to, make signi� cant retail investments. This trend has been driven by a continued search by
retail establishments to � nd new locations for their outlets (SACN, 2009). These investments can also be
linked to increased investment in the basic and bulk infrastructure associated with various forms of
urban renewal projects (Harrison and Todes, 2015). Yet other private-sector investments have been
rather limited. There is also little evidence to suggest that these retail developments promote other
economic activity in the areas (SACN, 2009).

38PART 3: COMPARING THE CASES 38PART 3: COMPARING THE CASES
POVERTY LEVELSResidents in these displaced settlements were generally
poorer than residents in former black townships near
the economic core areas, but better off than their rural
black counterparts. The three indicators used to
measure poverty are: the human development index
(HDI), the percentage/number of people living in
poverty and the percentage of household expenditure
spent on food.
Human development indexThe HDI is a compound indicator consisting of educational level, per capita income and life expectancy.
The changing HDI for the four case studies is compared to the black population of the magisterial districts
of Mangaung, East London, Polokwane and Pretoria, with the purpose of comparing the displaced
population with the population that was able to migrate directly to the main urban complex (Figure 8).
Figure 8: Human development index (1996 and 2013)
1996 2013
0,8
0,7
0,6
0,5
0,4
0,3
0,2
0,1
0,Botshabelo Bloemfontein
(black population)
Mdantsane East London (black
population)
Seshego Polokwane City (black population)
Winterveld / Ga-Rankuwa
Pretoria (black
population)
Source: Global Insight (2014)
DISPLACED SETTLEMENTS
RURAL AREAS
better off than
TOWNSHIPS NEAR ECONOMIC
CORE AREAS
poorer than

39 HIDDEN URBANITIES: SOUTH AFRICA’S DISPLACED SETTLEMENTS39 HIDDEN URBANITIES: SOUTH AFRICA’S DISPLACED SETTLEMENTS
The 2013 HDI � gures for the four case studies were consistently lower than those for the black population
living in the core economic areas. Of the four case studies, the two areas closest to the core urban area
(Mdantsane and Seshego) have the higher HDI (0.60). Interestingly, in 1996, Mdantsane had a higher HDI
than the black population in East London, which could indicate large-scale under-investment in Duncan
Village to ensure that Mdantsane would be the more attractive place in which to settle.
People living in povertyBetween 1996 and 2013, the growth in the number of people living in poverty in the four case studies
was considerably lower than in the core urban areas. In Seshego, the number of people living in poverty
decreased by 0.8% per annum between 1996 and 2013, largely because of effective integration but also
because the corridor development between Polokwane City and Seshego accommodated new
urbanisation. The annual growth in numbers of people living in poverty was very low in Mdantsane
(0.08%) and Botshabelo (0.9%) but higher in Winterveld/Ga-Rankuwa (3.5%). During the same period,
the annual growth in numbers of people living in poverty was much higher in the core urban areas: 3.9%
in Bloemfontein, 2.9% in East London, 4.3% in Polokwane City and 9.7% in Pretoria. These � gures
con� rm the migration trends and imply that the poverty nodes are shifting from displaced settlements to
the core economic areas.
Nevertheless, the percentage of people living in poverty is still considerably higher in the displaced
settlements than in the core economic areas, as re� ected in Figure 9.
Figure 9: Percentage of people living in poverty (2013)
Pretoria (black
population)
Winterveld –Ga-Rankuwa
Polokwane City (black population)
Seshego East London (black
population)
Mdantsane Bloemfontein (black
population)
Botshabelo
33,6%
43,9%
37,7%
47,4%46,1% 46,3%
35,7%
48%
50
40
30
20
10
0
Source: Global Insight (2014)

40PART 3: COMPARING THE CASES 40PART 3: COMPARING THE CASES
Household expenditure on foodThe share of household expenditure used to purchase food is commonly used as an indicator of poverty.
The higher the share spent on food, the more acute the poverty. Household expenditure on food was
found to be consistently higher in the four displaced settlements than among the black population in the
core economic areas (Figure 10).
Figure 10: Percentages of household expenditure spent on food
Pretoria (black
population)
Winterveld –Ga-Rankuwa
Polokwane City (black population)
Seshego East London (black
population)
Mdantsane Bloemfontein (black
population)
Botshabelo
30
25
20
15
10
5
0
12,8%
21,7%
14,9%
22,6%
15,3%
22,5%
15,1%
25,1%
This suggests that while poor migrants are moving to the core areas, the displaced settlements continue
to have high levels of poverty and thus require social investment or support. Yet again, the displaced
settlements with the largest differences in poverty levels compared to their respective municipalities
were the two areas farthest away from the core economic areas: Botshabelo and Winterveld.
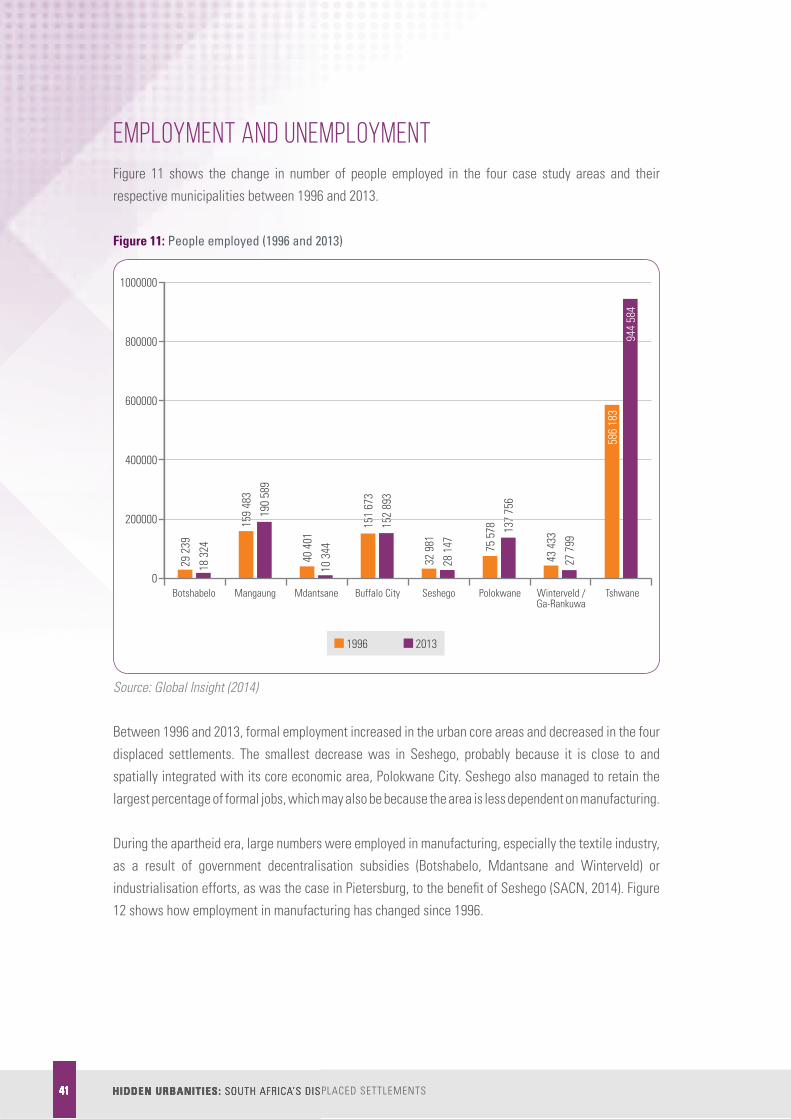
41 HIDDEN URBANITIES: SOUTH AFRICA’S DISPLACED SETTLEMENTS41 HIDDEN URBANITIES: SOUTH AFRICA’S DISPLACED SETTLEMENTS
EMPLOYMENT AND UNEMPLOYMENTFigure 11 shows the change in number of people employed in the four case study areas and their
respective municipalities between 1996 and 2013.
Figure 11: People employed (1996 and 2013)
1996 2013
1000000
800000
600000
400000
200000
29 2
39
40 4
01
159
483
151
673
75 5
78
43 4
33
32 9
81
18 3
24
10 3
44
190
589
152
893
137
756
27 7
99
28 1
47
0Botshabelo Mangaung Mdantsane Buffalo City Seshego Polokwane Winterveld /
Ga-RankuwaTshwane
586
183
944
584
Source: Global Insight (2014)
Between 1996 and 2013, formal employment increased in the urban core areas and decreased in the four
displaced settlements. The smallest decrease was in Seshego, probably because it is close to and
spatially integrated with its core economic area, Polokwane City. Seshego also managed to retain the
largest percentage of formal jobs, which may also be because the area is less dependent on manufacturing.
During the apartheid era, large numbers were employed in manufacturing, especially the textile industry,
as a result of government decentralisation subsidies (Botshabelo, Mdantsane and Winterveld) or
industrialisation efforts, as was the case in Pietersburg, to the bene� t of Seshego (SACN, 2014). Figure
12 shows how employment in manufacturing has changed since 1996.

42PART 3: COMPARING THE CASES 42PART 3: COMPARING THE CASES
Figure 12: Employment in manufacturing (1996 and 2013)
1996 2013
120000
100000
80000
60000
40000
20000
0Botshabelo Mangaung Mdantsane Buffalo City Seshego Polokwane Winterveld /
Ga-RankuwaTshwane
6 82
0 13 5
23
15 0
63
7 63
3
10 2
77
13 2
45
4 41
7
10 6
2
2 74
610 3
88
10 2
77
7 63
3
5 08
7
2 28
3
9104
1
1130
68
Since 1996, the reduction in manufacturing employment has been drastic. By 2013, only 15% of the
manufacturing jobs in Botshabelo remained, 20% in Mdantsane, 38% in Winterveld/Ga-Rankuwa and
51% in Seshego. Increased jobs in the vehicle manufacturing industry (an industrial subsector supported
by government) somewhat countered the loss of jobs in Mdantsane and Winterveld/Ga-Rankuwa.
Similarly, the continued industrialisation of Polokwane meant that new developments made up for the
manufacturing jobs lost in Seshego.
The textile industry has seen the steepest decline: of the textile jobs in 1996, by 2013 only 3.7% remained
in Mdantsane, 8.5% in Botshabelo, 7.7% in Seshego and 30.8% in Winterveld/Ga-Rankuwa. This decline
was far greater than in the respective municipalities, where the textile industry managed to retain more
jobs than in the four displaced settlements.
The unemployment rate grew more slowly in the four displaced settlements than in the larger municipal
areas, probably because low-income people could settle closer to the core economic areas where most
job opportunities are found. Between 1996 and 2013, the unemployment rate increased by 9.1% (from
18.8% to 27.9%) in Mangaung and by 7.3% (from 28.8% to 36.1%) in Botshabelo, but (interestingly)
declined in both Seshego and Mdantsane (Figure 13).

43 HIDDEN URBANITIES: SOUTH AFRICA’S DISPLACED SETTLEMENTS43 HIDDEN URBANITIES: SOUTH AFRICA’S DISPLACED SETTLEMENTS
Figure 13: Unemployment rates (1996 and 2013)
1996 2013
Botshabelo Mangaung (black
population)
Mdantsane Buffalo City (black population)
Seshego Polokwane City (black population)
Winterveld / Ga-Rankuwa
Tshwane, (black
population)
28,8
%
28,6
%
19,3
%
20,3
%
31,3
%
9,5%
21,7
%
29,2
%
26,1
%
26,7
%29,2
%
15,9
%
30,5
%
22,3
%
16,8
%
27,9
%
0
5
10
15
20
25
30
35
Against the backdrop of declining formal employment, the research looked into whether new employment
opportunities have been created in the household sector. Although this type of employment does not
contribute directly to the economy, it does provide lower-skilled workers with employment opportunities.
The data in respect of employment in the household sector is represented in Figure 14.
Figure 14: Employment in the household sector (1996 and 2013)
0
1996 2013
250000
200000
150000
100000
50000
Botshabelo Mangaung Mdantsane Buffalo City Seshego Polokwane Winterveld / Ga-Rankuwa
Tshwane
2 64
5
857
43 7
27
38 2
70
25 6
16
1 69
0
2 36
0
1 06
2
525
63 8
78
42 1
21
37 3
33
1 43
5
2 74
7
126
319
244
041
Source: Stats SA (2013)

44PART 3: COMPARING THE CASES 44PART 3: COMPARING THE CASES
Between 1996 and 2013, employment in the household sector decreased in Botshabelo, Mdantsane and
Winterveld but increased substantially in the four municipal areas as well as in Seshego. This suggests
that being close to the core economic area and to the social networks of employed people is pivotal to
� nding employment in the household sector.
SPATIAL INTEGRATIONOf the four case studies, only one – Seshego – has successfully achieved some spatial integration with
its core economic area (Polokwane. previously Pietersburg). This is because just 10 km separate Seshego
and Polokwane, a good access road links the two towns, the area has a relatively � at topography, and
appropriate planning began in the early 1990s. In addition, no existing landowners had vested interests
that threatened the corridor development and in� ll developments. Another contributing factor is
Polokwane’s large-scale economic growth since the early 1990s, in particular a retail sector boom as a
result of the collapse of the Zimbabwean economy.
In Mdantsane, spatial conglomeration seems to be shifting northwards towards King William’s Town,
where most new developments are taking place. However, the Mdantsane area’s topography is likely to
make new and in� ll developments more dif� cult than in Polokwane.
In� ll development will probably never materialise in Botshabelo and Winterveld because of the distances
from Bloemfontein and Pretoria respectively. Botshabelo’s spatial integration with Mangaung will also
be limited because of the municipal spatial plans, which state that no developments should take place
in the southern parts of Botshabelo (Mandela View was developed on land originally earmarked for
industrial development in Bloemdustria) and emphasise the integration of the open spaces between
Botshabelo and Thaba Nchu.
PRIVATE INVESTMENT IN HOUSINGIn all four displaced settlements private investment in housing is ongoing, albeit in different forms and
to various degrees (Figure 15). Botshabelo has seen the highest increase in the average house size
(based on number of rooms per house), increasing from 3.02 to 3.95 rooms between 1996 and 2011.
During the same period, formal houses in Botshabelo increased by almost 20% (from nearly 60% to just
below 80%).
In Mdantsane, between 1996 and 2011 the average house size increased from 3.26 to 3.97 rooms, while
formal houses increased by only 2.5%. Seshego experienced marginal increases in average house size
but a 24% increase in formal housing units (from 67.1% in 1996 to 91.1% in 2011). In Winterveld, the
average house size declined slightly, while the percentage of formal houses increased slightly, probably

45 HIDDEN URBANITIES: SOUTH AFRICA’S DISPLACED SETTLEMENTS45 HIDDEN URBANITIES: SOUTH AFRICA’S DISPLACED SETTLEMENTS
because of the new houses constructed under the Housing Subsidy Programme. Despite general declines
in household size, housing investment seems to have continued unabated in at least three of the four
settlements. This may be because of a desire to create a place of retirement, an increasing experience
of these places as ‘home’ or maybe even a lack of alternatives.
Figure 15: House size and household size, 1996 and 2011
1996 2011
5
4,5
4
3,5
3
2,5
2
1,5
1
0,5
0Bothsabelo –
house sizeBotshabelo –
household sizeMdantsane –
house sizeMdantsane – household size
Seshego – house size
Seshego – household size
Winterveld – house size
Winterveld – household size
3,02
% 3,26
%
4,52
%
4,47
%
4,5%
4,1
3,85
%
3,97
%
3,95
%
3,59
%
3,59
%
3,44
%
3,97
3,97
%
4,69
3,57
The improvements in Botshabelo suggest that increased investments in basic infrastructure, which result
in private housing investments, have locked people into the location. The interviews revealed that
moving is indeed dif� cult for some households.
TRANSPORT EXPENDITUREWith the exception of Seshego, the case study areas had subsidised bus systems. Botshabelo and
Winterveld have recorded substantial declines in the number of people commuting on a daily basis,
while con� ict between the taxi industry and the bus companies in Mdantsane eventually led to the bus
service being discontinued. However, the existing subsidy remains critical for ensuring access to
employment in the main urban areas. Any discontinuation of the subsidy is sure to have a detrimental
effect on the existing commuters. Figure 16 provides an overview of money spent on public transport.

46PART 3: COMPARING THE CASES 46PART 3: COMPARING THE CASES
Figure 16: Percentage of household expenditure on public transport (1996 and 2013)
1996 2013
5,00%
4,00%
3,00%
2,00%
1,00%
0,00%Botshabelo Mangaung Mdantsane Buffalo City Seshego Polokwane Winterveld /
Ga-RankuwaTshwane
4,50
%
5,00
%
2,40
%
2,50
% 2,70
%
3,80
%
4,00
%
1,40
%
1,40
%
0,60
%
0,70
%
0,50
%
1,20
%
1,00
%
1,80
%
0,40
%
Source: Global Insight (2014)
As Figure 16 illustrates, households in the displaced settlements spend a much higher proportion of their
expenditure on public transport compared to households in their respective municipalities. Households
in Winterveld/Ga-Rankuwa and Mdantsane spend over 100% more than households in Pretoria and East
London, respectively. These � gures could be even higher in practice, given that Botshabelo and
Winterveld/Ga-Rankuwa still have bus subsidies.
SCHOOLS AND EDUCATIONThe quality of the schools played a crucial role in creating (or not creating) a sense of place in at least
two of the case studies (Botshabelo and Winterveld). Learners were attracted to schools in Winterveld
by the considerable investment in the school system and the school feeding scheme. The overall quality
of education also doubtlessly improved, which contributed to a positive sense of place. The opposite
happened in Botshabelo, where schools are perceived as underperforming (despite one or two good
secondary schools). At least three schools in the area have closed, as children attend schools elsewhere
(for example in Bloemfontein), and the out� ow of people and internal migration to the northern parts of
Botshabelo continues.

47 HIDDEN URBANITIES: SOUTH AFRICA’S DISPLACED SETTLEMENTS47 HIDDEN URBANITIES: SOUTH AFRICA’S DISPLACED SETTLEMENTS
Figure 17: Percentage of people without any education, 1996 and 2011
1996 2011
30
25
20
15
10
5
0
5.8%
3,4% 3,3%
10%
20%
15,1%
13,2%
26%
Botshabelo Mdantsane Seshego Winterveld / Ga-Rankuwa
The education levels in the displaced settlements are generally lower than in their respective
municipalities, despite a considerable improvement since 1996. For example, in Botshabelo, the
percentage of people with no schooling has dropped from 20% in 1996 to 5.8% in 2011 (compared to
4.4% for the Mangaung Metropolitan Municipality) Of the four areas, Winterveld has the highest
percentage of people without schooling – 10.8% in 2011 but down from 26% in 1996. Compared to their
respective municipalities, three of the settlements have substantially lower percentages of people with
post-Grade 12 quali� cations: Botshabelo (3.3%), Mdantsane (7.1%) and Winterveld (3.5%). The exception
is Seshego, where 17.4% of people have post-Grade 12 quali� cation, compared to 12% for Polokwane,
which again suggests Seshego’s functional integration with the larger Polokwane Local Municipality.

PART 4: SOME LESSONS FOR PROGRAMMES AND POLICY
The four case studies are a stark reminder that the spatial fragmentation of economic
regions – a product of apartheid planning – continues to hamper development. In
re� ecting on the lessons for programmes and policy, a fundamental concern is the
absence of an integrated rationale for investment decisions in these settlements.
1 DISPLACED SETTLEMENTS HAVE MULTIPLE FUNCTIONAL ROLES
Historically, under apartheid, displaced settlements were a means of addressing urbanisation, as dormitory
towns intended to keep black urbanisation at some distance from the main urban centres and administratively
linked to the former homelands. Post-apartheid conceptualisation of these displaced settlements has been
rather vague and diverse, possibly because their functional roles are also changing. Many of these settlements
could remain dormitory towns with little potential to develop their economies (Crankshaw and Parnell, 1996)
– the Mangaung IDP still refers to Botshabelo as a dormitory town (a place where people sleep). Unlike
Botshabelo, Seshego has integrated into the larger urban centre, whereas Winterveld is a rural development
node in Gauteng. Both Mdantsane and Botshabelo seem to have developed other functional roles that are
distinct from their historical role. For instance, as retirement places (with greater numbers of elderly people
moving there) or for families, or as places of social care (because of the substantial housing investments over
the past decade and the high number of social grantees).
A fundamental concern is the absence of an
integrated rationale for investment decisions in
these settlements.
48PART 4: SOME LESSONS FOR PROGRAMMES AND POLICY
The four case studies are a stark reminder that the spatial fragmentation of economic
regions – a product of apartheid planning – continues to hamper development. In
re� ecting on the lessons for programmes and policy, a fundamental concern is the
absence of an integrated rationale for investment decisions in these settlements.
Historically, under apartheid, displaced settlements were a means of addressing urbanisation, as dormitory
towns intended to keep black urbanisation at some distance from the main urban centres and administratively
linked to the former homelands. Post-apartheid conceptualisation of these displaced settlements has been
rather vague and diverse, possibly because their functional roles are also changing. Many of these settlements
could remain dormitory towns with little potential to develop their economies (Crankshaw and Parnell, 1996)
– the Mangaung IDP still refers to Botshabelo as a dormitory town (a place where people sleep). Unlike
Botshabelo, Seshego has integrated into the larger urban centre, whereas Winterveld is a rural development
node in Gauteng. Both Mdantsane and Botshabelo seem to have developed other functional roles that are
distinct from their historical role. For instance, as retirement places (with greater numbers of elderly people
moving there) or for families, or as places of social care (because of the substantial housing investments over
A fundamental concern is the absence of an
integrated rationale for investment decisions in
these settlements.
48
Part 4:
Some Lessons for Programmes and Policy

49 HIDDEN URBANITIES: SOUTH AFRICA’S DISPLACED SETTLEMENTS49 HIDDEN URBANITIES: SOUTH AFRICA’S DISPLACED SETTLEMENTS
Local planning frameworks need to understand, contextualise and incorporate the multi-functional roles
of these settlements, even if their economic potential is limited. Examples of these functional roles are: ■ The dormitory town, as commonly portrayed in documents such as the Mangaung IDP. ■ The rural town, e.g. the Winterveld case study, which is a role that is deeply embedded in the
area’s development. ■ The place of caring (for children and the aged), especially where relatively high densities would
help make the area economically more viable, such as in Mdantsane and Botshabelo. ■ The rural home where family investments are made (e.g. Botshabelo) ■ An integrated suburb within a larger urban area (e.g. Seshego)
This nuanced understanding of places can lead to more appropriate and strategic investments into these
areas that begin to work towards the vision of a post-apartheid, spatially transformed city.
2 THE QUEST FOR SPATIAL INTEGRATION AND IMPROVED DENSITIES CONTINUES
The notion of spatial integration is deeply entrenched in the post-apartheid policy agenda, and the need
for greater densities is a logical consequence of this integration. Although densities have increased in
Johannesburg and Tshwane (albeit from a low basis), achieving spatial integration and increased
densities has been dif� cult. At the same time, migration trends are following job creation trends –
‘people are voting with their feet’, leaving localities with limited economic potential for the larger
metropolitan areas. Elements of new employment creation are visible within metropolitan areas and
municipal core areas related to the four case studies. It should be noted that: ■ Urban densities in the displaced settlements are relatively high and, in the case of Seshego,
Mdantsane and Botshabelo, higher than the municipal average. Yet all four settlements have low/
slow population growth and have not managed to create new jobs, despite the job creation in their
respective core urban areas (i.e. Pretoria, Bloemfontein, East London and Polokwane). ■ New housing investments in these areas are probably the reason for the relatively high urban
densities persisting. However, neither these new investments nor the relatively high densities have
been accompanied by new employment opportunities. ■ Of the four case studies, Seshego is probably the only place where functional integration has been
achieved. This functional integration is the result of its close proximity to Polokwane, its role as the
former black township of Pietersburg and because deliberate attempts were made to integrate the
old Pietersburg and Seshego since the early 1990s. ■ Spatial integration is being achieved through people leaving these settlements and settling
in the economic core, especially in Botshabelo and Mdantsane. The continued existence of a
subsidised bus system between Botshabelo and Bloemfontein has probably reduced the impact of
resettlement towards Bloemfontein. However, the many new stands being made available in and

50PART 4: SOME LESSONS FOR PROGRAMMES AND POLICY PART 4: SOME LESSONS FOR PROGRAMMES AND POLICY 50PART 4: SOME LESSONS FOR PROGRAMMES AND POLICY
near Bloemfontein (compared to a dearth of stands in Botshabelo) should be seen as a means of
achieving spatial integration and of accommodating people in the economic core (where some jobs
have been created).
Innovative ways are needed to increase densities and achieve spatial integration within the regional
context. This will require explicitly articulating the spatial integration plan between the displaced
settlements and their respective municipality.
3 LARGE-SCALE INFRASTRUCTURE INVESTMENTS HAVE LOCKED PEOPLE IN
All four case studies have received large-scale government investments, supported by local political
pressure and amalgamation through municipal demarcation since 1993. The large-scale investments
suggest that a signi� cant degree of spatial justice has been pursued at some basic level. However, what
is not clear is whether other principles, particularly spatial ef� ciency and quality, are being accomplished
and whether government has compromised ef� ciency for justice, or is this simply the price to pay for the
apartheid spatial legacy.
A concern is that continued investment and subsidisation serve to lock people into these areas, which
were planned under apartheid to displace urbanisation from the core urban areas. This is probably not
applicable to Seshego because of the short distance from Polokwane City and its historical role as the
main ‘black township’ under apartheid (as well as a displaced settlement). However, apart from
Winterveld between 2001 and 2011, all four settlements have seen large outmigration and signi� cant
job losses, and at the same time considerable infrastructure and housing investments. In most of these
areas, substantial private housing investments have also materialised. Household investment into
housing (seen especially in Botshabelo) may even exaggerate the lock in. Such investments come on the
back of substantial improvements in the basic infrastructure of the four case-study areas. The continued
bus subsidy (in Botshabelo and Winterveld) largely reinforces the lock in.
Despite remarkable achievements in delivering basic services, the broader investment debate does not
appear to have been considered as part of these developments. Key questions in this broader debate include: ■ What is the strategic approach intended for addressing spatial dislocation, other than simply
maintaining or even entrenching it? ■ At what point will such investment be suf� cient? ■ Should investments in basic infrastructure go beyond basic service levels? What are the arguments
in favour of exceeding (or adhering to) only basic levels in certain poorly located areas? ■ Are state-driven investment models sustainable in the long run? Is there an intent to secure a return
on investment through municipal service charges or property taxes? If not, then what is envisaged
for how the municipalities would function?

51 HIDDEN URBANITIES: SOUTH AFRICA’S DISPLACED SETTLEMENTS51 HIDDEN URBANITIES: SOUTH AFRICA’S DISPLACED SETTLEMENTS
■ How can various subsidy systems be integrated to avoid reinforcing the spatial marginalisation
created under apartheid? For example, the study found that providing a state transport subsidy for
commuting and housing subsidies largely reinforce apartheid spatial patterns.
4 AN OPEN DEBATE ON TRANSPORT AND HOUSING SUBSIDIES IS NEEDED
The IUDF suggests that an open debate is needed concerning subsidies in South Africa, and the intended
and unintended consequences of different subsidies. The debate should be broadened because: ■ Subsidies are associated either directly or indirectly with the large-scale investments in the four
settlements. For example, infrastructure or housing subsidies generally involve some form of capital
grant. ■ The continued bus subsidy (Botshabelo and Winterveld) serves to perpetuate the subsidisation of
peripheral locations, which probably is the single most important reason why people are prevented
from migrating from Botshabelo to Bloemfontein. ■ In interrogating the rationales for the transport subsidy and the housing subsidy, how wise is using
a bus subsidy and a settlement grant in the same place, and where acknowledged inef� ciency (poor
location) is effectively being locked in.
5 TENSION BETWEEN SERVICE DELIVERY AND STRATEGIC SPATIAL PLANNING
An integrated and strategic planning response to these displaced settlements is needed. The state has
made noteworthy progress in delivering services and addressing service backlogs in these areas,
especially since the mid-1990s and in 2001 when these displaced settlements merged with their
respective economic areas resulting in increased institutional capacity. Yet the danger is that extending
service delivery, particularly housing delivery and major infrastructure investments in questionable
locations, may in fact reinforce the existing spatial inequalities. The NDP (NPC, 2012: 279) identi� es ‘the
lack of an overarching strategic approach to spatial development’ as a major shortcoming for the country.
Similarly, these four displaced settlements need a strategic approach that would entail reconciling
different subsidies and asking questions about long-term viability. Only Botshabelo has attempted this
(Tomlinson and Krige, 1997), although the provincial authorities’ response to the report was decidedly
lukewarm and the basic principles introduced in the Botshabelo Investment Study are unlikely to remain
in the institutional memory of the existing bureaucracy.
The dif� cult question of how to redress the locational challenge and dif� cult histories of these displaced
settlements is yet to be resolved. In many ways, their situation has been exacerbated or at least
entrenched by deferring the dif� cult questions and choices.

Concluding Remarks
Like previous differentiation studies, this study explored an important issue, using qualitative and
quantitative evidence to enhance understanding, to raise questions and gain fresh perspectives. All of
these draw attention to policy and planning and stimulate conversation, which will hopefully result in a
better-informed agenda for policy and action. More speci� cally, in line with the previous studies on
differentiation, the case is indeed made for differentiated planning. In fact, this report shows that, in
practice, some forms of differentiation do indeed already exist (for example the transport subsidy). The
report also argues that the high levels of complexity of these displaced settlements require a holistic
planning approach in which differentiation is a central component.
PART 4: SOME LESSONS FOR PROGRAMMES AND POLICY 52

References
Bekke S. 1991. Cities straddling homeland boundaries. In Swilling M, Humphries R and Shubane K (eds.) Apartheid city in transition (pp. 108−118). Cape Town: Oxford University Press.
CDE (Centre for Development and Enterprise). 1998. South Africa’s ‘discarded people’: survival, adaptation and current policy challenges. Johannesburg: Centre for Development and Enterprise.
Christopher AK. 1994. The Atlas of Apartheid. London: Routledge
Cobbet W. 1987. Industrial decentralisation and exploitation: the case of Botshabelo, South African Labour Bulletin 10(3): 1–13.
COGTA (Department of Cooperative Governance and Traditional Affairs). 2013. Integrated Urban Development Framework. Pretoria: COGTA.
COGTA. 2016. Integrated Urban Development Framework. Pretoria: CO GTA.
Crankshaw O and Parnell S. 1996. Housing provision and the need for an urbanisation policy for South Africa, Urban Forum 7(2): 232–237.
de Clerq F. 1994. Putting community participation into development work: The dif� cult case of Winterveld, Development Southern Africa 11(3): 379–393.
Donaldson SE. 2001. Amalgamation of the former homeland border-township of Seshego and the conservative apartheid city Pietersburg during transition, South African Geographical Journal, 83(3), 208–213.
Gauteng DBE (Department of Basic Education). 2014. Annual statistics for school learners in Winterveld area. Pretoria: Gauteng DBE.
Global Insight. 2014. Socio-economic data. Pretoria: Global Insight.
Harrison P. 1992. The policies and politics of informal settlement in South Africa: A historical background, Africa Insight 22(1): 14–22.
Harrison P and Todes A. 2015. Spatial transformation in a ‘loosening state’: South Africa in a comparative perspective, Geoforum 61: 148–162.
Hattingh P. 1975. Nedersetting en verstedeliking. In Moolman JH and Leistner GE (eds.) Bophuthatswana: hulpbronne en ontwikkeling (pp. 25–58). Pretoria: Africa Institute.
Horn AC. 1997. How (many) people are there in Winterveld? What a proper census should show, Urban Forum 8(1): 117–132.
Horn A, Hattingh P and Vermaak J. 1992. Winterveld: an urban interface settlement on the Pretoria metropolitan fringe. In. Smith DM (ed.) The Apartheid city and beyond: urbanization and social change in South Africa (pp. 113–124). London: Routledge.
Kotze N and Donaldson R. 1996. Desegregation in Pietersburg after the repeal of the Group Areas Act, Development Southern Africa 13(4): 119–127.
Krige S. 1991. Bloemfontein. In Lemon A (ed.) Homes apart. South Africa’s segregated cities (pp. 104–119). Cape Town: David Philip.
Krige S. 1996. Botshabelo: former fastest-growing urban area in South Africa approaching zero population growth. Bloemfontein: University of the Free State.
Mangaung Metropolitan Municipality. 2013. An audit of enterprises on industrial stands in Mangaung. Bloemfontein: Mangaung Metropolitan Municipality.
Marais L and Ntema J. 2013. The upgrading of an informal settlement in South Africa: twenty years onwards, Habitat International 39: 85−95.
Marais L, Nel E and Rogerson C. 2005. Manufacturing in former homeland areas of South Africa: The example of the Free State Province, Africa Insight 35(4): 39–44.
Marais L, Van Rooyen D, Lenka M and Cloete J. 2014. Planning for economic development in a secondary city? Trends, pitfalls and alternatives for Mangaung, South Africa. In Rogerson C and Szymańska D (eds.) Bulletin of Geography:
53 HIDDEN URBANITIES: SOUTH AFRICA’S DISPLACED SETTLEMENTS

References
Socio-economic Series 26, pp. 203–217. Toruń: Nicolaus Copernicus University.
Mokoena M and Marais L. 2008. An evaluation of post-apartheid housing delivery in Mangaung: a view from local government. In Marais L and Visser G (eds.) Spatialities of urban change: selected themes from Bloemfontein at the beginning of the 21st century (pp. 97–114). Stellenbosch: Sun Press.
Nel E. 1990. Mdantsane, East London’s homeland township: municipal neglect and apartheid planning 1949–1988, GeoJournal 22(3): 305–313.
Nel E and Hill T. 2001. Deindustrialisation and local economic development initiatives in KwaZulu-Natal, South Africa, Geography 86(4): 356–359.
NPC (National Planning Commission). 2012. National Development Plan. Pretoria: NPC.
Palmary I and Ngubeni K. 2003. ‘We are living in a forgotten place’: safety in the cross-border parts of the City of Tshwane. Johannesburg: Centre for Study of Violence and Reconciliation.
Parnell S and Crankshaw O. 2013. The politics of ‘race’ and the transformation of the post-apartheid space economy, Journal of Housing and the Built Environment DOI 10.1007/s10901-013-9345-6.
Platzky L and Walker C. 1985. The surplus people: forced removals in South Africa. Johannesburg: Ravan Press.
Republic of South Africa. 2012. The National Development Plan. Pretoria: The Presidency.
Simkins C. 2010. Population growth, migration, economic growth and poverty in Gauteng since 1970. A Southern Africa Labour and Development Research Unit Working Paper Number 47. Cape Town: SALDRU, University of Cape Town.
Smith D. 1992. The apartheid city and beyond: urbanisation and social change in South Africa. New York: Routledge.
SACN (South African Cities Network). 2009. Training for township renewal sourcebook. Johannesburg: SACN.
SACN. 2014. Polokwane case study: towards an understanding of intermediate cities in South Africa. Johannesburg: SACN.
Stats SA (Statistics South Africa). 2013. Census data for 1996, 2001 and 2011. Pretoria: Stats SA.
Tomlinson R and Krige S. 1997. Botshabelo: coping with the consequences of urban apartheid, International Journal for Urban and Regional Research 21(4): 691−705.
Turok I. 2011. Deconstructing density: strategic dilemmas confronting the post-Apartheid city, Cities 28(5): 470–477.
Turok I. 2013. Transforming South Africa’s divided cities: Can devolution help? International Planning Studies 18(2): 168–187.
Turok I and Borel-Saladin J. 2014. Is urbanisation in South Africa on a sustainable trajectory? Development Southern Africa 31(5): 675–691.
Twala C and Barnard L. 2006. The incorporation of Botshabelo into the former Qwaqwa homeland: a logical consequence of the apartheid system, Journal of Contemporary History 31(1): 161–177.
van Rensburg-Bonthuyzen E, Heunis C, Engelbrecht MKM and Summerton J. 2003. PHC delivery in the Mdantsane Urban Renewal Site, Eastern Cape: Mapping gaps in the maternal health, IMCI, TB, STIs, HIV/AIDS and EDL programmes. Bloemfontein: Centre for Health Systems Research and Development.
Wolfson T. 1991. Access to urban land. In Swilling M, Humphries R and Shubane K (eds.) Apartheid city in transition (pp. 231–257). Cape Town: Oxford University Press.
PART 4: SOME LESSONS FOR PROGRAMMES AND POLICY 54

Differentiation Studies Series
2012
2014
These publications may be accessed at www.sacities.net.