2,127 (june 30, 2014) php - 0 - - a brown company, inc. rosa anna duavit-santiago 02-6386832 contact...
TRANSCRIPT

- 1 -
3 1 1 6 8 SEC Registration Number
A B R O W N C O M P A N Y , I N C .
(Company’s Full Name)
(Business Address: No. Street City/Town/Province)
Atty. Rosa Anna Duavit-Santiago 02-6386832 Contact Person Company Telephone Number
1 2 3 1 1 7 - Q 0 6
Month Day FORM TYPE Month Day Fiscal Year Annual Meeting
Secondary License Type, if applicable
C F D Dept. Requiring this Doc. Amended Articles Number/Section Total Amount of Borrowings Total No. of Stockholders Domestic Foreign _ _ _ _ _ _ _ _ _ _ _ _ _ _ _ _ _ _ _ _ _ _ _ _ _ _ _ _ _ _ _ _ _ _ _ _ _ _ _ _ _ _ _ _ _ _ _ _ _
To be accomplished by SEC Personnel concerned
File number LCU Document I.D. Cashier Remarks = pls. use black ink for scanning purposes
A I R P O R T R O A D U P T O W N C A G A Y A N D E O R O C I T Y
STAMPS
2,127 (June 30, 2014) - 0 - Php 2,059,995,224 (June 30, 2014)

- 2 -
SECURITIES AND EXCHANGE COMMISSION SEC FORM 17-Q
QUARTERLY REPORT PURSUANT TO SECTION 17 OF THE SECURITIES REGULATION CODE AND SRC RULE 17(2)(b) THEREUNDER
1. For the 2nd quarter ended June 30, 2014 2. Commission Identification Number: 31168 3. BIR Tax identification No. 002-724-446-000 4. A BROWN COMPANY, INCORPORATED 5. Metro Manila, Philippines 6. Industry Classification Code: (SEC use only) 7. Xavier Estates Uptown, Airport Road, Balulang, Cagayan de Oro City 9000 8. Telephone Nos. (088) 858-8784 or (02) 638-6832 9. Former address in last report is: Rm. 3304-C, 33rd Floor West Tower, PSE Centre Ortigas Center, Pasig City (Liaison Office) 10. Securities registered pursuant to Sections 8 and 12 of the Code, or Sections 4 and 8 of
the RSA Title of each class Number of shares outstanding Common shares 1,732,865,522 Amount of debt outstanding: P2,059,995,224.00 11. Are any or all of the securities listed on a Stock Exchange? Yes, all of the common securities are listed in the Philippine Stock Exchange 12.a Yes, we have filed all reports required to be filed by Section 17 of the Code and SRC
Rule 17 thereunder or Sections 11 of the RSA and the RSA Rule 11(a)-1 thereunder, and Sections 26 and 141 of the Corporation Code of the Philippines, during the preceding 12 months (or for such shorter period the registrant was required to file such reports).
12.b Yes, we have been subject to such filing requirements for the past 90 days.

- 3 -
TABLE OF CONTENTS
Page Part I. Financial Information Item 1. Financial Statements
• Unaudited Consolidated Financial Statements Exhibit 1
- Consolidated Statement of Financial Position as of June 30, 2014 and December 31, 2013
- Consolidated Statement of Income for the Three Months Ended and Year-to-Date Ended June 30, 2014 and June 30, 2013
- Consolidated Statement of Comprehensive Income for the Three Months Ended and Year-to-Date Ended June 30, 2014 and June 30, 2013
- Consolidated Statement of Changes in Equity as of June 30, 2014, June 30, 2013 and December 31, 2013
- Consolidated Statement of Cash Flows for the Three Months Ended and Year-to-Date Ended June 30, 2014 and June 30, 2013
- Notes to Financial Statements - Aging of Receivables Exhibit 1-A - Segment Report Exhibit 1-B - Financial Soundness Indicators Exhibit 1-C - ABCI Group Chart Exhibit 1-D
Item 2. Management Discussion and Analysis of Financial Condition
And Results of Operations 4-10 Part II. Other Information Item 3. Performance Indicators 10
Signature 18
- 4 -
PART I – Financial Information Item 1. Financial Statements Please find attached herein the Unaudited Consolidated Financial Statements (as Exhibit 1) for the
Second (2nd) Quarter ending June 30, 2014. Item 2. Management’s Discussion and Analysis of Financial Condition and Results of Operations Financial Condition – Consolidated (Unaudited)
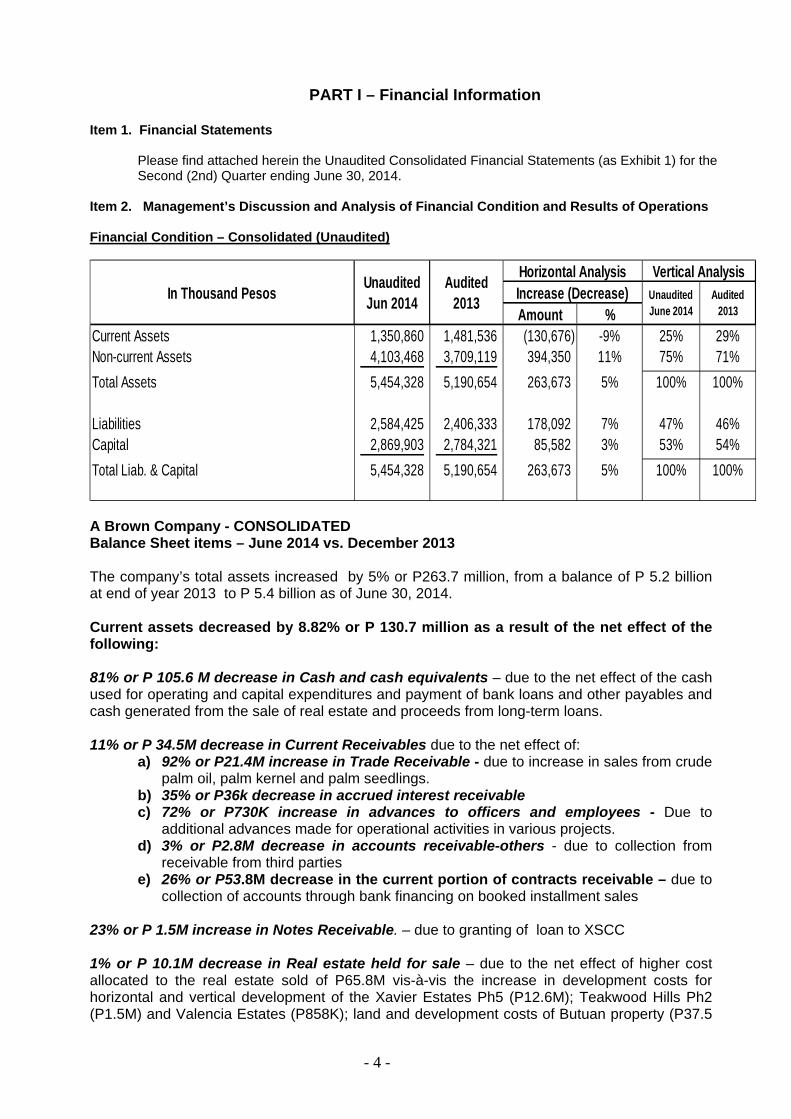
A Brown Company - CONSOLIDATED Balance Sheet items – June 2014 vs. December 2013 The company’s total assets increased by 5% or P263.7 million, from a balance of P 5.2 billion at end of year 2013 to P 5.4 billion as of June 30, 2014. Current assets decreased by 8.82% or P 130.7 million as a result of the net effect of the following: 81% or P 105.6 M decrease in Cash and cash equivalents – due to the net effect of the cash used for operating and capital expenditures and payment of bank loans and other payables and cash generated from the sale of real estate and proceeds from long-term loans. 11% or P 34.5M decrease in Current Receivables due to the net effect of:
a) 92% or P21.4M increase in Trade Receivable - due to increase in sales from crude palm oil, palm kernel and palm seedlings.
b) 35% or P36k decrease in accrued interest receivable c) 72% or P730K increase in advances to officers and employees - Due to
additional advances made for operational activities in various projects. d) 3% or P2.8M decrease in accounts receivable-others - due to collection from
receivable from third parties e) 26% or P53.8M decrease in the current portion of contracts receivable – due to
collection of accounts through bank financing on booked installment sales
23% or P 1.5M increase in Notes Receivable. – due to granting of loan to XSCC 1% or P 10.1M decrease in Real estate held for sale – due to the net effect of higher cost allocated to the real estate sold of P65.8M vis-à-vis the increase in development costs for horizontal and vertical development of the Xavier Estates Ph5 (P12.6M); Teakwood Hills Ph2 (P1.5M) and Valencia Estates (P858K); land and development costs of Butuan property (P37.5
Amount %Current Assets 1,350,860 1,481,536 (130,676) -9% 25% 29%Non-current Assets 4,103,468 3,709,119 394,350 11% 75% 71%Total Assets 5,454,328 5,190,654 263,673 5% 100% 100%
Liabilities 2,584,425 2,406,333 178,092 7% 47% 46%Capital 2,869,903 2,784,321 85,582 3% 53% 54%Total Liab. & Capital 5,454,328 5,190,654 263,673 5% 100% 100%
In Thousand Pesos Unaudited Jun 2014
Audited 2013
Horizontal Analysis Vertical AnalysisIncrease (Decrease) Unaudited
June 2014Audited
2013

- 5 -
M); Initao Coral Resort Estates (P19.6M); Mountain View Homes (P4.5M), and reclassification to land and improvements P20.2M 7% or P 18M increase in Prepayments and other current assets – due to the net effect of:
a) 14% or P8.2M increase in creditable withholding taxes; b) 2% or P 2.5M increase for deposit on land acquisition; c) 6% or P2.9M increase in prepaid expenses – due to increase in amortization of
prepaid taxes for the year, and payment of real estate sales commission for unbooked sales.
d) 15% or P4.1M increase in refundable deposit – due to deposit to service contractors. e) 2% or P 230K decrease in inventory - due to increase in sale of crude palm oil –
Inventory decrease (1.5M), and increase in aggregates inventory of P 1.3M. f) 9% or P886K increase in input VAT – related to the additions on construction in
progress in agri-business g) 40% or 366K decrease in other assets due to sale of inventory of crude palm oil
Non-current assets increased by 11% or P 394.5 million as a result of the net effect of the following: 26% or P 53.8M increase in non-current contract receivables due to additional booked installment sales. 9% or P84.2M increase in Available-for-sale investments – due to the increase in market value of investments. 5% or P11.1M increase in Investment in associates – due to the net effect of share in equity in net loss of Panay Consolidated Land Holdings Corp. (PCLHC) =( P 354k ), Palm Concepcion Power Corporation (PCPC) = (P 5.9M) and Peakpower Energy, Inc. = (P 313.7k) and additional investment of P17.4M made by Palm Thermal Consolidated Holdings Corporation (PTCHC) to PCPC. 3% or P8.9M decrease in Investment Properties - net – due to disposal of Nueva Ecija property (P 6.1M), reclassification of Antonia Center from PPE to Investment property and subsequently disposed (P3.4M) and the provision of Depreciation and impairment loss (P 2.8M). 5% or P20.5M increase in Property and Equipment - net – due to the net effect in:
a.) 21% or P3.4M decrease in land – due to reclassification of Antonia center to investment property.
b.) 2% or P1.8M increase in Building and improvements – due to additional materials for chalet construction.
c.) 2% or P 56k increase in leasehold improvements - due to renovation of credit and collection Cagayan office, Compliance office, Accounting Office and HRD Office.
d.) 2% or P 428k increase in furniture, fixtures and equipment – due to purchase of Computer server for C&C office =P160K, various office equipment and furniture for office use=P268K.
e.) 1% or P535k increase in transportation equipment – due net effect on disposal of Toyota Innova (P835K), acquisition of Toyota Fortuner P1.37M.
f.) 5% or P 146K increase in tools and other equipment – due to purchase of laboratory tools for the mill.
g.) 29% or P41.6M increase in construction in progress – as a result of the additional expenditures of the Refined, Bleached, Deodorized (RBD) refinery for the agri-business.
h.) 7% or P2.8M increase in other fixed assets – due to purchase of fuel tank, vacuum pump and 6 set plumber block, submersible pump(P483K), and generator set(P650K).
i.) and 9% or P23.8M Increase in Accumulated depreciation

- 6 -
4% or P 21.3M increase in Land and improvements - due to the net effect in: a) P 1.1M additions to land and improvements b) P 20.2 reclassification of accounts from Real estate held for sale
5% or P15.8M increase in Biological Assets – due to the additional capitalized costs for Opol plantation (P 11.8M), Kalabugao plantation (P3.6M), Tignapoloan (148K) and cassava plantation (P 358K) 2% or P666K decrease in Leasehold rights - due to amortization 28% or P192.5M increase in Investments and deposits – deposits made for future subscription to its affiliates. 8% or P 4.7M increase in deferred tax assets - due to additional tax effect or tax benefits on the available net operating loss carry-over and minimum corporate income 90% or P3.5K increase in other noncurrent asset Current liabilities increased by 14% of P108.4M as a result of the net effect of the following: 30% or P 65M increase in short term debt – due to availment of short term loan from PBCOM. 63% or P70.1M increase current of portion of long term debt due to the increase on the schedule of re-payment/amortization of principal for the next 12 months 10% or P29.5M decrease in accounts payable and accrued expenses – primarily due to the net effect of the following:
a) 10% or P18M decrease in accounts payable b) 18% or P 7M decrease in accrued expenses c) 4% or P 382K Increase in accrued interest payable d) 17% or P1.4M increase in retention payable e) 16% or P6.2M decrease in A/P-others
4% or P2.8M decrease in Deposit from Customers – due to the net effect of the higher amount of booked sales as compared to the increase in sales reservations Non-Current liabilities increased by 4% or P 69.7 million as a result of the net effect of the following: 7% or P103M increase in long-term debt – due to the additional loans availed of P263.7M less repayments of (P88.4M) less current portion of (P70.1M). 100% or P40M decrease deposit for future subscription – due to return of deposits 8% or P6.6M Increase in deferred tax liabilities – due to increase in the deferred income on sale of real estate Equity increased by 3% or P 85.6 million as a result of the net effect of the following: 58% or P84.2M increase in net unrealized gain on available for sale- due to the increase in market value of investments.

- 7 -
Results of Operations – Consolidated (Unaudited)
A Brown Company - CONSOLIDATED Results of Operations For the 2nd Quarter ending June 30, 2014 The consolidated financial statements for the quarter ending June 30, 2014 resulted to a net income after tax of P11.0 million compared to a P2.3 million net loss of last year for the same quarter due to the net effect of the following: 88% or P81.7M increase in Sales on a Quarter (QTR) and 62% or P124.4M on a Year-to-Date (YTD) due to:
a) Increase in real estate Sales by 36% or P27.9M on a QTR and 29% or P47.3M on a YTD – as 52 unitswere booked this quarter against 30 units last year of the same quarter; real estate sales in this quarter also include sale of investment properties amounting to P16.1M; On a YTD, 111 units were booked this year of 2014 against 65 units of last year
b) Increase in sales of crude palm oil by 491% or P49.7M on a QTR and 273% or P73.0M on a YTD - with the increase in quantity sold by 357% or 1,315.34 metric tons, from a volume of 368.27 metric tons for the 2nd quarter of 2013 to 1,683.61 metric tons in 2014 of the same quarter; the average selling price per metric ton increased by P7,349.39 per metric ton from P27,494.72 per metric ton last year to P34,844.11 per metric ton in this 2nd quarter of 2014. This quarter’s sales also include sale of recovered oil amounting to P1.16M for a volume of 126.7 metric tons with an average price of P9,168.68. Sales volume variance is P36,164,905, favorable and sales price variance is P19,107,946, favorable
c) Increase in Sales from palm seedlings and kernel nuts by 141% or P 2.1M on a QTR and 161% or P3.2M on a YTD – Due to the increase in quantity sold of palm kernel by 98% or 111.03MT with a corresponding increase in the average SP of 1,558.66/MT compared to last year’s volume and price for the same quarter. Sales in palm seedlings increased by 151% or 3,870 pcs with selling price of P 220 per piece.
d) Increase in sales from water services by 129% or P1.9M on a QTR and 11% or P0.7M on a YTD – The increase in the quarter’s revenue is due to the net effect of
Amount %Net Sales 174,727 93,031 81,696 88% 49% 37%Financial Income 4,978 9,317 (4,339) -47% 1% 4%Rental Income 2,343 1,885 458 24% 1% 1%Sale of aggregates 5,137 3,677 1,460 40% 1% 1%Other Income 2,340 1,248 1,092 87% 1% 0% Total Revenues 189,525 109,159 80,367 74% 53% 43%Cost of sales and services 103,365 57,315 46,051 80% 29% 23%General and Admin Expenses 47,963 50,031 (2,068) -4% 14% 20%Finance Cost 21,145 17,066 4,079 24% 6% 7%Marketing 9,112 8,025 1,087 14% 3% 3%Equity in net loss (gain) of an associate (6,052) (1,789) (4,263) 238% -2% -1%Provision for Impairment Loss 382 382 - 0% 0% 0% Total Cost and Expenses 175,915 131,030 44,885 34%Income(Loss) before Tax 13,610 (21,871) 35,482 -162%Tax expense(income) 2,606 (19,559) 22,165 -113% 1% -18%Income after Tax 11,004 (2,312) 13,316 -576% 6% -2%Unrealized loss on Available-For-Sale investments 28,168 (14,228) 42,396 -298%Comprehensive Net Income(Loss) 39,172 (16,541) 55,713 -337%
In Thousand PesosUnaudited June 30,
2014
Unaudited June 30,
2013
Horizontal Analysis Vertical AnalysisIncrease (Decrease) June
2014June 2013
- 8 -
the increase average selling price from P28.53 per cubic meter in the 2nd quarter of 2013 to P29.12 in this quarter and increase in the volume of billed water consumption from 106,631 cubic meters in 2013 to 118,631 cubic meters in 2014
e) Decrease in sales from fertilizers by 7% or P2k on a QTR and 15% or P5k on a YTD
47% or P4.3M decrease in financial income on a QTR and 49% or P10.2M on a YTD– due to the decrease in interest from money market placements of 94% or P2.8M and the decrease in interest income of 25% or P 1.5M from in house financing of real estate sale; On a YTD, interest from money market placements decreased by 94% or P7.5M and the interest from in house financing of real estate sale decreased by 22% or P2.8M 40% or P1.5M increase in Sales of aggregates on a QTR and 13% or P0.9M decrease on a YTD– due to the increase in sales volume from 5,776 cubic meter of the second quarter of 2013 to 6,355 cubic meter in the second quarter of 2014 and also due to the increase in selling price to cover the increase in extraction fee; average selling price increased from P635 per cubic meter during the second quarter of 2013 to P786 per cubic meter during the second quarter of 2014; On a YTD, the decrease is attributable to the lower quantity produced in the first quarter of 2014 24% or P0.5M increase in rental income on a QTR and 42% or P1.6M on a YTD - due to rental income from construction equipment 87% or P1.1M increase in other income on a QTR and 61% or P12.6M decrease on a YTD– due to the net effect of the following:
a) decrease in income from penalties and surcharges by 17% or P87k on a QTR and 39% or P552k on a YTD - updated payments from customers and due to the bank financing facility
b) decrease in income from forfeited deposits by 74% or P231k on a QTR and 2179% or P4.2M increase on a YTD – foreclosed accounts in the 2nd quarter of 2014 is lower compared to last year’s forfeited accounts of the same quarter; on a YTD, foreclosed accounts this year is higher as compared to last year
c) increase in other income by 87% or P1.1M on a QTR and 61% or P12.6M decrease on a YTD – due to the increase in income from sale of sludge oil, lot staking fee and driving range fee
80% or P46.1M increase in Cost of Sales on a QTR and 61% or P71.7M on a YTD due to:
a) 25% or P9.9M increase in cost of real estate on a QTR and 24% or P19.6M on a YTD – the increase is relatively due to increase in lots sold.
b) 339% or P34.0M increase in cost of production of crude palm oil on a QTR and 204% or P49.8M on a YTD – the increase is relatively due to the increase in sales of crude palm oil
c) 27% of P0.8M increase in cost of hotel operations on a QTR and 23% or P1.2M on a YTD – due to the increase in fixed costs directly attributable to hotel operations
d) 17% or P0.3M decrease in cost of aggregates on a QTR and 46% or P1.6M on a YTD – the decrease is attributable to the increase in production during the second quarter of 2014 causing the fixed cost per unit to decrease
e) 17% or P0.2M increase in the production of water services on a QTR and 32% or P0.6M on a YTD – due to the increase in the direct operating costs of water services such as labor and electricity
f) 140% or P1.5M increase in the cost of palm seedlings and FFB on a QTR and 160% or P2.2M on a YTD – related to the increase in sales of palm seedlings and kernel nuts.
g) 7% or P1k decrease in cost of fertilizers on a QTR and 15% or P3k on a YTD 4 % or P2.1M decrease in General and Administrative Expenses on a QTR and 5% or P5.2M on a YTD - due to the following net effect of:

- 9 -
a) 0.2% or P51k increase in Personnel expenses on a QTR and 7% or P2.8M decrease on a YTD – the decrease on a YTD is due to the vacant position of an officer and a manager of the parent company
b) 1% or P94k increase in Depreciation and amortization on a QTR and 2% or P0.3M decrease on a YTD – due to the net effect of various additions and the fully depreciated property and equipment items
c) 1% or P33k decrease in Taxes and Licenses on a QTR and 3% or P0.3M on a YTD
d) 9% or P0.2M increase in utilities and supplies on a QTR and 7% or P0.2M on a YTD – due to additional office supplies for the new real estate projects and additional utility expenses incurred due to additional office space occupied by parent company
e) 21% or P0.4M decrease in repairs and maintenance on a QTR and 17% or P0.7M on a YTD - due to various repairs on vehicles and heavy equipment incurred in the 2nd quarter of last year as compared this year
f) 24% or P0.2M increase in rental expense on a QTR and 13% or P0.3M on a YTD– the increase pertains to the additional office space occupied by the parent company
g) 181% or P0.2M increase in Representation and Entertainment on a QTR and 5% or P21k on a YTD – higher cost of providing comfort/convenience (e.g. meals) to the prospective clients
h) 7% or P0.25M increase in security services on a QTR and 15% or P1.0M on a YTD - due to the increase in number of security personnel assigned to real estate (Butuan, Initao and Mountain Pines projects).
i) 27% or P0.63M increase in professional fees/retainers fee on a QTR and P4% or P0.2M on a YTD – due to the various consultancy services incurred by the group this year
j) 18% or P0.4M decrease in travel and transportation on a QTR and 15% or P0.6M on a YTD – due to the various site visitation for mill and plantation operations and power group operations during the 2ndt quarter of last year
k) 49% or P0.46M decrease in directors fees on a QTR and 42% or P0.5M on a YTD – directors fee of the 2nd quarter of 2013 includes bonus
l) 207% or P 0.1M increase in training and seminars on a QTR and 90% or P0.1M on a YTD – due to the minimal trainings and seminars conducted and attended last 2nd quarter of 2013 as compared to this year
m) 49% or P0.1M decrease in subscription and dues on a QTR and 21% or P0.1M on a YTD - there were lesser subscriptions of business magazines in the 2nd quarter of 2014 as compared to 2nd quarter of 2013
n) 51% or P27k decrease in notarization on a QTR and 53% or P60k on YTD - due to various contracts, deed of sale and waiver of rights notarized in the 2nd quarter of 2013
o) 74% or P71k decrease in litigation expenses on a QTR and 4% or P4k on a YTD – litigation expenses in the 2nd quarter of 2013 include legal fees for Yulo case
p) 125% or P56k increase in unrealized foreign exchange gain (loss) on a QTR and 11% on a YTD – due to changes in dollar exchange rates
q) 88% or P11k decrease in bank charges on a QTR and 90% or P27k on a YTD - due to payment of REM annotation for UBP loan during the 2nd quarter of 2013
r) 125% or P0.4M decrease in board meeting expenses on a QTR and 46% or P0.3M on a YTD – due to the various materials and other expenses incurred related to board meetings and annual reports in the 2nd quarter of 2013
s) 58% or P1.9M decrease in miscellaneous expenses on a QTR and 28% or P1.4M on a YTD – include community relations expenses such as scholar’s tuition and other humanitarian assistance; in the 2nd quarter of 2013, the Group incurred expenses during the conduct of medical mission
24% or P 4.1M increase in Finance costs on a QTR and 23% or P7.7M on a YTD - due to additional availment of loans
- 10 -
14% or P1.1M increase in Marketing expenses on a QTR and 12% or P1.9M on a YTD – due to the increase in commission expenses in relation to the increase in booked sales and increase in various sponsorships of events for ads and promotions 238% or P4.3M increase in Equity in net gain of associates on a QTR and 449% or P5.4M increase of Equity in net loss on a YTD – due to the deconsolidation of PCPC and PCLHC which the group has a share of P6.1M gain in the 2nd quarter of 2014 and P1.8M gain in the 2nd quarter of 2014 (see Note 12); On a YTD, the Group has a share of P6.6 loss in 2014 and P1.2 loss in 2013 Top Key Performance Indicators (Consolidated Figures)
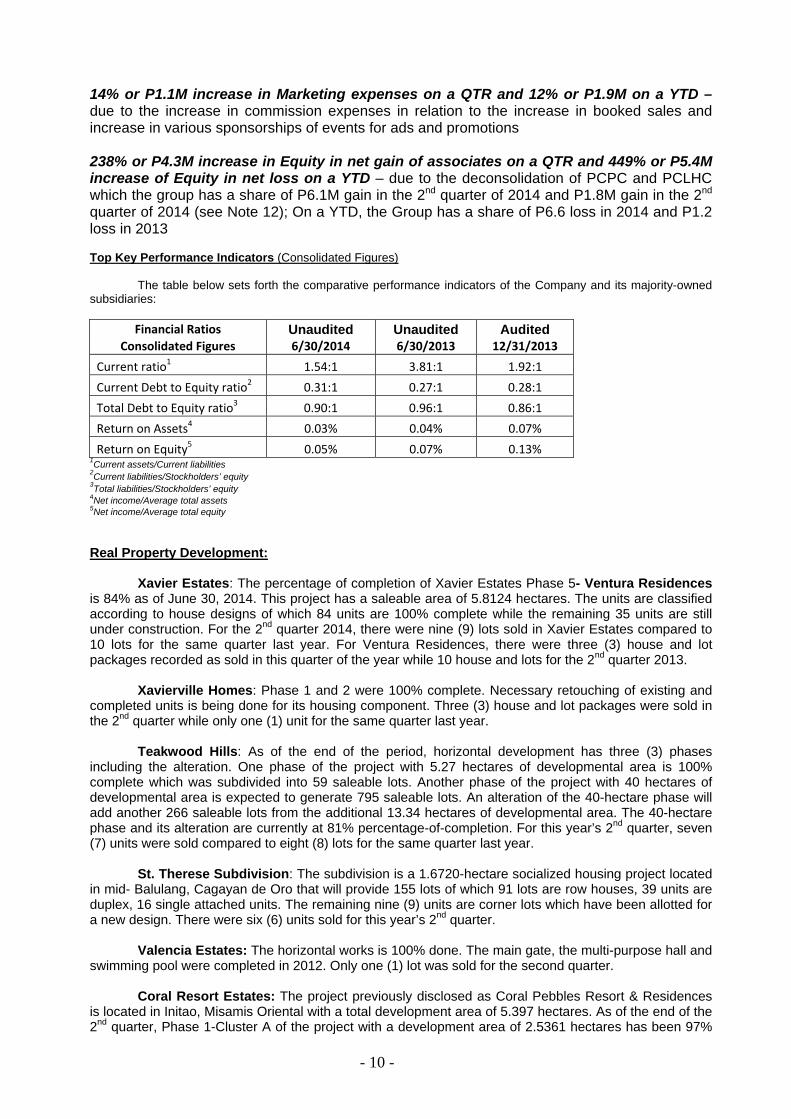
The table below sets forth the comparative performance indicators of the Company and its majority-owned subsidiaries:
Financial Ratios Unaudited Unaudited Audited
Consolidated Figures 6/30/2014 6/30/2013 12/31/2013 Current ratio1 1.54:1 3.81:1 1.92:1 Current Debt to Equity ratio2 0.31:1 0.27:1 0.28:1 Total Debt to Equity ratio3 0.90:1 0.96:1 0.86:1 Return on Assets4 0.03% 0.04% 0.07% Return on Equity5 0.05% 0.07% 0.13%
1Current assets/Current liabilities 2Current liabilities/Stockholders’ equity 3Total liabilities/Stockholders’ equity 4Net income/Average total assets 5Net income/Average total equity Real Property Development:
Xavier Estates: The percentage of completion of Xavier Estates Phase 5- Ventura Residences is 84% as of June 30, 2014. This project has a saleable area of 5.8124 hectares. The units are classified according to house designs of which 84 units are 100% complete while the remaining 35 units are still under construction. For the 2nd quarter 2014, there were nine (9) lots sold in Xavier Estates compared to 10 lots for the same quarter last year. For Ventura Residences, there were three (3) house and lot packages recorded as sold in this quarter of the year while 10 house and lots for the 2nd quarter 2013.
Xavierville Homes: Phase 1 and 2 were 100% complete. Necessary retouching of existing and
completed units is being done for its housing component. Three (3) house and lot packages were sold in the 2nd quarter while only one (1) unit for the same quarter last year.
Teakwood Hills: As of the end of the period, horizontal development has three (3) phases
including the alteration. One phase of the project with 5.27 hectares of developmental area is 100% complete which was subdivided into 59 saleable lots. Another phase of the project with 40 hectares of developmental area is expected to generate 795 saleable lots. An alteration of the 40-hectare phase will add another 266 saleable lots from the additional 13.34 hectares of developmental area. The 40-hectare phase and its alteration are currently at 81% percentage-of-completion. For this year’s 2nd quarter, seven (7) units were sold compared to eight (8) lots for the same quarter last year.
St. Therese Subdivision: The subdivision is a 1.6720-hectare socialized housing project located
in mid- Balulang, Cagayan de Oro that will provide 155 lots of which 91 lots are row houses, 39 units are duplex, 16 single attached units. The remaining nine (9) units are corner lots which have been allotted for a new design. There were six (6) units sold for this year’s 2nd quarter.
Valencia Estates: The horizontal works is 100% done. The main gate, the multi-purpose hall and swimming pool were completed in 2012. Only one (1) lot was sold for the second quarter.
Coral Resort Estates: The project previously disclosed as Coral Pebbles Resort & Residences is located in Initao, Misamis Oriental with a total development area of 5.397 hectares. As of the end of the 2nd quarter, Phase 1-Cluster A of the project with a development area of 2.5361 hectares has been 97%
- 11 -
completed. Phase 1-Cluster B is currently at 55% percentage-of-completion. There were seven (7) lots that were sold for the second quarter.
West Highlands is a golf and residential estate located in Brgy. Bonbon, Butuan City. The estate
has a total developmental area of 25.9 hectares and is 289 feet above sea level which gives lot owners a panoramic view of historic Mt. Mayapay or the cityscape. The first cluster covers 4.4 hectares with 155 saleable lots. The second cluster covers 4.9 hectares with 91 saleable lots. The project’s Phase 1 percentage-of-completion is 79%. The spillway, concrete barrier, riprap and driving range are 100% done while the spine road is 95% complete as of the end of the period. There were 14 lots sold for this quarter as compared to the one (1) lot sold for the same quarter last year.
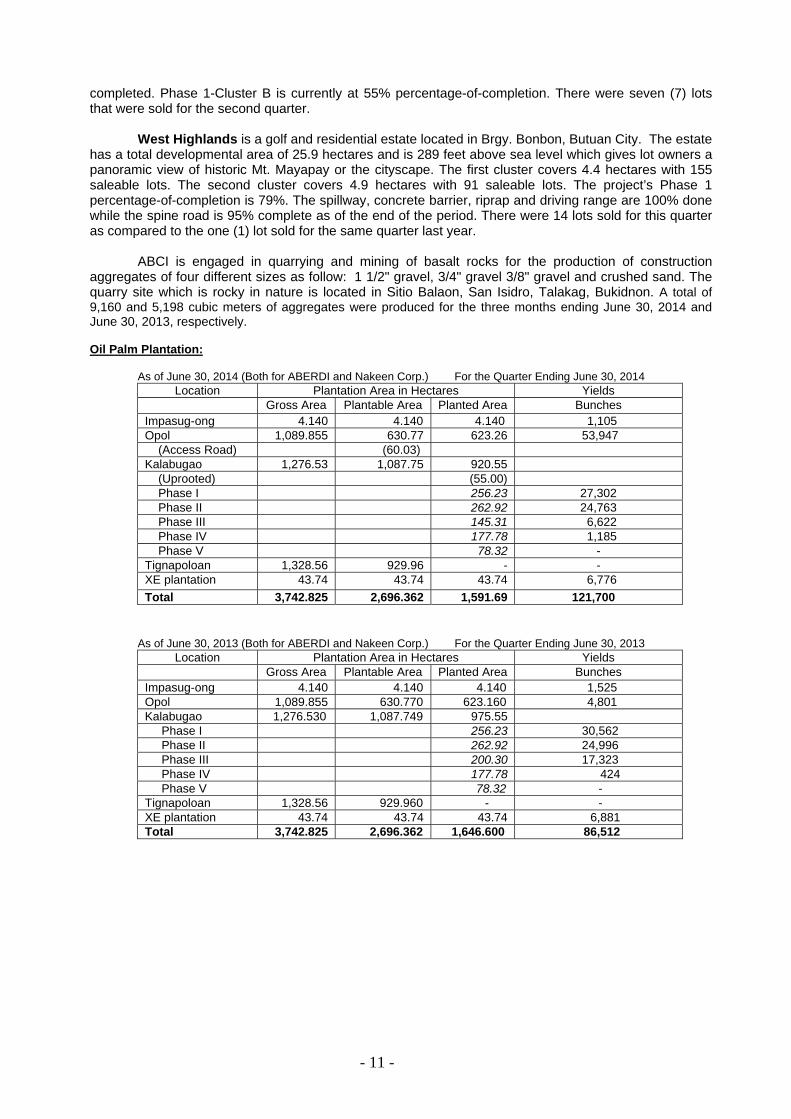
ABCI is engaged in quarrying and mining of basalt rocks for the production of construction aggregates of four different sizes as follow: 1 1/2" gravel, 3/4" gravel 3/8" gravel and crushed sand. The quarry site which is rocky in nature is located in Sitio Balaon, San Isidro, Talakag, Bukidnon. A total of 9,160 and 5,198 cubic meters of aggregates were produced for the three months ending June 30, 2014 and June 30, 2013, respectively. Oil Palm Plantation: As of June 30, 2014 (Both for ABERDI and Nakeen Corp.) For the Quarter Ending June 30, 2014
Location Plantation Area in Hectares Yields Gross Area Plantable Area Planted Area Bunches
Impasug-ong 4.140 4.140 4.140 1,105 Opol 1,089.855 630.77 623.26 53,947 (Access Road) (60.03) Kalabugao 1,276.53 1,087.75 920.55 (Uprooted) (55.00) Phase I 256.23 27,302 Phase II 262.92 24,763 Phase III 145.31 6,622 Phase IV 177.78 1,185 Phase V 78.32 - Tignapoloan 1,328.56 929.96 - - XE plantation 43.74 43.74 43.74 6,776 Total 3,742.825 2,696.362 1,591.69 121,700
As of June 30, 2013 (Both for ABERDI and Nakeen Corp.) For the Quarter Ending June 30, 2013 Location Plantation Area in Hectares Yields
Gross Area Plantable Area Planted Area Bunches Impasug-ong 4.140 4.140 4.140 1,525 Opol 1,089.855 630.770 623.160 4,801 Kalabugao 1,276.530 1,087.749 975.55 Phase I 256.23 30,562 Phase II 262.92 24,996 Phase III 200.30 17,323 Phase IV 177.78 424 Phase V 78.32 - Tignapoloan 1,328.56 929.960 - - XE plantation 43.74 43.74 43.74 6,881 Total 3,742.825 2,696.362 1,646.600 86,512

- 12 -
The following are the status of the four plantation areas as June 30, 2014:
Location Fruiting/Flowering Vegetative Impasug-ong 100% - Opol Phase Ia 54% 46% Phase Ib 30% 70% Phase IIa 40% 60% Phase IIb 100% Phase IIIa 100% Phase IVa 100% Phase Va 100% Kalabugao Phase Ia 100% - Phase Ib 70% 30% Phase IIa 100% - Phase IIb 70% 30% Phase IIIa 100% - Phase IIIb 40% 60% Phase IIIc - 100% Phase IVa 20% 80% Phase IVb - 100% XE plantation Phase I 100% Phase II 100%
Nursery Operation:
The oil palm seeds are sourced from Thailand. As of end of June 30, 2014, a total of 5,598 seedlings are available for planting covering an equivalent 41.16 hectares. Palm Oil Mill
A total of 8,921 metric tons of fresh fruit bunches derived from internal and external sources were processed and produced for the second quarter of 2014, compared to 1,927 metric tons in second quarter of 2013. This average of 2,973.62 metric tons of fresh fruit bunch per month for the three months of the second quarter of the year resulted to 1,768.38 metric tons of crude palm oil at an average oil extraction rate of 19.82% as compared to 641.97 metric tons of crude palm oil with a 20.00% oil extraction rate in same period last year. The kernels that were produced for this quarter totalled 203.37 metric tons as compared to 54.42 metric tons of last year’s second quarter. About 107.11 metric tons of effluent sludge oil was also produced for this quarter. In addition, sales generated from crude palm oil were from 1,683.61 metric tons for the quarter. There were also 224.48 metric tons of kernels and 126.70 metric tons of sludge oil sold for the quarter.
Power Generation – Coal-Fired Power Project
Palm Concepcion Power Corporation (PCPC) whose outstanding capital stock has been acquired by Palm Thermal Consolidated Holdings Corp. (PTCHC) in 2010 – is the project company that will construct and operate a 135-megawatt coal-fired power plant in Concepcion, Iloilo. This project will be a base-load plant and will make use of Circulating Fluidized Bed Combustion (CFBC) technology.
While only 135-megawatt is on a firm basis, the plant site and support units are programmed for two (2) units. The preparation for the second unit is projected to begin two to three (2 to 3) years after commissioning of the first unit if the power market in the region continues to expand as projected.
PCPC signed an agreement to tap the services of SNC - Lavalin, Inc., a global leader in the field of Engineering, Construction and Operations, as its Owner’s Engineer of the project in the early second quarter of 2012. SNC-Lavalin is providing technical advisory from the engineering stage up to the completion of the power project. Its services cover detailed engineering that will include review and evaluation of Engineering Procurement and Construction (EPC) specifications, system’s design parameters and operating features and development of conceptual layouts, among others. In early October 2012, PCPC signed a Connection Agreement with the National Grid Corporation of the Philippines (NGCP). This connection agreement paves the way and ensures dispatch of PCPC’s generation output to its customers via the facilities of system operator NGCP.
ABCI together with its subsidiaries, by then: PTCHC, PCPC and Panay Consolidated Land Holdings Corporation (PCLHC) signed a Memorandum of Agreement with AC Energy Holdings, Inc. (ACEHI) last September 2012. Towards the end of October 2012, PTCHC together with other principal stockholders of PCPC namely: ACEHI and Jin Navitas Resource, Inc. (JNRI) finalized and executed their
- 13 -
Shareholders’ Agreement to document and implement the PCPC shareholders’ respective agreements and undertakings, including the constitution of PCPC as the Project Company as well as to confirm the terms and conditions by which PCPC will be owned, managed and controlled, and by which PCPC shall implement the development and operation of its power generation project.
To implement the Shareholders Agreement, ABCI transferred all of its equity interest in PCLHC to its other wholly-owned subsidiary, PTCHC. With this, PCLHC ceased to be a direct subsidiary of ABCI. At the same time, ACEHI, JNRI and PTCHC subscribed to the remaining Nine Million shares (9 M shares) of PCLHC. As a result of these new subscriptions, PCLHC mirrored the same equity structure as that of PCPC, i.e. 30% PTCHC, 30% JNRI and 40% ACEHI as of end of 2012.
Last January 15, 2013, PCPC had its official ground breaking ceremony to launch the project. NLSC- the consortium of First Northeast Electric Power Engineering Corp. of China (NEPC), Liaoning Electric Power Survey & Design Institute and Shenyang Electric Power Design Institute Co., Ltd.- is the project’s general engineering, procurement and construction (EPC) contractor. Alstom Power of Europe, one of the world’s foremost suppliers of steam turbines and power generation equipment, will provide the steam turbine and generator for this project. SNC-Lavalin is also tapped as the Project Construction Manager.
However, as a result of ACEHI’s strategic decision to focus on its other existing power imminent in its development pipeline, PTCHC and ACEHI agreed the acquisition by PTCHC of ACEHI’s 40% interest in the 135-megawatt coal-fired power plant project in Iloilo on May 2013.
The financial closing was completed last July 2013 when lending banks: China Banking Corporation (Php 3.5B); Asian United Bank (Php 2.5B) and BDO Unibank, Inc. (Php 4B) signed the term loan financing totaling Php 10B to partially finance the Engineering, Procurement and Construction (EPC) and finance costs of the project. BDO Capital & Investment Corporation acted as the Lead Arranger and Sole Bookrunner for the term loan facilities.
Outlook for the Year and Onwards Real Estate Business: The Philippine real estate sector players believe that the industry is definitely bullish about prospects at least in a medium term, barring any major crisis. This outlook is based on the recent developments and urgent issues which the industry associations are advocating to be resolved and with the support of the policy-makers and lawmakers in charge on housing and urban development in helping the sector achieve its full potential as drivers of economic growth. A Department of Housing, better fiscal incentives and closer public-private partnership are all included in their work program.
Adding to these initiatives is the pronouncements by the business process outsourcing (BPO) sector about better business for this and incoming years which will mean more office spaces and employment are needed for its expansion. Though the country is considered as the most attractive BPO destination next to India, it has overtaken the leader in the number of new hires and in the revenue of call centers. In December 2010, the new hires in the Philippines since the start of the year totaled 15,000 as compared to the 13,800 hires of India. The Philippine revenues were placed at $ 5.5 billion against India’s $5.3 billion. Based on the IT-BPO Road Map 2011-2016 developed jointly by Everest Group and Outsource2Philippine in cooperation with the Business Processing Association of the Philippines, IT-BPO industry revenues are projected to reached $20 billion and jobs to 900,000 in five years, from the current $9 billion and the 500,000 jobs. (http://www.malaya.com.ph/12082010/busi2.html). Tourism, another booming sector also poses huge potentials considering the requirements for hotels, resorts, restaurants and related developments.
From the estimated 3.75 million units of housing need (defined as backlog plus new households) by 2010 according to the Medium-Term Philippine Development Plan (MTPDP 2004-2010), the housing gap has already reached 5.8 million units or about 800,000 units per year as embodied in the MTPDP 2011-2016 edition. This data has triggered for the mass and socialized housing to be listed by the Department of Trade and Industry as a priority industry. This housing backlog will offer an opportunity for real estate developers or dealers to be innovative and creative in filling this gap.
In support to narrow the ever increasing gap of housing need, the Housing and Urban Development Coordinating Council (HUDCC) - the highest policy making and coordination body on housing and urban development, announced that it has increased the target housing loans from 75,000 to 150,000 housing units setting aside P30 billion in new loanable funds for both buyers and developers. This is in line with the government’s thrust of facilitating access to a variety of housing options that are decent, affordable and responsive by providing incentives to low-cost mass housing developers. Investing on mass and socialized housing will enable the investors to enjoy certain incentives. Mass housing as defined by the Board of Investment (BOI) as those units sold at P400,000 up to P 3 million while the socialized housing covers units sold at less than P400,000 will provide ardor to developers to avail of income tax holidays while sourcing out financing needs from real estate finance providers at affordable interest rate. (Real Estate World, 1st Quarter 2011)
- 14 -
A considerable cause of this increasing backlog is population growth. It was reported that with the population growing at an annual rate of 2.32 percent, demand for shelter is also expected to increase. Given this, government policy makers are bent on providing more shelter assistance and pursuing strategies to encourage more private sector participation in housing production. In fact, “jumpstarting” the housing construction sector can spur economic growth and alleviate poverty by taking advantage of its multiplier effect. Housing has a high multiplier effect of 16.6 times, meaning that every 10 billion worth of housing units, it can contribute a total of Php 166 billion of economic activity for the country (MTDP 2004-2010).Thus, this positive ripple impact on the sub-sectors and allied industries that the housing provides is an evidence of the sector’s important role acting as driver of economic growth.
The issuance of the BIR Revenue Regulation No.16-2011 dated October 27, 2011 which was effective starting January 1, 2012 eliminated the burden of those prospective clients who will acquire residential property to pay the value added tax (VAT) of 12% for the gross selling price not exceeding Php 1,919,500.00 for the sale of residential lot and the gross selling price not exceeding Php 3,199,200.00 for the sale of residential house and lot. The Bureau responded the call to ease the imposition of VAT in consideration of the inflation for the last six years from the time of the passage of Republic Act 9337.
While pursuing new projects, the Company will continue to roll-out new phases in its existing project called Xavier Estates. It will expand its product offerings to build up its portfolio across a wider market. This will be complemented by intensified sales and marketing efforts to broaden market reach and tap the growing market of overseas-based Filipinos.
The management is also optimistic that sales will increase in 2014 due to steady global demand for Filipino labor. There is also an increasing demand from local professionals investing in affordable housing projects especially with the support from the local banks and PAG-IBIG for more affordable housing loan rates.
ABCI will complete the development of the property in Initao, Misamis Oriental (Coral Resort Estates) and in Butuan City (West Highlands). ABCI will venture on socialized and economic housing projects tapping the facility of PAG-IBIG as well as the banks through end-buyers’ financing.
The volume of aggregates derived from boulders is believed also to increase. Palm Oil Business:
The palm oil industry is a promising enterprise as the palm oil continuously being considered as the most important tropical vegetable oil in the global oils and fats industry, in terms of production and trade. It accounts for about 31%, ahead of soybean oil with 28% and rapeseed oil with 19%. Aside from its many food and non-food applications, it has been promoted as a feedstock for the production of biofuels in response to the depletion of world’s reserve on fossil fuels and skyrocketing price of oil in the world market. The significant growth of palm oil production, consumption and market share is also to a large extent due to its cost competitiveness and its inherent crop productivity yielding from 3.80 to 5 tons per hectare with minimum land utilization which is 9.3, 7.6 and 5.8 times higher than soybean oil, rapeseed oil and sunflower oil, respectively (Oil World 2008). Thus, it has been viewed as the cheapest, versatile and most productive oil among the three vegetable oils.
As the growing population would keep consuming more oil palm products processed to products of higher value-added, increase in oil palm production is to be expected. Domestic demand for palm oil is seen five percent annually from 1995 to 2015 according to the study by the University of Asia and the Pacific (http://ppdci.org/?p=20). Since oil palm thrives in tropical countries where agro-climactic conditions favor its growth, the Philippines has been suitable for its production with its neighboring countries, Indonesia and Malaysia as the leaders. The Philippines has 7.4 million hectares of idle land (Yosuf and Yew, 2009). In 1994, the Palm Oil Research Institute of Malaysia identified at least 300,000 hectares in eight provinces in Mindanao suitable for oil palm plantation. The Philippine Coconut Authority (PCA) and the Southern Philippines Development Authority (SPDA) have also identified some 447,000 hectares of potential areas in Mindanao and Visayas region suitable for oil palm planting. Based on the report presented during the mini-workshop on Oil Palm Planning conducted in June 2008, the Philippines has developed at least a total of more than 46,000 hectares of land for oil palm with only some 20,000 hectares of oil palm trees in year 2000. Caraga region registers as the largest area of more than 17,000 hectares or 37% of total oil palm area in the country. Major players include Filipinas Palm Oil Plantations, Inc., Agusan Plantations Inc. and Kenram Philippines Inc.
From 2003 to 2009, the area planted to oil palm increased from about 25,227 hectares to 46,608 hectares, an increase of about 85% within a 7-year period or about 14% per year. Growing at an average of 82,500 metric tons in 2000, it is projected to reach 171,700 metric tons in 2015. Along with this data, the palm oil industry players need to expand the current plantations and out grower farms to grow more by 38,934 hectares by 2015.
In 2008, although the crude palm oil production exceeded 50,000 metric tons, it was not enough to meet the local demand. Hence, the country imported about 300,000 metric tons. This volume of crude

palm oil icope withThe demmillion toconsumpin 2011 to
A
neglect inmean thaCouncil (shall forf60,000 wmember the goveplantationPhilippinedomestic Inhectares comparedUS$ 400 P27.26 b
G
there willthe lack oplantation2nd quartalmost 1,The comexpansioNakeen Cand share
AWe startetons per additionametric toStearin w Power G Inserious iobjectiveselectric ponce agaexpansiothe explo
mport translah the domestand for palmns in 2012 i
ption of vegeto 9 billion by
According to n supporting at by 2022 thMPOC), estifeit in favor would-be oil countries of
ernment of Mns resulting e governmen demands, nn the PPDCof potential
d to 625,000million whileillion in 2022
Given the cur be disparityof adequate n in Kalabugter of 2014, ,592 hectarepany is anticn program aCorp. appliedeholders.
ABERDI will ed the groun
day. Assumal purchase ons of RBD
will be produc
Generation:
n support on addressins of the ene
power and eain, governmn in investm
oration, devel
ates to an imtic demand.
m oil is expecn considerattable oil. Bas
y 2043, an inc
Source: P
Philippine Pthe palm oil
he country smated to be of the Malapalm farmethe ASEAN
Malaysia, Into significa
nt neglectednow at P6.68CI report in th
area for pl0 hectares ine the Philippi2. (http://ppdc
rrent domesty between plocal producao, Impasugabout 3,743
es were plancipating the aggregating d for an Am
soon introdund works for ming the paof CPO from oil. After fra
ced monthly.
of attracting g the count
ergy sector aexpand rural ment should
ment. It is vitalopment, utili
mmediate req(http://ppdci
cted to increation with the sed on the screase of 29
PPDCI; Thoma
Palmoil Deveindustry to e
hall import, b576,596 MTysians (thrors and direclocated withdonesia andnt reduction
d the palm o billion annuhe recent paanting palm
n Thailand. Tnes importedci.org/wp-con
tic demand aroduction anction, the mag-ong, Bukidn3 (gross areated while absigning of ato 3,000 heended Articl
uce to the mthe RBD reflm oil mill ooutside sou
actionation, 7The Refiner
more investry’s energy are to raise e
electrificatiod ensure thal to harmonization and c
- 15 -
quirement of i.org/wp-contase by 25.7 mprojected w
statistics, wo%.(PPDCI; B
as M. (POTS K
elopment Couexpand to atbased on im
T of palm oil vugh import)
ct employmehin the equatd Thailand f
n in poverty,oil industry rally. ast, the cou
m oil has onlThe neighbord US$ 225 mntent/upload
and supply cnd consumptanagement hnon in 3-5 yea) hectares bout 1,105 hagreements wectares. Duees and Plan
market Refinefinery with a operates at rce of 500 m
798 metric try is schedul
stments andrequiremen
energy capaon in the cohat power snize policies conservation
80,000 hecttent/uploads/million tons i
world populatrld populatioBasiron, 201
KL, 2012)
uncil, Inc. (Pt least 144,00
mport trends valued at USthe opportu
ent of 288,00or which arefully support, and high eresulting to
ntry with an ly 54,748 hering country million at P6.ds/2011/08/po
conditions antion which nehas targeted ears time as were alreadectares are with local co
e to the synen of Merger a
ed Bleached fractionationfull capacity
metric tons ofons of Palmed to be ope
pursuing ints especially
acity, achieveuntry. Lest tupply is suand guidelinof natural re
ares of matu/2010/04/6thn 2020 baseion growth p
on is projecte2).
PPDCI), the g00 hectares reported by
S$ 634.26 miunity of givin00 rural wor
e highly suitated the expexport genehuge palm
estimated oectares planhas exported68 billion in 2osters-oil-pal
d projected eeds to be ato develop 2targeted in 2y acquired foprepared to
ommunities iergy and taxas approved
Deodorized n machine wiy of 700 mef CPO, the re
m Olein and erational by A
ndustrializatiy the Visayae a reliable athe current gfficient to snes among cesources for
ure oil palm phnpocreport.ped on the proparallel to theed to grow fr
government’by the year the Malaysiaillion or P27.
ng high farmrkers. With t
able for oil papansion of theration. In co
oil importati
of more thannted, laggingd palm oil am2010 and to lm.pdf)
growth in incaddressed. T2,000 hectar2010. As of tfor developm
be availablen Misamis Ox efficiency, by its Boar
(RBD) palmith a capacityetric tons perefinery will p
342 metric August 2014
on, the govas and Mindand adequatgrowth momsupport the concerned aenergy proje
plantation to pdf) ojected 52.3 e increasing rom 7 billion
s continued 2017 would an Palm Oil .26 billion. It
m income to the four (4) alm farming, he palm oil ontrast, the on to meet
n 1,000,000 g behind as mounting to increase to
coming yearsTo respond tres of oil palmthe end of th
ment, of whice for plantingOriental for it
ABERDI and of Director
m oil productsy of 50 metrer month anproduce 1,14tons of Palm.
vernment is danao. The te supply of
mentum stall anticipated
agencies on ects.
s, to m he ch g. ts
nd rs
s. ic
nd 40 m

- 16 -
Government figures reveal that the year 2015 will be critical period for the Visayas Grid, where an additional capacity of 100MW will be needed to avert shortages. This forecast was derived from a projection by the Department of Energy of an annual demand growth rate of 4.55%. However, recent figures from 2001-2008 revealed a much higher demand growth rate of 6.3%.
Coal-Fired Power Project To fill the anticipated tight power supply situation in Panay and the Visayas grids by 2016 as
economic activity continues to expand in the area, a 135-megawatt coal-fired power plant in Concepcion, Iloilo is currently under construction.
Project financial closure has been completed in July 2013 while construction activities in the project site have already started on the 3rd quarter of 2013 after the Notice to Proceed was duly issued to the Engineering, Procurement and Construction (EPC) contractor. The commissioning of the plant is expected to be made by mid-2016. The plant site and support units are programmed for 2 units, since the project is to construct a 2x135MW generation power plant starting with 1 unit of 135-megawatt.The preparations for the second unit is forecasted to begin two to three years after commissioning of the first unit if the power market in the region continues to expand as projected.
Bunker-Fired Power Project
In 2013, Peakpower Energy, Inc. (PEI) was set up to address the lack of base load power in the
Mindanao electric grid for the next 2 to 3 years and in the future to allow the partner electric cooperatives to meet their demand for peaking power. The salient points of the projects are: short gestation period (from construction to commissioning), and take or pay on the capital expenditure.
Last October 2013, ABCI along with Enterprise Holdings Corporation, World Power Alliance Limited and Power Mavens Holdings Limited executed a Shareholders’ Agreement for their joint investment in PEI. The agreement outlines the collective support and commitment of the shareholders to bring Mindanao’s economic development to the next level.
Wartsila Finland Oy will be the supplier of the bunker/diesel-fired engines to be used in these power plants. These are engines with excellent fuel flexibility and efficiency. Wartsila has around 48.8GW of installed power in 4,599 power plants all over the world. In the Philippines, it has over 2,000 MW of installed capacity.
Peakpower Soccsargen Inc. (PSI) is the project company under PEI that is developing the 20.9 MW bunker/diesel-fired power plant for the South Cotabato II Electric Cooperative, Inc. (SOCOTECO2). Last March 20th 2013, PSI and SOCOTECO 2 signed a Power Purchase and Transfer Agreement (PPTA) which was followed by a ground breaking and capsule laying on the 14th of August the same year. Last July 1st 2014, PSI received their Provisional Approval Rates from the Energy Regulatory Commission (ERC). PSI is about to commence with the testing and commissioning stage of construction.
Peakpower San Francisco, Inc. (PSFI) is the project company under PEI that is developing the 5.2 MW bunker/diesel-fired power plant for the Agusan del Sur Electric Cooperative, Inc. (ASELCO). Last May 29th 2013, PSI and ASELCO signed a PPTA which was followed by a ground breaking and capsule laying on the 21th of August the same year. Last July 1st 2014, PSI received their Provisional Approval Rates from ERC. PSFI has started with the electrical-mechanical stage of construction to be followed by testing and commissioning.
PSI and PSFI are set to commence commercial operations by the last quarter of 2014.
Hydro Power Project
Hydro Link Projects Corp. (HLPC), ABCI’s wholly-owned subsidiary has secured the Hydropower Service Contract from the Department of Energy (DOE) for the development of the Carac-an river in Cantilan, Surigao del Sur. The contract gives Hydro Link exclusive rights to explore, develop and utilize the hydropower potential of the Carac-an River. The project is part of ABCI’s plans to provide much-needed additional power capacities for the electric cooperatives and the Mindanao Grid and to continue to look for other projects similar to it. As part of compliance with the service contract, the project is currently undergoing a feasibility study as part of the pre-development stage. The project has a potential of about 26 MW of capacity and is expected to generate an average of188 GWh annual energy. The output of the power station will be connected to the nearest substation of the Surigao del Sur Electric Cooperative II. Being a registered DOE project, it will enjoy all the incentives accorded to this type of project which include a seven-year income tax holiday as provided by RA 9513 (Renewable Energy Act) and issued by Board of Investments (BOI).

- 17 -
Impact of Economic/Political Uncertainties: The country has finally obtained last June 2013 its much-coveted investment grade status from
Fitch Ratings, one of the three major international credit rating agencies that evaluate the government’s credit worthiness. This is the first time that the country was bestowed with an investment grade rating since the Philippines went back to the international bond market after it declared a moratorium in 1983 due to the tightness in sourcing dollars. The investment grade is a seal of good housekeeping that tells investors that it is safe to invest in the country. Fitch upgraded the Philippines’ long term Foreign-currency issuer default rating (IDR) to “BBB-“ from “BB+” and the long-term local currency IDR to “BBB” from “BBB” with stable outlook. This upgrade means a dramatic strengthening in the ability of the government to meet its foreign and local obligations. It also means a lowering of the borrowing cost of the country from both local and foreign creditors. This could, likewise, result in an improvement in the attractiveness of the country in the eyes of the foreign investors that could further pick-up economic domestic activities.
The Company’s performance will continue to hinge on the overall economic performance of the country. Interest rate movements may affect the performance of the real estate industry, including the Company. Good governance will definitely lead to better economy and better business environment and vice-versa. Political stability encourages people to work better and spend more and the investors to infuse funds for additional investment. Plus, given the other positive economic indicators like recovery in exports, sustained rise in remittances, and growing liquidity in the domestic financial market, the monetary officials agree that the government’s projected growth targets is attainable.
We believe that the Company’s available cash, including cash flow from operations and drawings from existing and anticipated credit facilities, will provide sufficient liquidity to fund our projected operating, investment, capital expenditures and debt service requirements for the next twelve months. We have also implemented a number of initiatives under our liability management program to meet our debt service requirements in the short and medium term.
The Company does not expect to conduct any product research and development in the foreseeable future. No extraordinary purchase or sale of plant and equipment are expected beyond those in the regular course of the Company’s operations. The Brown Group of Companies foresees significant change in the number of employees at around 20 new employees (for 2014) if its proposed projects will push through. Hiring of employees will continue in the regular course of business. There are no events that will trigger direct or contingent financial obligation that is material to the company, including any default or acceleration of an obligation nor material off-balance sheet transactions, arrangements, obligations (including contingent obligations), and other relationships of the company with unconsolidated entities or other persons created during the reporting period. Material Event/s and Uncertainties:
The Company has no other events to report on the following: a) Any known trends, demands, commitments, events or uncertainties that will have a material
impact on its liquidity. b) Any material commitments for capital expenditures. c) Any known trends, events or uncertainties that have had or that are reasonably expected to
have a material favorable or unfavorable impact on net sales/ revenues/ income from continuing operations.
d) Any significant elements of income or loss that did not arise from the issuer’s continuing operations.
e) Any seasonal aspects that had a material effect on the financial condition or results of operations.
f) Any event/s that will trigger direct or contingent financial obligation that is material to the company, including any default or acceleration of an obligation.
g) Any material off-balance sheet transactions, arrangements, obligations (including contingent obligations), and other relationships of the company with unconsolidated entities or other persons created during the reporting period.
The Company has no other information that needs to be disclosed other than disclosures made under SEC Form 17-C (if any).

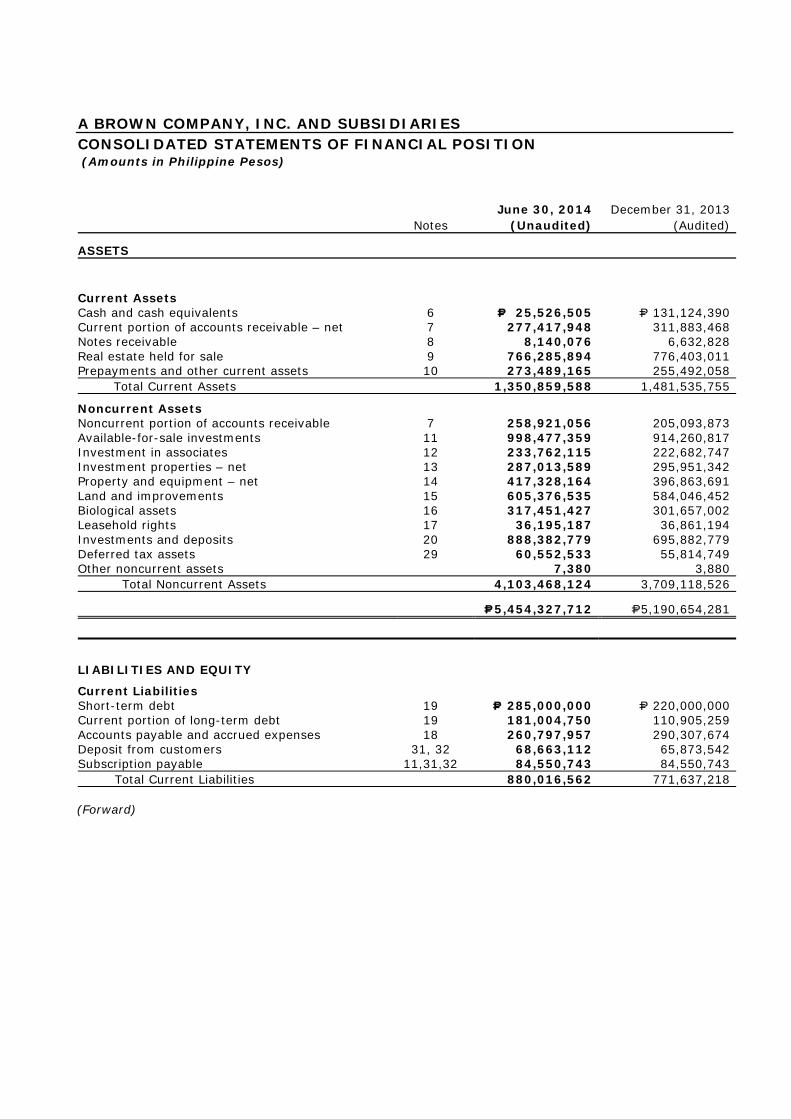
A BROWN COMPANY, INC. AND SUBSIDIARIES CONSOLIDATED STATEMENTS OF FINANCIAL POSITION (Amounts in Philippine Pesos)
Notes June 30, 2014
(Unaudited) December 31, 2013
(Audited)
ASSETS
Current Assets Cash and cash equivalents 6 P= 25,526,505 P= 131,124,390 Current portion of accounts receivable – net 7 277,417,948 311,883,468 Notes receivable 8 8,140,076 6,632,828 Real estate held for sale 9 766,285,894 776,403,011 Prepayments and other current assets 10 273,489,165 255,492,058
Total Current Assets 1,350,859,588 1,481,535,755
Noncurrent Assets Noncurrent portion of accounts receivable 7 258,921,056 205,093,873 Available-for-sale investments 11 998,477,359 914,260,817 Investment in associates 12 233,762,115 222,682,747 Investment properties – net 13 287,013,589 295,951,342 Property and equipment – net 14 417,328,164 396,863,691 Land and improvements 15 605,376,535 584,046,452 Biological assets 16 317,451,427 301,657,002 Leasehold rights 17 36,195,187 36,861,194 Investments and deposits 20 888,382,779 695,882,779 Deferred tax assets 29 60,552,533 55,814,749 Other noncurrent assets 7,380 3,880
Total Noncurrent Assets 4,103,468,124 3,709,118,526
P=5,454,327,712 P=5,190,654,281
LIABILITIES AND EQUITY
Current Liabilities Short-term debt 19 P= 285,000,000 P= 220,000,000 Current portion of long-term debt 19 181,004,750 110,905,259 Accounts payable and accrued expenses 18 260,797,957 290,307,674 Deposit from customers 31, 32 68,663,112 65,873,542 Subscription payable 11,31,32 84,550,743 84,550,743
Total Current Liabilities 880,016,562 771,637,218
(Forward)
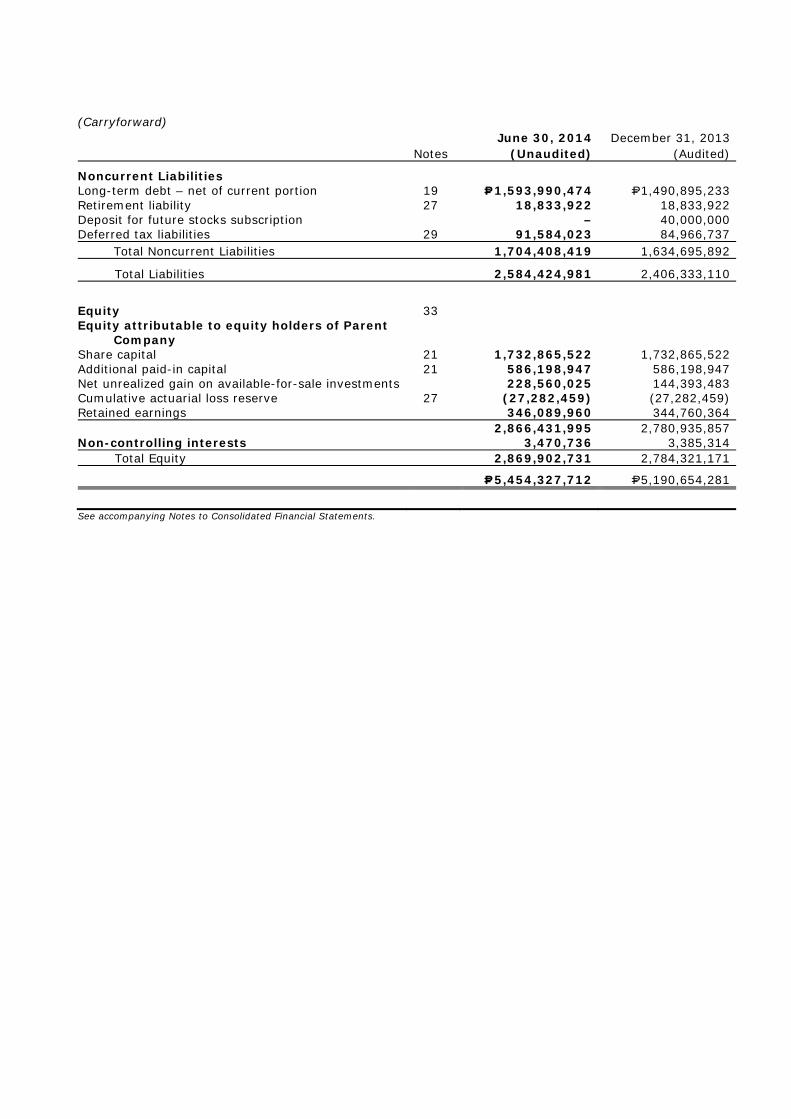
(Carryforward)
Notes June 30, 2014
(Unaudited) December 31, 2013
(Audited)
Noncurrent Liabilities Long-term debt – net of current portion 19 P=1,593,990,474 P=1,490,895,233 Retirement liability 27 18,833,922 18,833,922 Deposit for future stocks subscription – 40,000,000 Deferred tax liabilities 29 91,584,023 84,966,737
Total Noncurrent Liabilities 1,704,408,419 1,634,695,892
Total Liabilities 2,584,424,981 2,406,333,110
Equity 33 Equity attributable to equity holders of Parent
Company Share capital 21 1,732,865,522 1,732,865,522 Additional paid-in capital 21 586,198,947 586,198,947 Net unrealized gain on available-for-sale investments 228,560,025 144,393,483 Cumulative actuarial loss reserve 27 (27,282,459) (27,282,459) Retained earnings 346,089,960 344,760,364 2,866,431,995 2,780,935,857 Non-controlling interests 3,470,736 3,385,314
Total Equity 2,869,902,731 2,784,321,171
P=5,454,327,712 P=5,190,654,281
See accompanying Notes to Consolidated Financial Statements.

A BROWN COMPANY, INC. AND SUBSIDIARIES CONSOLIDATED STATEMENTS OF INCOME (Amounts in Philippine Pesos)
For the quarter ending
June 30 Year-to-Date
Note 2014
(Unaudited)2013
(Unaudited)6/30/2014
(Unaudited) 6/30/2013
(Unaudited)
REVENUES Sales 22 P=174,727,373 P= 93,031,102 P=324,116,641 P=199,708,644Financial income 23 4,978,312 9,317,190 10,499,447 20,734,139Sales of aggregates 5,136,857 3,677,062 6,107,795 7,010,979Rental income 20, 28 2,342,956 1,885,446 5,358,237 3,762,975Others 24 2,339,956 1,247,985 8,177,985 20,824,890 189,525,454 109,158,785 354,260,105 252,041,627
COST AND EXPENSES Cost of sales and services 25 103,365,419 57,314,889 189,810,897 118,072,710General and administrative 26 47,962,945 50,031,178 92,648,765 97,875,452Finance costs 19 21,144,579 17,065,885 40,644,676 32,993,580Marketing 9,111,611 8,024,969 18,095,386 16,224,062Equity in net loss (gain) of an associate 12 (6,051,741) (1,788,906) 6,613,972 1,205,456Provision for impairment loss 13 382,150 382,150 764,300 764,300 175,914,963 131,030,165 348,577,996 267,135,560
INCOME (LOSS) BEFORE INCOME TAX 13,610,491 (21,871,380) 5,682,109 (15,093,933)
INCOME TAX EXPENSE (BENEFIT) 29 Current 2,466,619 2,830,542 3,581,083 14,006,852Deferred 139,777 (22,389,526) 686,008 (31,510,621) 2,606,396 (19,558,984) 4,267,091 (17,503,769)
NET INCOME (LOSS) P=11,004,095 (P=2,312,396) P=1,415,018 P=2,409,836
NET INCOME (LOSS) ATTRIBUTABLE TO: Equity holders of the Parent Company P=10,961,714 (P=1,649,730) P=1,329,596 P=3,039,887Non-controlling interests 42,381 (662,666) 85,422 (630,051)
P=11,004,095 (P=2,312,396) P=1,415,018 P=2,409,836 BASIC AND DILUTED EARNINGS
(LOSS) PER SHARE 30
Attributable to:
Equity holders of the Parent Company P= 0.00633 (P=0.00119) P= 0.00077 P=0.00219
See accompanying Notes to Consolidated Financial Statements.

A BROWN COMPANY, INC. AND SUBSIDIARIES CONSOLIDATED STATEMENTS OF COMPREHENSIVE INCOME (Amounts in Philippine Pesos)
For the quarter ending June 30 Year-to-Date
Note
2014 (Unaudited)
2013 (Unaudited)
6/30/2014 (Unaudited)
6/30/2013 (Unaudited)
NET INCOME (LOSS) P=11,004,095 (P= 2,312,396) P= 1,415,018 P= 2,409,836
OTHER COMPREHENSIVE INCOME Unrealized gain (loss) on available-for-
sale investments 11 28,168,105 (14,228,319) 84,166,542 10,854,921
COMPREHENSIVE NET INCOME (LOSS) P=39,172,200 (P=16,540,715) P=85,581,560 P=13,264,757
Attributable to: Equity holders of the Parent Company P=39,129,819 (P=15,878,049) P=85,496,138 P=13,894,808 Non-controlling interests 42,381 (662,666) 85,422 (630,051)
P=39,172,200 (P=16,540,715) P=85,581,560 P=13,264,757
See accompanying Notes to Consolidated Financial Statements.

- 23 -
A BROWN COMPANY, INC. AND SUBSIDIARIES CONSOLIDATED STATEMENTS OF CHANGES IN EQUITY (Amounts in Philippine Pesos)
Notes
As of 06/30/2014 (Unaudited)
As of 06/30/2013 (Unaudited)
As of12/31/2013
(Audited)
EQUITY ATTRIBUTABLE TO EQUITY HOLDERS OF PARENT COMPANY
SHARE CAPITAL - P=1 par value Authorized – 2,000,000,000 shares in
2014 and 2013, 1,620,000,000 shares in 2012
Subscribed – 1,732,865,522 shares in 2014 and 2013, 1,386,293,229 shares in 2012 21
Balance at beginning of year P=1,732,865,522 P=1,386,293,229 P=1,386,293,229Issuance during the period/year – – 346,572,293Balance at end of year 1,732,865,522 1,386,293,229 1,732,865,522 STOCK DIVIDENDS DISTRIBUTABLE 34 – 346,573,307 – ADDITIONAL PAID-IN CAPITAL 21 586,198,947 586,198,947 586,198,947 NET UNREALIZED GAIN ON
AVAILABLE-FOR-SALE INVESTMENTS
Balance at beginning of year 144,393,483 146,894,874 146,894,874Net unrealized gain (loss) during the
period/year 11 84,166,542 10,854,921 (2,501,391)Balance at end of period/year 228,560,025 157,749,795 144,393,483
CUMULATIVE ACTUARIAL LOSS
RESERVE 27 Balance at beginning of year as previously
reported (27,282,459) – – Adjustments – – (24,206,991)Balance at beginning of year as restated (27,282,459) – (24,206,991) Actuarial loss as previously reported – – (3,075,468)Adjustments – – –Actuarial loss as restated – – (3,075,468) Balance at end of period/year (27,282,459) – (27,282,459) (Forward)

- 24 -
(Carryforward)
As of 06/30/2014 (Unaudited)
As of 06/30/2013 (Unaudited)
As of 12/31/2013
(Audited) RETAINED EARNINGS Balance at beginning of year as previously
reported P= 344,760,364 P= 685,835,631 P= 685,835,631 Adjustments – – 1,941,382 Balance at beginning of year as restated 344,760,364 685,835,631 687,777,013 Stock dividends declared and distributed – – (346,572,293) Dividend declaration – (346,573,307) – Increase in retained earnings due to
deconsolidated subsidiaries – 4,526,951 – Net income during the period/year 1,329,596 3,039,887 3,555,644 Balance at end of period/year 346,089,960 346,829,162 344,760,364 Total Equity Attributable to Equity Holders of
Parent Company P=2,866,431,995 P=2,823,644,440 P=2,780,935,857 NON-CONTROLLING INTERESTS Balance at beginning of year 3,385,314 2,952,530 2,952,530 Net income (loss) during the period/year 85,422 (630,051) 432,784 Increase/(Decrease) in noncontrolling interests due to re/(de)consolidated subsidiaries 642,764,608 Balance at end of period/year 3,470,736 645,087,087 3,385,314 P=2,869,902,731 P=3,468,731,527 P=2,784,321,171 See accompanying Notes to Consolidated Financial Statements
- 25 -
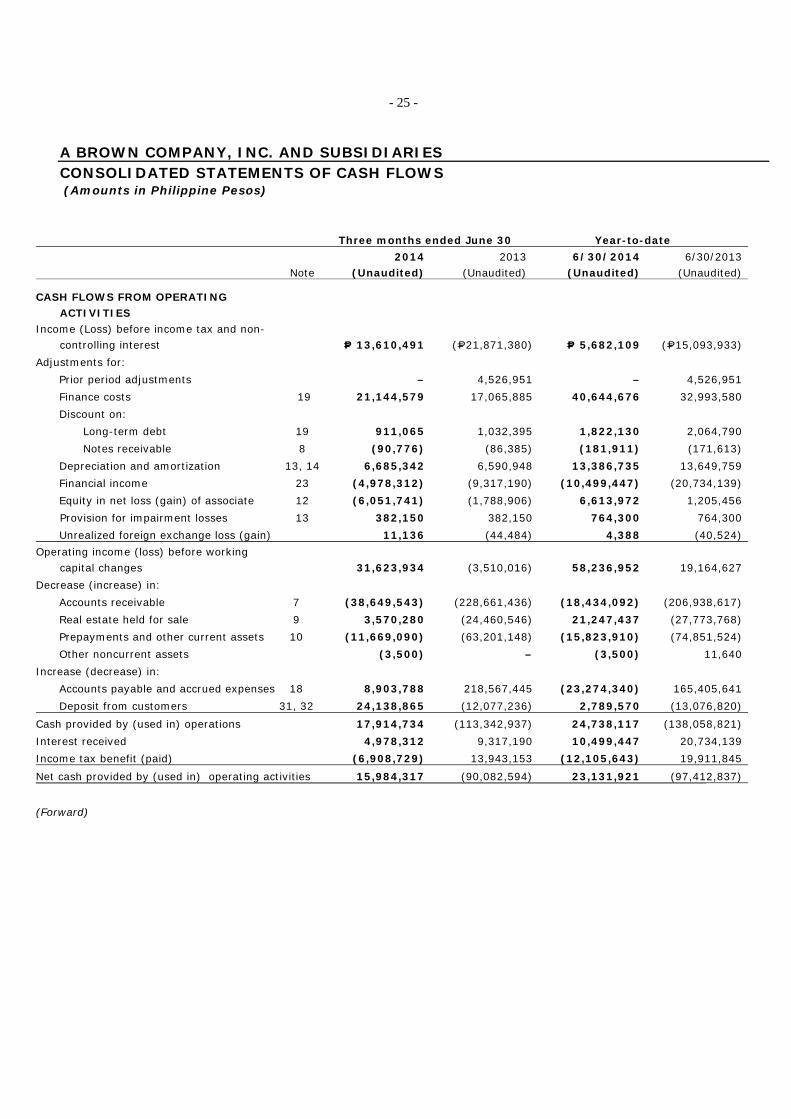
A BROWN COMPANY, INC. AND SUBSIDIARIES CONSOLIDATED STATEMENTS OF CASH FLOWS (Amounts in Philippine Pesos)
Three months ended June 30 Year-to-date
Note 2014
(Unaudited)2013
(Unaudited) 6/30/2014
(Unaudited) 6/30/2013
(Unaudited)
CASH FLOWS FROM OPERATING ACTIVITIES
Income (Loss) before income tax and non-controlling interest P= 13,610,491 (P=21,871,380) P= 5,682,109 (P=15,093,933)
Adjustments for: Prior period adjustments – 4,526,951 – 4,526,951 Finance costs 19 21,144,579 17,065,885 40,644,676 32,993,580 Discount on:
Long-term debt 19 911,065 1,032,395 1,822,130 2,064,790 Notes receivable 8 (90,776) (86,385) (181,911) (171,613)
Depreciation and amortization 13, 14 6,685,342 6,590,948 13,386,735 13,649,759 Financial income 23 (4,978,312) (9,317,190) (10,499,447) (20,734,139) Equity in net loss (gain) of associate 12 (6,051,741) (1,788,906) 6,613,972 1,205,456 Provision for impairment losses 13 382,150 382,150 764,300 764,300 Unrealized foreign exchange loss (gain) 11,136 (44,484) 4,388 (40,524)
Operating income (loss) before working capital changes 31,623,934 (3,510,016) 58,236,952 19,164,627
Decrease (increase) in: Accounts receivable 7 (38,649,543) (228,661,436) (18,434,092) (206,938,617) Real estate held for sale 9 3,570,280 (24,460,546) 21,247,437 (27,773,768) Prepayments and other current assets 10 (11,669,090) (63,201,148) (15,823,910) (74,851,524) Other noncurrent assets (3,500) – (3,500) 11,640
Increase (decrease) in: Accounts payable and accrued expenses 18 8,903,788 218,567,445 (23,274,340) 165,405,641 Deposit from customers 31, 32 24,138,865 (12,077,236) 2,789,570 (13,076,820)
Cash provided by (used in) operations 17,914,734 (113,342,937) 24,738,117 (138,058,821) Interest received 4,978,312 9,317,190 10,499,447 20,734,139 Income tax benefit (paid) (6,908,729) 13,943,153 (12,105,643) 19,911,845 Net cash provided by (used in) operating activities 15,984,317 (90,082,594) 23,131,921 (97,412,837)
(Forward)

- 26 -
(Carryforward)
Three months ended
June 30 Year-to-date
Note 2014
(Unaudited)2013
(Unaudited) 6/30/2014
(Unaudited)6/30/2013
(Unaudited)
CASH FLOWS FROM INVESTING ACTIVITIES
Additions to: Property and equipment 14 (P= 34,640,352) (P=229,724,318) (P= 49,721,979) (P=253,519,240) Investment properties – (64,601,005) – (64,601,005) Land and improvements 15 (500,083) (7,938,691) (1,146,662) (12,655,159) Land rights 17 – – – (75,030)
Investments and deposits 20 – 94,640,000 (192,500,000) 76,785,626 Increase in:
Biological assets 16 (5,820,177) (22,110,104) (15,128,418) (35,668,826) Available-for-sale investments – (789,600) (50,000) (789,600) Goodwill 2 – (44,367,290) (44,367,290)
Loan to a related party 8 644,663 404,600 (1,325,337) (595,400) Proceeds from disposal of investment property 13 – – 6,105,485 – Proceeds from disposal of property and
equipment 14 – 1,300 – 114,820 Increase (Decrease) in Investment in an
associate 12 (17,393,341) 24,648,179 (17,693,341) 24,627,424
Net cash used in investing activities (57,709,290) (249,836,929) (271,460,252) (310,743,680)
CASH FLOWS FROM FINANCING ACTIVITIES Payments of:
Finance costs 19 (P=29,708,314) (P=23,912,960) (P=53,637,768) (P=47,879,479)Long-term debt 19 (69,005,279) (4,320,000) (97,375,398) (10,884,816)Cash dividend (3,447) – (447)
Proceeds from long term debt Short-term debt 70,000,000 – 70,000,000 20,000,000Long-term debt – – 263,748,000 –
Deposits received for future stock subscription – 869,484,000 – 869,484,000Return of deposits for future stock subscription – – (40,000,000) –Increase in noncontrolling interests of subsidiaries – 642,764,608 – 642,764,608Net cash provided by (used in) financing
activities (28,713,593) 1,484,012,201 142,734,834 1,473,483,866EFFECT OF EXCHANGE RATE CHANGES ON CASH AND CASH EQUIVALENTS 6 (11,136) 44,484 (4,388) 40,524NET INCREASE/ (DECREASE) IN CASH AND CASH EQUIVALENTS (70,449,702) 1,144,137,162 (105,597,885) 1,065,364,873
CASH AND CASH EQUIVALENTS AT BEGINNING OF PERIOD/YEAR 95,976,207 916,487,239 131,124,390 995,259,528
CASH AND CASH EQUIVALENTS AT END OF PERIOD/YEAR
6 P= 25,526,505 P=2,060,624,401 P= 25,526,505 P=2,060,624,401
See accompanying Notes to Consolidated Financial Statements.
- 27 -
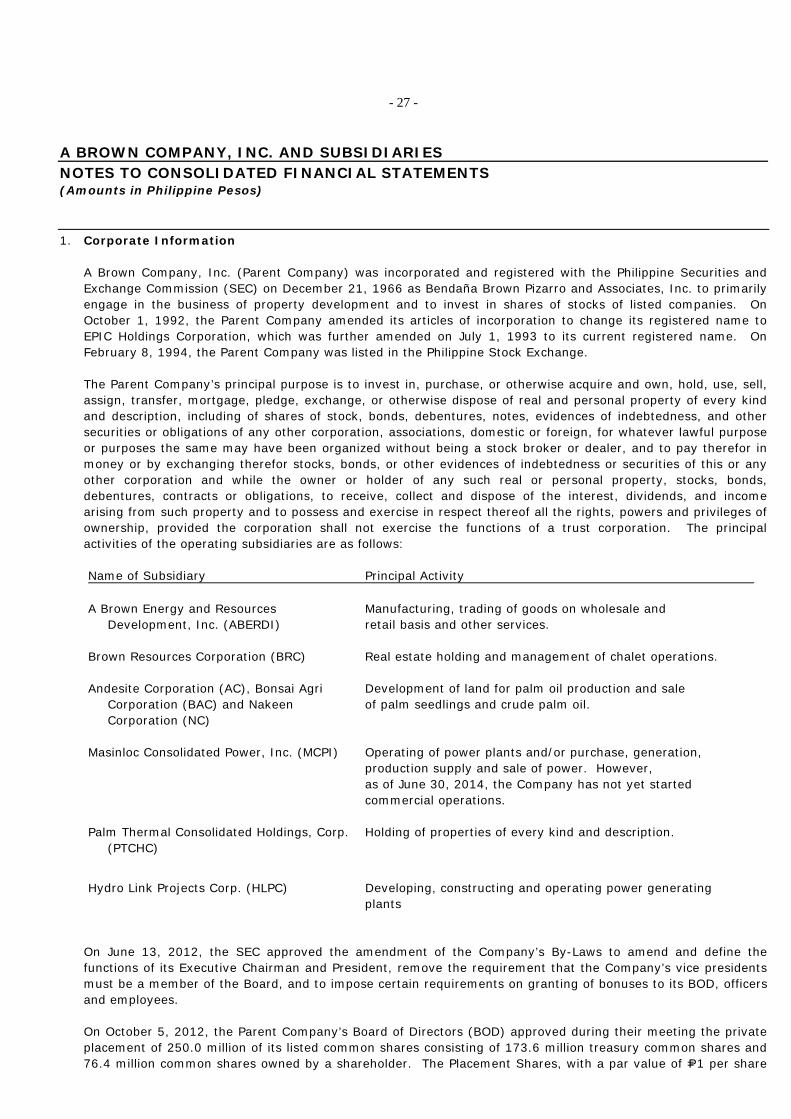
A BROWN COMPANY, INC. AND SUBSIDIARIES NOTES TO CONSOLIDATED FINANCIAL STATEMENTS (Amounts in Philippine Pesos) 1. Corporate Information
A Brown Company, Inc. (Parent Company) was incorporated and registered with the Philippine Securities and Exchange Commission (SEC) on December 21, 1966 as Bendaña Brown Pizarro and Associates, Inc. to primarily engage in the business of property development and to invest in shares of stocks of listed companies. On October 1, 1992, the Parent Company amended its articles of incorporation to change its registered name to EPIC Holdings Corporation, which was further amended on July 1, 1993 to its current registered name. On February 8, 1994, the Parent Company was listed in the Philippine Stock Exchange. The Parent Company’s principal purpose is to invest in, purchase, or otherwise acquire and own, hold, use, sell, assign, transfer, mortgage, pledge, exchange, or otherwise dispose of real and personal property of every kind and description, including of shares of stock, bonds, debentures, notes, evidences of indebtedness, and other securities or obligations of any other corporation, associations, domestic or foreign, for whatever lawful purpose or purposes the same may have been organized without being a stock broker or dealer, and to pay therefor in money or by exchanging therefor stocks, bonds, or other evidences of indebtedness or securities of this or any other corporation and while the owner or holder of any such real or personal property, stocks, bonds, debentures, contracts or obligations, to receive, collect and dispose of the interest, dividends, and income arising from such property and to possess and exercise in respect thereof all the rights, powers and privileges of ownership, provided the corporation shall not exercise the functions of a trust corporation. The principal activities of the operating subsidiaries are as follows: Name of Subsidiary Principal Activity A Brown Energy and Resources
Development, Inc. (ABERDI) Manufacturing, trading of goods on wholesale and retail basis and other services.
Brown Resources Corporation (BRC) Real estate holding and management of chalet operations. Andesite Corporation (AC), Bonsai Agri
Corporation (BAC) and Nakeen Corporation (NC)
Development of land for palm oil production and sale of palm seedlings and crude palm oil.
Masinloc Consolidated Power, Inc. (MCPI) Operating of power plants and/or purchase, generation,
production supply and sale of power. However, as of June 30, 2014, the Company has not yet started commercial operations.
Palm Thermal Consolidated Holdings, Corp.
(PTCHC) Holding of properties of every kind and description.
Hydro Link Projects Corp. (HLPC) Developing, constructing and operating power generating plants
On June 13, 2012, the SEC approved the amendment of the Company’s By-Laws to amend and define the functions of its Executive Chairman and President, remove the requirement that the Company’s vice presidents must be a member of the Board, and to impose certain requirements on granting of bonuses to its BOD, officers and employees. On October 5, 2012, the Parent Company’s Board of Directors (BOD) approved during their meeting the private placement of 250.0 million of its listed common shares consisting of 173.6 million treasury common shares and 76.4 million common shares owned by a shareholder. The Placement Shares, with a par value of P=1 per share

- 28 -
was sold at a price of P=2.89 per share and crossed in the Exchange on October 8, 2012. The BOD likewise approved the issuance of an equal number of shares of the Parent Company at an issue price equal to the net proceeds per share in favor of the lending shareholder. The shares will be issued out of the increase in the Parent Company’s authorized capital stock from P=1.32 billion divided into 1.32 billion shares with a par value of P=1 to P=1.62 billion divided into 1.62 billion shares with par value of P=1. On December 28, 2012, the SEC approved the Company’s application for increase in authorized capital stock. Subsequently, the 76.4 million common shares were issued. On June 7, 2013 the Parent Company’s Board of Directors (BOD) unanimously approved the proposed 25% stock dividend declaration or equivalent to 346.6 million of the Parent Company’s outstanding shares. The shares will be distributed to the stockholders record as of September 12, 2013 and shall be issued out of the increase in the Parent Company’s authorized capital stock from P=1.62 billion divided into 1.62 billion shares with par value of P=1 to P=2.0 billion divided into 2 billion shares with par value of P=1. On August 16, 2013, the SEC approved the Parent Company’s application for increase in authorized capital stock. Subsequently, 346.6 million shares were issued. The Parent Company’s registered office and principal place of business is at Xavier Estates, Upper Balulang, Cagayan de Oro City, Philippines (see Note 36).
2. Basis of Preparation
The consolidated financial statements of the Group have been prepared using the historical cost basis, except for available-for-sale investments which are measured at fair values. These consolidated financial statements are presented in Philippine Peso, which is the Group’s functional and reporting currency. All values are rounded to the nearest peso, except when otherwise indicated. Statement of Compliance The accompanying consolidated financial statements of the Group have been prepared in compliance with Philippine Financial Reporting Standards (PFRS). PFRS includes statements named PFRS, Philippine Accounting Standards (PAS) and International Financial Reporting Interpretations Committee (IFRIC) interpretations issued by the Financial Reporting Standards Council. Principles of Consolidation The consolidated unaudited financial statements consist of the financial statements of the Parent Company and its subsidiaries as of end of the first three quarters of each year. This report covers the period ending June 30, 2014. The consolidated financial statements of the subsidiaries are prepared for the same reporting year as the Parent Company, using consistent accounting policies. Subsidiaries are consolidated from the date on which control is transferred to the Group and cease to be consolidated from the date on which control is transferred out of the Group. Consolidated financial statements are prepared using uniform accounting policies for like transactions and other events in similar circumstances. Intercompany balances and transactions, including intercompany profits and unrealized profits and losses are eliminated. Noncontrolling interests represent interests in certain subsidiaries not held by the Parent Company and are presented separately in the consolidated statements of income, consolidated statements of comprehensive income and consolidated statements of changes in equity and within equity in the consolidated statements of financial position, separately from equity attributable to the Parent Company.
- 29 -
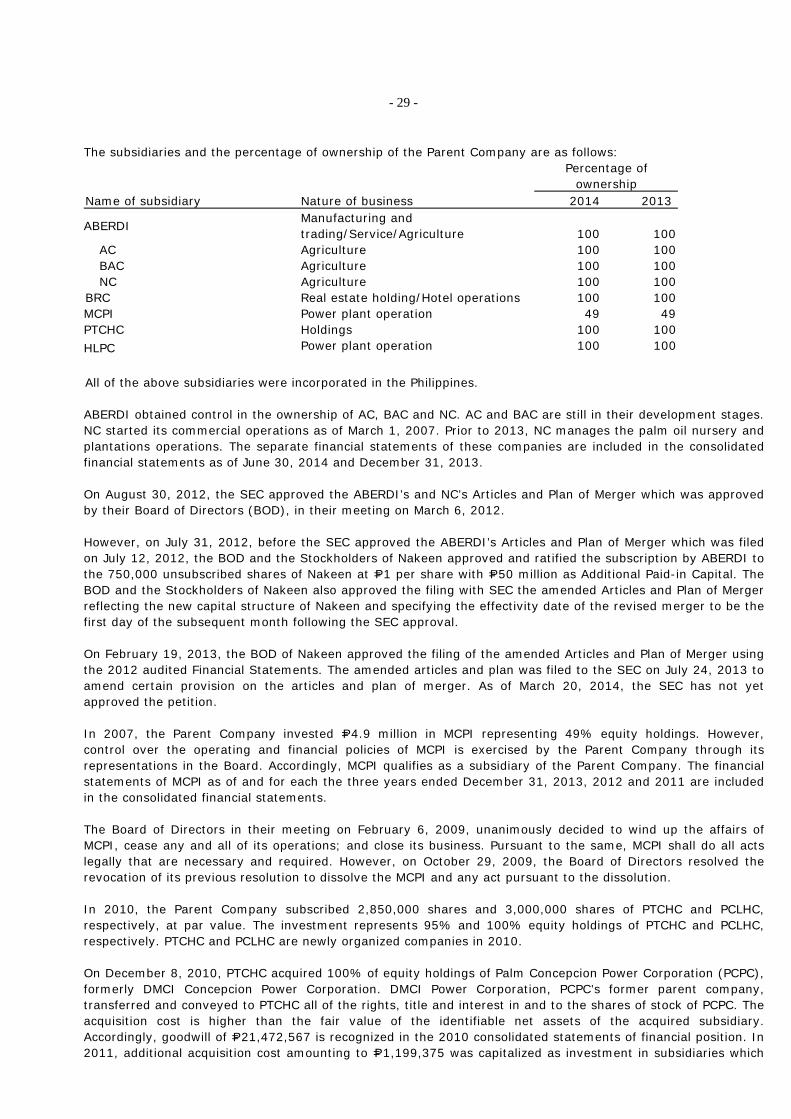
The subsidiaries and the percentage of ownership of the Parent Company are as follows:
Percentage of ownership
Name of subsidiary Nature of business 2014 2013
ABERDI Manufacturing and trading/Service/Agriculture
100
100
AC Agriculture 100 100 BAC Agriculture 100 100 NC Agriculture 100 100
BRC Real estate holding/Hotel operations 100 100 MCPI Power plant operation 49 49 PTCHC Holdings 100 100 HLPC Power plant operation 100 100
All of the above subsidiaries were incorporated in the Philippines.
ABERDI obtained control in the ownership of AC, BAC and NC. AC and BAC are still in their development stages. NC started its commercial operations as of March 1, 2007. Prior to 2013, NC manages the palm oil nursery and plantations operations. The separate financial statements of these companies are included in the consolidated financial statements as of June 30, 2014 and December 31, 2013. On August 30, 2012, the SEC approved the ABERDI’s and NC’s Articles and Plan of Merger which was approved by their Board of Directors (BOD), in their meeting on March 6, 2012. However, on July 31, 2012, before the SEC approved the ABERDI’s Articles and Plan of Merger which was filed on July 12, 2012, the BOD and the Stockholders of Nakeen approved and ratified the subscription by ABERDI to the 750,000 unsubscribed shares of Nakeen at P=1 per share with P=50 million as Additional Paid-in Capital. The BOD and the Stockholders of Nakeen also approved the filing with SEC the amended Articles and Plan of Merger reflecting the new capital structure of Nakeen and specifying the effectivity date of the revised merger to be the first day of the subsequent month following the SEC approval. On February 19, 2013, the BOD of Nakeen approved the filing of the amended Articles and Plan of Merger using the 2012 audited Financial Statements. The amended articles and plan was filed to the SEC on July 24, 2013 to amend certain provision on the articles and plan of merger. As of March 20, 2014, the SEC has not yet approved the petition. In 2007, the Parent Company invested P=4.9 million in MCPI representing 49% equity holdings. However, control over the operating and financial policies of MCPI is exercised by the Parent Company through its representations in the Board. Accordingly, MCPI qualifies as a subsidiary of the Parent Company. The financial statements of MCPI as of and for each the three years ended December 31, 2013, 2012 and 2011 are included in the consolidated financial statements. The Board of Directors in their meeting on February 6, 2009, unanimously decided to wind up the affairs of MCPI, cease any and all of its operations; and close its business. Pursuant to the same, MCPI shall do all acts legally that are necessary and required. However, on October 29, 2009, the Board of Directors resolved the revocation of its previous resolution to dissolve the MCPI and any act pursuant to the dissolution. In 2010, the Parent Company subscribed 2,850,000 shares and 3,000,000 shares of PTCHC and PCLHC, respectively, at par value. The investment represents 95% and 100% equity holdings of PTCHC and PCLHC, respectively. PTCHC and PCLHC are newly organized companies in 2010. On December 8, 2010, PTCHC acquired 100% of equity holdings of Palm Concepcion Power Corporation (PCPC), formerly DMCI Concepcion Power Corporation. DMCI Power Corporation, PCPC’s former parent company, transferred and conveyed to PTCHC all of the rights, title and interest in and to the shares of stock of PCPC. The acquisition cost is higher than the fair value of the identifiable net assets of the acquired subsidiary. Accordingly, goodwill of P=21,472,567 is recognized in the 2010 consolidated statements of financial position. In 2011, additional acquisition cost amounting to P=1,199,375 was capitalized as investment in subsidiaries which

- 30 -
resulted to additional goodwill of the same amount. In 2012, when the Group’s equity interest in PCPC was reduced to 30%, the entire goodwill was derecognized. On January 12, 2011, the Parent Company and HLPC entered to a deed of subscription, which increased HLPC’s authorized share capital from 10,000 to 160,000 shares with par value of one hundred pesos (P=100) per share. Out of the 150,000 increase in authorized shares of HLPC, the Parent Company subscribe an aggregate share of 37,500 common shares which represents ninety three and seventy five percent (93.75%) of the resulting total issued and subscribed share capital of 40,000 shares. Accordingly, goodwill of P=250,000 is recognized in the 2011 consolidated statements of financial position. In December 2011, a deed of assignment was entered into by the Parent Company and HLPC’s stockholder, assigning the remaining six and twenty five percent (6.25%) shares of HLPC to the Parent Company. In September 2012, the Parent Company, together with its subsidiaries, PTCHC, Palm Concepcion Power Corporation (PCPC) and Panay Consolidated Land Holdings Corporation (PCLHC), has signed a Shareholders’ Agreement with AC Energy Holdings, Inc. (ACEHI) and Jin Navitas Resource, Inc. (JNRI) to implement the Memorandum of Agreement between the parties to build power generation plant in the Province of Iloilo. In relation to the above agreements, the Parent Company transferred all of its equity interest in PCLHC to PTCHC. Likewise, PTCHC, ACEHI and JNRI subscribed on the remaining unissued authorized share capital of PCLHC and PCPC. The subscription of ACEHI and JNRI to PCLHC and PCPC reduced the Parent Company’s holdings, through PTCHC, to 30%. In May 2013, ACEHI sold all its interest in PCPC and PCLHC to focus its investing power to its existing power projects imminent in its development pipeline. In the light of this event, PTCHC has taken the opportunity to acquire the entire stake of ACEHI bringing PTCHC’s interest to 70% on both entities. Later before the end of the year, Oriental Knight Limited bought out and subscribed to the 30.46% equity interest of PCPC from PTCHC. Additional shares were subscribed by PTCHC bringing its equity interest to 39.54%. On the other hand, PTCHC’s interest in PCLHC as of December 31, 2013 remained at 70%. On December 11, 2013, the BOD and shareholders of PCLHC and PCPC approved the merger of the two entities, with PCPC as the surviving entity. PTCHC will hold sufficient interest in PCPC for it to be able to exercise significant influence. PTCHC’s interest in PCLHC will still be presented under the investment in associate account (see Note 12).
3. Changes in Accounting Policies Changes in Accounting Policies The accounting policies adopted are consistent with those of the previous financial year except for the adoption of the following standards, amendments and Philippine Interpretations based on the interpretations of the International Financial Reporting Standards Interpretations Committee (IFRIC) effective beginning January 1, 2013.
• Amendments to PFRS 7, "Financial instruments: Disclosures - Offsetting Financial Assets and Financial
Liabilities" These amendments require an entity to disclose information about rights of set-off and related arrangements (such as collateral agreements). The new disclosures are required for all recognized financial instruments that are set off in accordance with Philippine Accounting Standard (PAS) 32, "Financial Instruments: Presentation". These disclosures also apply to recognized financial instruments that are subject to an enforceable master netting arrangement or 'similar agreement', irrespective of whether they are set-off in accordance with PAS 32. The amendments require entities to disclose, in a tabular format, unless another format is more appropriate, the following minimum quantitative information. This is presented separately for financial assets and financial liabilities recognized at the end of the reporting period: a. The gross amounts of those recognized financial assets and recognized financial liabilities; b. The amounts that are set off in accordance with the criteria in PAS 32 when determining the net
amounts presented in the consolidated balance sheet; c. The net amounts presented in the consolidated balance sheet;
d. The amounts subject to an enforceable master netting arrangement or similar agreement that are not
otherwise included in (b) above, including:

- 31 -
i. Amounts related to recognized financial instruments that do not meet some or all of the offsetting criteria in PAS 32; and
ii. Amounts related to financial collateral (including cash collateral); and e. The net amount after deducting the amounts in (d) from the amounts in (c) above.
The amendments affect disclosures only and have no impact on the Group's financial position or performance (see Note 31).
• PFRS 13, "Fair Value Measurement" This standard establishes a single source of guidance for fair value measurement. It does not change when an entity is required to use fair value, but rather provides guidance on how to measure fair value under PFRS when fair value is required or permitted.
As a result of the guidance in PFRS 13, the Company reassessed its policies for measuring fair values, in particular, its valuation inputs such as non-performance risk for fair value measurement of liabilities. The application of PFRS 13 did not have a material impact on the fair value measurements of the Company. Additional disclosures where required, are provided in the individual notes relating to the assets and liabilities whose fair values where determined. The fair value hierarchy is provided in Note 31 to the consolidated financial statements.
• Amendment to PAS 1, "Presentation of Financial Statements - Presentation of Items of Other Comprehensive
Income" The amendment to PAS 1 changes the grouping of items presented in OCI. Items that can be reclassified (or "recycled") to profit or loss at a future point in time (for example, upon derecognition or settlement) will be presented separately from items that will never be recycled. The amendment affected the presentation of items of OCI and has no impact on the Group's financial position or performance.
• Amendments to PAS 19, "Employee Benefits" For defined benefit plans, the Revised PAS 19 requires all actuarial gains and losses to be recognized in OCI and unvested past service costs previously recognized over the average vesting period to be recognized immediately in the consolidated statement of income when incurred.
Prior to adoption of the revised standard, the Group recognized actuarial gains and losses as income or expense when the net cumulative unrecognized actuarial gains and losses for each individual plan at the end of the previous reporting period exceeded 10% of the higher of the present value of the defined benefit obligation and the fair value of the plan assets. Unvested past service costs are recognized as an expense on a straight-line basis over the average vesting period until the benefits become vested. Upon adoption of the revised standard, the Group changed its accounting policy to recognize all actuarial gains and losses in OCI and all past service costs in the consolidated statement of income in the period they occur.
In addition, the Revised PAS 19 replaced the interest cost and expected return on plan assets with the concept of net interest on defined benefit liability or asset, which is calculated by multiplying the net defined benefit liability or asset at the beginning of the year by the discount rate used to measure the defined benefit obligation, each at the beginning of the annual period.
The revised standard also amended the definition of short-term employee benefits and requires employee benefits to be classified as short-term based on expected timing of settlement rather than the employee's entitlement to the benefits. It also modifies the timing of recognition for termination benefits, where termination benefits are recognized at the earlier of when the offer cannot be withdrawn or when the related restructuring costs are recognized. The opening balance sheet of the earliest comparative period presented (January 1, 2012) and the comparative figures have been restated accordingly resulting to a retroactive adjustment of P=1,108,764 as of January 1, 2012. The effects of the application on the financial statements are as follows:

- 32 -
January 1, 2013 January 1, 2012 Retained earnings as previously reported P=685,835,631 P=610,442,318 Decrease in retirement benefit cost 1,941,382 1,108,764 Retained earnings as restated P=687,777,013 P=611,551,082
Reconciliation of Retirement Benefit Asset (Liability) January 1, 2013 January 1, 2012 Retirement benefit asset as previously reported P=4,436,866 P=4,361,002 Recognition of cumulative actuarial loss reserve (24,206,991) (9,990,469) Decrease in retirement benefit cost 1,941,382 1,108,764 Retirement liability as restated (P=17,828,743) (P=4,520,703)
Reconciliation of Cumulative Actuarial Loss Reserve
January 1, 2013 January 1, 2012 Cumulative actuarial loss reserve as previously
reported P=– P=– Recognition of cumulative actuarial loss reserve (24,206,991) (9,990,469)Cumulative actuarial loss reserve as restated (P=24,206,991) (P=9,990,469)
The transition did not have a significant impact on the statements of cash flows and earnings per share for the years ended December 31, 2013 and 2012.
Remeasurement loss on retirement benefits liability was closed to retained earnings at transition date. Subsequent to January 1, 2012, remeasurement loss on retirement benefits liability is separately presented in equity.
The Revised PAS 19 also requires more extensive disclosures which are presented in Note 27 to the financial statements.
• Philippine Interpretation IFRIC 20, "Stripping Costs in the Production Phase of a Surface Mine"
This interpretation applies to waste removal costs ("stripping costs") that are incurred in surface mining activity during the production phase of the mine ("production stripping costs"), If the benefit from the stripping activity will be realized in the current period, an entity is required to account for the stripping activity costs as part of the cost of inventory. When the benefit is the improved access to ore, the entity should recognize these costs as a noncurrent asset, only if certain criteria are met ("stripping activity asset"). The stripping activity asset is accounted for as an addition to, or as an enhancement of, an existing asset. After initial recognition, the stripping activity asset is carried at its cost or revalued amount less depreciation or amortization and less impairment losses, in the same way as the existing asset of which it is a part. The interpretation did not have any significant impact on the Company's financial position or performance.
• Annual Improvements to PFRS (2009 to 2011 cycle)
The Annual Improvements to PFRS (2009 to 2011 cycle) contain non-urgent but necessary amendments to PFRS. The Company adopted these amendments in 2013.
• PFRS 1, "First-time Adoption of PFRS - Borrowing Costs"
The amendment clarifies that, upon adoption of PFRS, an entity that capitalized borrowing costs in accordance with its previous generally accepted accounting principles, may carry forward, without any adjustment, the amount previously capitalized in its opening balance sheet at the date of transition. Subsequent to the adoption of PFRS, borrowing costs are recognized in accordance with PAS 23, "Borrowing Costs". The amendment does not apply to the Company as it is not a first-time adopter of PFRS.
• PAS 1, "Presentation of Financial Statements - Clarification of the Requirements for Comparative Presentation"
- 33 -
The amendments clarify the requirements for comparative information that are disclosed voluntarily and those that are mandatory due to retrospective application of an accounting policy, or retrospective restatement or reclassification of items in the financial statements. An entity must include comparative information in the related notes to the financial statements when it voluntarily provides comparative information beyond the minimum required comparative period. The additional comparative period does not need to contain a complete set of financial statements. On the other hand, supporting notes for the third balance sheet (which are mandatory when there is a retrospective application of an accounting policy, or retrospective restatement or reclassification of items in the financial statements) are not required. The amendments affect disclosures only and have no impact on the Company's financial position or performance.
• PAS 16, "Property, Plant and Equipment - Classification of Servicing Equipment"
The amendment clarifies that spare parts, stand-by equipment and servicing equipment should be recognized as property, plant and equipment when they meet the definition of property, plant and equipment and should be recognized as inventory if otherwise. The amendment did not have any impact on the Company's financial position or performance.
• PAS 32, "Financial Instruments: Presentation - Tax Effect of Distribution to Holders of Equity
Instruments" The amendment clarifies that income taxes relating to distributions to equity holders and to transaction costs of an equity transaction are accounted for in accordance with PAS 12, "Income Taxes". The amendment did not have any impact on the Company's financial position or performance.
• PAS 34, "Interim Financial Reporting - Interim Financial Reporting and Segment Information for Total
Assets and Liabilities" The amendment clarifies that the total assets and liabilities for a particular reportable segment need to be disclosed only when the amounts are regularly provided to the chief operating decision maker and there has been a material change from the amount disclosed in the entity's previous annual financial statements for that reportable segment. The amendment affects disclosures only and has no impact on the Company's financial position or performance.
Future Changes in Accounting Policies The standards, amendments and interpretations which have been issued but not yet effective as at December 31, 2013 are disclosed below. Except as otherwise indicated, the Company does not expect the adoption of the applicable new and amended PFRS to have a significant impact on the financial position or performance.
Effective in 2014 • Amendments to PFRS 10, "Consolidated Financial Statements", PFRS 11, "Joint Arrangements" and PAS 27,
"Separate Financial Statements": Investment Entities The amendments provide an exception to the consolidation requirement for entities that meet the definition of an investment entity under PFRS 10. The exception to consolidation requires investment entities to account for subsidiaries at fair value through profit or loss (FVPL). It is not expected that these amendments will be relevant to the Company since none of the entities in the Company will qualify as an investment entity under PFRS 10.
• Amendments to PAS 32, "Financial Instruments: Presentation - Offsetting Financial Assets and Financial Liabilities" The amendments clarify the meaning of "currently has a legally enforceable right to set-off" and also clarify the application of the PAS 32 offsetting criteria to settlement systems (such as central clearing house systems) which apply gross settlement mechanisms that are not simultaneous_ The amendments will affect presentation only and will have no impact on the Company's financial position or performance.
• Amendments to PAS 36, "Impairment of Assets - Recoverable Amount Disclosures for Nonfinancial Assets"
The amendments remove the unintended consequence of PFRS 13 on the disclosures required under PAS 36. In addition, these amendments require disclosure of the recoverable amounts for the assets or cash-generating units for which impairment loss has been recognized or reversed during the period. These amendments are effective retrospectively for annual periods beginning on or after January 1, 2014 with earlier application permitted, provided PFRS 13 is applied. The Company did not early adopt the

- 34 -
amendments. These amendments will affect disclosures only and will have no impact on the Company's financial position or performance.
• PAS 39, "Financial Instruments: Recognition and Measurement - Novation of Derivatives and Continuation of
Hedge Accounting" The amendments provide relief from discontinuing hedge accounting when novation of a derivative designated as a hedging instrument meets certain criteria. These amendments are effective for annual periods beginning on or after January 1, 2014. The amendments are not expected to have an impact on the Company's financial position or performance.
• Philippine Interpretation IFRIC 21, "Levies"
The interpretation clarifies that an entity recognizes a liability for a levy when the activity that triggers payment, as identified by the relevant legislation, occurs. For a levy that is triggered upon reaching a minimum threshold, the interpretation clarifies that no liability should be anticipated before the specified minimum threshold is reached. The Company does not expect that the interpretation will have a material financial impact on its future financial statements.
Effective in 2015 • Amendments to PAS 19, "Employee Benefits - Defined Benefit Plans: Employee Contributions"
The amendments apply to contributions from employees or third parties to defined benefit plans. Contributions that are set out in the formal terms of the plan shall be accounted for as reductions to current service costs if they are linked to service or as part of the remeasurements of the net defined benefit asset or liability if they are not linked to service. Contributions that are discretionary shall be accounted for as reductions of current service cost upon payment of these contributions to the plans. The amendments will not have any significant impact on the financial statements of the Company as its retirement plans are noncontributory.
• Annual Improvements to PFRS (2010 to 2012 cycle)
The Annual Improvements to PFRSs (2010-2012 cycle) contain non-urgent but necessary amendments to the following standards:
• PFRS 2, "Share-based Payment - Definition of Vesting Condition"
The amendment revised the definitions of vesting condition and market condition and added the definitions of performance condition and service condition to clarify various issues. This amendment shall be prospectively applied to share-based payment transactions for which the grant date is on or after July 1, 2014. This amendment does not apply to the Company as it currently has no share-based payments.
• PFRS 3, "Business Combinations - Accounting for Contingent Consideration in a Business Combination"
The amendment clarifies that a contingent consideration that meets the definition of a financial instrument should be classified as a financial liability or as equity in accordance with PAS 32, Contingent consideration that is not classified as equity is subsequently measured at FVPL whether or not it falls within the scope of PFRS 9 (or PAS 39, if PFRS 9 is not yet adopted). The amendment shall be prospectively applied to business combinations for which the acquisition date is on or after July 1, 2014. The Company shall consider this amendment for future business combinations.
• PFRS 8, "Operating Segments - Aggregation of Operating Segments and Reconciliation of the Total of the
Reportable Segments' Assets to the Entity's Assets" The amendments require entities to disclose the judgment made by management in aggregating two or more operating segments. This disclosure should include a brief description of the operating segments that have been aggregated in this way and the economic indicators that have been assessed in determining that the aggregated operating segments share similar economic characteristics. The amendments also clarify that an entity shall provide reconciliations of the total of the reportable segments' assets to the entity's assets if such amounts are regularly provided to the chief operating decision maker. These amendments are effective for annual periods beginning on or after July 1, 2014 and are applied retrospectively. The amendments will affect disclosures only and will not have an impact on the Company's financial position or performance.
• PFRS 13, "Fair Value Measurement - Short-term Receivables and Payables"
- 35 -
The amendment clarifies that short-term receivables and payables with no stated interest rates can be held at invoice amounts when the effect of discounting is immaterial. This amendment is effective immediately.
• PAS 16, "Property, Plant and Equipment: Revaluation Method - Proportionate Restatement of Accumulated Depreciation" The amendment clarifies that, upon revaluation of an item of property, plant and equipment, the carrying amount of the asset shall be adjusted to the revalued amount, and the asset shall be treated in one of the following ways: a. The gross carrying amount is adjusted in a manner that is consistent with the revaluation of the
carrying amount of the asset. The accumulated depreciation at the date of revaluation is adjusted to equal the difference between the gross carrying amount and the carrying amount of the asset after taking into account any accumulated impairment losses.
b. The accumulated depreciation is eliminated against the gross carrying amount of the asset.
The amendment is effective for annual periods beginning on or after July 1, 2014. The amendment shall apply to all revaluations recognized in annual periods beginning on or after the date of initial application of this amendment and in the immediately preceding annual period. The amendment will have no impact on the Company's financial position or performance.
• PAS 24, "Related Party Disclosures - Key Management Personnel"
The amendments clarify that an entity is a related party of the reporting entity if the said entity, or any member of a group for which it is a part of, provides key management personnel services to the reporting entity or to the parent company of the reporting entity. The amendments also clarify that a reporting entity that obtains management personnel services from another entity (also referred to as management entity) is not required to disclose the compensation paid or payable by the management entity to its employees or directors. The reporting entity is required to disclose the amounts incurred for the key management personnel services provided by a separate management entity. The amendments are effective for annual periods beginning on or after July 1, 2014 and are applied retrospectively. The amendments will affect disclosures only and will have no impact on the Company's financial position or performance.
• PAS 38, "Intangible Assets: Revaluation Method - Proportionate Restatement of Accumulated
Amortization" The amendments clarify that, upon revaluation of an intangible asset, the carrying amount of the asset shall be adjusted to the revalued amount, and the asset shall be treated in one of the following ways: a. The gross carrying amount is adjusted in a manner that is consistent with the revaluation of the
carrying amount of the asset. The accumulated amortization at the date of revaluation is adjusted to equal the difference between the gross carrying amount and the carrying amount of the asset after taking into account any accumulated impairment losses.
b. The accumulated amortization is eliminated against the gross carrying amount of the asset.
The amendments also clarify that the amount of the adjustment of the accumulated amortization should form part of the increase or decrease in the carrying amount accounted for in accordance with the standard.
The amendments are effective for annual periods beginning on or after July 1, 2014. These amendments shall apply to all revaluations recognized in annual periods beginning on or after the date of initial application of this amendment and in the immediately preceding annual period. The amendments will have no impact on the Company's financial position or performance.

- 36 -
• Annual Improvements to PFRS (2011 to 2013 cycle) The Annual Improvements to PFRSs (2011-2013 cycle) contain non-urgent but necessary amendments to the following standards: • PFRS 1, "First-time Adoption of Philippine Financial Reporting Standards - Meaning of Effective PFRS"
The amendment clarifies that an entity may choose to apply either a current standard or a new standard that is not yet mandatory, but that permits early application, provided either standard is applied consistently throughout the periods presented in the entity's first PFRS financial statements. This amendment is not applicable to the Company as it is not a first-time adopter of PFRS.
• PFRS 3, "Business Combinations - Scope Exceptions for Joint Arrangements"
The amendment clarifies that PFRS 3 does not apply to the accounting for the formation of a joint arrangement in the financial statements of the joint arrangement itself. The amendment is effective for annual periods beginning on or after July 1, 2014 and is applied prospectively.
• PFRS 13, "Fair Value Measurement - Portfolio Exception"
The amendment clarifies that the portfolio exception in PFRS 13 can be applied to financial assets, financial liabilities and other contracts. The amendment is effective for annual periods beginning on or after July 1, 2014 and is applied prospectively. The amendment will have no impact on the Company's financial position or performance.
• PAS 40, "Investment Property"
The amendment clarifies the interrelationship between PFRS 3 and PAS 40 when classifying property as investment property or owner-occupied property. The amendment stated that judgment is needed when determining whether the acquisition of investment property is the acquisition of an asset or a group of assets or a business combination within the scope of PFRS 3. This judgment is based on the guidance of PFRS 3. This amendment is effective for annual periods beginning on or after July 1, 2014 and is applied prospectively. The amendment has no significant impact on the Company's financial position or performance.
New Standard with No Mandatory Effective Date • PFRS 9, "Financial Instruments: Classification and Measurement"
PFRS 9, as issued, reflects the first and third phases of the project to replace PAS 39 and applies to the classification and measurement of financial assets and liabilities and hedge accounting, respectively. Work on the second phase, which relate to impairment of financial instruments, and the limited amendments to the classification and measurement model is still ongoing, with a view to replace PAS 39 in its entirety. PFRS 9 requires all financial assets to be measured at fair value at initial recognition. A debt financial asset may, if the fair value option (FVO) is not invoked, be subsequently measured at amortized cost if it is held within a business model that has the objective to hold the assets to collect the contractual cash flows and its contractual terms give rise, on specified dates, to cash flows that are solely payments of principal and interest on the principal outstanding. All other debt instruments are subsequently measured at fair value through profit or loss. All equity financial assets are measured at fair value either through OCI or profit or loss. Equity financial assets held for trading must be measured at FVPL. For liabilities designated as at FVPL using the FVO, the amount of change in the fair value of a liability that is attributable to changes in credit risk must be presented in OCI. The remainder of the change in fair value is presented in profit or loss, unless presentation of the fair value change relating to the entity's own credit risk in OCI would create or enlarge an accounting mismatch in profit or loss. All other PAS 39 classification and measurement requirements for financial liabilities have been carried forward to PFRS 9, including the embedded derivative bifurcation rules and the criteria for using the FVO. The adoption of the first phase of PFRS 9 will have an effect on the classification and measurement of the Group's financial assets, but will potentially have no impact on the classification and measurement of financial liabilities.
On hedge accounting, PFRS 9 replaces the rules-based hedge accounting model of PAS 39 with a more principles-based approach. Changes include replacing the rules-based hedge effectiveness test with an objectives-based test that focuses on the economic relationship between the hedged item and the hedging instrument, and the effect of credit risk on that economic relationship; allowing risk components to be designated as the hedged item, not only for financial items, but also for nonfinancial items, provided that the risk component is separately identifiable and reliably measurable; and allowing the time value of an option,

- 37 -
the forward element of a forward contract and any foreign currency basis spread to be excluded from the designation of a financial instrument as the hedging instrument and accounted for as costs of hedging. PFRS 9 also requires more extensive disclosures for hedge accounting.
PFRS 9 currently has no mandatory effective date. PFRS 9 may be applied before the completion of the limited amendments to the classification and measurement model and impairment methodology. The Group will not adopt the standard before the completion of the limited amendments and the second phase of the project. The Group is currently assessing the relevance and impact of the above new and amendments to standards, Philippine Interpretations and improvements to existing accounting standards. The revised disclosures on the consolidated financial statements required by the above new and amendments to standards, Philippine Interpretations and improvements to existing accounting standards will be included in the Group’s consolidated financial statements when these are adopted.
After consideration of the results on the initial impact evaluation using the audited balances of the financial statements as of December 31, 2013, the Group has decided not to early adopt either PFRS 9 (2009) or PFRS 9 (2010) for its 2014 financial reporting. The group will, however, continue to evaluate the impact of this standard on the financial statements for the year 2014.
Deferred • Philippine Interpretation IFRIC 15, "Agreements for the Construction of Real Estate"
This interpretation covers accounting for revenue and associated expenses by entities that undertake the construction of real estate directly or through subcontractors. The Philippine SEC and the Financial Reporting Standards Council (FRSC) have deferred the affectivity of this interpretation until the final Revenue standard is issued by the International Accounting Standards Board (IASB) and an evaluation of the requirements of the final Revenue standard against the practices of the Philippine real estate industry is completed. The adoption of the interpretation when it becomes effective will not have any impact on the financial statements of the Group.
4. Summary of Significant Accounting and Financial Reporting Policies
Revenue Recognition Revenue is recognized to the extent that is probable that the economic benefits will flow to the Group and the revenue can be reliably measured. Revenue is recognized when the significant risks and rewards of ownership of the goods have passed to the buyer and the amount of revenue can be measured reliably. The following specific recognition criteria must also be met before revenue is recognized:
• Sale of real estate
Sale of real estate is recognized in full provided the profit is determinable, and the earning process is virtually complete. Specifically, revenue recognition is applied to sale if construction development is almost complete, sufficient cumulative down payment has been received, and that collectibility of sales price is reasonably assured. The percentage of completion method is used to recognize revenue from sales of projects where the Group has material obligations to complete the project after the property is sold. Under this method, revenue is recognized as the related obligations are fulfilled, measured principally on the basis of the estimated completion of a physical proportion of the contract work. Pending recognition of sale when conditions for recording a sale are not met, cash received from buyers are presented under “Deposit from customers” in the liability section of the consolidated statements of financial position. Any excess of collections over the recognized receivables are also included in the said account.
• Sale of crude palm oil. Revenue is recognized upon delivery or shipment of goods to customers at invoice.
• Sale of aggregates, seedlings and fresh fruit bunch. Revenue is recognized when goods are delivered to the buyer.
- 38 -
• Water service income. Revenue is recognized when services are rendered and normally when billed.
• Hotel operations. Revenue is recognized when the services are rendered and when goods are delivered to the buyer.
• Interest income. Interest income is recognized as the interest accrues, taking into account the effective yield on the asset. Interest income from bank deposits is recognized on a time proportion basis on the principal outstanding and at the rate applicable.
• Rental income. Rental income on leased properties arising from operating leases or investment properties is accounted for on a straight-line basis over the lease term.
• Dividend income. Dividend income is recognized when the shareholders’ right to receive payment is established.
• Other income. Revenue is recognized as other income accrues.
• Realized gains and losses. Realized gains and losses are recognized when the sale transaction occurs.
Cost and Expense Recognition Contract costs include all direct materials and labor costs and those indirect costs related to contract performance. Expected losses on contracts are recognized immediately when it is probable that the total contract costs will exceed total contract revenue. Changes in contract performance, contract conditions and estimated profitability, including those arising from contract penalty provisions, and final contract settlements which may result in revisions to estimated costs and gross margins are recognized in the year in which the changes are determined. Expenses are recognized in the consolidated statements of income upon utilization of the assets or services or at the date they are incurred.
Preoperating Expenses Preoperating expenses are expensed as incurred. Cash and cash equivalents Cash is stated at face value and includes cash on hand and in banks. Cash equivalents are short-term highly liquid investments that are readily convertible to known amounts of cash with original maturities of three months or less and that are subject to an insignificant risk of change in value. Financial Assets and Liabilities Date of recognition The Group recognizes a financial asset or a financial liability when it becomes a party to the contractual provisions of the instrument. In the case of a regular way purchase or sale of financial assets, recognition and derecognition, as applicable, is done using settlement date accounting. Initial recognition Financial assets and financial liabilities are recognized initially at fair value, which is the fair value of the consideration given (in case of an asset) or received (in case of a liability). The fair value of the consideration given or received is determined by reference to the transaction price or other market prices. If such market prices are not reliably determinable, the fair value of the consideration is estimated as the sum of all future cash payments or receipts, discounted using the prevailing market rate of interest for similar instruments with similar maturities. The initial measurement of financial instruments, except for those designated at fair value through profit and loss (FVPL), includes transaction costs.
- 39 -
Determination of fair value Fair value is determined by preference to the transaction price or other market prices. If such market prices are not reliably determinable, the fair value is determined by using appropriate valuation techniques. Valuation techniques include net present value model where the fair value of the consideration is estimated as the sum of all future cash payments or receipts, discounted using the prevailing market rates of interest for a similar instruments with similar maturities. Other valuation techniques include comparing to similar instruments for which market observable prices exist; recent arm’s length market transaction; option pricing model and other relevant valuation models. Financial Assets The Group determines the classification at initial recognition and, where allowance is appropriate, re-evaluates this designation every reporting date. The classification depends on the purpose for which the investments are acquired and whether they are quoted in an active market. Subsequent to initial recognition, the Group classifies its financial assets in the following categories:
• Financial asset at fair value through profit or loss (FVPL)
A financial asset is classified in this category if acquired principally for the purpose of selling or repurchasing in the near term or upon initial recognition, it is designated by the management as at FVPL. Derivatives are also categorized as held at fair value through profit or loss, except those derivatives designated as effective hedging instruments. Assets classified in this category are carried at fair value in the consolidated statements of financial position. Changes in the fair value of such assets are accounted for in consolidated statements of income. Financial instruments held at fair value through profit or loss are classified as current if they are expected to be realized within 12 months from the end of financial reporting period. As of June 30, 2014 and December 31, 2013, the Group has no financial asset at FVPL.
• Loans and receivables
Loans and receivables are non-derivative financial assets with fixed or determinable payments and are not quoted in an active market. They arise when the Group provides money, goods or services directly to a debtor with no intention of trading the receivables. Such assets are carried at cost or amortized cost in the consolidated statements of financial position. Amortization is determined using the effective interest method. Loans and receivables are included in current assets if maturity is within 12 months from the end of financial reporting period. Otherwise, these are classified as non-current assets.
The Group’s cash and cash equivalents, accounts receivable, due from related parties and refundable deposits are included in this category (see Notes 6, 7, 8, 10, 20 and 31).
• Held-to-maturity investments Held-to-maturity investments are non-derivative financial assets with fixed or determinable payments and fixed maturities wherein the Group has the positive intention and ability to hold to maturity. Held-to-maturity investments are carried at cost or amortized cost in the consolidated statements of financial position. Amortization is determined by using the effective interest method. Assets under this category are classified as current assets if maturity is within 12 months from the end of financial reporting period and as non-current assets if maturity is more than a year from the end of financial reporting period. As of June 30, 2014 and December 31, 2013, the Group has no held-to-maturity investments.
• Available-for-sale financial assets
Available-for-sale financial assets are those non-derivative financial assets that are designated as available-for-sale or are not classified in any of the three preceding categories. After initial recognition, available-for-sale financial assets are measured at fair value with gains or losses being recognized as separate component of equity until the investment is derecognized or until the investment is determined to be impaired at which time the cumulative gain or loss previously reported in equity is included in the consolidated statements of income.

- 40 -
The fair value of investments that are actively traded in organized financial market is determined by reference to quoted market bid prices at the close of business on the end of financial reporting period. For investments where there is no active market, fair value is determined using valuation techniques. Such techniques include reference to recent arm’s length market transaction, reference to the current market value of another instrument which is substantially the same, discounted cash flows analysis and option pricing models. The Group’s investment in shares of stocks in golf, sports and country clubs, listed and non-listed companies are included in this category (see Note 11).
Financial Liabilities • Financial liability at FVPL
Financial liabilities are classified in this category if these result from trading activities or derivatives transaction that are not accounted for as accounting hedges, or when the Group elects to designate a financial liability under this category.
As of June 30, 2014 and December 31, 2013, the Group has no financial liabilities at FVPL.
• Other financial liabilities
This category pertains to financial liabilities that are not held for trading or not designated as at FVPL upon the inception of the liability. These include liabilities arising from operations (e.g. payables, accruals) or borrowing (e.g., long-term debt). The financial liabilities are recognized initially at fair value and are subsequently carried at amortized cost, taking into account the impact of applying the effective interest rate method of amortization (or accretion) for any related premium, discount and any directly attributable transaction costs.
The Group’s accounts payable and accrued expenses, dividends payable, due to related parties, deposit from customers, subscriptions payable and long-term debt are included in this category (see Notes 18, 19, 20, & 32).
Impairment of Financial Assets The Group assesses at each end of financial reporting period whether a financial asset or group of financial assets is impaired.
• Assets carried at amortized cost. If there is objective evidence that an impairment loss on loans and
receivables carried at amortized cost has been incurred, the amount of the loss is measured as the difference between the asset’s carrying amount and the present value of estimated future cash flows (excluding future credit losses that have not been incurred) discounted at the financial asset’s original effective interest rate (i.e., the effective interest rate computed at initial recognition). The carrying amount of the asset shall be reduced either directly or through use of an allowance account. The amount of the loss shall be recognized in the Group’s consolidated statements of income.
The Group first assesses whether objective evidence of impairment exists individually for financial assets that are individually significant, and individually or collectively for financial assets that are not individually significant. If it is determined that no objective evidence of impairment exists for an individually assessed financial asset, whether significant or not, the asset is included in a group of financial assets with similar credit risk characteristics and that group of financial asset is collectively assessed for impairment. Assets that are individually assessed for impairment and for which an impairment loss is or continues to be recognized are not included in a collective assessment of impairment. If, in a subsequent period, the amount of the impairment loss decrease can be related objectively to an event occurring after the impairment was recognized, the previously recognized impairment loss is reversed. Any subsequent reversal of an impairment loss is recognized in the consolidated statements of income to the extent that the carrying value of the asset does not exceed its amortized cost at the reversal date.
• Assets carried at cost. If there is objective evidence that an impairment loss has been incurred in an unquoted equity instrument that is not carried at fair value because its fair value cannot be reliably
- 41 -
measured, or on a derivative asset that is linked to and must be settled by delivery of such an unquoted equity instrument, the amount of the loss is measured as the difference between the asset’s carrying amount and the present value of estimated future cash flows discounted at the current market rate of return for a similar financial asset.
• Available-for-Sale Financial Assets. If an available-for-sale financial asset is impaired, an amount comprising
the difference between its cost (net of any principal payment and amortization) and its current fair value, less any impairment loss previously recognized in the consolidated statement of income, is transferred from consolidated equity to the consolidated statement of income. Reversals in respect of equity instruments classified as available-for-sale financial assets are not recognized in the consolidated statement of income. For available-for-sale financial assets, the Group assesses at each reporting date whether there is objective evidence that an investment or a group of investments is impaired. In the case of equity investments classified as available-for-sale financial assets, objective evidence would include a significant or prolonged decline in the fair value of the investment below its cost. Where there is evidence of impairment, the cumulative loss, measured as the difference between the acquisition cost and the current fair value, less any impairment loss on that investment previously recognized in the consolidated statement of income, is removed from consolidated equity and recognized in the consolidated statement of income. Impairment losses on equity investments are not reversed through the consolidated statement of income; increases in their fair value after impairment are recognized directly in consolidated equity.
Derecognition of Financial Assets and Liabilities Financial Assets A financial asset is derecognized when (1) the rights to receive cash flows from the financial instruments expire, (2) the Group retains the right to receive cash flows from the asset, but has assumed an obligation to pay them in full without material delay to a third party under a “pass-through” arrangement, or (3) the Group has transferred its rights to receive cash flows from the asset and either has transferred substantially all the risks and rewards of the asset, or has neither transferred nor retained substantially all the risks and rewards of the asset, but has transferred control of the asset.
Where the Group has transferred its rights to receive cash flows of an asset or has entered into a pass-through arrangement and has neither transferred nor retained substantially all the risks and rewards of an asset nor transferred control of the assets, the asset is recognized to the extent of the Group’s continuing involvement in the asset. Continuing involvement that takes the form of a guarantee over the transferred asset is measured at the lower of the original carrying amount of the asset and the maximum amount of consideration that the Group could be required to repay. Financial Liabilities A financial liability is derecognized when the obligation under the liability is discharged, cancelled or expired. Where the existing financial liability is replaced by another from the same lender on substantially different terms, or the terms of an existing liability are substantially modified, such an exchange or modification is treated as a derecognition of the original liability and the recognition of a new liability, and the difference in the respective carrying amounts is recognized in consolidated statements of income. Classification of Financial Instrument between Debt and Equity Financial instruments are classified as liabilities or equity in accordance with the substance of the contractual arrangement. Interest relating to a financial instrument or a component that is a financial liability is reported as expenses. A financial instrument is classified as debt if it provides for a contractual obligation to: (a) deliver cash or another financial asset to another entity; or (b) exchange financial assets or financial liabilities with another entity under conditions that are potentially unfavorable to the Group; or (c) satisfy the obligation other than by exchange of a fixed amount of cash or other financial asset for a fixed number of own equity shares. If the Group does not have an unconditional right to avoid delivering cash or another financial asset to settle its contractual obligation, the obligation meets the definition of a financial liability.

- 42 -
Offsetting Financial Instruments Financial assets and financial liabilities are offset and the net amount is reported in the consolidated statements of financial position if, and only if, there is a currently enforceable legal right to offset the recognized amounts and there is an intention to settle on a net basis, or to realize the asset and settle the liability simultaneously. This is not generally the case with master netting agreements, and the related assets and liabilities are presented gross in the consolidated statements of financial position.
Real Estate Held for Sale and Land and Improvements Real estate held for sale, and land and improvements consisting of properties held for future development are valued at the lower of cost and net realizable value (NRV). Cost includes the acquisition cost of the land plus all costs incurred directly attributable to the development and improvement of the properties. NRV is the estimated selling price in the ordinary course of business, less estimated cost of completion and estimated costs necessary to make the sale. Inventories Finished goods are valued at the lower of cost and net realizable value. Costs incurred in bringing inventory to its present conditions are accounted for as follows: • Finished goods and goods in process – cost includes direct materials and labor and proportion of
manufacturing overhead costs based on normal operating capacity but excluding borrowing costs. Cost is determined by the moving average method.
• Materials and supplies – at cost using the first-in-first out method. Prepayments and Other Current Assets Prepayments are expenses paid in advance and recorded as asset before they are utilized. This account comprises the following: • Input Tax. Input tax is recognized when an entity in the Group purchases goods or services from a Value
Added Tax (VAT)-registered supplier. This account is offset, on a per entity basis, against any output tax previously recognized.
• Prepaid Commission and Other Expenses. Prepaid commission and other expenses are apportioned over the
period covered by the payment and charged to the appropriate account in the consolidated statements of income when incurred.
• Creditable Withholding Tax. Creditable withholding tax is recognized for income taxes withheld by
customers. The balance as of end of each reporting period represents the unutilized amount after deducting any income tax payable.
Prepayments and other assets that are expected to be realized for no more than 12 months after the reporting period are classified as current asset. Otherwise, these are classified as other noncurrent asset. Investment in an Associate Investment in shares of stock where the Group holds 20% or more ownership, or where it has the ability to significantly influence the investee company’s operating activities is accounted for under the equity method. Under the equity method, the cost of the investment is increased or decreased by the Group’s equity in net earnings or losses of the investee company since the date of acquisition. Any excess of the cost of acquisition over the Group’s share in the fair value of the identifiable net assets of the associate at date of acquisition is recognized as goodwill. Any excess of the fair value of the identifiable assets, liabilities and contingent liabilities and assets of the investee company over cost is included in the determination of the Group’s share of the profit or loss in the period in which the investment is acquired. Under the equity method, investment in shares of stock is carried at cost adjusted by post-acquisition changes in the Group’s share of the net assets of the investee. The Group’s share in the investee’s post-acquisition profits or losses is recognized in the statements of income, and its share of post-

- 43 -
acquisition movements in reserves is recognized in reserves, if any. The cumulative post-acquisition movements are adjusted against the carrying amount of investment. The carrying value is also decreased for any cash or property dividends received. Investment in a Joint Venture Investment in joint venture is initially accounted for at cost and is reviewed for impairment when events or changes in circumstances indicate that the carrying values may not be recoverable. The Group has an investment in a jointly controlled operations whereby the venturers have a contractual arrangement that establishes joint control. The operation of the joint venture involves the use of the assets and other resources of the venturers rather than the establishment of a corporation, partnership or other entity, or a financial structure that is separate from the venturers themselves. Each venturer uses its own property plant and equipment and carries its own inventories. It also incurs its own expenses and liabilities and raises its own finance, which represent its own obligations. The joint venture activities may be carried out by the venturer’s employees alongside the venturer’s similar activities. The joint venture agreement usually provides a means by which the revenue from the sale of the joint venture product and any expenses in common are shared among the venturers. As discussed in Note 39, in 2010, the Group participated in a project to drill a well in Texas, USA, which was expected to contain commercial oil and gas deposits. However in the same year, it was confirmed that the reservoir does not have sufficient permeability to justify production. The Group has concurred with the recommendation of its co-venturer to plug and abandon the well. The Group recognized its investment with the project amounting to P=16,911,988 as a loss during the period.
Investment Properties Investment properties consist of properties held to earn rental income, for capital appreciation or both. These are initially recorded at cost, including transaction cost. The carrying amount includes the cost of replacing part of an existing property at the time the cost are incurred if the recognition criteria are met, and excludes the costs of day-to-day servicing of investment properties. Subsequent to initial recognition, investment properties are carried at cost less accumulated depreciation and any impairment in value. Depreciation and amortization are computed on a straight-line method over estimated useful lives ranging from 2 to 20 years. The useful lives and depreciation method are reviewed periodically to ensure that the period and the method of depreciation are consistent with the expected pattern of economic benefits from the use of the properties for lease. Investment properties are derecognized when these are disposed of or when the investment property is permanently withdrawn from use and there is no future economic benefit expected to arise from the continued use of the properties. Any gain or loss on the retirement or disposal of said properties are recognized in the consolidated statements of income in the year of retirement or disposal. Property and Equipment Property and equipment are stated at cost less accumulated depreciation, amortization and any impairment in value.
The initial cost of property and equipment comprises its purchase price or construction cost and any directly attributable costs of bringing the asset to its working condition and location for its intended use. Expenses incurred after the property and equipment have been put into operation, such as repairs and maintenance and overhaul costs, are normally charged to operations in the period when the costs are incurred. In situations where it can be clearly demonstrated that the expenditures have resulted in an increase in the future economic benefits expected to be obtained from the use of an item of property and equipment beyond its originally assessed standard of performance, the expenditures are capitalized as an additional cost of property and equipment. Depreciation of crushing properties is calculated using units-of-production method based on estimated recoverable reserve. Depreciation and amortization of other items of property, plant and equipment are computed using the straight-line method over the following estimated useful lives, except for leasehold improvements, which are amortized over their estimated lives or term of the lease, whichever is shorter:

- 44 -
Category Estimated useful life Land improvements 1 to 10 years Building and improvements 10 to 20 years Leasehold improvements 2 to 5 years Machinery and equipment 2 to 10 years Furniture, fixture and equipment 2 to 9 years Transportation equipment 2 to 5 years Tools and other equipment 2 to 5 years Other fixed assets 3 to 5 years The useful life and depreciation and amortization methods are reviewed periodically to ensure the period and method of depreciation and amortization are consistent with the expected pattern of economic benefits from items of property and equipment. An item of property and equipment is derecognized upon disposal or when no future economic benefits are expected from its use or disposal. Any gain or loss arising on derecognition of the asset (calculated as the difference between the net disposal proceeds and the carrying amount of the asset) is included in the consolidated statements of income in the year the asset is derecognized. Construction in progress represents structures under construction and is stated at cost. This includes cost of construction and other direct costs. Construction in progress is not depreciated until such time the relevant assets are completed and ready for operational use. Intangibles Intangible assets acquired separately are measured on initial recognition at cost. The cost of intangible assets acquired in a business combination is recognized at fair value at acquisition date. Following initial recognition, intangible assets are carried at cost less any accumulated amortization and any accumulated impairment losses. Internally generated intangible assets are not capitalized and expenditure is reflected in the consolidated statements of income in the year in which the expenditure is incurred. The useful lives of intangible assets are assessed to be either finite or indefinite. The intangible asset recognized and determined by the Group has finite useful lives and represents leasehold rights. Intangible assets with finite lives are amortized over the straight-line method over their useful economic lives of three (3) to twenty (20) years and assessed for impairment whenever there is an indication that the intangible assets may be impaired. The amortization period and method for an intangible asset with a finite useful life is reviewed at least annually. Changes in expected useful life or the expected pattern of consumption of future economic benefits embodied in the asset is accounted for by changing the amortization period or method, as appropriate, and treated as changes in accounting estimates. The amortization expense on intangible assets with finite lives is capitalized as part of the “Biological assets” account in the in the consolidated statements of financial position consistent with the function of the intangible asset. Biological Assets and Agricultural Produce The Group’s biological assets include growing palm oil seedlings, which are grouped according to their physical state, transformation capacity and location/areas. These are carried at its fair value with any resultant gain or loss recognized in the statements of income. The fair value of the biological assets is determined using the cost approach of fair valuation. It involves valuing based on the original cost plus improvements to the biological assets. The Group’s agricultural produce consists of those harvested from the biological assets and is measured at fair value less point-of-sale costs at the point of harvest. The fair value is based on the quoted price in the market at any given time. Goodwill Goodwill arising from the acquisition of a subsidiary or a jointly controlled entity represents the excess of the cost of acquisition over the Group’s interest in the net fair value of the identifiable assets, liabilities and contingent liabilities of the subsidiary or jointly controlled entity recognized at the date of acquisition. Goodwill is initially recognized as an asset at cost and is subsequently measured at cost less any accumulated impairment losses. Goodwill is reviewed for impairment annually or more frequently, if event of changes in circumstances
- 45 -
indicate that the carrying value may be impaired. An impairment loss recognized for goodwill is not reversed in a subsequent period. Negative goodwill, which is the excess of net fair value of subsidiaries’ identifiable assets, liabilities and contingent liabilities over the cost of the business combination is immediately recognized as income. On disposal of a subsidiary or a jointly controlled entity, the attributable amount of goodwill is included in the determination of the profit or loss on disposal. Impairment of Nonfinancial Assets The carrying values of assets such as investment properties, property and equipment, leasehold rights and biological assets are reviewed for impairment when events or changes in circumstances indicate that the carrying values may not be recoverable. If any such indication exists, and if the carrying value exceeds the estimated recoverable amount, the assets or cash generating units are written down to their recoverable amounts. The recoverable amount of the asset is the greater of net selling price or value in use. The net selling price is the amount obtainable from the sale of an asset in an arm’s-length transaction less cost to sell. In assessing value in use, the estimated future cash flows are discounted to their present value using a pre-tax discount rate that reflects current market assessments of the time value of money and the risks specific to the asset. For an asset that does not generate largely independent cash flows, the recoverable amount is determined for the cash-generating unit to which the asset belongs. An impairment loss is charged to operations in the period in which it arises unless the asset is carried at a revalued amount in which case the impairment is charged to the revaluation increment of the said asset. An assessment is made at each end of financial reporting period to determine whether there is any indication that an impairment loss previously recognized for an asset in prior years may no longer exist or may have decreased. If any such indication exists, the asset’s recoverable amount is estimated. A previously recognized impairment loss is reversed only if there has been a change in the estimates used to determine the recoverable amount of an asset, however, not to an amount higher than the carrying amount that would have been determined (net of any depreciation), had no impairment loss been recognized for the asset in prior years. Such reversal is recognized in profit or loss. After such a reversal, the depreciation charge is adjusted in future periods to allocate the asset’s revised carrying amount, less any residual value, on a systematic basis over its remaining useful life. Employee benefits Short-term benefits Short-term employee benefits are recognized as expense in the period when the economic benefits are given. Unpaid benefits at the end of the accounting period are recognized as accrued expense while benefits paid in advance are recognized as prepayment to the extent that it will lead to a reduction in future payments. Short-term benefits given by the Group to its employees include salaries and wage, social security contributions, short-term compensated absences, bonuses and non-monetary benefits.
Retirement benefits Retirement benefit cost is actuarially determined using projected unit credit method. Actuarial gains or losses are recognized as income or expense when the net cumulative unrecognized actuarial gains and losses for the plan at the end of the previous reporting year exceeded 10% of the higher of the present value of the defined benefit obligation and the fair value of the plan assets at that date. These gains and losses are recognized over the expected average remaining working lives of the employees participating in the plan. Past service cost is recognized as an expense on a straight line basis over the average period until the benefits become vested. If the benefits are already vested immediately following the introduction of, or changes to a retirement plan, past service cost is recognized immediately. The define benefit obligation is the aggregate of the present value of the defined benefit contribution and actuarial gains and losses not recognized, reduced by past service costs not yet recognized, and the fair value of plan assets, out of which the obligation are to be settled directly. If such aggregate is negative, the asset is measured at the lower of such aggregate or the aggregate of cumulative unrecognized net actuarial losses and past service cost and the present value of any economic benefits available in the form of refunds from the plan or reductions in the future contributions to the plan.

- 46 -
If the asset is measured at the aggregate of cumulative unrecognized net actuarial losses and past service cost and the present value of any economic benefits available in the form of refunds from the plan or reductions in the future contributions to the plan, net actuarial losses of the current period and past service cost of the current period are recognized immediately to the extent that these exceed any reduction in the present value of those economic benefits. If there is no change or increase in the present value of the economic benefits, the entire net actuarial losses or the current period and past service cost of the current period and past service cost of the current period are recognized immediately. Similarly, net actuarial gains of the current period after the deduction of past service cost of the current period exceeding any increase in the present value of the economic benefits stated above are recognized immediately if the asset is measured at the aggregate of cumulative unrecognized net actuarial losses and past service cost and the present value of economic benefits available in the form of refunds from the plan or reductions in the future contributions to the plan. If there is no change or decrease in the present value of the economic benefits, the entire net actuarial gains of the current period after the deduction of past service cost of the current period are recognized immediately. The Group has defined benefit pension plan, which requires contributions to be made to a separately administered fund. The cost of providing benefits under the defined benefit plan is determined by using the projected unit credit actuarial valuation method. Actuarial gains and losses are recognized as income or expense when the net cumulative unrecognized actuarial gains and losses for each individual plan at the end of the previous reporting year exceeded 10% of the higher of the defined benefit obligation and the fair value of plan assets at that date. These gains or losses are recognized over the expected average remaining working lives of the employees participating in the plan.
Termination benefits Termination benefits are payable when employment is terminated by the Group before the normal retirement date, or whenever the employee accepts voluntary redundancy in exchange for these benefits.
Compensated absences Compensated absences are recognized for the number of paid leave days (including holiday entitlement) remaining at the end of the financial reporting period. Operating Lease Group as a lessee Leases of assets under which the lessor effectively retains all the risks and reward of ownership are classified as operating lease. Operating lease payments are recognized as expense in the consolidated statements of income on a monthly basis based on the contractual agreement. Associated costs such as repairs and maintenance and business taxes are expense when incurred. Group as a lessor Leases where the Group does not transfer substantially all the risks and benefits of the ownership of the assets are classified as operating leases. Operating lease receipts are recognized in the consolidated statements of income on a straight line basis over the lease term. Borrowing Cost Borrowing costs that are directly attributable to the acquisition or construction of a qualifying asset while the asset, which includes intangibles and property and equipment, is being constructed are capitalized as part of the cost of that asset. Capitalization of borrowing cost should commence when: (i) expenditures for the asset and borrowing costs are being incurred; and (ii) activities that are necessary to prepare the asset for its intended use or sale are in progress. Capitalization ceases when the asset is substantially ready for its intended use or sale. If active development is interrupted for an extended period, capitalization is suspended. When construction occurs piecemeal and use of each part is possible as construction continues, capitalization of each part ceases upon substantial completion of that part. For borrowing associated with a specific asset, the actual rate on that borrowing is used. Otherwise, a weighted average cost of borrowing is used. All other borrowing costs are expensed as incurred.

- 47 -
Foreign Currency Transactions The consolidated financial statements are presented in Philippine Pesos, which is the Group’s functional and presentation currency. Items included in the consolidated financial statements of each entity are measured using the functional currency. Transactions in foreign currencies are initially recorded in the functional currency rate prevailing at the date of the transaction. Monetary assets and liabilities denominated in foreign currencies are restated at the functional currency rate of exchange as of the financial reporting date. Gains or losses arising from these transactions and translations are recognized in the consolidated statements of income. Non-monetary items measured at fair value in a foreign currency are translated using the exchange rates at the date when the fair value was determined. Income Tax Income taxes represent the sum of the tax currently due and deferred tax. The tax currently due is based on taxable income for the year. Taxable income differs from income as reported in the consolidated statements of income because it excludes items of income or expenses that are taxable or deductible in other years and it further excludes items that are never taxable or deductible. The Group’s liability for current income tax is calculated using tax rates that have been enacted or substantively enacted at the end of financial reporting period. Deferred tax is provided, using the liability method. Deferred tax assets and liabilities are recognized for future tax consequence attributable to differences between the financial reporting bases of assets and liabilities and their related tax bases. Deferred tax assets are recognized for all deductible temporary differences, carry forward benefit of unused tax credits from excess minimum corporate income tax (MCIT) and carry forward benefit of unused net operating loss carryover (NOLCO), to the extent that it is probable that taxable profit will be available against which the deductible temporary difference can be utilized. Deferred tax liabilities are recognized for all taxable temporary differences. Deferred tax assets and liabilities are measured using the tax rate that is expected to apply to the period when the asset is realized or the liability is settled. The carrying amount of deferred tax assets is reviewed at each end of financial reporting period and reduced to the extent that it is no longer probable that sufficient taxable profit will be available to allow all or part of the deferred income tax assets to be utilized. Related Party Transactions Transactions between related parties are based on terms similar to those offered to non-related parties. Parties are considered to be related if one party has the ability, directly or indirectly, to control the other party or exercise significant influence over the other party in making financial and operating decisions and the parties are subject to common control or common significant influence. Related parties may be individuals or corporate entities. Provisions A provision is recognized when the Group has a present obligation (legal or constructive) as a result of past event, it is probable that an outflow of resources embodying economic benefits will be required to settle the obligation, and a reliable estimate can be made of the amount of the obligation. If the effect of the time value of money is material, provisions are determined by discounting the expected the expected future cash flows at a pre-tax rate that reflects current market assessment of the time value of money and, where appropriate, the risks specific to the liability. Where discounting is used, the increase in the provision due to passage of time is recognized as a borrowing cost. Contingencies Contingent liabilities are not recognized in the consolidated financial statements. They are disclosed unless the possibility of an outflow of resources embodying economic benefits is remote. A contingent asset is not recognized in the consolidated financial statements but disclosed when an inflow of economic benefit is probable.

- 48 -
Equity Share capital is determined using the nominal value of shares that have been issued. Additional paid-in capital includes any premiums received on the initial issuance of capital stock. Any transaction costs associated with the issuance of shares are deducted from additional paid-in capital, net of any related income tax benefits. Net unrealized gain on available-for-sale investment accounts for the excess of the fair market value over the carrying amounts of these investments. When fluctuation is deemed permanent, the gain or loss resulting from such fluctuation will be reversed and charged to consolidated statements of income in the year that the permanent fluctuation is determined. Treasury shares are stated at the cost of re-acquiring such shares. Retained earnings include all current and prior period results as disclosed in the consolidated statements of income. Noncontrolling Interests Noncontrolling interest represents the interest in a subsidiary, which is not owned, directly or indirectly through subsidiaries, by the Group. If losses applicable to the minority interest in a subsidiary exceed the minority interest’s equity in the subsidiary, the excess, and any further losses applicable to the minority interest, are charged against the majority interest except to the extent that the minority has a binding obligation to, and is able to, make good the losses. If the subsidiary subsequently reports profits, the majority interest is allocated all such profits until the minority interest’s share of losses previously absorbed by the majority interest has been recovered. Earnings per share Basic earnings per share is determined by dividing net income for the year by weighted average number of common shares outstanding during the year (after retroactive adjustment for any stock dividends declared in the current year). Diluted EPS is computed by dividing net income for the year by the weighted average number of common shares issued and outstanding during the year after giving effect to assumed conversion of potential common shares. In determining both the basic and diluted earnings per share, the effect of stock dividends, if any, is accounted for retroactively.
Segment reporting For management purposes, the Group is organized into seven (7) major operating businesses which comprise the bases on which the Group reports its primary segment information. Financial information on business segments is presented in Note 35. The Group has no geographical segments as all of the companies primarily operate only in the Philippines. Segment revenue, expenses and performance include transfers between business segments. The transfers are accounted for at competitive market prices charged to unaffiliated customers for similar products and services. The measurement policies the Group used for segment reporting are the same as those used in the consolidated financial statements. There have been no changes from prior periods in the measurement methods used to determine profit and loss. No asymmetrical allocations have been applied between segments. Inter-segment assets, liabilities, revenue, expenses and results are eliminated in the consolidated financial statements.

- 49 -
Events After End of Financial Reporting Period Post year-end events that provide additional information about the Group’s position at the end of financial reporting period, if any, are reflected in the consolidated financial statements. However, post year-end events that are not adjusting events are disclosed in the notes to the consolidated financial statements when material.
5. Significant Accounting Judgments, Estimates and Assumptions
The preparation of the Group’s consolidated financial statements in conformity with PFRS requires management to make estimates and assumptions that affect the amounts reported in the consolidated financial statements and accompanying notes. The estimates and assumptions used in the accompanying consolidated financial statements are based upon management’s evaluation of relevant facts and circumstances as of date of the consolidated financial statements. Actual results could differ from such estimates. The following is a summary of these significant estimates and judgments and the related impact and associated risks on the consolidated financial statements. Judgments • Determination of Control.
The Parent Company determines control when it is exposed, or has rights, to variable returns from its involvement with an entity and has the ability to affect those returns through its power over the equity. The Parent Company controls an entity if and only if the Parent Company has all of the following:
• Power over the entity; • Exposure, or rights, to variable returns from its involvement with the entity; and, • The ability to use its power over the entity to affect the amount of the Parent Company's returns.
The Parent Company regularly reassesses whether it controls an investee if facts and circumstances indicate that there are changes to one or more of the three elements of control listed above.
• Real Estate Revenue and Cost Recognition
In determining whether economic benefits will flow to the Group and the revenue can be reliably measured, the Group assesses certain judgments based on buyers’ commitment on sale which may be ascertained through the significance of the buyer’s initial down payment, and stage of completion of the project development. Total costs of property development are based on cost estimates made by the Group’s technical personnel made in concurrence with management. These estimated costs are reviewed at least annually and are updated if expectations differ from previous estimates. Changes are mainly due to adjustments in development plan, materials and labor prices. Also, the Group’s revenue recognition policies require management to make use of estimates and assumptions that may affect the reported amounts of revenue and costs. The Group’s revenue from real estate sales are recognized based on the percentage-of-completion and the completion rate is measured principally on the basis of the estimated completion of a physical proportion of the contract work, and by reference to the actual costs incurred to date over the estimated total costs of projects. Revenue and costs from sale of real estate are shown in Notes 22 and 25, respectively.
• Classification of Financial Instruments
The Group classifies a financial instrument, or its component parts, on initial recognition financial liability or an equity instrument in accordance with the substance of the contractual definitions of a financial asset, a financial liability or an equity instrument. The substance rather than its legal form, governs its classification in the consolidated statements of financial position.

- 50 -
• Classification of Leases The Group has entered into various lease agreements as either a lessor or a lessee. Critical judgment was exercised by management to distinguish each lease agreement as either an operating or finance lease by looking at the transfer or retention of significant risk and rewards of ownership of the properties covered by the agreements. Currently, all of the Group’s lease agreements are determined to be operating leases. Rental expense and income for the first quarter of 2014 and 2013 are shown in Notes 26 and 28, respectively.
• Distinction Between Investment Property and Owner-Occupied Property The Group determines whether a property qualifies as investment property. In making its judgment, the Group considers whether the property generates cash flows largely independent of the other assets held by an entity. Owner-occupied properties generate cash flows that are attributable not only to property but also to the other assets used in the supply process.
Some properties are held to earn rentals or for capital appreciation and other properties are held for use in rendering of services or for administrative purposes. If these portions cannot be sold separately, the property is accounted for as investment property only if an insignificant portion is held for use in providing services or for administrative purposes. Judgment is applied in determining whether ancillary services are so significant that a property does not qualify as investment property. The Group considers each property in making its judgment.
• Determination of Fair Value of Financial Instruments The Group carries certain financial assets and liabilities at fair value, which requires extensive use of accounting estimates and judgment. While significant components of fair value measurement were determined using verifiable objective evidence, the amount of changes in fair value would differ if the Group utilized different valuation methodologies and assumptions. Any changes in fair value of these financial assets and liabilities would affect income and loss and equity.
The summary of the carrying values and fair values of the Group’s financial instruments as of June 30, 2014 and December 31, 2013 is shown in Note 31.
Estimates
• Estimation of Allowances for Doubtful Accounts
Recoverability of specific receivables including amounts due from related parties is evaluated based on the best available facts and circumstances, the length of the Group’s relationship with its debtors, the debtors’ payment behavior and known market factors. These specific reserves are reevaluated and adjusted as additional information received affects the amount estimated to be uncollectible. The Group’s allowance for doubtful accounts amounted to P=0.6 million as of June 30, 2014 and December 31, 2013 (see Note 7). The carrying values of accounts receivables, notes receivable and amounts due from related parties as of June 30, 2014 and December 31, 2013 are shown in Notes 7, 8 and 20, respectively.
• Estimation of Impairment of Financial Assets The computation for the impairment of available-for-sale financial assets and refundable deposits requires an estimation of the present value of the expected future cash flows and the selection of an appropriate discount rate. An impairment issue arises when there is an objective evidence of impairment, which involves significant judgment. In making this judgment, the Group evaluates the financial health of the issuer, among others. In the case of available-for-sale equity instruments, the Group expands its analysis to consider changes in the issuer’s industry and sector performance, legal and regulatory framework, changes in technology, and other factors that affect the recoverability of the Group’s investments. No impairment losses on financial assets were recognized in the first quarter of 2014 and 2013.

- 51 -
• Estimation of Useful Lives of Certain Assets The Group estimates the useful lives of investment properties, property and equipment and intangible assets based on the period over which the assets are expected to be available for use. The estimated useful lives of these assets are reviewed periodically and are updated if expectations differ from previous estimates due to physical wear and tear, technical or commercial obsolescence and legal or other limits on the use of the assets. In addition, the estimation of the useful lives of these assets is based on collective assessment of internal technical evaluation and experience with similar assets. It is possible, however, that future results of operations could be materially affected by changes in estimates brought about by any changes in factors mentioned. The amounts and timing of recorded expenses for any period would be affected by changes in these factors and circumstances. A reduction in the estimated useful lives of investment properties, property and equipment and intangible assets would increase recorded operating expenses and decrease noncurrent assets. There were no significant changes on the estimated useful lives of the above mentioned assets. The carrying value of the Group’s investment properties, depreciable property and equipment, and leasehold rights amounted to P=287.0, P=417.3 and P=605.4, respectively as of June 30, 2014 and P=296.0 million, P=396.9 million and P=36.9 million, respectively as of December 31, 2013 (see Notes 13, 14 and 17). As of June 30, 2014 and December 31, 2013, the Group’s property and equipment have no residual values.
• Determination of Net Realizable Value of Inventories The Parent Company uses the fair value to determine how much it could gain by selling its real estate held-for-sale inventories, agricultural produce and other inventories. The net realizable value is calculated in an effort to prevent the Parent Company from under or overestimating the value of its real estate held-for-sale inventories, agricultural produce and other inventories.
• Impairment of Non-financial Assets The Group reviews inventories, land and improvements, investment properties, property and equipment, biological assets, leasehold rights and other assets for impairment of value. This includes considering certain indications of impairment such as significant changes in asset usage, significant decline in assets’ market value, obsolescence or physical damage of an asset, plans in the real estate projects, significant underperformance relative to expected historical or projected future operating results and significant negative industry or economic trends. As described in the accounting policy, the Group estimates the recoverable amount as the higher of the net selling price and value in use. In determining the present value of estimated future cash flows expected to be generated from the continued use of the assets, the Group is required to make estimates and assumptions that may affect land and improvements, investment properties, property and equipment, biological assets and other assets. The Group’s allowance for impairment loss pertaining to an investment property amounted to P=16.1 million and P=15.3 million as of June 30, 2014 and December 31, 2013, respectively (see Note 13). Provision for impairment loss recognized in the consolidated statements of income amounted to P=0.8 million in the first quarter of 2014 and 2013. The carrying amounts of investment properties, property and equipment, biological assets and leasehold rights are disclosed in Notes 13, 14, 16 and 17, respectively.
• Estimation of Pension and Other Retirement Benefits The determination of the Group’s obligation and cost for pension and other retirement benefits is dependent on management’s selection of certain assumptions used by actuaries in calculating such amounts. The assumptions for pension costs and other retirement benefits are described in Note 27, and include among others, expected returns on plan assets and rates of compensation increase. In accordance with PFRS, actual results that differ from our assumptions are accumulated and amortized over future periods and therefore, generally affect the Group’s recognized expense and recorded obligation in such future periods. While management believes that the assumptions are reasonable and appropriate, significant differences in actual experience or significant changes in management assumptions may materially affect the Group’s pension and other retirement obligations.

- 52 -
Retirement benefit costs amounted to P=3.0 million in 2013, P=2.3 million in 2012 and P=2.7 million in 2011. Retirement liability amounted to P=18.8 million as of June 30, 2014 and December 31, 2013, respectively (see Note 27).
• Estimation of Deferred Income Tax Assets and Deferred Tax Liabilities Significant judgment is required in determining provision for income taxes. There are many transactions and calculations for which the ultimate tax determination is uncertain during the ordinary course of business. Where the final tax outcome of these matters is different from the amounts that were initially recorded, such differences will impact the income tax and deferred tax provisions in the period in which such determination is made. The Group’s deferred income tax assets amounted to P=60.6 million and P=55.8 million as of June 30, 2014 and December 31, 2013, respectively (see Note 29). The Group’s deferred tax liabilities amounted to P=91.6 million and P=85.0 million as of June 30, 2014 and December 31, 2013, respectively (see Note 29).
• Estimation of Provisions for Contingencies The Group is a party to certain lawsuits involving recoveries of sum of money arising from the ordinary course of business. The estimate of the probable costs for the resolution of possible claims has been developed in consultation with outside counsel handling the Group’s defense in these matters and is based upon an analysis of potential results. These are recognized in the books only when the claims are finally settled or when judgment is rendered. There is no provision for probable losses recognized in the consolidated financial statements in 2013, 2012 and 2011.
• Estimation of Fair Value of Biological Assets and Agricultural Produce The total estimated production of the Company’s biological assets is based on the expected crop yield over its expected lifespan which patterned on the scientific studies conducted on neighboring countries wherein similar biological assets are also grown. Unit-of-harvest method is used in determining the periodic amortization over the estimated yield of the crops over its life span. As of June 30, 2014 and December 31, 2013, the Group’s biological assets have a carrying value of P=317.5 million and P=301.7 million, respectively (see Note 16).
6. Cash and Cash Equivalents This account consists of:
As of 06/30/2014 (Unaudited)
As of 12/31/2013
(Audited) Cash on hand P= 922,310 P= 889,386 Cash in banks 24,100,160 91,676,995 Cash equivalents 504,035 38,558,009 P=25,526,505 P=131,124,390 Cash in banks pertain to savings and current account that generally earn interest rates based on prevailing bank deposit rates of approximately 0.25% to 0.65% per annum in 2013, 2012 and 2011. The Group’s cash in banks include dollar-denominated accounts with Peso equivalent amounting to P=422,530 and P=812,383 as of June 30, 2014 and December 31, 2013, respectively. The Group’s foreign currency denominated cash account is translated to Peso equivalents using an exchange rate of P=43.780/$1.00 and P=41.414/$1.00 as at June 30, 2014 and December 31, 2013, respectively. Cash equivalents include short-term money market placements placed by the Group in a local bank. These have a maturity of less than 90 days with an interest of 3.5% to 4.0% per annum.

- 53 -
Financial income recognized in the consolidated statements of income on cash in banks and cash equivalents amounted to P=0.19 million and P=3.04 million for the quarters ending June 30, 2014 and June 30, 2013 respectively (see Note 23).
7. Accounts Receivable
This account consists of:
As of 06/30/2014 (Unaudited)
As of 12/31/2013
(Audited) Contract receivables on sale of real estate P= 385,915,731 P=385,894,180 Trade receivable 44,729,093 23,303,944 Accrued interest receivable (Note 8) 66,111 102,415 Advances to officers and employees 1,741,714 1,011,272 Others 104,481,203 107,260,647 Total receivables 536,933,852 517,572,458 Allowance for doubtful accounts (594,849) (595,117) 536,339,003 516,977,341 Noncurrent portion of receivables:
Contract receivables on sale of real estates 258,921,055 205,093,873
P= 277,417,948 P=311,883,468
Contract receivables on sale of real estate represent amounts due and collectible in monthly installment over a period of 5 to 15 years, and bear interest ranging from less than 10% to 18% in 2014 and 2013. The transfer certificates of title remain in the possession of the Group until full payment has been made by the customers.
Interest income on contract receivables on sale of real estate amounted to P=4.7 million and P=6.2 million for the second quarter in 2014 and 2013, respectively. No contract receivables on sale of real estate are collateralized as of June 30, 2014 and December 31, 2013. Accrued interest receivable includes interest from contract receivables, notes receivable and loans receivable.
Other receivables are interest-free. These include receivables from various companies for the sale of available-for-sale investments in 2008.
Other receivables amounting to P=0.6 million as of June 30, 2014 and December 31, 2013, were impaired and fully provided for. There was no additional provision for doubtful accounts in 2013. Allowance for doubtful accounts amounting to P=268 and P=1,492 were recovered in the second quarter of 2014 and in the year 2013.
8. Notes Receivable
On July 30, 2010, the Group granted a loan to Xavier Sports and Country Club, Inc. (XSCCI), an affiliate amounting to P=1.0 million and bears an interest of 10% per annum and collectible within one (1) year for twelve monthly equal installments. The loan was extended for one year until July 30, 2012 and was fully paid on the same year. In January 2013, the Parent Company granted a loan to XSCCI amounting to P=1.0 million and bearing the same interest rate of 10% per annum and collectible within one (1) year for twelve monthly equal installments. The loan was fully paid in December 2013. Subsequent to this, the Parent Company extended two other loans to XSCCI amounting to P=394,674 and P=200,000 last February 2013 and July 2013 respectively. All of these were fully paid in December 2013.

- 54 -
In January 2014, the Parent Company granted a loan to XSCCI amounting to P=2.0 million and bearing the same interest rate of 10% per annum and collectible within one (1) year for twelve monthly equal installments. Total collections made from loans to XSCCI in 2014 amounted to P=644,663. Total collections made from loans to XSCCI amounted to P=920,417, P=329,583 and P=1,250,000 in 2012, 2011 and 2010, respectively. Interest income on the notes receivable amounted to P=58,664, P=73,994 and P=15,050 in 2014, 2013 and 2012, respectively. On February 2, 2012, the Group granted a noninterest-bearing loan to a third party debtor amounting to P=7 million payable on or before December 31, 2014. The debtor has the option to prepay in partial or full after the first year of the loan without a pre-termination penalty.
The loan was discounted at the prevailing interest rate applicable to the Group. The carrying value of this loan is presented below:
As of
06/30/2014(Unaudited)
As of 12/31/2013
(Audited) Principal P=7,000,000 P=7,000,000 Less collections during the period 30,000 – 6,970,000 7,000,000 Discount on loans receivable: Balance at January 1 367,172 715,084 Amortization for the period/year 181,911 347,912 Balance at end of the period/year 185,261 367,172 P=6,784,739 P=6,632,828
9. Real Estate Held for Sale
Real estate held for sale represents land and development costs of various projects in Cagayan de Oro City, Valencia City, Bukidnon and Butuan detailed as follows:
As of
06/30/2014(Unaudited)
As of 12/31/2013
(Audited) Land P= 317,366,818 P=317,366,818 Development Cost 318,309,426 336,381,274 Construction materials 130,609,650 122,654,919 P= 766,285,894 P=776,403,011
Real estate held for sale with carrying value of P=671.0 as of June 30, 2014 and December 31, 2013 are collateralized to the loans obtained from UCPB, BPI, BPIF and UBP (see Note 20). In 2012, the Group also reclassified real estate held for sale with a total cost of P=23.1 million into land and improvements (see Note 15). In 2013, the Group reclassified land with a total cost of P=10.5 million from land and improvements. Also, in 2013 the Group reclassified real estate held for sale with a total cost of P=173.3 million to land and improvements (see note 15). In 2014, a total of P=20.2 million was reclassified from real estate held for sale to land and improvements (see Note 15).

- 55 -
10. Prepaid Expenses and Other Current Assets This account consists of:
As of 06/30/2014 (Unaudited)
As of 12/31/2013
(Audited) Creditable withholding taxes P= 65,272,282 P= 57,067,754 Deposit for land acquisition 103,525,341 101,028,906 Prepaid expenses 50,941,235 48,019,647 Refundable deposits 30,804,238 26,719,819 Inventories 11,965,637 12,195,541 Value-added input taxes 10,428,964 9,542,946 Others 551,468 917,445 P=273,489,165 P=255,492,058 In 2011, the Group entered into several contracts to sell with several sellers of land. Installments made by the Group to the sellers were presented as deposit for land acquisition as the Transfer Certificates of Title were not yet transferred to the name of the Group. Also in 2012 and 2011, the Group paid for refundable deposits totaling to P=45.7 million which pertains to payments made by the Group in connection with its engagement to a third party to look for suitable parties for the Group to enter into a joint venture agreement for acceptable plant facilities. Such payment will be used to answer for the out-of-pocket expenses incurred in relation to and during the engagement. The entire balance was refunded in 2013 when the third-party failed to find a suitable party for the Group to enter into a joint venture agreement.
11. Available-for-Sale Investments
The rollforward analysis of the net carrying value of this account is shown below: As of June 30, 2014 (Unaudited) Golf, Sports and
Country Clubs Non-listed
Companies Listed
Companies Total Carrying value:
Balance at beginning of year P=280,569,601 P=505,064,248 P=128,626,968 P=914,260,817 Additions 50,000 – – 50,000 Unrealized gain – – 84,166,542 84,166,542 Balance at end of period P=280,619,601 P=505,064,248 P=212,793,510 P=998,477,359
As of December 31, 2013 (Audited) Golf, Sports and
Country Clubs Non-listed
Companies Listed
Companies Total Carrying value:
Balance at beginning of year P=279,780,001 P=296,094,152 P=131,128,359 P=707,002,512 Additions 789,600 – – 789,600 Reclassification – 208,970,096 – 208,970,096 Unrealized loss – – (2,501,391) (2,501,391) Balance at end of year P=280,569,601 P=505,064,248 P=128,626,968 P=914,260,817
Available-for-sale (AFS) investments are stated at fair value. The changes in the fair value are recognized directly in equity, through the consolidated statements of comprehensive income and consolidated statements of changes in equity.
The fair values of AFS investments in listed companies have been determined directly by reference to published prices in active market. Fair values of unquoted equity instruments are determined at the present value of
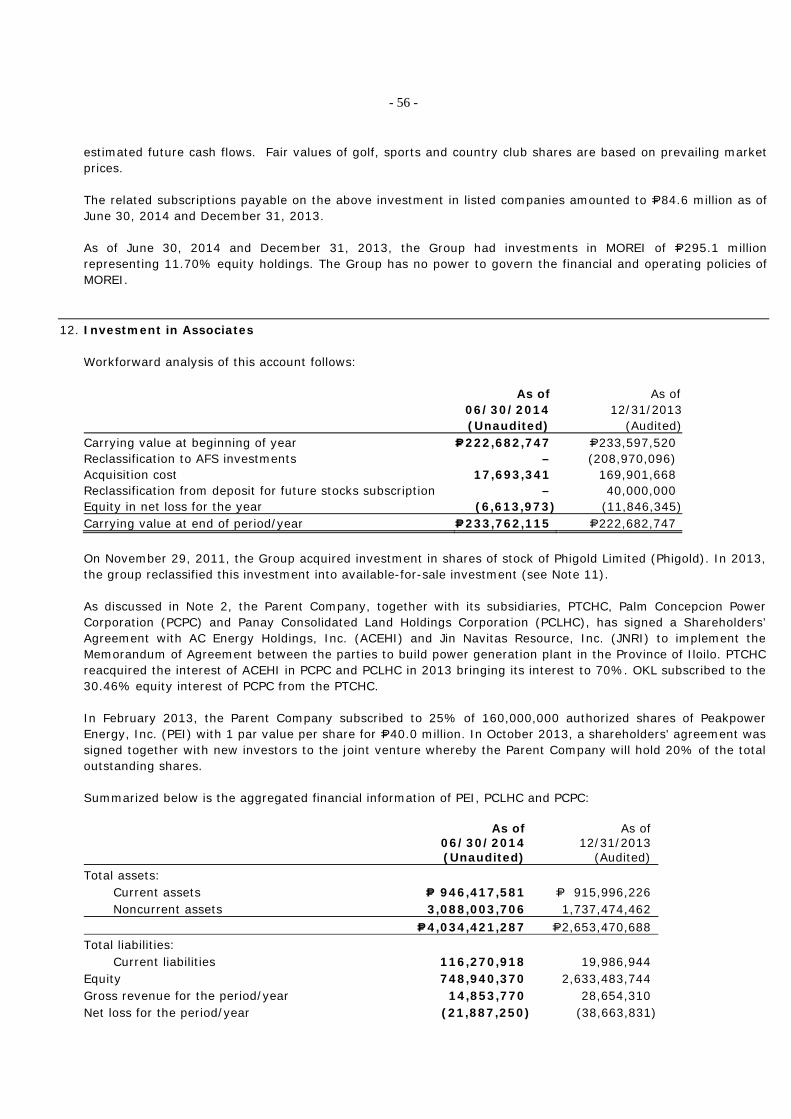
- 56 -
estimated future cash flows. Fair values of golf, sports and country club shares are based on prevailing market prices.
The related subscriptions payable on the above investment in listed companies amounted to P=84.6 million as of June 30, 2014 and December 31, 2013. As of June 30, 2014 and December 31, 2013, the Group had investments in MOREI of P=295.1 million representing 11.70% equity holdings. The Group has no power to govern the financial and operating policies of MOREI.
12. Investment in Associates
Workforward analysis of this account follows:
As of 06/30/2014 (Unaudited)
As of 12/31/2013
(Audited)Carrying value at beginning of year P=222,682,747 P=233,597,520 Reclassification to AFS investments – (208,970,096) Acquisition cost 17,693,341 169,901,668 Reclassification from deposit for future stocks subscription – 40,000,000 Equity in net loss for the year (6,613,973) (11,846,345)Carrying value at end of period/year P=233,762,115 P=222,682,747 On November 29, 2011, the Group acquired investment in shares of stock of Phigold Limited (Phigold). In 2013, the group reclassified this investment into available-for-sale investment (see Note 11). As discussed in Note 2, the Parent Company, together with its subsidiaries, PTCHC, Palm Concepcion Power Corporation (PCPC) and Panay Consolidated Land Holdings Corporation (PCLHC), has signed a Shareholders’ Agreement with AC Energy Holdings, Inc. (ACEHI) and Jin Navitas Resource, Inc. (JNRI) to implement the Memorandum of Agreement between the parties to build power generation plant in the Province of Iloilo. PTCHC reacquired the interest of ACEHI in PCPC and PCLHC in 2013 bringing its interest to 70%. OKL subscribed to the 30.46% equity interest of PCPC from the PTCHC. In February 2013, the Parent Company subscribed to 25% of 160,000,000 authorized shares of Peakpower Energy, Inc. (PEI) with 1 par value per share for P=40.0 million. In October 2013, a shareholders' agreement was signed together with new investors to the joint venture whereby the Parent Company will hold 20% of the total outstanding shares. Summarized below is the aggregated financial information of PEI, PCLHC and PCPC:
As of 06/30/2014 (Unaudited)
As of 12/31/2013
(Audited) Total assets: Current assets P= 946,417,581 P= 915,996,226 Noncurrent assets 3,088,003,706 1,737,474,462 P=4,034,421,287 P=2,653,470,688 Total liabilities: Current liabilities 116,270,918 19,986,944 Equity 748,940,370 2,633,483,744 Gross revenue for the period/year 14,853,770 28,654,310 Net loss for the period/year (21,887,250) (38,663,831)

- 57 -
13. Investment Properties
This account consists of:
As of 06/30/2014 (Unaudited)
As of
12/31/2013 (Audited)
Investment in real estate held for capital appreciation – net P= 224,818,292 P= 231,688,077
Properties held under lease 62,195,297 64,263,265
P= 287,013,589 P= 295,951,342
Investment properties are stated at cost less any impairment. Investment properties have a fair market value of about P=636.8 million as of June 30, 2014 and December 31, 2013, respectively, as determined by an independent firm of appraisers. The excess of the fair market value over the carrying amount of the asset is not recognized in the consolidated financial statements. The rollforward analysis of properties held for capital appreciation as of June 30, 2014 and December 31, 2013 follows:
As of June 30, 2014 Land and
improvements Building Total Cost:
Balance at beginning of year P=216,441,272 P=30,532,805 P= 246,974,077 Disposal (9,537,006) – (9,537,006) Reclassifications 3,431,522 – 3,431,522 Balance at end of peiod 210,335,788 30,532,805 240,868,593
Allowance for impairment loss: Balance at beginning of year – 15,286,001 15,286,001 Additions – 764,300 764,300 Balance at end of period – 16,050,301 16,050,301
Net book value P=210,335,788 P= 14,482,504 P= 224,818,292
As of December 31, 2013 (Audited) Land and
improvements Building Total Cost:
Balance at beginning of year P=216,238,950 P=30,532,806 P=246,771,756 Additions 202,322 – 202,322 Balance at end of year 216,441,272 30,532,806 246,974,078
Allowance for impairment loss: Balance at beginning of year – 13,757,401 13,757,401 Additions – 1,528,600 1,528,600 Balance at end of year – 15,286,001 15,286,001
Net book value P=216,441,272 15,246,805 231,688,077 Land and improvements amounting to P=61.9 million from a former subsidiary was deconsolidated in 2012. In 2012, the Group reclassified investment properties amounting to P=109.0 million, P=26.8 million and P=0.3 million into land and improvements, real estate held for sale and property and equipment, respectively (see Notes 9, 14 and 15). In 2014, the Group sold a parcel of land in Quezon City costing P=3.43 million and in Nueva Ecija costing P=6.11 million. The property in Quezon City was previously classified as property and equipment (see Note 14 and 22).

- 58 -
The provision for impairment loss of P=0.8 million in 2014 and P=1.5 million in 2013 represents the write-down of an unfinished building to its estimated net recoverable amount. The details of the properties held under lease follows:
As of June 30, 2014 (Unaudited)
Land Building and
improvements Total Cost:
Balance at beginning of year and end of period P=25,538,133 P=134,673,524 P=160,211,657
Accumulated depreciation:
Balance at beginning of year – 95,948,392 95,948,392 Additions – 2,067,968 2,067,968 Balance at end of period – 98,016,360 98,016,360
Net book value P=25,538,133 P= 36,657,164 P= 62,195,297
As of December 31, 2013 (Audited)
Land Building and
improvements Total Cost:
Balance at beginning and end of year P=25,538,133 P=134,673,524 P=160,211,657
Accumulated depreciation:
Balance at beginning of year – 88,644,919 88,644,919 Additions – 7,303,473 7,303,473 Balance at end of year – 95,948,392 95,948,392
Net book value P=25,538,133 P=38,725,132 P=64,263,265 Rental income generated from investment properties held under lease amounted to P=2.34 million and P=1.88 million for the second quarter of 2014 and 2013, respectively.
14. Property and Equipment - net
The carrying value of this account is as follows:
As of 06/30/2014 (Unaudited)
As of
12/31/2013 (Audited)
Land P= 12,967,297 P= 16,398,819 Land improvements 1,217,657 1,538,174 Building and improvements 33,720,141 34,554,571 Leasehold improvements 610,040 798,334 Machinery and equipment 146,374,718 158,018,663 Furniture, fixtures and equipment 5,354,569 6,250,707 Transportation equipment 15,691,468 18,162,270 Tools and other equipment 263,485 369,576 Other fixed assets 17,784,182 19,059,627 Construction in progress 183,344,607 141,712,950 P=417,328,164 P=396,863,691

- 59 -
Rollforward analysis of this account is shown below:
As of June 30, 2014 (Unaudited)
Balance at beginning of year
Additions/ Depreciations
Reclassification/ Disposals
Balance at end of period
Cost: Land P=16,398,819 P=– P= (3,431,522) P= 12,967,297 Land improvements 3,572,029 – – 3,572,029 Building and improvements 84,700,026 1,803,808 (3,006) 86,500,828 Leasehold improvements 2,773,453 55,828 – 2,829,281 Machinery and equipment 276,765,409 492,622 (95,960) 277,162,071 Furniture, fixtures and equipment 28,370,803 428,966 – 28,799,769 Transportation equipment 59,495,614 1,370,030 (835,446) 60,030,198 Tools and other equipment 3,007,498 146,005 3,153,503 Construction in progress 141,712,950 42,673,287 (1,041,630) 183,344,607 Other fixed assets 38,141,556 2,751,433 40,892,989
654,938,157 49,721,979 (5,407,564) 699,252,572
Accumulated depreciation and
amortization:
Land improvements 2,033,855 320,517 – 2,354,372 Building and improvements 50,145,455 2,635,232 – 52,780,687 Leasehold improvements 1,975,119 244,122 – 2,219,241 Machinery and equipment 118,746,746 12,136,567 (95,960) 130,787,353 Furniture, fixtures and equipment 22,120,096 1,325,104 – 23,445,200 Transportation equipment 41,333,344 3,659,817 (654,432) 44,338,729 Tools and other equipment 2,637,922 252,096 – 2,890,018 Other fixed assets 19,081,929 4,026,879 – 23,108,808
258,074,466 24,600,334 (750,392) 281,924,408
Net Book Value P=396,863,691 P=25,121,645 (4,657,172) P=417,328,164
As of December 31, 2013 (Audited)
Balance at beginning of year
Additions/ Depreciations
Disposals
Reclassification
Balance at end of year
Cost: Land P=16,398,819 P=– P=– P=– P=16,398,819 Land improvements 3,572,029 – – – 3,572,029 Building and improvements 75,712,154 13,417,017 (4,429,145) – 84,700,026 Leasehold improvements 2,432,436 341,017 – – 2,773,453 Machinery and equipment 271,150,626 6,024,783 (410,000) – 276,765,409 Furniture, fixtures and equipment 22,656,952 5,817,865 (104,014) – 28,370,803 Transportation equipment 56,383,708 7,688,209 (4,576,303) – 59,495,614 Tools and other equipment 2,455,726 574,540 (22,768) – 3,007,498 Other assets 21,572,951 8,046,185 (12,590) 8,535,010 38,141,556 Construction in progress 66,302,998 95,744,633 (11,799,671) (8,535,010) 141,712,950
538,638,399 137,654,249 (21,354,491) – 654,938,157
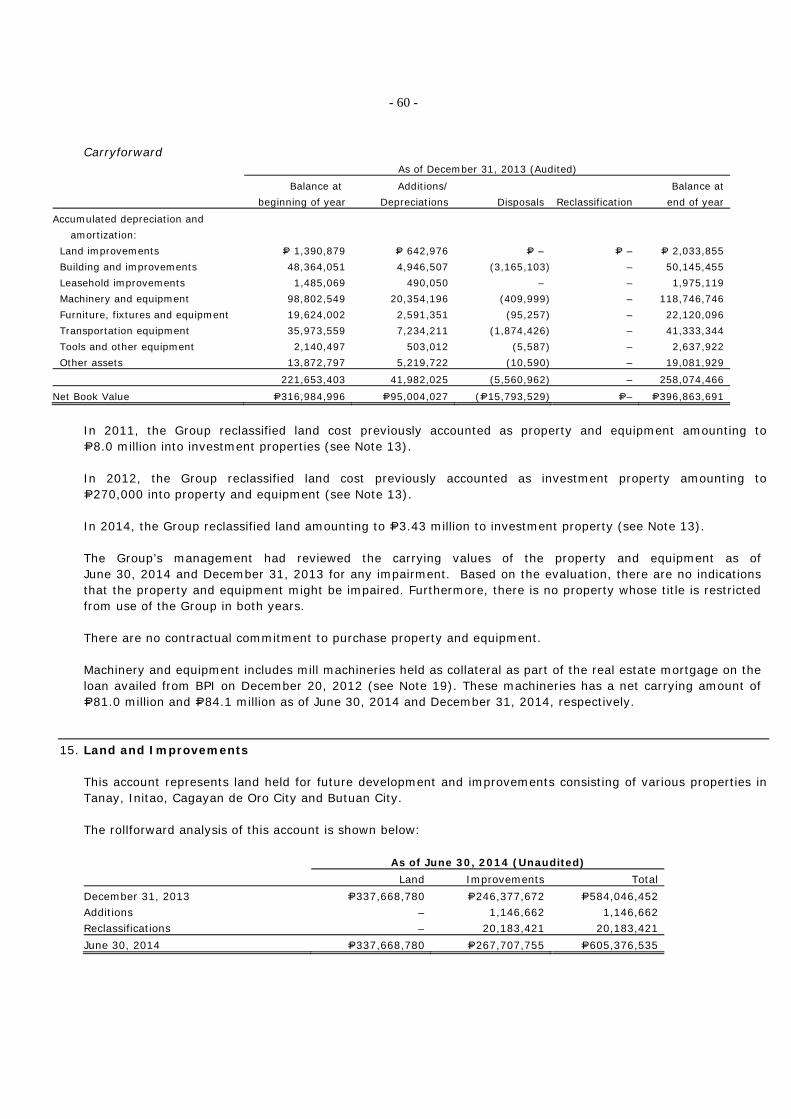
- 60 -
Carryforward As of December 31, 2013 (Audited)
Balance at beginning of year
Additions/ Depreciations
Disposals
Reclassification
Balance at end of year
Accumulated depreciation and amortization:
Land improvements P= 1,390,879 P= 642,976 P= – P= – P= 2,033,855 Building and improvements 48,364,051 4,946,507 (3,165,103) – 50,145,455 Leasehold improvements 1,485,069 490,050 – – 1,975,119 Machinery and equipment 98,802,549 20,354,196 (409,999) – 118,746,746 Furniture, fixtures and equipment 19,624,002 2,591,351 (95,257) – 22,120,096 Transportation equipment 35,973,559 7,234,211 (1,874,426) – 41,333,344 Tools and other equipment 2,140,497 503,012 (5,587) – 2,637,922 Other assets 13,872,797 5,219,722 (10,590) – 19,081,929
221,653,403 41,982,025 (5,560,962) – 258,074,466
Net Book Value P=316,984,996 P=95,004,027 (P=15,793,529) P=– P=396,863,691
In 2011, the Group reclassified land cost previously accounted as property and equipment amounting to P=8.0 million into investment properties (see Note 13). In 2012, the Group reclassified land cost previously accounted as investment property amounting to P=270,000 into property and equipment (see Note 13). In 2014, the Group reclassified land amounting to P=3.43 million to investment property (see Note 13).
The Group’s management had reviewed the carrying values of the property and equipment as of June 30, 2014 and December 31, 2013 for any impairment. Based on the evaluation, there are no indications that the property and equipment might be impaired. Furthermore, there is no property whose title is restricted from use of the Group in both years.
There are no contractual commitment to purchase property and equipment. Machinery and equipment includes mill machineries held as collateral as part of the real estate mortgage on the loan availed from BPI on December 20, 2012 (see Note 19). These machineries has a net carrying amount of P=81.0 million and P=84.1 million as of June 30, 2014 and December 31, 2014, respectively.
15. Land and Improvements This account represents land held for future development and improvements consisting of various properties in Tanay, Initao, Cagayan de Oro City and Butuan City. The rollforward analysis of this account is shown below: As of June 30, 2014 (Unaudited) Land Improvements Total
December 31, 2013 P=337,668,780 P=246,377,672 P=584,046,452 Additions – 1,146,662 1,146,662 Reclassifications – 20,183,421 20,183,421 June 30, 2014 P=337,668,780 P=267,707,755 P=605,376,535

- 61 -
As of December 31, 2013 (Audited) Land Improvements Total
December 31, 2012 P=348,209,055 P=55,387,929 P=403,596,984 Additions – 17,695,874 17,695,874 Reclassifications (10,540,275) 173,293,869 162,753,594 December 31, 2013 P=337,668,780 P=246,377,672 P=584,046,452
In 2012, the Group reclassified land and improvements with a total cost of P=80.2 million into real estate held for sale (see Notes 9). The Group also reclassified in 2012 investment property and real estate held for sale with a total cost of P=109.0 million and P=23.1 million, respectively, into land and improvements (see Notes 9 and 13). In 2013, the Group reclassified land with a total cost of P=10.5 million into real estate held for sale. Also, in 2013 the Group reclassified real estate held for sale with a total cost of P=173.3 million to land and improvements (See note 9).
16. Biological Assets
These represent the fair value of oil palm trees as follows:
As of 06/30/2014 (Unaudited)
As of 12/31/2013
(Audited)
Balance at beginning of year P=315,826,266 P=249,077,511 Additions during the year 15,794,425 66,748,755
End of year/period 331,620,691 315,826,266 Accumulated amortization: Beginning of year/period 14,169,264 11,911,536 Amortization during the year/period - 2,257,728
End of year/period 14,169,264 14,169,264 Balance at end of year P=317,451,427 P=301,657,002 The carrying value of the biological assets in 2014 and 2013 is determined based on the accumulated cost of the biological assets less accumulated amortization and any impairment recognized in prior years. In 2012, the carrying value of the Group’s biological assets is based on its fair value using the cost approach. In 2013, the Group was not able to determine reliably the fair value of its biological assets. Management believes that the change from fair valuation method in 2012 to cost method of valuation in 2013 did not have any material effects in the Group’s financial statements, thus no adjustment was made for such effects. The amortization of biological assets was charged to cost of sales in profit or loss.
17. Leasehold Rights
This account pertains to amounts paid by the Company during the year for the rights to use parcels of land in Salawaga Tingalan, Opol, Misamis Oriental and Tignapoloan, Cagayan de Oro City and to develop them as oil palm commercial plantations (see Note 37).
Rollforward analysis of this account is shown below:
As of 06/30/2014 (Unaudited)
As of 12/31/2013
(Audited) Balance at beginning of year P=41,655,391 P= 41,580,362 Additions during the year - 75,029 41,655,391 41,655,391 Accumulated amortization 5,460,204 4,794,197 Balance at end of period/year P=36,195,187 P=36,861,194
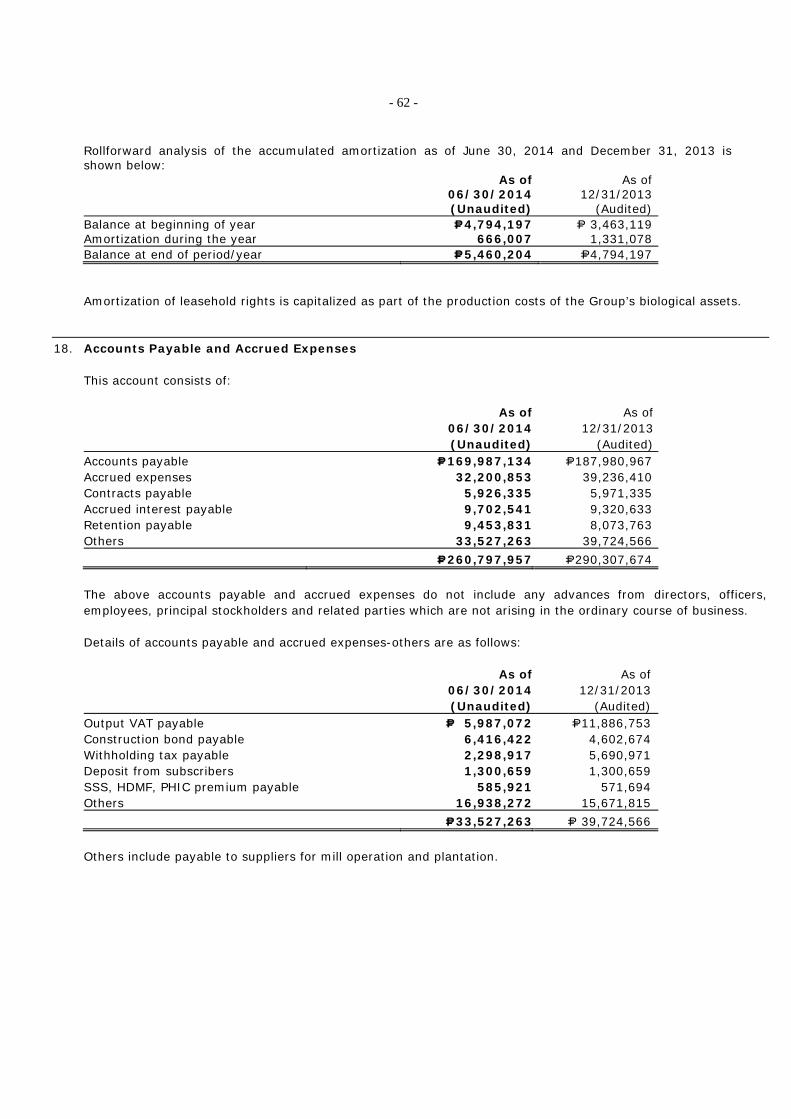
- 62 -
Rollforward analysis of the accumulated amortization as of June 30, 2014 and December 31, 2013 is shown below:
As of 06/30/2014 (Unaudited)
As of 12/31/2013
(Audited) Balance at beginning of year P=4,794,197 P= 3,463,119 Amortization during the year 666,007 1,331,078 Balance at end of period/year P=5,460,204 P=4,794,197 Amortization of leasehold rights is capitalized as part of the production costs of the Group’s biological assets.
18. Accounts Payable and Accrued Expenses This account consists of:
As of06/30/2014(Unaudited)
As of
12/31/2013 (Audited)
Accounts payable P=169,987,134 P=187,980,967 Accrued expenses 32,200,853 39,236,410 Contracts payable 5,926,335 5,971,335 Accrued interest payable 9,702,541 9,320,633 Retention payable 9,453,831 8,073,763 Others 33,527,263 39,724,566 P=260,797,957 P=290,307,674 The above accounts payable and accrued expenses do not include any advances from directors, officers, employees, principal stockholders and related parties which are not arising in the ordinary course of business. Details of accounts payable and accrued expenses-others are as follows:
As of06/30/2014(Unaudited)
As of 12/31/2013
(Audited) Output VAT payable P= 5,987,072 P=11,886,753 Construction bond payable 6,416,422 4,602,674 Withholding tax payable 2,298,917 5,690,971 Deposit from subscribers 1,300,659 1,300,659 SSS, HDMF, PHIC premium payable 585,921 571,694 Others 16,938,272 15,671,815 P=33,527,263 P= 39,724,566
Others include payable to suppliers for mill operation and plantation.

- 63 -
19. Short-term and Long-term Debt
Short-term debt consists of loans obtained from the following:
As of 06/30/2014(Unaudited)
As of 12/31/2013
(Audited) Financial Institutions:
Union Bank of the Philippines(UBP) P=100,000,000 P=100,000,000 China Banking Corporation(CBC) 100,000,000 100,000,000 United Coconut Planters Bank (UCPB) 20,000,000 20,000,000 Philippine Bank of Communications (PBCOM) 65,000,000 -
P=285,000,000 P=220,000,000
The loan from UBP pertains to the term loan availed by the Group amounting to P=100 million in January 2012 and October 2011. The loan bears annual interest rate of 5.5% and will mature one (1) year from the date of availment and was subsequently renewed on December 20, 2013. The loan balance as of June 30, 2014 and December 31, 2013 is unsecured (see Note 9). The loan from CBC pertains to a clean term loan availed by the Group amounting to P=70 million in September 2012 with an interest rate of 6.0%. The Group paid the 2012 loan in 2013 and availed another loans on various dates with interest rate of 5.5%. On March 18, 2013, the Group availed a clean term loan from UCPB amounting to P=20 million payable after one year from the date of availment with 5.75% interest rate. The Group availed another clean term loan on May 8, 2014 from PBCOM amounting to P=65 million payable on April 30, 2015 with interest rate of 5.5%. Long-term debt consists of loans obtained from the following: As of
06/30/2014 (Unaudited)
As of 12/31/2013
(Audited) Financial Institutions:
United Coconut Planters Bank (UCPB) P= 325,478,724 P= 354,242,824 Asia United Bank (AUB) 344,023,000 85,000,000 Bank of the Philippine Islands (BPI) 197,000,000 210,500,000 BPI Family Savings Bank (BPIF) 259,052,227 274,610,126 China Banking Corp. (CBC) 300,000,000 300,000,000 Union Bank of the Philippines (UBP) 291,227,800 296,056,200 1,716,781,751 1,520,409,150
Shareholders 58,213,472 81,391,342
1,774,995,223 1,601,800,492
Less current portion (181,004,750) (110,905,259) P=1,593,990,473 P=1,490,895,233
In August and December of 2011, the Group obtained P=400 million loan from UCPB to refinance its outstanding term loan and finance various real estate development projects. The loan shall have a term which shall expire at the end of ten (10) years from initial date of drawdown and shall bear interest payable quarterly in arrears, based on 3-month Philippine Dealing System Treasury-Fixing rate obtaining at the time of availment, plus a spread of two percent (2.0%) inclusive of Gross Receipt Tax (GRT) or floor rate 5.25% inclusive of GRT per annum whichever is higher, subject to quarterly payment and resetting.

- 64 -
This loan is collateralized by real estate mortgage over the real estate held for sale with a carrying value of P=89.6 million and P=109.0 million as of June 30, 2014 and December 31, 2013, respectively (see Note 9). The loans from BPI were obtained on various dates within 2011 and will mature five (5) years after loan release dates, the last of which being 2016. These bear interest at 3-month Philippine Dealing System Treasury- R2 plus a spread of one and a half percent (1.50%) per annum or the applicable bank floor lending rate at the time of availment, whichever is higher, subject to monthly payment and quarterly resetting, with one time option to fix rate based on 5-year Philippine Dealing System Treasury- R2 rate, plus a spread of one and a quarter percent (1.25%) per annum. The interest rate is currently at 4.75% per annum. These are collateralized by real estate mortgages over the real estate held for sale of the Group with a total carrying value of P=101.1 million and P=94.5 million as of June 30, 2014 and December 31, 2013, respectively. On December 20, 2012, the Group obtained a loan from BPI amounting to P=89.0 million that will mature on December 20, 2019 with an interest rate of 4.75%. This loan is collateralized by a real estate mortgage with a total carrying value of P=86.7 million. The loans from BPIF were obtained on various dates within 2004 to 2012 and will mature ten (10) years after loan release dates, the last of which will be in 2022. These bear interest at the rates ranging from 5.5% to 11.50% per annum. These are collateralized by real estate mortgages over the real estate held for sale of the Group with a total carrying value of P=86.8 million and P=116.3 million as of June 30, 2014 and December 31, 2013 respectively (see Note 9). The Group availed several clean loans from CBC on various dates within February to July 2011 and will mature five (5) years after loan release dates, the last of which will be in 2016. These loans bear interest rate of 7.33% per annum. The loan from UBP pertains to a 7-year loan availed by the Parent Company in 2012, with 3 years grace period on principal. Principal payments of 48 equal monthly amortization will be made starting on the end of the grace period which will start in 2015. Quarterly interest payment in arrears is made for the first 3 years, then monthly payments for the rest of the term. The loan bears interest of 5.56% and is collateralized by the Parent Company’s real estate held for sale assets with carrying amount of P=126.6 million and P=178.2 million as of June 30, 2014 and December 31, 2013. On December 2, 2013, the Group availed loan from AUB amounting to P=85 million that will mature on December 1, 2017 with an interest rate of 5%. On March 27, 2014, additional loan amounting to P=65.0 million was availed from AUB with the same interest rate of 5%. These loans will mature on December 1, 2017 and are collateralized by a real mortgage on the property of the stockholder of Parent Company and real estate mortgage on the Parent Company’s investment properties with net carrying amount of P=0.2 million as of June 30, 2014 and December 31, 2013. The Group availed another loan from AUB amounting to P=180.0 million on January 9, 2014 and P=18.75 million on March 27, 2014. These loans bear an interest rate of 5.5% and are collateralized by the Parent Company’s real estate held for sale assets with carrying amount of P=78.1 million. These loans will mature on January 9, 2019. The loans from shareholders represent a 10-year noninterest-bearing loan with a total principal amount of P=129.28 million availed on various dates from October to November 2012. The loan is repayable in lump sum on or before maturity. The Group recognized discount on loans payable amounting to P=52.97 million in 2012 in the Statements of comprehensive income. Amortization of discount on loans recognized amounted to P=0.91 million in the second quarter of 2014.

- 65 -
20. Related Party Transactions Related party relationship exists when one party has the ability to control, directly, or indirectly through one or more intermediaries, the other party or exercise significant influence over the other party making financial and operating decisions. Such relationship also exists between and/or among entities, which are under common control with the reporting enterprise, or between and/or among the reporting entities and key management personnel, directors, or its shareholders. In considering each possible related party relationship, attention is directed to the substance of relationship and not merely the legal form. For financial statements disclosure purposes, an affiliate is an entity under common control of the Parent Company’s stockholders. The Parent Company enters into transactions with related parties. Outstanding balances at year-end are unsecured and noninterest-bearing and are settled based on agreed upon terms. The following are the related party transactions.
a. Investments and deposits The Group made deposits for future subscription to its affiliates which amounted to P=888,382,779 and P=695,882,779 as of June 30, 2014 and December 31, 2013.
b. Lease of Parent Company’s office space from an affiliate
For the quarters ending June 30 2014 2013
Amount of rent expense P=872,674 P=495,740 Outstanding balances 370,008 330,493
c. Noninterest-bearing loans received from shareholders
The loans from the shareholders represent a 10-year noninterest-bearing loan with a total principal amount of P=129.28 million availed on various dates from October to November 2012. The loan is re-payable in lump sum on or before maturity (see Note 19).
The summary of the above related party transactions follows:
June 30, 2014
Category Amount/Volume Outstanding balance Terms and Condition
Guaranty/Settlement/Provision
Shareholders 1. Loans received
from shareholders
P=129,280,000 P= 58,213,472 Noninterest-bearing and repayable in lump sum on or before maturity after 10 years from 2012
Unsecured; no significant covenants
Affiliates 2. Investments
and deposits Deposits:
P= 95,500,000 Applied to additional
subscription: P= 97,000,000
P=888,382,779 To be applied in equity call
3. Lease of office space from an affiliate
P=872,674 P=370,008 One year subject to annual review and renewable upon mutual agreement of parties; payable in cash every 15th of the month without necessity of demand
No guarantees
4. Collection of notes receivable from an affiliate
P=2,000,000 P= 1,355,337 One year and to be collected in twelve monthly installments at 10% per annum.
No guarantees

- 66 -
June 30, 2013
Category Amount/Volume Outstanding balance Terms and Condition
Guaranty/Settlement/Provision
Shareholders 5. Loans received
from shareholders
P=129,280,000 P=79,273,429 Noninterest-bearing and repayable in lump sum on or before maturity after 10 years from 2012
Unsecured; no significant covenants
Affiliates 6. Investments
and deposits Decrease due to
reconsolidated subsidiaries
P=76,740,000
P=81,900,390 To be applied in equity call
7. Lease of office space from an affiliate
P=495,740 P=330,493 One year subject to annual review and renewable upon mutual agreement of parties; payable in cash every 15th of the month without necessity of demand
No guarantees
8. Collection of notes receivable from an affiliate
P=404,600 P=595,400 One year and to be collected in twelve monthly installments at 10% per annum.
No guarantees
Below are the account balances as of June 30, 2014 and June 30, 2013 on the separate financial statements of the companies within the Group which were eliminated upon consolidation:
• Receivables/Payables
As of June 30, 2014 (Unaudited)
ABCI-Parent
Company ABERDI Total Receivable: ABCI-Parent Company P=– P= 1,083,800 P=1,083,800 BRC 1,975,648 – 1,975,648
P=1,975,648 P=1,083,800 P=3,059,448
As of December 31, 2013 (Audited) Payable ABERDI Andesite Total Receivable: ABCI-Parent Company P=966,048 P=– P=966,048 ABERDI – 649,607 649,607 Bonsai 24,431 – 24,431 Andesite 3,766,237 – 3,766,237
P=4,756,716 P=649,607 P=5,406,323
• Deposits for future stock subscription
As of June 30, 2014 (Unaudited)
Deposits to
Deposits from ABERDI BRC Palm Thermal Nakeen Total
ABCI-Parent Company P= 329,303,228 P= 15,711,000 P= 856,753,000 P=– P=1,201,767,228
ABERDI – – – 254,685,103 254,685,103
P= 329,303,228 P= 15,711,000 P= 856,753,000 P= 254,685,103 P=1,456,452,331

- 67 -
As of December 31, 2013 (Audited)
Deposits from
ABERDI BRC Palm Thermal Nakeen Total
Deposits from
ABCI-Parent Company P=269,303,228 P=14,877,000 P=695,701,000 P=– P=979,881,228
ABERDI – – – 254,685,103 254,685,103
P=269,303,228 P=14,877,000 P=695,701,000 P=254,685,103 P=1,234,566,331
21. Share Capital The details of the number of shares of authorized and subscribed capital stock follows:
As of 06/30/2014 (Unaudited)
As of 12/31/2013
(Audited) Authorized (Note 1) 2,000,000,000 2,000,000,000 Subscribed and issued (Note 1) 1,732,865,522 1,732,865,522
All subscribed shares are issued and outstanding as of June 30, 2014 and December 31, 2013. Movements of the amount of subscribed capital stock and additional paid in capital (APIC) during the quarter ending June 30, 2014 follow: CAPITAL STOCK
Additional paid in capital
Subscribed and issued
Subscribed but not issued Total
Balance as at January 1, 2014 P= 1,732,865,522 P= – P=1,732,865,522 P=586,198,947 Subscriptions (Jan. to June 2014) – – – – Transfer of paid-up shares – – – –
Balance as of June 30, 2014 P= 1,732,865,522 P= - P=1,732,865,522 P=586,198,947
The Securities and Exchange Commission (SEC) issued the following orders related to the Group's registration of its securities: SEC-BED Order No. 1179 issued on December 17, 1993 amounting to P=200,000,000; SEC-BED Order No. 847 issued on August 15, 1994 amounting to P=230,000,000 and SEC-CFD Order No. 64 issued on March 12, 1996 totaling P=530,000,000. Common shares are the only equity securities registered and issued by the Group. As of December 31, 2013 and 2012, there are 2,129 and 2,139 stockholders in the records of the transfer agent, Fidelity Stock Transfers, Inc. (FSTI), respectively. As of June 30, 2014, there are two thousand one hundred twenty-eight (2,128) stockholders in the books of the transfer agent.

- 68 -
22. Sales This account consists of: For the three
months ended 06/30/2014
For the three months ended
06/30/2013 Real estate P=105,814,490 P= 77,902,919 Crude palm oil 59,825,594 10,125,479 Palm seedlings and kernel nuts 3,643,816 1,513,563 Water service income 3,456,903 1,509,025 Hotel operations 1,965,320 1,957,166 Fertilizers 21,250 22,950 P=174,727,373 P=93,031,102
Real estate sales include P=16.1M sale of investment properties in Quezon City and Nueva Ecija (see Note 13).
23. Financial Income
This account consists of: For the three
months ended 06/30/2014
For the three months ended
06/30/2013 Interest from:
Sales of real estate (Note 7) P=4,707,893 P=6,246,670 Cash in banks and cash equivalents (Note 6) 188,422 3,037,933 Notes and loans receivable (Notes 8, 9 and 20) 81,997 32,587
P=4,978,312 P=9,317,190
24. Other Income
This account consists of
For the three months ended
06/30/2014
For the three months ended
06/30/2013 Surcharge income P= 441,075 P= 528,515 Income from forfeited accounts 79,502 310,385 Others 1,819,379 409,085 P=2,339,956 P=1,247,985
Other income includes sale of by-products derived from the production of crude palm oil.
25. Cost of Sales and Services This account consists of: For the three
months ended 06/30/2014
For the three months ended
06/30/2013 Real estate P= 50,400,630 P=40,459,302 Crude palm oil 44,038,027 10,040,458 Hotel operations 3,561,554 2,794,597 Aggregates 1,568,397 1,878,986 Water services 1,254,865 1,073,990 Palm seedlings and kernel nuts 2,529,418 1,054,026 Fertilizers 12,528 13,530 P=103,365,419 P=57,314,889

- 69 -
Cost of sales and services includes depreciation charges and other direct costs (e.g. repairs and maintenance, salaries and wages) related to the Group’s investment properties and property and equipment. For the quarter ending June 30, 2014, cost of real estate sales includes cost of investment property (see Note 13 and 22).
26. General and Administrative Expenses
This account consists of: For the three
months ended 06/30/2014
For the three months ended
06/30/2013 Personnel cost (Notes 20 and 27) P=20,414,749 P=20,364,167 Depreciation and amortization (Notes 13 and 14) 6,685,342 6,590,948 Taxes and licenses 4,972,086 5,005,431 Utilities and supplies 2,163,549 1,989,058 Repairs and maintenance 1,561,757 1,984,284 Rental (Notes 20 and 28) 1,277,524 1,028,340 Entertainment, amusement and recreation 266,434 94,739 Others 10,621,504 12,974,211 P=47,962,945 P=50,031,178
Significant components of other operating expenses follow: For the three
months ended 06/30/2014
For the three months ended
06/30/2013 Security services P= 3,719,606 P=3,467,695 Professional fees 2,980,251 2,353,449 Transportation and travel 1,689,860 2,060,064 Director fees 470,471 930,068 Insurance 155,853 155,707 Training and seminar 145,043 47,174 Subscription and dues 126,332 248,372 Notarization 25,062 51,590 Litigation fees 25,000 96,449 Unrealized foreign exchange gain (loss) 11,136 (44,484) Bank charges 1,593 12,841 Board meetings (89,595) 359,931 Miscellaneous 1,360,892 3,235,355 P=10,621,504 P=12,974,211
Miscellaneous expense includes supervision, regulation and other fees.
27. Retirement Benefits Costs The Group has a funded non-contributory retirement plan covering all regular and full time employees effective July 1, 2002 (anniversary date was amended to take effect every January 1, retroactive 2003). Contribution and cost are determined in accordance with the actuarial studies made for the plan. The Group’s annual contributions to their respective plans consist principally of payments covering the current service cost for the year and the required funding relative to the guaranteed minimum benefits as applicable. Actuarial valuations are made with sufficient regularity.

- 70 -
The principal actuarial assumptions used to determine retirement benefits were as follows: As of
12/31/2013 Discount rate, beginning of year 6.17% Discount rate, end of year 5.65% Expected rate of return on plan assets, beginning of year 5.00% Salary increase rate , beginning of year 5.00% Salary increase rate, end of year 5.00%
28. Lease Agreement
Group as a Lessor The Group leased its various properties under operating lease with various lessees. The term of the lease agreements is for one to five years and is renewable upon the agreement of both parties. The agreements will expire in various dates up to 2014. The agreements account the lessees for all major and minor repairs, business taxes, and charges for water, light, telephone, other utilities expense.
Group as a Lessee The Group entered into an operating lease agreement with a related and nonrelated party for its office space in Cagayan de Oro City and Metro Manila. The term of the lease agreements is for one year and is renewable upon the agreement of both parties. There are no other significant restrictions imposed by lease agreements such as those concerning dividends, additional debt and further leasing.
29. Income Taxes
a. The current income tax expense is composed of MCIT and regular corporate income tax. Components of current income tax reported in the consolidated statements of income follows: 06/30/2014 06/30/2013 12/31/2013
MCIT P=2,387,589 P= 80,000 P= 53,796Regular corporate income tax 1,193,495 13,926,852 11,377,107 P=3,581,084 P=14,006,852 P=11,430,903
b. The components of deferred tax accounts represent the future tax consequence of the following: As of
6/30/2014 (Unaudited)
As of 12/31/2013 (Audited)
Deferred tax assets Tax effects of:
NOLCO P= 40,031,400 P= 37,910,495 Allowance for doubtful accounts 135,967 135,968 Allowance for impairment losses on investment
properties 4,815,090 4,585,800 Unamortized past service cost 2,413,299 2,413,299 Others 10,045,836 10,045,836
MCIT 3,110,941 723,351 P= 60,552,533 P= 55,814,749
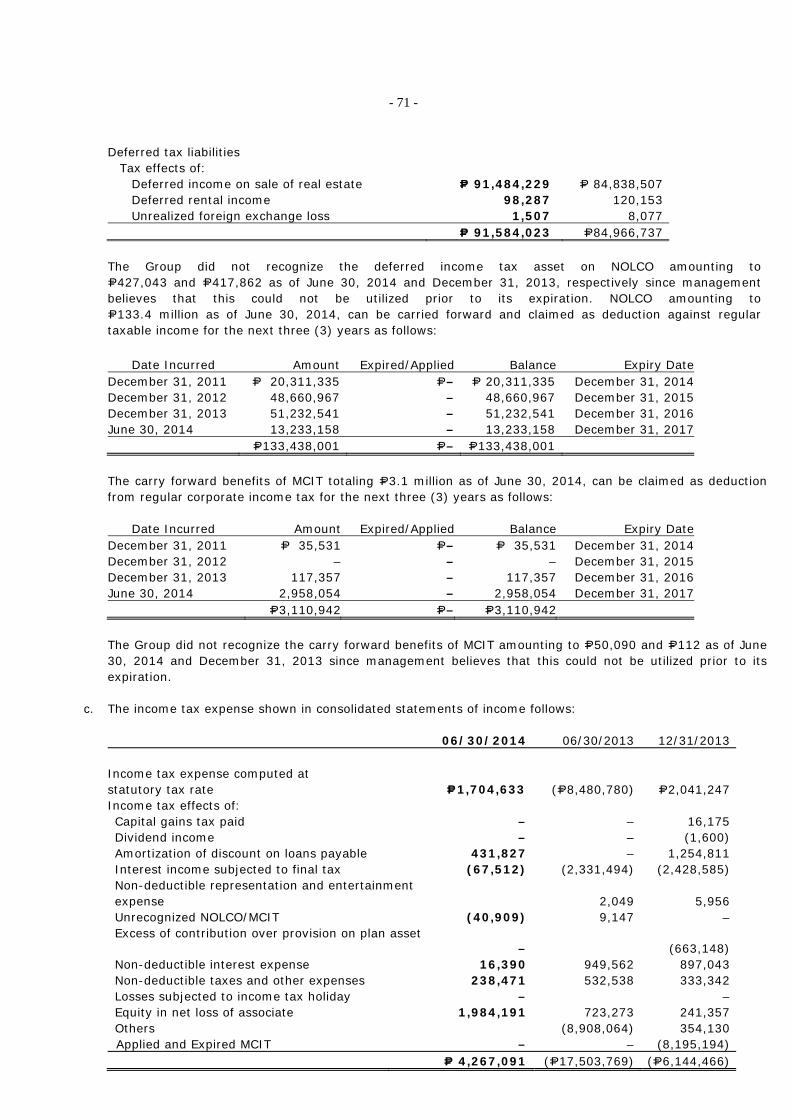
- 71 -
Deferred tax liabilities Tax effects of:
Deferred income on sale of real estate P= 91,484,229 P= 84,838,507 Deferred rental income 98,287 120,153 Unrealized foreign exchange loss 1,507 8,077 P= 91,584,023 P=84,966,737
The Group did not recognize the deferred income tax asset on NOLCO amounting to P=427,043 and P=417,862 as of June 30, 2014 and December 31, 2013, respectively since management believes that this could not be utilized prior to its expiration. NOLCO amounting to P=133.4 million as of June 30, 2014, can be carried forward and claimed as deduction against regular taxable income for the next three (3) years as follows:
Date Incurred Amount Expired/Applied Balance Expiry DateDecember 31, 2011 P= 20,311,335 P=– P= 20,311,335 December 31, 2014December 31, 2012 48,660,967 – 48,660,967 December 31, 2015December 31, 2013 51,232,541 – 51,232,541 December 31, 2016June 30, 2014 13,233,158 – 13,233,158 December 31, 2017 P=133,438,001 P=– P=133,438,001
The carry forward benefits of MCIT totaling P=3.1 million as of June 30, 2014, can be claimed as deduction from regular corporate income tax for the next three (3) years as follows:
Date Incurred Amount Expired/Applied Balance Expiry DateDecember 31, 2011 P= 35,531 P=– P= 35,531 December 31, 2014December 31, 2012 – – – December 31, 2015December 31, 2013 117,357 – 117,357 December 31, 2016June 30, 2014 2,958,054 – 2,958,054 December 31, 2017 P=3,110,942 P=– P=3,110,942
The Group did not recognize the carry forward benefits of MCIT amounting to P=50,090 and P=112 as of June 30, 2014 and December 31, 2013 since management believes that this could not be utilized prior to its expiration.
c. The income tax expense shown in consolidated statements of income follows: 06/30/2014 06/30/2013 12/31/2013
Income tax expense computed at statutory tax rate
P=1,704,633
(P=8,480,780) P=2,041,247 Income tax effects of: Capital gains tax paid – – 16,175 Dividend income – – (1,600) Amortization of discount on loans payable 431,827 – 1,254,811 Interest income subjected to final tax (67,512) (2,331,494) (2,428,585) Non-deductible representation and entertainment expense 2,049 5,956 Unrecognized NOLCO/MCIT (40,909) 9,147 – Excess of contribution over provision on plan asset
– (663,148) Non-deductible interest expense 16,390 949,562 897,043 Non-deductible taxes and other expenses 238,471 532,538 333,342 Losses subjected to income tax holiday – – Equity in net loss of associate 1,984,191 723,273 241,357 Others (8,908,064) 354,130
Applied and Expired MCIT – – (8,195,194) P= 4,267,091 (P=17,503,769) (P=6,144,466)

- 72 -
d. The Group opted for the itemized deduction scheme for its income tax reporting in 2013 and 2012.
30. Earnings per Share (EPS) Basic EPS is computed as follows: For the Quarter
06/30/2014 (Unaudited)
For the Quarter 06/30/2013 (Unaudited)
Net income (loss) attributable to equity holders of Parent Company P= 11,004,095 (P= 1,649,730)
Divided by weighted average number of shares outstanding 1,732,865,522 1,386,293,229 Basic earnings (loss) per share (for the quarter) P= 0.00633 (P= 0.00119) The Group has no dilutive potential shares as of June 30, 2014.
31. Financial Instruments Set out below is a comparison by category of carrying values and estimated fair values of Group’s financial instruments as of June 30, 2014 and December 31, 2013: As of June 30, 2014 Carrying value Fair value
Financial assets: Cash and cash equivalents P= 25,526,505 P= 25,526,505 Accounts receivable* 535,788,233 513,944,711 Notes receivable 8,140,076 8,140,076 Refundable deposits 30,804,238 30,804,238 AFS investments 998,477,359 998,477,359
P=1,598,736,411 P=1,576,892,889
Financial liabilities: Short-term debt P= 285,000,000 P= 285,000,000 Long-term debt 1,774,995,224 1,774,995,224 Accounts payable and accrued expenses** 251,926,048 251,926,048 Subscription payable 84,550,742 84,550,742 P=2,396,472,014 P=2,396,472,014
As of December 31, 2013 Carrying value Fair value
Financial assets: Cash and cash equivalents P=131,124,390 P=131,124,390 Accounts receivable* 499,350,851 499,350,851 Notes receivable 6,632,828 6,632,828 Refundable deposits 26,719,819 26,719,819 AFS investments 914,260,817 914,260,817
P=1,578,088,705 P=1,578,088,705
Financial liabilities:
Short-term debt P= 220,000,000 P= 220,000,000 Long-term debt 1,601,800,492 1,601,800,492 Accounts payable and accrued expenses** 272,158,256 272,158,256 Subscription payable 84,550,742 84,550,742 P=2,178,509,490 P=2,178,509,490
*Receivables exclude advances to suppliers and contractors as of June 30, 2014 and December 31, 2013. **Accounts payable and accrued expenses exclude statutory payables as of June 30, 2014 and December 31, 2013.

- 73 -
Fair value is defined as the amount at which the financial instrument could be exchanged in a current transaction between knowledgeable willing parties in an arm’s length transaction, other than in a forced liquidation or sale. Fair values are obtained from quoted market prices, discounted cash flow models, recent arm’s length market transaction, option pricing models and other relevant valuation models, as appropriate. The carrying value of cash and cash equivalents, accounts receivable, loans receivable, notes receivable, due from related parties, refundable deposits, accounts payable and accrued expenses, deposits from customers, due to related parties and loans payable approximate their fair values due to the relatively short-term maturities of the financial instruments or short-term nature of transactions.
32. Financial Risk Management Objectives and Policies
The Group is exposed to a variety of financial risks, which resulted from its operating, investing and financing activities. The Group’s principal financial instruments comprise of cash and cash equivalents, receivables, investment in equity securities, and bank loans. The main purpose of investing these financial instruments (assets) is to maximize interest yield and for capital appreciation. The main purpose of bank loans is to finance the Group’s operations. The Group has various other financial assets and liabilities such as trade receivables, trade payables and accrued liabilities, which arise directly from operations. The Group’s policies and guidelines cover credit risk, liquidity risk and interest rate risk. The objective of financial risk management is to contain, where appropriate, exposures in these financial risks to limit any negative impact on the Group’s results and financial position. The Group actively measures, monitors and manages its financial risk exposures by various functions pursuant to the segregation of duties principles.
The main risks arising from the use of financial instruments are credit risk, liquidity risk, interest rate risk, equity price risk and foreign currency risk. The Group’s Board of Directors reviews and agrees with policies for managing each of these risks. These are summarized below: • Credit risk
Credit risk refers to the risk that a counterparty will default and/or fail to honor its financial or contractual obligations, resulting in financial loss to the Group. The Group only transacts with recognized and creditworthy counterparties, like investing in creditworthy equities such as those listed in the Philippine Stock Exchange. Moreover, the Group follows strict credit policies and procedures in granting of credit to customers, which are regularly reviewed and updated to reflect changing risk conditions, which includes credit evaluation, administration, monitoring and collection guidelines. The Group, likewise monitors exposures through continuing assessment of creditworthiness of customers and monitoring of the aged schedules of receivables. Real estate buyers are subject to standard credit check procedures, which are calibrated based on payment scheme offered. Generally, the maximum credit risk exposure of the financial assets is the carrying amounts of the Group’s financial assets as summarized below:
As of 06/30/2014 (Unaudited)
As of
12/31/2013 (Audited)
Cash and cash equivalents P= 25,526,505 P= 131,124,390 Accounts receivable 535,788,233 499,350,851 Notes receivable 8,140,076 6,632,828 Refundable deposits 30,804,238 26,719,819 Available-for-sale investments 998,477,359 914,260,817 P=1,598,736,411 P=1,578,088,705
The Group’s cash and cash equivalents have been invested with various creditworthy banks, thus limiting exposure to credit risk, in regard to its liquid assets. The Parent Company’s contract receivable consists of significant number and various customers/lot buyers. Customers of the Group have been subjected to credit evaluation prior to sale. Moreover, ownership of the shares and title of the real estate sold on installment to various customers/lot buyers are only transferred, upon full payment of the agreed total contract price.

- 74 -
Available-for-sale investments include investment in shares that are actively traded in the stock market. The Group uses other publicly available financial information to monitor its investments.
With respect to credit risk arising from other financial assets, the Group’s exposure to credit risk arises from default of the counterparty, with a maximum exposure equal to the carrying value of these instruments.
• Liquidity risk
Liquidity risk refers to the risk that the Group will not be able to meet its financial obligations as they fall due. The Group ensures that investments have ample liquidity to finance operations and capital requirements and yield good returns. The Group manages liquidity by maintaining adequate reserves. Moreover, banking facilities and reserve bank lines and facilities are secured to fill in temporary mismatch of funds for new investments or projects. As of June 30, 2014 and December 31, 2013, the available credit lines with banks and outstanding balances are as follows:
As of June 30, 2014 Available credit line Drawable line Unpaid UCPB P= 420,000,000 P= – P= 345,478,724 CBC 405,000,000 – 400,000,000 BPIF 275,983,414 – 259,052,227 AUB 348,748,000 344,023,000 PBCOM 65,000,000 – 65,000,000 BPI 224,000,000 – 197,000,000 UBP 400,000,000 – 391,227,800 P=2,138,731,414 P= – P=2,001,781,751
As of December 31, 2013
Available credit line Drawable line Unpaid UCPB P= 420,000,000 P=– P= 374,242,824 CBC 400,000,000 – 400,000,000 BPIF 275,983,414 – 274,610,126 AUB 265,000,000 180,000,000 85,000,000 BPI 224,000,000 – 210,500,000 UBP 400,000,000 – 396,056,200 P=1,984,983,414 P=180,000,000 P=1,740,409,150
Furthermore, long-term debts are used for financing when the business requirement calls for it to ensure adequate liquidity for its operations. Additional funding requirements may be obtained from related parties. The following table presents the Group’s non-derivative financial assets and liabilities by contractual maturity and settlement dates as of June 30, 2014 and December 31, 2013. These have been based on the undiscounted cash flows and on the earliest date on which the Group will earn and/or will be required to pay. As of June 30, 2014 (Unaudited)
Due within one
year Due beyond one
year Total Financial assets:
Cash and cash equivalents P= 25,526,505 P=– P=25,526,505 Accounts receivable* 276,867,178 258,921,055 535,788,233 Notes receivable 8,140,076 – 8,140,076 Refundable deposits 30,804,238 – 30,804,238 AFS investments – 998,477,359 998,477,359
P=341,337,997 P=1,257,398,414 P=1,598,736,411

- 75 -
As of June 30, 2014 (Unaudited)
Due within one
year Due beyond one
year Total Financial liabilities:
Short-term debt P=285,000,000 P=– P=285,000,000 Long-term debt 181,004,750 1,593,990,473 1,774,995,223 Accounts payable and accrued expenses** 251,926,048 – 251,926,048 Subscription payable 84,550,742 – 84,550,742 P=802,481,540 P=1,593,990,473 P=2,396,472,013
As of December 31, 2013 (Audited)
Due within one
year Due beyond one
year Total Financial assets:
Cash and cash equivalents P=131,124,390 P=– P=131,124,390 Accounts receivable 294,256,978 205,093,873 499,350,851 Notes receivable 6,632,828 – 6,632,828 Refundable deposits 26,719,819 – 26,719,819 AFS investments – 914,260,817 914,260,817
P=458,734,015 P=1,119,354,690 P=1,578,088,705
Financial liabilities: Short-term debt P=220,000,000 P=– P=220,000,000 Long-term debt 110,905,259 1,490,895,233 1,601,800,492 Accounts payable and accrued expenses* 272,158,256 272,158,256 Subscription payable 84,550,742 84,550,742 P=687,614,257 P=1,490,895,233 P=2,178,509,490
• Agricultural production risk
Agricultural production risks include all factors that affect the productivity of crop which affects the profitability of the related biological assets. Due to the high dependence on biological processes, external events such as drought, flooding, pests and diseases are major sources of agricultural production risk. The Group reduces this risk by good farm management practices and access to agricultural support services. The Group ensures that proper selection of planting sites has been performed.
• Interest rate risk The Group is exposed to interest rate fluctuations on their cash in bank and cash equivalents, contract receivables on sale of real estate and short-term and long-term debt. Other financial assets and liabilities which principally arise in the ordinary course of its operations are generally short-term and noninterest-bearing. Historically, the rate fluctuations relative to its cash in bank and cash equivalents are minimal. Interest rates in 2013 and 2012 ranged from 0.25% to 3.0%. The contract receivables on sale of real estate are managed within the parameters approved by management. Currently, these have been offered at approved fixed rates. Interest rates, which are highly controllable by the Parent Company, ranged from less than 0% to 15% in 2011 and 2010, depending on the terms and length of payment in years. Any changes in the interest rate have been subjected to thorough review and approval of the management. Long-term debt carries fixed interest rates of 4.75% to 12.0% in 2013 and 2012.
• Equity Price Risk
Equity price risk is the risk that the fair values of equities decrease as a result of changes in the levels of equity indices and the value of individual stocks. Changes in fair value of Available-for-sale equity
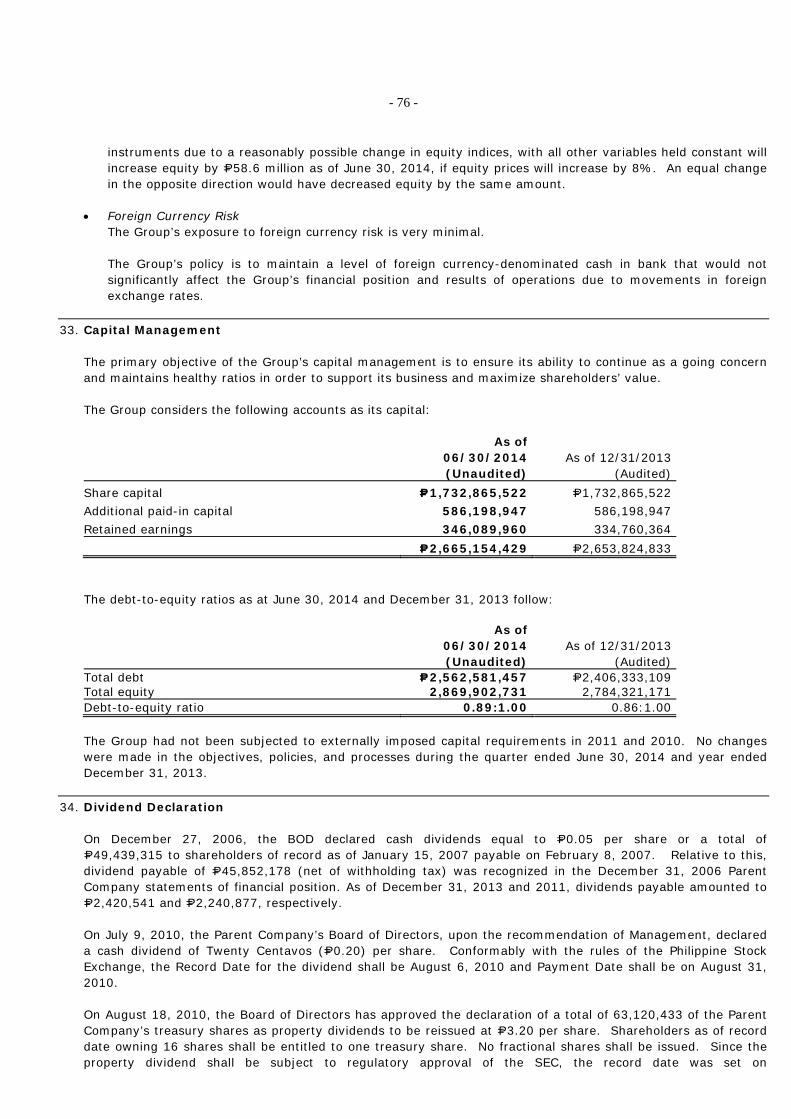
- 76 -
instruments due to a reasonably possible change in equity indices, with all other variables held constant will increase equity by P=58.6 million as of June 30, 2014, if equity prices will increase by 8%. An equal change in the opposite direction would have decreased equity by the same amount.
• Foreign Currency Risk
The Group’s exposure to foreign currency risk is very minimal. The Group’s policy is to maintain a level of foreign currency-denominated cash in bank that would not significantly affect the Group’s financial position and results of operations due to movements in foreign exchange rates.
33. Capital Management
The primary objective of the Group’s capital management is to ensure its ability to continue as a going concern and maintains healthy ratios in order to support its business and maximize shareholders’ value. The Group considers the following accounts as its capital:
As of 06/30/2014 (Unaudited)
As of 12/31/2013 (Audited)
Share capital P=1,732,865,522 P=1,732,865,522 Additional paid-in capital 586,198,947 586,198,947 Retained earnings 346,089,960 334,760,364 P=2,665,154,429 P=2,653,824,833
The debt-to-equity ratios as at June 30, 2014 and December 31, 2013 follow:
As of 06/30/2014 (Unaudited)
As of 12/31/2013 (Audited)
Total debt P=2,562,581,457 P=2,406,333,109 Total equity 2,869,902,731 2,784,321,171 Debt-to-equity ratio 0.89:1.00 0.86:1.00
The Group had not been subjected to externally imposed capital requirements in 2011 and 2010. No changes were made in the objectives, policies, and processes during the quarter ended June 30, 2014 and year ended December 31, 2013.
34. Dividend Declaration
On December 27, 2006, the BOD declared cash dividends equal to P=0.05 per share or a total of P=49,439,315 to shareholders of record as of January 15, 2007 payable on February 8, 2007. Relative to this, dividend payable of P=45,852,178 (net of withholding tax) was recognized in the December 31, 2006 Parent Company statements of financial position. As of December 31, 2013 and 2011, dividends payable amounted to P=2,420,541 and P=2,240,877, respectively. On July 9, 2010, the Parent Company’s Board of Directors, upon the recommendation of Management, declared a cash dividend of Twenty Centavos (P=0.20) per share. Conformably with the rules of the Philippine Stock Exchange, the Record Date for the dividend shall be August 6, 2010 and Payment Date shall be on August 31, 2010. On August 18, 2010, the Board of Directors has approved the declaration of a total of 63,120,433 of the Parent Company’s treasury shares as property dividends to be reissued at P=3.20 per share. Shareholders as of record date owning 16 shares shall be entitled to one treasury share. No fractional shares shall be issued. Since the property dividend shall be subject to regulatory approval of the SEC, the record date was set on
- 77 -
November 3, 2010 and the distribution date was November 29, 2010 after an instruction was received from the SEC for the Board of Directors to set those pertinent dates. On December 2010, the Parent Company distributed 62,500,591 shares which is net of 4,609,685 shares representing the final tax due on the treasury shares. As of December 31, 2013 and 2011, unpaid dividends amounted to P=2.4 million and P=2.2 million, respectively.
35. Business Segment Information
In identifying the operating segments, management generally follows the Group’s principal activities or business operations, which represent the main products and services provided by the Group as follows: Real estate Development of land into commercial and residential subdivision, sale of lots
and residential houses and the provision of customer financing for sales Quarry and Mining
Quarrying and mining of basalt rocks for production of constructionaggregates or sand and gravel
Service/ Manufacturing /Trading
Providing water supply and servicing Manufacturing of crude palm oil Selling of goods on wholesale and retail basis
Hotel Management of hotel operations Agriculture Development of land for palm oil production and sale of palm seedlings and
sale of crude palm oil Power Operating of power plants and/or purchase, generation, production supply
and sale of power. However, there was no commercial operation yet as of June 30, 2014
Holding Holding of properties of every kind and description The Group generally account for inter-segment sales and transfers as if the sales and transfers were to third parties at current market prices. Exhibit 1-B regarding business segments presents assets and liabilities as of June 30, 2014 and revenue and profit information for quarters ending June 30, 2014 (in thousands).
36. Amendments to the Articles of Incorporation and the By-Laws
In a Board of Directors meeting held on May 2, 2012 and the annual stockholders meeting on June 1, 2012, the Board of Directors and the shareholders representing 2/3 of the outstanding capital stock approved the following amendments in the Articles of Incorporation: a. Amendment to paragraph 4: “That the term for which the Corporation is to exist is extended for another fifty
(50) years from and after the date of the expiration of the original corporate term on 20 December 2016”.
b. Amendment to paragraph 6: “That the number of directors of this Corporation shall be Nine (9)……”
c. Amendment to paragraph 7: “That the amount of the capital stock of this Corporation is One Billion Six Hundred Twenty Million Pesos (P=1,620,000,000.00), Philippine Currency, and the said capital stock is divided into One Billion Six Hundred Twenty Million (1,620,000,000) shares with a par value of One Peso (P=1.00) each, provided that, stockholders shall have no preemptive right to subscribe to unissued shares unless otherwise approved by the Board of Directors”.

- 78 -
In 2011 and 2010, the Parent Company’s authorized capital stock is P=1,320,000,000 divided in 1,320,000,000 with par value of P=1 each share.
The SEC approved the said amendments on December 28, 2012.
The Board of Directors in its special meetings held on May 26 and June 10, 2008 approved the following amendments in its articles of incorporation. The amendments were confirmed by the shareholders representing not less than 2/3 of the outstanding capital stock in the annual shareholders’ meeting on July 11, 2008. a. Amendment to paragraph 3: “That the place where the principal office of the Corporation is to be established
in Pasig City, Metro Manila”.
The change in principal office was approved by SEC on March 3, 2010. The Board of Directors, during their meeting held on November 28, 2011 and by the stockholders of the Parent Company holding at least two-thirds (2/3) of the outstanding capital stock, amended the Articles of Incorporation, changing the principal office to Xavier Estates, Upper Balulang, Cagayan de Oro City. Amendment was approved by SEC on December 28, 2011.
b. Amendment to paragraph 7: “That the amount of the capital stock of this Corporation is P=15,320,000,000 and the said capital stock is divided into 15,320,000,000 shares with the par value of P=1.00 each, provided that shareholders shall have no preemptive right to subscribed unissued shares unless otherwise approved by the Board of Directors”.
Pending approval from SEC for the increase in its capitalization, the Parent Company received a total of P=187.8 million as of December 31, 2009, as deposits for future stock subscription. Additional deposits were received by the Parent Company in 2010 amounting to P=3.8 million. Inasmuch, however, that the Parent Company no longer has use for the fresh capital intended to be raised in 2008, management has proposed that the increase in capital stock be cancelled which was subsequently approved by the BOD on its board meeting last September 16, 2010. The deposits made in consideration thereof have already been returned to the stockholders concerned in 2010.
Moreover, the Board of Directors on its meeting on March 26, 2007 and May 30, 2007, approved the following:
Amendment to paragraph 5 of the secondary purpose of the Articles of Incorporation, to read as follows:
“To engage in the power business, including but not limited to power generation, power trading and power supply, and for this purpose, to bid for or acquire power generation and power related assets, facilities, concessions and contracts, and to enter into other transactions or agreements relating to power, by itself or through joint ventures or partnerships, directly or through its subsidiaries or affiliates and to purchase, hold use, sell, transfer, mortgage, exchange, or dispose of real and personal properties of every kind and description, including all commercial papers and securities or obligations of domestic/foreign corporation or associations without being a stockholder or dealer and to pay or exchange therefore, stocks, bonds or other evidences of indebtedness or securities for this or any other corporation and to exercise any and all rights and obligations as owner or holder thereof, provided it shall not function as a trust corporation”.
The foregoing amendments were confirmed by the stockholders representing not less than 2/3 of the outstanding capital stock in the annual stockholders’ meeting on June 1, 2007. On May 2, 2012, the BOD approved the cancellation of this amendment.
- 79 -
37. Other Matter Impasug-Ong and Kalabugao Plantations ABERDI entered into a Development Contract (DC) with Kapunungan Sa Mga Mag-uuma sa Kaanibungan (KASAMAKA) at the Municipality of Impasug-ong, Bukidnon concerning the development of Oil Palm Commercial Plantation.
KASAMAKA had been granted with Community Based Forest Management Agreement (CBFMA) no. 55093, by the Department of Environment and National Resources (DENR) on December 22, 2000 covering an area of 2,510.80 hectares. Under the CBFMA, KASAMAKA is mandated to develop, manage and protect the allocated community forest project area. Moreover, it is allowed to enter into agreements or contracts with private or government entities for the development of the whole or portion of the CBFMA area. The project’s objectives are to establish approximately 894 hectares into a commercial palm plantation within 5 years (2006-2011). However, ABERDI may intercrop suitable agricultural crops in the plantation and raise livestock, the harvest and produce of which shall belong to ABERDI. The responsibilities of KASAMAKA with regards to the project follow: • To provide the land area of 894 hectares within CBFMA area for oil palm plantation. • To provide manpower needs of the Company in all developmental activities such as land preparation,
planting, weeding, fertilization, harvesting, maintenance and others. On the other hand, the responsibility of ABERDI in regard to the project is to provide technical and financial resources to develop the 894 hectares into palm oil plantation for a period of 20 years up to 2026. Relative to the agreement, the Group paid for leasehold rights on the land that are applicable up to year 2026 (see Note 17). Opol Plantation Nakeen entered into a Development Contract for the establishment of Palm Oil Plantation in Tingalan, Opol, Misamis Oriental with Kahugpongan sa mga Mag-Uuma sa Barangay Tingalan (KMBT). KMBT has been granted CBFMA No. 56297 by DENR on December 31, 2000 covering a total area of 1,000 hectares of forest lands located in Tingalan, Opol, Misamis Oriental to develop, manage and protect the allocated Community Forest Project Area. The roles and responsibilities of KMBT under the Development Contract are as follows: • Provide the land area within the CBFMA for oil plantation • To provide manpower needs of Nakeen in all developmental activities such as land preparation, planting,
weeding, fertilization, harvesting, maintenance and others. On the other hand, the responsibility of Nakeen in regard to the project is to provide technical and financial resources to develop the covered area into palm oil plantation for a period of 25 years.
38. Litigation
Yulo Case On December 15, 2008, the First Division of the Supreme Court issued a resolution, denying with finality the motion for reconsideration filed by the Parent Company on October 15, 2008 concerning the case involving a claim for sum of money, specific performance and damage by a certain individual in November 2001. As a result, the Parent Company recognized an estimated litigation loss of P=34.4 million, inclusive of 12% legal interest computed from default until judgment is fully satisfied based on the Court of Appeals amended decision on July 23, 2008 and claimant. On July 15, 2009, pursuant to the assailed Order of the trial court dated June 25, 2009, the Parent Company paid the claimant the amount of P=22.4 million. The said payment was made with the intention of putting

- 80 -
closure to the case. The difference between the amount of litigation liability and the amount of settlement has been recorded by the Parent Company as withholding tax on compensation pursuant to the BIR ruling that the nature of the claim is compensation income. In May 2010, the amount recorded by the Parent Company as withholding tax on compensation was released to the Court of Appeals until the decision is final. The presiding judge who handled the case was eventually replaced. In an Order dated April 15, 2010, the new presiding judge, reversed the order of the former presiding judge, declaring that the judgment award is not subject to income tax and, at the same time, eliminating the threshold date of 15 July 2009 set by the former presiding judge in the computation of the total amount payable to the claimant The new presiding judge ruled that the company was “still obligated to pay the amount of P=14, 075,521.24 as of April 15, 2010, subject to daily interest at the rate of P=4, 305.73 until judgment is fully satisfied.” The Parent Company moved for reconsideration of the said order but, to no avail. The matter is elevated to the Court of Appeals where it is now currently pending. Lustre Case The Parent Company filed with the trial court a case for rescission with damages against defendants Home Industries Development Corporation (“HIDC”) and/or Mr. Antonio Lustre. The instant case was brought about by the defendants non delivery of lots subject of a contract to sell. The amount involved in the instant case is Six Million Four Hundred Sixty-Four Thousand Four Hundred Twenty-Five Pesos (P=6,464,425.00) [(cash actually paid by the Parent Company) P=794,425.00 + (present value of shares of stock) P=5,400,000.00 + (difference between value of the shares of stock at the date of the execution of the Contract to Sell and the present value of the shares of stock) P=270,000.00]. The trial court ruled in favour of the Parent Company. The Parent Company learned that the shares of stock forming part of the trial court’s judgment award had been disposed and were no longer in the name of Defendants Home Industries Development Corporation (“HIDC”) and/or Mr. Antonio Lustre. As such, the Parent Company filed an Omnibus Motion dated 18 April 2011 praying, among others, that Defendant HIDC pay the value of the shares of stock, in lieu of the actual return of the same, which regrettably was denied by the trial court. Considering the trial court’s denial of the above-mentioned Omnibus Motion, the Parent Company filed with the Court of Appeals a Motion for Amendment and/or Clarification of Judgment Based on Supervening Events (“Motion”) dated 22 February 2012. This Motion was subsequently denied in a Resolution dated 27 December 2012. Consequently, the Parent Company filed a Motion for Reconsideration (Of the Resolution dated 27 December 2012). At present, the Motion is still pending with the Court of Appeals.
39. Treasury Shares
On June 1, 2010, the Parent Company acquired 300,000,000 treasury shares held by Baysfield Investments Limited (BIL) at the purchase price of P=335,212,810, or about P=1.12 per share. On October 12, 2010, the Parent Company sold 63,865,705 common shares held in treasury at P=3.01 per share resulting to additional paid-in capital amounting to P=120,873,766.
As discussed in Note 1, the Parent Company’s Board of Directors (BOD) approved, during their meeting on October 5, 2012, the private placement of 250.0 million of its listed common shares consisting of 173.6 million treasury common shares and 76.4 million common shares owned by a shareholder. The Placement Shares, with a par value of P=1 per share was sold at a price of P=2.89 per share and crossed in the Exchange on October 8, 2012.

- 81 -
EXHIBIT 1-A
A BROWN COMPANY, INC. & SUBSIDIARIES AGING OF INSTALLMENT CONTRACTS AND TRADE RECEIVABLES
As of June 30, 2014
TOTAL Long-term Current 1-30 days 31-60 days 61-90 days 91-120 days
Over 120 days
ABCI P= 385,915,729 P= 261,293,117 P= 114,026,495 P= 1,015,999 P= 1,573,669 P= 1,247,498 P= 1,039,253 P= 5,719,698
BRC 1,926,789 – – 482,111 226,715 98,397 84,287 1,035,279
ABERDI 42,802,306 – 24,134,981 14,758,184 411,482 15,755 3,481,904 –
TOTAL P= 430,644,824 P= 261,293,117 P=138,161,476 P=16,256,294 P=2,211,866 P=1,361,650 P=4,605,444 P= 6,754,977
N. B. Only the trade/installment contract receivables (current & non-current) were aged, gross of allowance.

- 82 -
EXHIBIT 1-B
A BROWN COMPANY, INC. AND SUBSIDIARIESFINANCIAL INFORMATION ABOUT BUSINESS AND GEOGRAPHICAL SEGMENTSFOR THE SECOND QUARTER 2014 (APRIL TO JUNE)
2014 2013 2014 2013 2014 2013 2014 2013 2014 2013 2014 2013 2014 2013 2014 2013 2014 2013 2014 2013
Revenues
External revenues 107,821 79,732 66,948 13,171 2,658 2,371 ‐ ‐ ‐ ‐ ‐ ‐ 5,137 3,677 182,564 98,950 ‐ ‐ 182,564 98,950
Inter‐segment revenues ‐ ‐ ‐ ‐ ‐ ‐ ‐ ‐ ‐ ‐ ‐ ‐ ‐ ‐ ‐ ‐ (357) (357) (357) (357)
Total revenues 107,821 79,732 66,948 13,171 2,658 2,371 ‐ ‐ ‐ ‐ ‐ ‐ 5,137 3,677 182,564 98,950 (357) (357) 182,207 98,594
Operating expenses 97,779 78,401 58,956 26,161 5,026 4,285 853 914 723 6,040 61 396 ‐ 2,538 163,398 118,735 (8,638) (4,771) 154,759 113,964
10,042 1,331 7,991 (12,990) (2,368) (1,914) (853) (914) (723) (6,040) (61) (396) 5,137 1,139 19,166 (19,785) 8,282 4,414 27,448 (15,371) Gain on sale of investment properties ‐ ‐ ‐ ‐ ‐ ‐ ‐ ‐ ‐ ‐ ‐ ‐ ‐ ‐ ‐ ‐ ‐ ‐ ‐ ‐
Gain on sale of AFS investments ‐ ‐ ‐ ‐ ‐ ‐ ‐ ‐ ‐ ‐ ‐ ‐ ‐ ‐ ‐ ‐ ‐ ‐ ‐ ‐
Dividends income ‐ ‐ ‐ ‐ ‐ ‐ ‐ ‐ ‐ ‐ ‐ ‐ ‐ ‐ ‐ ‐ ‐ ‐ ‐ ‐
Financial income 4,816 8,827 5 78 1 38 ‐ 0 157 182 0 192 ‐ ‐ 4,978 9,317 ‐ ‐ 4,978 9,317
Financial expenses (21,145) (16,897) ‐ ‐ ‐ (169) ‐ ‐ ‐ ‐ ‐ ‐ ‐ ‐ (21,145) (17,066) ‐ ‐ (21,145) (17,066)
Other income (loss) 1,445 1,921 911 197 (27) (244) 2,000 2,000 ‐ ‐ ‐ ‐ ‐ ‐ 4,329 3,873 (2,000) (2,625) 2,329 1,248 Income tax benefit (expense) (1,554) 13,471 (1,634) 3,861 694 648 (346) (335) 215 1,800 18 115 ‐ ‐ (2,606) 19,559 ‐ ‐ (2,606) 19,559
Net income (loss) (6,395) 8,652 7,273 (8,854) (1,700) (1,642) 801 751 (352) (4,058) (42) (89) 5,137 1,139 4,722 (4,101) 6,282 1,789 11,004 (2,312)
Net income attributable to:
Equity holders of Parent Company 10,961.71 3,427
Noncontrolling interest 42.38 (184)
11,004 3,243
Other information
Segment assets 5,392,348 5,265,282 826,114 673,496 97,471 79,755 265,892 256,551 20,706 2,118,404 947,226 1,687,676 1,469 18,480 7,551,226 10,099,644 (2,157,451) (3,358,371) 5,393,775 6,741,273
Deferred tax assets 21,652 16,220 17,924 15,455 7,852 4,521 10,994 11,742 1,004 15,268 1,126 1,390 ‐ ‐ 60,553 64,596 ‐ ‐ 60,553 64,596
Total assets 5,414,001 5,281,502 844,038 688,951 105,323 84,276 276,886 268,294 21,711 2,133,672 948,351 1,689,066 1,469 18,480 7,611,779 10,164,241 (2,157,451) (3,358,371) 5,454,328 6,805,869
Segment liabilities 2,320,758 2,277,673 469,302 305,735 60,350 31,169 263,539 256,093 757 62,985 565,770 1,578,780 186 9,318 3,680,663 4,521,754 (1,187,822) (1,250,942) 2,492,841 3,270,812
Deferred tax liabilities 91,584 66,326 ‐ ‐ ‐ ‐ ‐ ‐ ‐ ‐ ‐ ‐ ‐ ‐ 91,584 66,326 ‐ ‐ 91,584 66,326
Total liabilities 2,412,342 2,343,999 469,302 305,735 60,350 31,169 263,539 256,093 757 62,985 565,770 1,578,780 186 9,318 3,772,247 4,588,080 (1,187,822) (1,250,942) 2,584,425 3,337,138
Segment additions to property and equipment and investment properties 2,152 3,064 38,990 48,137 1,946 10,072 ‐ ‐ 6,634 52,856 ‐ 1,488 ‐ ‐ 49,722 115,617 ‐ ‐ 49,722 115,617
Depreciation and amortization 2,557 3,373 2,708 1,615 551 558 707 815 143 229 1 1 18 ‐ 6,685 6,591 ‐ ‐ 6,685 6,591
Impairment loss 382 382 ‐ ‐ ‐ ‐ ‐ ‐ ‐ ‐ ‐ ‐ ‐ ‐ 382 382 ‐ ‐ 382 382
Quarry & Mining Total Adjustments and eliminations Hotel Agriculture
1ST Quarter 2014
Real Estate Consolidated Service/ Manufacturing/
Trading Power operations Holding

- 83 -
EXHIBIT 1-C
FINANCIAL SOUNDNESS INDICATORS
Financial Ratios Unaudited Unaudited Audited Consolidated Figures 06/30/2014 06/30/2013 12/31/2013
Current ratio1 1.54:1 3.33:1 1.92:1 Total Debt to Equity ratio2 0.90:1 0.80:1 0.86:1 Asset to Equity ratio3 1.90:1 1.80:1 1.86:1 Interest Coverage ratio4 1.14X 1.54X 0.97X Profit Margin ratio5 0.00% 0.01% 0.01% Return on Assets6 0.03% 0.05% 0.08% Return on Equity7 0.05% 0.08% 0.14%
1Current assets/Current liabilities 2Total liabilities/Stockholders’ equity 3Total assets/Stockholders’ equity 4Earnings before interest, income tax (EBIT)/Total financing cost 5Net income/Total revenue 6Net income/Average total assets 7Net income/Average total stockholders’ equity
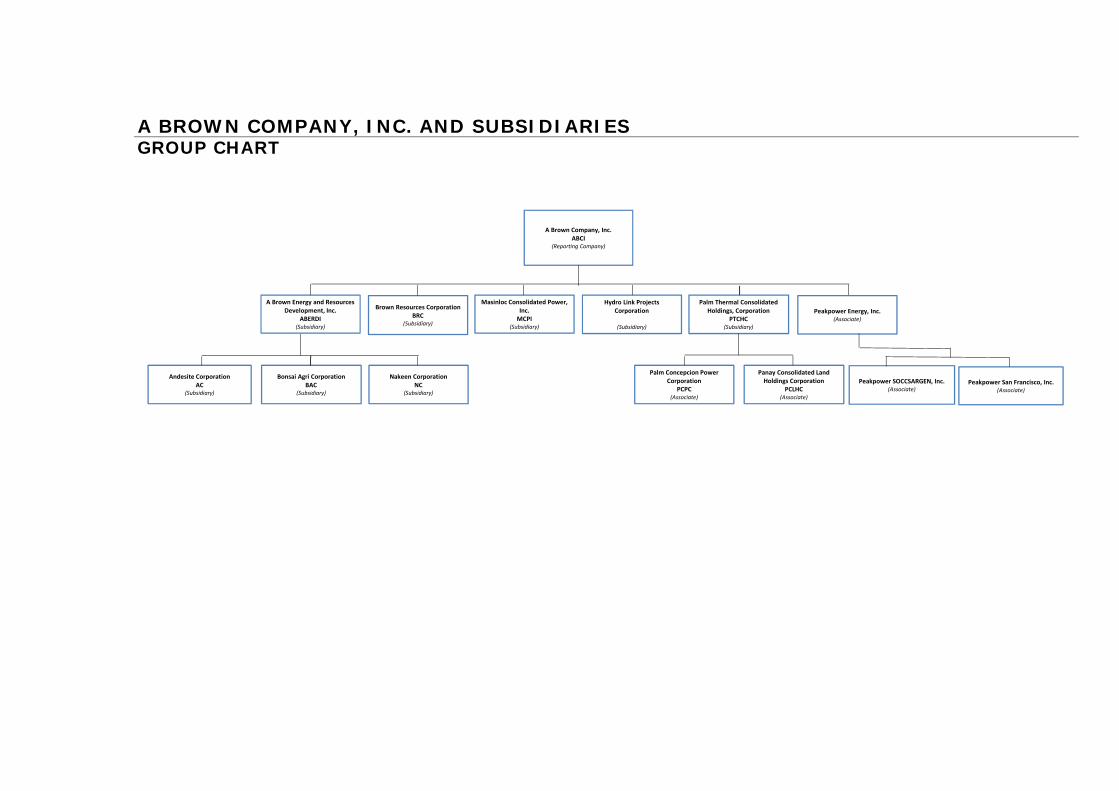
A BROWN COMPANY, INC. AND SUBSIDIARIESGROUP CHART
A Brown Company, Inc.ABCI
(Reporting Company)
A Brown Energy and Resources Development, Inc.
ABERDI(Subsidiary)
Brown Resources CorporationBRC
(Subsidiary)
Masinloc Consolidated Power, Inc.MCPI
(Subsidiary)
Palm Thermal Consolidated Holdings, Corporation
PTCHC(Subsidiary)
Hydro Link Projects Corporation
(Subsidiary)
Peakpower Energy, Inc.(Associate)
Andesite CorporationAC
(Subsidiary)
Bonsai Agri CorporationBAC
(Subsidiary)
Nakeen CorporationNC
(Subsidiary)
Palm Concepcion PowerCorporation
PCPC(Associate)
Panay Consolidated Land Holdings Corporation
PCLHC(Associate)
Peakpower SOCCSARGEN, Inc.(Associate)
Peakpower San Francisco, Inc.(Associate)