2.1 history of leprosy -...
TRANSCRIPT

REVIEW OF LITERATURE
Page | 6
2.1 HISTORY OF LEPROSY
2.1.1 Origin and spread of leprosy
The history of leprosy is ‘‘interwoven with civilization itself’’. Leprosy is a debilitating but
treatable disease caused by infection with Mycobacterium leprae. The damage to skin and
peripheral nerves results in characteristic deformities and disabilities that contribute to an
intense social stigma and discrimination of patients and their families. Although leprous
nodules were found to contain brown bodies in 1847 (Danielssen et al. 1847), these bodies
were mistaken for degenerated fat cells until 1873 when Armauer Hansen re-examined the
nodules and recognized that they contained bacilli (Pallamary 1955). However, the proof of
an infectious agent was difficult to obtain until the evidence of direct transmission was shown
in 1886 (Marmor 2002). First named Bacillus leprae (Hansen 1880), the causative agent was
assigned to the genus Mycobacterium by Lehmann and Neumann in 1896. The inability to
cultivate M. leprae in vitro and the lack of a suitable animal model has long hampered
leprosy research. Progress was made by Charles Shepard in 1960 with the observation of
limited M. leprae multiplication after injection into mouse footpads (Shepard 1960) and by
Kircheimer and Stoors with the demonstration that the nine-banded armadillo is a natural host
for systemic infection (Kirchheimer and Storrs 1971). From a phylogenetic point of view, M.
leprae is a distinct species (Harmsen et al. 2002). It is not a close relative of M.lepraemurium
(Grange 1996). This unculturable pathogen has undergone extensive reductive evolution,
with half of its genome now occupied by pseudogenes. Using comparative genomics, it was
demonstrated that all extant cases of leprosy are attributable to a single clone whose
dissemination worldwide could be retraced from the analysis of very rare single-nucleotide
polymorphisms (Monot et al. 2005). A comparative analysis of the complete genome
sequence of Br4923, a Brazilian strain of M. leprae, was reported with its use for the
discovery of SNPs and other polymorphic markers with phylogeographic potential. This
finding was then complemented by genome resequencing of strains from Thailand and the
United States. When all the genome sequences were compared, little genomic diversity was
uncovered, consistent with the hypothesis that leprosy has arisen from infection with a single
clone that has passed through a recent evolutionary bottleneck (Monot et al. 2009). The
disease seems to have originated in Eastern Africa or the Near East and spread with
successive human migrations. It has been suggested that Europeans or North Africans

REVIEW OF LITERATURE
Page | 7
introduced leprosy into West Africa and the Americas within the past 500 years (Figure 2.1.
modified from (Monot et al. 2009)).
Figure 2.1: Dissemination of leprosy around the globe, presenting with the screeing of 28 different geographic origins with a total of 400 M. leprae strains, resulting in 16 different M. leprae subtypes, referred to as A-P (shown on left as different colour bars) (Monot et al. 2009). Pillars indicate country of origin of M. leprae sample. Colour of pillars represent colour coded scheme for the 16 SNP subtypes. The thickness of the pillar corresponds to the number of samples (1–5, thin; 6–29, intermediate; >30, broad). The gray arrows indicate the migration routes of humans derived from genetic, archaeological, and anthropological studies with an approximate estimated time of migration in years. The coloured arrows indicate the direction of human migration predicted (modified from (Monot et al. 2009)).
2.1.2 Epidemiology Over the last three decades, significant reduction of global burden of leprosy was achieved
with two important events. The first event took place in 1981, when a WHO study group on
chemotherapy of leprosy recommended the use of multidrug therapy as the standard
treatment for leprosy. The success of multidrug therapy led to the second event in 1991, when
the 44th World Health Assembly passed resolution WHA44.9, declaring its commitment to
eliminate leprosy as a public health problem by the end of year 2000. This meant achieving a
prevalence of less than one case per 10 000 population. The number of countries reporting
prevalence rates above one per 10 000 population was reduced from 122 in 1985 to nine at

REVIEW OF LITERATURE
Page | 8
the beginning of 2004. In addition, more than 14 million leprosy cases were diagnosed and
treated with multidrug therapy with very few relapses. Although during 2007 both the
Democratic Republic of the Congo and Mozambique reached this important stage, however,
pockets of high endemicity still remain in some areas of Angola, Brazil, Central African
Republic, Democratic Republic of Congo, India, Madagascar, Mozambique, Nepal, and the
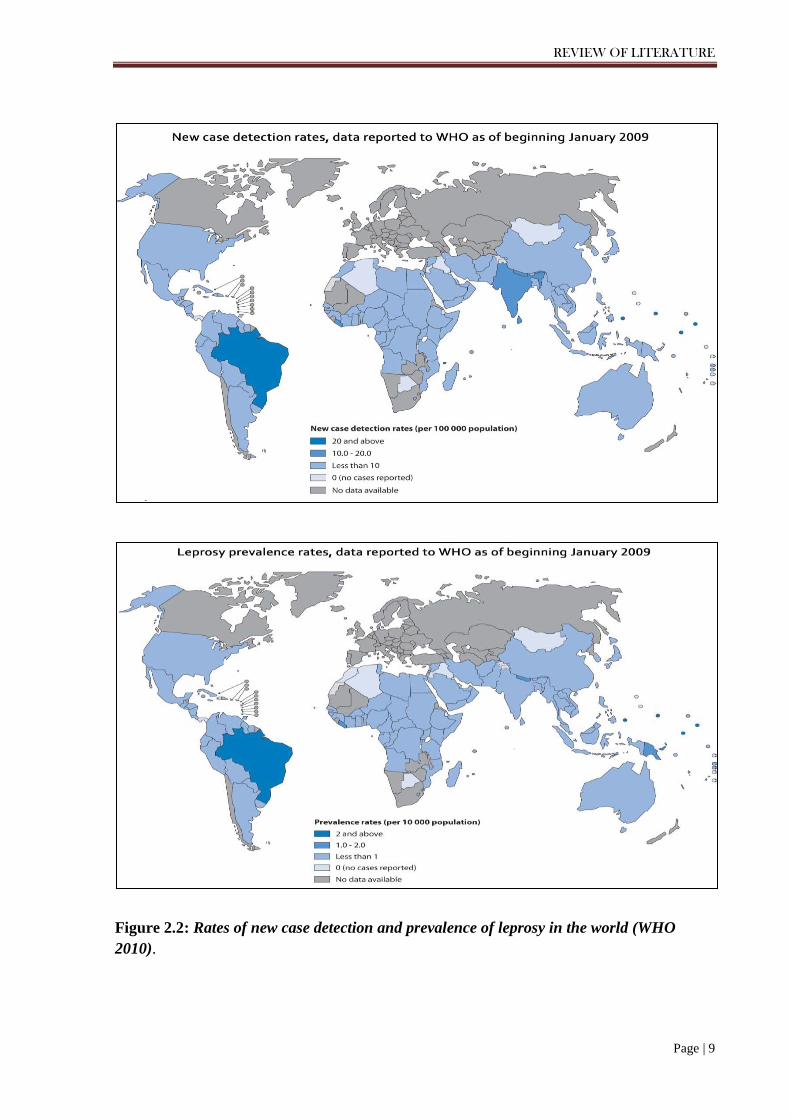
United Republic of Tanzania (Figure 2.2). An official report of leprosy, collected from 141
countries and territories during 2010, showed the global registered prevalence of 211,903
cases, while the number of new cases detected during 2009 was 244,796 (excluding the small
number of cases in Europe) (WHO 2010). The main principles of leprosy control are based
on timely detection of new cases and their treatment with effective chemotherapy in the form
of multidrug therapy, which is available free of charge since 1995 in all endemic countries
through WHO.
2.1.2.1 Leprosy situation in India
There has been a fall reported in the prevalence rate (PR) from 0.84 in March 2008 to 0.72 at
the end of the financial year 2008-09 but no change in prevalence rate 0.71 in 2009-10.
(Figure 2.3, Table 2.1). Thirty two out of 35 states and Union Territories have achieved
elimination with Bihar at a PR of 1.07. In order to achieve Elimination of Leprosy as a Public
Health Problem, the state has to achieve a Prevalence Rate of below one per ten thousand
population. Chattisgarh is the only state which has a PR of more than 2. A total of 510
districts (80.57%) out of total 633 districts have reached PR<1/10,000 (Figure 2.4 a).
A total of 1.34 lakh new cases were detected during the year 2009-10, with an Annual New
Case Detection Rate (ANCDR) of 10.93 per 100,000 population. This shows ANCDR
reduction of 2.32% from 11.70 during 2008-09. (Figure 2.4 b) depicts the trend of leprosy
Prevalence (PR) and Annual New Case Detection (ANCDR). The three states /Union
territories (UTs) i.e. Bihar, Chhattisgarh and Dadra & Nagar Haveli have remained with PR
between 1 and 2.5 per 10,000 population. These 3 states/UTs with 10.5% of country’s
population, contribute 19% of country’s recorded caseload and 21.9% of the country’s new
cases detected during the year 2009-10 (WHO 2010).
REVIEW OF LITERATURE
Page | 9
Figure 2.2: Rates of new case detection and prevalence of leprosy in the world (WHO 2010).

REVIEW OF LITERATURE
Page | 10
Figure 2.3: Declining leprosy prevalence in India (National Leprosy Eradication Programme (NLEP report, 2009)
Table 2.1: Epidemiological Situation in India
Prevalence Rate 0.71 per ten thousand population
Cases on record 0.87 lakh MB proportion (As percentage of new cases) 48.50%
Female proportion (As As percentage of new cases) 35.40% Child proportion (As As percentage of new cases) 9.97% Visible deformity (As As percentage of new cases) 3.10% Number of states which have achieved elimination 32 (out of 35)
Annual new case detection rate (2009-10) 10.93 per 100,000 population Number of cases detected during 2009-10 1.34 lakh

REVIEW OF LITERATURE
Page | 11
Figure 2.4 (a): Registered leprosy cases in India (March 2010) (National Leprosy Eradication Programme (NLEP) report, 2010).
Figure 2.4 (b): Leprosy Prevalence Rate (PR) and New Case Detection Rate (NCDR) per 10,000 population in India from: 1991-2010 (National Leprosy Eradication Programme (NLEP) report, 2010).

REVIEW OF LITERATURE
Page | 12
Despite this impressive decline in prevalence, the incidence of new case detection rate per
year is still high. Unexpectedly, incidence approximates prevalence, a striking observation in
the context of a chronic disease. Although this could partly reflect improved leprosy control
and case detection in endemic countries (Lockwood 2002), it is also plausible that the global
use of MDT has had limited impact on the transmission cycle of M. leprae. It is unclear why
the incidence of leprosy is still so high despite effective chemotherapy and the fact that
humans are the only relevant reservoir of M. leprae.
2.1.3 Diagnosis of leprosy
Leprosy is a slow progressing infectious disease, caused by Mycobacterium leprae with
intermittent hypersensitivity reactions (the so-called lepra reactions) in some patients. It is
highly infective with low pathogenicity and virulence and has a long incubation period. The
skin, superficial peripheral nerves, anterior chamber of the eyes, and testes are the most
frequently affected organs. Its geographic distribution varied in the past. Presently it is
endemic mainly in subtropical areas. The clinical diagnosis of leprosy is based on patients
having one or more of three cardinal signs (i) hypopigmented or reddish patches with definite
loss of sensation (ii) thickened peripheral nerves (iii) acid-fast bacilli on skin smears or
biopsy material. Skin smears processed to detect intradermal acid fast bacilli, have high
specificity, but low sensitivity, since about 70% of all leprosy patients are smear negative
(Lockwood 2002). Nevertheless, skin smears are important because these identify most
infectious patients and those at greatest risk of relapse. Histological diagnosis, when
available, is considered to be the gold standard for diagnosis. The intradermal injection of 0.1
ml lepromin may provoke a late response (Mitsuda reaction) which is a consequence that
follows the phagocytosis of the lepromin's heat-killed Mycobacterium leprae by the skin
macrophages (histiocytes). This late lepromin reaction may be clinically and histologically
evaluated at 4 weeks. During the Sixth International Congress of Leprosy in 1953, it was
recommended that five classes of Mitsuda reaction should be clinically read as: an absence
of observable or palpable element indicating negative (-) reaction; a perceptible element
smaller than 3 mm in diameter – a doubtful (+/- ) reaction; a conspicuous infiltrated element
3-5 mm in diameter as positive (+) reaction; a conspicuous infiltrated element larger than 5
mm - positive (++) reaction; an ulcerated large nodule – a highly positive (+++) reaction.
When histologically evaluated, a positive Mitsuda reaction is defined by the presence of
epithelioid cells, usually assuming a tuberculoid or tuberculoid-like structure, where acid-fast

REVIEW OF LITERATURE
Page | 13
bacilli (AFB) are absent or scarcely found. This reaction indicates, therefore, that the
macrophages are able to digest phagocytosed heat-killed M. leprae, since this response is a
consequence of the destruction of bacilli contained in lepromin by the macrophages which
transform themselves into epithelioid elements. In the negative Mitsuda reaction the
phagocytosed AFB are not destroyed nor is a tendency to a tuberculoid structure seen
(Azulay et al. 1960; Petri et al. 1985). Since the bacilli contained in lepromin are heat-killed,
the Mitsuda reaction cannot be considered a replica of the leprosy infection. Nevertheless,
this reaction has a high prognostic value, since Mitsuda-positive contacts of leprosy patients
are free from the risk of manifesting lepromatous leprosy, which is completely associated
with a negative Mitsuda reaction (Dharmendra and Chatterjee 1991). Otherwise stated, a
positive Mitsuda reaction indicates that the macrophages are able to destroy either dead or
living leprosy bacilli. In contrast, leprosy contacts who persistently exhibit a negative
Mitsuda reaction are considered to be at risk of contracting leprosy. The proposal that leprosy
might be diagnosed by the presence of an anaesthetic skin lesion alone does not pass critical
assessment (report of ILATF, 2002). Although 70% of leprosy skin lesions have reduced
sensation, the 30% non-anaesthetic lesions occur in patients with multibacillary disease,
(Saunderson and Groenen 2000) who are infectious and have a higher risk of developing
disability than those with paucibacillary disease. Therefore other criteria are also used.
Neither serology nor PCR has a role for diagnosis at present (report of ILATF, 2002).
Antibodies against M. leprae specific PGL-I are present in 90% of patients with untreated
lepromatous disease, but only 40–50% of patients with paucibacillary disease, and 1–5% of
healthy controls (Cho et al. 2001; Roche et al. 1990). PCR for detection of M. leprae DNA
encoding specific genes or repeat sequences is potentially highly sensitive and specific, since
it detects M. leprae DNA in 95% of multibacillary and 55% of paucibacillary patients
(Kampirapap et al. 1998; Patrocinio et al. 2005). Currently, no specific and sensitive test is
available for the diagnosis of asymptomatic Mycobacterium leprae infection or for predicting
progression to leprosy among exposed individuals.
2.1.4 Classification of the leprosy disease spectrum
The leprosy bacillus has a tropism for macrophages and peripheral nerve Schwann cells,
infection of the latter resulting in sensory and motor function loss. Individual differences in
the host immune response directed against M. leprae strongly correlate with the spectrum of
clinical and histological phenotypes delimited by the tuberculoid (TT) and lepromatous (LL)

REVIEW OF LITERATURE
Page | 14
subtypes (Danielssen et al. 1847) (Figure 2.5). Tuberculoid cases present a limited number of
hypopigmented, anesthetic skin lesions with no microscopically discernable bacteria. The
correlated Th1-cell-mediated immune (CMI) response (IL2, IFNγ) promotes the formation of
delineated granulomas—central areas of infected macrophages, often fused into multinucleate
giant cells, surrounded by T cells—that successfully limit bacterial replication. Conversely,
LL cases present numerous sensitive or anesthetic skin lesions with high bacillary loads. The
correlated Th2-antibody response (IL4, IL10) impedes granuloma formation, allowing for
uncontrolled bacterial replication and continuous infiltration of the skin and nerves.
Borderline forms, i.e., borderline-tuberculoid (BT), borderline (BB), and borderline-
lepromatous (BL), comprise the majority of cases. These individuals present intermediate
clinical and histological phenotypes resulting from immunologically unstable responses. With
limited accuracy, the Ridley-Jopling designations are approximated in the alternative WHO
classification system by reclassifying TT and BT subtypes as paucibacillary (PB), and BB,
BL, and LL forms as multibacillary (MB).

REVIEW OF LITERATURE
Page | 15
Figure 2.5. Clinical and immunological classification of the leprosy disease spectrum. with
a wide range of clinical presentations from: tuberculoid (TT) through borderline (BT, BL and
BB) forms to lepromatous (LL). The TT and BT patients who have a bacillary index (BI) = 0
are classified as paucibacillary (PB) disease, and BB, BL, and LL patients have a BI > 0 and
are classified as multibacillary (MB) disease. Tuberculoid cases present a limited number of
hypopigmented, anesthetic skin lesions with no microscopically discernable bacteria. The
correlated Th1-cell-mediated immune (CMI) response (with IL2, IFNγ cytokine expression)
promotes the formation of delineated granulomas. Conversely, LL cases present numerous
sensitive or anesthetic skin lesions with high bacillary loads. The correlated Th2-antibody
response (with IL4, IL10 cytokine expression) impedes granuloma formation, allowing for
uncontrolled bacterial replication and continuous infiltration of the skin and nerves. There
are two main categories of reactions in leprosy: Type I reaction which is called a reversal
lepra reaction and Type II lepra reaction, which is reported as erythema nodosum leprosum
(modified from (Misch et al. 2010)).

REVIEW OF LITERATURE
Page | 16
2.1.4.1 Leprosy reactions
The induced Mitsuda reaction is a delayed-type hypersensitivity response (measured 21 to 28
days after inoculation) to intradermally administered leprosy antigens (of which lepromin is
one formulation). Patients with tuberculoid leprosy typically have strongly positive Mitsuda
reactions, a measure of the presence of functional cell-mediated immunity; in contrast, LL
patients commonly have little to no reaction (Danielssen et al. 1847; Ilangumaran et al. 1996;
Modlin 2010; Narayan et al. 2001; Sansonetti and Lagrange 1981; Singh et al. 2010). Two
types of spontaneous immune reactions, or “reactive states,” can also occur in leprosy.
Reversal reactions (RRs) also known as type 1 reactions, represent the sudden activation of a
Th1 inflammatory response to M. leprae antigens. They occur most frequently, although not
exclusively, in borderline categories (BL, BT, or BB categories), often after the initiation of
treatment, and reflect a switch from a Th2- toward a Th1-predominant response (Britton and
Lockwood 2004; Lockwood et al. 1993; Scollard et al. 2006; Walker et al. 2008). Erythema
nodosum leprosum (ENL), also known as a type 2 reaction, is an acute inflammatory
condition involving high levels of tumor necrosis factor (TNF) (Sarno et al. 1991), tissue
infiltration by CD4 cells and neutrophils (Kahawita and Lockwood 2008), and deposition of
immune complexes and complement, resulting in immune-complex-associated vasculopathy,
panniculitis, and uveitis (Britton and Lockwood 2004). ENL occurs in LL or BL patients and
is more commonly seen in patients with a high bacterial index (Sansonetti and Lagrange
1981). Numerous investigators have measured intralesional and systemic cytokine production
during leprosy reactions (Garcia et al. 1999; Jullien et al. 1997; Little et al. 2001; Sieling and
Modlin 1994; Yamamura 1992), but those studies did not show a consistent Th1 versus Th2
cytokine pattern for reversal reaction versus ENL (Scollard 2008; Scollard et al. 2006). For
example, increased amounts of Th1 cytokines, such as IFNγ, IL-12, and IL-2, have been
demonstrated for both reversal reactions and ENL. A major drawback of these studies is the
inability to determine whether the measured cytokine response is the cause or the
consequence of inflammation. For these reasons, the immune mechanism of these reactions is
still poorly understood.

REVIEW OF LITERATURE
Page | 17
2.1.4.2 Lucio Phenomenon (Erythema Necroticans)
It is unique to diffuse lepromatosis leprosy and usually occurs in Latin American patients.
The development of necrotizing vasculitis results in crops of large polygonal lesions
characterized by ulcerations and sloughing of large areas of skin. The pathophysiology of this
complication is not fully delineated, but it may represent a variant of ENL.
2.1.5 Transmission of leprosy
Leprosy is a curable disease with well-defined etiology. However, it lacks better diagnostic
tools and therapeutic strategies, which together with the socio-cultural prejudice becomes an
important obstacle to overcome these limitations in early detection and protection of the
susceptible population, especially for the household contacts of leprosy patients. It has been
suggested that the latter group should be given priority in disease control programs in order to
interrupt transmission and reduce physical and social disabilities (Goulart et al. 2008).
Household contacts of leprosy patients are the highest risk group for the development of the
disease. Although many risk or prevention factors have been identified, these have not been
employed in leprosy-monitoring programs.
Transmission of M. leprae infection is not significantly affected by current leprosy control
measures. In addition to delayed or missed diagnosis of infectious leprosy patients, the lack
of tests to measure asymptomatic M. leprae infection in contacts prevents assessment of
transmission of M. leprae. Therefore, a key priority is the development of specific and
sensitive diagnostic tools that detect M. leprae infection before clinical manifestations arise
(report of ILATF, 2002).
Untreated MB patients are probably the most important source of transmission of M. leprae.
Household contacts of MB patients have been estimated to have a 5–10 times greater risk of
developing leprosy than that of the general population (Douglas et al. 2004; Douglas et al.
1987; Fine et al. 1997; van Beers et al. 1999). However, in many areas, the number of MB
patients is very small and they may not represent the most important source of infection
(report of ILATF, 2002).There is increasing evidence that subclinical transmission may occur
(Moet et al. 2004), because even in highly endemic countries, no history of close contact with
a leprosy patient can be established for many patients (Fine et al. 1997).
REVIEW OF LITERATURE
Page | 18
Nasal excretion of M. leprae by healthy carrier individuals could be responsible for
transmission. M. leprae-specific DNA sequences have been detected by PCR in nasal swabs
from many apparently healthy individuals residing in endemic areas (Goulart et al. 1996;
Hatta et al. 1995; Izumi et al. 1999; Klatser et al. 1993; Pattyn et al. 1993; Ramaprasad et al.
1997; van Beers et al. 1994); and large proportions of those who live in endemic areas show
seropositivity against M. leprae specific antigens (Izumi et al. 1999; Ramaprasad et al. 1997;
van Beers et al. 1994).
There is increasing evidence from nasal swab PCR studies of temporary carriage or even
subclinical infection (Cree and Smith 1998; Hatta et al. 1995; Job et al. 2008; Klatser et al.
1993; van Beers et al. 1996), indicating that infected persons may go through a transient
period of nasal excretion when the mycobacterium is highly infective (Hatta et al. 1995).
Patients’ household contacts, neighbours, and social contacts have an increased risk of
contracting the disease (van Beers et al. 1999). Nasal carriage of M. leprae in healthy people
may have important implications for leprosy control, once it is difficult to visualize the
widespread exposure without the existence of sources of transmission other than MB patients
alone (Klatser et al. 1993). Other strong evidence on the involvement of contacts in the
transmission chain is the presence of M. leprae DNA in the nasal mucosa biopsies (inferior
turbinate) in 10% of household contacts (Patrocinio et al. 2005) and in 4% in the nasal swab
(Job et al. 2008), which also confirms that the nose is major port of entry and exit of M.
leprae. These findings also support the results (Sethna et al. 1997) that have demonstrated the
affinity of M. leprae for the nasal mucosa and head sinuses, which depend on the bacilli
viability and mucosa integrity.
Although nasal carriage may not necessarily result in infection or excretion of bacilli, the
finding of nasal carriage evidences the disseminated occurrence of M. leprae in contacts (Job
et al. 2008; Patrocinio et al. 2005) and leprosy-endemic populations and its probable role as a
reservoir for maintenance of bacteria (Sethna et al. 1997).
In a preliminary investigation for the presence of M. leprae DNA in blood samples of 110
patients and 434 contacts, the general positivity was 18.2 and 8.9%, respectively. The
presence of M. leprae DNA in the blood of healthy carriers provides additional
epidemiological evidence that the route of M. leprae transmission is not only the upper
airways, indicating a possible transmission through blood, which may affect blood bank
REVIEW OF LITERATURE
Page | 19
routine tests in future. This hypothesis is corroborated by case reports in nonendemic areas
(Launius et al. 2004; Modi et al. 2003), in which leprosy was acquired after organ
transplantation. However, it has been suggested that these two case reports should be
carefully investigated to demonstrate that recipient patients did not receive contaminated
blood during transfusion, since there is no scientific proof that indirect transmission through
the chain of armadillo–dog–man is possible.
Based on earlier findings it is possible to state that there is subclinical infection in leprosy and
many times it corresponds to the incubation period of the multibacillary disease (Douglas et
al. 2004). It has been found that a maximum duration of seropositivity prior to diagnosis is of
9 years, indicating the long incubation period prior to clinical diagnosis. This group of
leprosy patients are likely to pose a serious threat to the control of the transmission of leprosy
and have been suggested to be given chemoprophylaxis to prevent the occurrence of new
cases and opening the way for a rational program for eradication.
The following approaches for reduction or control of leprosy transmission have been
suggested (Goulart et al. 2008): (1) household contacts of leprosy patients must be monitored
during the first year after diagnosis of the index case; (2) an additional intradermal BCG
booster dose must be given in Leprosy Control Programs for household contacts, aiming for
protection against leprosy, mainly against MB forms; and (3) the use of the combination of
the three assays may discriminate individuals at a higher risk for developing leprosy from
contacts with significant protection factors, which could lead to a closer monitoring program
for those at risk, as well as a subsidized new and effective control strategy for leprosy.
2.1.6 Mycobacterium leprae, the etiologic agent of leprosy
2.1.6.1 Basic Characteristics
Cellular morphology: M. leprae is a nonmotile, non-sporeforming, microaerophilic, acid-fast-
staining bacterium that usually forms slightly curved or straight rods.
The cell wall core contains peptidoglycan, composed of chains of alternating N-
acetylglucosamine and N-glycolylmuramate linked by peptide cross-bridges, which is linked

REVIEW OF LITERATURE
Page | 20
to the galactan layer by arabinogalactan (Figure 2.6). Three branched chains of arabinan are
in turn linked to the galactan. Mycolic acids are linked to the termini of arabinan chains to
form the inner leaflet of a pseudolipid bilayer. The outer leaflet is composed of a rich array of
intercalating mycolic acids of trehalose monomycolates and mycoserosoic acids of
phthiocerol dimycocerosates as well as phenolic glycolipids (PGLs). The dominant lipid in
the cell wall which gives M. leprae immunological specificity is PGL-1. Recent studies
suggest that PGL-1 is involved in the interaction of M. leprae with the laminin of Schwann
cells, suggesting a role for PGL-1 in peripheral nerve-bacillus interactions (Ng et al. 2000;
Scollard et al. 2006).
Most of the genes necessary to build the peptidoglycan-arabinogalactan-mycolate polymer
appear to be present in the M. leprae genome. A few exceptions are two genes involved in
polyprenyl-phosphate synthesis (dxs-II and idi), a gene (fabH) involved in meromycolate
synthesis, and a glycosyltransferase gene (pimB) involved in the biosynthesis of
phosphatidylinositol, phosphatidylinositol mannosides, lipomannan, and lipoarabinomannan.
Growth: M. leprae has never been grown on artificial media but can be maintained in axenic
cultures (Truman and Krahenbuhl 2001). As a result, propagation of M. leprae has been
restricted to animal models, including the armadillo (Truman 2005) and normal athymic, and
gene knockout mice (Krahenbuhl and Adams 2000). These systems have provided the basic
resources for genetic, metabolic, and antigenic studies of the bacillus. Growth of M. leprae in
mouse footpads also provides a tool for assessing the viability of a preparation of bacteria and
testing the drug susceptibility of clinical isolates (Shepard and Chang 1962; Truman and
Krahenbuhl 2001). The viability of M. leprae harvested from several different sources is now
known to vary greatly, and many standard laboratory practices, such as incubation at 37°C,
rapidly reduce the viability of this organism (Truman and Krahenbuhl 2001). However, M.
leprae stored at 33°C in 7H12 medium has been shown to remain viable for weeks.

REVIEW OF LITERATURE
Page | 21
Figure 2.6. Schematic model of the cell envelope of M. leprae, where the plasma membrane
is covered by a cell wall core made of peptidoglycan covalently linked to the galactan by a
linker unit of arabinogalactan. Three branched chains of arabinan are in turn linked to the
galactan. Mycolic acids are linked to the termini of the arabinan chains to form the inner
leaflet of a pseudolipid bilayer. An outer leaflet is formed by the mycolic acids of trehalose
monomycolates (TMM) and mycocerosoic acids of phthiocerol dimycocerosates (PDIMs) and
PGLs as shown. A capsule presumably composed largely of PGLs and other molecules such
as PDIMs, phosphatidylinositol mannosides, and phospholipids surrounds the bacterium.
Lipoglycans such as phosphatidylinositol mannosides, lipomannan (LM), and
lipoarabinomannan (LAM), known to be anchored in the plasma membrane, are also found
in the capsular layer as shown (Scollard et al. 2006).

REVIEW OF LITERATURE
Page | 22
Metabolism: M. leprae has the capacity to generate energy by oxidizing glucose to pyruvate
through the Embden-Meyerhof-Parnas pathway. Acetyl-coenzyme A from glycolysis enters
the Krebs cycle, producing energy in the form of ATP. In addition to glycolysis for energy
production, M. leprae and M. tuberculosis rely heavily upon lipid degradation and the
glyoxylate shunt for energy production. In this regard, M. leprae contains a full complement
of genes for β-oxidation but, compared to M. tuberculosis, very few genes are capable of
lipolysis. Acetate utilization capability has been lost in M. leprae as a carbon source since
only pseudogenes are present for acetate kinase, phosphate acetyltransferase, and acetyl-
coenzyme A synthase.
Overall, M. leprae has many fewer enzymes involved in degradative pathways for carbon and
nitrogenous compounds than M. tuberculosis. This is reflected in the paucity of
oxidoreductases, oxygenases, and short-chain alcohol dehydrogenases and their probable
regulatory genes. In addition, other major problems associated with metabolism for M. leprae
are that the bacilli have lost anaerobic and microaerophilic electron transfer systems and that
the aerobic respiratory chain is severely curtailed, making it impossible for M. leprae to
generate ATP from the oxidation of NADH. In contrast to the reduction in catabolic
pathways, the anabolic capabilities of M. leprae appear relatively unharmed. For example,
complete pathways are predicted for synthesis of purines, pyrimidines, most amino acids,
nucleosides, nucleotides, and most vitamins and cofactors (Brosch et al. 2000; Eiglmeier et
al. 2001; Scollard et al. 2006; Wheeler 2001).
2.1.6.2 Genome and Proteome
The completion of the genomic sequence of M. leprae is a major advance (Cole et al. 2001),
which has considerably assisted in elucidation of the unique biology of the organism. The M.
leprae genome includes 1605 genes encoding proteins and 50 genes for stable RNA
molecules (Cole et al. 2001). More than half of the functional genes of the M. tuberculosis
genome are absent and replaced by many inactivated genes or pseudogenes in M. leprae
(Figure 2.7). One of the most striking features of M. leprae’s genome is that it possesses
1,133 inactivated genes (genes lost through mutation, or pseudogenes), compared to six
pseudogenes in M. tuberculosis (Cole 1998). When pairwise comparisons of the gene and
protein sets of the leprosy and tubercle bacilli (Cole 1998, 1999; Cole et al. 2001; Tekaia et
al. 1999) were performed, 1,433 proteins were found to be common to both pathogens. After

REVIEW OF LITERATURE
Page | 23
removal of proteins that are shared with all other prokaryotes (except Actinomycetes) and
eukaryotes the sample contained only 333 proteins. Since these pathogenic mycobacteria
occupy similar niches in the human body, where they encounter the same physiological
stresses and immune responses, it was conceivable that the products of some of these genes
may affect highly specialized functions that could be essential for intracellular growth of
mycobacteria. The corresponding proteins or enzymes are suggested to represent novel drug
targets. The 333 candidates identified by comparative mycobacterial genomics are subdivided
into those proteins that are confined to the genus Mycobacterium (there are 219 of these) and
a second group of 114 polypeptides that also occur in Streptomyces or Corynebacteria spp.,
related members of the Actinomycetales kingdom. The latter proteins confer specific
properties on actinomycetes, whereas those that are restricted to mycobacteria are surmised to
play an even more specialized role. M. leprae seems to have jettisoned genes normally
required for replication ex vivo, assuming a unique ecological niche with a very limited host
range and the need for growth within cells. The largest functional groups of genes in M.
leprae are those involved in gene regulation, metabolism and modification of fatty acids and
polyketides, cell envelope synthesis, and transport of metabolites (Cole et al. 2001; Eiglmeier
et al. 2001). Defense against toxic radicals is severely degenerative, as neither katG nor the
narGHJI cluster is functional.
There appears to be limited genetic diversity in M. leprae, less than in M. tuberculosis, and
there is no evidence that the observed genetic variations influence the virulence of M. leprae,
nerve damage, and eventually fibrosis with axonal death.
2.1.7 Treatment
In 1981, the WHO Study Group recommended multiple drug therapy (MDT) for the
following reasons (report of a WHO study group. (Geneva 1982)):
i) To address dapsone resistance and to discourage resistance to other drugs to be used.
ii) To promote compliance and to get away from long-term monotherapy such as dapsone. iii)
To keep rifampicin in all therapeutic regimens because of its powerful bactericidal action and
its effectiveness even when taken once a month. iv) To promote compliance and cost
effectiveness. In 1997, the WHO Expert Committee suggested that it might be possible to

REVIEW OF LITERATURE
Page | 24
reduce duration of MDT for multibacillary disease from 2 years to one year and also
recommended the treatment of a single PB lesion with one dose of ROM (rifampicin,
ofloxacin, and minocycline) (Bhattacharya and Sehgal 2002).
Figure 2.7. The extent of gene reduction and decay in the genome of M. leprae, depicting
(a) the percentage of the total potential open reading frames assigned to major cellular
functions; (b) sub-classification of each category and the number of putative functional genes
in M. leprae (after eliminating the pseudogenes) for each subclass, followed by the
corresponding number in M. tuberculosis. The data were obtained from the databases of the
M. leprae and M. Tuberculosis (Vissa and Brennan 2001).
The on-going WHO recommendation of MDT for adults is as follows: i) For paucibacillary
disease (PB), 600 mg rifampicin monthly and 100 mg dapsone daily in 6 months. ii) For
multibacillary disease (MB), 600 mg rifampicin and 300 mg clofazimine monthly and 100
mg dapsone and 50 mg clofazimine daily in 12 months. iii) For single PB lesion (SLPB),

REVIEW OF LITERATURE
Page | 25
single dose of rifampicin 600 mg, ofloxacin 400 mg, minocycline 100 mg. However, it has
been suggested that because of lack of long-term follow-up, this recommendation has to be
considered experimental. Single-lesion leprosy, which is often indeterminate leprosy, heals
spontaneously in 80% of patients. It is not easy to determine if those of the 20% who develop
classifiable leprosy will benefit from single ROM treatment. It may cure some patients but
will only delay the onset of multibacillary disease in others. In the United States, a biopsy of
a suspicious lesion is recommended to establish the diagnosis and deliver the appropriate
treatment. Other drugs with anti-mycobacterial properties, which may be used if needed as
substitutes in the above current therapeutic programs are rifabutin, ofloxacin, sparfloxacin,
levofloxacin, minocycline, and clarithromycin (Moschella 2004).
2.1.7.1 Dapsone
The first successful chemotherapy using promin for leprosy was reported in 1943 (Faget et al.
1966) at a leprosarium in Carville, Louisiana, USA. Promin (diamiono-azobenzene 4´-
sulfonamide) was introduced in Japan in 1947. Patients were intravenously administrated 5
ml of 30% promin solution. A more effective sulfone, dapsone (4, 4´-diaminodiphenyl
sulphone: DDS), replaced promin 6 years later. Dapsone is still a fundamental anti-leprosy
compound even in the MDT era. Dapsone inhibits folic acid synthesis by competitive
inhibition and is bacteriostatic.
Dapsone, an analogue of p-aminobenzoic acid (PABA), targets dihydropteroate synthase
(DHPS), which is encoded by folP1 and is involved in folic acid synthesis. A relationship
between DHPS mutations and dapsone resistance has been demonstrated. Missense mutations
at codon 53 (ACC) or 55 (CCC) coding threonine or proline in folP1 confer dapsone
resistance (Kai et al. 1999; Williams et al. 2000).
2.1.7.2 Rifampicin
Rifampicin 3-[(4-methyl-1-piperazinyl)-imino]-methyl] is currently a key bactericidal
antibiotic for leprosy treatment. A high bactericidal effect was shown experimentally and
clinically in 1970s (Levy et al. 1976; Rees et al. 1970; Shepard et al. 1972, 1974), leading to
the introduction of rifampicin for leprosy treatment. A single dose of 1,200 mg or a daily
dose of 600 mg for 3 days kills bacilli in patients, and no bacillary growth is shown in mice

REVIEW OF LITERATURE
Page | 26
inoculated with patient bacilli (Levy et al. 1976).
Rifampicin targets the beta (β) subunit of RNA polymerase, which is encoded by rpoB.
Rifampicin binding to the β subunit inhibits DNA-dependent mRNA transcription. A
correlation between rifampicin resistance and mutations at highly conserved regions in the
rpoB gene has been shown. Isolates confirmed to be rifampicin-resistant harbor missense
mutations at codon 407, 410, 420, 425, and 427 (Cambau et al. 2002; Cambau et al. 1997;
Honore and Cole 1993; Matsuoka et al. 2003; Matsuoka et al. 2000; Williams et al. 1994;
Zhang et al. 2004). In addition, one isolate had a 6-bp insertion in codon 409 (Honore and
Cole 1993). Various mutations detected from isolates confirmed to be rifampicin resistant
include codon 407 CAG (Gln) to GTG (Val) (Cambau et al. 2002), codon 410 GAT (Asp) to
TAT (Tyr) (Zhang et al. 2004), codon 420 CAC (His) to GAC (Asp) (Cambau et al. 2002;
Honore and Cole 1993), codon 425 TCG (Ser) to TTG (Leu) (Cambau et al. 2002; Cambau et
al. 1997; Honore and Cole 1993; Maeda et al. 2001; Matsuoka et al. 2003; Matsuoka et al.
2000; Williams et al. 1994) ATG (Phe) (Honore and Cole 1993), TTC (Met) (Honore and
Cole 1993), and codon 427 CTG (Leu) to GAG (Val) (Cambau et al. 2002). Of 29 mutants,
22 isolates had the mutation TTG at codon 425. The high frequency of this mutation is
similar to the frequency of this mutation in Mycobacterium tuberculosis (Honore and Cole
1993; Williams et al. 1994). In addition, a codon 416 amino acid substitution of Ser to Cys
(TCG-TGT) was found, but results of the mouse footpad susceptibility test were unavailable
for this isolate. M. tuberculosis with this mutation is resistant to rifampicin (Musser 1995;
Williams et al. 1994). Therefore, it has been concluded that this mutation confers rifampicin
resistance to M. leprae. Incidentally, the mutation Gly408Asp was detected together with a
mutation at codon 420 that is known to confer rifampicin resistance. Thus, it has been unclear
whether the Gly408Asp mutation is related to rifampicin resistance. A total of 108
rifampicin-susceptible strains determined by the mouse footpad test have not been found to
contain any mutations between codons 407 to 427 (Cambau et al. 2002; Honore and Cole
1993; Matsuoka et al. 2007; Williams et al. 1994).
2.1.7.3 Clofazimine
Clofazimine [(3-p-chloroanilino)-10-(p-chlorophenyl)-2,10-dihydro-2-(isopropylimino)
phenazine], is bactericidal for M. leprae. The mechanism of action is not fully elucidated;
however, a possible bactericidal mechanism through the binding of GC-rich domains is

REVIEW OF LITERATURE
Page | 27
suggested (Morrison and Marley 1976). No molecular background for drug resistance to
clofazimine is known. Clofazimine was first used for leprosy treatment in 1962 (Browne and
Hogenzeil 1962). It is anti-inflammatory and is also used to control the type 2 reaction
(erythema nodosum leprosum: ENL) in MDT. Although clofazimine has been used for
leprosy treatment for over four decades, reported drug resistance is rare (Browne and
Hogenzeil 1962; Ebenezer et al. 2002; Shetty et al. 1996; Warndorff-van Diepen 1982).
2.1.7.4 Ofloxacin
Ofloxacin (4-fluoroquinolone) is a moderate bactericidal antibiotic for M. leprae. Its
bactericidal activity for M. leprae was first demonstrated in 1986 by the mouse footpad
method and subsequently by a clinical trial (Gelber et al. 1992; Grosset et al. 1990; Saito et
al. 1986). Ofloxacin binds to the A subunit of DNA gyrase (gyrA) and inhibits DNA
replication. Association between mutations within the highly conserved region of gyrA,
coded by the gyrA gene, and quinolone resistance was revealed in most resistant strains of
mycobacterium (Cambau et al. 1994; Takiff et al. 1994). The first ofloxacin-resistant M.
leprae was found in 1994 (Cambau et al. 1997). Two other cases of ofloxacin resistant M.
leprae from Japanese relapsed cases were reported in 2000 and 2003 (Matsuoka et al. 2003;
Matsuoka et al. 2000). Four other possible ofloxacin-resistant cases have been found (Maeda
et al. 2001). Three isolates confirmed to be ofloxacin resistant harbored the mutation Ala-Val
(GCA-GTA) at codon 91 (Cambau et al. 1997; Matsuoka et al. 2003; Matsuoka et al. 2000)
in the gyrA gene. One isolate in which the susceptibility could not be examined by the mouse
footpad method had the mutation Gly-Cys (GGA-TGC) at codon 89 (Maeda et al. 2001).
Two other amino acid changes, Ser at 91, and Asp at 94 (same codon numbers as M.
tuberculosis), in gyrA of M. tuberculosis have been associated with quinolone resistance
(Cambau and Jarlier 1996). It seems that mutations at codons 89, 92, and 95 in gyrA of M.
leprae also confer quinolone resistance.
2.1.7.5 Minocycline
Minocycline (7-dimethylamino-6-demethyl-6-deoxy-tetracycline) is the only tetracycline
group active against M. leprae. Efficacy of minocycline against M. leprae was confirmed in
1987 (Gelber 1987). It is bactericidal and its activity is additive when combined with other
anti-leprosy drugs (Gelber and Rea 1991; Ji et al. 1991).

REVIEW OF LITERATURE
Page | 28
Minocycline is used with rifampicin and ofloxacin in MDT only for the single lesion
paucibacillary (SLPB) cases. Tetracyclines inhibit protein synthesis by binding to the 30S
ribosomal subunit, blocking the binding of aminoacyl transfer RNA to the messenger RNA
ribosomal complex (Taylor and Chau 1996). To date, no minocycline-resistant cases are
known (Matsuoka 2010).
2.1.8 Vaccination
Anti-leprosy vaccination can be immunoprophylactic or immunotherapeutic (Azulay 2002;
Talwar 1999; Zaheer et al. 1993). The aim in immunoprophylactic approach is to restore the
host recognition of shared mycobacterial antigens to promote Th1 responses, to induce CD8+
cytotoxic cells, and to downregulate the proportion of T cells producing Th2 interleukins
(Naafs 2000). The aim of immunotherapy is to switch off the mechanisms leading to
immunopathology and to increase intracellular mechanisms by which bacilli are killed. The
first vaccine used was BCG, but its failure to protect certain populations clearly indicated that
an improved vaccine against leprosy was needed. Among the vaccines being used or explored
are Mycobacterium w., Mycobacterium ICRC (M avium intracellulare), bacillus Calmette-
Gue´rin plus heat-killed M. leprae, Mycobacterium tufu and Mycobacterium Habana (Azulay
2002). The enthusiasm for use of vaccines has lessened because of the significantly favorable
impact of MDT on leprosy. However, one cannot deny the potential usefulness of a proven
effective vaccine in highly endemic countries such as India and Brazil. Some of the best
information about vaccination is from India where the Mycobacterium w and Mycobacterium
ICRC vaccines have been used in the field (Talwar 1999). The comparative genomics of
different mycobacterial species have spurred the identification of new vaccine targets and the
successful preliminary trials of rationally constructed knock outs in BCG strain (Brodin et al.
2004) in providing improved resistance against M. tuberculosis infection is a step forward in
this direction.
2.1.8.1 Lacunae in leprosy vaccine studies
It is worthwhile to define the lacunae in vaccines currently proposed for prevention of leprosy
(Sehgal and Sardana 2007):-

REVIEW OF LITERATURE
Page | 29
i) Very few well-performed double blind randomized controlled trials with proper
follow up are established (Sehgal and Sardana 2007; Setia et al. 2006).
ii) The largest vaccine trial which has been conducted in recent times, has found a
maximum efficacy of 67% (BCG+ heat killed M. leprae [HKML]) which still does
not meet the criteria of usage (Gupte 2001).
iii) Scientific analysis of data has shown that observational studies overestimate the
efficacy of vaccines (Setia et al. 2006).
2.2 IMMUNOLOGY
Mycobacterium leprae probably enters the body by way of the nose and spreads to the skin
and nerves via circulation. The host’s immunological response determines the clinical forms
that develop. Figure 2.8 depicts genes and gene products involved in the immune response to
M. leprae.
2.2.1 Innate immunity
An effective innate immune response in combination with the low virulence of the leprosy
bacillus may underlie resistance to the development of clinical disease. Dendritic cells (DCs)
uptake M. leprae and subsequent local production of cytokines and chemokines regulates
inflammation and influences the course of the adaptive cell-mediated immunity into a Th1 or
Th2 response. Although DCs are known to be effective presenters of M. leprae antigens,
major histocompatibility complex (MHC) class I and II expression is downregulated in
monocyte-derived DCs infected with M. leprae bacilli. On the other hand, DCs stimulated
with M. leprae membrane antigens upregulate both MHC class II and CD40 ligand-
associated interleukin-12 (IL-12) production, suggesting that whole live bacilli may suppress
the interaction of DCs and T cells (Gulia et al. 2010; Maeda et al. 2003).
The cytokine profile present in the lesion also appears to be correlated with Toll-like receptor
(TLR) function: Th1-type cytokines are associated with TLR1 and TLR2 activation, and Th2-
type cytokines are associated with inhibition of activation. The expression of TLR1 and
TLR2 has been found to be stronger on monocytes and DCs in TT lesions than in the LL
counterparts. In addition, in vitro studies have shown that the M. leprae 19-kDa and 33-kDa

REVIEW OF LITERATURE
Page | 30
lipoproteins could activate monocytes and monocyte derived DCs through TLR2 (Gulia et al.
2010; Krutzik et al. 2003)
Figure 2.8. Genes and gene products involved in the immune response to M. leprae,
depicting molecular and cellular interactions known or postulated to play a role in the
immune response to M. leprae. This comprises of TLRs activation by Mycobacterium leprae
antigens, IL10, IL12, IL4 and TNFα regulatory pathways, generation of Th1 or Th2 cell
responses. T-cell-dependent acquired immune responses typically require antigen-presenting
cells (APCs) to present antigen-derived peptides (after phagocytosis) within major
histocompatibility complex (MHC) molecules to naive T (T lymphocyte) cells, resulting in
Helper T 1 (Th1) and Helper T 2 (Th2) responses.
Molecule symbols are: C3, complement factor 3; CR1, complement receptor 1; DEFB1, beta
defensin 1; IFNγ, gamma interferon; IL10, interleukin-10; IL12, interleukin-12; LTA4H,
leukotriene A4 hydrolase; MHC II, major histocompatibility complex class II; MBL2,
mannose binding lectin 2; MRC1, mannose receptor; NOD2, nucleotide oligomerization
domain 2; RIP2, receptor-interacting kinase; SLC11A1, solute carrier family 11, member 1
(also known as NRAMP); TCR, T-cell receptor; Th1, T-cell helper type 1; Th2, T-cell helper
type 2; TLR, Toll-like receptor; TNF, tumor necrosis factor (modified from (Misch et al.
2010)).

REVIEW OF LITERATURE
Page | 31
Recent investigations have shown that plasmacytoid DCs are not involved in the immune
response against M. leprae whereas FoxP3-positive cells (markers of regulatory T cells, or
Treg cells) are present in 95% of the cases in a retrospective immunohistochemical study,
with an average density of 2.9% of the infiltrate. Their distribution was not related to
granulomatous structures or special locations (Gulia et al. 2010; Massone et al. 2010).
2.2.1.1 Receptors of innate immunity
Cells of the innate immune system are equipped with germ line encoded pattern recognition
receptors (PRRs), which recognize pathogen-associated molecular patterns (PAMPs), which
are shared among groups of pathogens.
Toll-like receptors
Mammalian Toll-like receptors (TLRs) are crucial for the recognition of microbial pathogens
by macrophages and dendritic cells during innate immunity. TLRs are phylogenetically
conserved transmembrane proteins that contain repeated leucine-rich motifs in their
extracellular domains. The cytoplasmic signaling domain is linked to the IL-1 receptor-
associated kinase, which activates transcription factors such as NF-κβ to induce cytokine
production. Ten TLRs have been identified in humans, of which TLR2-TLR1 heterodimers,
TLR2 homodimers, and TLR4 appear to be significant in the recognition of mycobacteria.
TLRs have been found to be necessary for the optimal production of IL12 (Brightbill et al.
1999), a proinflammatory cytokine responsible for the induction of Th-type immunity, as
well as TNFα (Underhill et al. 1999) a cytokine important in cellular activation and
granuloma formation and also implicated in the tissue destruction associated with leprosy
reactions.
A number of mechanisms have been identified, which regulate TLR function in leprosy. In
addition to the ability of IL4 to downregulate TLR2/1 expression, it also inhibits TLR2/1-
induced cytokine responses (Krutzik et al. 2003). IL10 had no effect on TLR2/1 expression
but strongly inhibit TLR2/1-induced cytokine release (Krutzik et al. 2003). Activation of
LILRA2, which is differentially expressed in lepromatous leprosy (L-lep) versus tuberculoid
leprosy (T-lep) lesions, inhibited TLR2/1-induced IL12 release but preserved IL10 release
(Bleharski et al. 2003). Similarly, oxidized phospholipids inhibited TLR2/1-induced IL-12

REVIEW OF LITERATURE
Page | 32
release but preserved IL10 release (Cruz et al. 2008). The ability of M. leprae to upregulate
tryptophan aspartate containing coat protein (TACO), known to be expressed in macrophages
containing M. leprae in vitro and in disease lesions (Suzuki et al. 2006), was shown to
downregulate TLR2-mediated signalling (Tanigawa et al. 2009).
Nucleotide-binding oligomerization domain 2 (NOD2) is a cytoplasmic receptor belonging to
the NOD-like receptor family. It not only shares homology to TLRs in containing leucine rich
repeats but also encodes a CARD domain. It mediates the response to peptidoglycan,
including that derived from mycobacteria, by sensing muramyl dipeptide (MDP) (Girardin et
al. 2003; Yang et al. 2007). Triggering of NOD2 by MDP activates NF-κB through the
adaptor molecule, RIP2. In addition, MDP can also activate the inflammasome, by
recruitment of caspase-1, leading to the proteolytic cleavage and activation of IL-1β
(Delbridge and O'Riordan 2007). NOD2 deficiency in a mouse model of tuberculosis (TB)
resulted in increased susceptibility to infection at late time points (Divangahi et al. 2008;
Gandotra et al. 2007). NOD2 polymorphisms, not those associated with Crohn’s disease,
were shown to be associated with susceptibility to TB (Austin et al. 2008) and those
associated with Crohn’s disease, were shown to be associated with leprosy (Zhang et al.
2009). NOD2 was not only found to mediate the response to mTB in human monocytes and
synergize with lipoprotein in activating monocyte cytokine responses (Ferwerda et al. 2005),
but also synergized with transfected DNA in activating the IFN-β pathway (Leber et al.
2008).
C-type lectin receptors
These receptors bind specifically to carbohydrate moieties on pathogens (Allavena et al, 2004)
and facilitate internalization for antigen processing and presentation. The mannose receptor (also
called CD206), is expressed primarily on cells of the myeloid lineage, especially mature
macrophages, although not on monocytes, and on some subsets of dendritic cells. The
macrophage has been shown to play a role in uptake of virulent mycobacteria (Schlesinger,
1993), and a major mycobacterial ligand for this receptor is lipoarabinomannan (Prigozy et al,
1997). It has also been reported that uptake of mycobacteria via the mannose receptor does not
elicit a respiratory burst (Astarie-Dequeker et al, 1999).

REVIEW OF LITERATURE
Page | 33
DC-SIGN another C-type lectin receptor is expressed on dendritic cells and also recognizes
pathogens via the binding of mannose-containing structures (van Kooyk and Geijtenbeek, 2003).
In studies using M. tuberculosis, DC-SIGN has been shown to be the major receptor on DC for
the bacilli (Tailleux et al, 2003). Again, the primary mycobacterial ligand for DC-SIGN was
mannose-capped lipoarabinomannan (Koppel et al, 2004; Maeda et al, 2003; Tailleux et al, 2003;
van Kooyk and Geijtenbeek, 2003). Some investigators have proposed that virulent mycobacteria
may subvert DC function via DC-SIGN possibly through the inhibition of IL12 production
(Nigou et al, 2001) and the induction of IL10 (Geijtenbeek et al, 2003). Engagement of DC-
SIGN has also been suggested to inhibit TLR signaling (van Kooyk and Geijtenbeek, 2003).
2.2.1.2 Alternative mechanisms of infection
Recent work has suggested that the successful infection and survival of M. leprae could be
associated with the ability of M. leprae to regulate cytokine production or to drive Th1 or
Th2 responses. Other pathways including insulin-like growth factor have also been
implicated (Rodrigues et al, 2010; Gulia et al, 2010) Lipid droplet (LD) formation and
prostaglandin 2 (PGE2) productions are directly correlated, indicating that M. leprae-induced
LDs constitute intracellular sites for eicosanoid synthesis and that foamy cells may be critical
regulators in subverting the immune response in leprosy (Mattos et al, 2010; Gulia et al,
2010).
2.2.2 Adaptive immunity: development of cell-mediated immunity
Second branch of immune response, the adaptive immunity, plays an important role in clearance
of pathogens. Cells of the T-cell lineage play an essential role in resistance to M. leprae.
2.2.2.1 Role of T lymphocyte subsets in Leprosy
Initial studies to identify and characterize T lymphocytes in lesions have shown striking
differences in the CD4:CD8 (T-helper/inducer: T suppressor/cytotoxic) ratio at the poles of
the leprosy spectrum. In tuberculoid leprosy lesions, the CD4 population predominates with a
CD4:CD8 ratio of 1.9:1 and in lepromatous lesions the CD8 population predominates with a
CD4: CD8 ratio of 0.6:1. However, the CD4:CD8 ratios are independent of those in the blood
of the patients suggesting selective migration of cells into, proliferation within, or retention
in, lesions (Modlin et al, 1986). The proportions and distributions of CD4, CD8

REVIEW OF LITERATURE
Page | 34
subpopulations and their localization in the granulomas also shows striking differences
(Modlin et al, 1988). In tuberculoid lesions, the T-helper/memory: T naïve ratio has been
reported to be 1:1 in blood but 14:1 in lesions. In contrast, in the lepromatous lesions one half
of the CD4+ cells belong to the naive T cell subset, with majority of the CD8 + cells belonging
to the T-suppressor subset (i.e CD8 + CD28 -). CD8+ cells of the T-cytotoxic phenotype (i.e
CD8+ CD28+) are predominant in tuberculoid lesions.
The microanatomic localization and association of T cell subpopulations has shown T-
helper/memory (CD4+, CD45RA) cells in close association with macrophages in the core of
the granuloma with relative restriction of T-cytotoxic (CD8+ CD28+) cells to the mantle
surrounding the tuberculoid granuloma. The T naïve (CD4+ CD45RO) or suppressor inducer
subset (CD8+ CD28-) are localized to the mantle surrounding the granuloma near CD8+
CD28+ T cytotoxic cells where they perhaps restrict the cell mediated immune response from
causing extensive tissue damage (Modlin et al, 1982; Narayanan et al, 1983; Wallach et al,
1984; Longley et al, 1985). In lepromatous granulomas, the T- suppressor subset (CD8 +
CD28-) cells were reported to be admixed with macrophages and CD4+ cells, which could
facilitate suppression of the cell- mediated immune response.
The most puzzling and fundamental immunological issue in lepromatous leprosy that remains
unresolved is that of selective and specific unresponsiveness. CD8+ lines and clones derived
from lepromatous lesions but not from tuberculoid lesions have been reported to suppress
mitogen responses in vitro in an MHC class II restricted manner (Modlin et al, 1986,
Salgame et al, 1991). It has also been observed that these CD8+ cells secrete more IL4 which
might be responsible for downregulating macrophage activation by IFNγ (Salgame et al,
1991).
MHC class II restricted CD4+, MHC class I restricted CD8+, non MHC CD1 restricted CD4+
T cells and NKT cells are known to play an important role in host defense against leprosy
(Yamamura et al, 1991; Salgame et al, 1991; Sieling et al, 1999; Sieling et al, 2000; Gansert
et al, 2003; Sieling et al, 2005). Studies with these lymphocyte subsets (cell lines and clones)
have also corroborated the fact that there is skewness of particular lymphocyte subset
associated with protective immune responses in tuberculoid patients; whereas there is
absence or inadequate populations of these protective lymphocytes in lepromatous patients.
Simultaneous measurements of memory T cell 1(MT1 CD45 RA-, CD62L-, CD11a bright;

REVIEW OF LITERATURE
Page | 35
IFNγ biased) and memory T cell 2 (MT2, CD45RA-, CD62L+, CD11a dim IL4 biased) of
peripheral blood of leprosy patients has shown that the ratios of MT1/MT2 differed
significantly in patients with tuberculoid and lepromatous leprosy, indicating that cells
become polarized for one type or the other in leprosy (Mitra et al, 1999). T cells have been
shown to respond to around 30 different antigens, but it is still unknown if these antigens
induce protective immunity or contribute to immune dysfunction and disease progression. A
systematic comparison between T-cell epitopes recognized by healthy contacts and different
groups of leprosy patients in the context of HLA molecules has been proposed to facilitate
the understanding of the distinction between protective and harmful T-cell responses in
mycobacterial diseases. The availability of the M. lepare genome sequence and comparative
genomics of M. leprae with other mycobacterial species has precipitated research in this
direction. The functional status of T cells in leprosy has clearly delineated a striking
dichotomy (Th1/Th2) in the nature of immune responses elicited by the two polar forms. The
genomic profiling of clinically categorized leprosy patients reinforces the fact that the
skewness or imbalance between responses of Th1 and Th2 cells is involved in disease
progression (Bleharski et al, 2003). The role of cytokines, IL18 (Garcia et al, 1999), IL12R
(Kim et al, 2001), IL15 (Jullien et al, 1997), IL10 and IL4 (Seiling et al, 1993), TNFα
(Kaplan et al, 1994; Khanolkar-Youmg et al, 1995; Lima et al. 2000), TGFβ1(Goulart et al,
1996) IFNγ (Libraty et al, 1997), costimulatory molecules B7-CD28 (Schlienger et al, 1998),
CD40-CD40L interactions (Yamauchi et al, 2000) and signaling lymphocytic activation
molecule (SLAM, CD150) (Bleharski et al, 2001; Garcia et al, 2001) in influencing the level
and pattern of cell mediated immune response to leprosy has also been investigated. All
together these observations suggest that the outcome of leprosy is believed to be determined
at an early point following infection which could be partly determined by host genetic
factors.
2.2.2.2 Neutrophil recruitment One of the histological differences between ENL and lepromatous leprosy is the
characteristic infiltration of neutrophils in ENL lesions. Lee and colleagues (Lee et al, 2010)
investigated the mechanisms of neutrophil recruitment at the site of disease. The gene
expression profile of ENL lesions has been shown to integrate pathway of TLR2 and Fc
receptor activation, neutrophil migration, and inflammation. Major aspects of this pathway
include the following: (a) FcR or TLR2 induction of IL-1b release; (b) endothelial activation,

REVIEW OF LITERATURE
Page | 36
including the upregulation of E-selectin and subsequent neutrophil binding; and (c)
upregulation of inflammatory mediators associated with both neutrophils and
monocytes/macrophages. Thalidomide, which is a highly effective agent used in the
treatment of ENL and is known to reduce neutrophil infiltration in lesions was shown to
target individual events in this inflammatory pathway (Lee et al, 2010).
2.2.3 Cytokines in leprosy
The Th1/Th2 paradigm, based on functional discrimination of T-helper cells according to
their pattern of cytokine production, asserts that Th1 and Th2 cells promote a cellular and
humoral immune response, respectively (Mosmann et al, 1986). This functional
differentiation has offered an attractive hypothesis to explain the differences between
tuberculoid and lepromatous responses to M. leprae. Many studies have revealed a
predominance of IL2, TNFα, and IFNγ transcripts in tuberculoid lesions and IL4 and IFNγ in
lepromatous ones, gene expression profiles consistent with Th1 and Th2 patterns,
respectively (Arnoldi et al, 1990; Flad et al, 1990; Mutis et al, 1993; Sieling et al, 1994;
Yamamura et al, 1991). CD4+ clones isolated from TT lesions have been reported to secrete
primarily IFNγ, whereas a CD4+ clone from an LL lesion produces predominantly IL4
(Sieling et al, 1994), and CD8+ clones isolated from LL patients likewise generate large
amounts of IL4 (Salgame et al, 1991).
Circulating leukocytes and T-cell lines from tuberculoid patients stimulated by M. leprae in
vitro have also generally been found to produce a Th1 cytokine pattern, while leukocytes and
T-cell lines from lepromatous patients have generally been shown to produce a Th2 cytokine
pattern (Misra et al, 1995; Nath et al, 2000).
In summary, studies of cytokine gene expression in leprosy lesions thus far have given us a
more detailed description of the immunological parameters of the polar types of leprosy,
confirming and supporting the original concept that tuberculoid lesions are manifestations of
delayed hypersensitivity and cellular immunity and that lepromatous ones result when
immune recognition occurs (as indicated by antibody production) but the host is unable to
develop cellular immunity to M. leprae (Scollard et al, 2006) . However, these studies have
not yet revealed the mechanisms by which the cellular immune response is so extraordinarily
titrated to produce the entire leprosy spectrum.

REVIEW OF LITERATURE
Page | 37
2.2.3.1 Mechanisms of nerve injury
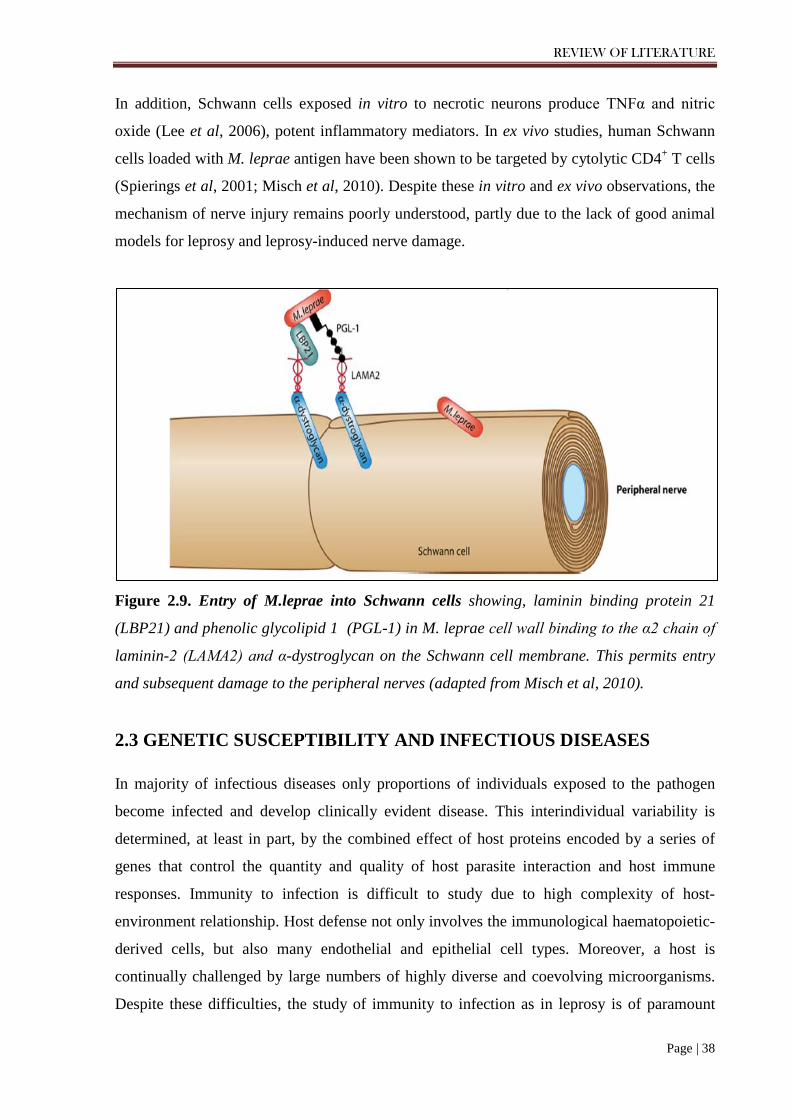
M. leprae is an obligate intracellular pathogen with a distinct tropism for Schwann cells of
the peripheral nervous system and for macrophages (Boddingius, 1974; Schlesinger and
Horwitz, 1991; Spierings et al, 2000; Stoner, 1979). The pronounced specificity of M. leprae
for Schwann cells is related to the tissue-specific expression of laminin-2 on Schwann cells.
M. leprae contains a phenolic glycolipid (PGL-1) that has been shown to bind to the G
domain of the α2 chain of laminin-2 on the membrane of Schwann cells (Ng et al, 2000). The
uptake of M. leprae into the Schwann cell is thought to occur when the PGL–laminin-2
complex interacts with α-dystroglycan, the laminin-2 receptor located on the Schwann cell
membrane (Ng et al, 2000; Rambukkana et al, 1997; Rambukkana et al, 1998). Laminin
binding protein 21 (LBP21) also mediates the intracellular entry of M. leprae into the
Schwann cell (Figure 2.9) (Rambukkana, 2001; Shimoji et al, 1991). A variety of other
receptors on monocytes and macrophages have also been proposed to facilitate intracellular
entry by M. leprae. On monocytes, PGL-1 mediates M. leprae phagocytosis via the
complement receptor CR3 and serum complement 3 (Schlesinger and Horwitz, 1991). On
macrophages, complement receptors 1 and 4 help phagocytose M. leprae (Schlesinger and
Horwitz, 1991). Another candidate phagocytic receptor on the macrophage is the mannose
receptor, which binds mannose and other carbohydrate moieties on mycobacteria (Kery et al,
1992; Schlesinger et al, 1996).
Nerve injury is the hallmark of progressive leprosy infection and involves both myelinated
and unmyelinated nerves (Hagge et al, 2002; Job, 1989; Job, 1971). Biopsy specimens taken
from affected nerves of leprosy patients has revealed perineural and intraneural inflammation
and, in myelinated fibers, eventual demyelination (Scollard, 2008). At the tissue level, the
influx of immune cells and interstitial fluid (edema) inside inflexible nerve sheaths has been
shown to cause nerve injury through mechanical compression and ischemia (Scollard, 2008).
At the cellular level, immunological injury is thought to be a major mechanism of nerve
damage. The immune-mediated injury hypothesis has indirect support from in vitro studies in
which the stimulation of monocytes or macrophages with M. leprae induces proinflammatory
cytokines such as TNFα, IL12, IL6, IL1β, IL18, and IL15 (Garcia et al, 1999; Jullien et al,
1997; Krutzik et al, 2003; Misch et al, 2008). For example, the 19-kDa protein of M. leprae,
which is recognized by the TLR2/1 heterodimer, elicits a robust proinflammatory cytokine
response (Krutzik et al, 2003) and induces apoptosis in Schwann cells (Oliveira et al, 2003).
REVIEW OF LITERATURE
Page | 38
In addition, Schwann cells exposed in vitro to necrotic neurons produce TNFα and nitric
oxide (Lee et al, 2006), potent inflammatory mediators. In ex vivo studies, human Schwann
cells loaded with M. leprae antigen have been shown to be targeted by cytolytic CD4+ T cells
(Spierings et al, 2001; Misch et al, 2010). Despite these in vitro and ex vivo observations, the
mechanism of nerve injury remains poorly understood, partly due to the lack of good animal
models for leprosy and leprosy-induced nerve damage.
Figure 2.9. Entry of M.leprae into Schwann cells showing, laminin binding protein 21
(LBP21) and phenolic glycolipid 1 (PGL-1) in M. leprae cell wall binding to the α2 chain of
laminin-2 (LAMA2) and α-dystroglycan on the Schwann cell membrane. This permits entry
and subsequent damage to the peripheral nerves (adapted from Misch et al, 2010).
2.3 GENETIC SUSCEPTIBILITY AND INFECTIOUS DISEASES
In majority of infectious diseases only proportions of individuals exposed to the pathogen
become infected and develop clinically evident disease. This interindividual variability is
determined, at least in part, by the combined effect of host proteins encoded by a series of
genes that control the quantity and quality of host parasite interaction and host immune
responses. Immunity to infection is difficult to study due to high complexity of host-
environment relationship. Host defense not only involves the immunological haematopoietic-
derived cells, but also many endothelial and epithelial cell types. Moreover, a host is
continually challenged by large numbers of highly diverse and coevolving microorganisms.
Despite these difficulties, the study of immunity to infection as in leprosy is of paramount

REVIEW OF LITERATURE
Page | 39
importance, since it provides an insight into physiological, ecological and evolutionary
aspects of immunity (Figure 2.10).
Figure 2.10. A schematic presentation showing host–environment interaction stages in the
course of infection such as leprosy, depicting how the exposure to an infectious agent (M.
leprae) does not always result in infection (leprosy). In case of Mycobacterium leprae
infection, >95% of individual resist disease by establishing protective immunity and only the
minority develops leprosy. The overall susceptibility/resistance to infection is under host and
environmental control. Host factors might be genetic (for example, mutation in a gene
involved in immunity to infection) or non-genetic (for example, skin lesion), and might act at
the level of exposure to (cutaneous and mucosal barriers) or infection with (innate and
adaptive immunity) the microorganism. In leprosy, several genes modulate cell-mediated
immunity and some have a role in either susceptibility to leprosy per se or to leprosy type.
Environmental factors might be microbial (for example, virulence factors) or related to the
mode of exposure (for example, air temperature), and might have an impact at each stage of
the interaction (modified from (Casanova and Abel 2004)).

REVIEW OF LITERATURE
Page | 40
2.3.1 Assessing the genetic contribution to leprosy risk Leprosy has long been observed to be a disease that aggregates in families (Brown and Stone,
1958; Hansen, 1875; Job, 1980; Propping and Vogel, 1976). In the 19th century, the
hereditary versus environmental origins of this illness were vigorously debated (Browne,
1985; Hansen, 1875) driven in part by the social stigma attached to leprosy. The discovery of
the M. leprae bacillus by Gerhard Henrik Armauer Hansen in 1873 (Hansen, 1875; Harboe,
1973) settled the argument for the time being in favor of an environmental etiology. In the
modern era it has become clear that while encounter with the M. leprae pathogen is necessary
for infection, it is not sufficient, since the majority of exposed individuals do not become
infected. Host genetic factors may therefore largely determine which exposed individuals
develop disease. Evidence that host genes influence susceptibility to leprosy or its various
clinical forms is supported by data from a wide variety of sources. These sources include twin
studies, segregation analyses, family-based linkage and association studies, candidate gene
association studies, and most recently, genome-wide association studies (GWASs). The most
definitive twin study of leprosy by Chakravartti and Vogel, (1973) enrolled 62 monozygous
and 40 dizygous twin pairs from three different regions in India and found a 3-fold-greater
concordance rate for the type of leprosy disease in monozygotic twins than in dizygotic twins
(Chakravartti and Vogel, 1973). Segregation analyses determine whether or not there is a
segregation of disease among more closely related individuals (evidence of a “major gene
effect”) and what mode of inheritance is at work (dominant, recessive, or additive) (Stein,
2010). A number of segregation studies have been carried out for leprosy (Abel and
Demenais, 1988; Abel et al, 1995; Feitosa et al, 1995; Haile et al, 1985; Lazaro et al, 2010;
Ranque et al, 2005; Serjeantson et al, 1979; Smith, 1979; Wagener et al, 1988) several of
which have detected the presence of a recessive or codominant mode of inheritance for
leprosy per se or for non-lepromatous-leprosy (Abel and Demenais, 1988; Feitosa et al, 1995;
Haile et al, 1985; Lazaro et al, 2010; Smith, 1979). Based on the results of complex
segregation analyses, linkage and association studies, a two-stage model of genetic
susceptibility to leprosy was proposed (Figure 2.11). The first stage representing an overall
susceptibility/resistance to the infection, which is a manifestation of innate resistance
mediated by cells of the monocyte lineage. If innate resistance is insufficient and infection
becomes established, genetic influence is expressed at the second level, i.e., influencing the
degree of specific cellular immunity and delayed hypersensitivity generated by the infected
individual (Scollard et al, 2006). In addition, the limited genomic diversity between M.

REVIEW OF LITERATURE
Page | 41
leprae isolates implies that microbial factors do not play a major role in determining the
clinical outcome. As there is no relevant animal model for human leprosy, forward genetics is
the main method used to identify the genes, and consequently the immunological pathways
involved in the human response to M. leprae (Figure 2.12).
Figure 2.11. M.leprae infection and the two stage genetic control of susceptibility to
infection (Malhotra Ph.D. thesis 2005).

REVIEW OF LITERATURE
Page | 42
Figure 2.12. Strategies for identifying susceptibility genes that contribute to leprosy
phenotypes. There are mainly two methods : Candidate gene study and genome-wide
association studies. The role of the variant (common/ rare) in candidate gene identified by
either approach is further investigated by testing its associations with the leprosy phenotype
under study, using population-based (case-control) or family-based designs such as the
transmission disequilibrium test (TDT). Then role of associated polymorphism is functionally
validated (modified from (Moller et al. 2010)).
2.3.2 Study Design for Complex Diseases
It has been widely presumed for many infectious diseases, including leprosy, that
susceptibility is governed by polygenic inheritance, or the additive effect of multiple genes,
each with a modest effect on the infectious phenotype. Two study designs are typically used
to examine diseases with complex inheritance patterns: linkage studies of families and

REVIEW OF LITERATURE
Page | 43
association studies (candidate gene or genome wide). Linkage studies look for evidence of
the segregation of a genetic marker and a disease trait within families. Genetic association
studies assess whether the frequency of a particular genetic variant differs between
individuals with a disease compared to unrelated controls.
2.3.2.1 Linkage studies
Linkage studies often follow up on the results of segregation analyses in the same study
population. Several genome-wide linkage studies of leprosy susceptibility have been
performed by using a family based design (Mira et al, 2003; Siddiqui et al, 2001). A major
strength of genome-wide linkage studies is the absence of bias: no hypothesis as to which
chromosomal loci or genes might be linked to disease status is required. Linkage studies
genotype microsatellites or SNPs (single-nucleotide polymorphisms) spaced evenly
throughout the genome, typically every 10 centimorgans (cM). Susceptibility loci identified
in these studies are then investigated further by higher-resolution mapping of markers or gene
alleles and linked to disease traits (Alcais et al, 2007; Mira et al, 2004; Tosh et al, 2002).
Linkage studies have also been used to evaluate candidate regions (Jamieson et al, 2004;
Wallace et al, 2004) and candidate genes (Abel et al, 1998; Santos et al, 2002) in leprosy.
Significance in these studies is reported via Z scores, LOD scores (logarithm of odds), or P
values (Lander and Kruglyak, 1995). The proposed criteria for significance in genome-wide
linkage studies are somewhat stringent, given the risk of false positives due to the large
number of markers studied. For example, one common genome-wide linkage study design
relies on sibling pairs. Suggested threshold levels of significance for “suggestive linkage,”
“significant linkage,” and “highly significant linkage” for individual markers in these sibling
pair genome-wide linkage studies are P values of 7x10⁻⁴, 2 x10⁻⁵ and 3x10⁻⁷, respectively
(corresponding to LOD scores of 2.2, 3.6, and 5.4, respectively) (Lander and Kruglyak,
1995). The suggested P value for validating linkage in replication studies (which typically
focus on a candidate region of ~20 cM in size) is a P value of 0.01 (Lander and Kruglyak,
1995). Linkage studies are also the most powerful study design for identifying rare variants
of genes that confer a large risk to disease (Ardlie et al, 2002; Stein, 2010). Conversely, they
have reduced statistical power to detect genes with modest or weak effects on disease risk,
even when hundreds of families are included (Altmuller et al, 2001; Ralston and
Crombrugghe, 2006; Risch and Merikangas, 1996; Stein, 2010).

REVIEW OF LITERATURE
Page | 44
2.3.2.2 Genetic association and gene-gene interaction studies
In contrast to linkage studies, association studies evaluate whether common polymorphisms
in candidate genes are associated with susceptibility to disease, usually in unrelated
individuals. These studies are hypothesis driven and often focus on genetic variants that are
predicted to alter protein structure or function. The most common study design is a case-
control format with comparisons of one or more polymorphism (single nucleotide, insertions,
deletions, or microsatellite [MS] markers) frequencies between cases and controls. A major
strength of this study design is the power to find relatively modest effects, generally with
smaller sample sizes than family-based studies (Risch and Merikangas, 1996; Stein, 2010).
One disadvantage is the problem of population stratification or admixture, where differences
in ethnic compositions of the cases and controls can lead to spurious disease associations.
Methods to control for population stratification include matching cases and controls for
ethnicity and adjusting for ethnicity as a possible confounder in a multivariate logistic
regression model. An alternative study design that takes care of the problem of population
stratification is the transmission disequilibrium test (TDT). This approach looks for evidence
of nonrandom transmission of the candidate allele from a heterozygous parent to an affected
child and can be used to corroborate findings of either linkage studies or association studies.
It is important to remember that association, even down to the SNP level, does not
necessarily explain an etiology of a disease. Genetic associations at specific loci may derive
from neighboring alleles in linkage disequilibrium (LD) with the candidate gene that is being
studied. In these situations, the candidate gene SNP serves as a proxy for the association, and
if the haplotype structure of the region surrounding the candidate gene is not explored, the
alleles most responsible for the disease association remains unascertained. The haplotype
structures at specific genetic loci often differ between populations (population-specific
linkage disequilibrium). This variability can make it difficult to replicate disease associations
when the underlying LD structure has not been evaluated for both populations. Both linkage
and genetic association study designs are also vulnerable to the generation of false-positive
results from multiple comparisons. This problem is especially relevant in the current era of
genome-wide linkage scans and high-throughput genotyping strategies. As a result,
replication and validation of findings in independent populations coupled with investigation
of the underlying haplotype structure of each population are an essential part of a careful

REVIEW OF LITERATURE
Page | 45
study design. The candidate gene approach can also be linked to functional studies of the
polymorphisms to determine the biological mechanism relevant to disease pathogenesis.
Finally, neither association nor linkage studies are designed to detect rare alleles with weak
effects (Stein, 2010). Adequate power has been a limitation for candidate gene association
studies and probably accounts in part for a poor track record for replicating SNP associations.
The need to include adequate number of cases and controls is particularly important when the
frequency of the allele(s) being studied is low (< 5%). Numerous candidate gene association
studies have relied on sample sizes of 50 to 100 cases. There is an absence of adequate power
to detect a disease association of a variant allele with a population frequency of 5% in these
small studies, unless the odds ratio (OR) rises to the level of 3.0 to 4.0 (for example, for an α
of 0.05 with 100 cases and 100 controls with a minor allele frequency [MAF] of 0.05, power
equals 0.17 for an OR of 1.5, 0.44 for an OR of 2, 0.87 for an OR of 3, and 0.98 for an OR of
4). However, many candidate genes have disease associations with ORs in the range of 1.5 to
2.5 or lower. To have power to detect associations of low-frequency SNPs with a more
modest influence on disease susceptibility, study investigators would need to recruit 300 to
600 cases and an equal number of controls (for example, for an α of 0.05 with 500 cases, 500
controls and an MAF of 0.05, power equals 0.58 for an OR of 1.5, 0.97 for an OR of 2, and
1.00 for an OR of 3 to 4).
Because of the complex nature of the immune system and the polygenic nature of complex
diseases, it has become increasingly evident that gene-gene interactions play a far more
important part in an individual’s susceptibility to a complex disease than single
polymorphisms would on their own (Williams et al, 2000; Ritchie et al, 2001; Tsai et al,
2003). Methods for studying gene-gene interactions are based on a multilocus and multigene
approach, consistent with the nature of complex-trait diseases, which would provide a new
paradigm for future genetic studies of leprosy (Moller et al, 2010).
2.4 ROLE OF PARK2-PACRG GENE REGION
PARK2 and PACRG genes both share a common regulatory region and encode the proteins
that are involved in the cellular ubiquitination metabolism. Little is known about the specific
function of the PACRG gene, but PARK2 protein product, parkin, has been identified as an
REVIEW OF LITERATURE
Page | 46
ubiquitination E3 ligase involved in delivery of polyubiquinated proteins to the proteasomal
complex (Shimura et al. 2000) The only experimental evidence for the involvement of the
PARK2 and its co-regulated gene PACRG with the host responses to M. leprae has been
provided by the positional cloning in Vietnamese and Brazilian populations (Mira et al.
2004). Where a genome-wide scan of multi-case families from Vietnam with almost equal
distribution of PB (44%) and MB (56%) cases detected significant evidence of linkage for
chromosome region 6q25–q26 (multipoint LOD=4.31) and also provided a suggestive
evidence for regions 6p21 (multipoint LOD=2.62), 20p12 (LOD=1.13), and 13q22.1
(LOD=1.68) (Mira et al. 2003). A separate study of 208 families confirmed that two markers
in the 6q25-27 region were strongly linked to leprosy susceptibility. Further scanning of 6.4-
megabase region of 6q25-27 using 81 SNPs found 17 SNPs that were associated with leprosy
susceptibility. These identified SNPs were in or near the core promoter region of PARK2 and
PACRG and were in strong linkage disequilibrium with each other. Two SNPs,
PARK2_e01(2599) and rs1040079, accounted for the entire association at this locus. A
separate case-control study from Brazil identified 9 SNPs, significantly associate d with
leprosy risk and validated the PARK2_e01(2599) and rs1040079 alleles and a third SNP,
PARK2_e01(2697) (Miller et al. 2004). However, Malhotra et al. did not find a significant
association (after conservative Bonferroni correction) between leprosy and SNPs in the
PARK2 or PACRG coregulatory region, including PARK2_e01(2599) and rs1040079 in
case-control study from India (Malhotra et al. 2006). The identification of PARK2 and
PACRG as major leprosy risk genes in Brazilian and Vietnamese populations and their
apparent absence in Indian population highlights the heterogeneity of risk alleles for
infectious diseases across different ethnic groups. PARK2 codes for parkin, an E3 ubiquitin–
protein ligase that is involved in the delivery of poly-ubiquitinated proteins to the proteasome
complex (Shimura et al. 2000). Mutations in the PARK2 gene cause autosomal recessive
early-onset Parkinson’s disease (Kitada et al. 1998). The function of PACRG is unknown, but
is linked to the ubiquitin–proteasome system. Both genes are expressed in varying degrees in
different tissues, including Schwann cells and monocyte-derived macrophages, the primary
host cells for M.leprae, suggesting the involvement of the both PARK2 and PACRG gene in
the ubiquitin-mediated proteolysis of the important immune-regulatory molecules.
Different pathway analyses also show the importance for these genes in the pathogenesis of
the disease (Schurr et al. 2006; Zhang et al. 2009) However, attempts to replicate the results
in other populations have failed in the past (Li et al. 2012; Malhotra et al. 2006) suggesting

REVIEW OF LITERATURE
Page | 47
the possible involvement of different variants in diverse populations responsible to provide
susceptibility towards leprosy. This possibility could arise due to the change in LD structures
across the populations for the SNPs distributed in the specific genomic regions.
The present study with the rationale, as mentioned already, selected the group of SNPs to
saturate the regulatory region of the PARK2 and PACRG genes to find out the variant LD
structure, if any, in Indian population as compared to Brazilian and Vietnamese; and study
the unexplored variants that may be responsible for an association with leprosy or its sub-
types in the studied population.
2.5 INFERENCES FROM THE STUDIES CONDUCTED SO FAR AND
THE RATIONALE FOR OUR STUDY
While it is encouraging that regions of linkage have been identified reaching genome-wide
statistical significance, however, many of these results have not been replicated in other
populations, reflecting existence of genetic heterogeneity between populations. Frequencies
of the disease related polymorphisms have differed between populations and exist only in
some populations and not in others. Such heterogeneity also is evident in the apparent
differences in relative frequency of multibacillary (MB) and paucibacillary (PB) disease
between populations, with proportions of MB disease being lowest in Africans, higher in
Asians and highest among Caucasians. Besides, other explanations, such as exposure to other
factors (e.g environmental/ mycobacteria) which modify the risk of the disease and associated
immune response, cannot be discounted.
India carries the majority of the global burden of leprosy and ironically the role of anti -
inflammatory cytokines and their receptor genes in susceptibility to leprosy have not been
studied extensively. The present case control association study of functional polymorphisms
in the PARK2 and PACRG gene regulatory regions was carried out to genetically dissect the
basic elements involved in the interplay between M. leprae and its human host. Since, leprosy
is a complex disease caused by multiple genes, it was considered pertinent to explore gene–
gene interactions between the studied variations of the candidate genes in view of the
polygenic nature of the disease.

REVIEW OF LITERATURE
Page | 48
With this background, the present work entitled “Genetic Predisposition to Leprosy: A
study of PARK2-PACRG gene regulatory region in Indian Population” was undertaken
laying down the following objectives.
2.5.1 OBJECTIVES
1. Screen some known SNPs in the chromosome region 6q25-26, spanning the coding
and the regulatory region of PARK2 and PACRG genes to find an association with
Leprosy and its sub-types.
2. Study the level of significance and the strength of association of individual single
nucleotide polymorphisms (haplotypes or interacting alleles among the selected
polymorphisms) with susceptibility / resistance to leprosy, through a case-control
study in the individuals representing Indian population, belonging to the States of
Uttar Pradesh, Delhi and Bihar.
3. Replicate the results in the ethnically distinct population of eastern Indian, Orissa, if
possible.
4. Examine the extent of genetic heterogeneity associated with leprosy susceptibility
among the selected polymorphisms for the populations under study and the
populations already studied.
5. Carry out the bio-informatics analysis of the associated SNPs and to evaluate their
functional role by in-vitro luciferase reporter expression assay.