2.1 demonstration facility description - san diego · section 2 demonstration facility description...
TRANSCRIPT
January 2013 2‐1
Section 2
Demonstration Facility Description and
Observations
This section provides a description of the Demonstration Facility, summarizes the operations and testing results, discusses the regulatory relevance of those results, and describes the integrity and reliability monitoring measures used to confirm that each water purification process functioned reliably. The information provides a basis for energy optimization and full‐scale considerations discussed in Section 3 as well as the conceptual design and cost estimate for the Full‐Scale Facility, presented in Sections 4 and 5, respectively.
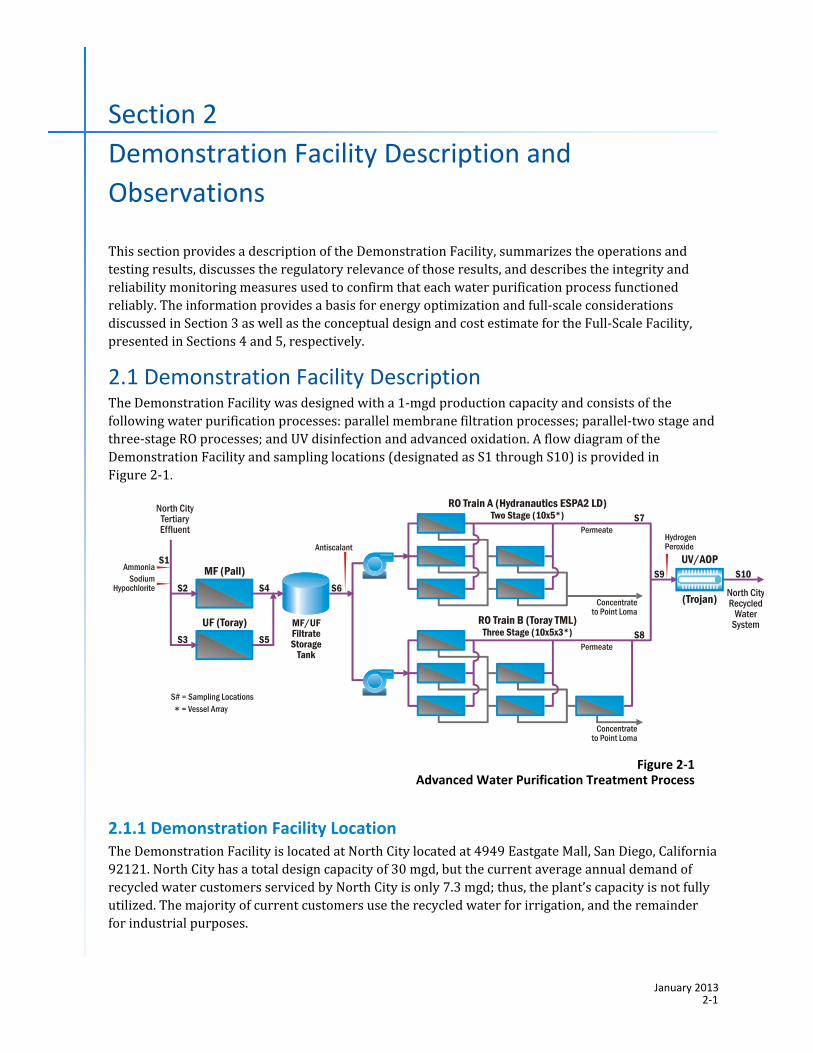
2.1 Demonstration Facility Description The Demonstration Facility was designed with a 1‐mgd production capacity and consists of the following water purification processes: parallel membrane filtration processes; parallel‐two stage and three‐stage RO processes; and UV disinfection and advanced oxidation. A flow diagram of the Demonstration Facility and sampling locations (designated as S1 through S10) is provided in Figure 2‐1.
Figure 2‐1 Advanced Water Purification Treatment Process
2.1.1 Demonstration Facility Location The Demonstration Facility is located at North City located at 4949 Eastgate Mall, San Diego, California 92121. North City has a total design capacity of 30 mgd, but the current average annual demand of recycled water customers serviced by North City is only 7.3 mgd; thus, the plant’s capacity is not fully utilized. The majority of current customers use the recycled water for irrigation, and the remainder for industrial purposes.
Section 2 Demonstration Facility Description and Observations
January 2013 2‐2
The Demonstration Facility is located on a concrete pad adjacent to the existing electrodialysis reversal (EDR) units #4 and #5. The Demonstration Facility pad area is 3,800 square feet (50 feet x 76 feet). The western edge of the pad houses the EDR #6 and was not part of the Demonstration Project. The operations trailer is located on the existing Research Pad, which has an area of 2,000 square feet (40 feet x 50 feet).
The Demonstration Facility is connected to the North City plant tertiary effluent by an 8‐inch Schedule 80 polyvinyl chloride (PVC) pipe designed to deliver water to the Demonstration Facility at 980 gallons per minute (gpm) and a pressure between 40 to 50 pounds per square inch (psi). The water is delivered by the same pumps that feed EDRs #4, #5 and #6. Two drains are provided for liquid process and cleaning waste. The drains are routed in the Demonstration Facility and EDR #6 areas and then routed to discharge to an existing manhole and eventually discharged to Point Loma. Water produced by the Demonstration Facility is blended with North City tertiary effluent upstream of the chlorine contact tanks. The product water piping is routed overhead in the Demonstration Facility and EDR #6 areas and then routed below grade to discharge into the tertiary effluent line immediately upstream of the chlorine contact tanks.
2.1.2 Membrane Filtration Membrane filtration is most commonly done using hollow fiber membranes, with each membrane fiber typically less than a millimeter in diameter and three to six feet in length. Filtration occurs across the surface of each individual membrane fiber. Tens of thousands of these fibers are packaged together and sold as removable membrane elements, typically within a self‐contained pressure vessel. Dozens of these elements can then be manifolded together into a larger, modular operating unit, typically referred to as a membrane skid. A complete membrane system consists of the membrane skid or multiple skids, along with various ancillary equipment, often located off of the skid(s). Full scale facilities often contain multiple membrane skids, each operated independently through frequent backwash and production cycles.
The membrane filtration equipment used at the Demonstration Facility includes two parallel 0.63‐mgd systems, each treating half the facility flow. One system is a Pall MF system utilizing membranes with a nominal pore size of 0.1 micron, while the second system is a semi‐universal UF system utilizing membranes with a nominal pore size ten times smaller at 0.01 micron. The UF system used Toray membranes but is capable of operating with membrane elements (filter modules) from multiple vendors. Selection of the two systems was based on review of other operational advanced purification facilities and on the City’s goal of comparing alternative membrane filtration systems to develop the most efficient and effective approach for a potential Full‐Scale Facility.
Design Flux and Materials
Membrane system filtration rate, or flux, represents the amount of permeate flow produced per day (gallons per day) per unit area of membrane (square feet [ft2]). A membrane system containing 20,000 ft2 of membrane area, which produces 1.0 million gallons per day, would be operating with a flux of 50 gallons per day per square foot (gfd). Membrane filtration systems for wastewater applications are generally designed to operate at relatively low fluxes (20 to 35 gfd), to reduce the rate of fouling on the membranes. Fouling occurs more frequently at higher fluxes, particularly when treating water containing relatively high organic content, as treated wastewater often does. The MF and UF systems used at the Demonstration Facility were operated at fluxes between 29 and 30 gfd.

Section 2 Demonstration Facility Description and Observations
January 2013 2‐3
In addition to flux, specific flux, also known as permeability, is flux per unit pressure (gfd/psi). The specific flux is generally corrected for temperature, based on the viscosity of the water. The reference temperature for membrane filtration is 20 degrees Celsius (C), while it is 25 degrees C for RO.
The majority of the wastewater membrane filtration facilities in California are currently using MF membranes, which are made from either chlorine resistant polyvinylidene fluoride (PVDF) material or from chlorine‐sensitive polypropylene. Facilities using PVDF membranes include the Water Replenishment District Leo J. Vander Lans Water Treatment Facility in Long Beach, California, and the Scottsdale Water Campus in Scottsdale, Arizona. Facilities using PVDF membranes often utilize chlorine enhanced backwashes to reduce organic fouling and biological growth on the membranes. However, chlorine enhanced backwashes cannot be used at facilities employing membranes sensitive to chlorine (i.e. polypropylene). Facilities using such chlorine sensitive polypropylene membranes include the Orange County Water District’s Groundwater Replenishment System and the West Basin Edward C. Little Water Reclamation Facility, both in California.
Most indirect potable reuse plants, including facilities in the United States, Singapore, and Australia, employing membrane filtration and RO as treatment processes, maintain a continuous chloramine residual through the entire treatment process to prevent biological growth on the membrane filters and the RO membranes. At the Demonstration Facility, a total chlorine residual between 3 and 4 milligrams/liter (mg/L) was maintained through the membranes to prevent such biological growth.
Standardization of Membrane Filtration Membranes
Three manufacturers currently supply approximately 90 percent of the municipal membrane filtration systems in the United States, including Siemens/Memcor, Pall Corporation, and GE/Zenon. These systems generally are not compatible with each other, due to differences in membrane module configurations, dimensions, piping, and flow configurations. Due to the proprietary nature and complexity of these systems, membrane selection is commonly completed during the preliminary design phase of a project, allowing better integration of the systems into the overall design.
As the industry has matured in recent years, the system designs have become more standard. Today GE/Zenon makes a pressurized UF membrane that is relatively compatible in size and configuration to the Pall system. In addition, alternative membrane manufacturers are supplying domestic facilities with membranes that are far more standardized than systems sold a decade ago. A semi‐universal membrane unit, capable of operating with membranes from several different suppliers, is now possible to design or purchase from third party vendors. Such a design benefits treatment system owners during the design phase and during bidding.
The City therefore selected a non‐proprietary system design to treat half of the flow at the Demonstration Facility in order to promote future competition for the potential Full‐Scale Facility. This UF system for the Demonstration Facility was designed to be compatible with membranes from three alternative membrane suppliers: Pentair, Dow, and Toray. Membrane element design conditions for each of these suppliers are included in Table 2‐1.

Section 2 Demonstration Facility Description and Observations
January 2013 2‐4
Table 2‐1 Membrane Elements Considered in Design of Semi‐Universal UF Skid Design
Model Pentair Aquaflex Dow SFD‐2860 Toray HFU‐2020
Length 2.2 m 2.0 m 2.2 m
Diameter 0.2 m (8‐inch) 0.2 m (8‐inch) 0.22 m (8.5‐inch)
Area 55 m2 (85,250 in2) 77 m2 (119,350 in2) 72 m2 (111,600 in2)
Flow Configuration Inside‐out Outside‐in Outside‐in
Microfiltration System Design
The microfiltration system selected for the Demonstration Facility was a Pall Aria system which produced 0.63 mgd for the downstream RO process. The Asahi membranes used with the Pall system were PVDF material with a nominal pore size of 0.1 micron. These membranes were selected as a baseline to compare against the UF, based on their successful operation in wastewater applications with low membrane fouling and few fiber breaks. The MF membranes were operated at a flux of 29 gfd and recovery of 93 percent. While the system was designed to incorporate chemically enhanced backwashes, they were not used during the initial operation of the Demonstration Facility in order to reduce the amount of downtime for the membrane filtration unit. Chemical enhanced backwashes may be required in the future if more aggressive operating conditions are use (e.g. higher flux, higher recovery).
Ultrafiltration System Design
The Demonstration Facility uses Toray HFU membranes in the UF system, which also produced 0.63 mgd for the downstream RO membranes. The UF system operates in parallel to the MF system. Toray UF membranes were selected for the UF system because these membranes are CDPH‐certified. The Toray UF membranes are PVDF material, similar to the Pall MF membranes, but have a nominal pore size ten times smaller than the MF membranes. Toray membranes can be used in a standardized skid configuration, which could accommodate UF membranes from Norit, Dow, or Toray. This provides flexibility with the Demonstration Facility if the City decides to test another UF manufacturer, and could also provide advantages for membrane replacement in the Full‐Scale Facility. The Toray UF membranes are chlorine resistant PVDF material with a nominal pore size of 0.01 micron. The smaller pore size of the UF membrane allows for the removal of smaller constituents, such as viruses. The UF system was operated at a flux of 30 gfd and 95 percent recovery. While the system was designed to incorporate chemically enhanced backwashes, they were not used during the initial operation of the Demonstration Facility in order to reduce the amount of downtime for the membrane filtration unit. Chemically enhanced backwashes may be required in the future if more aggressive operating conditions are use (e.g. higher flux, higher recovery).
The Demonstration Facility was the first municipal installation in the United States to use the relatively new Toray HFUF (hollow fiber ultrafiltration); however, the membranes had previously been used at wastewater facilities in Asia, and are now currently being used for other facilities being built or in recent operation within the United States. Because of differences in port dimensions and locations, it will be necessary to change out portions of the piping if and when the membranes are changed to an alternative manufacturer in the future. In addition, the inside‐out flow configuration for the Pentair system will require modifications in the controls. The majority of the piping, controls, and the pumping system for the UF unit were designed to accommodate the alternative membrane suppliers.

Section 2 Demonstration Facility Description and Observations
January 2013 2‐5
2.1.3 Reverse Osmosis Reverse osmosis membranes are most commonly manufactured as flat sheets, with a thin membrane layer coating a larger support structure used to resist the high pressures seen in reverse osmosis. Individual sheets are glued together in pairs to form membrane envelopes, with separation of dissolved ions occurring across the membrane surface. Desalinated water passes into the center of the membrane envelope, while salts and other contaminants remain on the outside of the membrane sheets. These sheets are typically rolled into spiral wound membrane elements, with hundreds of square feet of membrane area contained inside a single 8‐inch by 40‐inch element. The elements are most commonly loaded into pressure vessels in series, with six to eight elements per vessel. Multiple vessels are then manifolded together into a modular operating unit typically referred to as a train. Reverse osmosis facilities will operate with one or more membrane train, each operating independently through extended cleaning cycles.
The reverse osmosis equipment used at the Demonstration Facility included two parallel systems, each treating half the flow. Two alternative membranes were used, and two alternative RO configurations, one operated as a two‐stage (Train A) and one as a three‐stage (Train B) system. RO systems for wastewater applications are typically designed to operate at low fluxes, ranging from 10 to 12 gfd. These fluxes are more in line with traditional fluxes used at seawater desalination facilities than at brackish water plants; however, early operation at Water Factory 21 in California and other pilot studies suggested that the lower fluxes were needed to prevent fouling from high concentrations of organic material in the wastewater sources.
Design recoveries for RO units at all of the existing AWP facilities in California are 85 percent, but problems with scaling in downstream stages have resulted in some of these facilities operating at reduced recoveries—as low as 75 percent. A recovery of 80 percent was initially selected for the Demonstration Facility, which was the proven recovery demonstrated during the City’s previous pilot testing of water purification processes (conducted in 2005‐2006). As discussed in Section 2.3.2, the recovery was successfully increased to 85 percent to maximize water production.
Reverse Osmosis System Design
Similar to the membrane filtration system, two parallel reverse osmosis systems were used for the Demonstration Facility – one representing a baseline condition and the second representing an alternative design approach. Train A includes Hydranautics ESPA2‐LD elements operated in a two‐stage configuration, which was used as the baseline. ESPA2‐LD membranes have a rated salt rejection of 99.6 percent, based on Hydranautics standard testing procedures, using a 1,500 mg/L sodium chloride solution and a 150 psi feed pressure. This train utilized seven elements per vessel within a 10 vessel by 5 vessel array. An Energy Recovery Incorporated turbocharger (also referred to as an energy recovery device) was used to recover residual energy from the second stage concentrate, boosting the pressure to the second‐stage feed. The RO system was operated at 12 gfd at both 80 percent and 85 percent recovery.
The second parallel RO system (Train B) utilized Toray TML20 membranes in a three‐stage RO configuration to improve system hydraulics at higher recovery rates. TML20 membranes have a rated salt rejection of 99.7 percent, based on Toray standard testing procedures, using a 2,000 mg/L sodium chloride solution and 225 psi feed pressure. Six element pressure vessels were used to reduce the differential pressure loss, with a 10 by 5 by 3 vessel array. An energy recovery device was used to recover residual energy from the third stage concentrate, boosting the pressure to the third stage feed.

Section 2 Demonstration Facility Description and Observations
January 2013 2‐6
The Toray TML20 membranes were projected to have a higher nitrogen rejection than the baseline ESPA2 membranes. Total nitrogen may be a controlling water quality limitation for reservoir augmentation, making the rejection of the RO membranes a critical evaluation parameter. A goal of 1.0 mg/L total nitrogen was set for the Demonstration Facility; however, the final requirement will be determined by the Regional Board. ESPA2 elements were not projected to meet this nitrogen goal, based on Hydranautics design software, however, the Toray membranes were projected to deliver considerably lower total nitrogen levels.
2.1.4 UV Disinfection and Advanced Oxidation The RO permeate from the two RO trains are combined and treated through an advanced oxidation process, comprised of UV coupled with hydrogen peroxide. Trojan UVPhox, a low pressure and high output (LPHO) UV system was used to demonstrate the UV disinfection and advanced oxidation process. This reactor is the same model that is being used at the Groundwater Replenishment System in Orange County. The Trojan model used was selected based on discussions with Trojan, given the capacity of the Demonstration Facility. For more details on the selection of the reactor, see Appendix C, Attachment A of the Testing and Monitoring Plan (T&M Plan) (Appendix A).
There was an initial concern that the single reactor would not be as efficient as a full scale facility. Based on discussions with the manufacturer, this system was expected to be less efficient due to differences in hydraulic conditions, compared to a full scale system. However, based on results from the spiking experiment, the calculated electrical energy per order (EEO) values at the Demonstration Facility were similar to those predicted at Orange County's Groundwater Replenishment District, under similar conditions.
The advantages of LPHO UV, compared to medium pressure UV, include electrical efficiency, longer lamp life, and narrower UV wavelength targeted for microbial destruction. Trojan LPHO UV systems have a proven history with advanced water treatment in California with systems installed at the Orange County Water District’s Groundwater Replenishment System, the West Basin Municipal Water District’s Edward C. Little Water Recycling Facility, and the Water Replenishment’s District Leo J. Vander Lans Advanced Water Treatment Facility.
2.1.5 Purified Water The water that has been treated by the membrane filtration, RO, and UV disinfection and advanced oxidation processes is considered purified water. This purified water meets water quality requirements for full advanced treatment under the November 2011 Groundwater Replenishment Reuse Draft Regulations, including primary and secondary drinking water standards, total nitrogen, total organic carbon (TOC), and CDPH Notification Levels. If the IPR/RA project is approved for full‐scale implementation, the purified water would be conveyed to the San Vicente Reservoir to supplement existing raw water supplies to the reservoir. Additional post‐treatment through blending or adding stabilizing chemicals would be required for the Full‐Scale Facility to address the aggressive nature of highly purified water. Since this project was for demonstration purposes only, the purified water produced by the facility was blended with existing recycled water and distributed through the existing recycled water system for irrigation and industrial uses. No water from the Demonstration Facility was used to supplement any drinking water supplies.

Section 2 Demonstration Facility Description and Observations
January 2013 2‐7
2.2 Demonstration Facility Public Outreach and Tours One of the objectives of the Demonstration Facility was to support public education and outreach activities to acquaint San Diego residents and stakeholders with the concepts and processes related to IPR/RA. The Demonstration Facility, pictured in Figure 2‐2, was designed and constructed to facilitate public tours as part of the City’s ongoing Water Purification Education and Outreach program.
The Demonstration Facility tours fulfilled four critical purposes:
Introduce and graphically illustrate the water purification processes and technologies.
Show how North City, the potential Full‐Scale Facility, the approximately 23‐mile pipeline, the San Vicente Reservoir, and the City’s drinking water treatment plant work together to provide multiple barriers of protection.
Communicate information about expert oversight and continuous monitoring of treatment processes to enhance public trust in the reliability of these facilities to produce a safe and clean supply of water.
Place the water purification process in a water cycle context to reframe mental models about how water is continuously used and reused.
The Demonstration Project Public Education and Outreach program is summarized in the Demonstration Project Report.
Figure 2‐2 Demonstration Facility
Section 2 Demonstration Facility Description and Observations
January 2013 2‐8
2.3 Summary of Operations The following subsection summarizes Demonstration Facility operation during the time period of 6/16/11 to 7/31/12. The facility start‐up period was 1.5 months (mid‐June 2011 through the end of July 2011) with full operational testing continuing for one year (August 2011 through July 2012). The results and conclusions from this 13.5‐month period are the focus of this report. The Demonstration Facility is continuing to operate after the testing period for tours.
Each water purification process was operated continuously over this time period with minimal offline time due to routine maintenance, cleaning (membrane systems), and unscheduled minor repairs. Based on a comparison of actual time to run hours, the system was producing purified water 87 percent of the time during this period. Each of the water purification processes performed as required during this period of operation.
The operation and testing results were presented in quarterly reports over a 12‐month testing period as summarized in Table 2‐2:
Table 2‐2 Demonstration Facility Testing Periods
Testing Quarter Operating Period
Report Date Test Quarter Start Test Quarter End
Quarter 1 (Q1) 6/16/2011 10/31/2011 December 2011
Quarter 2 (Q2) 11/1/2011 2/10/2012 March 2012
Quarter 3 (Q3) 2/11/2012 5/14/2012 June 2012
Quarter 4 (Q4) 5/15/2012 7/31/2012 September 2012
The Quarterly Testing Report No. 4 includes the comprehensive water quality data for all Testing Periods and is provided in Appendix B.
2.3.1 Summary of Membrane Filtration Operation The following includes a description of the membrane filtration system operation and a comparison of the operational and water quality performance of the two systems.
Microfiltration System
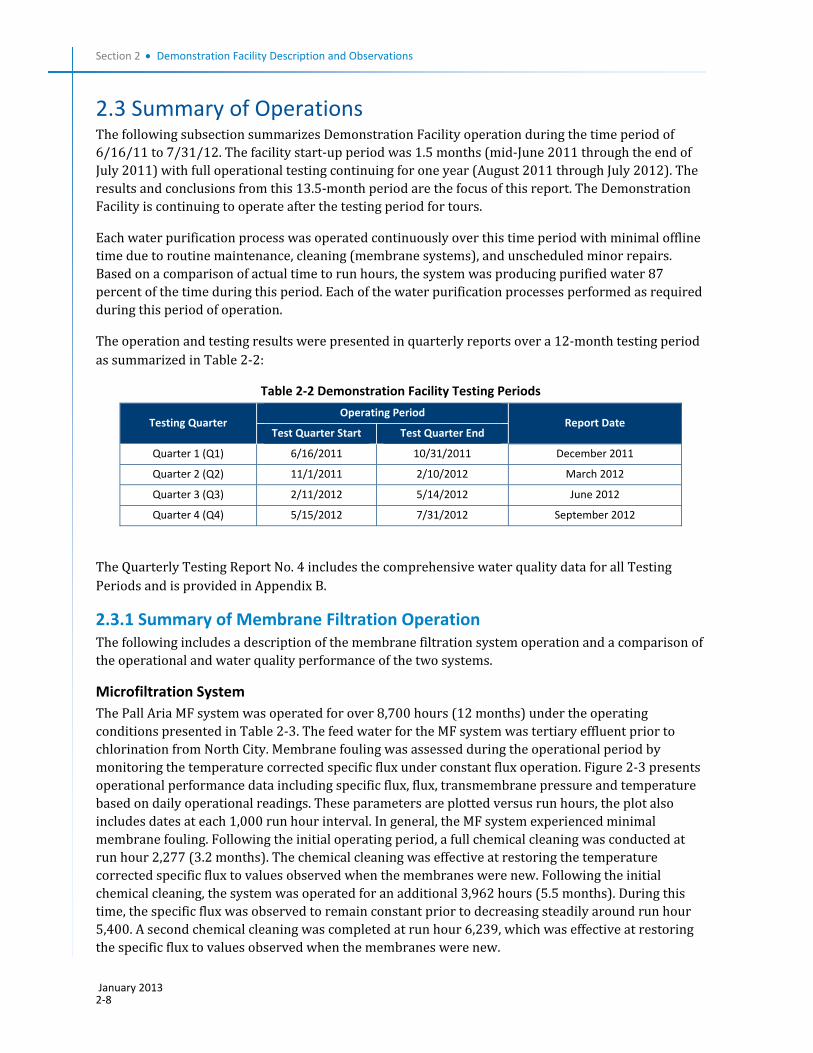
The Pall Aria MF system was operated for over 8,700 hours (12 months) under the operating conditions presented in Table 2‐3. The feed water for the MF system was tertiary effluent prior to chlorination from North City. Membrane fouling was assessed during the operational period by monitoring the temperature corrected specific flux under constant flux operation. Figure 2‐3 presents operational performance data including specific flux, flux, transmembrane pressure and temperature based on daily operational readings. These parameters are plotted versus run hours, the plot also includes dates at each 1,000 run hour interval. In general, the MF system experienced minimal membrane fouling. Following the initial operating period, a full chemical cleaning was conducted at run hour 2,277 (3.2 months). The chemical cleaning was effective at restoring the temperature corrected specific flux to values observed when the membranes were new. Following the initial chemical cleaning, the system was operated for an additional 3,962 hours (5.5 months). During this time, the specific flux was observed to remain constant prior to decreasing steadily around run hour 5,400. A second chemical cleaning was completed at run hour 6,239, which was effective at restoring the specific flux to values observed when the membranes were new.

Section 2 Demonstration Facility Description and Observations
January 2013 2‐9
Table 2‐3 Summary of Pall MF System Operating Conditions
Parameter Value
Target feed water chloramines dose 3 mg/L
Instantaneous flux 29 gfd
Average feed water recovery 93 percent
Backwash frequency 19 minutes or 10,000 or filtrate gallons
Backwash duration 96 seconds
Strainer backwash frequency 1,440 minutes
Pressure Decay Test frequency 24 hours
Section 2 Demonstration Facility Description and Observations
January 2013 2‐10
Figure 2‐3 Summary of Pall MF System Operational Performance

Section 2 Demonstration Facility Description and Observations
January 2013 2‐11
Ultrafiltration System
The Toray UF system was operated for over 8,600 hours (12 months) under the operating conditions provided in Table 2‐4. The UF system was also fed from the tertiary effluent prior to chlorination produced by North City. Membrane fouling was assessed during the operational period by monitoring the temperature corrected specific flux under constant flux operation. Figure 2‐4 presents operational performance data including specific flux, flux, transmembrane pressure and temperature based on daily operational readings. These parameters are plotted versus run hours; the plot also includes dates at every 1,000 run hour interval.
In general, the rate of decrease in specific flux for the UF system observed during the Q1 and Q2 Testing Periods showed minimal fouling; however, an increased rate of fouling was observed during the Q3 Testing Period. It is important to note the UF system was operated at a higher recovery than the MF system over the course of the operating period, resulting in overall less backwash waste flow. This higher recovery could therefore be partially responsible for the higher rate of observed fouling in the UF system.
Following the initial operating period, a chemical cleaning was conducted at run hour 1,729 (2.4 months). The chemical cleaning was effective at restoring the temperature corrected specific flux to values observed when the membranes were new. Following the initial chemical cleaning, the system was operated for an additional 4,156 hours (5.8 months). During this time, the specific flux was observed to remain steady prior to trending downward at a moderate rate around run hour 3,850. The rate of decline increased around run hour 4,540 and was consistent for the remainder of the operating period. A second chemical cleaning was completed at run hour 5,885, which was effective at restoring the specific flux to the previously observed post‐clean value. The UF membranes fouled at a faster rate during the Q3 and Q4 Testing Periods than in the previous periods. A final chemical cleaning was conducted at run hour 7,360 (10.2 months).
Table 2‐4 Summary of Toray UF System Operating Conditions
Parameter Value
Target feed water chloramines dose 3 mg/L
Instantaneous flux 30 gfd
Average feed water recovery 95 percent
Backwash frequency 30 minutes
Backwash duration 195 seconds
Strainer backwash frequency 1,440 minutes
Pressure Decay Test frequency 24 hours

Section 2 Demonstration Facility Description and Observations
January 2013 2‐12
Figure 2‐4 Summary of the Toray UF Operational Performance
Section 2 Demonstration Facility Description and Observations
January 2013 2‐13
Comparison of Membrane Filtration System Operation
The MF System (Pall) and UF system (Toray) were operated side by side for similar runtimes to compare the operational and water quality performance of the systems.
A summary of operational performance of the membrane filtration systems is provided in Table 2‐5. Operating Period 1 is defined as the operational time period between the completion of the first and second chemical cleanings. During this time, the MF system operated for 5.5 months and the UF system for 5.7 months with similar fouling rates of 11 percent (decline in specific flux per month). During this time the UF system operated with a slightly lower average transmembrane pressure (4.6 psi vs. 5.0 psi); however, the UF system required a higher average feed pressure (16 psi vs. 15 psi), due to a higher permeate backpressure from the longer discharge piping between the UF system and the break tank. Backpressure on the UF averaged 11.3 psi, but averaged 8.5 psi for the MF system, located immediately adjacent to the break tank. The differences in feed pressure should therefore not be considered representative of the two systems, but are rather the result of the unique flow configuration of the intermediate piping downstream of each system.
Operational Period 2 is defined as the operational period following the completion of the second chemical cleaning. The MF system operated for over 3.4 months with a calculated fouling rate of 12 percent and did not require a third cleaning through the end of the 12 month testing period. In comparison, the UF system operated for 2 months before requiring cleaning during this operating period. During this time the fouling rate for the UF was 38 percent, which was significantly greater (> 3 times) than that observed on the MF system over a similar time period, and considerably greater than the fouling rate observed during Operational Period 1. The UF manufacturer recommended that an aggressive low pH (pH 1.5) cleaning be performed to try to decrease the unexpected transmembrane pressure rise seen during this operational period.
Operational Period 3 (UF only) is defined as the operational period following the completion of the third chemical cleaning. The UF system operated for 1.7 months with a lower fouling rate (26 percent vs. 38 percent) and much lower average transmembrane pressure (2.7 psi vs. 6.8 psi) than observed during Operational Period 2. The decrease in fouling is attributed to the lower target pH (1.5 vs. 3) used during the third cleaning as opposed to the target pH of the second cleaning.
Water quality monitoring of the membrane filtration systems showed that both consistently produced filtrate with similar water quality: turbidity (<0.1 NTU), TOC (6.5 mg/L), and UV 254 Absorbance (UV254) (0.17 cm‐1). With regards to pathogen removal, concentrations of total and fecal coliforms were consistently non detect (ND) in the filtrate from both systems; however, it was observed that the UF system achieved a slightly higher log removal of bacteriophage (viruses), than the MF system, which is attributable to the smaller pore size in the UF membranes. The average (n=20) log removal for somatic and male specific bacteriophage for the MF system were greater than 3.0 and 1.1, respectively. The average (n=20) log removal of somatic and male specific bacteriophage for the UF system were calculated as greater than 3.7 and 2.2, respectively. No quantifiable hits of either somatic or male specific bacteriophage were recorded in the UF product, suggesting that higher log removal values may have been observed had concentrations in the feed been higher. It should be noted that the composite reduction for the two types of viruses monitored was greater than 99 percent for both the MF and UF system.

Section 2 Demonstration Facility Description and Observations
January 2013 2‐14
Table 2‐5 Summary of Membrane Filtration Operation
Operational Period following Chemical
Cleanings
Run Time Hours
(Months)
Average Feed
Pressure (psi)
Average Filtrate Pressure (psi)
Total Delta Hbetween Feed & Filtrate Pressure Transmitters
(psi)
Average Transmembrane Pressure
1 (psi)
Fouling Rate (% decrease temp. corrected specific flux per month)
MF System
Operating Period 1 (10/6/11 to 4/5/12)
3,962 (5.5)
15.0 8.5 1.5 5.0 11
Operating Period 2 (4/6/12 to 7/31/12)
2,444(3.4)
15.2 8.6 1.5 5.1 12
UF System
Operating Period 1 (9/8/11 to 3/22/12)
4,138 (5.7)
16.0 11.3 1.3 3.4 11
(Operating Period 2 (3/23/12 to 5/31/12)
1,472 (2) 19.4 11.3 1.3 6.8 38
Operating Period 3 (6/2/12 to 7/31/12)
1,225 (1.7)
15.3 11.3 1.3 2.7 26
Notes: a. Transmembrane pressure was calculated as Average Feed Pressure minus Average Filtrate Pressure minus total Delta H (difference in elevation between feed and filtrate pressure transmitters).
b. Chemical cleanings performed on the MF system on 10/5/11 and 4/5/12. c. Chemical cleanings performed on the UF system on 9/7/11, 3/22/12, and 5/31/12.
2.3.2 Reverse Osmosis During the testing period the RO system (Trains A and B) was operated using combined filtrate from the membrane filtration systems for 8,500 hours (11.8 months) of runtime. The RO trains were operated under similar operating conditions for the entire testing period as shown in Table 2‐6. Each RO train was also equipped with an energy recovery device that was designed to transfer pressure from the concentrate to the feed of the last stage. The RO trains were designed without the use of cartridge filtration as pre‐treatment because of the controlled environment upstream of the RO system (closed membrane filtration break tank), which eliminated the introduction of particulates upstream of RO. Chloramines and antiscalant were applied upstream of RO to prevent biofouling and control scaling of the membranes.
Table 2‐6 Summary of the RO System Operating Conditions
Parameter Value
RO Train A
Antiscalant dose 3 mg/L
Average flux 11.9 gfd
Feed water recovery 80 to 85 percent
RO Train B
Antiscalant dose 3 mg/L
Average flux 11.6 gfd
Feed water recovery 80 to 85 percent
RO Train A Operation
Operational performance parameters including net driving pressure, flux, specific flux, and feed water temperature for the RO system Train A are illustrated in Figure 2‐5. Membrane fouling was assessed

Section 2 Demonstration Facility Description and Observations
January 2013 2‐15
during the operational period by monitoring the decline in temperature corrected specific flux, or permeability, under constant flux operation.
Figure 2‐5 Membrane Performance of the RO System Train A

Section 2 Demonstration Facility Description and Observations
January 2013 2‐16
During the initial operation period, a decrease in the specific flux was observed prior to becoming level around run hour 900 (5 weeks). Since this decrease was predominantly in the first stage elements, it was believed that it may have been related to organic fouling or to biological regrowth. To prevent further fouling, the target feed water concentration of chloramines was increased from 1.5 to 3.0 mg/L. Following this adjustment, the membranes operated with little to no decrease in specific flux for approximately 1,345 hours of operation. A full chemical cleaning was performed on Train A on 10/14/11 (run hour 2,245). The membranes were cleaned in accordance to the manufacturer’s protocol using caustic soda followed by citric acid. A summary of cleaning results for both RO Systems is provided in Table 2‐7. Comparison of the specific flux measured before and after the cleaning of Train A on 10/14/11 indicates the cleaning had no effect on restoring the average membrane specific flux. These results suggest that the decrease in specific flux observed during the initial operation may have been related to conditioning of the membranes rather than entirely from membrane fouling. It is also possible that the cleaning procedures chosen were not sufficient to entirely remove the foulant layers.
Following cleaning, the system was restarted and the specific flux remained steady with little decline for the next 4,000 hours (5.5 months) of operation. On 4/26/12 a second chemical cleaning was performed before changing the RO recovery. During this cleaning, the order of cleaning chemicals was changed (citric acid followed caustic) and the soak and recirculation times were extended. Data collected before and after the chemical cleaning showed the specific flux was restored by about 15 percent.
Table 2‐7 Summary of RO Membrane Cleaning Results
RO System Date of Cleaning
Pre‐Clean Temperature
Corrected Specific Flux (gfd/psi@ 25
Deg C)
Post Clean Temperature
Corrected Specific Flux (gfd/psi @ 25
Deg C)
Cleaning Effectiveness (% change in specific flux pre to post
clean)
Cleaning Chemicals
Train A 10/14/11 0.14 0.14 0 % Caustic
followed by citric acid
Train A 4/26/12 0.13 0.15 15% Citric acid followed by caustic
Train B 10/7/11 0.11 0.13 18% Caustic
followed by citric acid
Train B 4/18/12 0.12 0.14 17% Citric acid followed by caustic
Train B (3rd Stage Only)
6/7/12 0.05 0.11 120% Citric acid followed by caustic
Following completion of the chemical cleaning, the system was operated under the same target operating conditions as stated above with the exception that the feed water recovery FWR was increased to 85 percent at run hour 6,314. Following the adjustment, little to no fouling was observed as measured by the limited decline in overall specific flux for the remainder of the testing period. In all, the system operated for 2,144 hours (3 months) under these operating conditions without a cleaning. The fouling rate averaged 2 percent per month during these final 3 months of operation.

Section 2 Demonstration Facility Description and Observations
January 2013 2‐17
The performance of the RO Train A energy recovery device was also closely monitored over the testing period. During Q1 and Q2 Testing Periods, the energy recovery device performed far below optimal conditions. The device was removed from the system and sent to the manufacturer for repair. The unit was repaired and reinstalled at run hour 5,015. Comparison of performance data before and after the repair showed that the average boost pressure increased from 8.9 to 23 psi, which was within the range of the design projections of the energy recovery device. It was also observed that the average boost pressure dropped significantly (23 psi to 12 psi) when the recovery increased to 85 percent, because of the lower concentrate flows available to power the energy recovery device.
RO Train B Operation
Operational performance parameters monitored for the RO system Train B are shown in Figure 2‐6. Membrane fouling was assessed during the operational period by monitoring the decline in temperature corrected specific flux under constant flux operation.
During the initial 160 hours (1 week) of operation, the specific flux (gfd/psi @25 degrees C) of the new Toray TML membranes declined steadily from an initial value of 0.15 to 0.13. The specific flux further declined slightly over the next 740 run hours to approximately 0.12 gfd/psi. The target feed concentration of chloramines was increased from 1.5 to 3.0 mg/L (same modification as Train A) at run hour 941. The specific flux remained steady with little or no decline for the next 1,126 hours (1.6 months) of operation.
A full chemical cleaning was performed on Train B at run hour 2,027. The membranes were cleaned in accordance with the manufacturer’s protocol using both caustic soda and citric acid. Assessment of the membrane performance before and after the cleaning shows the cleaning was partially effective at restoring the specific flux in the second and third stage membranes. Following the cleaning, the specific flux remained steady with little to no decline for 4,253 hours (5.9 months) of operation. A second chemical cleaning was conducted at run hour 6,297. Due to the suboptimum effectiveness of the chemical cleaning conducted on all three stages of the RO system during the Q1 Testing Period (as well as the positive experience with RO Train A chemical cleaning), the cleaning protocol was modified to change the order of cleaning chemicals (citric acid followed caustic) and the soak and recirculation times were extended. Data collected before and after the cleaning showed the specific flux was restored by about 14 percent. The specific flux increased by 6 percent after the acid cleaning and an additional 8 percent after the caustic cleaning.

Section 2 Demonstration Facility Description and Observations
January 2013 2‐18
Figure 2‐6 Membrane Performance of RO System Train B

Section 2 Demonstration Facility Description and Observations
January 2013 2‐19
Following completion of the chemical cleaning, the system was operated under the same target operating conditions as previously operated with the exception that the feed water recovery was increased to 85 percent at run hour 6,391. Since that change, little fouling was observed in either the first or second stage, however, significant scaling appears to have occurred within the third stage. By run hour 7,311, the third stage specific flux had dropped by 40 percent of the initial value observed at the start of 85 percent feed water recovery. In addition, the permeate conductivity of the third stage had increased by more than 158 percent. The increase in salt passage (higher permeate conductivity) and decrease in specific flux, are both indicators of inorganic scale formation in the final membrane stage. At this time, a chemical cleaning was conducted on the third stage membranes. Results of the cleaning show the cleaning was effective at restoring the specific flux to the values seen at the start of the 85 percent feed water recovery operation. After completion of this cleaning Train B was restarted at a target feed water recovery of 80 percent, while the cause of the scale formation was evaluated.
Because Train B scaled at a much faster rate than Train A during operation at 85 percent, an investigation was undertaken to identify the possible cause. The investigation included verification of the accuracy of the flow transmitters equipped on the RO skids as well as verifying the feed water recovery of the systems based on sulfate values measured in the feed, permeate, and concentrate. The flow transmitters equipped on both RO skids were checked against measurements using an ultrasonic flow meter provided by Toray. Comparing results showed the flow transmitters were within acceptable agreement with the ultrasonic flow meter with the exception of the concentrate flow transmitter on Train B, which read 22 percent higher than the flow measured by the ultrasonic meter. Based on this information, recovery calculations were revised to use the permeate and feed flow meters rather than the concentrate. In addition, sulfate mass balance calculations were performed, confirming the accuracy of the revised recovery calculations. It was therefore determined that Train B had operated at a feed water recovery between 87 and 89 percent instead of the targeted 85 percent feed water recovery during the time the scaling was observed. In order to rectify the issue, the scale factor on the concentrate flow meter was adjusted to accommodate the measured discrepancy. The feed water recovery was then returned to 85 percent at run hour 7,942. During the following 493 hours (3 weeks), the overall specific flux declined by approximately 9.9 percent and the third stage by 25 percent, which was still a significantly higher fouling rate than what was seen on RO Train A. Because a limited amount of run time was conducted on Train B at 85 percent recovery, it was recommended that further operation be conducted to more accurately assess the fouling rate at this recovery.
The performance of the RO Train B energy recovery device was also closely monitored over the testing periods. The average boost pressure during operation at a target feed water rate of 80 percent was 23 psi with a noticeable decrease at run hour 5,022. This decrease corresponds with a manual adjustment made on the concentrate valve to decrease the concentrate flow in order to maintain the target feed water recovery. Further adjustment was made to the concentrate valve at run hour 6,391 to increase the target feed water recovery to 85 percent. The average boost pressure measured during operation at 85 percent over the remainder of the testing period was 6.4 psi due to the lower concentrate flows available to power the device at 85 percent recovery.
Comparison of RO System Train A and Train B Operation
A comparison of operational performance of RO System Trains A and B is provided in Table 2‐8.
Operating Period 1 is defined as the operational time period between the completion of the first and second chemical cleaning. During this time the systems operated for 5.6 months (Train A) and 5.9

Section 2 Demonstration Facility Description and Observations
January 2013 2‐20
months (Train B) with similar fouling rates of 1.4 percent and 1.6 percent (decline in specific flux per month), respectively. Train B operated with a higher feed pressure. The higher pressure required for Train B is attributed to the difference in configuration (three stages vs. two stages), as the specific flux were found to be similar for both membranes and were nearly identical for the first stage elements (see Table 2‐8).
Table 2‐8 Summary of the RO System Trains A and B Operation
Operational Period following Chemical
Cleanings
Run Time Hours
(Months)
Target Feed Water
Recovery (%)
Average Feed
Pressure (psi)
Net Driving Pressure(psi)
Average Specific Flux or Permeability (gfd/psi@25
Deg. C)
Fouling Rate (% decrease
temperature corrected
specific flux per month)
Train A (Two‐stage)
Operating Period 1 (10/16/11 to 4/16/12)
4,020 (5.6) 80% 133 98 1st Stage: 0.12
2nd Stage: 0.14
1.4
Operating Period 2 (4/19/12 to 7/31/12)
2,144 (3) 85% 124 87 1st Stage: 0.13
2nd Stage: 0.16
2.1
Train B (Three‐stage)
Operating Period 1 (10/6/11 to 4/17/12)
4,254 (5.9) 80% 139 104 1st Stage: 0.12
2nd Stage: 0.13
3rd Stage: 0.10
1.6
Operating Period 2 (4/23/12 to 6/7/12)
920 (1.3) 85%1 138 97 1st Stage: 0.13
2nd Stage: 0.14
3rd Stage: 0.10
15
(Stage 3 = 40)
Operating Period 3 2
(6/8/12 to 7/9/12)
591 (0.8) 80 130 91 1st Stage: 0.12
2nd Stage: 0.13
3rd Stage: 0.10
2.1
Operating Period 4
(7/10/12 to 7/31/12)
493 (0.7) 85 130 88 1st Stage: 0.12
2nd Stage: 0.13
3rd Stage: 0.10
9.9
Note:
1. The actual feed water recovery during Operating Period 2 was determined to be between 87 to 89%.
2. No cleaning was performed between Operating Period 3 and Operating Period 4.
Specific flux for the first stage elements are presented in Figure 2‐7. First stage permeability is impacted primarily by organic fouling, particulates, and biological growth and should not be impacted significantly by whether the membranes are operated in a two‐stage or three‐stage configuration. The first stage permeability therefore allows a direct comparison of the organic fouling rate between the TML20 and ESPA2 membranes for this feed water, along with a comparison of intrinsic resistance within the membranes (the membranes natural resistance to pushing water through). Specific flux decline for the two membranes was similar, with both showing a rapid initial decline during the first 20 days (500 hours) of operation, followed by relatively flat permeability (around 0.12 gfd/psi) until the membranes were cleaned after 260 days (6,250 hours). Fouling of the membranes was low compared with many operational AWP facilities.

Section 2 Demonstration Facility Description and Observations
January 2013 2‐21
Figure 2‐7 Membrane Permeability for RO System Trains A and B First‐stage Membranes
Operational Period 2: is defined as the operational period following the completion of the second chemical cleaning, which was conducted at run hour 6,265 for Train A and run hour 6,297 for Train B. During this time the target feed water recovery for both systems was 85 percent. Following the second cleaning, Train A operated for 2,144 run hours (3 months) with little fouling (2.1 percent per month). However, Train B only operated for 920 run hours (1.3 months) due to the aforementioned issue with the concentrate flow meter which led to the system being operated above the target recovery (i.e. 87 to 89 percent). During this time fouling rate was 15 percent based on the decline in the overall specific flux, however the Stage 3 fouling rate was 40 percent. At this time, the third stage was cleaned.
Operational Period 3 (Train B only) is defined as the operational period following the cleaning of the third stage membranes. During this period the system was operated with a target recovery of 80 percent during which time the issue with the concentrate flow meter was investigated and resolved. During this period the system operated for 591 run hours with a modest fouling rate of 2.1 percent.
Operational Period 4 (Train B only) is defined as the operational period during which the system was operated at 85 percent recovery upon resolving the aforementioned issue with the concentrate flow meter. During this time the system operated for 493 run hours (0.7 months) with a measured fouling rate of 9.9 percent. Because a limited amount of run time was conducted on Train B at 85 percent
0.00
0.02
0.04
0.06
0.08
0.10
0.12
0.14
0.16
0.18
0.20
Specific Flux (gfd/psi)
Run Hours
Toray ‐ TML400 Hydranautics ‐ ESPA2‐400

Section 2 Demonstration Facility Description and Observations
January 2013 2‐22
recovery, it is recommended that further operation be conducted to more fully assess the fouling rate at this recovery.
Table 2‐9 presents the water quality data for RO System Trains A and B for several key water quality parameters. The two types of membranes were projected to differ on some water quality parameters, but both systems consistently produced permeate with similar water quality characteristics. Software projections for both membranes predicted less rejection of total dissolved solids (TDS) and chloride, with the Hydranautics ESPA2 elements (Train A) closer to projections for TDS and the Toray TML20 elements (Train B) closer for chlorides. Nitrate rejection was significantly under‐estimated for the ESPA2 elements, projecting a total nitrogen concentration of 1.3 mg/L in the product, but measuring an average concentration nearly half of this, at 0.78 mg/L. In contrast, the TML20 software over estimated the nitrate rejection, predicting a total nitrogen of 0.3 mg/L, but measuring an average concentration more than double this, at 0.78 mg/L. Overall, there was very little difference between the permeate produced by the two RO membranes tested, in spite of the initial projections that had suggested much higher nitrogen removal with the TML20 elements.
Table 2‐9 Comparison of RO System Trains A and B Permeate Water Quality
Contaminant Units Number of Samples (n)
Train A Permeate (Hydranautics
ESPA2) (Average ±STD)
Train B Permeate (Toray TML) (Average
±STD)
Nutrients
Ammonia, Total mg/L‐N 20 0.39 ±0.13 0.40 ±0.14
Nitrate mg/L‐N 20 0.38 ±0.09 0.40 ±0.09
Nitrite mg/L‐N 14 0.02 ±0.00 0.02 ±0.00
Nitrogen, Total mg/L‐N 20 0.78 ±0.12 0.77 ±0.09
Phosphorus, Total µg/L‐P 21 5 ±2 4 ±2
Inorganic
TDS mg/L 17 14 ±2 14 ±2
Sodium mg/L 15 2.8 ±0.4 2.8 ±0.4
Chloride mg/L 18 2.3 ±1.9 2.2 ±0.3
Boron mg/L 15 0.22 ±0.02 0.22 ±0.02
Manganese mg/L 15 0.002 ±0.001 0.002 ±0.001
Fluoride mg/L 17 0.03 ±0.00 0.03 ±0.00
Organics
TOC mg/L 9 0.18 ±0.01 0.18 ±0.01
UV 254 cm‐1 41 0.016 ±0.00 0.016 ±0.00
Microbial
Total / Fecal Coliform MPN/100 mL 73 <1 <1
Comparison of RO Configurations
Figure 2‐8 presents the RO feed pressure for the two‐stage and three‐stage flow configurations. Since membrane permeabilities did not differ significantly between the two systems, the higher feed pressure seen with Train B (the Toray membranes) is the result of higher differential pressure losses associated with the three‐stage operation. In a two‐stage configuration, differential pressure loss occurs as water passes along the feed spacers of seven first‐stage elements followed by seven second‐stage elements, averaging 12 psi of loss within the first stage and 11 psi within the second. This pressure loss is partially overcome by an interstage boost from the energy recovery devices; however, the differential pressure loss still results in a decrease in net driving pressure and a lower water production in the tail end elements. For the three‐stage configuration, differential pressure loss occurs

Section 2 Demonstration Facility Description and Observations
January 2013 2‐23
across three separate stages, although with only six elements in each stage, rather than the more typical seven elements used in the two‐stage configuration. An average 11 psi of differential pressure loss occurred within the first stage, 15 psi in the second, and 13 psi in the third. As with the two‐stage configuration, the differential pressure loss was partially overcome using an interstage boost from the energy recovery device.
Figure 2‐8 Feed Pressures for RO System Trains A and B
The operating results presented in Figure 2‐8 demonstrate that the higher differential pressure loss experienced with the three‐stage configuration resulted in a feed pressure between 10 to 15 psi higher than the two‐stage configuration. This higher feed pressure relates directly to higher operating costs and energy demands for a three‐stage configuration.
The rapid increase in feed pressure seen in the two‐stage system after 170 days shown in Figure 2‐7 resulted from removal of the energy recovery device for repair. The two‐stage system operated at a feed pressure nearly identical to the three‐stage system during the period in which no energy recovery device was used with the two‐stage system, however, when the repaired energy recovery device was returned to service at 209 days, the feed pressure for the two‐stage system dropped to approximately 15 psi below the three‐stage system. Additional information on the comparison of the energy usage of the two‐stage versus three‐stage RO configuration is presented in Section 2.3.5.
100
110
120
130
140
150
160
Feed Pressure (psi)
Run Hours
Toray ‐ 3‐Stage Hydranautics ‐ 2‐Stage

Section 2 Demonstration Facility Description and Observations
January 2013 2‐24
2.3.3 UV Disinfection and Advanced Oxidation The UV disinfection and advanced oxidation system was operated to achieve a target log removal of NDMA and 1,4‐dioxane of 1.2‐logs and 0.5‐logs, respectively, based on the 2008 CDPH Groundwater Replenishment Reuse Draft Regulations. After the commencement of this project, CDPH issued revised Groundwater Replenishment Reuse Draft Regulations (November 2011) that did not include the requirement for 1.2‐log NDMA removal. The revised draft regulations maintained the requirement for 1,4‐dioxane removal and included a requirement to meet the 10 nanogram per liter (ng/L) Notification Level for NDMA. However, testing conducted at the Demonstration Facility has shown that these low NDMA levels were met in the tertiary effluent before treatment, which means it may not ultimately be necessary to provide treatment for NDMA at the Full‐Scale Facility. NDMA levels in the tertiary effluent are lower than other operating AWP facilities.
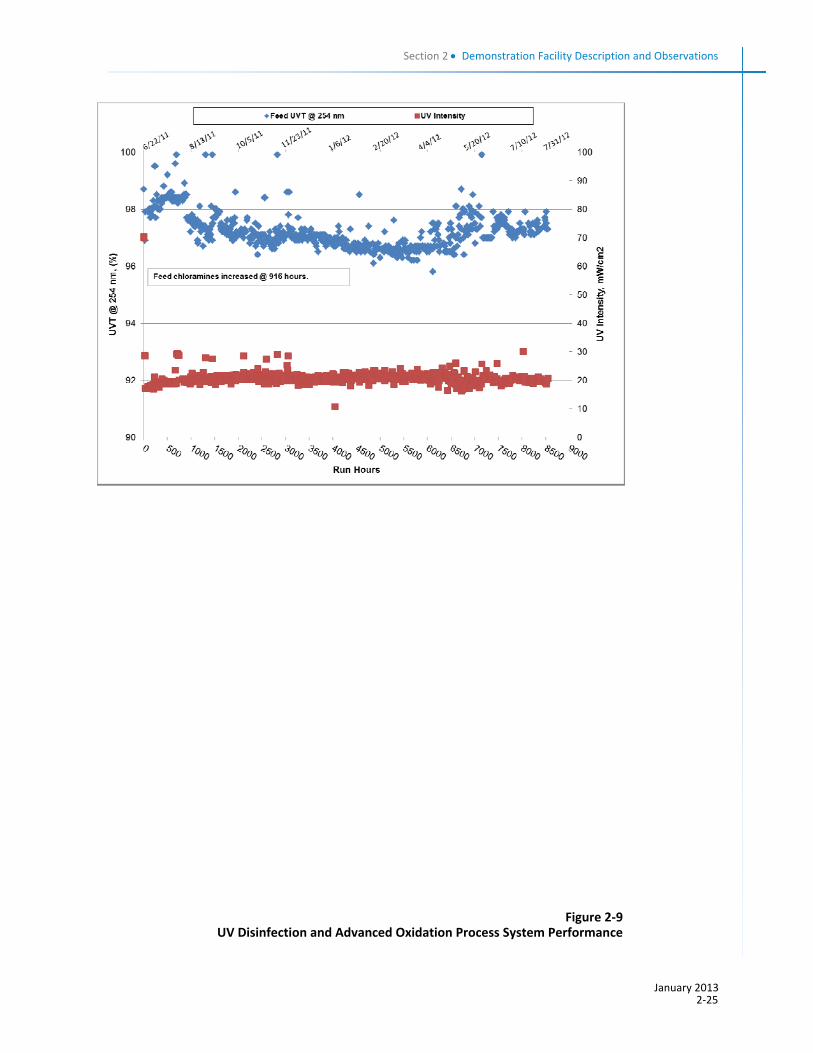
The target hydrogen peroxide dose applied to the UV disinfection and advanced oxidation feed water was held constant at 3 mg/L, targeting the required 0.5‐log destruction of 1,4‐dioxane. The ultraviolet light transmittance (UVT) at the 254 nanometer wavelength measured in the feed ranged from approximately 97 percent to 98.5 percent, which was determined to be impacted by the chloramines residual concentration. The Trojan control system adjusted the reactor power to maintain the target log removals using an algorithm, which takes into account feed flow, temperature, UVT, and lamp age.
Operating parameters monitored on the UV system for nearly 8,500 hours of operation are provided in Figure 2‐9. The average reactor power level required to achieve the target NDMA removal as predicted by the Trojan control system was approximately 67 percent, which corresponds to an average power of 12.6 kilowatt (kW). A slight increase in the power required to achieve the target removal was observed to increase with an increase in runtime. The increased power was attributed to the decrease in temperature during the winter months as well as lamp aging, both of which increased the applied power to achieve a target contaminant removal. The average electrical energy per order (EEO) value as predicted by the Trojan algorithm and displayed on the human machine interface (HMI) over the testing period was 0.26 kilowatt‐hours (kWh)/1,000 gallons/ log removal.
The UV system at the Demonstration Facility had five ballast failures which caused the reactor power to increase to 100 percent. The manufacturer indicated that the ballast failures were caused by failures in weak components of the faulty ballasts. The design of the Full‐Scale Facility should include power monitoring of the Full‐Scale Facility power sources to determine if a transient voltage surge suppressor should be included in the UV system design. Further discussion related to power optimization is provided in Section 3.1.3.
The EEO values and NDMA removal performance of the UV disinfection and advanced oxidation system were confirmed by conducting an initial spiking experiment. The spiking experiment was conducted by injecting a laboratory prepared NDMA stock solution to the UV and advanced oxidation feed water. The results of the spiking experiment are summarized in Figure 2‐10. Overall the results showed that the Trojan system achieved NDMA removals between 1.5 to 2.1 log units over the span of power settings that were tested (60 percent to 100 percent). In addition, the system operated more efficiently than predicted by the Trojan algorithm. Calculated values of EEO based on results of the spiking experiment ranged from 0.18 to 0.21 kWh/1,000 gallons/log removal over the range of power settings tested. This EEO is similar to the tested EEO of 0.19 to 0.23 kWh/1,000 gallons/log removal for the UV disinfection and advanced oxidation system at the West Basin Municipal Water District’s Edward C. Little Water Recycling Facility, a full‐scale AWP Facility
Section 2 Demonstration Facility Description and Observations
January 2013 2‐25
Figure 2‐9 UV Disinfection and Advanced Oxidation Process System Performance

Section 2 Demonstration Facility Description and Observations
January 2013 2‐26
1.51.5
1.92.1
0.97
1.2
1.6
2.5
0.0
0.5
1.0
1.5
2.0
2.5
3.0
60% 64% 78% 100%
Av
era
ge
ND
MA
Re
mo
va
l (n
=3
)
Reactor Power Level, %
Measured NDMA Removal Anticipated NDMA Removal
TargetNDMA Removal (1.2)
.
Figure 2‐10 UV Disinfection and Advanced Oxidation NDMA Spiking Experiment Results
A second spiking experiment was conducted to demonstrate the performance of the reactor at removing both NDMA and 1,4‐dioxane, the results of which are summarized in Figure 2‐11. A laboratory‐prepared 1,4‐dioxane stock solution was injected into the UV and advanced oxidation feed water. The UV/AOP system achieved 0.6‐log removal (74.9 percent) of 1,4‐Dioxane under the design conditions. This exceeded the log‐removal goal of 0.5 (68.7 percent) based on 2011 Groundwater Recharge Reuse Draft Regulations. Figure 2‐11 plots log removal of 1,4‐dioxane versus target peroxide dose for Tests 1 to 3. The results show a linear relationship between log removal and peroxide dose (R2 = 0.99). Based on this relationship, a predicted target dose of 2.3 mg/L would be required to achieve 0.5 log removal of 1,4‐dioxane. The significance of these results is that it may be possible to optimize the peroxide dose to reduce O&M costs of the UV/AOP if it is considered that there is a balance between electrical energy and peroxide dose needed to achieve the optimal operating conditions.
The EEO observed for 1,4‐dioxane destruction ranged from 0.5 to 0.7 kWh/1,000 gallons/log reduction with a peroxide dose of 2.5 mg/L. This EEO is similar to the EEO of 0.5 kWh/1,000 gallons/log reduction reported by the Orange County Water District after initial testing at their Groundwater Replenishment System.

Section 2 Demonstration Facility Description and Observations
January 2013 2‐27
Figure 2‐11
UV Disinfection and Advanced Oxidation 1,4 Dioxane Spiking Experiment Results
2.3.4 Chemical Consumption The consumption of chemicals was monitored over the testing period. Key information and observations related to chemical consumption during the testing period for the various Demonstration Facility water purification processes are summarized below.
The Demonstration Facility used four chemicals during routine operations: ammonium hydroxide, sodium hypochlorite, antiscalant, and hydrogen peroxide. Table 2‐10 provides specific information for each chemical used including target dose, location, stock concentration and purpose. Chemicals were fed into the process stream using diaphragm metering pumps. The speeds of the pumps are flow paced to maintain a constant dose when changes in flow occur. The most notable flow change throughout the Demonstration Facility operations was the feed flow when the MF or UF system goes into backwash or pressure decay test mode. Cylinder draw downs were completed daily to make sure that each chemical was being fed accurately and in the proper quantity.

Section 2 Demonstration Facility Description and Observations
January 2013 2‐28
Table 2‐10 Summary of Chemicals used by the Demonstration Facility Water Purification Processes
Chemical Stock
Concentration (w/w)
Injection Location
Target Dose (mg/L)
Purpose
Ammonium hydroxide
19% MF/UF Influent
1.5 To combine with sodium hypochlorite to form chloramines for membrane biofouling control.
Sodium hypochlorite
13% MF/UF Influent
3.8 To combine with ammonia to form
chloramines for membrane biofouling control.
Antiscalant 100% RO Influent 3 To prevent scaling of RO membranes.
Hydrogen peroxide 30% UV Influent 3 Reacts with UV light to form free hydroxyl radicals to provide advanced oxidation.
Monitoring of the chemical consumption of the Demonstration Facility water purification processes was conducted throughout the testing period. Table 2‐11 provides information related to chemical usage for the MF, UF, RO and UV disinfection and advanced oxidation systems. The table provides the total amount of each chemical delivered during each testing period as well as the estimated average daily consumption per 1‐mgd production of purified water.
The average daily consumption of each chemical represents the average of values determined from each testing period. During the Q1 Testing Period the daily consumption for each chemical was estimated based on full capacity production for a 24 hour period and the target dose rate. During the Q2 through Q4 Testing Periods, the actual average daily consumption usage of each chemical was determined by monitoring the level of each chemical storage tank before and after each delivery. The volume of each chemical used over the testing period was then calculated based on the difference in tank levels recorded at the beginning and end of the testing period, the total volume delivered over the testing period and the estimated storage capacity per foot of each chemical tank. The total calculated usage over the testing period was then divided by the total number of days in the testing period to estimate the average daily usage. No chemical usage above that expected was required during any of the testing periods.
Table 2‐11 Summary of Chemical Consumption
Chemical
Total Amount Delivered Start up and Testing Period 1 5/3/11 to 10/31/11 (gallons)
Total Amount Delivered
Testing Period 2 11/1/11 to 2/10/12 (gallons)
Total Amount Delivered
Testing Period 3 2/11/11 to 5/14/12 (gallons)
Total Amount Delivered
Testing Period 4 5/15/11 to 7/31/12 (gallons)
Estimated Average Daily Consumption per 1 mgd (gallons)
Ammonium hydroxide 1,593 1,007 1,208 928 11
Sodium hypochlorite 4,229 2,932 3,464 2,636 31
Antiscalant 440 275 220 164 3
Hydrogen peroxide 1,784 869 550 546 8
2.3.5 Energy Consumption The power consumption of each Demonstration Facility water purification process was monitored during the demonstration period by taking daily readings of power consumption totals displayed on the Demonstration Facility control system. The totals are based on daily power logged by the individual power monitors (Electro Industries Model Shark 200) installed in each individual water purification processes (MF, UF, RO and UV disinfection and advanced oxidation systems). An
Section 2 Demonstration Facility Description and Observations
January 2013 2‐29
additional power meter was also installed to monitor the total power being used by the Demonstration Facility. The purpose of the main power meter was to capture the power usage of the entire Demonstration Facility, including MF, UF, RO and UV disinfection and advanced oxidation systems; chemical storage and feed systems for pre‐treatment; and loads such as lights, air conditioning, and ancillary equipment (e.g., auto‐samplers, TOC analyzer, etc.) plugged into the 120V receptacles. Table 2‐12 summarizes the power monitors and associated equipment monitored by each power monitor.
Table 2‐13 summarizes the monthly power usage by each water purification process for the days that the Demonstration Facility was in operation. Appendix F provides daily power totals logged from the main control system screen for each water purification process from 8/1/11 to 7/31/12.
The following observations were made regarding the Demonstration Facility power usage:
Since the membrane filtration feed pumping was provided by the EDR feed pump located external to the Demonstration Facility, the power usage of the membrane filtration feed pumping was not monitored continuously. The power consumption of the EDR feed pump feeding the membrane filtration systems was monitored for three days and average daily power consumption was 960 kWh/d. The major power requirement for the membrane filtration systems is influent pumping.
The UF power usage is consistently higher than the MF power usage, which was attributed to the oversized air compressor and other inefficient design components. The UF power usage is discussed in more detail below.
Following the replacement of the inlet valve electro‐pneumatic positioner with a pneumatic actuator on 1/18/12, the daily UF power totals were observed to increase by approximately 50 kWh/d.
The measurements in the MF power monitor increased in October 2011 and April 2012 due to increased power usage required to heat the cleaning chemicals for the chemical cleanings conducted in those months. However, the increase in power usage of chemical cleanings was offset by reduced power usage from MF downtimes.
Comparison of the sum of the individual power meters for the water purification processes to Demonstration Facility power meter show that the power usage for ancillary equipment not specific to MF/UF, RO or UV disinfection and advanced oxidation systems was approximately 3 percent to 4 percent of the total Demonstration Facility power usage.

Section 2 Demonstration Facility Description and Observations
January 2013 2‐30
Table 2‐12 Demonstration Facility Power Monitors
Power Monitor Equipment Monitored Equipment Not Monitored
1 MF System
MF strainer
MF skid including recirculation pump and reverse feed pump
MF skid including hot water pump
MF/UF/RO CIP tank heater
MF air compressor system
MF control panel and MF air dryer are on 120 V power source and captured by the Demonstration Facility main power monitor
2 UF System
UF strainer
UF skid including backwash pump
UF air compressor system
UF chemical transfer pumps
3 RO Train A System RO Train A including Train A feed pump RO cleaning skid including permeate flush pump and cleaning pump are captured by the Demonstration Facility main power monitor
4 RO Train B System RO Train B including Train B Feed pump
5 UV Disinfection and Advanced Oxidation System
UV system
Hydrogen peroxide feed pumps
6 Demonstration Facility Main
All equipment located within Demonstration Facility, including: RO cleaning skid with permeate flush pump and cleaning pump; ancillary process equipment such as sodium hypochlorite feed pump, ammonium hydroxide feed pump, disinfection carrier water pump, sulfuric acid feed Pump, antiscalant feed pump, sump pump; analyzer equipment such as auto‐samplers, TOC analyzer, etc.; lights; and air conditioning.
EDR feed pump for MF/UF feed pumping
Reference: Indirect Potable Reuse/Reservoir Augmentation Demonstration Project Advanced Water Purification Facility at North City WRP, Approved for Construction Drawings, CDM Smith/MWH, February 2011, Drawings 28‐E‐3 and 28‐E‐4.

Section 2 Demonstration Facility Description and Observations
January 2013 2‐31
Table 2‐13 Demonstration Facility Power Usage Monthly Summary
Month
Total Monthly Power Consumption (kWh) 8
MF 1 UF 2 RO Train A RO Train B UV Ancillary Loads 3
Total including MF/UF Feed
Pumping 4
Total including MF/UF Feed
Pumping 5
Total without
MF/UF Feed Pumping 6
Total without
MF/UF Feed
Pumping 7
Aug 2011 14,200 16,100 14,400 18,100 6,600 69,300 45,000
Sep 2011 13,500 15,200 17,200 17,100 5,300 68,300 45,600
Oct 2011 14,800 19,000 21,900 22,200 8,600 86,600 61,200
Nov 2011 14,900 18,100 21,300 22,400 8,300 85,000 59,700
Dec 2011 16,600 20,100 25,800 27,500 8,900 3,200 98,900 102,000 70,900 74,100
Jan 2012 16,600 20,800 25,400 27,100 8,800 3,200 98,600 102,000 70,400 73,600
Feb 2012 16,200 21,100 25,600 26,900 8,900 3,000 98,700 102,000 71,200 74,200
Mar 2012 17,800 21,600 24,700 26,600 8,900 3,300 99,500 103,000 70,400 73,700
Apr 2012 18,100 21,000 22,700 27,300 9,000 3,400 98,200 102,000 70,200 73,600
May 2012 15,000 17,300 19,100 21,700 7,500 2,500 80,700 83,000 56,000 58,600
June 2012 14,000 16,700 18,800 21,600 7,200 2,700 78,300 81,000 55,400 58,100
July 2012 14,400 17,200 19,200 22,500 9,100 2,400 82,400 84,000 58,000 59,200
Total Power (kWh) 186,000 224,200 256,100 281,100 97,100 1,044,500 734,000
Total Flow Treated (MG) 172 174 161 161 324 324 324 324 324 324
Average Power Consumption per Flow (kWh/MG)
1,100 1,300 1,600 1,700 300 3,200 2,300
Notes: 1Includes power measured by MF system power monitor, estimated power usage for MF feed pumping, and estimated power usage for MF control panel and MF air dryer that are powered through the 120V system. MF feed pumping is based on average feed flow of 570 gpm and 35‐40 psi of pressure. Feed pressure was reduced at the PRV located upstream of MF. The MF control panel is estimated to use 14 kWh/day and the MF air dryer is estimated to use 2.9 kWh/day. 2Includes power measured by UF system power monitor and estimated power consumption for UF feed pumping. UF feed pumping is based on average feed flow of 552 gpm and 35‐40 psi of pressure. Feed pressure was reduced at the PRV located upstream of UF. 3 Includes power usage for: RO cleaning skid with permeate flush pump and cleaning pump; ancillary process equipment such as sodium hypochlorite feed pump, ammonium hydroxide feed pump, disinfection carrier water pump, sulfuric acid feed pump, antiscalant feed pump, sump pump; analyzer equipment such as auto‐samplers, TOC analyzer, etc.; lights; and air conditioning. 4Total estimated power usage for UF, MF, RO and UV disinfection and advanced oxidation systems, including membrane filtration feed pumping. Does not include RO cleaning skid, ancillary process equipment, analyzer equipment, lighting and air conditioning. 5The total Demonstration Facility power usage measured by the main power monitor plus the estimated power usage for membrane filtration feed pumping. The main power monitor was installed on 11/8/11. 6Total estimated power usage for UF, MF, RO and UV disinfection and advanced oxidation systems. Does not include membrane filtration feed pumping. Does not include RO cleaning skid, ancillary process equipment, analyzer equipment, lighting and air conditioning.
7The total Demonstration Facility power usage measured by the main power monitor. Does not include the estimated power usage for membrane filtration feed pumping.
8For days that power totals were not recorded from the meters, power usage was estimated based on the estimated runtime and typical power usage over a 24‐hour period.

Section 2 Demonstration Facility Description and Observations
January 2013 2‐32
Membrane Filtration Power Consumption
The detailed breakdown of monthly total membrane filtration power consumption is summarized in Table 2‐14.
Table 2‐14 Membrane Filtration Power Consumption
MF UF
Month MF Power Monitor1
MF Feed Pumping2
MF Control Panel3
MF Air Dryer4
Total MF UF Power Monitor5
UF Feed Pumping6
Total UF
Aug 2011 1,621 12,114 361 72 14,168 3,953 12,190 16,143
Sep 2011 1,668 11,449 341 68 13,526 4,027 11,213 15,241
Oct 2011 2,438 11,953 356 71 14,818 5,561 13,460 19,021
Nov 2011 1,566 12,860 383 77 14,885 5,593 12,464 18,056
Dec 2011 1,811 14,271 425 85 16,591 6,337 13,753 20,090
Jan 2012 1,720 14,331 427 85 16,563 6,902 13,890 20,791
Feb 2012 1,737 13,948 415 83 16,184 7,554 13,519 21,073
Mar 2012 2,277 14,996 446 89 17,809 7,342 14,124 21,466
Apr 2012 3,401 14,210 423 85 18,119 7,225 13,773 20,998
May 2012 1,942 12,638 376 75 15,031 5,330 11,995 17,325
June 2012 2,057 11,469 341 68 13,935 5,294 11,448 16,741
July 2012 1,577 12,396 369 74 14,416 5,211 12,014 17,225
Total Power
(kWh) 23,816 156,633 4,663 933 186,044 70,327 153,843 224,170
Total Flow Treated (MG)
172 172 172 172 172 174 174 174
Average Power Consumption per Treated Flow
(kWh/MG)
139 913 27 5 1,084 404 885 1,289
Notes: 1Measured by MF system power monitor. MF power usage for membrane skids and ancillary equipment includes power usage from chemical cleaning system tank heater, which was also used for UF and RO cleanings. Therefore, MF power usage is slightly overestimated. 2Calculated value based on average feed flow of 570 gpm and 35‐40 psi of pressure. 3MF control panel is powered through the 120V system. The MF control panel is estimated to use 14 kWh/day. 4 MF air dryer is powered through the 120V system. The MF air dryer is estimated to use 2.9 kWh/day. 5 Measured by UF system power monitor. UF power usage for membrane skids and ancillary equipment does not include power usage from chemical cleaning system tank heater (measured as part of MF system) or chemical cleaning system pumps (measured separately and accounted for as part of ancillary loads). Therefore, UF power usage is slightly underestimated. 6Calculated value based on average feed flow of 552 gpm and 35‐40 psi of pressure.
Power Monitoring of the Membrane Filtration Feed Pump (EDR Feed Pump)
The power to pump the tertiary recycled water to the membrane filtration systems is separate from the power to the Demonstration Facility and not measured with the Demonstration Facility power monitor. The membrane filtration feed pump is shared with the City’s EDR system and is set to pump at a discharge pressure of approximately 35 to 40 psi, which is later reduced down to 15.5 psi and 17.2 psi to meet the membrane filtration system influent pressure requirements (the estimated average feed pressure required for the MF and UF are 15.5 psi and 16.0 psi, respectively, after accounting for the backpressure on the UF system). The membrane filtration feed configuration in the Demonstration Facility is not reflective of the Full‐Scale Facility influent pumping configuration, since

Section 2 Demonstration Facility Description and Observations
January 2013 2‐33
the Full‐Scale Facility will be located north of North City and will have different head requirements (see Section 4).
The City performed short‐term power monitoring of the EDR feed pump that supplies feed water to the membrane filtration systems to determine how much power was used to feed the membrane filtration systems at the Demonstration AWP Facility. An external power meter was connected to the feed pump for approximately nine days. Based on the total power recorded over this time period, the power usage of the feed pump per day was approximately 960 kWh/day to feed both membrane filtration systems. The membrane filtration feed pumping accounted for approximately 30 percent of the total Demonstration Facility power consumption.
Estimated Power Usage for Membrane Filtration Feed Pumping
Since approximately 18 to 25 psi of pressure was lost, on average, across the pressure reducing valves located upstream of the membrane filtration, a more realistic power requirement for membrane filtration feed pumping was estimated based on the average transmembrane pressure across the membrane filtration membranes that were measured during the Demonstration Facility testing period. Based on this calculation, the membrane filtration feed pumping was reduced to approximately 10 percent of the total Demonstration Facility power consumption. Table 2‐15 shows a detailed breakdown of the membrane filtration power consumption with the EDR feed pump used for membrane filtration feed pumping.
Table 2‐15 Average Power Consumption per Flow Treated for Membrane Filtration
Average Power Consumption per Flow Treated (kWh/MG) MF 1 UF 2
Equipment Pumping with EDR
Feed Pump
Estimated Pumping based on
transmembrane pressure
Pumping with EDR Feed Pump
Estimated Pumping based on
transmembrane pressure
Feed Pumping
913(Average Feed Pressure = 35‐40
psi)
232 (Average Feed
Pressure = 15.5 psi)
885(Average Feed Pressure = 35‐40
psi)
232 (Average Feed
Pressure = 16.0 psi)
Membrane Skids and Ancillary Equipment
171 170 404 408
Total 1,084 402 1,289 640
Notes: 1MF power usage for membrane skids and ancillary equipment include power usage from the chemical cleaning system tank heater, which was also used for UF and RO cleanings. Therefore, MF power usage is slightly overestimated. 2UF power usage for membrane skids and ancillary equipment does not include power usage from the chemical cleaning system tank heater (measured as part of MF system) or the chemical cleaning system pumps (measured separately and accounted for as part of ancillary loads). Therefore, UF power usage is slightly underestimated.
Investigation of UF Power Usage
As shown in Table 2‐15 and Appendix F, the UF system required approximately 18 percent more power than the MF system during the Demonstration Project. Table 2‐15 shows that the difference in power consumption is greater (59 percent) once the influent pumping requirements are adjusted to eliminate excess pumping, as discussed above.
The City conducted additional power monitoring of the UF system with an external power meter to confirm the power usage. The power meter was connected to the main UF power supply for approximately 14 days. Based on the total power recorded over this time period, the power usage of

Section 2 Demonstration Facility Description and Observations
January 2013 2‐34
the UF system was determined to be approximately 200 kWh/day, which correlates to the values logged from the power monitor equipped on the system.
Next, the power usage of the air compressor on the UF system was monitored for nearly 14 days using the external power meter. Based on the total power recorded over this time period the power usage of the air compressor was determined to be 105 kWh/day, which is about half of the total UF power. It is expected that differences in the size and efficiency of the compressors equipped on the UF and MF systems may account for the discrepancy in power totals. The UF system air compressor is 40 HP and requires 50 amps while the MF system air compressor is about 8 horsepower (HP) and requires 7.9 amps. It seems that the UF system air compressor was oversized and the design could be optimized for the Full‐Scale Facility.
Reverse Osmosis
Comparison of Two‐stage versus Three‐stage RO Systems
Two RO configurations were tested at the Demonstration Facility, two‐stage and three‐stage configurations, both incorporating energy recovery devices that were designed to provide approximately 23 psi of interstage boost. As previously discussed, the three‐stage configuration (RO Train B) provided no improvement in performance over the two‐stage configuration (RO Train A), but required a feed pressure 5 to 10 percent higher. As shown in Table 2‐16 below, the three‐stage configuration (RO Train B) required on average 9 percent more energy than a two‐stage configuration (RO Train A).
Table 2‐16 Comparison of Two‐stage RO and Three‐stage RO Power Consumption
Total Monthly Power Consumption (kWh)
Month RO Train A 1 (Two‐Stage Configuration)
RO Train B 2 (Three‐stage configuration)
Ancillary Loads 3
Aug 2011 14,400 18,100
Sep 2011 17,200 17,100
Oct 2011 21,900 22,200
Nov 2011 21,300 22,400
Dec 2011 25,800 27,500 3,200
Jan 2012 25,400 27,100 3,200
Feb 2012 25,600 26,900 3,000
Mar 2012 24,700 26,600 3,300
Apr 2012 22,700 27,300 3,400
May 2012 19,100 21,700 2,500
June 2012 18,800 21,600 2,700
July 2012 19,200 22,500 2,400
Total Power (kWh) 256,100 281,100
Total Flow Treated (MG) 161 162 324
Average Power Consumption per Treated Flow (kWh/MG)
1,600 1,700
Notes: 1Measured by RO Train A power monitor. Two‐stage system. Energy recovery device is ERI Turbocharger LPT‐250. 2Measured by RO Train B power monitor. Three‐stage system. Energy recovery device is ERI Turbocharger LPT‐150. 3Includes power usage for: RO cleaning skid with permeate flush pump and cleaning pump; ancillary process equipment such as sodium hypochlorite feed pump, ammonium hydroxide feed pump, disinfection carrier water pump, sulfuric acid feed pump, antiscalant feed pump, sump pump; analyzer equipment such as auto‐samplers, TOC analyzer, etc.; lights; and air conditioning.

Section 2 Demonstration Facility Description and Observations
January 2013 2‐35
A two‐stage configuration is currently used at the City of Los Angeles’ Terminal Island AWP Facility, Water Replenishment District’s Leo J. Vander Lans Water Treatment Facility, and one of the West Basin Municipal Water District’s AWP facilities; however, a three‐stage configuration is used at the Orange County Groundwater Replenishment System and another of the West Basin Municipal Water District’s AWP facilities. The preliminary layout, design criteria, and cost estimate are based on a two‐stage configuration, based on three quarters of operating data, which showed that a three‐stage configuration required approximately 8 percent more energy with no improvement in performance over a two‐stage configuration.
Evaluation of Energy Recovery Devices
Both RO trains are equipped with energy recovery devices to utilize wasted energy from the RO concentrate to boost feed pressures to the final stage. Energy recovery devices have been employed successfully at brackish water RO facilities in California and other western states, but have not yet been incorporated into an AWP Facility in the region. While energy recovery devices will reduce the required feed pressure and energy usage at an RO facility, the ability of the operational savings to offset the cost of the equipment will depend on the salinity of the water, the residual energy in the concentrate, and the efficiency of the energy recovery device. Because of the limited data available on full‐scale operation of these devices in AWP facilities, a focus of the Demonstration Facility was to confirm the accuracy of projected energy recovery estimated using RO design models (IMSDesign v. 2009).
Table 2‐17 presents information on the energy recovery devices used in the RO systems for the Demonstration Facility and the impacts these devices had on operating pressures. Section 3 includes additional information on the energy recovery devices. The average boost to the final stage shown in the table was measured directly from the systems; however, values for the two‐stage configuration include only data from after 209 days of operation when the energy recovery device had been repaired. Initial operation with the energy recovery device only resulted in a 5 to 10 psi boost in interstage pressure for the two‐stage system. After several months of trouble‐shooting with the RO system supplier and ERD manufacturer, the device was removed and sent for testing and repairs. When the repaired device was returned to service, the interstage boost averaged 23 psi. The reduction in feed pressure listed in Table 2‐17 for the two‐stage system was calculated as the average feed pressure when the device was offline (between 170 and 209 days) minus the average feed pressure after the device was returned to service (after 209 days). The reduction in feed pressure for the three‐stage system, in contrast, was calculated using an energy balance, the measured pressure boost to the final stage, and the flow ratio between the final stage and the first stage. Total energy reduction was calculated by dividing the calculated reduction in feed pressure by the measured feed pressure. The following formulas were used for these calculations:
Reduction in Feed Pressure (Threestage) Pr = Pb*Q3f/Q1f where Pr = Reduction in feed pressure P3b = Boost pressure to third stage Q3f = Feed flow to the third stage (calculated from concentrate plus third‐stage permeate flow) Q1f = Feed flow to the first stage

Section 2 Demonstration Facility Description and Observations
January 2013 2‐36
Total Energy Reduction Er = (Pr/P1f)*100 where Er = Reduction in energy (%) Pr = Reduction in feed pressure P1f = Feed pressure to the first stage
Concentrate Energy Recovered (Threestage) Ecr = (Pb*Q3f/(Pc*Qc))*100 where Ecr = Concentrate energy recovered (%) P3b = Boost pressure to third stage Q3f = Feed flow to the third stage Pc = Final concentrate pressure Qc = Final concentrate flow
Table 2‐17 Impact of Energy Recovery Devices on RO Operation
RO Train A
Two‐Stage Configuration
RO Train B
Three‐Stage Configuration
Equipment Model Number ERI Turbocharger LPT‐250 ERI Turbocharger LPT‐125
Average Boost to Final Stage 23 psi 24 psi
Reduction in Feed Pressure 10 psi 7.4 psi
Concentrate Energy Recovered 42% 27%
Total Energy Reduction 8% 5%
For the energy recovery devices used at the Demonstration Facility, the two‐stage configuration resulted in a higher overall recovery of energy. An average of 42 percent of the hydraulic energy present in the concentrate stream was recovered in the interstage boost, compared with only 27 percent energy recovery achieved in a three‐stage configuration. The energy recovery resulted in an overall energy savings of 8 percent and 5 percent for the two‐stage and three‐stage systems, respectively. Efficiencies of the energy recovery devices are impacted by operating pressures, concentrate and interstage flows and should not be assumed to remain constant over the full duration of plant operation.
UV Disinfection and Advanced Oxidation
The average reactor power level required to achieve the target NDMA removal as predicted by the Trojan control system was approximately 67 percent, which corresponds to an average power of 12.5 kW. The power required to achieve the target removal was observed to increase as runtime increased. The increased power was attributed to the decrease in temperature during winter months, as well as lamp aging, both of which increased the applied power to achieve a target contaminant removal. The average EEO value predicted over the testing period for NDMA was 0.26 kWh/1,000 gallons/ log removal. When measured during the testing period, however, the EEO was better than projected at 0.19 kWh/1,000 gallons/log removal. For the Full‐Scale Facility, multiple UV vessels in series will likely be used to improve overall reactor hydraulics, further reducing the EEO.
Section 2 Demonstration Facility Description and Observations
January 2013 2‐37
2.4 Water Quality and Regulatory Relevance This subsection includes a discussion of the water quality data collected during the operation of the Demonstration Facility and the regulatory relevance of the data in regards to future permitting of the Full‐Scale Facility. Non‐regulated water quality constituents are also discussed, in regards to potential health impacts associated with constituents monitored in the purified water.
2.4.1 Regulatory Background As described in the T&M Plan (Appendix A), a future Full‐Scale Facility will be subject to requirements put forth by CDPH and the Regional Board. At this time, specific requirements for reservoir augmentation have not been established by any state agencies, creating a degree of uncertainty regarding the ultimate requirements which will need to be met. For purposes of evaluating the regulatory relevance of the water quality observed at the Demonstration Facility, water quality goals were developed for the T&M Plan based on:
Compliance with all federal (U.S. Environmental Protection Agency [EPA]) and state (CDPH) drinking water maximum contaminant levels (MCLs) and secondary maximum contaminant levels.
Remaining below all CDPH notification levels (NLs).
Compliance with all requirements of the August 2008 and November 2011 CDPH Groundwater Replenishment Reuse Draft Regulations. These draft requirements were used because CDPH has not issued draft regulations for surface water augmentation. (Note that in November 2011, after the Demonstration Facility design and T&M Plan were completed, CDPH released updated Groundwater Replenishment Reuse Draft Regulations. The goals included here‐in comply with requirements from both the 2008 and the 2011 draft regulations.)
Compliance with all established discharge requirements from the Regional Board, including Basin Plan Objectives, California Toxics Rule (CTR) requirements for freshwater and for human health, and State Board Policy for Implementation of Toxics Standards for Inland Surface Water, Enclosed Bays, and Estuaries of California (SIP). It should be noted here that not all requirements for the CTR or the nutrient limits of the Basin Plan have been firmly established for discharges to San Vicente Reservoir and some uncertainly therefore remains on these specific requirements.
Compliance with project specific goals established for the Demonstration Facility.
Twenty‐one key water quality parameters were identified to serve as a primary focus of the water quality testing, with project specific goals established for each parameter as listed in Table 2‐18. These key constituents were identified because they can be challenging to remove by the treatment processes employed or because they are widely used parameters to measure performance of water treatment processes. Additionally, nutrients are a specific concern when introducing purified water to the San Vicente Reservoir, and five specific nutrient goals were identified as part of the key water quality parameters. Several of the water quality goals were based on CTR limits for consumption of water and organisms, without accounting for a mixing zone, as would typically be applied. The goals are considered conservative with respect to potential requirements of the CTR. Of particular note are the goals established for bromoform, bromodichloromethane, and dibromochlormethane, which are three of the four trihalomethanes that also regulated for drinking water with an MCL of 80 µg/L for

Section 2 Demonstration Facility Description and Observations
January 2013 2‐38
the sum of all four trihalomethanes. The goals listed in Table 2‐18 for these three trihalomethanes are more than 100 times lower than this drinking water MCL and are based on CTR limits that may not be applicable once potential mixing zones are accounted for in the reservoir.
All water quality goals defined in the T&M Plan were reviewed and commented on by CDPH, the Regional Board, and the Demonstration Project Independent Advisory Panel. As a result of the comments received, the T&M Plan was expanded to include sampling for additional water quality parameters and increased frequency and number of samples for constituents that were identified in the draft plan. These comments and a description of how they were addressed are included as an Appendix to the T&M Plan.
Table 2‐18 Demonstration Facility Project Specific Water Quality Goals
Constituent Units Water Quality
Goala
Removal Challenge Bromoform µg/L 0.5
Methylene Chloride µg/L 4.7
Trihalomethanes, Total (TTHMs) µg/L 80
Bromodichloromethane µg/L 0.56
Dibromochloromethane µg/L 0.5
Haloacetic Acids (HAA5) µg/L <60
N‐Nitrosodiethylamine (NDEA) ng/L 10
N‐Nitrosodimethylamine (NDMA) ng/L 2
1,4‐Dioxane µg/L 1
1,2‐Dichloroethane µg/L 0.5
Boron mg/L 1.0
Common Parameters Total Organic Carbon (TOC) mg/L 0.5
Total Dissolved Solids (TDS) mg/L 300
Chloride mg/L 50
Sulfate mg/L 65
Turbidity NTU 0.2
Nutrients Nitrate as N mg/L 1
Nitrite as N mg/L 1
Ammonia as N (unionized)b mg/L 0.025
Phosphorus, Total mg/L 0.1
Nitrogen, Total mg/L 1
Note: a. See T&M Plan, Table 5‐2 (Appendix A). b. Unionized values of ammonia are not directly measured, but are estimated using EPA’s Aqueous Ammonia
Equilibrium – Tabulation of Percent Un‐ionized Ammonia (EPA‐600/3‐79‐091) along with average values of
temperature and pH.
2.4.2 Summary of Water Quality Testing The T&M Plan outlined an extensive water quality monitoring plan for the Demonstration Facility. Water quality testing was conducted in the following seven constituent categories.
Routine Water Quality Monitoring. This category consisted of nutrients (nitrogen and phosphorus); volatile organic compounds (trihalomethanes, methylene chloride, 1,2‐dichloroethane); nitrosamines; 1,4‐dioxane; and TOC. Sampling frequencies ranged from bi‐weekly to monthly depending on the specific parameter.

Section 2 Demonstration Facility Description and Observations
January 2013 2‐39
Microbial Monitoring. This category consisted of total coliform and fecal coliform, in which sampling was initially conducted daily and then weekly. Somatic and male specific bacteriophage (viruses) sampling was initially conducted weekly, then monthly.
Basin Plan Objectives Monitoring. This category consisted of parameters with Basin Plan numeric objectives not addressed in other sampling categories: TDS, Chloride, Sulfate, Sodium, Iron, Manganese, Boron, Color, Fluoride, Phenolic compounds, pH, Temperature, Dissolved Oxygen, and Turbidity. Sampling frequencies ranged from daily to bi‐monthly.
Quarterly Monitoring. This category consisted of: (1) compounds with Federal and State drinking water MCLs; (2) compounds included on EPA’s priority pollutant list; (3) compounds with current CDPH NLs; (4) compounds on the US EPA’s current Unregulated Contaminant Monitoring Rule (UCMR3) list; (5) other Radionuclides (Cesium‐137, Iodine‐29, Iodine‐131); 6) other compounds recommended by the IAP (Lithium, benzo(k)fluoranthene, hexavalent chromium). Samples were collected quarterly.
Constituents of Emerging Concern (CECs). During the Q1 and Q2 Testing Periods, an initial characterization study was conducted based on four monthly sampling events for 91 CECs, including pesticides, herbicides, pharmaceuticals, and ingredients in personal care products representing a wide range of chemical and physical properties. Following the initial characterization study, the CEC monitoring program was modified to include the health‐based and performance‐based indicators recommended by the State Board’s expert panel on CEC monitoring for groundwater recharge projects that utilize RO/advanced oxidation. The complete report produced by the expert panel can be found online at the following website: http://www.waterboards.ca.gov/water_issues/programs/water_recycling_policy/recycledwater_cec.shtml. One sample was collected for this suite of CECs. In addition, 37 CECs were selected for monitoring as potential treatment performance indicators based on occurrence in the RO feed water as measured during the initial characterization study or CECs recommended by the IAP. Weekly samples were collected over a period of four weeks.
Whole Effluent Toxicity Testing. This program, conducted during the Q2 Testing Period, consisted of acute and chronic toxicity assays for a blend of purified water and Lake Murray (local reservoir primarily holding imported water) and a control sample. The chronic test organisms were Ceriodaphnia dubia (water flea), Pimephales promelas (fathead minnow) and Selenastrum capricornutum (green algae). The test organisms used for the acute testing were Ceriodaphnia dubia and Pimephales promelas.
Quality Assurance/Quality Control (QA/QC) Testing. A QA/QC Plan was developed for the project consisting of the collection and analysis of field duplicates, blind duplicates, travel blanks, field blanks, and split samples. In addition, third‐party validations were performed by Laboratory Data Consultants, Inc. using EPA Level IV guidelines to assess data quality and review laboratory and sample handling procedures by WECK and MWH Labs.
There was some overlap for parameters in the different categories. For example some of the constituents included in the routine monitoring category were also assessed as part of the quarterly monitoring category.

Section 2 Demonstration Facility Description and Observations
January 2013 2‐40
2.4.3 Water Quality Monitoring Results – Regulated Constituents Results from water quality monitoring conducted through the Q4 Testing Period showed that the Demonstration Facility produced purified water that reliably met drinking water and the 2008 and 2011 CDPH Groundwater Replenishment Reuse Draft Regulations, while providing multiple barriers to chemicals and pathogens. The purified water met all regulatory requirements and goals defined for the project.
Project Specific Goals
A summary of water quality monitoring results of regulated constituents is presented in Table 2‐19, and a comparison of key water quality results and project specific goals is presented in Table 2‐20. Table 2‐20 shows values for all parameters returning quantifiable laboratory results above the laboratory reporting level. Sample results less than the laboratory reporting level (LRL) or the method detection limit (MDL) were considered to be not quantifiable or not detectable, both shown as “ND” in the table. It should be noted that CDPH has established detection limits for purposes of regulatory reporting (DLRs) for all parameters listed in existing CDPH regulations. In some cases the DLR was higher than the laboratory reporting level, resulting in values shown in Table 2‐20 that would be considered non‐detectable under standard CDPH reporting. As analytical methods advance in the industry, it has allowed the measurement of compounds at increasingly low concentration. Standard, approved analytical methods were used for all constituents, when available.
For purposes of calculating average values and standard deviations, non‐quantifiable values below the laboratory reporting level were assumed to be 50 percent of that value, while values below the method detection limit were assumed to be 50 percent of that value. Calculated average values less than the laboratory reporting level are considered non‐quantifiable and shown as “ND” in Table 2‐20. Average concentrations for all constituents measured in the purified water were below the project specific goals for the Demonstration Facility.
Federal and State Drinking Water Maximum Contaminant Levels
All constituents currently regulated for drinking water supplies were monitored quarterly in the tertiary effluent prior to chlorination, purified water, and imported raw aqueduct water. Primary drinking water standards are established by the EPA and CDPH, and are based on MCLs, established to provide the maximum feasible protection to public health, based on EPA health guidelines for both acute (short term) and chronic (long term) health risks. In addition, secondary MCLs have been established for non‐health concerns, based on aesthetic issues, such as taste, odor, or color in the water. Secondary MCLs are considered guidelines rather than enforceable limits, as they are not related to public health at these concentrations. Currently, the EPA has established primary MCLs for 81 constituents, including 17 inorganic constituents, 51 organic compounds, 6 radionuclides, 4 disinfection byproducts, and three disinfectants. In addition, CDPH has establishing state specific MCLs for 11 additional constituents, including 2 inorganic constituents and 9 organic compounds, resulting in a total of 92 primary MCLs relevant to drinking water supplies in California. CDPH and EPA have established secondary MCL’s for 15 contaminants. Federal and CDPH primary and secondary MCL’s and results from quarterly monitoring are provided in Quarterly Testing Report No. 3 (Appendix B).
Results from the quarterly monitoring have shown that the purified water consistently met all primary MCLs established by both EPA and CDPH. In addition, the purified water met all numerical secondary drinking water MCLs. CDPH has also established a non‐numerical secondary MCL to have

Section 2 Demonstration Facility Description and Observations
January 2013 2‐41
non‐corrosive water. This standard can be met either by blending with other water supplies or by adding stabilizing chemicals to address the aggressive nature of highly purified water.
Table 2‐19 Water Quality Monitoring Results of Regulated Constituents
Regulation and Guideline Group Number of Constituents
/ Parameters
Total Number of
Tests1
Purified Water
Results
Federal and State
MCLs
Primary Drinking Water
MCL 2
90 1,781 √ Meets all
Secondary Drinking Water
MCL 3 18 1,290 √ Meets all
Microbial 4 4 1,547 √ Non‐Detect
CDPH
CDPH Notification Level 5 30 716 √ Below all
CDPH Groundwater
Replenishment 6 142 2,244 √ Meets all
Regional Board
Regional Board
Requirements for the
Reservoir 7
143 4,404 √ Meets all
Total Number of
Constituents /
Parameters8
2318 7,5238 ‐‐‐‐‐‐‐‐‐‐‐‐‐‐‐‐‐
Notes: 1 The total number of tests represents the approximate number of tests conducted at all sample locations shown in Figure 2‐1 and the Imported Raw Aqueduct Water. 2 Maximum Contaminant Levels and Regulatory Dates for Drinking Water U.S. EPA VS. California November 2008. 3 California Code of Regulation: Title 22, Division 4, Environmental Health Chapter 15. Domestic Water Quality and Monitoring Regulations Article 16. Secondary Water Standards. Purified water met all Federal and State Secondary MCLs with the exception of pH and corrosivity. The potential Full Scale Facility would include post treatment to meet these requirements. 4 EPA Total Coliform Rule (published 29 June 1989/effective 31 December 1990). Samples from the Demonstration Facility were analyzed for the following microbial contaminants: Total coliform, Fecal Coliform, and Viruses (Somatic and Male Specific Bacteriophage). 5 Drinking Water Notification Levels and Response Levels: An Overview. California Department of Public Health Drinking Water Program Last Update: December 14, 2010. 6 CDPH Groundwater Replenishment Reuse DRAFT Regulation 2011. Purified water meets all numerical water quality requirements for indirect potable reuse via groundwater replenishment. 7 EPA Numeric Criteria for Priority Pollutants Toxic Pollutants for the State of California Rule. San Diego Regional Water Quality Control Board San Diego Basin Plan Numeric objectives; note some objectives have not been defined. 8 Because some constituents and parameters are in multiple regulations / guidelines the total of unique parameters is less than the sum.
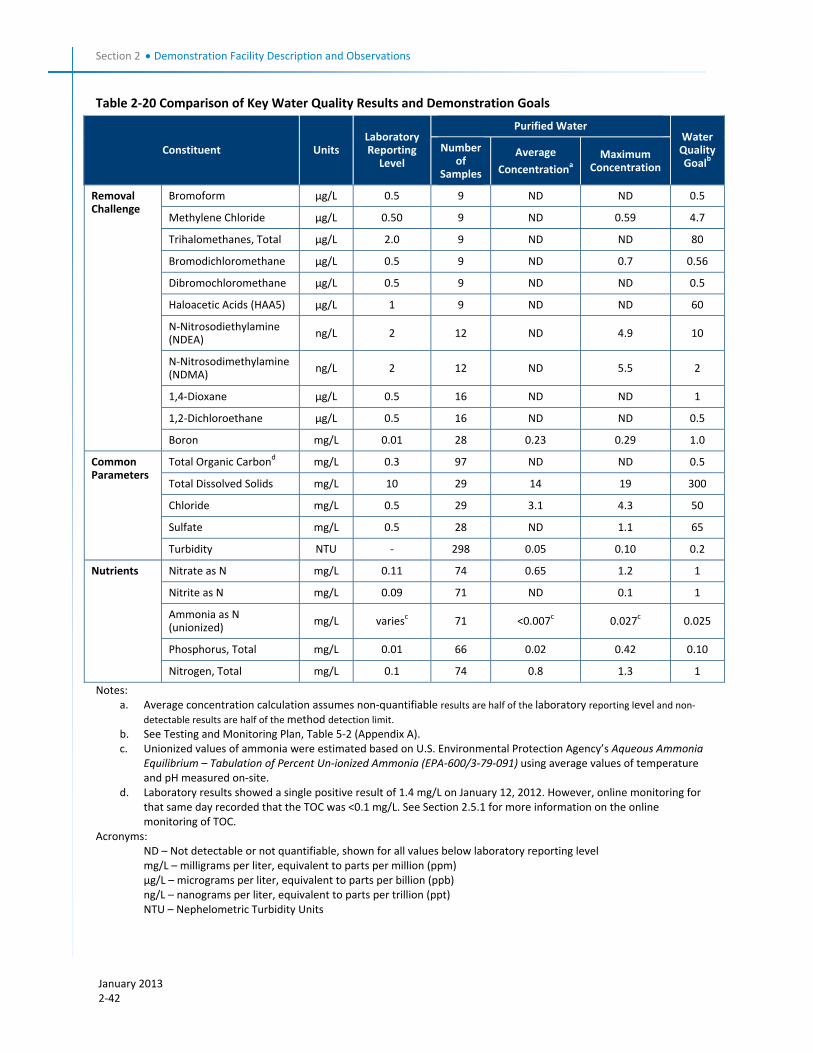
Section 2 Demonstration Facility Description and Observations
January 2013 2‐42
Table 2‐20 Comparison of Key Water Quality Results and Demonstration Goals
Constituent Units Laboratory Reporting Level
Purified Water Water Quality Goalb
Number of
Samples
Average
Concentrationa
Maximum Concentration
Removal Challenge
Bromoform µg/L 0.5 9 ND ND 0.5
Methylene Chloride µg/L 0.50 9 ND 0.59 4.7
Trihalomethanes, Total µg/L 2.0 9 ND ND 80
Bromodichloromethane µg/L 0.5 9 ND 0.7 0.56
Dibromochloromethane µg/L 0.5 9 ND ND 0.5
Haloacetic Acids (HAA5) µg/L 1 9 ND ND 60
N‐Nitrosodiethylamine (NDEA)
ng/L 2 12 ND 4.9 10
N‐Nitrosodimethylamine (NDMA)
ng/L 2 12 ND 5.5 2
1,4‐Dioxane µg/L 0.5 16 ND ND 1
1,2‐Dichloroethane µg/L 0.5 16 ND ND 0.5
Boron mg/L 0.01 28 0.23 0.29 1.0
Common Parameters
Total Organic Carbond mg/L 0.3 97 ND ND 0.5
Total Dissolved Solids mg/L 10 29 14 19 300
Chloride mg/L 0.5 29 3.1 4.3 50
Sulfate mg/L 0.5 28 ND 1.1 65
Turbidity NTU ‐ 298 0.05 0.10 0.2
Nutrients Nitrate as N mg/L 0.11 74 0.65 1.2 1
Nitrite as N mg/L 0.09 71 ND 0.1 1
Ammonia as N (unionized)
mg/L variesc 71 <0.007c 0.027c 0.025
Phosphorus, Total mg/L 0.01 66 0.02 0.42 0.10
Nitrogen, Total mg/L 0.1 74 0.8 1.3 1
Notes: a. Average concentration calculation assumes non‐quantifiable results are half of the laboratory reporting level and non‐
detectable results are half of the method detection limit. b. See Testing and Monitoring Plan, Table 5‐2 (Appendix A). c. Unionized values of ammonia were estimated based on U.S. Environmental Protection Agency’s Aqueous Ammonia
Equilibrium – Tabulation of Percent Un‐ionized Ammonia (EPA‐600/3‐79‐091) using average values of temperature and pH measured on‐site.
d. Laboratory results showed a single positive result of 1.4 mg/L on January 12, 2012. However, online monitoring for that same day recorded that the TOC was <0.1 mg/L. See Section 2.5.1 for more information on the online monitoring of TOC.
Acronyms: ND – Not detectable or not quantifiable, shown for all values below laboratory reporting level mg/L – milligrams per liter, equivalent to parts per million (ppm) µg/L – micrograms per liter, equivalent to parts per billion (ppb) ng/L – nanograms per liter, equivalent to parts per trillion (ppt) NTU – Nephelometric Turbidity Units

Section 2 Demonstration Facility Description and Observations
January 2013 2‐43
CDPH Notification Levels
Notification levels (NLs) are health‐based advisory levels established by CDPH for chemicals in drinking water that do not have MCLs. When chemicals are found at concentrations greater than their NL’s, certain reporting requirements apply. In addition, CDPH has established Response Levels at two to three times higher than each NL, where CDPH recommends removal of a drinking water source from service to protect public health. Currently, the CDPH has established NLs and Response Levels for 30 constituents. During the testing period, these constituents were monitored quarterly in the tertiary effluent prior to chlorination, purified water and imported raw aqueduct water. CDPH NL’s and results from quarterly monitoring are provided in Quarterly Testing Report No. 4 (Appendix B). Results from the quarterly monitoring have shown that the purified water is consistently below all NLs as established by CDPH.
Groundwater Replenishment Reuse Draft Regulations
The CDPH’s Division of Drinking Water and Environmental Management is responsible for establishing standards for wastewater reuse in accordance with the “Water Recycling Criteria” in Title 22 of the California Code of Regulations. In conjunction with the CDPH and the State Board, the Regional Boards have permitting and oversight authority for Groundwater Recharge Reuse Projects. Groundwater Replenishment Reuse Draft Regulations were developed and updated most recently in November 2011. These regulations are currently in the formal regulation adoption process. CDPH is working to adopt uniform water recycling criteria for groundwater recharge by December 31, 2013.
The Groundwater Replenishment Reuse Draft Regulation is provided at the following website: http://www.cdph.ca.gov/HealthInfo/environhealth/water/Pages/Waterrecycling.aspx
Additionally, CDPH is developing draft regulations for the use of recycled water for surface water augmentation, but has not yet released a draft for public review. For the time being, an assumption has been made that CDPH requirements will be similar to those for groundwater replenishment. These treatment requirements include:
Compliance with primary and secondary drinking water MCLs in the final recycled water.
Total nitrogen cannot exceed 5 mg/L.
TOC cannot exceed 0.5 mg/L divided by the CDPH‐specified maximum average Recycled Water Contribution.
The turbidity of the RO product water cannot exceed 0.2 NTU more than 5 percent of the time in any 24‐hour period and can never exceed 0.5 NTU.
The RO permeate UVT must be 90 percent or greater at 254 nanometers (nm).
The final recycled water must be disinfected such that the 7‐day median number of total coliforms cannot exceed 2.2 total coliform bacteria per 100 mL and the number of total coliform organisms cannot exceed 23 total coliform bacteria per 100 mL in more than one sample in any 30‐day period.
Advanced oxidation must achieve 0.5‐log reduction in 1,4‐dioxane, whether it is present or not in the source water. Additionally, the removal of indicator compounds or surrogates can be substituted for the reduction of 1,4‐dioxane.

Section 2 Demonstration Facility Description and Observations
January 2013 2‐44
Purified water from the Demonstration Facility has met the requirements listed above. Detailed data tables can be found in the Quarterly Testing Report No. 3 (Appendix B).
Regional Board Requirements for the Reservoir
In California the regulation, protection and administration of environmental water quality are carried out by the State Board and nine Regional Boards. The San Diego region is designated as Region (9) and is governed by the San Diego Regional Board. Each Regional Board adopts a Water Quality Control Plan or Basin Plan, which recognizes and reflects differences in existing water quality, the beneficial uses of the region’s ground and surface water and the local water quality conditions and problems. The Basin Plan is designed to preserve and enhance the water quality and protect the beneficial uses of all regional water bodies.
The Basin Plan includes designated beneficial uses of the San Vicente Reservoir, water quality objectives to protect those uses, the state anti‐degradation policy for surface water, and toxicity requirements (including applicable federal and state standards). The Basin Plan establishes beneficial uses for surface waters and groundwater in the region and numeric and narrative water quality objectives to protect those uses. Permit limits are established for those constituents that have the reasonable potential to cause or contribute to an excursion above any water quality objective. The Basin Plan allows for a mixing zone (e.g., dilution factor) to be considered for inland surface waters on a case‐by‐case basis. If a dilution factor is approved, the permit limit (and reasonable potential evaluation) could be based on modified water quality objectives. The designated beneficial uses of San Vicente Reservoir are:
Municipal and Domestic Supply
Agricultural Supply
Industrial Process Supply
Industrial Service Supply
Contact Water Recreation: fishing from shore or boat is permitted, but other water contact recreational (REC‐1) uses are prohibited. However, per Section 115840(a) of the Health and Safety Code, CDPH allows the reservoir to be used for body contact recreation, and thus other REC‐1 uses apply.
Non‐body Contact Water Recreation
Warm Freshwater Habitat
Cold Freshwater Habitat
Wildlife Habitat
The Basin Plan includes various numerical and narrative water quality standards for numerous constituents. Narrative and numeric nutrient requirements are also included. For waste discharge requirements established for recycled water discharges to surface water such as the San Vicente Reservoir, the Basin Plan allows the Regional Board to use the phosphorus goal for flowing waters (0.1 mg/L) as a guideline or to determine compliance with the narrative objective using four factors, including use of best available technology economically feasible for the removal of nutrients. It should

Section 2 Demonstration Facility Description and Observations
January 2013 2‐45
be noted that the nutrient requirements (including phosphorus and nitrogen) for the potential Full‐Scale Facility have not yet been established.
During the testing period, general parameters with Basin Plan numeric objectives were sampled on a weekly, bi‐weekly or monthly basis. Sampling locations varied by constituent as presented in the T&M Plan and included tertiary effluent prior to chlorination, RO feed, RO permeate and purified water. The results are presented in Quarterly Testing Report No. 3 (Appendix B).
Overall the results for all samples collected to date in the purified water met the Basin Plan objectives. Important observations and information related to these results follow:
Phenolic Compounds ‐ On four occasions in 2011, the total phenolic compounds were reported above the Basin Plan numeric objective of 1 µg/L. The first monthly sample of the purified water was analyzed using EPA Method 420.4 total phenolics (method detection level =10 µg/L) for which the result was at 22 µg/L. Because this method has a method detection level greater than the Basin Plan numeric objective it was suspected that the method was not sensitive enough to accurately quantify the low concentrations of phenolic compounds expected in the purified water. After the first monthly sample, all subsequent samples for phenolic compounds were analyzed with a more sensitive method EPA 8270 C‐SM. This method analyzes 14 individual phenolic compounds with method detection level between 1 to 2 µg/L.
On three additional occasions, one or more of the 14 compounds (phenol) was reported above the numeric objective for total phenolic compounds of 1 µg/L. These compounds were not found in the RO permeate upstream of the advanced oxidation, indicating that the positive results may have been caused by sample mix‐up or by inadvertent contamination of the sample. Phenol is a common compound used in plastics and in water bottles. While phenol free bottles were used for all sampling, outside contamination cannot be altogether ruled out as the cause of the two quantifiable results. Following these occurrences, the frequency of sampling for phenolic compounds was therefore increased (from monthly to bi‐weekly) to confirm the purified water met the required objective. The results showed both the RO permeate and purified water for 15 additional sample dates were always below quantifiable levels.
pH ‐ The pH measured in the purified water was within the expected range of 5.5 to 6.5. The potential Full‐Scale Facility would be designed with post‐treatment to adjust pH to a value which would meet the Basin Plan numerical objective. The objective for pH states the change in pH level cannot exceed 0.5 units and that pH shall not be depressed below 6.5 or raised above 8.5.
Nitrogen and Phosphorus – Although the Basin Plan nutrient requirements for the potential Full‐Scale Facility were not established at the time this report was prepared, nitrogen and phosphorous were tested in the purified water. The testing results showed that the water purification process achieved a high removal of these nutrients with total nitrogen being removed to an average concentration of 0.8 mg/L and total phosphorus being removed to an average concentration of 0.02 mg/L.
EPA California Toxics Rule (CTR)
The California Toxics Rule (CTR) is a federal regulation established to protect both aquatic life and human health by limiting surface water discharges based on 105 priority toxic pollutants. EPA

Section 2 Demonstration Facility Description and Observations
January 2013 2‐46
promulgated the rule after a State court overturned California’s water quality control plans in 1994, which had contained state specific water quality criteria for priority toxic pollutants. Implementation procedures for the CTR were established by the State Board through the SIP. The SIP includes: i) procedures to determine which priority pollutants need effluent limitations (e.g., reasonable potential analysis); ii) methods to calculate water quality‐based effluent limitations; and iii) policies regarding mixing zones, metals translators, monitoring, pollution prevention, reporting levels for determining compliance, and whole effluent toxicity control. Permit limits are established for those CTR constituents that have the reasonable potential to cause or contribute to an excursion above any applicable criteria including consideration of dilution (Section 1.3 of the SIP). If a dilution factor is approved, the permit limit would be based on this modification of the water quality criteria in addition to other factors as set forth in Section 1.4 of the SIP. The CTR criteria are presented in the T&M Plan (Appendix A).
The CTR requirements for the potential Full‐Scale Facility have not been defined yet by the Regional Board. The City will assess the water quality results and the final permit limits based on CTR criteria when they are established by the Regional Board.
Whole Effluent Toxicity Testing
Whole Effluent Toxicity refers to the aggregate toxic effect to aquatic organisms from all pollutants contained in a facility's wastewater (effluent). It is one way that the EPA implements the Clean Water Act's prohibition of the discharge of toxic pollutants in toxic amounts. Whole Effluent Toxicity tests measure wastewater's effects on specific test organisms' ability to survive, grow and reproduce.
The test methods are specified at 40 CFR 136.3, Table IA, and consist of exposing living aquatic organisms (plants, vertebrates and invertebrates) to various concentrations of a sample of wastewater, usually from a facility's effluent stream. These tests are used by the National Pollutant Discharge Elimination System (NPDES) permitting authority to determine whether a facility's permit will need Whole Effluent Toxicity requirements.
At this time it is unknown if the potential Full‐Scale Facility would be permitted under the NPDES however, in order to get some preliminary information on the toxicity of the purified water, WET testing was done one time during the reporting period utilizing both acute and chronic freshwater bioassays. All tests were performed by Nautilus Environmental Laboratories (San Diego, CA). Tests were conducted per EPA protocols: EPA/821/R‐02/013 (2002) Chronic Manual and EPA/821/R‐02/012 (2002) Acute Manual. The chronic test organisms included: Ceriodaphnia dubia (water flea), Pimephales promelas (fathead minnow) and Selenastrum capricornutum (green algae). The test organisms used for the acute testing included water flea and fathead minnow.
The sample water was comprised of a blend of purified water collected from the Demonstration Facility and imported raw aqueduct water collected from Lake Murray. The final blend was made up of 67 percent purified water and 33 percent imported raw aqueduct water to achieve the target total hardness of 50 mg/L. Prior to testing, the pH of the blended sample was raised to approximately 8.5 using sodium hydroxide. In addition, sodium thiosulfate was added to the sample to remove residual chlorine and hydrogen peroxide. Laboratory control water was EPA moderately hard mineral water (20 percent diluted). A reference control consisting of deionized water (67 percent) mixed with raw aqueduct water (33 percent) was also utilized.

Section 2 Demonstration Facility Description and Observations
January 2013 2‐47
Overall, the results showed there was no toxicity observed in the sample for any of the acute and chronic tests performed. The statistical results of the purified sample follow:
No Observed Effect Concentration values (percent effluent) for all species and endpoints tested were reported as 100 percent.
Lowest Observed Effect Concentration values (percent effluent) for all species and endpoints tested were reported as >100 percent.
Toxic Units were reported as 1.0 for all species and end points tested with the exception of the Water Flea 96‐hr Acute survival TU = 0.41 and the Fathead minnow 96‐ hr acute survival TU=0.
2.4.4 Water Quality for Other Non‐Regulated Constituents
Additional non‐regulated constituents were monitored at various locations in the purification process and the imported raw aqueduct water. These constituents are grouped into two main categories: those included in the 2012 EPA Unregulated Contaminant Monitoring Rule (UCMR3) and other CECs, such as pharmaceutical compounds and personal care products. In addition, lithium and six nitrosamine compounds beyond the two nitrosamine compounds mentioned previously in Section 2.4.3 (NDMA and N‐nitrosodiethylamine) were monitored in the purified water, based on the recommendation of the Demonstration Project Independent Advisory Panel. All together, 127 non‐regulated constituents were evaluated (111 when accounting for duplication with regulated constituents) beyond the constituents discussed previously in Section 2.4.3.
Unregulated Contaminant Monitoring Rule (UCMR)
The UCMR3 is the latest of the UCMR series, issued by the EPA. The third Unregulated Contaminant Monitoring Rule (UCMR3) was signed by the EPA Administrator on April 16, 2012. UCMR3 will require monitoring for 30 contaminants using EPA and/or consensus organization analytical methods during 2013‐2015. Once every five years, the EPA issues a new list of no more than 30 unregulated contaminants to be monitored by public water systems, in accordance with 1996 amendments to the Safe Drinking Water Act. The UCMR provides scientifically valid data on the occurrence of contaminants in drinking water. These data provide information that the agency uses to develop regulatory decisions. UCMR3 was published in the Federal Register on May 2, 2012 (77 FR 26072).
The UCMR3 is divided into three lists of constituents:
Assessment Monitoring (List 1) includes 21 constituents listed in six individual EPA methods (200.8, 218.7, 300.1, 522, 524.3, and 537). Any systems serving a retail population greater than 10,000 must monitor for List 1.
Screening Survey Monitoring (List 2) includes seven natural and synthetic hormones (EPA method 539). All very large systems (greater than 100,000 retail population) must also monitor for List 2. A randomly selected set of 320 large systems (greater than 10,000 retail population) must also monitor for List 2.
Pre‐Screen Testing (List 3) – 2 Constituents. A representative selection of 800 undisinfected groundwater public water systems serving 1,000 or fewer people will participate in monitoring for two constituents.
Section 2 Demonstration Facility Description and Observations
January 2013 2‐48
A complete summary of the methods, reporting limits and required sample locations is shown at: http://water.epa.gov/lawsregs/rulesregs/sdwa/ucmr/ucmr3/methods.cfm.
Sampling and testing of water at the Demonstration Facility included List 1 and List 2 of the UCMR3. Samples were collected quarterly on the feed water (tertiary effluent prior to chlorination) to the Demonstration Facility, the purified water, and the imported raw aqueduct water.
Constituents of Emerging Concern
The term constituents of emerging concern (CEC) refers to new classes of manufactured chemicals, such as pharmaceuticals, personal care products, pesticides, and other industrial chemicals. While many CECs are present in water supplies, the detection of many of these chemicals is so recent that robust methods for their quantification and toxicological data for interpreting potential human or ecosystem health effects are unavailable. The water purification process is designed to provide a multiple barrier approach for removal of CECs. In 2010, under the Recycled Water Policy, the State Board established a Science Advisory Panel to provide guidance for developing potential CEC threats to human and aquatic life.
As part of the robust water quality monitoring program implemented at the Demonstration Facility, CEC monitoring was conducted at multiple locations throughout the water purification process. The monitoring plan also included the collection of samples from imported raw aqueduct water. The target list of CECs consists of 90 compounds commonly found in treated wastewater effluent representing a wide range of chemical and physical properties. The list includes compounds identified by the Science Advisory Panel to have toxicological relevance. These compounds along with their common description includes: NDMA (rocket fuel, disinfection by‐product), 17 beta‐estradiol (estrogenic hormone), caffeine (stimulant) and triclosan (anti‐microbial). The list includes compounds identified by the Science Advisory Panel as indicators of treatment performance. The specific performance indicator compounds along with their common description include: DEET (mosquito repellant), gemfibrozil (lipid regulator), iopromide (X‐ray contrasting agent) and sucralose (artificial sweetener) along with certain surrogate parameters (e.g. ammonia, dissolved organic carbon, conductivity). The complete list of CECs monitored during the testing period along with their common use is presented in Appendix B.
The main objectives of the CEC monitoring plan as detailed in the T&M Plan (Appendix A) are as follows:
Characterize the tertiary effluent prior to chlorination
Identify appropriate performance indicator compounds to be monitored on an on‐going basis
Identify surrogate parameters, and assess and compare removal efficiency to indicator compounds
Assess the ability of the water purification process to remove CECs
Compare the water quality of the purified water to imported raw aqueduct water
The overall CEC monitoring plan consisted of three phases as described below:
Initial Characterization – Samples were collected monthly for four months from the following sample locations: tertiary effluent (prior to chlorination), RO feed, RO permeate, purified water

Section 2 Demonstration Facility Description and Observations
January 2013 2‐49
and imported raw aqueduct water. Samples were analyzed for the 91 compound list described above.
Ongoing Characterization Based on assessment of results from the initial characterization phase, five compounds were identified for on‐going characterization. Four of these compounds (NDMA, 17 beta‐estradiol, caffeine and triclosan) were identified by the Science Advisory Panel based on toxicological relevance. The fifth compound (1,4‐dioxane) is currently presented as an option for sizing and evaluating advanced oxidation performance for direct groundwater injection reuse applications as specified in the CDPH November 2011 Groundwater Replenishment Reuse Draft Regulation. Samples were collected on a quarterly basis from the following locations: tertiary effluent prior to chlorination, RO feed, RO permeate, purified water, and imported raw aqueduct water.
Identification of Potential Performance Indicator Compounds Based on assessment of results from the initial characterization phase, 37 compounds were identified as potential performance indicator compounds. These compounds were selected based on one or more of the following factors: 1) identified by the Science Advisory Panel as potential performance indicators for groundwater injection (via surface spreading or direct injection) reuse applications 2) consistency of occurrence in the RO feed during the initial characterization, 3) recommendations from the IAP. Samples were collected weekly for four weeks from the following locations: RO feed, RO permeate, and purified water. Results of the performance indicator compound testing are discussed in Section 2.5 Integrity and Reliability Monitoring.
Non‐Regulated Constituents Results
While 127 non‐regulated constituents were measured, only 111 were unique constituents after accounting for overlaps with regulated compounds and among non‐regulated lists. Of the non‐regulated constituents measured at the Demonstration Facility, only six were found to be quantifiably detected in the purified water. Table 2‐21 provides a summary of these six constituents, including average and maximum values measured in both the purified water and imported raw aqueduct water. These six constituents are discussed in more detail below. Since these constituents do not have regulatory limits, the results are discussed in terms of either the Health Reference Level identified by the EPA, or the Drinking Water Equivalent Level (DWEL), where no Health Reference Level has been provided by the EPA. Health Reference Levels and DWELs represent an acceptable concentration in drinking water, assuming an average person consumes two liters of water (about 8.5 cups) per day over 70 years. DWELs are developed from tolerable daily intakes (TDIs), acceptable daily intakes (ADI), or EPA identified Reference Doses (RfDs), which all describe a daily dose below which risks to public health are judged to be minimal, assuming repeated daily exposure over a lifetime through consumption of drinking water.

Section 2 Demonstration Facility Description and Observations
January 2013 2‐50
Table 2‐21 Summary of Other Non‐regulated Constituents in Purified Water and Imported Raw Aqueduct Water (Detected Constituents of 111 Monitored)
Constituent Classification/
Common Use Units
Laboratory Reporting Level
Purified Water Imported Raw Aqueduct Water
Number of Samples
Average Concentrationa
Maximum Concentration
Number of Samples
Average Concentrationa
Maximum Concentration
Bromochloromethane UCMR3
Disinfection byproduct µg/L 0.06 4 0.23 0.25 4 ND 0.08
Chromium (VI)b
UCMR3
Disinfection byproduct, industrial byproduct
µg/L 0.02 4 0.09 0.16 4 0.05 0.05
Strontium UCMR3
Naturally occurring metal, Dietary Supplement
µg/L 0.3 4 ND 0.37 4 405 610
Acesulfame‐K CEC
Sugar Substitute ng/L 20 9 ND
50 4 343 370
Iohexal CEC
X‐ray contrast agent ng/L 10 9 ND 19 4 43 55
Triclosan CEC
Antibacterial ng/L 10 9 ND 19 5 ND ND
Notes: a. Average concentration calculation assumes non‐quantifiable results are half of the laboratory reporting level and non‐detectable results are half of the method detection limit.
b. Three Chromium (VI) samples were sent to another lab and all results were below the detection limit of 0.0059 µg/L. The CDPH Detection Limit for purposes of Reporting (DLR) is 1 µg/L.
Acronyms: ND – Not detectable or not quantifiable, shown for all values below laboratory reporting level µg/L – micrograms per liter, equivalent to parts per billion (ppb) ng/L – nanograms per liter, equivalent to parts per trillion (ppt)

Section 2 Demonstration Facility Description and Observations
January 2013 2‐51
TDIs are derived from published information about pharmacology and toxicity for constituents. DWELs are not regulatory limits, but have been established by professional organizations for some constituents typically sampled for in water supplies to assist with the interpretation of water quality results for constituents without regulatory limits. More information on DWELs can be found in the following publications:
Monitoring Strategies for Chemicals of Emerging Concern in Recycled Water, Recommendations of a Science Advisory Panel (State Board, Final Report, June 25, 2010)
Development and Application of Tools to Assess and Understand the Relative Risks of Drugs and Other Chemicals in Indirect Potable Reuse Water (WateReuse Research Foundation, 2010)
Unregulated Contaminant Monitoring Rule
Results from the testing show 27 of the 30 compounds included in the UCMR3 were consistently below quantifiably detectable levels in the purified water. The three constituents, which were detected, included bromochloromethane, hexavalent chromium, and strontium. It should be noted that on May 2, 2012, the EPA issued the Final Rule Promulgation, which removed two constituents from the original List 1: n‐Propylbenzene and sec‐Butylbenzene. While these two constituents were removed from the final UCMR3 list, they had both been monitored as part of the 30 compounds previously referenced, and were never detected at any point in the treatment process. Additional information about the detected UCMR3 constituents, and their occurrence in the purified water, is presented below and in Quarterly Testing Report No. 4 (Appendix B).
Bromochloromethane
Bromochloromethane, also called Halon 1011, is used as a fire‐extinguishing fluid and to suppress explosions, as well as a solvent in the manufacturing of pesticides. It may also occur as a disinfection byproduct in drinking water, when chlorine used for disinfection reacts with organic material in the water.
Bromochloromethane was detected four times out of four samples in the purified water, with an average value of 0.22 µg/L and a maximum value of 0.25 µg/L.
The DWEL for bromochloromethane is 40 µg/L (40,000 ng/L) (State Board, June 2010), which is more than 170 times higher than the concentration measured in the purified water, suggesting that the concentrations measured in the purified water do not pose a health risk for human consumption.
Hexavalent Chromium (Chromium‐6)
Chromium is an odorless, tasteless metallic element found naturally in rocks, plants, soil and volcanic dust, and animals. Chromium is commonly found in two forms: trivalent chromium (chromium‐3) and hexavalent chromium (chromium‐6). The trivalent form is a required nutrient and has very low toxicity. The hexavalent form, also commonly known as chromium‐6, is more toxic and has been known to cause cancer when inhaled. In recent scientific studies in laboratory animals, chromium‐6 has also been linked to cancer when ingested. Chromium‐6 is currently regulated in California as part of the total chromium MCL of 50 µg/L, which was originally established assuming all of the chromium present is in the hexavalent form.
In 2008, EPA began a rigorous and comprehensive review of chromium‐6 health effects based on new scientific information. When this human health assessment is finalized, the EPA will carefully review the conclusions and consider all relevant information to determine if the current chromium standard
Section 2 Demonstration Facility Description and Observations
January 2013 2‐52
should be revised. The lowest reference dose for chromium‐6 currently identified by EPA as not having evidence of adverse health effects is 0.9 µg/kg/day (IRIS, Draft 75 FR 60454 EPA/635/R‐10/004C), which is equivalent to a DWEL of 11 µg/L. Chromium‐6 concentrations measured in the purified water were approximately 500 times lower than the current MCL and more than 100 times lower than the DWEL associated with the lowest reference dose identified by EPA.
Additional information on hexavalent chromium can be found at: http://www.cdph.ca.gov/certlic/drinkingwater/Pages/Chromium6.aspx . CDPH is in the process of developing an MCL specific to chromium‐6. Currently CDPH is collecting data associated with the risks and prevalence of chromium‐6 and has established a detection limit for purposes of reporting (DLR) of 1 µg/L. This detection limit is 33 to 50 times higher than the laboratory reporting level used by the primary laboratory where chromium‐6 samples were taken during the Demonstration Facility operation. As a result, data from the Demonstration Facility includes concentrations that are currently considered undetectable based on CDPH guidelines.
During the Demonstration Facility operation, chromium‐6 samples were sent for analysis to two separate labs. Information about the sampling of chromium‐6 is provided below and in Quarterly Testing Report No. 4 (Appendix B).
For Lab 1, the method used was EPA 218.6 (laboratory reporting level = 0.02 µg/L) / EPA 218.7 (laboratory reporting level = 0.03 µg/L). Chromium‐6 was found at quantifiable concentrations in the purified water four times out of four samples, with an average value of 0.09 µg/L and a maximum value of 0.16 µg/L. The laboratory reporting level, using EPA 218.7, is in accordance with current UCMR3’s reporting level.
Chromium‐6 was not detected in the tertiary effluent by Lab 1, suggesting that chromium‐3 may have been oxidized by the advanced oxidation process to form the low levels of chromium‐6 measured in the purified water. A contaminate created by a disinfection process is known as a disinfection byproduct.
Lab 2 analyzed chromium‐6 using method EPA 218.6 with all results in purified water reported below detectable levels. The Lab 2 laboratory reporting level was 0.3 µg/L, which is higher than Lab 1.
All results from both labs were below the CDPH detection limit (DLR) of 1 µg/L.
Strontium
Strontium is a naturally‐occurring metal that is used as a dietary supplement and in various industrial applications, such as pyrotechnics and automobile manufacturing. Strontium was detected in one of the four quarterly samples analyzed from the purified water, with a concentration measured as 0.37 µg/L and a blind duplicate sample reported as 0.41 µg/L.
While the EPA has not established an MCL for strontium, a health reference level of 4.2 mg/L (4,200 µg/L) was identified as part of the 2009 Contaminant Candidate List 3 (CCL3). This health reference level is more than 10,000 times higher than the single detectable value measured in the purified water, indicating that the concentrations measured in the purified water do not pose a health risk for human consumption.

Section 2 Demonstration Facility Description and Observations
January 2013 2‐53
In addition, USEPA regulates a radioactive isotope of strontium (strontium 90), with an MCL of 8 pCi/L. Sample results for strontium 90 were consistently below the minimum detectable levels in both the tertiary effluent and the purified water.
Constituents of Emerging Concern
Results from the initial characterization phase of CEC monitoring are presented in Appendix B (Section 3). CEC results measured at the various sample locations are presented in the units of nanograms per liter (ng/L), or parts per trillion. Analogies used to describe a 1 ng/L concentration would be the equivalent of 1 penny in 10 billion dollars or 1 drop in 20 Olympic size swimming pools. When assessing low level CEC results such as these, it is important to keep in mind that analytical variability and influence of false positive/negative results becomes a more significant issue at such minute levels. Technologies were not available to measure compounds at these low concentrations a decade ago, and there is still considerable debate about the significance of such low measured concentrations. Therefore, it is important to assess results as a whole data set including quality control sample results before making conclusions on the significance of a single result.
Thirty‐nine of the 90 CEC compounds were detected at quantifiable levels in the tertiary effluent prior to chlorination with values generally ranging from 5.5 to 9,500 ng/L. Higher levels were seen for the artificial sweeteners sucralose and acesulfame‐k, which were detected at concentrations averaging 40,000 and 30,000 ng/L, respectively.
Results showed the RO process was effective at removing the majority of the CECs present in the tertiary effluent, and advanced oxidation further reduced the remaining constituents. For constituents found in significant concentrations in the tertiary effluent, the purification process achieved greater than 98% removal. This is further discussed in 2.5.3. Only three CECs found at quantifiable concentrations in the purified water. These compounds include iohexal, acesulfame‐k, and triclosan. Additional information on all three compounds and the potential significance of the measured concentrations are discussed below.
AcesulfameK (AceK): Acesulfame Potassium (Ace‐K) is a widely used artificial sweetener. Ace‐K is used in a variety of consumables, including soft drinks, sports drinks, chewable and liquid medications, and other foods. During the testing period, Ace‐K was below quantifiable levels in the purified water in seven of nine samples analyzed, with an average concentration below quantifiable levels and maximum concentration of 50 ng/L (laboratory reporting level=20 ng/L). Ace‐K was below detectable levels in the RO permeate or RO permeate duplicate in samples collected on the same day that results in the purified water (after advanced oxidation) were reported above the laboratory reporting level, suggesting that even the low levels measured on these days may have resulted from sampling or analytical error.
The Food and Drug Administration has established an acceptable daily intake (ADI) for Ace‐K of 50 mg/kg. Based on this, the calculated DWEL for Ace‐K is 525 mg/L, which is a concentration 10 million times greater than the maximum value reported in the purified water. This suggests that the concentrations of Ace‐K measured in the purified water (and in the tertiary water before purification) do not pose a threat to public health.
Iohexal: This compound is a contrasting agent used in x‐ray procedures, such as coronary angiographs. Iohexal is typically injected into the body, allowing organic iodine compounds to block x‐rays as they pass through the body. This allows for delineation between body structures containing iodine and structures that do not contain iodine. This compound was below quantifiably detectable
Section 2 Demonstration Facility Description and Observations
January 2013 2‐54
levels in the purified water for eight of nine samples analyzed, with an average value of below quantifiable levels and a maximum value of 19 ng/L (laboratory reporting level=10 ng/L). RO permeate and RO permeate duplicate QC samples collected during the same sampling event as the single positive result were below quantifiable levels, suggesting that the single positive result may have been the result of analytical error.
The DWEL for this compound is 720,000 ng/L (State Board, June 2010), which is nearly 38,000 times higher than the maximum concentration reported in the purified water, suggesting that the concentrations measured do not pose a threat to public health.
Triclosan: 2,4,4’ –trichloro‐2’‐hydroxydiphenyl ether (triclosan) is used as a synthetic broad‐spectrum antibacterial agent. Triclosan is used in a variety of consumer products, such as antimicrobial hand soaps, toothpaste, and over‐the‐counter drugs. It also functions as a material preservative in adhesives, fabrics, vinyl, plastics (toys, toothbrushes), polyethylene, polyurethane, polypropylene, floor wax emulsions, textiles (footwear, clothing), caulking compounds, sealants, rubber, carpeting, and a wide variety of other products. In commercial, institutional, and industrial equipment, triclosan is used to prevent microbial growth in conveyor belts, fire hoses, dye bath vats, HVAC coils, and ice‐making equipment. This compound was found to be below quantifiable levels in seven out of nine samples, with an average value below quantifiable levels and a maximum value of 19 ng/L. Duplicate samples collected for a second lab from the RO permeate and purified water at the same time as one of the two positive results were found to be below detectable levels.
A number of factors suggest that the two results reported above the laboratory reporting level in the purified water may have resulted from sample contamination. The first factor is the widespread use of this compound in personal care products. Though careful measures (use of gloves, avoidance of products that contain triclosan, etc.) were taken during all sampling events to minimize the possibility of field contamination, such contamination cannot be ruled out. All sample bottles used were one time use EPA certified bottles; however, the laboratory conducting the analysis reported that because there are no commercially available preserved containers for the CECs, bottles are preserved by lab staff prior to shipping to clients for collection. This introduces the risk of contamination. Another important factor is that duplicate quality control samples taken from both the RO permeate and purified water (collected on the same day as one of the two samples reported above the laboratory reporting level) were analyzed by a second lab and reported non‐detectable values (less than 2.5 ng/L).
It should be noted that the CDPH Science Advisory Panel recommended a more practical reporting limit of 50 ng/L for triclosan, which would suggest that all of the samples measured in the purified water should be considered below quantifiably detectable levels.
The DWEL for triclosan ranges between 350 to 2,600,000 ng/L (State Board, June 2010), which is 18 to nearly 137,000 times higher than the maximum concentration reported in the purified water, suggesting that no public health concerns are associated with the low levels of triclosan which may or may not have been present in the purified water.
2.4.5 Data Validation Third‐party validation was performed on the water quality data from WECK Laboratory and MWH Labs for the first quarterly sampling event. The purpose of the validation was to assess data quality and to review laboratory and sample handling procedures in order to identify possible procedural alterations to be implemented for subsequent sampling events. The third party validation process

Section 2 Demonstration Facility Description and Observations
January 2013 2‐55
showed all the data validated to be acceptable. It was also confirmed that the majority of the data met the strict analytical standards of the EPA Contract Laboratory Program.
For two CEC compounds (oxolinic acid and n‐diethyl‐meta‐toluamide (DEET)), false positive results were initially reported by one of the laboratories, suggesting that quantifiable values of oxolinic acid and DEET had been detected in the purified water; however, subsequent testing and further comparison of test results with method blanks indicated that the original laboratory reporting level for these compounds had been set too low. The laboratory therefore revised the testing reports, confirming that quantifiable results for these two compounds had not been detected at any point in the purified water. Such anomalies are common when attempting to quantify organic compounds at such low detection levels using test methods that have not yet been fully standardized. Additional information on these two compounds is discussed below.
DEET: DEET is the most common active ingredient in insect repellents. DEET is used to repel biting flies, biting midges, black flies, chiggers, deer flies, fleas, gnats, horse flies, mosquitoes, no‐see‐ums, sand flies, small flying insects, stable flies, and ticks. Product types include liquids, pressurized liquids, ready‐to‐use formulations and impregnated material. Product concentrations range from 4 percent to 100 percent of DEET as an active ingredient.
DEET was originally reported to have been detected at a concentration of 8.7 ng/L in a single sample, based on a laboratory reporting level of 2 ng/L; however, the analytical laboratory conducting the analysis later revised the laboratory reporting level to 10 ng/L, based on continued variability in test blank results. The original test report was therefore revised, confirming that none of the nine samples contained quantifiable levels of DEET in the purified water. In addition, a duplicate sample of the purified water taken at the same time as the original positive value and analyzed by a second laboratory reported the result as not detectable, based on detection limit of 2.5 ng/L. Such variability in test results is common when attempting to quantify organic compounds at such low detection levels.
Oxolinic Acid: This compound is an antibiotic commonly used as veterinary medication for animals such as fish, calves, pigs, and poultry. It is delivered to the animal through an oral route. Oxolinic acid inhibits bacterial DNA‐gyrase replication, and is commonly used to treat urinary tract infections in humans outside the U.S., a use which has not yet been approved by the U.S. Food and Drug Administration.
Oxolinic acid was originally reported to have been detected at a concentration of 5.5 ng/L in a single sample, based on a laboratory reporting level of 5 ng/L; however, the analytical laboratory conducting the analysis revised the laboratory reporting level to 10 ng/L, based on variability in test blank results. The original test report was therefore revised, confirming that none of the four samples contained quantifiable levels of oxolinic acid in the purified water.
2.5 Integrity and Reliability Monitoring The integrity and reliability of the Demonstration Facility water purification processes were evaluated closely during the testing period. Integrity monitoring was conducted using several direct and indirect methods employed at various stages in the testing period. In addition, critical control point monitoring was implemented to identify any changes in the performance of the treatment processes that can adversely impact the final water quality. Overall integrity monitoring results showed the processes

Section 2 Demonstration Facility Description and Observations
January 2013 2‐56
met their intended treatment performance on a continuous basis. The specific methods used to evaluate each water purification process and results are summarized below.
2.5.1 Summary of Integrity Monitoring Results Membrane Filtration
The integrity monitoring of the membrane filtration systems included the performance of daily pressure decay tests along with online filtrate turbidity monitoring. Results showed both the membrane filtration systems were intact over the testing periods. The filtrate turbidity was consistently below 0.05 NTU, lower than the limit of 0.2 NTU (0.5 NTU maximum). The pressure decay values were consistently below 0.1 psi over 5 minutes, which is below the limit of 0.4 psi over 5 minutes and corresponds to greater than 4‐log (99.99 percent) calculated removal of Cryptosporidium and Giardia for each of the two membrane filtration systems. Over the testing period, estimates of the log removal value of Cryptosporidium and Giardia achieved by the membrane filtration systems were performed based on the measured values of pressure decay. These estimated log removal values were determined using the equation for air liquid conversion ratio as presented in the EPA Membrane Filtration Guidance Manual, 2005. This equation requires several inputs categorized as operating parameters, direct integrity test parameters, and unit and membrane characteristics. Values for these parameters were obtained from the membrane manufacturers and / or by field verification.
Reverse Osmosis
The integrity monitoring of the RO systems included the performance of vacuum/pressure decay testing of individual elements (pre‐installation), conductivity vessel probing (post‐element installation) along with online monitoring of conductivity and TOC during normal operation. Results of the vacuum/pressure decay testing indicated the RO elements to be intact with no breaches in glue lines or membrane material prior to installation. Vessel probing results were indicative of intact RO systems with no leaks at interconnectors or end caps. Both RO systems achieved consistent conductivity rejection throughout the testing period with average values of 98.7 percent (Hydranautics) and 98.5 percent (Toray). Eleven months of online TOC monitoring showed the combined RO permeate TOC was consistently below 100 µg/L, indicating TOC removal ranging from 98.8 – 99.8 percent.
It should be noted that TOC values measured online in the RO permeate throughout the testing period (ranging from 0.02 to 0.08 mg/L) were much lower than the laboratory reporting limit of 0.3 mg/L for samples sent offsite for laboratory analysis. Online TOC analyzers are known to be capable of detecting lower concentrations of organic content compared with desktop analyzers used by most laboratories, due to the decreased presence of organic interferences in the measurement system. During the collection of field samples for laboratory analysis, samples can be contaminated with organics from the several sources, including the sample vials themselves and carbon dioxide from the atmosphere. Because of the increased precision that the online analyzers have at low concentrations, they are considered a more appropriate method for measuring TOC in RO permeate, compared with the lower precision laboratory analysis.
UV Disinfection and Advanced Oxidation
The integrity monitoring of the UV disinfection and advanced oxidation system included continuous online power monitoring of the UV reactor and daily drawdown testing of the hydrogen peroxide dosing pump. On several occasions during the Q1 Testing Period, the UV disinfection and advanced oxidation system experienced a ballast failure which caused the control system to automatically increase the reactor power to 100 percent thereby maintaining treatment performance at all times.
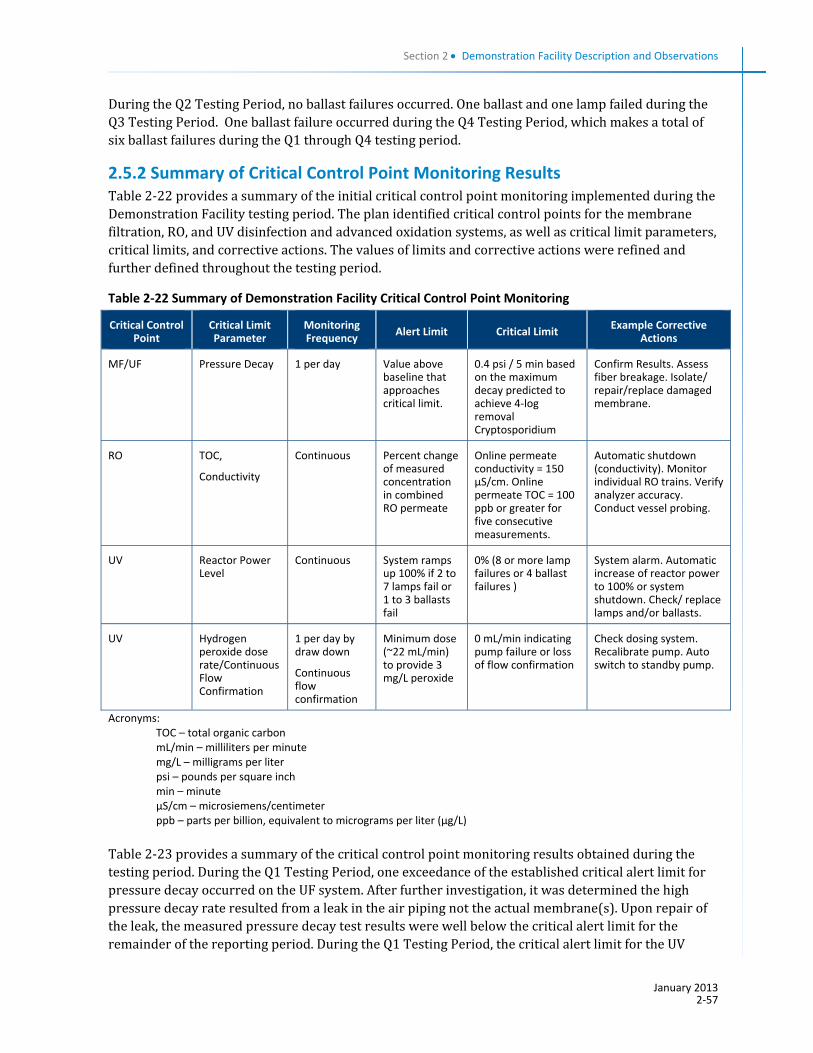
Section 2 Demonstration Facility Description and Observations
January 2013 2‐57
During the Q2 Testing Period, no ballast failures occurred. One ballast and one lamp failed during the Q3 Testing Period. One ballast failure occurred during the Q4 Testing Period, which makes a total of six ballast failures during the Q1 through Q4 testing period.
2.5.2 Summary of Critical Control Point Monitoring Results Table 2‐22 provides a summary of the initial critical control point monitoring implemented during the Demonstration Facility testing period. The plan identified critical control points for the membrane filtration, RO, and UV disinfection and advanced oxidation systems, as well as critical limit parameters, critical limits, and corrective actions. The values of limits and corrective actions were refined and further defined throughout the testing period.
Table 2‐22 Summary of Demonstration Facility Critical Control Point Monitoring
Critical Control Point
Critical Limit Parameter
Monitoring Frequency
Alert Limit Critical Limit Example Corrective
Actions
MF/UF Pressure Decay 1 per day Value above baseline that approaches critical limit.
0.4 psi / 5 min based on the maximum decay predicted to achieve 4‐log removal Cryptosporidium
Confirm Results. Assess fiber breakage. Isolate/ repair/replace damaged membrane.
RO TOC,
Conductivity
Continuous Percent change of measured concentration in combined RO permeate
Online permeate conductivity = 150 µS/cm. Online permeate TOC = 100 ppb or greater for five consecutive measurements.
Automatic shutdown (conductivity). Monitor individual RO trains. Verify analyzer accuracy. Conduct vessel probing.
UV Reactor Power Level
Continuous System ramps up 100% if 2 to 7 lamps fail or 1 to 3 ballasts fail
0% (8 or more lamp failures or 4 ballast failures )
System alarm. Automatic increase of reactor power to 100% or system shutdown. Check/ replace lamps and/or ballasts.
UV Hydrogen peroxide dose rate/Continuous Flow Confirmation
1 per day by draw down
Continuous flow confirmation
Minimum dose (~22 mL/min) to provide 3 mg/L peroxide
0 mL/min indicating pump failure or loss of flow confirmation
Check dosing system. Recalibrate pump. Auto switch to standby pump.
Acronyms: TOC – total organic carbon mL/min – milliliters per minute mg/L – milligrams per liter psi – pounds per square inch min – minute µS/cm – microsiemens/centimeter ppb – parts per billion, equivalent to micrograms per liter (µg/L)
Table 2‐23 provides a summary of the critical control point monitoring results obtained during the testing period. During the Q1 Testing Period, one exceedance of the established critical alert limit for pressure decay occurred on the UF system. After further investigation, it was determined the high pressure decay rate resulted from a leak in the air piping not the actual membrane(s). Upon repair of the leak, the measured pressure decay test results were well below the critical alert limit for the remainder of the reporting period. During the Q1 Testing Period, the critical alert limit for the UV

Section 2 Demonstration Facility Description and Observations
January 2013 2‐58
reactor power level was not met on four separate occasions, each due to ballast failures. In response, the reactor power automatically increased to 100 percent. Based on the reactor performance to date it has been determined that a reactor power level of approximately 70 percent is required to achieve the target log removal of NDMA. As a result, the occurrences of ballast failures are highly unlikely to have jeopardized the treatment performance and UV disinfection and advanced oxidation because the reactor was sized to meet the water quality goals when operating at 70 percent power. The programming of the UV reactor called for the reactor to adjust to 100 percent power when two lamps or a single ballast failed. No exceedances of critical alert limits were identified for any of the critical limit parameters during the Q2 Testing Period. However two critical alert limits were exceeded in the Q3 Testing Period.
During the Q3 Testing Period, two critical alert limit exceedances occurred. The first incident was due to the loss of flow confirmation on the hydrogen peroxide dosing pump of the UV disinfection and advanced oxidation system. Once this occurred, the system automatically switched to the stand‐by pump. However, the stand‐by pump also shut off due to low flow resulting from air lock, thereby causing the system to automatically shut down. The Demonstration Facility operations staff was present when the event occurred and quickly restarted the system with no issues for the remainder of the testing period. The second incident was due to a single ballast failure on the UV disinfection and advanced system. The system automatically increased power to 100 percent to accommodate power loss thereby maintaining treatment performance. An alarm notified the operations team of this occurrence, and shortly after the system was taken offline and the ballast was replaced.
During the Q4 Testing Period, six critical alert limit exceedances occurred. Five of these were due to the loss of flow confirmation on the hydrogen peroxide dosing pump of the UV/AOP system. Once this occurred, the system auto switched to the stand‐by pump. On two occasions the switch to duty pump was successful and the system operated without interruption. However, on the other three occasions, the stand‐by pump also shut off due to low flow resulting from air lock, thereby causing the UV/AOP system to automatically shut down. The operations staff were notified by alarms when the unit was shut down, shortly after the system was restarted after operating both pumps in manual to remove entrained air. The issue was resolved by making adjustments to the degassing interval and pulse length on the peroxide dosing skid and opening a valve on the pump skid to allow off gas to return to the peroxide storage tank.
The sixth critical alert limit exceedance occurred due to a single ballast failure on the UV/AOP system. The system automatically increased power to 100 percent to accommodate power loss thereby maintaining treatment performance. An alarm notified the operations team of this occurrence, shortly after the system was taken offline and the ballast was replaced.
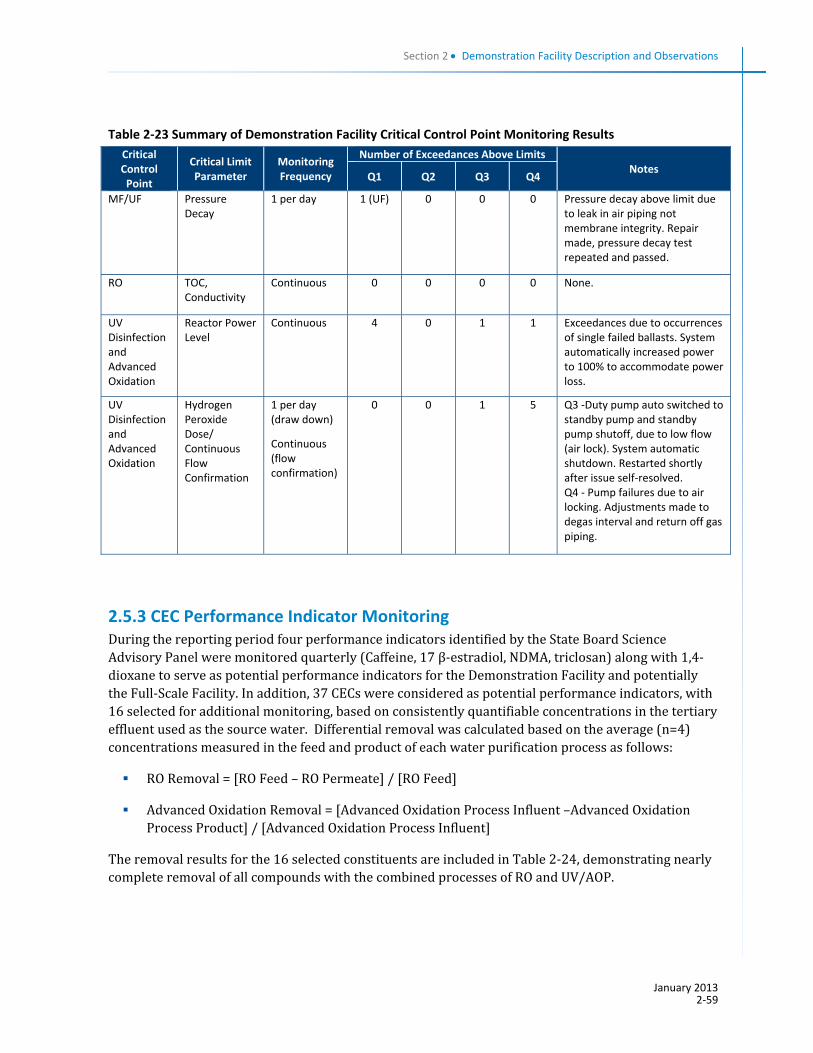
Section 2 Demonstration Facility Description and Observations
January 2013 2‐59
Table 2‐23 Summary of Demonstration Facility Critical Control Point Monitoring Results
Critical Control Point
Critical Limit Parameter
Monitoring Frequency
Number of Exceedances Above Limits Notes
Q1 Q2 Q3 Q4
MF/UF Pressure Decay
1 per day 1 (UF) 0 0 0 Pressure decay above limit due to leak in air piping not membrane integrity. Repair made, pressure decay test repeated and passed.
RO TOC, Conductivity
Continuous 0 0 0 0 None.
UV Disinfection and Advanced Oxidation
Reactor Power Level
Continuous 4 0 1 1 Exceedances due to occurrences of single failed ballasts. System automatically increased power to 100% to accommodate power loss.
UV Disinfection and Advanced Oxidation
Hydrogen Peroxide Dose/ Continuous Flow Confirmation
1 per day (draw down)
Continuous (flow confirmation)
0 0 1 5 Q3 ‐Duty pump auto switched to standby pump and standby pump shutoff, due to low flow (air lock). System automatic shutdown. Restarted shortly after issue self‐resolved. Q4 ‐ Pump failures due to air locking. Adjustments made to degas interval and return off gas piping.
2.5.3 CEC Performance Indicator Monitoring During the reporting period four performance indicators identified by the State Board Science Advisory Panel were monitored quarterly (Caffeine, 17 β‐estradiol, NDMA, triclosan) along with 1,4‐dioxane to serve as potential performance indicators for the Demonstration Facility and potentially the Full‐Scale Facility. In addition, 37 CECs were considered as potential performance indicators, with 16 selected for additional monitoring, based on consistently quantifiable concentrations in the tertiary effluent used as the source water. Differential removal was calculated based on the average (n=4) concentrations measured in the feed and product of each water purification process as follows:
RO Removal = [RO Feed – RO Permeate] / [RO Feed]
Advanced Oxidation Removal = [Advanced Oxidation Process Influent –Advanced Oxidation Process Product] / [Advanced Oxidation Process Influent]
The removal results for the 16 selected constituents are included in Table 2‐24, demonstrating nearly complete removal of all compounds with the combined processes of RO and UV/AOP.

Section 2 Demonstration Facility Description and Observations
January 2013 2‐60
Table 2‐24 CEC Potential Indicator Characterization Results
Compound Units MDL LRL Average RO Feed (n = 5)
Average RO Perm. (n = 5)
Average UV/AOP (n = 5)
RO Removal
UV/AOP Removal
Acesulfame‐K ng/L 20 20 33,000 <27 <22 >99.9% >16.5%
Amoxicillin ng/L 6.4 20 220 <6.4 <6.4 >97% ‐
Carbamazepine ng/L 1.2 5 190 <5 <1.2 >99% ‐
Dilantin ng/L 13 20 120 <13 <13 >88.8% ‐
Diuron ng/L 1.8 5 77 <1.8 <5 >97.7% ‐
Fluoxetine ng/L 10 10 84 <10 <10 >88% ‐
Lidocaine ng/L 1.1 5 170 <1.1 <1.1 >99.3% ‐
Lopressor ng/L 5.1 20 340 <20 <5.1 >97.6% ‐
NDMA ng/L 0.96 2 3 <2 <0.96 >65.5% ‐
Primidone ng/L 4.8 5 100 <4.8 <4.8 >95.4% ‐
Sucralose ng/L 42 100 55,000 <100 <42 >99.9% ‐
Sulfamethoxazole ng/L 2.8 5 950 <2.8 <2.8 >99.7% ‐
TCEP ng/L 3.2 10 300 <10 <10 >98.3% ‐
TCPP ng/L 20 100 2,000 <100 <100 >97.6% ‐
Triclosan ng/L 6.3 10 48 <10 <10 >84.1% ‐
Trimethoprim ng/L 1.8 5 330 <5 <5 >99.1% ‐
Notes: a. For calculating average concentrations, results reported below the LRL were considered the value of the LRL and
for values reported below the MDL, the value of the MDL was used. b. Dashes shown for the UV/AOP Removal indicate the average concentrations in the RO permeate and UV/AOP were
both below the LRL or MDL and removal could not be quantified. Acronyms:
ng/L – nanograms per liter, equivalent to parts per trillion (ppt)
LRL – laboratory reporting level MDL – method detection limit
Because many of these constituents were removed by the RO to levels at or below quantifiable limits, removal within the UV could not be accurately measured, creating challenges with identifying usable performance indicators. Of the four constituents recommended by the Science Advisory Panel, only triclosan was found at any time in the RO product, but even here it was at concentrations too low to use as a reliable performance monitor for advanced oxidation. Similarly, 1,4‐dioxane was removed to levels below quantifiable limits by the RO process, making it too low to monitor performance of the advanced oxidation using this compound.
For the 16 constituents monitored as performance indicators (Table 2‐24), removal generally exceeded 95 percent within the RO when sufficient quantities were present in the source water to calculate such removals. In some cases, greater than 99.9 percent removal was observed (sucralose and Ace‐K). For the advanced oxidation process, however, no reliable performance indicator was found, due to the low levels present in the RO product. The most promising constituents measured were tris (2‐chloroethyl) phosphate, tris (1‐chlor‐2‐propyl) phosphate (two flame retardant compounds), and Ace‐K, which sometimes had low levels measurable in the RO product (ranging from

Section 2 Demonstration Facility Description and Observations
January 2013 2‐61
non‐quantifiable to 160 ng/L). These low concentrations in the RO product allowed a measured reduction by the advanced oxidation of up to 40 percent, however, higher removals may have been observed had higher concentrations been present.
During the initial two weeks of the performance CEC sampling period, surrogate compounds (TOC, conductivity, monochloramine, and UV254) were monitored daily. Results from this monitoring are shown in Table 2‐25. For the RO process, the average removal results were: TOC = 99.6 percent; conductivity = 99.0 percent; and UV254 = 88.8 percent. For the advanced oxidation process, the average removal results were: UV254 = 68.7 percent; and monochloramine = 72.8 percent. Figure 2‐11 presents the observed reduction in monochloramine across the UV disinfection and advanced oxidation process during operation of the Demonstration Facility.
Table 2‐25 Removal of Online Monitoring Surrogates by Unit Processes
Compound Units
Avg RO Feed
(n = 14)
Avg RO Perm. (n = 14)
Avg
UV/AOP (n = 14)
RO Removal
UV/AOP Removal
TOC mg/L 7.2 0.031 ‐‐a 99.6% ‐‐
Conductivity µS/cm 1,348 14 ‐‐ 99.0% ‐‐
UV254 cm‐1 0.158 0.018 0.006 88.8% 68.7%
Monochloramine mg/L ‐‐ 3.14 0.85 ‐‐ 72.8%
Notes: a. Dashes shown for values that were not measured.
Acronyms:
mg/L – milligrams per liter, equivalent to parts per million (ppm)
µS/cm – microSiemens per centimeter
cm‐1 – centimeters to the negative first power
Results from field testing demonstrated that the removal of UV254 and monochloramine within the UV Disinfection and advanced oxidation process was due primarily to UV photolysis rather than advanced oxidation, however, the reliable presence of these constituents in the water downstream of both RO and advanced oxidation, and their ease of sampling and consistent removal suggests that they could serve as reliable surrogates for Full‐Scale Facility performance monitoring.

Section 2 Demonstration Facility Description and Observations
January 2013 2‐62
Figure 2‐12 Monochloramine Removal by UV and Advanced Oxidation
Although not part of the initial surrogate monitoring, ammonia was also evaluated as a potential surrogate compound for advanced oxidation performance, due to its consistent removal within the AOP and an associated increase seen in the nitrate residual. Since ammonia is not expected to be oxidized to nitrate without the presence of an oxidizing agent, it was considered that ammonia could potentially serve as a surrogate parameter for the overall advanced oxidation process rather than just the UV component. Figure 2‐12 presents the percent reduction of ammonia by the UV/AOP, based on biweekly grab samples sent off‐site for laboratory analysis. The results show an ammonia reduction between 30 to 70 percent; however, results varied considerably from day to day, and may have been influenced by variability in the sampling procedure associated with offsite analysis. It is not known if the use of an online ammonia analyzer could provide a more consistent measure of AOP performance, providing a more reliable tool for surrogate monitoring. Further research should consider the use of ammonia as a potential surrogate, as it was consistently present both upstream and downstream of advanced oxidation.
0%
20%
40%
60%
80%
100%
120%
07/26/11 09/14/11 11/03/11 12/23/11 02/11/12 04/01/12 05/21/12 07/10/12
Percent Removal
Sample Date

Section 2 Demonstration Facility Description and Observations
January 2013 2‐63
Figure 2‐13 Ammonia Removal by Advanced Oxidation
2.6 Independent Advisory Panel The Independent Advisory Panel (IAP) was convened in May 2009 to provide expert peer review of technical, scientific, regulatory, and policy aspects for the Demonstration Project. At their first meeting in May 2009, the IAP provided input on the Demonstration Facility project components, including the treatment train. During the course of the Demonstration Project the IAP reviewed work products and provided feedback on various aspects of the project including the Demonstration Facility and potential Full‐Scale Facility. The IAP activities associated with the AWP Facility Study are summarized below.
Review of Demonstration Facility T&M Plan (October 2010)
Review of Demonstration Facility preliminary testing results (December 2011)
Review of the AWP Facility Study Report (November 2012)
2.6.1 Testing & Monitoring Plan The Final T&M Plan (Appendix A) established the testing program and water quality goals for the Demonstration Facility. The T&M Plan was reviewed and commented on by the IAP in October 2010. As a result of the comments received, the T&M Plan was expanded to include sampling for additional water quality parameters and increased frequency and number of samples for constituents that were identified in the draft plan. These comments and a description of how the comments were addressed are included as an appendix to the T&M Plan.
2.6.2 Preliminary Testing Results The first quarter testing and monitoring results were presented to the IAP in December 2011. As a result of the comments received, the third and fourth quarter sampling was focused on improving the correlation of indicator compounds for performance and integrity monitoring.
0%
10%
20%
30%
40%
50%
60%
70%
7/26/11 9/14/11 11/3/11 12/23/11 2/11/12 4/1/12 5/21/12 7/10/12
Percent Rem
oval
Sample Date

Section 2 Demonstration Facility Description and Observations
January 2013 2‐64
2.6.3 AWP Facility Study Report The AWP Facility Study Report was reviewed and commented on by the IAP in November 2012. Based on the results presented in this report, the IAP concluded that the purified water produced at the Demonstration Facility “met or exceeded all of the drinking water requirements and also provided multiple barriers for regulated and unregulated chemical and microbial constituents. The water produced is of a higher quality than any source available to the City of San Diego.”
Additional information on the IAP and its advisory activities can be found in the Demonstration Project Report.
2.7 Conclusions The primary purpose of the City’s Demonstration Facility was to demonstrate the feasibility of water purification technologies to produce purified water for the City to determine the feasibility of a full‐scale IPR/RA project. A full‐scale project would assist with the City’s effort to provide a local and sustainable water supply. To achieve this primary purpose, operation of the Demonstration Facility supported the project goals by the following means:
Water quality monitoring throughout the testing period demonstrated that membrane filtration, followed by RO, and UV disinfection and advanced oxidation can reliably produce purified water that consistently meets all drinking water quality standards.
Energy consumption was monitored at the Demonstration Facility, providing background data for energy requirements of a potential full‐scale facility, including the evaluation of opportunities for energy saving measures.
Operational data and observations collected from the Demonstration Facility testing period can be used to estimate construction costs and annual operation and maintenance costs for a Full‐Scale Facility.
Further research should also consider the use of ammonia as a potential surrogate for advanced oxidation performance, as it is not impacted by photolysis and was found to be consistently present upstream and downstream of advanced oxidation.