2021 retirement confidence survey: a closer look at black
TRANSCRIPT
A research report from the EBRI Education and Research Fund © 2021 Employee Benefit Research Institute
June 10, 2021 • No. 530
2021 Retirement Confidence Survey: A Closer Look at Black and Hispanic Americans
By Craig Copeland, Ph.D., Employee Benefit Research Institute, and Lisa Greenwald,
Greenwald Research
A T A G L A N C E
The Retirement Confidence Survey (RCS) was conducted for its 31st year in 2021 to measure attitudes of American
workers and retirees about issues surrounding retirement. The 2021 RCS included an oversample of Black and Hispanic
Americans to allow for a closer analysis of the challenges that they face in saving and preparing for retirement. New
questions were added this year to explore the impact of the COVID-19 pandemic, evaluate priorities in regard to
preparing for retirement, and understand experiences with the financial system that may affect Black and Hispanic
Americans’ retirement preparations.
The demographic profiles and composition of Black and Hispanic populations in the United States are unique, both
compared with each other and compared with those of White Americans. Both Black and Hispanic Americans are more
likely to have lower incomes and assets. This is a critically important consideration as financial resources (income and
assets) have historically had a clear correlation to retirement confidence and responses to many other RCS metrics. In
addition, the Black population tends to be more female, while the Hispanic population skews younger. Consequently,
this Issue Brief closely examines the responses of Black and Hispanic Americans, taking into account some of these key
demographic differences. Key findings are:
• Confidence in having enough money to live comfortably in retirement increases with income
regardless of race or ethnicity. For example, in the upper-income group, 86 percent of White Americans,
84 percent of Black Americans, and 85 percent of Hispanic Americans reported that they were confident about
their retirement prospects.
• The wealth gap between White Americans and Black or Hispanic Americans remains even as
income rises. Lower- and middle-income Black Americans were more likely to report savings of less than
$1,000 compared with White Americans. Likewise, the share with the highest amount of assets ($250,000 or
more) was much higher for White Americans than for Black or Hispanic Americans for both middle and upper
incomes.
• Black and Hispanic Americans were more likely to consider debt to be a major or minor problem
for their household than White Americans, across each income group. In the upper-income group, 62
percent of Black Americans and 58 percent of Hispanic Americans considered debt a problem compared with
37 percent of White Americans. As a result, Black and Hispanic Americans were more likely to say debt is
impacting their ability to save for retirement or emergencies and to live comfortably in retirement.
• Hispanic Americans, regardless of income, were more likely to agree that it is more important to
help friends and family now than to save for their own retirement. In the upper-income group, nearly
one-half of Hispanic Americans agreed with this statement compared with only one-third of White Americans.
Upper-income Black Americans were also more likely to agree that family is more important. Black and

ebri.org Issue Brief • June 10, 2021 • No. 530 2
Hispanic Americans were also more likely to agree that saving for or paying off a child’s education was
reducing their ability to save for retirement.
• Hispanic and Black Americans are more likely to say that a connection or commonality between
them and the advisor is important. This includes a preference for working with an advisor who has had a
similar upbringing or similar life experiences to them, working with an advisor who is affiliated with their
employer, working with an advisor who has a similar racial/ethnic background to them, and working with an
advisor who is the same gender as them. Black and Hispanic workers were also more likely to say that one-on-
one, personalized education would be a valuable potential improvement to workplace retirement savings plans.
• Forty-six percent of all retirees reported they retired earlier than expected — but the top reason
why differs by race. While White retirees said they could afford to retire earlier than planned most often,
Black retirees said they had a health problem or disability most often.
Black and Hispanic Americans reported disproportionately lower financial resources, and how they feel about retirement
and financial security is clearly impacted by having less resources. Still, there are some modifications in the financial
system that could help improve their prospects, including access to workplace retirement savings plans that provide
one-on-one, personalized advice that builds on their comfort with having a connection to those providing them advice.
Many Americans, but perhaps especially Black and Hispanic Americans, would benefit from increased assistance in
balancing competing financial priorities, such as debt reduction, supporting family, and their own long-term savings. In
addition, financial service companies having more people who are similar to Black and Hispanic Americans and treating
them fairly could improve their use of the system. A greater understanding of the importance of supporting family and
friends that in particular Hispanic Americans feel when making financial decisions is needed, so that this obligation can
be weighed against their own savings to build wealth that could result in a lesser need for supporting family members
in the future. Obviously, higher incomes would help, but these issues even arise for those already with higher incomes.
EBRI and Greenwald would like to thank the 2021 RCS sponsors who helped shape this year’s survey: AARP,
Aon, Ariel Investments, Ayco, Bank of America, BlackRock, Capital Group, Columbia Threadneedle, Empower
Retirement, Fidelity Investments, FINRA Foundation, J.P. Morgan, Legal & General Investment Management
America (LGIMA), Mercer, Mutual of America, Nationwide Financial, New York Life, PIMCO, Principal Financial
Group, Prudential, PGIM, Retirement Clearinghouse, T. Rowe Price, U.S. Chamber of Commerce, and Wells
Fargo.
ebri.org Issue Brief • June 10, 2021 • No. 530 3
Craig Copeland is a Senior Research Associate at the Employee Benefit Research Institute (EBRI). Lisa Greenwald is the
CEO of Greenwald Research. This Issue Brief was written with assistance from the Institute’s research and editorial
staffs. Any views expressed in this report are those of the author and should not be ascribed to the officers, trustees, or
other sponsors of EBRI, Employee Benefit Research Institute-Education and Research Fund (EBRI-ERF), or their staffs.
Neither EBRI nor EBRI-ERF lobbies or takes positions on specific policy proposals. EBRI invites comment on this
research.
Suggested citation: Copeland, Craig, and Lisa Greenwald, “2021 Retirement Confidence Survey: A Closer Look at
Black and Hispanic Americans,” EBRI Issue Brief, no. 530 (Employee Benefit Research Institute, June 10, 2021).
Copyright Information: This report is copyrighted by the Employee Benefit Research Institute (EBRI). You may copy,
print, or download this report solely for personal and noncommercial use, provided that all hard copies retain any and
all copyright and other applicable notices contained therein, and you may cite or quote small portions of the report
provided that you do so verbatim and with proper citation. Any use beyond the scope of the foregoing requires EBRI’s
prior express permission. For permissions, please contact EBRI at [email protected].
Report availability: This report is available on the internet at www.ebri.org
Table of Contents
Introduction .......................................................................................................................................................... 8
Demographics ....................................................................................................................................................... 8
Assets and Debt ................................................................................................................................................... 10
COVID-19 Pandemic Impact .................................................................................................................................. 14
Retirement Confidence .......................................................................................................................................... 18
Financial Background ............................................................................................................................................ 24
Financial Priorities................................................................................................................................................. 29
Experience With Financial Services Companies ........................................................................................................ 33
Financial Advice and Advisors ................................................................................................................................ 34
Savings and Preparations ...................................................................................................................................... 38
Retirement Age .................................................................................................................................................... 43
Workplace Retirement Savings Plans ...................................................................................................................... 47
Plan Changes & Loans .......................................................................................................................................... 52
Sources of Income in Retirement ........................................................................................................................... 56
Retiree Expectations and Experiences .................................................................................................................... 59
Conclusion ........................................................................................................................................................... 62
Appendix 1: Methodology ...................................................................................................................................... 63
Appendix 2: Figure Statistical Significance Key ........................................................................................................ 63
Endnotes ............................................................................................................................................................. 74
Figures
Figure 1, Demographic Breakdowns, by Race/Ethnicity ............................................................................................. 9
Figure 2, Demographic Breakdowns, by Race/Ethnicity ............................................................................................. 9
Figure 3, Amount Held in Savings and Investments, by Race/Ethnicity and Income .................................................. 10

ebri.org Issue Brief • June 10, 2021 • No. 530 4
Figure 4, Debt Level a Problem, by Race/Ethnicity and Income ............................................................................... 11
Figure 5, Debt Level a Problem of Hispanic and Black Americans, by Gender, Marital Status, and U.S. Born ............... 11
Figure 6, Debt’s Impact on Ability to Save for Retirement/Live Comfortably in Retirement, by Race/Ethnicity
and Income .......................................................................................................................................... 12
Figure 7, Non-Mortgage Debt’s Impact on Ability to Save for Emergencies, by Race/Ethnicity and Income ................. 12
Figure 8, Non-Mortgage Debt’s Impact on Ability to Save for Retirement in General, by Race/Ethnicity and Income .... 13
Figure 9, Non-Mortgage Debt’s Impact on Ability to Participate in or Contribute to an Employer’s Retirement Plan, by
Race/Ethnicity and Income ..................................................................................................................... 13
Figure 10, Percentage of Workers and Retirees Who Report a Negative Job or Income Change Since February 1, 2020,
by Race/Ethnicity and Income ................................................................................................................ 14
Figure 11, Percentage of Hispanic and Black Americans Who Report a Negative Job or Income Change Since February
1, 2020, by Age, Gender, and Marital Status ............................................................................................ 15
Figure 12, Percentage of Hispanic and Black Workers Who Report a Negative Job or Income Change Since February 1,
2020, by Age and Gender....................................................................................................................... 15
Figure 13, COVID-19 Pandemic Impact on Ability to Work Due to Child Care Needs, by Race/Ethnicity ...................... 16
Figure 14, COVID-19 Pandemic Impact on Ability of Black and Hispanic Workers to Work Due to Child Care Needs, by
Gender and Marital Status ...................................................................................................................... 16
Figure 15, COVID-19 Pandemic Impact on Ability to Work Due to Caregiving for Someone Other Than a Child, by
Race/Ethnicity ....................................................................................................................................... 17
Figure 16, Impact of COVID-19 Pandemic on the Ability to Save for Retirement, by Race/Ethnicity and Income .......... 17
Figure 17, Confidence in Having Enough Money to Live Comfortably Through Retirement, by Race/Ethnicity and
Income ................................................................................................................................................. 18
Figure 18, Confidence in Having Enough Money to Live Comfortably Through Retirement, by Race/Ethnicity, Income,
and Gender ........................................................................................................................................... 19
Figure 19, Confidence in Having Enough Money to Live Comfortably Through Retirement, by Race/Ethnicity, Income,
and Marital Status ................................................................................................................................. 19
Figure 20, Confidence of Hispanic Americans in Having Enough Money to Live Comfortably Through Retirement, by
Income and U.S. Born ............................................................................................................................ 20
Figure 21, Change in Confidence in Having Enough Money to Live Comfortably Throughout Retirement Due to the
Pandemic, by Race/Ethnicity and Income ................................................................................................ 20
Figure 22, Change in Confidence in Having Enough Money to Live Comfortably Throughout Retirement Due to the
Pandemic of Black and Hispanic Americans, by Gender, Marital Status, and U.S. Born ................................ 21
Figure 23, Confidence in Having Enough Money to Take Care of Basic Expenses During Retirement, by Race/Ethnicity
and Income .......................................................................................................................................... 22
Figure 24, Confidence in Doing a Good Job Preparing Financially for Retirement, by Race/Ethnicity and Income ......... 22
Figure 25, Percentage of Workers Who Agree That Preparing for Retirement Makes Them Stressed, by Race/Ethnicity
and Income .......................................................................................................................................... 23
Figure 26, Confidence in Social Security Continuing to Provide Benefits of at Least Equal to Those Received Now, by
Race/Ethnicity and Income ..................................................................................................................... 23

ebri.org Issue Brief • June 10, 2021 • No. 530 5
Figure 27, Confidence in Medicare Continuing to Provide Benefits of at Least Equal to Those Received Now, by
Race/Ethnicity and Income ..................................................................................................................... 24
Figure 28, Percentage Who Agree That Their Parents Were Good at Managing Money, by Race/Ethnicity and
Income ................................................................................................................................................. 24
Figure 29, Percentage Who Agree That Their Parents Had or Are Having a Financially Comfortable Retirement, by
Race/Ethnicity and Income ..................................................................................................................... 25
Figure 30, Percentage Who Agree That They Were Taught How to Save and Invest for the Future as a Child, by
Race/Ethnicity and Income ..................................................................................................................... 26
Figure 31, Percentage of Black and Hispanic Americans Who Agree That They Were Taught How to Save and Invest for
the Future as a Child, by Age ................................................................................................................. 26
Figure 32, Percentage Who Agree They Are Knowledgeable About Managing Their Day-to-Day Finances, by
Race/Ethnicity and Income ..................................................................................................................... 27
Figure 33, Percentage Who Agree They Are Knowledgeable About Managing Investments for the Future, by
Race/Ethnicity and Income ..................................................................................................................... 27
Figure 34, Percentage Who Agree They Are Knowledgeable About Managing Their Day-to-Day Finances, by
Race/Ethnicity and Age .......................................................................................................................... 28
Figure 35, Percentage Who Agree They Are Knowledgeable About Managing Investments for the Future, by
Race/Ethnicity and Age .......................................................................................................................... 29
Figure 36, Percentage Who Agree That Helping Friends and Family Is More Important Than Saving for Retirement, by
Race/Ethnicity and Income ..................................................................................................................... 30
Figure 37, Percentage of Black and Hispanic Americans Who Agree That Helping Friends and Family Is More Important
Than Saving for Retirement, by Age ........................................................................................................ 30
Figure 38, Percentage Who Agree That Retirement Savings Is Not a Priority Relative to Current Needs, by
Race/Ethnicity and Income ..................................................................................................................... 31
Figure 39, Percentage of Black and Hispanic Americans Who Agree That Retirement Savings Is Not a Priority Relative to
Current Needs, by Age ........................................................................................................................... 31
Figure 40, Percentage of Hispanic Americans Who Agree That Retirement Savings Is Not a Priority Relative to Current
Needs, by U.S. Born .............................................................................................................................. 32
Figure 41, Percentage Who Agree That Saving/Paying for a Child’s Education Is Reducing Retirement Savings, by
Race/Ethnicity and Income ..................................................................................................................... 32
Figure 42, Percentage of Black and Hispanic Americans Who Agree That Saving/Paying for a Child’s Education Is
Reducing Retirement Savings, by Gender, Marital Status, and U.S. Born .................................................... 33
Figure 43, Percentage Who Feel They Have Not Been Treated Fairly by Financial Services Companies, by Race/Ethnicity
and Income .......................................................................................................................................... 33
Figure 44, Percentage of Black and Hispanic Americans Who Feel They Have Been Treated Fairly by Financial Services
Companies, by Age ................................................................................................................................ 34
Figure 45, Percentage Who Feel They Do Not Know Who to Go to for Good Financial Advice, by Race/Ethnicity and
Income ................................................................................................................................................. 35
Figure 46, Percentage of Black and Hispanic Americans Who Feel They Do Not Know Who to Go to for Good Financial
Advice, by Marital Status and Age ........................................................................................................... 35
Figure 47, Sources of Information Used for Retirement Planning, by Race/Ethnicity .................................................. 36
ebri.org Issue Brief • June 10, 2021 • No. 530 6
Figure 48, Percentage Who Work With a Professional Financial Advisor, by Race/Ethnicity ........................................ 36
Figure 49, Percentage Who Work With a Professional Financial Advisor, by Race/Ethnicity and Income ...................... 37
Figure 50, Criteria Important When Looking for a Financial Advisor, by Race/Ethnicity .............................................. 37
Figure 51, Criteria Important for Black and Hispanic Americans When Looking for a Financial Advisor, by Age ............ 38
Figure 52, Percentage of Workers and Retirees Who Calculated How Much They Need to Save for Retirement, by
Race/Ethnicity and Income ..................................................................................................................... 39
Figure 53, Percentage of Hispanic and Black Americans Who Calculated How Much They Need to Save for Retirement,
by Gender, Marital Status, and U.S. Born................................................................................................. 39
Figure 54, Percentage of Hispanic and Black Americans Who Calculated How Much They Need to Save for Retirement,
by Gender, Marital Status, and Income ................................................................................................... 40
Figure 55, Confidence in Having Enough Money to Live Comfortably Throughout Retirement, by Race/Ethnicity and
Done a Retirement Needs Calculation...................................................................................................... 40
Figure 56, Percentage Who Have Ever Personally Saved for Retirement, by Race/Ethnicity and Income ..................... 41
Figure 57, Percentage Who Have Ever Personally Saved for Retirement, by Race/Ethnicity, Income, and Gender ........ 42
Figure 58, Percentage Who Have Ever Personally Saved for Retirement, by Race/Ethnicity, Income, and Marital Status
............................................................................................................................................................ 42
Figure 59, Percentage Who Agree They Have Enough Savings to Handle an Emergency Expense, by Race/Ethnicity and
Income ................................................................................................................................................. 43
Figure 60, Expected Retirement Age of Workers, by Race/Ethnicity ......................................................................... 44
Figure 61, Retirement Age of Retirees, by Race/Ethnicity ........................................................................................ 44
Figure 62, Share of Retirees Who Retired Earlier, Later, or When Planned, by Race/Ethnicity .................................... 45
Figure 63, Share of Black and Hispanic Retirees Who Retired Earlier, Later, or When Planned, by Gender and Marital
Status ................................................................................................................................................... 45
Figure 64, Top Three Reasons for Retiring Earlier Than Planned, by Race/Ethnicity .................................................. 46
Figure 65, Workers Adjusting Target Retirement Age Since January 1, 2020, by Race/Ethnicity ................................. 46
Figure 66, Percentage of Employed Workers Who Are Offered a Retirement Savings Plan and the Percentage Who
Participate When Offered, by Race/Ethnicity and Income .......................................................................... 47
Figure 67, How Retirement Savings Plan Participants Choose Their Investments, by Race/Ethnicity and Income ......... 48
Figure 68, Percentage of Those Contributing to a Retirement Savings Plan Who Invest in a Target-Date Fund, by
Race/Ethnicity ....................................................................................................................................... 48
Figure 69, Percentage Who Are Confident in Their Ability to Choose the Right Investments for Their Situation, by
Race/Ethnicity and Income ..................................................................................................................... 49
Figure 70, Top Three Factors Workplace Retirement Plan Participants Consider When Selecting Investment Options, by
Race/Ethnicity ....................................................................................................................................... 49
Figure 71, Percentage of Workplace Retirement Plan Participants Satisfied With Various Aspects of the Plan, by
Race/Ethnicity ....................................................................................................................................... 50
Figure 72, Top Three Most Valuable Improvements to Retirement Savings Plans, as Ranked by Those Offered a Plan, by
Race/Ethnicity ....................................................................................................................................... 51

ebri.org Issue Brief • June 10, 2021 • No. 530 7
Figure 73, How Valuable Is Automatically Transferring Retirement Savings From a Previous Employer to a Current
Employer Plan, by Race/Ethnicity ............................................................................................................ 51
Figure 74, Percentage Who Have Made Changes in Their Workplace Retirement Savings Plan Since January 1, 2020, by
Race/Ethnicity ....................................................................................................................................... 52
Figure 75, Percentage of Those Who Saved for Retirement Who Took a Loan or an Early Withdrawal, by
Race/Ethnicity ....................................................................................................................................... 53
Figure 76, Percentage of Those Who Saved for Retirement Who Took a Loan, by Race/Ethnicity and Income ............ 53
Figure 77, Percentage of Those Who Saved for Retirement Who Took a Hardship Withdrawal, by Race/Ethnicity and
Income ................................................................................................................................................. 54
Figure 78, Percentage of Those Who Saved for Retirement Who Took an Early Withdrawal, by Race/Ethnicity and
Income ................................................................................................................................................. 54
Figure 79, Percentage of Those Who Saved for Retirement Who Took Some Other Withdrawal, by Race/Ethnicity and
Income ................................................................................................................................................. 55
Figure 80, Top Three Reasons for Taking a Loan From a Retirement Savings Plan, by Race/Ethnicity ........................ 55
Figure 81, Extent of Workers’ Expected Sources of Income (Net Major/Minor Source), by Race/Ethnicity ................... 56
Figure 82, Extent of Workers’ Expected Sources of Income (Net Major/Minor Source), by Race/Ethnicity ................... 57
Figure 83, Extent of Retirees’ Sources of Income (Net Major/Minor Source), by Race/Ethnicity .................................. 57
Figure 84, Extent of Retirees’ Sources of Income (Net Major/Minor Source), by Race/Ethnicity .................................. 58
Figure 85, Workers’ Expectations About Working After Retirement vs. Retirees Actually Doing So, by Race/Ethnicity ... 58
Figure 86, Reasons for Working for Pay Since Retiring, by Race/Ethnicity ................................................................ 59
Figure 87, How Do Retirees’ Lifestyles Compare With What Was Expected Before Retirement, by Race/Ethnicity ........ 60
Figure 88, Expected Spending vs. Actual Spending of Retirees, by Race/Ethnicity ..................................................... 60
Figure 89, Retiree Behavior in Regard to Their Level of Assets, by Race/Ethnicity ..................................................... 61
Figure 90, Retiree Behavior in Regard to Their Level of Assets, by Race/Ethnicity and Income .................................. 61

ebri.org Issue Brief • June 10, 2021 • No. 530 8
2021 Retirement Confidence Survey: A Closer Look at Black and Hispanic Americans
By Craig Copeland, Ph.D., Employee Benefit Research Institute, and Lisa Greenwald,
Greenwald Research
Introduction
The Retirement Confidence Survey (RCS) was conducted for its 31st year in 2021 to measure attitudes toward,
preparations for, and understanding of the various issues/products for retirement by American workers and retirees.1
The RCS found that Americans in 2021 had near-record-high confidence in having enough money to live comfortably
throughout retirement. These levels held despite the COVID-19 pandemic that lasted throughout 2020. However, the
survey also found that many workers and retirees haven’t prepared or didn’t prepare for retirement, and the pandemic
most affected those least able to handle the financial impact of it.
The 2021 RCS included an oversample of Black and Hispanic workers and retirees to explore and identify potential
differences in attitudes, experiences, and behaviors related to financial management and preparing for retirement.2 In
particular, Black and Hispanic Americans were more likely to have lower incomes and assets. Due to these unique
challenges, this Issue Brief more closely examines Black and Hispanic Americans by using the measures developed in
the RCS. Furthermore, new questions were added this year to evaluate priorities in regard to preparing for retirement
and experiences with the financial system that may affect Black and Hispanic Americans’ retirement preparations.
The advantage of an oversample is the ability to control for important factors that are strongly associated with many of
the results about retirement preparations, in particular household income. The RCS has historically demonstrated
significant differences in how respondents in lower and upper income groups respond to survey questions. Therefore,
many of the figures will use household income as a control to see which differences by race and ethnicity persist even
when comparing respondents of the same incomes. In addition, other variables such as age, gender, marital status,
and whether the individual was born in the United States are used in this report.
A Note on the Figures
The exact wording from the questionnaire, who was being asked the question, and the sample size of the group
being asked are contained in each figure. Also, * and ^ are used to signify that a statistically significant
difference exists for the group that has the indicator. All significance tests are at the 95 percent level. The two
different indicators do not indicate a different significance level but different categories within the same graph
having different significance comparisons. The vast majority of significant differences are indicated by *.
Appendix 2 at the end of the report details the exact significant differences in each figure indicted by * and ^. If
no such indicator is present, the results are not statistically significantly different. The percentages in the figures
may not total to 100 percent due to rounding and/or missing categories.
Demographics
To understand differences by racial/ethnic groups, various demographic breakdowns are outlined below. First, 64
percent of Americans identified as White/Caucasian (non-Hispanic), 16 percent as Hispanic, and 11 percent as non-
Hispanic Black, and 9 percent were grouped into an “other” category that includes all remaining races/ethnicities, such
as Asian Americans (Figure 1).
White Americans were least likely to be in the lower-income group (less than $35,000 in annual household income) at
15 percent compared with 22 percent of Hispanic Americans and 34 percent of Black Americans. Those in the middle-
income group ($35,000–$74,999 in annual household income) ranged from 25 percent of White Americans to 31
percent of Black Americans and 37 percent of Hispanic Americans. White Americans were most likely to be in the

ebri.org Issue Brief • June 10, 2021 • No. 530 9
Figure 2
Demographic Breakdowns, by Race/Ethnicity
56%
36%
64%
59%
20%
37%
13%
18%
11%
12%
10%
10%
9%
9%
7%
7%
4%
6%
6%
6%
0% 20% 40% 60% 80% 100%
Hispanic
Black
White
All
Married Single, never married
Divorced or separated Not married, living with partner
Widowed
79%
93%
96%
90%
20%
6%
4%
10%
0% 20% 40% 60% 80% 100%
Hispanic
Black
White
All
Yes No
Marital Status U.S. Born
49%
45%
51%
49%
51%
55%
49%
51%
0% 20% 40% 60% 80% 100%
Hispanic
Black
White
All
Male Female
Gender
Source: Employee Benefit Research Institute and Greenwald Research 2021 Retirement Confidence Survey.
31%
26%
16%
20%
20%
17%
18%
19%
15%
19%
19%
18%
15%
20%
20%
19%
14%
15%
14%
14%
4%
4%
12%
10%
0% 20% 40% 60% 80% 100%
Hispanic
Black
White
All
25-34 35-44 45-54 55-64 65-74 75 or older
Age
64% 16% 11% 9%
0% 20% 40% 60% 80% 100%
White Hispanic Black Other
Race/Ethnicity
22%
34%
15%
19%
37%
31%
25%
27%
41%
35%
60%
55%
0% 20% 40% 60% 80% 100%
Hispanic
Black
White
All
Less than $35,000 $35,000-$74,999 $75,000 or more
Household Income
64%
58%
61%
62%
18%
23%
13%
14%
18%
18%
26%
24%
0% 20% 40% 60% 80% 100%
Hispanic
Black
White
All
Employed Unemployed Retired
Employment Status
Figure 1
Demographic Breakdowns, by Race/Ethnicity
Source: Employee Benefit Research Institute and Greenwald Research 2021 Retirement Confidence Survey.
upper-income group ($75,000 or more in annual household income) vs. 35 percent of Black Americans and 41 percent
of Hispanic Americans.3
Hispanic Americans were more likely to be younger, while White Americans were more likely to be older. White
Americans were more likely to be retired, and Black Americans were more likely to be unemployed. Black Americans
were the least likely to be married and those most likely to be single (Figure 2). Twenty percent of Hispanic Americans
were born outside of the United States.4 Finally, the genders were essentially evenly split in each race/ethnicity.
ebri.org Issue Brief • June 10, 2021 • No. 530 10
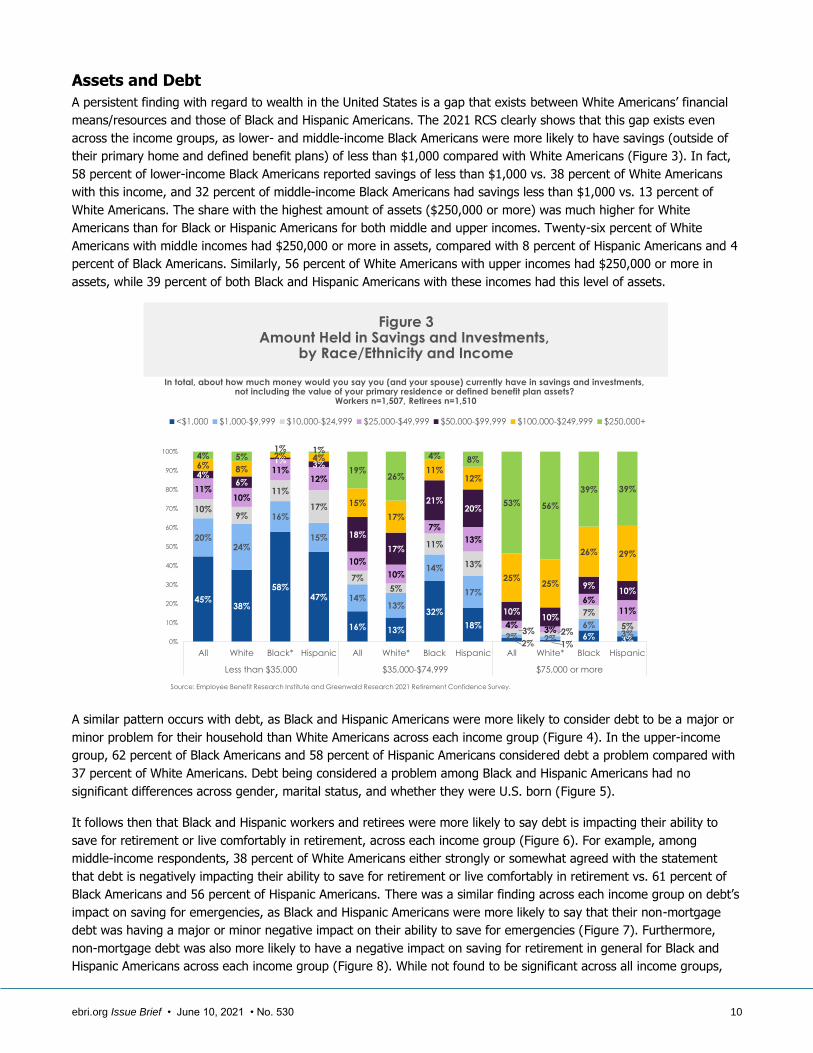
In total, about how much money would you say you (and your spouse) currently have in savings and investments, not including the value of your primary residence or defined benefit plan assets?
Workers n=1,507, Retirees n=1,510
Figure 3Amount Held in Savings and Investments,
by Race/Ethnicity and Income
Source: Employee Benefit Research Institute and Greenwald Research 2021 Retirement Confidence Survey.
45%38%
58%47%
16% 13%
32%
18%
2% 1%6% 3%
20%24%
16%
15%
14%13%
14%
17%
2% 2%
6%3%
10%9%
11%
17%
7%
5%
11%
13%
3% 2%
7%
5%
11%10%
11%12%
10%
10%
7%
13%
4%3%
6%
11%
4%6%
1%3%
18%
17%
21%20%
10%10%
9%10%
6% 8%
2% 4%
15%
17%
11%12%
25%25%
26% 29%
4% 5%1% 1%
19%26%
4% 8%
53% 56%
39% 39%
0%
10%
20%
30%
40%
50%
60%
70%
80%
90%
100%
All White Black* Hispanic All White* Black Hispanic All White* Black Hispanic
Less than $35,000 $35,000-$74,999 $75,000 or more
<$1,000 $1,000-$9,999 $10,000-$24,999 $25,000-$49,999 $50,000-$99,999 $100,000-$249,999 $250,000+
Assets and Debt
A persistent finding with regard to wealth in the United States is a gap that exists between White Americans’ financial
means/resources and those of Black and Hispanic Americans. The 2021 RCS clearly shows that this gap exists even
across the income groups, as lower- and middle-income Black Americans were more likely to have savings (outside of
their primary home and defined benefit plans) of less than $1,000 compared with White Americans (Figure 3). In fact,
58 percent of lower-income Black Americans reported savings of less than $1,000 vs. 38 percent of White Americans
with this income, and 32 percent of middle-income Black Americans had savings less than $1,000 vs. 13 percent of
White Americans. The share with the highest amount of assets ($250,000 or more) was much higher for White
Americans than for Black or Hispanic Americans for both middle and upper incomes. Twenty-six percent of White
Americans with middle incomes had $250,000 or more in assets, compared with 8 percent of Hispanic Americans and 4
percent of Black Americans. Similarly, 56 percent of White Americans with upper incomes had $250,000 or more in
assets, while 39 percent of both Black and Hispanic Americans with these incomes had this level of assets.
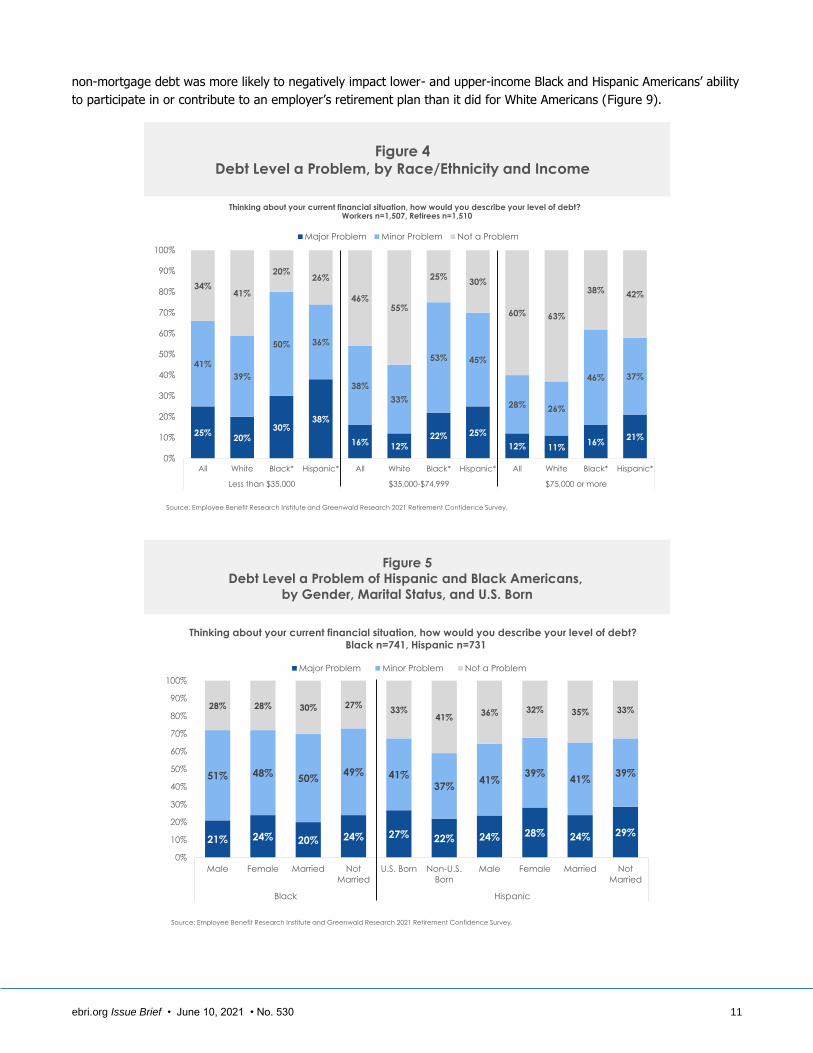
A similar pattern occurs with debt, as Black and Hispanic Americans were more likely to consider debt to be a major or
minor problem for their household than White Americans across each income group (Figure 4). In the upper-income
group, 62 percent of Black Americans and 58 percent of Hispanic Americans considered debt a problem compared with
37 percent of White Americans. Debt being considered a problem among Black and Hispanic Americans had no
significant differences across gender, marital status, and whether they were U.S. born (Figure 5).
It follows then that Black and Hispanic workers and retirees were more likely to say debt is impacting their ability to
save for retirement or live comfortably in retirement, across each income group (Figure 6). For example, among
middle-income respondents, 38 percent of White Americans either strongly or somewhat agreed with the statement
that debt is negatively impacting their ability to save for retirement or live comfortably in retirement vs. 61 percent of
Black Americans and 56 percent of Hispanic Americans. There was a similar finding across each income group on debt’s
impact on saving for emergencies, as Black and Hispanic Americans were more likely to say that their non-mortgage
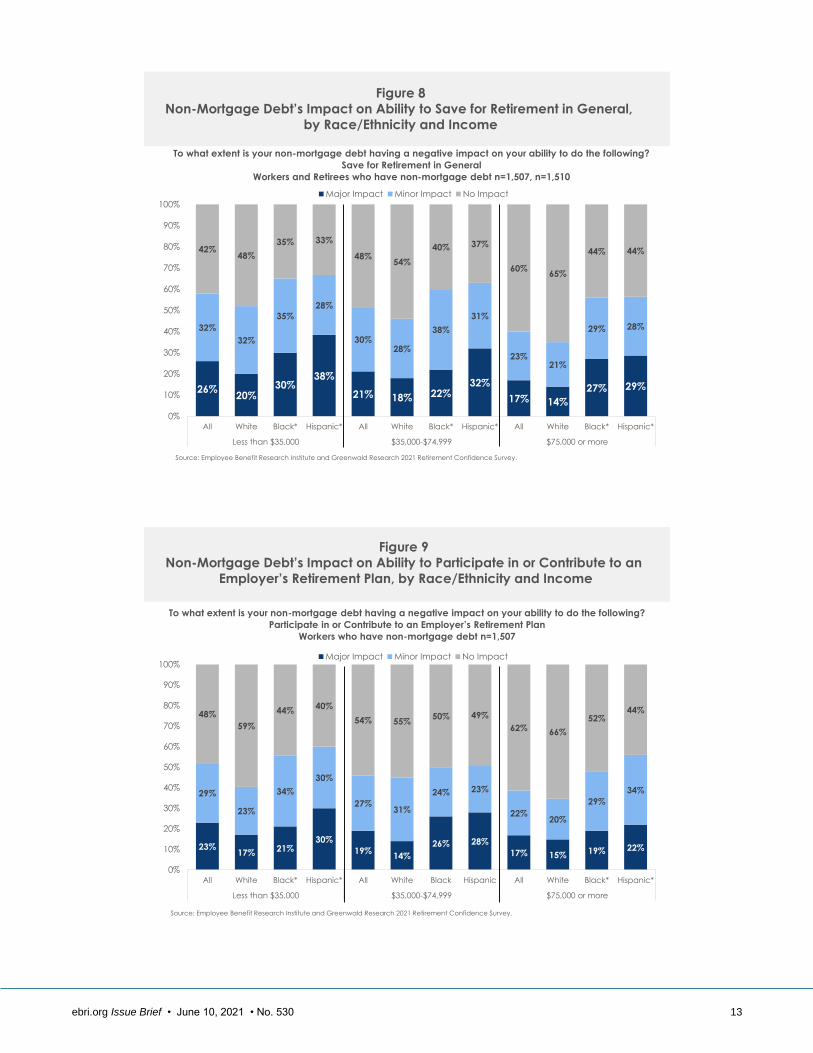
debt was having a major or minor negative impact on their ability to save for emergencies (Figure 7). Furthermore,
non-mortgage debt was also more likely to have a negative impact on saving for retirement in general for Black and
Hispanic Americans across each income group (Figure 8). While not found to be significant across all income groups,
ebri.org Issue Brief • June 10, 2021 • No. 530 11
25%20%
30%38%
16% 12%22% 25%
12% 11%16%
21%
41%
39%
50% 36%
38%
33%
53% 45%
28% 26%
46% 37%
34%41%
20%26%
46%55%
25%30%
60% 63%
38% 42%
0%
10%
20%
30%
40%
50%
60%
70%
80%
90%
100%
All White Black* Hispanic* All White Black* Hispanic* All White Black* Hispanic*
Less than $35,000 $35,000-$74,999 $75,000 or more
Major Problem Minor Problem Not a Problem
Source: Employee Benefit Research Institute and Greenwald Research 2021 Retirement Confidence Survey.
Thinking about your current financial situation, how would you describe your level of debt? Workers n=1,507, Retirees n=1,510
Figure 4Debt Level a Problem, by Race/Ethnicity and Income
21% 24% 20% 24% 27% 22% 24% 28% 24% 29%
51% 48%50%
49% 41%37%
41%39%
41%39%
28% 28% 30% 27%33%
41%36% 32% 35% 33%
0%
10%
20%
30%
40%
50%
60%
70%
80%
90%
100%
Male Female Married Not
Married
U.S. Born Non-U.S.
Born
Male Female Married Not
Married
Black Hispanic
Major Problem Minor Problem Not a Problem
Thinking about your current financial situation, how would you describe your level of debt? Black n=741, Hispanic n=731
Source: Employee Benefit Research Institute and Greenwald Research 2021 Retirement Confidence Survey.
Figure 5
Debt Level a Problem of Hispanic and Black Americans,
by Gender, Marital Status, and U.S. Born
non-mortgage debt was more likely to negatively impact lower- and upper-income Black and Hispanic Americans’ ability
to participate in or contribute to an employer’s retirement plan than it did for White Americans (Figure 9).

ebri.org Issue Brief • June 10, 2021 • No. 530 12
22%18%
23%
34%
18% 15%24% 21%
13% 12%18% 21%
27%
25%
35%
24%
27%
23%
37%34%
20% 19%
30% 26%
51%57%
43% 42%
55%62%
39%44%
67% 69%
52% 53%
0%
10%
20%
30%
40%
50%
60%
70%
80%
90%
100%
All White Black* Hispanic* All White Black* Hispanic* All White Black* Hispanic*
Less than $35,000 $35,000-$74,999 $75,000 or more
Strongly Agree Somewhat Agree Disagree
To what extent do you agree or disagree with the following statement?Debt is negatively impacting your ability to save for retirement/live comfortably in retirement.
Workers n=1,507, Retirees n=1,510
Source: Employee Benefit Research Institute and Greenwald Research 2021 Retirement Confidence Survey.
Figure 6
Debt’s Impact on Ability to Save for Retirement/Live Comfortably in
Retirement, by Race/Ethnicity and Income
30%25%
31%40%
23%19%
34%29%
15% 12%21%
29%
32%
31%
39%29%
29%28%
28%33%
24%22%
34%
30%
38%44%
29% 31%
47%53%
37% 38%
61%66%
45% 41%
0%
10%
20%
30%
40%
50%
60%
70%
80%
90%
100%
All White Black* Hispanic* All White Black* Hispanic* All White Black* Hispanic*
Less than $35,000 $35,000-$74,999 $75,000 or more
Major Impact Minor Impact No Impact
To what extent is your non-mortgage debt having a negative impact on your ability to do the following?
Save for Emergencies
Workers and Retirees who have non-mortgage debt n=1,507, n=1,510
Source: Employee Benefit Research Institute and Greenwald Research 2021 Retirement Confidence Survey.
Figure 7
Non-Mortgage Debt’s Impact on Ability to Save for Emergencies,
by Race/Ethnicity and Income
ebri.org Issue Brief • June 10, 2021 • No. 530 13
26%20%
30%38%
21% 18% 22%32%
17% 14%
27% 29%
32%
32%
35%
28%
30%28%
38%
31%
23%21%
29% 28%
42%48%
35% 33%
48%54%
40% 37%
60%65%
44% 44%
0%
10%
20%
30%
40%
50%
60%
70%
80%
90%
100%
All White Black* Hispanic* All White Black* Hispanic* All White Black* Hispanic*
Less than $35,000 $35,000-$74,999 $75,000 or more
Major Impact Minor Impact No Impact
To what extent is your non-mortgage debt having a negative impact on your ability to do the following?
Save for Retirement in General
Workers and Retirees who have non-mortgage debt n=1,507, n=1,510
Source: Employee Benefit Research Institute and Greenwald Research 2021 Retirement Confidence Survey.
Figure 8
Non-Mortgage Debt’s Impact on Ability to Save for Retirement in General,
by Race/Ethnicity and Income
To what extent is your non-mortgage debt having a negative impact on your ability to do the following?
Participate in or Contribute to an Employer’s Retirement Plan
Workers who have non-mortgage debt n=1,507
23%17% 21%
30%
19%14%
26% 28%
17% 15%19% 22%
29%
23%
34%
30%
27%31%
24% 23%
22%20%
29%
34%
48%
59%
44%40%
54% 55%50% 49%
62% 66%
52%44%
0%
10%
20%
30%
40%
50%
60%
70%
80%
90%
100%
All White Black* Hispanic* All White Black Hispanic All White Black* Hispanic*
Less than $35,000 $35,000-$74,999 $75,000 or more
Major Impact Minor Impact No Impact
Source: Employee Benefit Research Institute and Greenwald Research 2021 Retirement Confidence Survey.
Figure 9
Non-Mortgage Debt’s Impact on Ability to Participate in or Contribute to an
Employer’s Retirement Plan, by Race/Ethnicity and Income

ebri.org Issue Brief • June 10, 2021 • No. 530 14
29%
22%
32%
41%
30%
26%
41%
35%
32% 32%31%
40%
0%
5%
10%
15%
20%
25%
30%
35%
40%
45%
All White Black* Hispanic* All White Black* Hispanic* All White Black Hispanic*
Less than $35,000 $35,000-$74,999 $75,000 or more
Have any of the following work changes happened in your household since February 1st, 2020? (Please select all that apply.)
Total: Workers n=1,507, Retirees n=1,510, Net Negative Job or Income Change
Source: Employee Benefit Research Institute and Greenwald Research 2021 Retirement Confidence Survey.
Figure 10
Percentage of Workers and Retirees Who Report a Negative Job or
Income Change Since February 1, 2020, by Race/Ethnicity and Income
COVID-19 Pandemic Impact
The COVID-19 pandemic has had far-reaching consequences, so various COVID-related questions were added to the
RCS to see how the pandemic impacted retirement preparations. First and foremost, the pandemic had effects on
incomes and jobs, which if lowered or lost could lead to reduced retirement prospects for workers and retirees. Three in
ten Americans, regardless of income, reported experiencing a negative income or job change since February 1, 2020
(Figure 10). Black Americans with lower and middle incomes and Hispanic Americans in all three income groups had
higher likelihoods of experiencing a negative income or job change than did White Americans, with Hispanic Americans
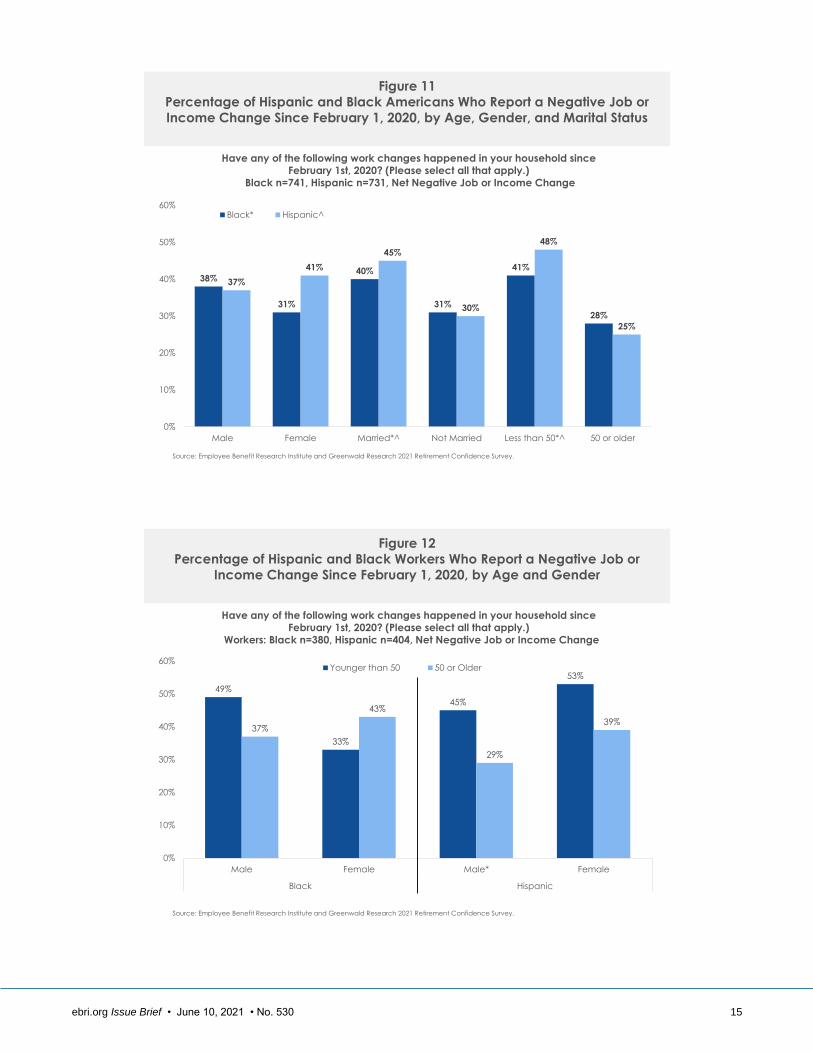
reaching 4 in 10 in the lower- and upper-income groups having a negative change since February 1, 2020. Hispanic and
Black Americans who were married or younger than age 50 were more likely to have experienced a negative income or
job change compared with their counterparts, whereas there were no significant differences between genders (Figure
11). It is important to note that the question asked about the family, so for those married, a negative change could
have happened to the respondent or their spouse, thereby raising the potential likelihood that a married person had a
negative change. Among Hispanic workers, males under age 50 were more likely to have had a negative change than
those 50 or older (Figure 12).
Many schools closed during the pandemic, increasing the need for child care. Overall, 2 in 10 workers said that the
pandemic had a major or minor negative impact on their ability to work the number of hours wanted or needed to
because of child care needs (Figure 13). Hispanic workers were affected more, as 3 in 10 said the pandemic had a
negative impact on the number of hours they could work compared with 2 in 10 White workers. The negative impact on
hours Black and Hispanic workers could work because of child care needs was not different by their gender, but not-
married Black Americans were more likely to say they were impacted than their married counterparts (Figure 14).
ebri.org Issue Brief • June 10, 2021 • No. 530 15
38%
31%
40%
31%
41%
28%
37%
41%
45%
30%
48%
25%
0%
10%
20%
30%
40%
50%
60%
Male Female Married*^ Not Married Less than 50*^ 50 or older
Black* Hispanic^
Source: Employee Benefit Research Institute and Greenwald Research 2021 Retirement Confidence Survey.
Have any of the following work changes happened in your household since February 1st, 2020? (Please select all that apply.)
Black n=741, Hispanic n=731, Net Negative Job or Income Change
Figure 11
Percentage of Hispanic and Black Americans Who Report a Negative Job or
Income Change Since February 1, 2020, by Age, Gender, and Marital Status
Source: Employee Benefit Research Institute and Greenwald Research 2021 Retirement Confidence Survey.
Have any of the following work changes happened in your household since February 1st, 2020? (Please select all that apply.)
Workers: Black n=380, Hispanic n=404, Net Negative Job or Income Change
Figure 12
Percentage of Hispanic and Black Workers Who Report a Negative Job or
Income Change Since February 1, 2020, by Age and Gender
49%
33%
45%
53%
37%
43%
29%
39%
0%
10%
20%
30%
40%
50%
60%
Male Female Male* Female
Black Hispanic
Younger than 50 50 or Older

ebri.org Issue Brief • June 10, 2021 • No. 530 16
Figure 13
COVID-19 Pandemic Impact on Ability to Work Due
to Child Care Needs, by Race/Ethnicity
9%
7%
13%
14%
13%
12%
12%
16%
45%
49%
35%
34%
8%
6%
13%
14%
25%
26%
26%
22%
All
White
Black*
Hispanic*
How has the COVID-19 pandemic and related health concerns, business and school closures impacted your…?
Ability to work the number of hours you want/need due to childcare needs or child supervision
Workers n=1,507
Major Negative
Impact
Minor Negative
Impact
No Impact/ The
Same Positive Impact Not Applicable
Source: Employee Benefit Research Institute and Greenwald Research 2021 Retirement Confidence Survey.
14% 13% 9%16% 13% 14% 15% 13%
12% 12%9%
13%14%
17% 16%15%
32%39%
38%
34% 38% 30%37%
31%
19% 8%18%
11%16%
11%
17%
9%
24% 28% 26% 26%18%
27%
15%
32%
0%
10%
20%
30%
40%
50%
60%
70%
80%
90%
100%
Male Female Married Not Married* Male Female Married Not Married
Black Hispanic
Major Negative Impact Minor Negative Impact No Impact Positive Impact Not Applicable
Source: Employee Benefit Research Institute and Greenwald Research 2021 Retirement Confidence Survey.
How has the COVID-19 pandemic and related health concerns, business and school closures impacted your…?
Ability to work the number of hours you want/need due to childcare needs or child supervision
Workers: Black n=380, Hispanic n=404
Figure 14
COVID-19 Pandemic Impact on Ability of Black and Hispanic Workers to
Work Due to Child Care Needs, by Gender and Marital Status
Hispanic workers also were more likely to report that they were negatively impacted by the pandemic in terms of the
number of hours they could work because of caregiving for someone other than a child, as 3 in 10 Hispanic workers

ebri.org Issue Brief • June 10, 2021 • No. 530 17
4%10%
4% 7% 8% 4% 7% 10% 8%17% 17%
34% 43%
36%
21%
45%49%
39%42%
58% 61% 47%40%
16%15% 14%
19%
22%22%
28% 14%
17% 16% 22%
21%31%31%
24%
38%
15%12%
16%25%
9% 8% 7%15%
15%10%
16% 18%11% 9%
14% 12%7% 7% 7% 7%
0%
10%
20%
30%
40%
50%
60%
70%
80%
90%
100%
All White Black Hispanic* All White Black Hispanic All White Black Hispanic*
Less than $35,000 $35,000-$74,999 $75,000 or more
Positive Impact No Impact Minor Negative Impact Major Negative Impact Not Applicable
Source: Employee Benefit Research Institute and Greenwald Research 2021 Retirement Confidence Survey.
How has the COVID-19 pandemic and related health concerns, business and school closures impacted your...?
Ability to save for retirement because of reduced hours, reduced income, or job changes
Workers n=1,507
Figure 16
Impact of COVID-19 Pandemic on the Ability to Save for Retirement,
by Race/Ethnicity and Income
Figure 15
COVID-19 Pandemic Impact on Ability to Work Due toCaregiving for Someone Other Than a Child, by Race/Ethnicity
How has the COVID-19 pandemic and related health concerns, business and school closures impacted your…?
Ability to work the number of hours you want/need due to caregiving for someone other than a child
Workers n=1,507
10%
10%
7%
8%
19%
15%
10%
12%
37%
40%
50%
47%
13%
12%
6%
8%
21%
23%
27%
25%
0% 10% 20% 30% 40% 50% 60% 70% 80% 90% 100%
Hispanic*
Black*
White
All
Major Negative Impact Minor Negative Impact No Impact/Same Positive Impact Not Applicable
said they had this negative impact vs. 17 percent of White workers (Figure 15). Black workers were also more likely
than White workers to have had their hours impacted to care for someone other than a child.
The pandemic had a greater impact on lower-income workers’ ability to save for retirement than it did on upper-income
workers (Figure 16). Hispanic workers in lower- and upper-income groups were more likely to report that the pandemic
had a major negative impact on their ability to save for retirement. This is relative to Black workers in the lower-income
group and White workers in the upper-income group.
ebri.org Issue Brief • June 10, 2021 • No. 530 18
15% 13%21%
12%
24% 23% 23% 25%
40% 40% 39% 42%
33% 34%29%
35%
46% 47%39%
44%
46% 46% 46% 43%
52% 52% 50% 54%
31% 30%38%
31%
14% 14% 16% 15%
0%
10%
20%
30%
40%
50%
60%
70%
80%
90%
100%
All White Black Hispanic All White Black Hispanic All White Black Hispanic
Less than $35,000 $35,000-$74,999 $75,000 or more
Very Confident Somewhat Confident Not Confident
Source: Employee Benefit Research Institute and Greenwald Research 2021 Retirement Confidence Survey.
Overall, how confident are you that you (and your spouse) will have enough
money to live comfortably throughout your retirement years?
Total: Workers n=1,507, Retirees n=1,510
Figure 17
Confidence in Having Enough Money to Live Comfortably
Through Retirement, by Race/Ethnicity and Income
Retirement Confidence
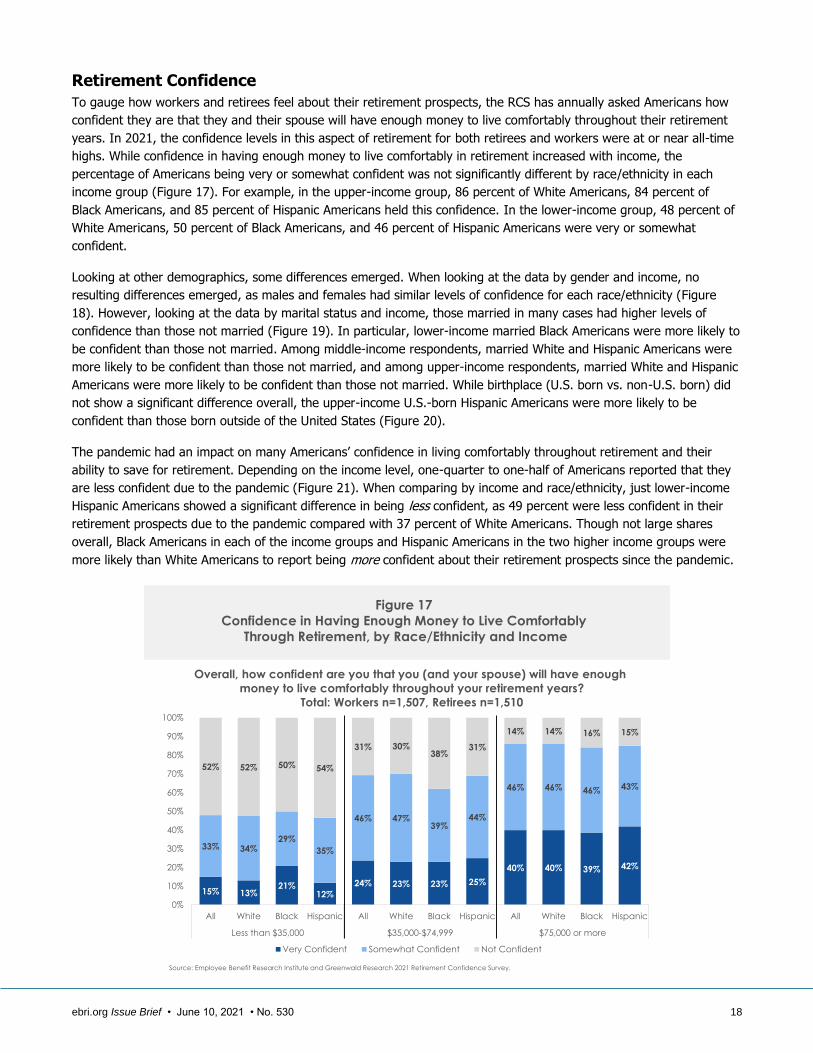
To gauge how workers and retirees feel about their retirement prospects, the RCS has annually asked Americans how
confident they are that they and their spouse will have enough money to live comfortably throughout their retirement
years. In 2021, the confidence levels in this aspect of retirement for both retirees and workers were at or near all-time
highs. While confidence in having enough money to live comfortably in retirement increased with income, the
percentage of Americans being very or somewhat confident was not significantly different by race/ethnicity in each
income group (Figure 17). For example, in the upper-income group, 86 percent of White Americans, 84 percent of
Black Americans, and 85 percent of Hispanic Americans held this confidence. In the lower-income group, 48 percent of
White Americans, 50 percent of Black Americans, and 46 percent of Hispanic Americans were very or somewhat
confident.
Looking at other demographics, some differences emerged. When looking at the data by gender and income, no
resulting differences emerged, as males and females had similar levels of confidence for each race/ethnicity (Figure
18). However, looking at the data by marital status and income, those married in many cases had higher levels of
confidence than those not married (Figure 19). In particular, lower-income married Black Americans were more likely to
be confident than those not married. Among middle-income respondents, married White and Hispanic Americans were
more likely to be confident than those not married, and among upper-income respondents, married White and Hispanic
Americans were more likely to be confident than those not married. While birthplace (U.S. born vs. non-U.S. born) did
not show a significant difference overall, the upper-income U.S.-born Hispanic Americans were more likely to be
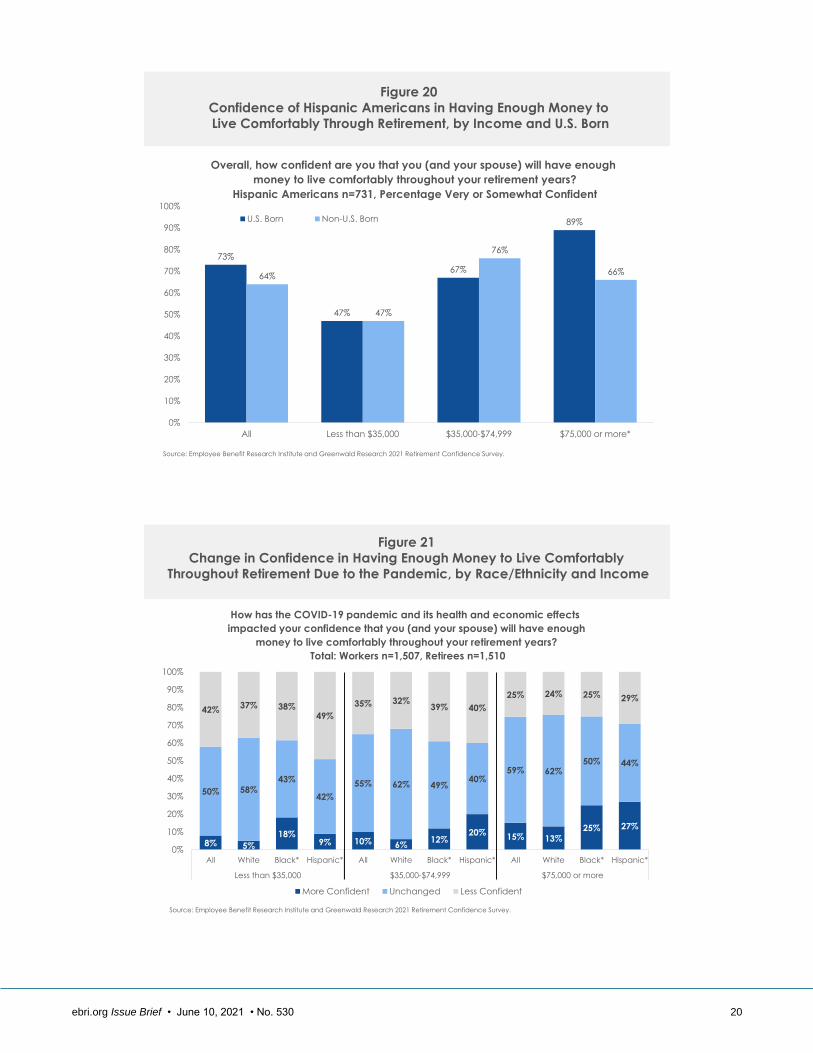
confident than those born outside of the United States (Figure 20).
The pandemic had an impact on many Americans’ confidence in living comfortably throughout retirement and their
ability to save for retirement. Depending on the income level, one-quarter to one-half of Americans reported that they
are less confident due to the pandemic (Figure 21). When comparing by income and race/ethnicity, just lower-income
Hispanic Americans showed a significant difference in being less confident, as 49 percent were less confident in their
retirement prospects due to the pandemic compared with 37 percent of White Americans. Though not large shares
overall, Black Americans in each of the income groups and Hispanic Americans in the two higher income groups were
more likely than White Americans to report being more confident about their retirement prospects since the pandemic.

ebri.org Issue Brief • June 10, 2021 • No. 530 19
48% 47% 49%46%
71%74%
62%
72%
88% 89% 88% 88%
49% 48%52%
47%
67% 67%
61%
66%
83% 83% 81% 82%
0%
10%
20%
30%
40%
50%
60%
70%
80%
90%
100%
All White Black Hispanic All White Black Hispanic All White Black Hispanic
Less than $35,000 $35,000-$74,999 $75,000 or more
Male Female
Overall, how confident are you that you (and your spouse) will have enough
money to live comfortably throughout your retirement years?
Total: Workers n=1,507, Retirees n=1,510, Percentage Very or Somewhat Confident
Figure 18
Confidence in Having Enough Money to Live Comfortably
Through Retirement, by Race/Ethnicity, Income, and Gender
Source: Employee Benefit Research Institute and Greenwald Research 2021 Retirement Confidence Survey.
58%
53%
65%
56%
78% 79%
65%
76%
88% 89%87%
91%
46% 47% 47%43%
60% 60% 60% 61%
76% 77%
83%
68%
0%
10%
20%
30%
40%
50%
60%
70%
80%
90%
100%
All White Black Hispanic All White* Black Hispanic* All White* Black Hispanic*
Less than $35,000 $35,000-$74,999 $75,000 or more
Married Not Married
Overall, how confident are you that you (and your spouse) will have enough
money to live comfortably throughout your retirement years?
Total: Workers n=1,507, Retirees n=1,510, Percentage Very or Somewhat Confident
Source: Employee Benefit Research Institute and Greenwald Research 2021 Retirement Confidence Survey.
Figure 19
Confidence in Having Enough Money to Live Comfortably
Through Retirement, by Race/Ethnicity, Income, and Marital Status
ebri.org Issue Brief • June 10, 2021 • No. 530 20
73%
47%
67%
89%
64%
47%
76%
66%
0%
10%
20%
30%
40%
50%
60%
70%
80%
90%
100%
All Less than $35,000 $35,000-$74,999 $75,000 or more*
U.S. Born Non-U.S. Born
Source: Employee Benefit Research Institute and Greenwald Research 2021 Retirement Confidence Survey.
Overall, how confident are you that you (and your spouse) will have enough
money to live comfortably throughout your retirement years?
Hispanic Americans n=731, Percentage Very or Somewhat Confident
Figure 20
Confidence of Hispanic Americans in Having Enough Money to
Live Comfortably Through Retirement, by Income and U.S. Born
8% 5%
18%9% 10% 6%
12%20%
15% 13%
25% 27%
50% 58%43%
42%
55% 62% 49%40%
59% 62%50% 44%
42%37% 38%
49%
35% 32%39% 40%
25% 24% 25% 29%
0%
10%
20%
30%
40%
50%
60%
70%
80%
90%
100%
All White Black* Hispanic* All White Black* Hispanic* All White Black* Hispanic*
Less than $35,000 $35,000-$74,999 $75,000 or more
More Confident Unchanged Less Confident
Source: Employee Benefit Research Institute and Greenwald Research 2021 Retirement Confidence Survey.
How has the COVID-19 pandemic and its health and economic effects
impacted your confidence that you (and your spouse) will have enough
money to live comfortably throughout your retirement years?
Total: Workers n=1,507, Retirees n=1,510
Figure 21
Change in Confidence in Having Enough Money to Live Comfortably
Throughout Retirement Due to the Pandemic, by Race/Ethnicity and Income

ebri.org Issue Brief • June 10, 2021 • No. 530 21
21%16% 19% 18% 22%
13%25%
16%23%
17%
50%
46%52%
45% 42%
42%
46%
38%
44%
39%
28%38%
29%37% 36%
45%
29%
46%
32%44%
0%
10%
20%
30%
40%
50%
60%
70%
80%
90%
100%
Male Female* Married Not
Married
U.S. Born Non-U.S.
Born
Male Female* Married Not
Married*
Black Hispanic
More Confident Unchanged Less Confident
How has the COVID-19 pandemic and its health and economic effects impacted your confidence that you (and your spouse) will have enough
money to live comfortably throughout your retirement years? Black n=741, Hispanic n=731
Figure 22Change in Confidence in Having Enough Money to Live Comfortably
Throughout Retirement Due to the Pandemic of Black and Hispanic Americans,by Gender, Marital Status, and U.S. Born
Source: Employee Benefit Research Institute and Greenwald Research 2021 Retirement Confidence Survey.
Female Black and Hispanic Americans were more likely to be less confident in retirement as a result of the pandemic
compared with their male counterparts (Figure 22). In addition, not-married Hispanic Americans were more likely to be
less confident than married Hispanic Americans.
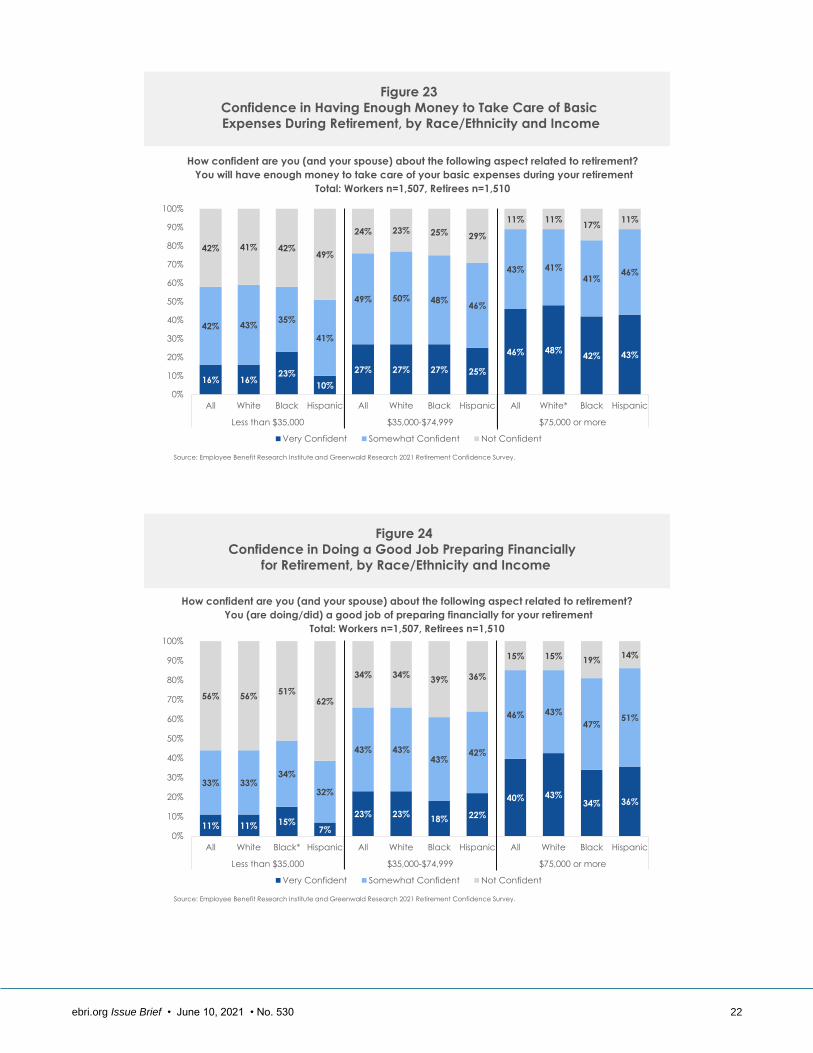
With regard to other aspects of retirement, the share of White Americans feeling confident in having enough to cover
basic expenses was greater than Black Americans, even among those with upper incomes (Figure 23). However, the
share of lower-income Black Americans feeling very confident in having enough money to cover basic expenses was
larger than that of Hispanic Americans (23 percent vs. 10 percent).
The percentage of lower-income Black Americans who were very confident that they are doing a good job preparing for
retirement was higher than that of Hispanic Americans, and upper-income White Americans were more likely to be very
confident than Black Americans (Figure 24). The percentages for the confident categories (somewhat or very confident)
together are not significantly different by race/ethnicity.
A majority of workers regardless of income or race/ethnicity said they agreed that preparing for retirement makes them
feel stressed (Figure 25). However, Hispanic workers were particularly likely to report that preparing for retirement was
stressful, as upper-income Hispanic workers were more likely to report being stressed than White workers, and lower-
income Hispanic workers were more likely to be stressed by preparing for retirement than Black workers. Lower-income
White workers were also more likely to say they were stressed from preparing for retirement than were Black workers.
Confidence in the ability of the two major social programs (Social Security and Medicare) in the United States to
continue to pay at least the benefits offered today was strong across all income and race/ethnicity groups, with no
group having less than 56 percent who were confident in these programs doing so (Figure 26 and Figure 27). However,
lower- and upper-income Black Americans and middle-income Hispanic Americans were more likely to be confident in
these programs providing at least the same level of benefits compared with White Americans in the same income
groups.
ebri.org Issue Brief • June 10, 2021 • No. 530 22
16% 16%23%
10%
27% 27% 27% 25%
46% 48%42% 43%
42% 43%35%
41%
49% 50% 48%46%
43% 41%
41%46%
42% 41% 42%49%
24% 23% 25% 29%
11% 11%17%
11%
0%
10%
20%
30%
40%
50%
60%
70%
80%
90%
100%
All White Black Hispanic All White Black Hispanic All White* Black Hispanic
Less than $35,000 $35,000-$74,999 $75,000 or more
Very Confident Somewhat Confident Not Confident
Source: Employee Benefit Research Institute and Greenwald Research 2021 Retirement Confidence Survey.
How confident are you (and your spouse) about the following aspect related to retirement?
You will have enough money to take care of your basic expenses during your retirement
Total: Workers n=1,507, Retirees n=1,510
Figure 23
Confidence in Having Enough Money to Take Care of Basic
Expenses During Retirement, by Race/Ethnicity and Income
11% 11% 15%7%
23% 23%18% 22%
40% 43%34% 36%
33% 33%34%
32%
43% 43%43%
42%
46% 43%
47%51%
56% 56%51%
62%
34% 34%39% 36%
15% 15% 19%14%
0%
10%
20%
30%
40%
50%
60%
70%
80%
90%
100%
All White Black* Hispanic All White Black Hispanic All White Black Hispanic
Less than $35,000 $35,000-$74,999 $75,000 or more
Very Confident Somewhat Confident Not Confident
Source: Employee Benefit Research Institute and Greenwald Research 2021 Retirement Confidence Survey.
How confident are you (and your spouse) about the following aspect related to retirement?
You (are doing/did) a good job of preparing financially for your retirement
Total: Workers n=1,507, Retirees n=1,510
Figure 24
Confidence in Doing a Good Job Preparing Financially
for Retirement, by Race/Ethnicity and Income

ebri.org Issue Brief • June 10, 2021 • No. 530 23
32%41%
19%
37%
26% 25% 26%32%
17% 15%
27% 25%
36%
32%
42%
35%
39% 41%33%
37%
37% 37%
30%44%
32%27%
40%
27%35% 34%
42%31%
47% 49%43%
31%
0%
10%
20%
30%
40%
50%
60%
70%
80%
90%
100%
All White* Black Hispanic* All White Black Hispanic All White Black Hispanic*
Less than $35,000 $35,000-$74,999 $75,000 or more
Strongly Agree Somewhat Agree Disagree
Source: Employee Benefit Research Institute and Greenwald Research 2021 Retirement Confidence Survey.
To what extent do you agree or disagree with the following statement?
Preparing for retirement makes you feel stressed
Workers n=1,507
Figure 25
Percentage of Workers Who Agree That Preparing for Retirement
Makes Them Stressed, by Race/Ethnicity and Income
Figure 26
Confidence in Social Security Continuing to Provide Benefits of at Least
Equal to Those Received Now, by Race/Ethnicity and Income
14% 13%20%
15% 17% 16% 19% 19% 18% 17%25% 23%
45% 43%
46%
43% 42%40%
41%48%
39% 39%
42%38%
41% 44%34%
41% 40% 44% 40%33%
43% 44%34%
40%
0%
10%
20%
30%
40%
50%
60%
70%
80%
90%
100%
All White Black* Hispanic All White Black Hispanic* All White Black* Hispanic
Less than $35,000 $35,000-$74,999 $75,000 or more
Very Confident Somewhat Confident Not Confident
Source: Employee Benefit Research Institute and Greenwald Research 2021 Retirement Confidence Survey.
How confident are you that the Social Security system will continue to provide benefits
of at least equal value to the benefits received by retirees today?
Total: Workers n=1,507, Retirees n=1,510

ebri.org Issue Brief • June 10, 2021 • No. 530 24
16% 14%21% 20% 18% 16% 19% 23% 20% 18%
28% 27%
43%41%
45%40% 45%
43%
48%48%
42% 43%
43%38%
41% 44%35%
40% 37% 41%33% 29%
38% 39%30%
34%
0%
10%
20%
30%
40%
50%
60%
70%
80%
90%
100%
All White Black* Hispanic All White Black Hispanic* All White Black* Hispanic
Less than $35,000 $35,000-$74,999 $75,000 or more
Very Confident Somewhat Confident Not Confident
Source: Employee Benefit Research Institute and Greenwald Research 2021 Retirement Confidence Survey.
How confident are you that the Medicare system will continue to provide
benefits of at least equal value to the benefits received by retirees today?
Total: Workers n=1,507, Retirees n=1,510
Figure 27
Confidence in Medicare Continuing to Provide Benefits of at Least
Equal to Those Received Now, by Race/Ethnicity and Income
21% 21%25%
20%28% 30%
25% 26%
35% 37% 34% 31%
33% 34%32%
31%
37%
42%
26% 27%
33%33%
29%31%
0%
10%
20%
30%
40%
50%
60%
70%
80%
All White Black Hispanic All White* Black Hispanic All White Black Hispanic
Less than $35,000 $35,000-$74,999 $75,000 or more
Strongly Agree Somewhat Agree
Source: Employee Benefit Research Institute and Greenwald Research 2021 Retirement Confidence Survey.
To what extent do you agree or disagree with the following?
Your parents or in-laws are/were good at managing their money.
Total: Workers n=1,507, Retirees n=1,510
Figure 28
Percentage Who Agree That Their Parents Were Good at Managing Money,
by Race/Ethnicity and Income
Financial Background
In 2021, the RCS asked several questions about respondents’ parents for the first time, including the respondents’
perceptions of their parents’ financial skills and retirement experiences. Among middle-income respondents, White
Americans were more likely to agree that their parents were good at managing money compared with Black and
Hispanic Americans (Figure 28). In contrast, lower- and upper-income respondents across each race/ethnicity had no
significant differences in the percentages who agreed that their parents or in-laws were good at managing their money.
ebri.org Issue Brief • June 10, 2021 • No. 530 25
16% 16% 16% 17%23% 25%
21%24%
30% 31%
18%
27%
26% 27% 26% 24%
35%37%
27%
30%
35% 35%
35%
35%
0%
10%
20%
30%
40%
50%
60%
70%
All White Black Hispanic All White* Black Hispanic All White* Black Hispanic
Less than $35,000 $35,000-$74,999 $75,000 or more
Strongly Agree Somewhat Agree
Source: Employee Benefit Research Institute and Greenwald Research 2021 Retirement Confidence Survey.
To what extent do you agree or disagree with the following?
Your parents had or are having a financially comfortable retirement.
Total: Workers n=1,507, Retirees n=1,510
Figure 29
Percentage Who Agree That Their Parents Had or Are Having a Financially
Comfortable Retirement, by Race/Ethnicity and Income
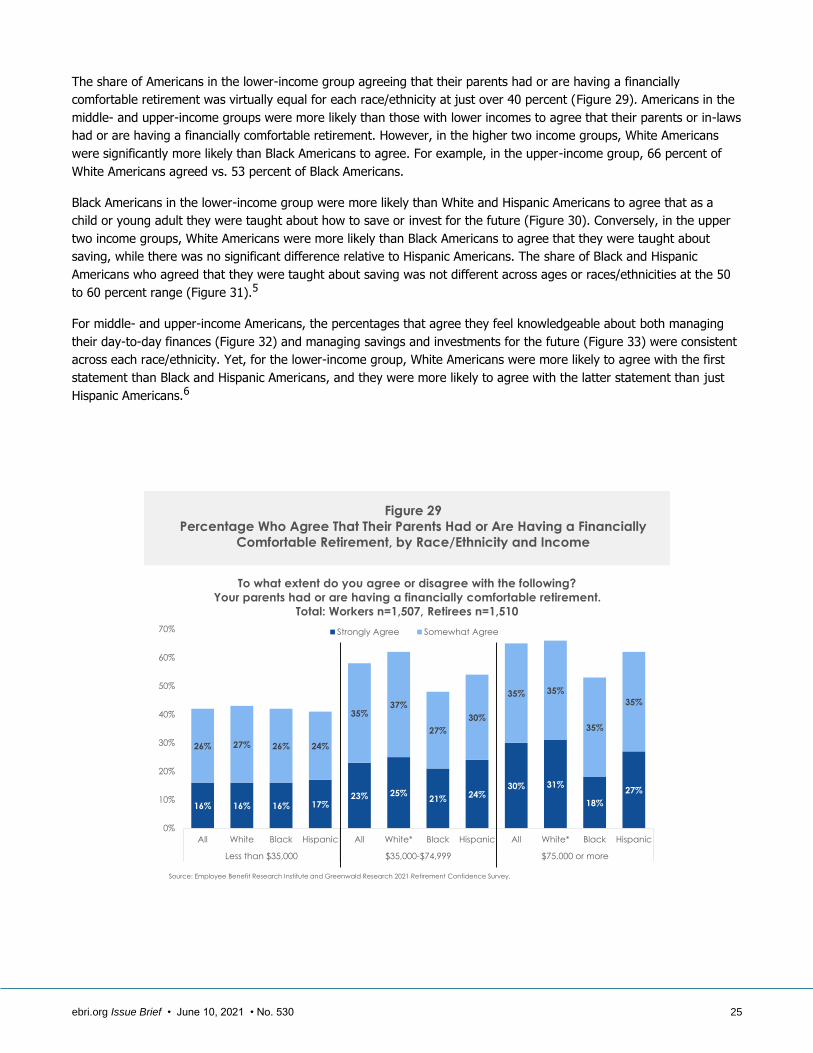
The share of Americans in the lower-income group agreeing that their parents had or are having a financially
comfortable retirement was virtually equal for each race/ethnicity at just over 40 percent (Figure 29). Americans in the
middle- and upper-income groups were more likely than those with lower incomes to agree that their parents or in-laws
had or are having a financially comfortable retirement. However, in the higher two income groups, White Americans
were significantly more likely than Black Americans to agree. For example, in the upper-income group, 66 percent of
White Americans agreed vs. 53 percent of Black Americans.
Black Americans in the lower-income group were more likely than White and Hispanic Americans to agree that as a
child or young adult they were taught about how to save or invest for the future (Figure 30). Conversely, in the upper
two income groups, White Americans were more likely than Black Americans to agree that they were taught about
saving, while there was no significant difference relative to Hispanic Americans. The share of Black and Hispanic
Americans who agreed that they were taught about saving was not different across ages or races/ethnicities at the 50
to 60 percent range (Figure 31).5
For middle- and upper-income Americans, the percentages that agree they feel knowledgeable about both managing
their day-to-day finances (Figure 32) and managing savings and investments for the future (Figure 33) were consistent
across each race/ethnicity. Yet, for the lower-income group, White Americans were more likely to agree with the first
statement than Black and Hispanic Americans, and they were more likely to agree with the latter statement than just
Hispanic Americans.6

ebri.org Issue Brief • June 10, 2021 • No. 530 26
17%13%
22% 19%24% 24%
20%27%
32% 33%29% 26%
31%33%
33%
25%
38% 40%
32%
36%
36% 37%
32% 38%
0%
10%
20%
30%
40%
50%
60%
70%
80%
All White Black* Hispanic All White* Black Hispanic All White* Black Hispanic
Less than $35,000 $35,000-$74,999 $75,000 or more
Strongly Agree Somewhat Agree
Source: Employee Benefit Research Institute and Greenwald Research 2021 Retirement Confidence Survey.
To what extent do you agree or disagree with the following?
As a child or young adult, you were taught how to save and invest for the future.
Total: Workers n=1,507, Retirees n=1,510
Figure 30
Percentage Who Agree That They Were Taught How to Save and Invest for
the Future as a Child, by Race/Ethnicity and Income
59%
54%52%
58% 58%
62%60%
55%
51%
63%
0%
10%
20%
30%
40%
50%
60%
70%
25-34 35-44 45-54 55-64 65 or older
Black Hispanic
Source: Employee Benefit Research Institute and Greenwald Research 2021 Retirement Confidence Survey.
To what extent do you agree or disagree with the following?
As a child or young adult, you were taught how to save and invest for the future.
Black n=741, Hispanic n=731, Percentage Somewhat or Strongly Agreeing
Figure 31
Percentage of Black and Hispanic Americans Who Agree That They Were
Taught How to Save and Invest for the Future as a Child, by Age

ebri.org Issue Brief • June 10, 2021 • No. 530 27
77%
84%
70%67%
81% 82%
75%80%
87% 88%83%
87%
0%
10%
20%
30%
40%
50%
60%
70%
80%
90%
100%
All White* Black Hispanic All White Black Hispanic All White Black Hispanic
Less than $35,000 $35,000-$74,999 $75,000 or more
Source: Employee Benefit Research Institute and Greenwald Research 2021 Retirement Confidence Survey.
To what extent do you agree or disagree with the following?You feel knowledgeable about managing your day-to-day finances.
Workers n=1,507, Retirees n=1,510, Percentage Strongly or Somewhat Agree
Figure 32
Percentage Who Agree They Are Knowledgeable About Managing
Their Day-to-Day Finances, by Race/Ethnicity and Income
57%61%
58%
50%
73% 74%70% 70%
79%81%
77%75%
0%
10%
20%
30%
40%
50%
60%
70%
80%
90%
All White* Black Hispanic All White Black Hispanic All White Black Hispanic
Less than $35,000 $35,000-$74,999 $75,000 or more
Source: Employee Benefit Research Institute and Greenwald Research 2021 Retirement Confidence Survey.
To what extent do you agree or disagree with the following?You feel knowledgeable about managing savings and investments for the future.
Workers n=1,507, Retirees n=1,510, Percentage Strongly or Somewhat Agree
Figure 33
Percentage Who Agree They Are Knowledgeable About Managing
Investments for the Future, by Race/Ethnicity and Income

ebri.org Issue Brief • June 10, 2021 • No. 530 28
Source: Employee Benefit Research Institute and Greenwald Research 2021 Retirement Confidence Survey.
To what extent do you agree or disagree with the following?You feel knowledgeable about managing your day-to-day finances.
Black n=741, Hispanic n=731, Percentage Somewhat or Strongly Agree
Figure 34
Percentage Who Agree They Are Knowledgeable About Managing
Their Day-to-Day Finances, by Race/Ethnicity and Age
67% 68% 69%
87%89%
77% 77% 77%
85%88%
0%
10%
20%
30%
40%
50%
60%
70%
80%
90%
100%
25-34 35-44 45-54 55-64* 65 or older*^
Black* Hispanic^
For Black and Hispanic Americans, the likelihood of agreeing that they feel knowledgeable about day-to-day finances
and about managing investments for the future was higher for those older but similar at each age between the two
tasks (Figure 34 and Figure 35). Specifically, Black Americans ages 55 or older were more likely to agree that they feel
knowledgeable about day-to-day finances compared with Black Americans younger than age 55, and Hispanic
Americans ages 65 or older were more likely to agree with this statement than those younger than age 55. Again, Black
Americans ages 55 or older were likely to agree that they feel knowledgeable about managing investments for the
future compared with those ages 35–54, while Hispanic Americans ages 35 or older had no significant differences in
agreeing with this statement and were more likely to agree than those younger than age 35.

ebri.org Issue Brief • June 10, 2021 • No. 530 29
Source: Employee Benefit Research Institute and Greenwald Research 2021 Retirement Confidence Survey.
To what extent do you agree or disagree with the following?You feel knowledgeable about managing savings and investments for the future.
Black n=741, Hispanic n=731, Percentage Somewhat or Strongly Agree
Figure 35
Percentage Who Agree They Are Knowledgeable About Managing
Investments for the Future, by Race/Ethnicity and Age
74%
62% 61%
66%
75%
56%
71%73%
71%
76%
0%
10%
20%
30%
40%
50%
60%
70%
80%
25-34^ 35-44 45-54 55-64 65 or older*
Black* Hispanic^
Financial Priorities
Turning to questions on priorities relative to retirement savings, upper-income Black Americans and Hispanic Americans
regardless of income were more likely to agree that it is more important to help friends and family now than to save for
their own retirement than were White Americans (Figure 36). In the upper-income group, nearly one-half of Hispanic
Americans agreed with this statement compared with one-third of White Americans. The likelihood of agreeing that
helping friends and family is more important than saving for retirement was even higher for younger (those less than
age 55) Black and Hispanic Americans (Figure 37). For example, 56 percent of Black Americans ages 35–44 and 51
percent of Hispanic Americans these same ages compared with 27 percent of Black Americans and 35 percent of
Hispanic Americans ages 55–64 agreed helping friends and family was more important than saving for retirement.
Middle- and upper-income Hispanic Americans were more likely to agree with the statement that retirement savings is
not a priority relative to the current needs of their family than White Americans were in these income groups (Figure
38). Middle-income Black Americans were also more likely to agree with this statement than middle-income White
Americans. However, in the lowest income groups, there were no significant differences by race/ethnicity in the
likelihood of agreeing that retirement savings is not a priority. Again, younger Black (ages 25–34) and Hispanic (ages
25–44) Americans were more likely to agree that saving for retirement is not a priority relative to older workers (Figure
39). Specifically, for Black Americans, those ages 25–34 (54 percent) were more likely to have agreed with this
statement compared with the one-third of those ages 45 or older. The approximately one-half of Hispanic Americans
younger than age 45 who agreed with retirement savings not being a priority was higher than the 3 in 10 ages 55 or
older agreeing. For Hispanic Americans who were born in the United States, those in the upper-income group were
more likely to agree with the statement than those born outside the United States (Figure 40).
Hispanic Americans in each income group and Black Americans in the lower- and upper-income groups were more likely
than White Americans to agree that saving for a child's education or paying off a child's education is reducing how
much they can save for retirement (Figure 41). In addition, male Black and Hispanic Americans were more likely than
their female counterparts to agree that a child’s education is reducing their retirement savings, but marital status was
not found to be significant (Figure 42).
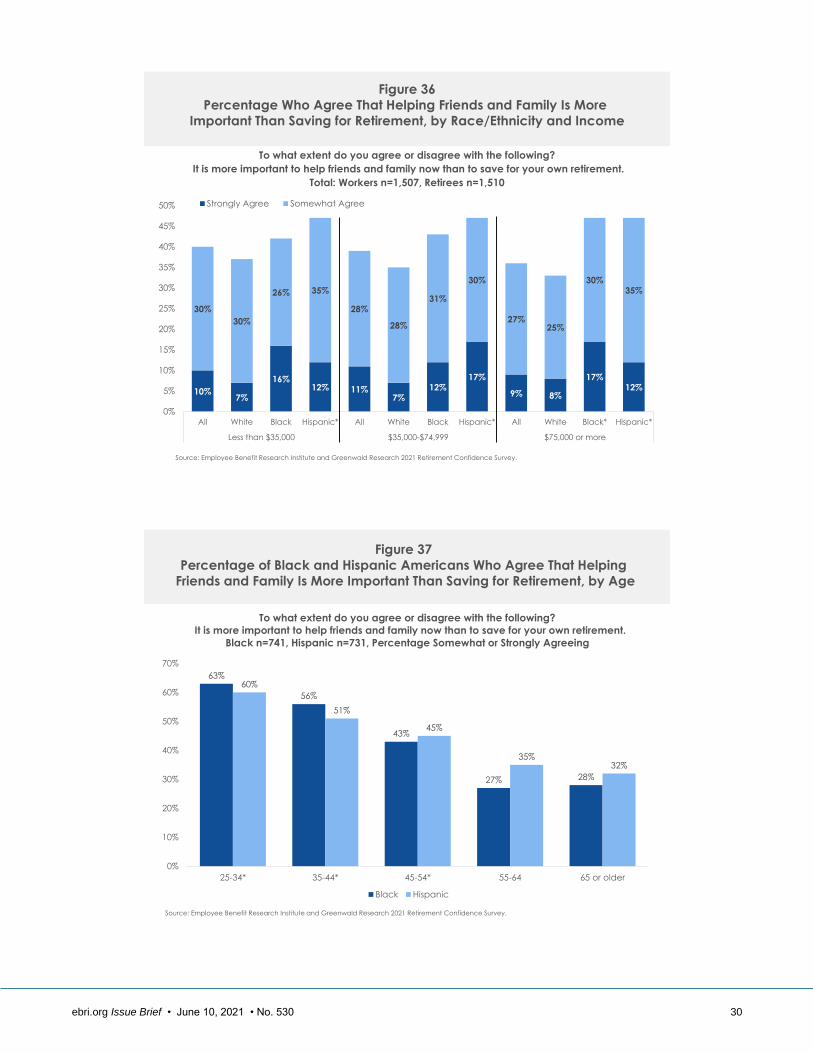
ebri.org Issue Brief • June 10, 2021 • No. 530 30
10%7%
16%12% 11%
7%12%
17%
9% 8%
17%12%
30%
30%
26% 35%
28%
28%
31%
30%
27%25%
30%35%
0%
5%
10%
15%
20%
25%
30%
35%
40%
45%
50%
All White Black Hispanic* All White Black Hispanic* All White Black* Hispanic*
Less than $35,000 $35,000-$74,999 $75,000 or more
Strongly Agree Somewhat Agree
Source: Employee Benefit Research Institute and Greenwald Research 2021 Retirement Confidence Survey.
To what extent do you agree or disagree with the following?
It is more important to help friends and family now than to save for your own retirement.
Total: Workers n=1,507, Retirees n=1,510
Figure 36
Percentage Who Agree That Helping Friends and Family Is More
Important Than Saving for Retirement, by Race/Ethnicity and Income
63%
56%
43%
27% 28%
60%
51%
45%
35%32%
0%
10%
20%
30%
40%
50%
60%
70%
25-34* 35-44* 45-54* 55-64 65 or older
Black Hispanic
To what extent do you agree or disagree with the following?
It is more important to help friends and family now than to save for your own retirement.
Black n=741, Hispanic n=731, Percentage Somewhat or Strongly Agreeing
Source: Employee Benefit Research Institute and Greenwald Research 2021 Retirement Confidence Survey.
Figure 37
Percentage of Black and Hispanic Americans Who Agree That Helping
Friends and Family Is More Important Than Saving for Retirement, by Age

ebri.org Issue Brief • June 10, 2021 • No. 530 31
13% 13% 14% 15% 13%10%
15%19%
8% 7%10%
14%
27% 27% 27%29%
23%
20%
30%
28%
22% 22%
22%
28%
0%
5%
10%
15%
20%
25%
30%
35%
40%
45%
50%
All White Black Hispanic All White Black* Hispanic* All White Black Hispanic*
Less than $35,000 $35,000-$74,999 $75,000 or more
Strongly Agree Somewhat Agree
Source: Employee Benefit Research Institute and Greenwald Research 2021 Retirement Confidence Survey.
To what extent do you agree or disagree with the following?
Retirement savings is not a priority relative to the current needs of my family.
Total: Workers n=1,507, Retirees n=1,510
Figure 38
Percentage Who Agree That Retirement Savings Is Not a
Priority Relative to Current Needs, by Race/Ethnicity and Income
54%
41%
32% 33% 32%
55%
48%
43%
30%32%
0%
10%
20%
30%
40%
50%
60%
25-34*^ 35-44^ 45-54 55-64 65 or older
Black* Hispanic^
Source: Employee Benefit Research Institute and Greenwald Research 2021 Retirement Confidence Survey.
To what extent do you agree or disagree with the following?
Retirement savings is not a priority relative to the current needs of my family.
Black n=741, Hispanic n=731, Percentage Somewhat or Strongly Agreeing
Figure 39
Percentage of Black and Hispanic Americans Who Agree That Retirement
Savings Is Not a Priority Relative to Current Needs, by Age
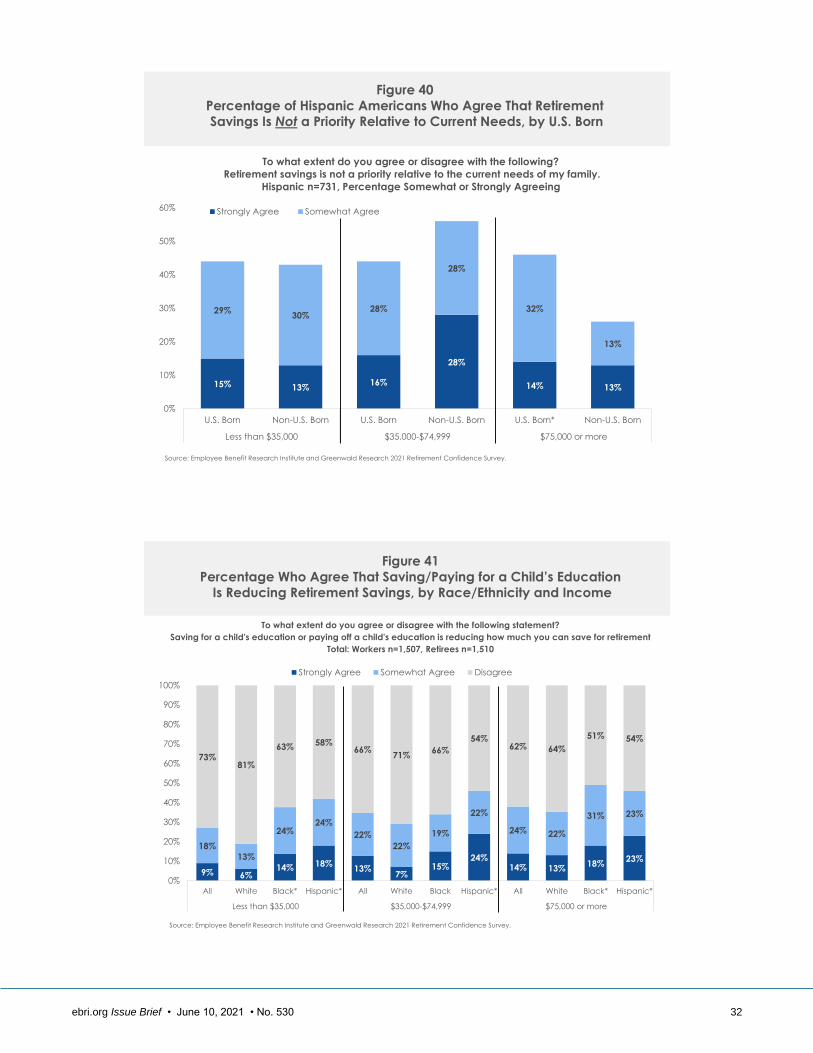
ebri.org Issue Brief • June 10, 2021 • No. 530 32
15% 13%16%
28%
14% 13%
29%30%
28%
28%
32%
13%
0%
10%
20%
30%
40%
50%
60%
U.S. Born Non-U.S. Born U.S. Born Non-U.S. Born U.S. Born* Non-U.S. Born
Less than $35,000 $35,000-$74,999 $75,000 or more
Strongly Agree Somewhat Agree
Source: Employee Benefit Research Institute and Greenwald Research 2021 Retirement Confidence Survey.
To what extent do you agree or disagree with the following?
Retirement savings is not a priority relative to the current needs of my family.
Hispanic n=731, Percentage Somewhat or Strongly Agreeing
Figure 40
Percentage of Hispanic Americans Who Agree That Retirement
Savings Is Not a Priority Relative to Current Needs, by U.S. Born
9% 6%14% 18%
13%7%
15%24%
14% 13%18%
23%
18%
13%
24%24%
22%
22%
19%
22%
24% 22%
31% 23%
73%81%
63%58%
66%71%
66%
54%62% 64%
51% 54%
0%
10%
20%
30%
40%
50%
60%
70%
80%
90%
100%
All White Black* Hispanic* All White Black Hispanic* All White Black* Hispanic*
Less than $35,000 $35,000-$74,999 $75,000 or more
Strongly Agree Somewhat Agree Disagree
Source: Employee Benefit Research Institute and Greenwald Research 2021 Retirement Confidence Survey.
To what extent do you agree or disagree with the following statement?
Saving for a child's education or paying off a child's education is reducing how much you can save for retirement
Total: Workers n=1,507, Retirees n=1,510
Figure 41
Percentage Who Agree That Saving/Paying for a Child’s Education
Is Reducing Retirement Savings, by Race/Ethnicity and Income

ebri.org Issue Brief • June 10, 2021 • No. 530 33
20%12% 13% 17%
22% 22%28%
17%23% 21%
25%
24%31% 21%
22% 27%24%
22%
25%21%
54%64%
56%62%
56% 52% 48%
61%52%
58%
0%
10%
20%
30%
40%
50%
60%
70%
80%
90%
100%
Male* Female Married Not
Married
U.S. Born Non-U.S.
Born
Male* Female Married Not
Married
Black Hispanic
Strongly Agree Somewhat Agree Disagree
Source: Employee Benefit Research Institute and Greenwald Research 2021 Retirement Confidence Survey.
To what extent do you agree or disagree with the following statement?
Saving for a child's education or paying off a child's education is reducing how much you can save for retirement
Black n=741, Hispanic n=731
Figure 42Percentage of Black and Hispanic Americans Who Agree That Saving/Paying for a Child’s Education Is Reducing Retirement
Savings, by Gender, Marital Status, and U.S. Born
27%
23%
28%
32%
23%
20%
35%
28%
16%
13%
25%
19%
0%
5%
10%
15%
20%
25%
30%
35%
40%
All White Black Hispanic* All White Black* Hispanic* All White Black* Hispanic
Less than $35,000 $35,000-$74,999 $75,000 or more
Source: Employee Benefit Research Institute and Greenwald Research 2021 Retirement Confidence Survey.
To what extent do you agree or disagree with the following?
You feel you have been fairly treated by financial services companies and their representatives.
Total: Workers n=1,507, Retirees n=1,510, Percentage Disagree
Figure 43
Percentage Who Feel They Have Not Been Treated Fairly by
Financial Services Companies, by Race/Ethnicity and Income
Experience With Financial Services Companies
Feeling comfortable accessing the financial system can help individuals start or stick with financial or retirement
planning. However, some Americans do not feel they have been treated fairly by financial services companies. In fact,
approximately one-quarter of all Americans in the lower two income groups disagree with the statement that they feel
they have been fairly treated by financial services companies and their representatives (Figure 43). Hispanic Americans
in the lower two income groups were more likely to disagree that they were treated fairly than White Americans,
whereas Black Americans in the higher two income groups were more likely to feel this way relative to White
Americans.
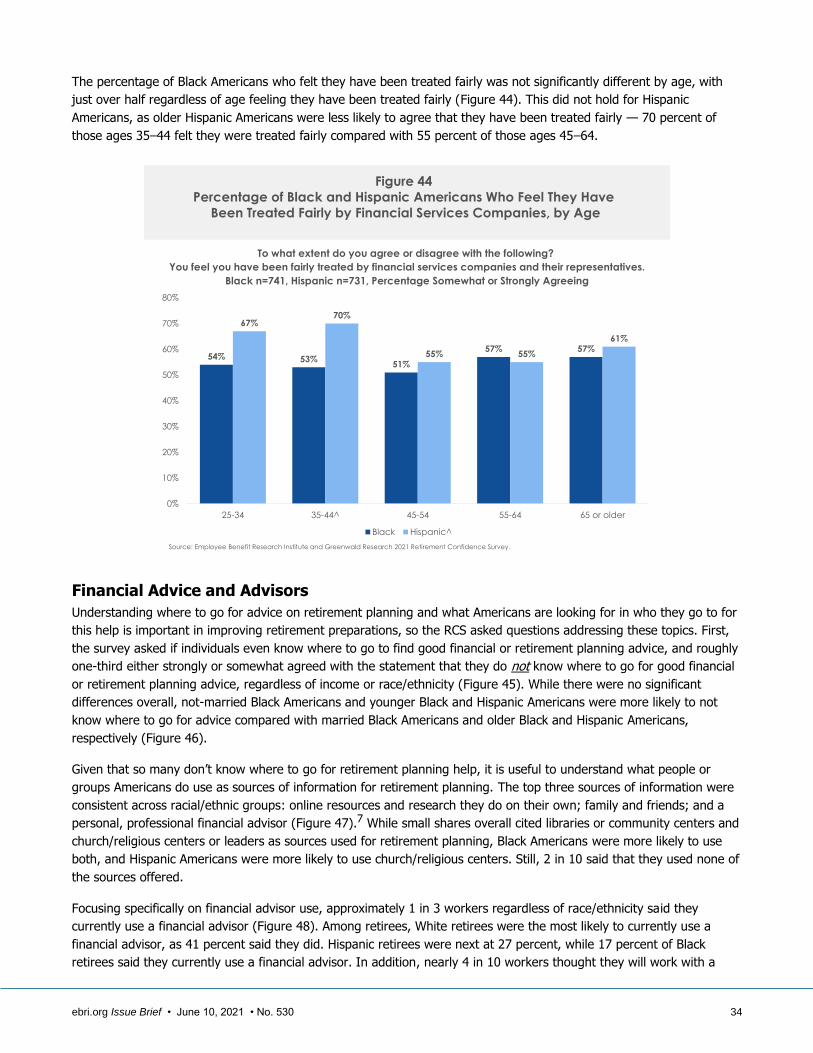
ebri.org Issue Brief • June 10, 2021 • No. 530 34
54% 53%51%
57% 57%
67%70%
55% 55%
61%
0%
10%
20%
30%
40%
50%
60%
70%
80%
25-34 35-44^ 45-54 55-64 65 or older
Black Hispanic^
Source: Employee Benefit Research Institute and Greenwald Research 2021 Retirement Confidence Survey.
To what extent do you agree or disagree with the following?
You feel you have been fairly treated by financial services companies and their representatives.
Black n=741, Hispanic n=731, Percentage Somewhat or Strongly Agreeing
Figure 44
Percentage of Black and Hispanic Americans Who Feel They Have
Been Treated Fairly by Financial Services Companies, by Age
The percentage of Black Americans who felt they have been treated fairly was not significantly different by age, with
just over half regardless of age feeling they have been treated fairly (Figure 44). This did not hold for Hispanic
Americans, as older Hispanic Americans were less likely to agree that they have been treated fairly — 70 percent of
those ages 35–44 felt they were treated fairly compared with 55 percent of those ages 45–64.
Financial Advice and Advisors
Understanding where to go for advice on retirement planning and what Americans are looking for in who they go to for
this help is important in improving retirement preparations, so the RCS asked questions addressing these topics. First,
the survey asked if individuals even know where to go to find good financial or retirement planning advice, and roughly
one-third either strongly or somewhat agreed with the statement that they do not know where to go for good financial
or retirement planning advice, regardless of income or race/ethnicity (Figure 45). While there were no significant
differences overall, not-married Black Americans and younger Black and Hispanic Americans were more likely to not
know where to go for advice compared with married Black Americans and older Black and Hispanic Americans,
respectively (Figure 46).
Given that so many don’t know where to go for retirement planning help, it is useful to understand what people or
groups Americans do use as sources of information for retirement planning. The top three sources of information were
consistent across racial/ethnic groups: online resources and research they do on their own; family and friends; and a
personal, professional financial advisor (Figure 47).7 While small shares overall cited libraries or community centers and
church/religious centers or leaders as sources used for retirement planning, Black Americans were more likely to use
both, and Hispanic Americans were more likely to use church/religious centers. Still, 2 in 10 said that they used none of
the sources offered.
Focusing specifically on financial advisor use, approximately 1 in 3 workers regardless of race/ethnicity said they
currently use a financial advisor (Figure 48). Among retirees, White retirees were the most likely to currently use a
financial advisor, as 41 percent said they did. Hispanic retirees were next at 27 percent, while 17 percent of Black
retirees said they currently use a financial advisor. In addition, nearly 4 in 10 workers thought they will work with a
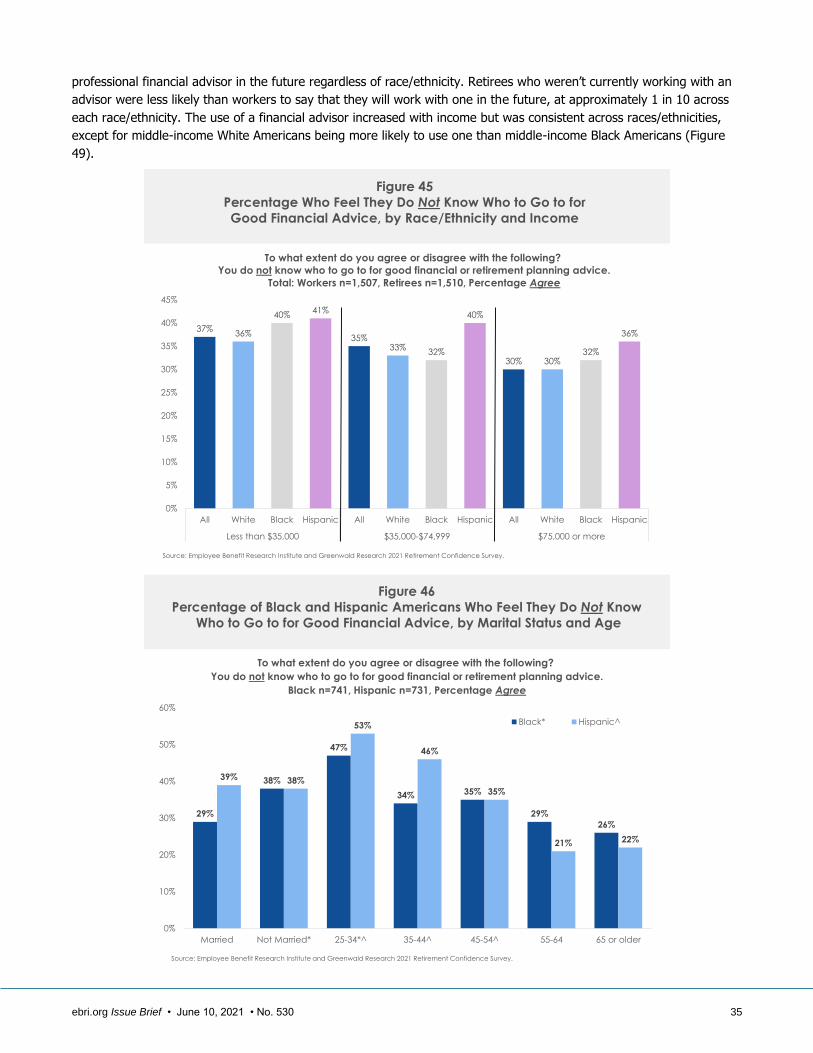
ebri.org Issue Brief • June 10, 2021 • No. 530 35
37%36%
40%41%
35%33%
32%
40%
30% 30%32%
36%
0%
5%
10%
15%
20%
25%
30%
35%
40%
45%
All White Black Hispanic All White Black Hispanic All White Black Hispanic
Less than $35,000 $35,000-$74,999 $75,000 or more
Source: Employee Benefit Research Institute and Greenwald Research 2021 Retirement Confidence Survey.
To what extent do you agree or disagree with the following?
You do not know who to go to for good financial or retirement planning advice.
Total: Workers n=1,507, Retirees n=1,510, Percentage Agree
Figure 45
Percentage Who Feel They Do Not Know Who to Go to for
Good Financial Advice, by Race/Ethnicity and Income
29%
38%
47%
34% 35%
29%
26%
39% 38%
53%
46%
35%
21% 22%
0%
10%
20%
30%
40%
50%
60%
Married Not Married* 25-34*^ 35-44^ 45-54^ 55-64 65 or older
Black* Hispanic^
Source: Employee Benefit Research Institute and Greenwald Research 2021 Retirement Confidence Survey.
To what extent do you agree or disagree with the following?
You do not know who to go to for good financial or retirement planning advice.
Black n=741, Hispanic n=731, Percentage Agree
Figure 46
Percentage of Black and Hispanic Americans Who Feel They Do Not Know
Who to Go to for Good Financial Advice, by Marital Status and Age
professional financial advisor in the future regardless of race/ethnicity. Retirees who weren’t currently working with an
advisor were less likely than workers to say that they will work with one in the future, at approximately 1 in 10 across
each race/ethnicity. The use of a financial advisor increased with income but was consistent across races/ethnicities,
except for middle-income White Americans being more likely to use one than middle-income Black Americans (Figure
49).

ebri.org Issue Brief • June 10, 2021 • No. 530 36
42%
38%
38%
38%
33%
25%
35%
33%
0% 10% 20% 30% 40% 50%
Hispanic
Black
White
All
Hispanic*
Black
White*
All
Thin
ks
will
wo
rk w
ith
a
pro
fess
ion
al f
ina
nc
ial
ad
vis
or
in t
he
fu
ture
Cu
rre
ntly w
ork
with
a
pro
fess
ion
al f
ina
nc
ial
ad
vis
or
Workers
14%
15%
8%
10%
27%
17%
41%
36%
0% 10% 20% 30% 40% 50%
Hispanic*
Black*
White
All
Hispanic*
Black
White*
All
Thin
ks
will
wo
rk w
ith
a
pro
fess
ion
al f
ina
nc
ial
ad
vis
or
in t
he
fu
ture
Cu
rre
ntly w
ork
with
a
pro
fess
ion
al f
ina
nc
ial
ad
vis
or
Retirees
Do you currently work with a professional financial advisor? Workers n=1,507, Retirees n=1,510, Percentage Yes
Do you think you will work with a professional financial advisor in the future? Workers n=1,065, Retirees n=1,023
Figure 48
Percentage Who Work With a Professional Financial Advisor,
by Race/Ethnicity
Source: Employee Benefit Research Institute and Greenwald Research 2021 Retirement Confidence Survey.
17%
3%
8%
6%
16%
19%
20%
23%
29%
32%
33%
22%
4%
9%
10%
12%
16%
19%
23%
24%
28%
31%
21%
3%
4%
4%
13%
13%
14%
18%
31%
32%
32%
0% 5% 10% 15% 20% 25% 30% 35%
None of these
Other
Church/religious centers or leaders
Libraries or community centers
Financial experts or gurus in the media
Online advice or advisors that provide guidance based on
formulas
Representatives from your workplace retirement plan
provider
Your employer or information you receive at work
A personal, professional financial advisor
Family and friends
Online resources and research you do on your own
White Black Hispanic
Which of the following people or groups do you use as a source of information for retirement planning?
Total: Workers n=1,507, Retirees n=1,510
Source: Employee Benefit Research Institute and Greenwald Research 2021 Retirement Confidence Survey.
Figure 47
Sources of Information Used for Retirement Planning,
by Race/Ethnicity
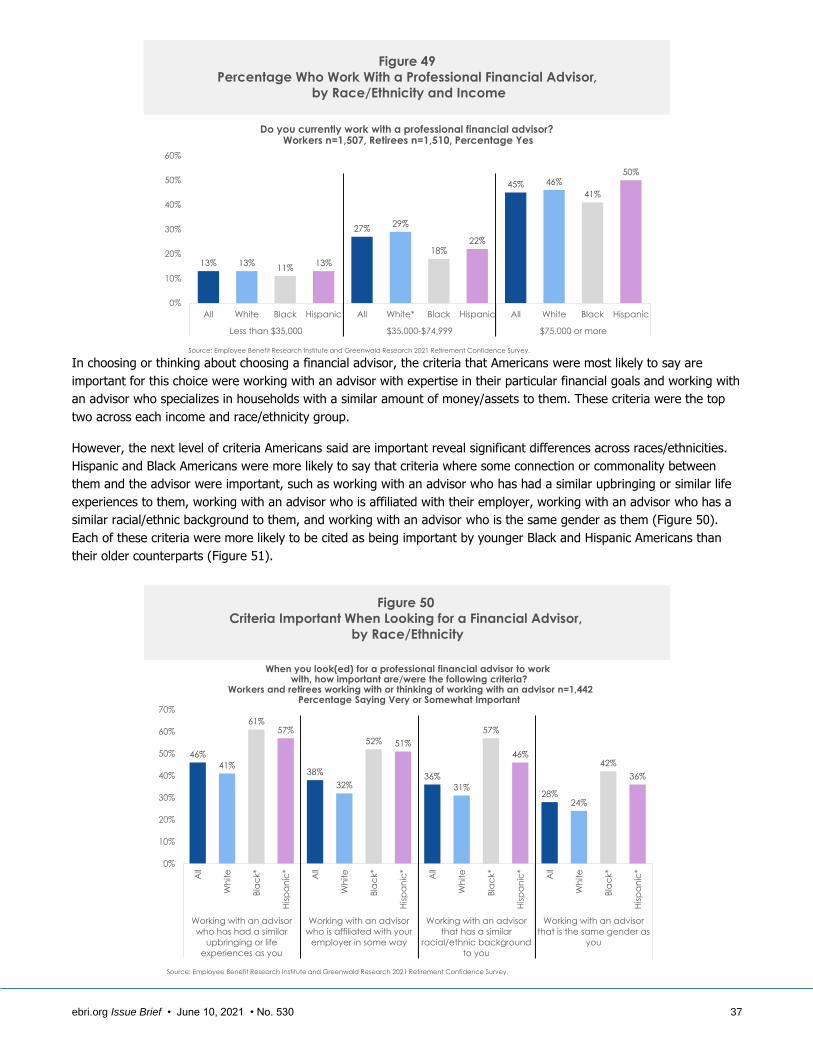
ebri.org Issue Brief • June 10, 2021 • No. 530 37
13% 13%11%
13%
27%29%
18%22%
45% 46%
41%
50%
0%
10%
20%
30%
40%
50%
60%
All White Black Hispanic All White* Black Hispanic All White Black Hispanic
Less than $35,000 $35,000-$74,999 $75,000 or more
Do you currently work with a professional financial advisor?Workers n=1,507, Retirees n=1,510, Percentage Yes
Source: Employee Benefit Research Institute and Greenwald Research 2021 Retirement Confidence Survey.
Figure 49
Percentage Who Work With a Professional Financial Advisor,
by Race/Ethnicity and Income
46%
41%
61%57%
38%
32%
52% 51%
36%
31%
57%
46%
28%24%
42%
36%
0%
10%
20%
30%
40%
50%
60%
70%
All
Wh
ite
Bla
ck*
His
pa
nic
*
All
Wh
ite
Bla
ck*
His
pa
nic
*
All
Wh
ite
Bla
ck*
His
pa
nic
*
All
Wh
ite
Bla
ck*
His
pa
nic
*
Working with an advisor
who has had a similar
upbringing or life
experiences as you
Working with an advisor
who is affiliated with your
employer in some way
Working with an advisor
that has a similar
racial/ethnic background
to you
Working with an advisor
that is the same gender as
you
Source: Employee Benefit Research Institute and Greenwald Research 2021 Retirement Confidence Survey.
When you look(ed) for a professional financial advisor to work with, how important are/were the following criteria?
Workers and retirees working with or thinking of working with an advisor n=1,442Percentage Saying Very or Somewhat Important
Figure 50
Criteria Important When Looking for a Financial Advisor,
by Race/Ethnicity
In choosing or thinking about choosing a financial advisor, the criteria that Americans were most likely to say are
important for this choice were working with an advisor with expertise in their particular financial goals and working with
an advisor who specializes in households with a similar amount of money/assets to them. These criteria were the top
two across each income and race/ethnicity group.
However, the next level of criteria Americans said are important reveal significant differences across races/ethnicities.
Hispanic and Black Americans were more likely to say that criteria where some connection or commonality between
them and the advisor were important, such as working with an advisor who has had a similar upbringing or similar life
experiences to them, working with an advisor who is affiliated with their employer, working with an advisor who has a
similar racial/ethnic background to them, and working with an advisor who is the same gender as them (Figure 50).
Each of these criteria were more likely to be cited as being important by younger Black and Hispanic Americans than
their older counterparts (Figure 51).

ebri.org Issue Brief • June 10, 2021 • No. 530 38
80%
60%
54%
34% 33%
69%
48%
34%
13%
19%
57% 57%
43%
24%
17%
46%43%
39%
19%
6%
0%
10%
20%
30%
40%
50%
60%
70%
80%
90%
25-34*^ 35-44*^ 45-54*^ 55-64 65 or older 25-34*^ 35-44*^ 45-54*^ 55-64^ 65 or older
Working with an advisor that has a similar racial/ethnic
background to you
Working with an advisor that is the same gender as
you
Black* Hispanic^
Source: Employee Benefit Research Institute and Greenwald Research 2021 Retirement Confidence Survey.
When you look(ed) for a professional financial advisor to work with, how important are/were the following criteria?
Those working with or thinking of working with an advisor, Black n=296, Hispanic n=357Percentage Saying Very or Somewhat Important
Figure 51
Criteria Important for Black and Hispanic Americans When Looking for
a Financial Advisor, by Age
75%
50% 49%
32%26%
86%
63%
53%
36%39%
58%
66%63%
29%
14%
64%
71%
54%
43%
28%
0%
10%
20%
30%
40%
50%
60%
70%
80%
90%
100%
25-34*^ 35-44*^ 45-54*^ 55-64^ 65 or older 25-34*^ 35-44*^ 45-54^ 55-64 65 or older
Working with an advisor who is affiliated with your
employer in some way
Working with an advisor who has had a similar
upbringing or life experiences as you
Black* Hispanic^
Source: Employee Benefit Research Institute and Greenwald Research 2021 Retirement Confidence Survey.
When you look(ed) for a professional financial advisor to work with, how important are/were the following criteria?
Those working with or thinking of working with an advisor, Black n=296, Hispanic n=357Percentage Saying Very or Somewhat Important
Figure 51 (cont.)
Criteria Important for Black and Hispanic Americans When Looking for
a Financial Advisor, by Age
Savings and Preparations
One of the most basic tasks of retirement planning is doing a retirement needs calculation. As a whole, only half report
having done this basic step — figuring out how much money they will need to have saved by the time they retire so
that they can live comfortably in retirement. The likelihood of doing this calculation did go up with income, but within
each income group, the likelihood of doing so for each race/ethnicity was only significantly different in one of them
(Figure 52). Hispanic Americans with lower incomes were more likely to report having done this calculation than White
Americans (32 percent vs. 22 percent). Among Black and Hispanic Americans, those both married and male were more
likely to have tried to figure out how much they need to save for retirement (Figure 53). However, these differences by
marital status and gender were not significant across all incomes, as only middle-income Black males were significantly
more likely to have done a retirement needs calculation than were Black females (Figure 54). Marital status differences
were only significantly higher for the lower-income married Black Americans and upper-income married Hispanic
Americans.
Those doing this first step were more confident they will have enough money to live comfortably throughout their
retirement years (Figure 55). In fact, the percentage of those who figured out how much money they need for
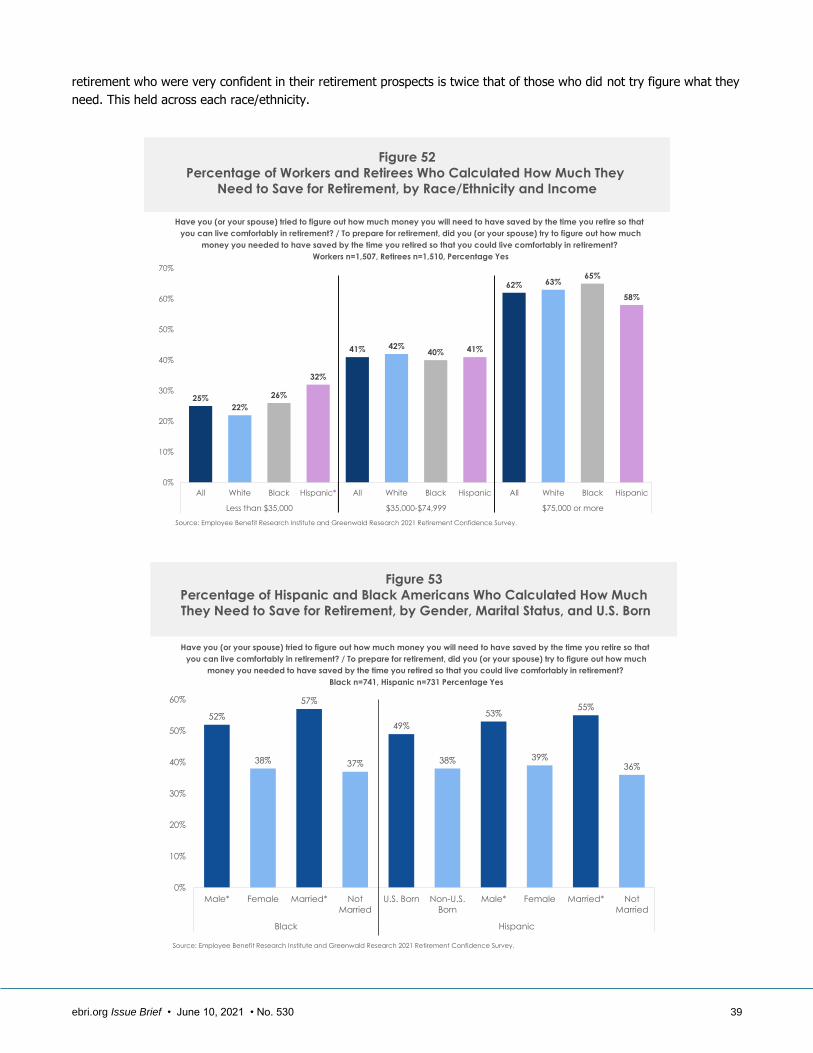
ebri.org Issue Brief • June 10, 2021 • No. 530 39
25%22%
26%
32%
41% 42%40% 41%
62% 63%65%
58%
0%
10%
20%
30%
40%
50%
60%
70%
All White Black Hispanic* All White Black Hispanic All White Black Hispanic
Less than $35,000 $35,000-$74,999 $75,000 or more
Source: Employee Benefit Research Institute and Greenwald Research 2021 Retirement Confidence Survey.
Have you (or your spouse) tried to figure out how much money you will need to have saved by the time you retire so that
you can live comfortably in retirement? / To prepare for retirement, did you (or your spouse) try to figure out how much
money you needed to have saved by the time you retired so that you could live comfortably in retirement?
Workers n=1,507, Retirees n=1,510, Percentage Yes
Figure 52
Percentage of Workers and Retirees Who Calculated How Much They
Need to Save for Retirement, by Race/Ethnicity and Income
52%
38%
57%
37%
49%
38%
53%
39%
55%
36%
0%
10%
20%
30%
40%
50%
60%
Male* Female Married* Not
Married
U.S. Born Non-U.S.
Born
Male* Female Married* Not
Married
Black Hispanic
Source: Employee Benefit Research Institute and Greenwald Research 2021 Retirement Confidence Survey.
Have you (or your spouse) tried to figure out how much money you will need to have saved by the time you retire so that
you can live comfortably in retirement? / To prepare for retirement, did you (or your spouse) try to figure out how much
money you needed to have saved by the time you retired so that you could live comfortably in retirement?
Black n=741, Hispanic n=731 Percentage Yes
Figure 53
Percentage of Hispanic and Black Americans Who Calculated How Much
They Need to Save for Retirement, by Gender, Marital Status, and U.S. Born
retirement who were very confident in their retirement prospects is twice that of those who did not try figure what they
need. This held across each race/ethnicity.

ebri.org Issue Brief • June 10, 2021 • No. 530 40
33%
20%
44%
22%
58%
29%
45%
38%
65% 65% 65% 64%
37%
31%
38%
31%
47%
35%
45%
37%
62%
51%
63%
41%
0%
10%
20%
30%
40%
50%
60%
70%
Male Female Married* Not
Married
Male* Female Married Not
Married
Male Female Married^ Not
Married
Less than $35,000 $35,000-$74,000 $75,000 or more
Black* Hispanic^
Have you (or your spouse) tried to figure out how much money you will need to have saved by the time you retire so that
you can live comfortably in retirement? / To prepare for retirement, did you (or your spouse) try to figure out how much
money you needed to have saved by the time you retired so that you could live comfortably in retirement?
Black n=741, Hispanic n=731, Percentage Yes
Figure 54
Percentage of Hispanic and Black Americans Who Calculated How Much
They Need to Save for Retirement, by Gender, Marital Status, and Income
Source: Employee Benefit Research Institute and Greenwald Research 2021 Retirement Confidence Survey.
Overall, how confident are you that you (and your spouse) will have enough
money to live comfortably throughout your retirement years?
Total: Workers n=1,507, Retirees n=1,510
Source: Employee Benefit Research Institute and Greenwald Research 2021 Retirement Confidence Survey.
Figure 55
Confidence in Having Enough Money to Live Comfortably Throughout
Retirement, by Race/Ethnicity and Done a Retirement Needs Calculation
44%
20%
45%
20%
43%
17%
43%
20%
45%
42%
45%
45%
38%
35%
42%
41%
9%
24%
8%
21%
14%
31%
12%
26%
3%14%
2%14%
5%17%
2%13%
0%
10%
20%
30%
40%
50%
60%
70%
80%
90%
100%
Yes* No Yes* No Yes* No Yes* No
All White Black Hispanic
Very Confident Somewhat Confident Not Too Confident Not at All Confident
Yes-they tried to figure how much money they need for retirement, No-they didn’t try

ebri.org Issue Brief • June 10, 2021 • No. 530 41
36%
42%
31%35%
67% 69%
63%
56%
88% 89%
78%
84%
0%
10%
20%
30%
40%
50%
60%
70%
80%
90%
100%
All White* Black Hispanic All White* Black Hispanic All White* Black Hispanic
Less than $35,000 $35,000-$74,999 $75,000 or more
Source: Employee Benefit Research Institute and Greenwald Research 2021 Retirement Confidence Survey.
Not including Social Security or employer-provided money, have you (or your spouse)
personally saved any money for retirement? / Not including Social Security or employer-provided
money, did you (or your spouse) personally save any money for retirement before you retired?
Total: Workers n=1,507, Retirees n=1,510
Figure 56
Percentage Who Have Ever Personally Saved for Retirement,
by Race/Ethnicity and Income
While the differences in taking the first step in preparing for retirement were minimal across the races/ethnicities, the
percentages who reported having ever personally saved for retirement do show significant differences, with White
Americans more likely to have done so than Black Americans in the lower- and upper-income groups and Hispanic
Americans in the middle-income group (Figure 56). However, there were no significant differences in having saved
between Black and Hispanic Americans.
When comparing the likelihood of having ever saved for retirement, differences between the genders emerged for
lower-income Black Americans, where males were more likely to have ever saved (Figure 57). No significant gender
differences resulted among the middle- and upper-income groups for each race/ethnicity. In contrast, there were
differences by marital status among Black and Hispanic Americans in the upper-income group; married Black and
Hispanic Americans were more likely to have saved for retirement than those not married (Figure 58). Among White
Americans, upper-income married respondents were more likely to have saved than those not married, but this
difference was not present among the two lower income groups.
An emergency or sudden large expense can derail an individual’s retirement planning, so having enough money to
cover such an expense is important for individuals to stay on track. The likelihood of Americans agreeing that they feel
they have enough savings to handle an emergency or sudden large expense increases with income, from 43 percent
among the lower income group to 84 percent among the upper income group (Figure 59). In the lower-income group,
at or just above 40 percent of Americans in each racial/ethnic group agreed that they can handle an emergency
expense. However, in the two higher income groups, White Americans were more likely to agree that they can handle
an emergency expense than Black Americans. White Americans in the middle-income group were also more likely to
agree with the statement than middle-income Hispanic Americans. Yet, middle-income Hispanic Americans were more
likely to agree that they can handle the large expense than middle-income Black Americans.

ebri.org Issue Brief • June 10, 2021 • No. 530 42
43%40% 42%
73%
67%
57%
88%
75%
90%
41%
24%
31%
65%61%
55%
91%
80%76%
0%
10%
20%
30%
40%
50%
60%
70%
80%
90%
100%
White Black* Hispanic White Black Hispanic White Black Hispanic
Less than $35,000 $35,000-$74,000 $75,000 or more
Male Female
Source: Employee Benefit Research Institute and Greenwald Research 2021 Retirement Confidence Survey.
Not including Social Security or employer-provided money, have you (or your spouse)personally saved any money for retirement? / Not including Social Security or employer-provided
money, did you (or your spouse) personally save any money for retirement before you retired? White n=1,384, Black n=741, Hispanic n=731, Percentage Yes
Figure 57
Percentage Who Have Ever Personally Saved for Retirement,
by Race/Ethnicity, Income, and Gender
Source: Employee Benefit Research Institute and Greenwald Research 2021 Retirement Confidence Survey.
Not including Social Security or employer-provided money, have you (or your spouse)personally saved any money for retirement? / Not including Social Security or employer-provided
money, did you (or your spouse) personally save any money for retirement before you retired? White n=1,384, Black n=741, Hispanic n=731, Percentage Yes
Figure 58
Percentage Who Have Ever Personally Saved for Retirement,
by Race/Ethnicity, Income, and Marital Status
53%
32%
41%
69% 67%
56%
91%
83%
90%
40%
31% 33%
69%
61%
55%
83%
70%67%
0%
10%
20%
30%
40%
50%
60%
70%
80%
90%
100%
White Black Hispanic White Black Hispanic White* Black* Hispanic*
Less than $35,000 $35,000-$74,000 $75,000 or more
Married Not Married

ebri.org Issue Brief • June 10, 2021 • No. 530 43
43%45%
40% 40%
66%
71%
44%
61%
84% 85%
77%81%
0%
10%
20%
30%
40%
50%
60%
70%
80%
90%
All White Black Hispanic All White* Black Hispanic* All White* Black Hispanic
Less than $35,000 $35,000-$74,999 $75,000 or more
Source: Employee Benefit Research Institute and Greenwald Research 2021 Retirement Confidence Survey.
To what extent do you agree or disagree with the following statement?You feel you have enough savings to handle an emergency or sudden large expense
Workers n=1,507, Retirees n=1,510, Percentage Strongly or Somewhat Agree
Figure 59
Percentage Who Agree They Have Enough Savings to Handle an
Emergency Expense, by Race/Ethnicity and Income
Retirement Age
Consistent across racial/ethnic groups, roughly 3 in 10 workers expected to retire before age 62 (Figure 60). Workers of
each race/ethnicity had a median expected retirement age of 65, showing no significant differences in retirement
expectations by race/ethnicity. Retirees of each race/ethnicity were more likely to retire at younger ages than the age
workers expected to retire (Figure 61). The reported median retirement age of 62 for retirees was consistent across
race/ethnicity groups, and the overall distribution of the retirement ages was also consistent across these groups.
However, when retirees were asked if they retired earlier than planned, about when planned, or later than planned,
both Black and Hispanic retirees were more likely to report that they had retired earlier than planned (Figure 62). Fifty-
three percent of Black and Hispanic retirees said they retired earlier than planned compared with 46 percent of White
retirees, but there was no significant difference in the share that retired later than planned. Among Black and Hispanic
retirees, those not married were more likely to retire earlier than planned (Figure 63). Fifty-eight percent of not-married
Black retirees retired earlier than planned compared with 45 percent of those married. A similar difference emerges for
Hispanic retirees by marital status — 63 percent vs. 43 percent, respectively. Gender differences are present among
Hispanic retirees but not among Black retirees, as 60 percent of female Hispanic retirees reported retiring earlier than
planned compared with just 43 percent of male Hispanic retirees, whereas 55 percent of female Black retirees and 50
percent of male Black retirees retired earlier than planned.
When asked about the reasons for retiring earlier than planned, the same top three reasons were cited by retirees in
each racial/ethnic group but in a different order (Figure 64).8 The top three reasons were that they could afford to
retire earlier than they planned; there were changes at their company, such as downsizing, closure or reorganization,
not due to the COVID-19 crisis; and they had a health problem or a disability, not related to COVID-19. The big
difference in the order of these reasons was that White retirees said they could afford to retire earlier than planned
most often vs. Black retirees saying they had a health problem or disability most often. Hispanic retirees reported these
two reasons essentially equally as the top reason and were not significantly different from the share of White and Black
retirees citing these reasons.

ebri.org Issue Brief • June 10, 2021 • No. 530 44
16%
24%
17%
18%
11%
6%
11%
10%
6%
7%
9%
8%
28%
22%
24%
25%
14%
11%
13%
13%
16%
19%
16%
16%
10%
12%
9%
10%
0% 10% 20% 30% 40% 50% 60% 70% 80% 90% 100%
Hispanic
Black
White
All
Under 60 60-61 62-64 65 66-69 70 or Older Never Retire
Source: Employee Benefit Research Institute and Greenwald Research 2021 Retirement Confidence Survey.
Realistically, at what age do you expect to retire?
Workers who gave an age n=1,064
Figure 60
Expected Retirement Age of Workers, by Race/Ethnicity
35%
41%
33%
34%
7%
7%
9%
9%
30%
28%
28%
28%
13%
10%
11%
11%
11%
11%
11%
11%
4%
4%
7%
6%
0% 10% 20% 30% 40% 50% 60% 70% 80% 90% 100%
Hispanic
Black
White
All
Under 60 60-61 62-64 65 66-69 70 or older
How old were you when you retired?
Retirees who gave an age n=1,375
Figure 61
Retirement Age of Retirees, by Race/Ethnicity
Source: Employee Benefit Research Institute and Greenwald Research 2021 Retirement Confidence Survey.
Furthermore, Hispanic workers and Black workers were more likely than White workers to say that they adjusted their
target retirement date since January 1, 2020 (Figure 65). Twenty-five percent of Hispanic workers and 21 percent of
Black workers said they plan to retire later now vs. 14 percent of White workers saying they will retire later.

ebri.org Issue Brief • June 10, 2021 • No. 530 45
53%
53%
46%
46%
41%
41%
49%
48%
7%
6%
5%
6%
0% 10% 20% 30% 40% 50% 60% 70% 80% 90% 100%
Hispanic*
Black*
White
All
Retired earlier than planned Retired about when planned Retired later than planned
Source: Employee Benefit Research Institute and Greenwald Research 2021 Retirement Confidence Survey.
Did you retire earlier than planned, about when planned, or later than planned?
Retirees n=1,510
Figure 62
Share of Retirees Who Retired Earlier, Later, or When Planned,
by Race/Ethnicity
43%
60%
44%
63%
50%
55%
45%
58%
50%
34%
46%
35%
43%
39%
50%
35%
7%
6%
10%
3%
6%
5%
5%
6%
0% 10% 20% 30% 40% 50% 60% 70% 80% 90% 100%
Male
Female*
Married
Not Married*
Male
Female
Married
Not Married*
His
pa
nic
Bla
ck
Earlier than planned About when planned Later than planned
Source: Employee Benefit Research Institute and Greenwald Research 2021 Retirement Confidence Survey.
Did you retire earlier than planned, about when planned, or later than planned?
Retirees: Black n=361, Hispanic n=327
Figure 63
Share of Black and Hispanic Retirees Who Retired Earlier, Later, or
When Planned, by Gender and Marital Status
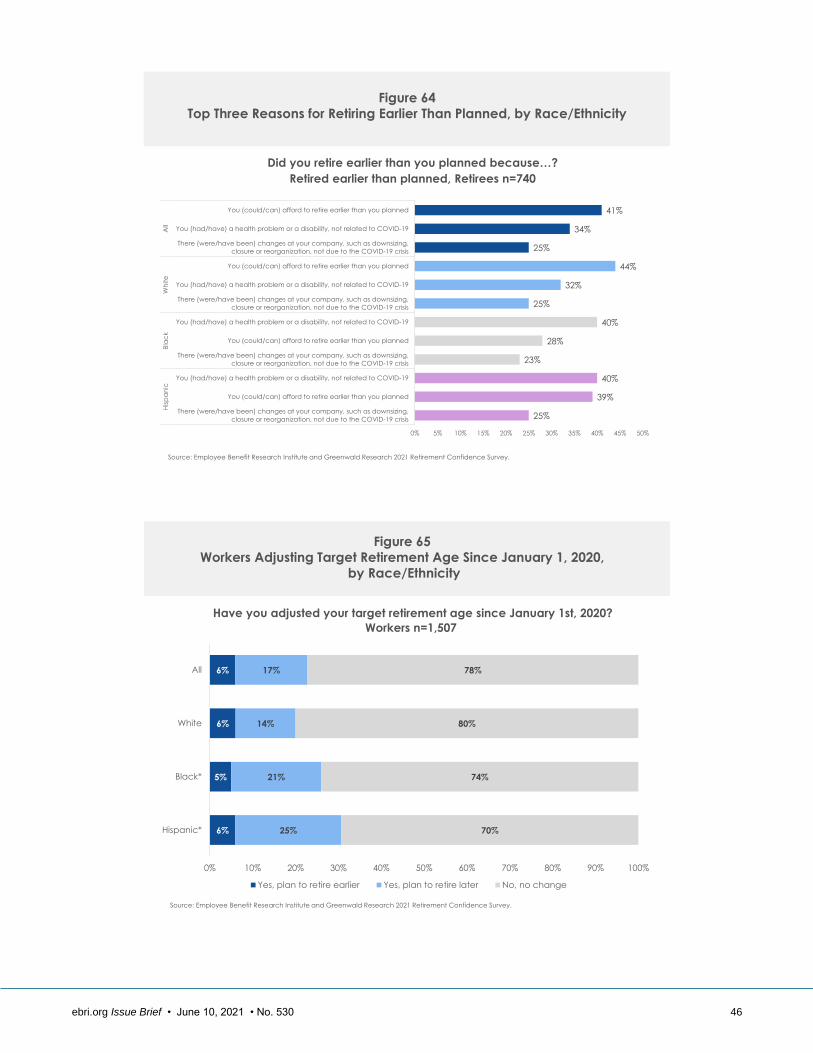
ebri.org Issue Brief • June 10, 2021 • No. 530 46
25%
39%
40%
23%
28%
40%
25%
32%
44%
25%
34%
41%
0% 5% 10% 15% 20% 25% 30% 35% 40% 45% 50%
There (were/have been) changes at your company, such as downsizing,
closure or reorganization, not due to the COVID-19 crisis
You (could/can) afford to retire earlier than you planned
You (had/have) a health problem or a disability, not related to COVID-19
There (were/have been) changes at your company, such as downsizing,
closure or reorganization, not due to the COVID-19 crisis
You (could/can) afford to retire earlier than you planned
You (had/have) a health problem or a disability, not related to COVID-19
There (were/have been) changes at your company, such as downsizing,
closure or reorganization, not due to the COVID-19 crisis
You (had/have) a health problem or a disability, not related to COVID-19
You (could/can) afford to retire earlier than you planned
There (were/have been) changes at your company, such as downsizing,
closure or reorganization, not due to the COVID-19 crisis
You (had/have) a health problem or a disability, not related to COVID-19
You (could/can) afford to retire earlier than you planned
His
pa
nic
Bla
ck
Wh
ite
All
Source: Employee Benefit Research Institute and Greenwald Research 2021 Retirement Confidence Survey.
Figure 64
Top Three Reasons for Retiring Earlier Than Planned, by Race/Ethnicity
Did you retire earlier than you planned because…?
Retired earlier than planned, Retirees n=740
6%
5%
6%
6%
25%
21%
14%
17%
70%
74%
80%
78%
0% 10% 20% 30% 40% 50% 60% 70% 80% 90% 100%
Hispanic*
Black*
White
All
Yes, plan to retire earlier Yes, plan to retire later No, no change
Source: Employee Benefit Research Institute and Greenwald Research 2021 Retirement Confidence Survey.
Have you adjusted your target retirement age since January 1st, 2020?
Workers n=1,507
Figure 65
Workers Adjusting Target Retirement Age Since January 1, 2020,
by Race/Ethnicity
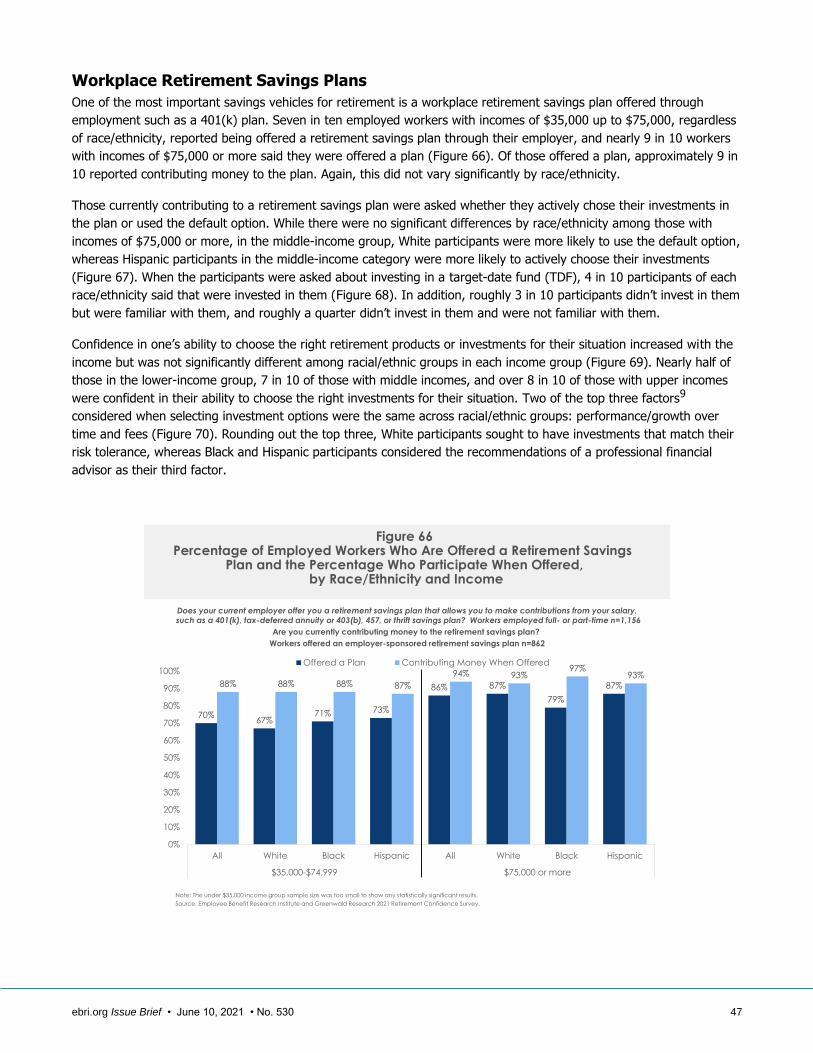
ebri.org Issue Brief • June 10, 2021 • No. 530 47
70%67%
71% 73%
86% 87%
79%
87%88% 88% 88% 87%
94% 93%97%
93%
0%
10%
20%
30%
40%
50%
60%
70%
80%
90%
100%
All White Black Hispanic All White Black Hispanic
$35,000-$74,999 $75,000 or more
Offered a Plan Contributing Money When Offered
Does your current employer offer you a retirement savings plan that allows you to make contributions from your salary,such as a 401(k), tax-deferred annuity or 403(b), 457, or thrift savings plan? Workers employed full- or part-time n=1,156
Are you currently contributing money to the retirement savings plan?
Workers offered an employer-sponsored retirement savings plan n=862
Note: The under $35,000 income group sample size was too small to show any statistically significant results.
Source: Employee Benefit Research Institute and Greenwald Research 2021 Retirement Confidence Survey.
Figure 66Percentage of Employed Workers Who Are Offered a Retirement Savings
Plan and the Percentage Who Participate When Offered,by Race/Ethnicity and Income
Workplace Retirement Savings Plans
One of the most important savings vehicles for retirement is a workplace retirement savings plan offered through
employment such as a 401(k) plan. Seven in ten employed workers with incomes of $35,000 up to $75,000, regardless
of race/ethnicity, reported being offered a retirement savings plan through their employer, and nearly 9 in 10 workers
with incomes of $75,000 or more said they were offered a plan (Figure 66). Of those offered a plan, approximately 9 in
10 reported contributing money to the plan. Again, this did not vary significantly by race/ethnicity.
Those currently contributing to a retirement savings plan were asked whether they actively chose their investments in
the plan or used the default option. While there were no significant differences by race/ethnicity among those with
incomes of $75,000 or more, in the middle-income group, White participants were more likely to use the default option,
whereas Hispanic participants in the middle-income category were more likely to actively choose their investments
(Figure 67). When the participants were asked about investing in a target-date fund (TDF), 4 in 10 participants of each
race/ethnicity said that were invested in them (Figure 68). In addition, roughly 3 in 10 participants didn’t invest in them
but were familiar with them, and roughly a quarter didn’t invest in them and were not familiar with them.
Confidence in one’s ability to choose the right retirement products or investments for their situation increased with the
income but was not significantly different among racial/ethnic groups in each income group (Figure 69). Nearly half of
those in the lower-income group, 7 in 10 of those with middle incomes, and over 8 in 10 of those with upper incomes
were confident in their ability to choose the right investments for their situation. Two of the top three factors9
considered when selecting investment options were the same across racial/ethnic groups: performance/growth over
time and fees (Figure 70). Rounding out the top three, White participants sought to have investments that match their
risk tolerance, whereas Black and Hispanic participants considered the recommendations of a professional financial
advisor as their third factor.

ebri.org Issue Brief • June 10, 2021 • No. 530 48
30%21%
37%45% 46% 47%
40%47%
30%39%
28% 15%22% 22%
28%
28%
32% 30% 24% 34%25% 25% 26%
21%
9% 9% 10% 6% 7% 6% 6% 4%
0%
10%
20%
30%
40%
50%
60%
70%
80%
90%
100%
All White* Black Hispanic* All White Black Hispanic
$35,000-$74,999 $75,000 or more
Actively choose your investments Use the default investment option
Some combination of both Not sure/Don't recall
Note: The under $35,000 income group sample size was too small to show any statistically significant results.Source: Employee Benefit Research Institute and Greenwald Research 2021 Retirement Confidence Survey.
Within your retirement savings plan, did you...?
Currently contributing money to the retirement savings plan n=770
Figure 67
How Retirement Savings Plan Participants Choose Their Investments,
by Race/Ethnicity and Income
39%
43%
39%
40%
35%
27%
36%
35%
26%
30%
25%
26%
0% 10% 20% 30% 40% 50% 60% 70% 80% 90% 100%
Hispanic
Black
White
All
Yes No, but familiar with this No and not familiar with this
Within your workplace retirement savings plan, do you currently have money invested or allocated to...?
A Target Date Fund (TDF)- Target Date Funds typically have a target retirement year in the name of the fund/investment option
Currently contributing money to the retirement savings plan n=770
Figure 68
Percentage of Those Contributing to a Retirement Savings Plan Who
Invest in a Target-Date Fund, by Race/Ethnicity
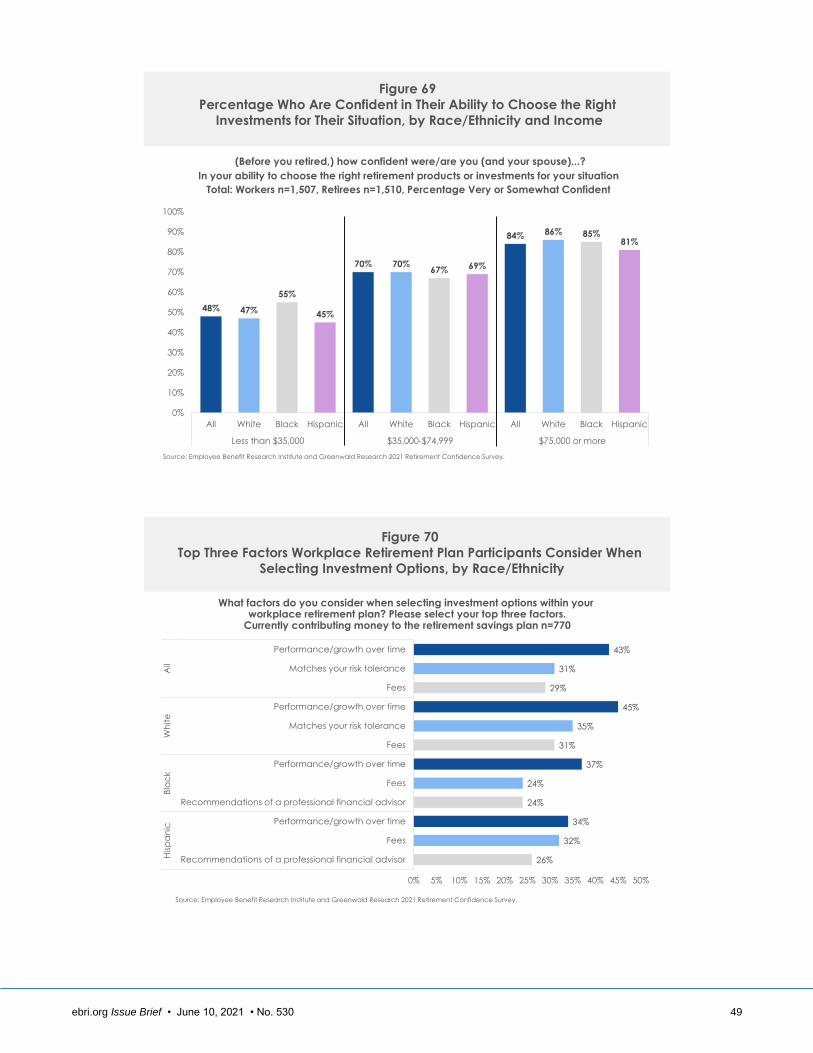
ebri.org Issue Brief • June 10, 2021 • No. 530 49
48% 47%
55%
45%
70% 70%67% 69%
84% 86% 85%81%
0%
10%
20%
30%
40%
50%
60%
70%
80%
90%
100%
All White Black Hispanic All White Black Hispanic All White Black Hispanic
Less than $35,000 $35,000-$74,999 $75,000 or more
Source: Employee Benefit Research Institute and Greenwald Research 2021 Retirement Confidence Survey.
(Before you retired,) how confident were/are you (and your spouse)...?
In your ability to choose the right retirement products or investments for your situation
Total: Workers n=1,507, Retirees n=1,510, Percentage Very or Somewhat Confident
Figure 69
Percentage Who Are Confident in Their Ability to Choose the Right
Investments for Their Situation, by Race/Ethnicity and Income
26%
32%
34%
24%
24%
37%
31%
35%
45%
29%
31%
43%
0% 5% 10% 15% 20% 25% 30% 35% 40% 45% 50%
Recommendations of a professional financial advisor
Fees
Performance/growth over time
Recommendations of a professional financial advisor
Fees
Performance/growth over time
Fees
Matches your risk tolerance
Performance/growth over time
Fees
Matches your risk tolerance
Performance/growth over time
His
pa
nic
Bla
ck
Wh
ite
All
Source: Employee Benefit Research Institute and Greenwald Research 2021 Retirement Confidence Survey.
What factors do you consider when selecting investment options within your workplace retirement plan? Please select your top three factors.
Currently contributing money to the retirement savings plan n=770
Figure 70
Top Three Factors Workplace Retirement Plan Participants Consider When
Selecting Investment Options, by Race/Ethnicity

ebri.org Issue Brief • June 10, 2021 • No. 530 50
84% 85% 85%
79% 78% 80%
74% 75% 77%80%
73% 72%75%
78%
71% 73%
0%
10%
20%
30%
40%
50%
60%
70%
80%
90%
All
Wh
ite
Bla
ck
His
pa
nic All
Wh
ite
Bla
ck
His
pa
nic All
Wh
ite
Bla
ck
His
pa
nic All
Wh
ite
Bla
ck
His
pa
nic
Overall The fund or investment
options available
The online tools or
calculators offered
The educational materials
you have received
Source: Employee Benefit Research Institute and Greenwald Research 2021 Retirement Confidence Survey.
How satisfied are you with the following aspects of your workplace retirement savings plan?
Percentage Very Satisfied or Somewhat Satisfied
Employer offers a retirement savings plan n=862
Figure 71
Percentage of Workplace Retirement Plan Participants Satisfied With
Various Aspects of the Plan, by Race/Ethnicity
Over 8 in 10 workers who were offered a workplace plan said they were satisfied overall with the plan, regardless of
the worker’s race/ethnicity (Figure 71). Workers also had similarly high satisfaction rates with other aspects of the
workplace plan, and no significant differences by race/ethnicity resulted. Over 7 in 10 workers offered a plan
(regardless of race/ethnicity) said they were satisfied with the fund or investment options available, the online tools or
calculators offered, and the educational materials they have received.
Consistent across racial/ethnic groups, those offered a plan cited better explanations for whether they are on track with
their retirement savings and better explanations for how much income their savings will produce in retirement among
their top three potential improvements to their workplace plan (Figure 72).10 The third potential improvement in the
top three was different for Black and Hispanic workers offered a plan compared with White workers: More one-on-one,
personalized education was cited more by Black and Hispanic workers vs. more fund or investment options available
being cited by White workers.
Workers offered a workplace plan overwhelmingly (nearly 9 in 10) said that it would be valuable to them if their
retirement plan savings with a previous employer were automatically transferred to their current employer’s plan when
changing jobs; as a result, retirement plan savings would be preserved (Figure 73). This was even more likely to be
considered valuable by Hispanic workers offered a plan.

ebri.org Issue Brief • June 10, 2021 • No. 530 51
36%
37%
43%
33%
36%
38%
28%
29%
31%
30%
31%
33%
0% 5% 10% 15% 20% 25% 30% 35% 40% 45% 50%
More one-on-one, personalized education
Better explanations for whether you are on track with your
retirement savings
Better explanations for how much income your savings will
produce in retirement
More one-on-one, personalized education
Better explanations for whether you are on track with your
retirement savings
Better explanations for how much income your savings will
produce in retirement
Better explanations for whether you are on track with your
retirement savings
More fund or investment options available
Better explanations for how much income your savings will
produce in retirement
Better explanations for whether you are on track with your
retirement savings
More fund or investment options available
Better explanations for how much income your savings will
produce in retirement
His
pa
nic
Bla
ck
Wh
ite
All
Source: Employee Benefit Research Institute and Greenwald Research 2021 Retirement Confidence Survey.
Which of the following, if any, would be the most valuable improvements
to your retirement savings plan? (Please select all that apply.)
Employer offers a retirement savings plan n=862
Figure 72
Top Three Most Valuable Improvements to Retirement Savings Plans, as
Ranked by Those Offered a Plan, by Race/Ethnicity
39% 35%45%
54%
46%47%
44%37%
0%
10%
20%
30%
40%
50%
60%
70%
80%
90%
100%
All White Black Hispanic*
Very Valuable Somewhat Valuable
85%82%
89% 91%
Source: Employee Benefit Research Institute and Greenwald Research 2021 Retirement Confidence Survey.
How valuable would it be to you if your retirement plan savings with
a previous employer were automatically transferred to your current
employer's plan if/when you changed jobs?
Employer offers a retirement savings plan n=862, Percentage Very or Somewhat Valuable
Figure 73
How Valuable Is Automatically Transferring Retirement Savings From
a Previous Employer to a Current Employer Plan, by Race/Ethnicity

ebri.org Issue Brief • June 10, 2021 • No. 530 52
35%
34%
31%
30%
0% 5% 10% 15% 20% 25% 30% 35% 40%
Hispanic
Black
White
All
Have you made changes to either your workplace retirement plan contribution or
the way your retirement plan savings are invested since January 1st, 2020?
Employer offers a retirement savings plan n=862
Source: Employee Benefit Research Institute and Greenwald Research 2021 Retirement Confidence Survey.
Figure 74
Percentage Who Have Made Changes in Their Workplace Retirement
Savings Plan Since January 1, 2020, by Race/Ethnicity
Plan Changes & Loans
With the challenges of 2020, workers offered a retirement plan may have made a change to their contributions or
investment allocations in response to the pandemic. Three in ten workers offered a plan reported having made such a
change since January 1, 2020, with this level holding across each racial/ethnic group (Figure 74).
Americans may have also taken a loan or a withdrawal from their retirement savings plan. Between 10 and 20 percent
of Americans overall who have saved for retirement reported ever having taken a loan or some type of withdrawal from
their workplace plan (Figure 75). Black and Hispanic Americans were more likely to have taken each of these from a
retirement plan relative to White Americans.
These differences by race/ethnicity hold across many of the income groups, but not all, for each of the distribution
types. For loans, Black Americans were more likely to have taken them across each income group relative to White
Americans, and Hispanic Americans in the upper-income group were as well (Figure 76). The same differences held for
hardship distributions among Hispanic Americans in the lower-income group and Black Americans (Figure 77). The
differences by income for early distributions were just in the higher two income groups, where Black Americans were
more likely to have taken one relative to White Americans and Hispanic Americans in the upper-income group (Figure
78). Other types of withdrawals had very limited differences by income. In the lower-income group, Black Americans
were more likely to have taken one compared with both White and Hispanic Americans, and in the upper-income group,
Hispanic Americans were more likely to have taken an “other” type of withdrawal than White Americans (Figure 79).
Two of the top three reasons for taking a loan were same across the races/ethnicities: to pay off credit card bill or
credit card debt and to buy a home, car, or other large purchase (Figure 80).11 The third reason was different between
Hispanic Americans (to cover medical expenses) and White and Black Americans (to make ends meet), but Black
Americans cited to make ends meet the most compared with it being the third most cited by White Americans.

ebri.org Issue Brief • June 10, 2021 • No. 530 53
21%19%
34%
28%
14%12%
29%
22%
16% 15%
29%
23%
15% 14%
23%20%
0%
5%
10%
15%
20%
25%
30%
35%
40%A
ll
Wh
ite
Bla
ck*
His
pa
nic
*
All
Wh
ite
Bla
ck*
His
pa
nic
*
All
Wh
ite
Bla
ck*
His
pa
nic
*
All
Wh
ite
Bla
ck*
His
pa
nic
*
Taken a Loan from the
plan (the borrowed
amount is paid back with
interest through payroll
deduction)
Taken a Hardship
Distribution from the plan
(a withdrawal made
because of a heavy and
immediate financial need)
Taken an Early Withdrawal
from the plan (a
withdrawal made before
age 59 ½ that you
typically pay a tax penalty
for)
Taken some Other type of
withdrawal or distribution
Source: Employee Benefit Research Institute and Greenwald Research 2021 Retirement Confidence Survey.
Thinking about your workplace retirement savings plan(s), have you ever...?
Saved for retirement n=2,050
Figure 75
Percentage of Those Who Saved for Retirement Who Took a Loan or
an Early Withdrawal, by Race/Ethnicity
Source: Employee Benefit Research Institute and Greenwald Research 2021 Retirement Confidence Survey.
Thinking about your workplace retirement savings plan(s), have you ever...?Taken a Loan from the plan (the borrowed amount is paid back with interest through payroll deduction)
Saved for retirement n=2,050
Figure 76
Percentage of Those Who Saved for Retirement Who Took a Loan,
by Race/Ethnicity and Income
19%
13%
31%
25%
18%
14%
29%
21%23%
21%
38%
33%
0%
5%
10%
15%
20%
25%
30%
35%
40%
All White Black* Hispanic All White Black* Hispanic All White Black* Hispanic*
Less than $35,000 $35,000-$74,999 $75,000 or more

ebri.org Issue Brief • June 10, 2021 • No. 530 54
Source: Employee Benefit Research Institute and Greenwald Research 2021 Retirement Confidence Survey.
Thinking about your workplace retirement savings plan(s), have you ever...?Taken a Hardship Distribution from the plan (a withdrawal made because of a heavy and immediate financial need)
Saved for retirement n=2,050
Figure 77
Percentage of Those Who Saved for Retirement Who Took a Hardship
Withdrawal, by Race/Ethnicity and Income
13%
7%
30%
24%
14%
10%
34%
14%15%
13%
24%
27%
0%
5%
10%
15%
20%
25%
30%
35%
40%
All White Black* Hispanic* All White Black* Hispanic All White Black* Hispanic*
Less than $35,000 $35,000-$74,999 $75,000 or more
Source: Employee Benefit Research Institute and Greenwald Research 2021 Retirement Confidence Survey.
Thinking about your workplace retirement savings plan(s), have you ever...?Taken an Early Withdrawal from the plan (a withdrawal made before age 59 ½ that you typically pay a tax penalty for)
Saved for retirement n=2,050
Figure 78
Percentage of Those Who Saved for Retirement Who Took
an Early Withdrawal, by Race/Ethnicity and Income
20%
18%
30%
27%
14%
10%
25%
17% 17%16%
32%
26%
0%
5%
10%
15%
20%
25%
30%
35%
All White Black Hispanic All White Black* Hispanic All White Black* Hispanic*
Less than $35,000 $35,000-$74,999 $75,000 or more
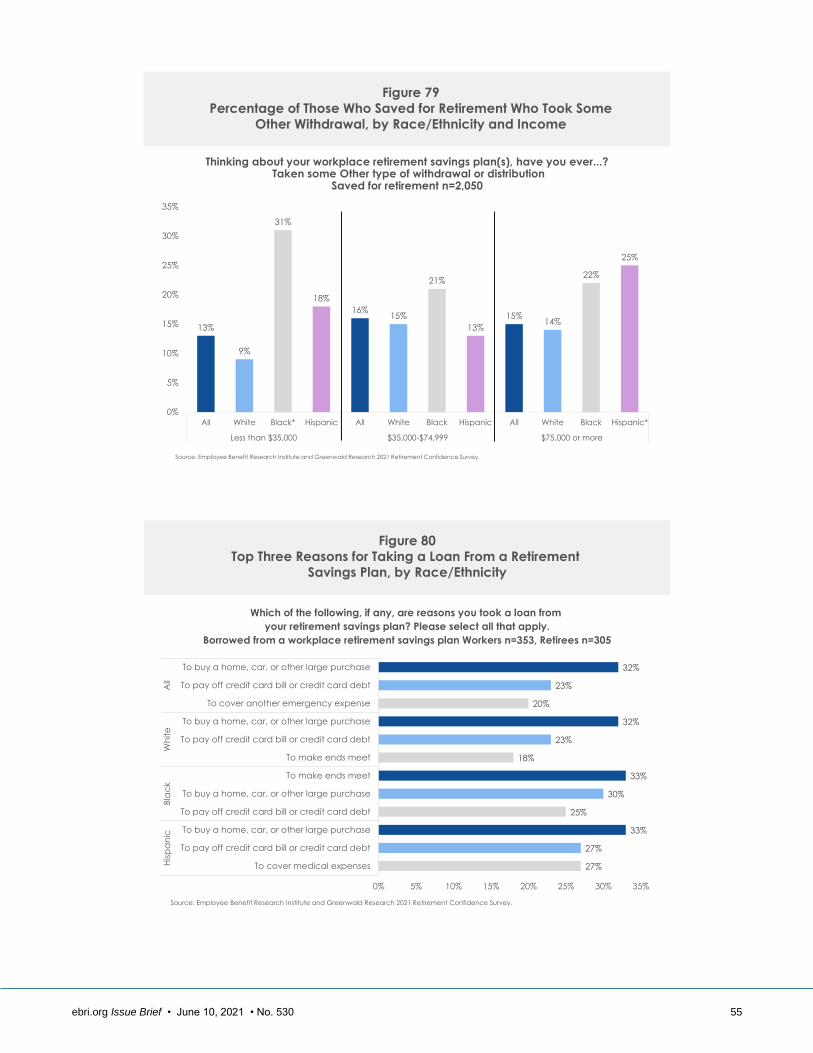
ebri.org Issue Brief • June 10, 2021 • No. 530 55
Source: Employee Benefit Research Institute and Greenwald Research 2021 Retirement Confidence Survey.
Thinking about your workplace retirement savings plan(s), have you ever...?Taken some Other type of withdrawal or distribution
Saved for retirement n=2,050
Figure 79
Percentage of Those Who Saved for Retirement Who Took Some
Other Withdrawal, by Race/Ethnicity and Income
13%
9%
31%
18%
16%15%
21%
13%
15%14%
22%
25%
0%
5%
10%
15%
20%
25%
30%
35%
All White Black* Hispanic All White Black Hispanic All White Black Hispanic*
Less than $35,000 $35,000-$74,999 $75,000 or more
27%
27%
33%
25%
30%
33%
18%
23%
32%
20%
23%
32%
0% 5% 10% 15% 20% 25% 30% 35%
To cover medical expenses
To pay off credit card bill or credit card debt
To buy a home, car, or other large purchase
To pay off credit card bill or credit card debt
To buy a home, car, or other large purchase
To make ends meet
To make ends meet
To pay off credit card bill or credit card debt
To buy a home, car, or other large purchase
To cover another emergency expense
To pay off credit card bill or credit card debt
To buy a home, car, or other large purchase
His
pa
nic
Bla
ck
Wh
ite
All
Source: Employee Benefit Research Institute and Greenwald Research 2021 Retirement Confidence Survey.
Which of the following, if any, are reasons you took a loan from
your retirement savings plan? Please select all that apply.
Borrowed from a workplace retirement savings plan Workers n=353, Retirees n=305
Figure 80
Top Three Reasons for Taking a Loan From a Retirement
Savings Plan, by Race/Ethnicity
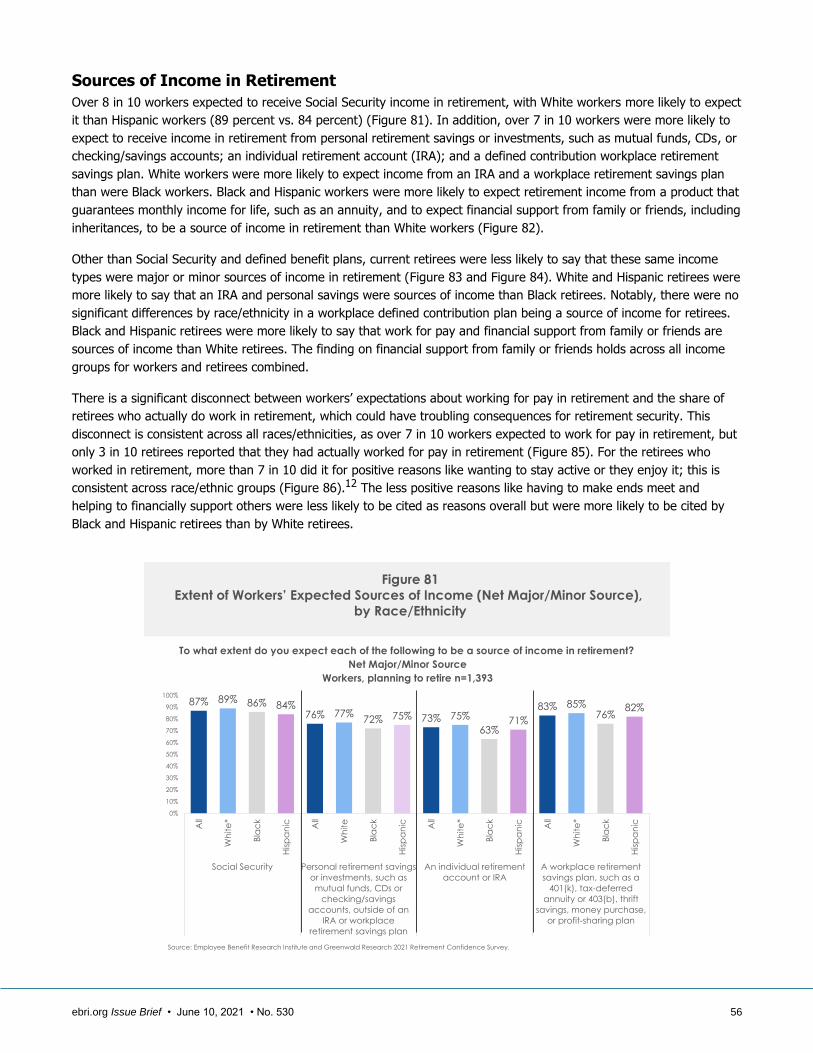
ebri.org Issue Brief • June 10, 2021 • No. 530 56
87% 89% 86% 84%76% 77%
72% 75% 73% 75%
63%71%
83% 85%76%
82%
0%
10%
20%
30%
40%
50%
60%
70%
80%
90%
100%
All
Wh
ite
*
Bla
ck
His
pa
nic All
Wh
ite
Bla
ck
His
pa
nic All
Wh
ite
*
Bla
ck
His
pa
nic All
Wh
ite
*
Bla
ck
His
pa
nic
Social Security Personal retirement savings
or investments, such as
mutual funds, CDs or
checking/savings
accounts, outside of an
IRA or workplace
retirement savings plan
An individual retirement
account or IRA
A workplace retirement
savings plan, such as a
401(k), tax-deferred
annuity or 403(b), thrift
savings, money purchase,
or profit-sharing plan
Source: Employee Benefit Research Institute and Greenwald Research 2021 Retirement Confidence Survey.
To what extent do you expect each of the following to be a source of income in retirement?
Net Major/Minor Source
Workers, planning to retire n=1,393
Figure 81
Extent of Workers’ Expected Sources of Income (Net Major/Minor Source),
by Race/Ethnicity
Sources of Income in Retirement
Over 8 in 10 workers expected to receive Social Security income in retirement, with White workers more likely to expect
it than Hispanic workers (89 percent vs. 84 percent) (Figure 81). In addition, over 7 in 10 workers were more likely to
expect to receive income in retirement from personal retirement savings or investments, such as mutual funds, CDs, or
checking/savings accounts; an individual retirement account (IRA); and a defined contribution workplace retirement
savings plan. White workers were more likely to expect income from an IRA and a workplace retirement savings plan
than were Black workers. Black and Hispanic workers were more likely to expect retirement income from a product that
guarantees monthly income for life, such as an annuity, and to expect financial support from family or friends, including
inheritances, to be a source of income in retirement than White workers (Figure 82).
Other than Social Security and defined benefit plans, current retirees were less likely to say that these same income
types were major or minor sources of income in retirement (Figure 83 and Figure 84). White and Hispanic retirees were
more likely to say that an IRA and personal savings were sources of income than Black retirees. Notably, there were no
significant differences by race/ethnicity in a workplace defined contribution plan being a source of income for retirees.
Black and Hispanic retirees were more likely to say that work for pay and financial support from family or friends are
sources of income than White retirees. The finding on financial support from family or friends holds across all income
groups for workers and retirees combined.
There is a significant disconnect between workers’ expectations about working for pay in retirement and the share of
retirees who actually do work in retirement, which could have troubling consequences for retirement security. This
disconnect is consistent across all races/ethnicities, as over 7 in 10 workers expected to work for pay in retirement, but
only 3 in 10 retirees reported that they had actually worked for pay in retirement (Figure 85). For the retirees who
worked in retirement, more than 7 in 10 did it for positive reasons like wanting to stay active or they enjoy it; this is
consistent across race/ethnic groups (Figure 86).12 The less positive reasons like having to make ends meet and
helping to financially support others were less likely to be cited as reasons overall but were more likely to be cited by
Black and Hispanic retirees than by White retirees.

ebri.org Issue Brief • June 10, 2021 • No. 530 57
50%46%
58%61%
68% 67%72% 73%
38%35%
52%
44%
63% 62%65% 66%
0%
10%
20%
30%
40%
50%
60%
70%
80%A
ll
Wh
ite
Bla
ck*
His
pa
nic
*
All
Wh
ite
Bla
ck
His
pa
nic All
Wh
ite
Bla
ck*
His
pa
nic
*
All
Wh
ite
Bla
ck
His
pa
nic
A product that guarantees
monthly income for life,
such as an annuity
Work for pay Financial support from
family or friends, including
inheritances
A defined benefit or
traditional pension plan,
where the amount you
receive is typically based
on salary and years of
service
Source: Employee Benefit Research Institute and Greenwald Research 2021 Retirement Confidence Survey.
To what extent do you expect each of the following to be a source of income in retirement?
Net Major/Minor Source
Workers, planning to retire n=1,393
Figure 82
Extent of Workers’ Expected Sources of Income (Net Major/Minor Source),
by Race/Ethnicity
92% 94%88%
92%
66%70%
49%
58% 55%59%
37%
48% 46% 45% 44%
52%
0%
10%
20%
30%
40%
50%
60%
70%
80%
90%
100%
All
Wh
ite
*
Bla
ck
His
pa
nic All
Wh
ite
*
Bla
ck
His
pa
nic
*
All
Wh
ite
*
Bla
ck
His
pa
nic
*
All
Wh
ite
Bla
ck
His
pa
nic
Social Security Personal retirement savings
or investments, such as
mutual funds, CDs or
checking/savings
accounts, outside of an
IRA or workplace
retirement savings plan
An individual retirement
account or IRA
A workplace retirement
savings plan, such as a
401(k), tax-deferred
annuity or 403(b), thrift
savings, money purchase,
or profit-sharing plan
Source: Employee Benefit Research Institute and Greenwald Research 2021 Retirement Confidence Survey.
To what extent is each of the following a source of income in retirement?
Net Major/Minor Source
Retirees n=1,510
Figure 83
Extent of Retirees’ Sources of Income (Net Major/Minor Source),
by Race/Ethnicity
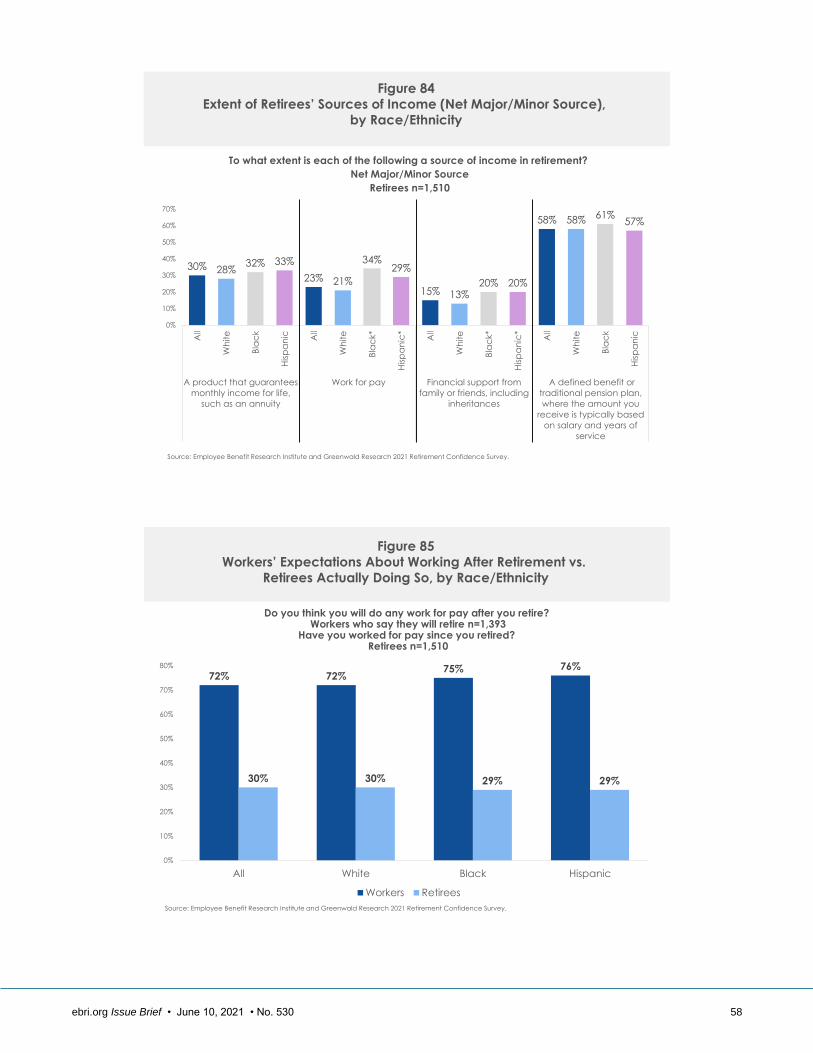
ebri.org Issue Brief • June 10, 2021 • No. 530 58
To what extent is each of the following a source of income in retirement?
Net Major/Minor Source
Retirees n=1,510
Source: Employee Benefit Research Institute and Greenwald Research 2021 Retirement Confidence Survey.
Figure 84
Extent of Retirees’ Sources of Income (Net Major/Minor Source),
by Race/Ethnicity
30% 28%32% 33%
23% 21%
34%29%
15% 13%20% 20%
58% 58%61%
57%
0%
10%
20%
30%
40%
50%
60%
70%
All
Wh
ite
Bla
ck
His
pa
nic All
Wh
ite
Bla
ck*
His
pa
nic
*
All
Wh
ite
Bla
ck*
His
pa
nic
*
All
Wh
ite
Bla
ck
His
pa
nic
A product that guarantees
monthly income for life,
such as an annuity
Work for pay Financial support from
family or friends, including
inheritances
A defined benefit or
traditional pension plan,
where the amount you
receive is typically based
on salary and years of
service
72% 72%75% 76%
30% 30% 29% 29%
0%
10%
20%
30%
40%
50%
60%
70%
80%
All White Black Hispanic
Workers Retirees
Do you think you will do any work for pay after you retire? Workers who say they will retire n=1,393
Have you worked for pay since you retired? Retirees n=1,510
Figure 85
Workers’ Expectations About Working After Retirement vs.
Retirees Actually Doing So, by Race/Ethnicity
Source: Employee Benefit Research Institute and Greenwald Research 2021 Retirement Confidence Survey.
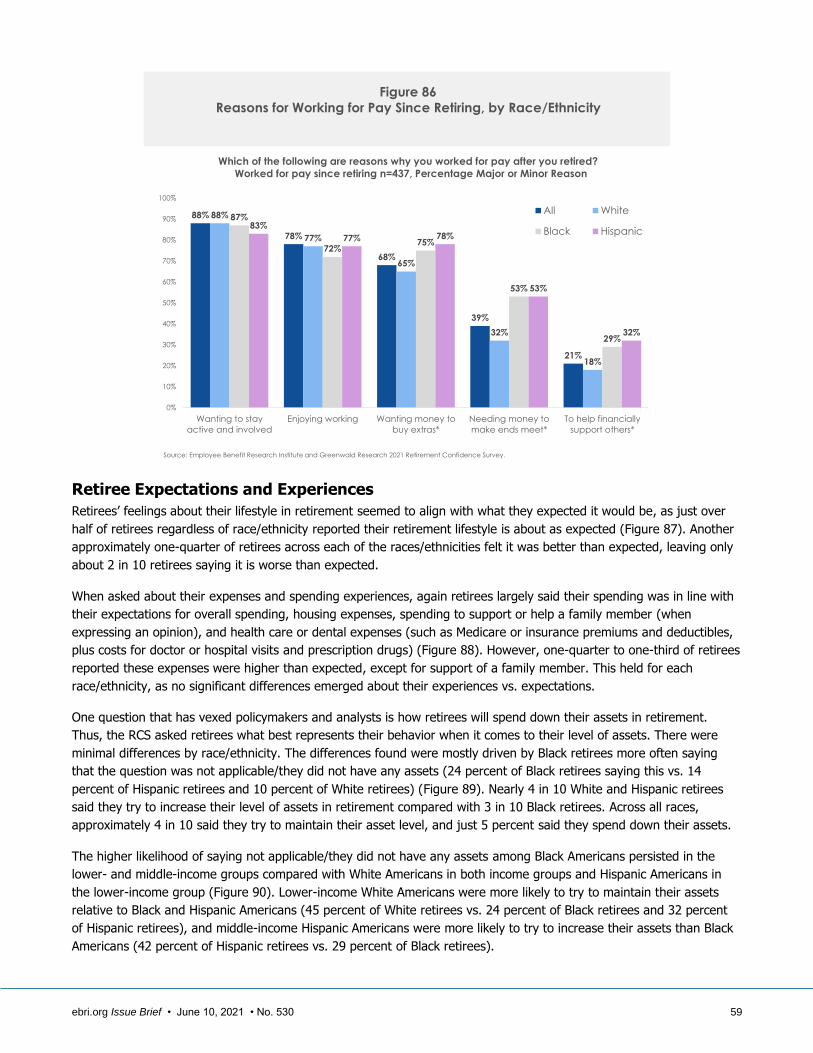
ebri.org Issue Brief • June 10, 2021 • No. 530 59
88%
78%
68%
39%
21%
88%
77%
65%
32%
18%
87%
72%75%
53%
29%
83%
77% 78%
53%
32%
0%
10%
20%
30%
40%
50%
60%
70%
80%
90%
100%
Wanting to stay
active and involved
Enjoying working Wanting money to
buy extras*
Needing money to
make ends meet*
To help financially
support others*
All White
Black Hispanic
Source: Employee Benefit Research Institute and Greenwald Research 2021 Retirement Confidence Survey.
Which of the following are reasons why you worked for pay after you retired? Worked for pay since retiring n=437, Percentage Major or Minor Reason
Figure 86
Reasons for Working for Pay Since Retiring, by Race/Ethnicity
Retiree Expectations and Experiences
Retirees’ feelings about their lifestyle in retirement seemed to align with what they expected it would be, as just over
half of retirees regardless of race/ethnicity reported their retirement lifestyle is about as expected (Figure 87). Another
approximately one-quarter of retirees across each of the races/ethnicities felt it was better than expected, leaving only
about 2 in 10 retirees saying it is worse than expected.
When asked about their expenses and spending experiences, again retirees largely said their spending was in line with
their expectations for overall spending, housing expenses, spending to support or help a family member (when
expressing an opinion), and health care or dental expenses (such as Medicare or insurance premiums and deductibles,
plus costs for doctor or hospital visits and prescription drugs) (Figure 88). However, one-quarter to one-third of retirees
reported these expenses were higher than expected, except for support of a family member. This held for each
race/ethnicity, as no significant differences emerged about their experiences vs. expectations.
One question that has vexed policymakers and analysts is how retirees will spend down their assets in retirement.
Thus, the RCS asked retirees what best represents their behavior when it comes to their level of assets. There were
minimal differences by race/ethnicity. The differences found were mostly driven by Black retirees more often saying
that the question was not applicable/they did not have any assets (24 percent of Black retirees saying this vs. 14
percent of Hispanic retirees and 10 percent of White retirees) (Figure 89). Nearly 4 in 10 White and Hispanic retirees
said they try to increase their level of assets in retirement compared with 3 in 10 Black retirees. Across all races,
approximately 4 in 10 said they try to maintain their asset level, and just 5 percent said they spend down their assets.
The higher likelihood of saying not applicable/they did not have any assets among Black Americans persisted in the
lower- and middle-income groups compared with White Americans in both income groups and Hispanic Americans in
the lower-income group (Figure 90). Lower-income White Americans were more likely to try to maintain their assets
relative to Black and Hispanic Americans (45 percent of White retirees vs. 24 percent of Black retirees and 32 percent
of Hispanic retirees), and middle-income Hispanic Americans were more likely to try to increase their assets than Black
Americans (42 percent of Hispanic retirees vs. 29 percent of Black retirees).

ebri.org Issue Brief • June 10, 2021 • No. 530 60
9%
8%
10%
10%
19%
16%
18%
18%
51%
54%
55%
53%
21%
22%
17%
19%
0% 10% 20% 30% 40% 50% 60% 70% 80% 90% 100%
Hispanic
Black
White
All
Much better than expected Somewhat better than expected About the same as expected Worse than expected
Source: Employee Benefit Research Institute and Greenwald Research 2021 Retirement Confidence Survey.
How does your overall lifestyle in retirement now compare to how you expected it to be before you retired? For example, are you traveling, spending time with
family or volunteering as much as you expected? Retirees n=1,510
Figure 87
How Do Retirees’ Lifestyles Compare With What Was Expected Before
Retirement, by Race/Ethnicity
26% 25%38%
31%24% 22%
31% 26%10% 9%
17% 18%33% 33% 36% 35%
60% 63%47% 54%
63% 66%55%
59%
32% 32%30% 31%
54% 55% 49% 53%
12% 10% 13% 13% 10% 9% 9% 11%
7% 6%10% 8%
9% 10%8%
9%
51% 53%44% 43%
0%
10%
20%
30%
40%
50%
60%
70%
80%
90%
100%
All
Wh
ite
Bla
ck*
His
pa
nic
*
All
Wh
ite
Bla
ck
His
pa
nic All
Wh
ite
Bla
ck*
His
pa
nic
*
All
Wh
ite
Bla
ck
His
pa
nic
Overall expenses/spending Housing expenses Spending to support or help a
family member
Health care or dental expenses
(such as Medicare or insurance
premiums, deductibles, plus
costs for doctor or hospital visits,
prescription drugs)
Higher than expected About the same as expected Lower than expected Not Applicable
Source: Employee Benefit Research Institute and Greenwald Research 2021 Retirement Confidence Survey.
Compared with what you expected when you first retired, would
you say the following are higher or lower for you now than you expected?
Retirees n=1,510
Figure 88
Expected Spending vs. Actual Spending of Retirees, by Race/Ethnicity

ebri.org Issue Brief • June 10, 2021 • No. 530 61
39%
29%
39%
37%
36%
36%
43%
42%
5%
4%
4%
4%
14%
24%
10%
13%
6%
7%
4%
5%
0% 10% 20% 30% 40% 50% 60% 70% 80% 90% 100%
Hispanic
Black
White
All
You try to increase your asset level* You try to maintain your current asset level
You spend down your assets You have no assets/not applicable*
Don't know
Source: Employee Benefit Research Institute and Greenwald Research 2021 Retirement Confidence Survey.
Which one of the following best represents your behavior when it comes to your level of assets?
Retirees n=1,510
Figure 89
Retiree Behavior in Regard to Their Level of Assets, by Race/Ethnicity
Source: Employee Benefit Research Institute and Greenwald Research 2021 Retirement Confidence Survey.
Which one of the following best represents your behavior when it comes to your level of assets?
Retirees n=1,510
46%
42%
53%
51%
42%
29%
38%
37%
29%
19%
20%
21%
40%
45%
41%
41%
37%
42%
45%
44%
32%
24%
45%
40%
8%
4%
3%
4%
3%
6%
5%
5%
4%
2%
3%
2%
2%
4%
2%
2%
12%
16%
6%
8%
28%
45%
27%
30%
3%
5%
1%
2%
7%
7%
5%
5%
7%
10%
6%
7%
0% 10% 20% 30% 40% 50% 60% 70% 80% 90% 100%
Hispanic
Black
White
All
Hispanic*
Black*
White
All
Hispanic
Black*
White*
All
$75
,000 o
r m
ore
$35
,000-$
74,9
99
Less
th
an
$35,0
00
You try to increase your asset level You try to maintain your current asset level You spend down your assetsYou have no assets/not applicable Don't know
Figure 90Retiree Behavior in Regard to Their Level of Assets,
by Race/Ethnicity and Income

ebri.org Issue Brief • June 10, 2021 • No. 530 62
Conclusion
Overall, Black and Hispanic Americans view retirement similar to others with comparable financial means. For example,
middle- and upper-income Black and Hispanic Americans were just as likely to feel knowledgeable about managing their
day-to-day finances and saving and investing for the future. However, Black and Hispanic Americans, on average, have
lower financial means. They were more likely to report and be burdened by higher incidences of lower incomes and
assets as well as higher likelihoods of “problematic” debt. The RCS has consistently shown that Americans with lower
incomes report feeling less confident about their retirement prospects. However, having debt is also one of the largest
indicators of individuals not being able to save, build wealth, and live comfortably in retirement. Despite these
challenges, Black and Hispanic Americans are still optimistic for their futures, as shown by their high levels of
retirement confidence across the income spectrum. A compounding factor to consider is Black and Hispanic Americans’
higher likelihood of being negatively impacted by the COVID-19 pandemic, which may further hinder some from making
gains in their retirement preparations.
But critically, even given comparable median retirement ages and expected retirement ages, Black and Hispanic retirees
were more likely to have retired earlier than planned and to do so for negative reasons, such as due to health concerns
or a disability, as opposed to being able to afford to retire earlier. Also, Black and Hispanic retirees who work for pay in
retirement were more likely to cite negative reasons like making ends meet or helping to support others. In certain
income groups, Black and Hispanic Americans are less likely to save for retirement. But, when offered a workplace
retirement plan, they said they participate at the same rate as White Americans. Furthermore, Black and Hispanic
workers were satisfied overall with the workplace plans offered, although when asked about improvements to these
plans, they were more likely to cite one-on-one, personalized advice being more available as valuable.
Experiences with the financial system and financial professionals also have an impact. In fact, Black and Hispanic
Americans were more likely to report feeling treated unfairly by financial service companies. However, while Black
Americans of all ages were equally likely to report feeling treated unfairly, younger Hispanic Americans were less likely
to report they have been treated unfairly relative to their older counterparts. Black and Hispanic Americans also
emphasized additional criteria when seeking a professional financial advisor. Like all respondents, the top criteria were
to work with a professional who has expertise relevant to their goals as well as experience working with households
with the same asset level as them. In addition to these common criteria, Black and Hispanic Americans were more likely
to prefer some connection (through their workplace) or personal similarity to those providing them financial advice. This
includes advisors who are the same race/ethnicity or gender as them, or who have had a similar upbringing. These
connections or similarities carry over to where these individuals seek retirement planning, with a higher likelihood of
doing so in community centers and churches along with the more common sources.
The importance of financially supporting family and friends and the desire to provide this support, while laudable, can
also have a negative impact on a person’s ability to save and prepare for their own long-term financial security. Family
and friends were particularly important for Hispanic Americans, as they tend to place a higher value on helping family
members over saving for their own retirement. Furthermore, while not a majority, both Black and Hispanic respondents
were more likely to say they are counting on financial support from family and friends, including inheritances, as an
income source in retirement. This family emphasis may point to financial planning or product needs, like life insurance,
will and estate planning, or college savings accounts. It also exposes a risk to retirement security for those who expect
or depend on family as a source of retirement income that may be less reliable or predictable.
Black and Hispanic Americans are more likely to be behind in their financial standing and face many challenges in
improving their situation. Still, there are some modifications in the financial system that could help improve their
prospects, including access to workplace retirement savings plans that provide one-on-one, personalized advice that
builds on their comfort with having a connection to those providing advice. In addition, the findings point to a need for
financial service companies to have more advisors who are similar to Black and Hispanic Americans and also to root out
sources that might cause Black and Hispanic Americans to feel they are being treated unfairly. A greater understanding
of the importance of supporting family and friends that in particular Hispanic Americans feel when making financial
decisions is needed, so that this obligation can be weighed against their own savings to build wealth that could result in

ebri.org Issue Brief • June 10, 2021 • No. 530 63
a lesser need for supporting family members in the future. Obviously, higher incomes would help, but these issues arise
even for those already with higher incomes.
Appendix 1: Methodology
The Retirement Confidence Survey, in its 31st year in 2021, is the longest-running survey of its kind, measuring worker
and retiree confidence about retirement, and is conducted annually by the Employee Benefit Research Institute (EBRI)
and Greenwald Research. The 2021 survey of 3,017 Americans was conducted online January 5 through January 25,
2021. All respondents were ages 25 or older. The survey included 1,507 workers and 1,510 retirees — this year
included an oversample of roughly 500 completed surveys among Black Americans (252 workers and 253 retirees) and
roughly 500 completed surveys among Hispanic Americans (253 workers and 249 retirees).
Data were weighted by age, gender, education, household income, and race/ethnicity. Unweighted sample sizes are
noted in figures to provide information for margin-of-error estimates. The margin of error would be ± 2.5 percentage
points for both workers and retirees in a similarly sized random sample.
Please note percentages in the figures may not total to 100 percent due to rounding and/or missing categories. Any
trend changes or differences in subgroups noted in the text are statistically significant; if no trend changes are noted,
there were no significant differences.
Appendix 2: Figure Statistical Significance Key
Figure 3
• Less than $35,000 (lower income): Black Americans were more likely than White Americans to have less than
$1,000 in assets.
• $35,000-$74,999 (middle income): White Americans were more likely to have $250,000 or more in assets than
Black and Hispanic Americans.
• $75,000 or more (upper income): White Americans were more likely to have $250,000 or more in assets than
Black and Hispanic Americans.
Figure 4
• In each income group: Black and Hispanic Americans were more likely to consider debt to be a problem than
White Americans.
Figure 6
• In each income group: Black and Hispanic Americans were more likely to agree that debt is negatively
impacting their ability to save for retirement/live comfortably in retirement than White Americans.
Figure 7
• In each income group: Black and Hispanic Americans were more likely to say that their non-mortgage debt is
having a negative impact on their ability to save for emergencies than White Americans.
Figure 8
• In each income group: Black and Hispanic Americans were more likely to say that their non-mortgage debt is
having a negative impact on their ability to save for retirement in general than White Americans.
Figure 9
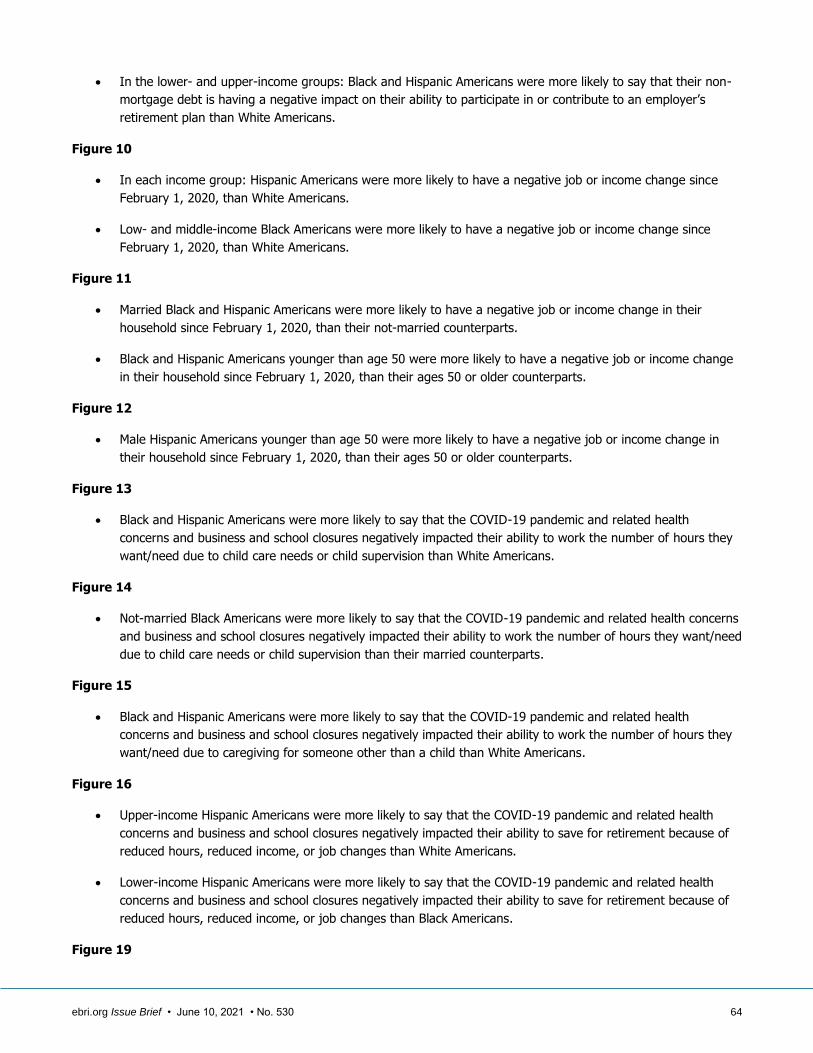
ebri.org Issue Brief • June 10, 2021 • No. 530 64
• In the lower- and upper-income groups: Black and Hispanic Americans were more likely to say that their non-
mortgage debt is having a negative impact on their ability to participate in or contribute to an employer’s
retirement plan than White Americans.
Figure 10
• In each income group: Hispanic Americans were more likely to have a negative job or income change since
February 1, 2020, than White Americans.
• Low- and middle-income Black Americans were more likely to have a negative job or income change since
February 1, 2020, than White Americans.
Figure 11
• Married Black and Hispanic Americans were more likely to have a negative job or income change in their
household since February 1, 2020, than their not-married counterparts.
• Black and Hispanic Americans younger than age 50 were more likely to have a negative job or income change
in their household since February 1, 2020, than their ages 50 or older counterparts.
Figure 12
• Male Hispanic Americans younger than age 50 were more likely to have a negative job or income change in
their household since February 1, 2020, than their ages 50 or older counterparts.
Figure 13
• Black and Hispanic Americans were more likely to say that the COVID-19 pandemic and related health
concerns and business and school closures negatively impacted their ability to work the number of hours they
want/need due to child care needs or child supervision than White Americans.
Figure 14
• Not-married Black Americans were more likely to say that the COVID-19 pandemic and related health concerns
and business and school closures negatively impacted their ability to work the number of hours they want/need
due to child care needs or child supervision than their married counterparts.
Figure 15
• Black and Hispanic Americans were more likely to say that the COVID-19 pandemic and related health
concerns and business and school closures negatively impacted their ability to work the number of hours they
want/need due to caregiving for someone other than a child than White Americans.
Figure 16
• Upper-income Hispanic Americans were more likely to say that the COVID-19 pandemic and related health
concerns and business and school closures negatively impacted their ability to save for retirement because of
reduced hours, reduced income, or job changes than White Americans.
• Lower-income Hispanic Americans were more likely to say that the COVID-19 pandemic and related health
concerns and business and school closures negatively impacted their ability to save for retirement because of
reduced hours, reduced income, or job changes than Black Americans.
Figure 19

ebri.org Issue Brief • June 10, 2021 • No. 530 65
• Middle-income married White and Hispanic Americans were more likely to be confident that they (and their
spouse) will have enough money to live comfortably throughout their retirement years than their not-married
counterparts.
• Upper-income married White and Hispanic Americans were more likely to be confident that they (and their
spouse) will have enough money to live comfortably throughout their retirement years than their not-married
counterparts.
Figure 20
• Upper-income, U.S.-born Hispanic Americans were more likely to be confident that they (and their spouse) will
have enough money to live comfortably throughout their retirement years than their non-U.S.-born
counterparts.
Figure 21
• In each income group: Black Americans were more likely to say that the COVID-19 pandemic and related
health concerns increased their confidence in having enough money to live comfortably throughout their
retirement years than White Americans.
• Middle- and upper-income Hispanic Americans were more likely to say that the COVID-19 pandemic and
related health concerns increased their confidence in having enough money to live comfortably throughout
their retirement years than White Americans.
• Lower-income Hispanic Americans were more likely to say that the COVID-19 pandemic and related health
concerns decreased their confidence in having enough money to live comfortably throughout their retirement
years than White Americans.
Figure 22
• Not-married Hispanic Americans and female Black and Hispanic Americans were more likely to say that the
COVID-19 pandemic and related health concerns decreased their confidence in having enough money to live
comfortably throughout their retirement years than their male counterparts.
Figure 23
• Upper-income White Americans were more likely to be confident that they will have enough money to take
care of their basic expenses during their retirement than Black Americans.
Figure 24
• Lower-income Black Americans were more likely to be confident that they are doing/did a good job preparing
financially for their retirement than Hispanic Americans.
Figure 25
• Lower-income White and Hispanic Americans were more likely to agree that preparing for retirement makes
them feel stressed than Black Americans.
• Upper-income Hispanic Americans were more likely to agree that preparing for retirement makes them feel
stressed than White Americans.
Figure 26
ebri.org Issue Brief • June 10, 2021 • No. 530 66
• Lower- and upper-income Black Americans were more likely to be confident that the Social Security system will
continue to provide benefits of at least equal value to the benefits received by retirees today than White
Americans.
• Middle-income Hispanic Americans were more likely to be confident that the Social Security system will
continue to provide benefits of at least equal value to the benefits received by retirees today than White
Americans.
Figure 27
• Lower- and upper-income Black Americans were more likely to be confident that the Medicare system will
continue to provide benefits of at least equal value to the benefits received by retirees today than White
Americans.
• Middle-income Hispanic Americans were more likely to be confident that the Medicare system will continue to
provide benefits of at least equal value to the benefits received by retirees today than White Americans.
Figure 28
• In the middle-income group: White Americans were more likely to agree that their parents or in-laws are/were
good at managing their money than Black and Hispanic Americans.
Figure 29
• In the middle-and upper-income groups: White Americans were more likely to agree that their parents had or
are having a financially comfortable retirement than Black Americans.
Figure 30
• In the lower-income group: Black Americans were more likely to agree that as a child or young adult, they
were taught how to save and invest for the future than White and Hispanic Americans.
• In the middle- and upper-income groups: White Americans were more likely to agree that as a child or young
adult, they were taught how to save and invest for the future than Black Americans.
Figure 32
• In the lower-income group: White Americans were more likely to strongly or somewhat agree that they feel
knowledgeable about managing their day-to-day finances than Black and Hispanic Americans.
Figure 33
• In the lower-income group: White Americans were more likely to strongly or somewhat agree that they feel
knowledgeable about managing savings and investments for the future than Hispanic Americans.
Figure 34
• Black Americans ages 55 or older were more likely to strongly or somewhat agree that they feel knowledgeable
about managing their day-to-day finances than Black Americans younger than age 55.
• Hispanic Americans ages 65 or older were more likely to strongly or somewhat agree that they feel
knowledgeable about managing their day-to-day finances than Hispanic Americans younger than age 55.
Figure 35
ebri.org Issue Brief • June 10, 2021 • No. 530 67
• Black Americans ages 65 or older were more likely to strongly or somewhat agree that they feel knowledgeable
about managing savings and investments for the future than Black Americans ages 35–54.
• Hispanic Americans ages 25–34 were less likely to strongly or somewhat agree that they feel knowledgeable
about managing savings and investments for the future than Hispanic Americans ages 35 or older.
Figure 36
• In each income group: Hispanic Americans were more likely to strongly or somewhat agree that it is more
important to help friends and family now than to save for their own retirement than White Americans.
• In the upper-income group: Black Americans were more likely to strongly or somewhat agree that it is more
important to help friends and family now than to save for their own retirement than White Americans.
Figure 37
• Among Black Americans, those ages 25–34 were more likely to strongly or somewhat agree that it is more
important to help friends and family now than to save for their own retirement than those ages 45 or older;
those ages 35–54 were more likely than those ages 55 or older.
• Among Hispanic Americans, those ages 25–34 were more likely to strongly or somewhat agree that it is more
important to help friends and family now than to save for their own retirement than those ages 45 or older;
those ages 35–44 were more likely than those ages 55 or older, and those ages 45–54 were more likely than
those ages 65 or older.
Figure 38
• Hispanic Americans in the higher two income groups and Black Americans in the middle-income group were
more likely to strongly or somewhat agree that retirement savings is not a priority relative to the current needs
of their family than White Americans.
Figure 39
• Hispanic Americans ages 25–44 were more likely to strongly or somewhat agree that retirement savings is not
a priority relative to the current needs of their family than those ages 55 or older.
• Black Americans ages 25–34 were more likely to strongly or somewhat agree that retirement savings is not a
priority relative to the current needs of their family than those ages 45 or older.
Figure 40
• Upper-income, U.S.-born Hispanic Americans were more likely to strongly or somewhat agree that retirement
savings is not a priority relative to the current needs of their family than non-U.S.-born Hispanic Americans.
Figure 41
• In each income group: Hispanic Americans were more likely to agree that saving for a child’s education or
paying off a child’s education is reducing how much they can save for retirement than White Americans, and
middle-income Hispanic Americans were also more likely than Black Americans to agree with this statement.
• Lower- and upper-income Black Americans were more likely to agree that saving for a child’s education or
paying off a child’s education is reducing how much they can save for retirement than White Americans.
Figure 42

ebri.org Issue Brief • June 10, 2021 • No. 530 68
• Male Black and Hispanic Americans were more likely to agree that saving for a child’s education or paying off a
child’s education is reducing how much they can save for retirement than their female counterparts.
Figure 43
• Hispanic Americans in the lower- and middle-income groups and Black Americans in the middle- and upper-
income groups were more likely to disagree that they feel they have been fairly treated by financial services
companies and their representatives than White Americans in those income groups.
Figure 44
• Hispanic Americans ages 35–44 were more likely to agree that they feel they have been fairly treated by
financial services companies and their representatives than Hispanic Americans ages 45–64.
Figure 46
• Not-married Black Americans were more likely to agree that they do not know who to go to for good financial
or retirement planning advice than their married counterparts.
• Black Americans ages 25–34 were more likely to agree that they do not know who to go to for good financial
or retirement planning advice than Black Americans ages 55 or older.
• Hispanic Americans ages 25–34 were more likely to agree that they do not know who to go to for good
financial or retirement planning advice than Black Americans ages 45 or older.
• Hispanic Americans ages 35–44 were more likely to agree that they do not know who to go to for good
financial or retirement planning advice than Black Americans ages 55 or older.
• Hispanic Americans ages 45–54 were more likely to agree that they do not know who to go to for good
financial or retirement planning advice than Black Americans ages 65 or older.
Figure 47
• A personal, professional advisor: White Americans were more likely to use this source than Black Americans.
• Their employer or information they receive at work: Black and Hispanic Americans were more likely to use this
source than White Americans.
• Representatives from their workplace retirement plan provider: Black and Hispanic Americans were more likely
to use this source than White Americans.
• Online advice or advisors that provide guidance based on formulas: Hispanic Americans were more likely to use
this source than White Americans.
• Libraries or community centers: Black and Hispanic Americans were more likely to use this source than White
Americans; Black Americans were more likely to use this source than Hispanic Americans.
• Church/religious centers or leaders: Black and Hispanic Americans were more likely to use this source than
White Americans.
Figure 48
• White and Hispanic workers and retirees were more likely to say they are currently working with a professional
financial advisor than Black workers and retirees.

ebri.org Issue Brief • June 10, 2021 • No. 530 69
• White retirees were more likely to say they are currently working with a professional financial advisor than
Hispanic retirees.
• Black and Hispanic retirees were more likely to say they think they will work with a professional financial
advisor in the future than White retirees.
Figure 49
• Middle-income White Americans were more likely to say they are currently working with a professional financial
advisor than Black Americans.
Figure 50
• Black and Hispanic Americans were more likely to say they used the following criteria when looking for a
professional financial advisor than White Americans: has a similar upbringing or life experiences as them,
affiliated with their employer, has a similar racial/ethnic background to them, and that is the same gender as
them.
Figure 51
• Working with an advisor that has a similar racial/ethnic background as them: Black Americans ages 25–34
were more likely to use this criterion than those ages 35 or older; Black Americans ages 35–54 were more
likely to use this criterion than those ages 55 or older; and Hispanic Americans ages 25–54 were more likely to
use this criterion than those ages 55 or older.
• Working with an advisor that is the same gender as them: Black Americans ages 25–34 were more likely to use
this criterion than those ages 35 or older; Black Americans ages 35–44 were more likely to use this criterion
than those ages 55 or older; Black Americans ages 45–54 were more likely to use this criterion than those ages
55–64; Hispanic Americans ages 25–54 were more likely to use this criterion than those ages 55 or older; and
Hispanic Americans ages 55-64 were more likely to use this criterion than those ages 65 or older.
• Working with an advisor who is affiliated with their employer in some way: Black Americans ages 25–34 were
more likely to use this criterion than those ages 35 or older; Black Americans ages 35–54 were more likely to
use this criterion than those ages 65 or older; Hispanic Americans ages 25–54 were more likely to use this
criterion than those ages 55 or older; and Hispanic Americans ages 55–64 were more likely to use this criterion
than those ages 65 or older.
• Working with an advisor who has had a similar upbringing or life experiences as them: Black Americans ages
25–34 were more likely to use this criterion than those ages 35 or older; Black Americans ages 35–44 were
more likely to use this criterion than those ages 55 or older; Hispanic Americans ages 25–44 were more likely
to use this criterion than those ages 55 or older; and Hispanic Americans ages 45–54 were more likely to use
this criterion than those ages 65 or older.
Figure 52
• Lower-income Hispanic Americans were more likely to have tried to figure out how much money they will need
to have saved by the time they retire so that they can live comfortably in retirement than White Americans.
Figure 53
• Male and married Black and Hispanic Americans were more likely to have tried to figure out how much money
they will need to have saved by the time they retire so that they can live comfortably in retirement than their
female and not-married counterparts.

ebri.org Issue Brief • June 10, 2021 • No. 530 70
Figure 54
• Middle-income male Black Americans were more likely to have tried to figure out how much money they will
need to have saved by the time they retire so that they can live comfortably in retirement than their female
counterparts
• Lower-income married Black Americans were more likely to have tried to figure out how much money they will
need to have saved by the time they retire so that they can live comfortably in retirement than their not-
married counterparts.
• Upper-income married Hispanic Americans were more likely to have tried to figure out how much money they
will need to have saved by the time they retire so that they can live comfortably in retirement than their not-
married counterparts.
Figure 55
• Among Americans of each race/ethnicity, those who tried to figure out how much money they will need to
have saved by the time they retire so that they can live comfortably in retirement were more likely to be
confident that they will have enough money to live comfortably throughout their retirement years than those
who did not try figure out how much money they will need.
Figure 56
• Lower- and upper-income White Americans were more likely to have personally saved any money for
retirement (not including Social Security or employer-provided money) than Black Americans.
• Middle-income White Americans were more likely to have personally saved any money for retirement (not
including Social Security or employer-provided money) than Hispanic Americans.
Figure 57
• Lower-income male Black Americans were more likely to have personally saved any money for retirement (not
including Social Security or employer-provided money) than their female counterparts.
Figure 58
• Upper-income married White, Black, and Hispanic Americans were more likely to have personally saved any
money for retirement (not including Social Security or employer-provided money) than their not-married
counterparts.
Figure 59
• Middle-income White Americans were more likely to agree that they have enough savings to handle an
emergency or sudden large expense than Black and Hispanic Americans.
• Middle-income Hispanic Americans were more likely to agree that they have enough savings to handle an
emergency or sudden large expense than Black Americans.
• Upper-income White Americans were more likely to agree that they have enough savings to handle an
emergency or sudden large expense than Black Americans.
Figure 62
• Black and Hispanic Americans were more likely to say that they retired earlier than planned than White
Americans.

ebri.org Issue Brief • June 10, 2021 • No. 530 71
Figure 63
• Not-married Black and Hispanic Americans were more likely to say that they retired earlier than planned than
their married counterparts.
• Female Hispanic Americans were more likely to say that they retired earlier than planned than their male
counterparts.
Figure 65
• Black and Hispanic Americans were more likely to have adjusted their target retirement age since January 1,
2020, to retire later than White Americans.
Figure 67
• Middle-income White Americans were more likely to use the default option than Hispanic Americans.
• Middle-income Hispanic Americans were more likely to actively choose their investments than White Americans.
Figure 73
• Hispanic Americans were more likely to say that it would be valuable to them if their retirement plan savings
with a previous employer were automatically transferred to their current employer’s plan if/when they changed
jobs than White Americans.
Figure 75
• Black and Hispanic Americans were more likely to have taken the following from their retirement plan than
White Americans: a loan from the plan (the borrowed amount is paid back with interest through payroll
deduction), a hardship distribution from the plan (a withdrawal made because of a heavy and immediate
financial need), an early withdrawal from the plan (a withdrawal made before age 59 ½ that you typically pay
a tax penalty for), and some other type of withdrawal or distribution.
Figure 76
• Lower- and middle-income Black Americans were more likely to have taken a loan from the plan (the borrowed
amount is paid back with interest through payroll deduction) than White Americans.
• Upper-income Black and Hispanic Americans were more likely to have taken a loan from the plan (the
borrowed amount is paid back with interest through payroll deduction) than White Americans.
Figure 77
• Lower- and upper-income Black and Hispanic Americans were more likely to have taken a hardship distribution
from the plan (a withdrawal made because of a heavy and immediate financial need) than White Americans.
• Middle-income Black Americans were more likely to have taken a hardship distribution from the plan (a
withdrawal made because of a heavy and immediate financial need) than White and Hispanic Americans.
Figure 78
• Middle-income Black Americans were more likely to have taken an early withdrawal from the plan (a
withdrawal made before age 59 ½ that you typically pay a tax penalty for) than White Americans.

ebri.org Issue Brief • June 10, 2021 • No. 530 72
• Upper-income Black and Hispanic Americans were more likely to have taken an early withdrawal from the plan
(a withdrawal made before age 59 ½ that you typically pay a tax penalty for) than White Americans.
Figure 79
• Lower-income Black Americans were more likely to have taken some other type of withdrawal or distribution
than White and Hispanic Americans.
• Upper-income Hispanic Americans were more likely to have taken some other type of withdrawal or distribution
than White Americans.
Figure 81
• White workers were more likely to expect that Social Security will be a major/minor source of income in
retirement than Hispanic workers.
• White workers were more likely to expect that IRAs and workplace retirement savings plans will be
major/minor sources of income in retirement than Black workers.
Figure 82
• Black and Hispanic workers were more likely to expect that a product that guarantees monthly income for life,
such as an annuity, will be a major/minor source of income in retirement than White workers.
• Black workers were more likely to expect that financial support from family or friends, including inheritances,
will be a major/minor source of income in retirement than White and Hispanic workers.
• Hispanic workers were more likely to expect that financial support from family or friends, including
inheritances, will be a major/minor source of income in retirement than White workers.
Figure 83
• White retirees were more likely to say that Social Security is a major/minor source of income in retirement than
Black retirees.
• White retirees were more likely to say that personal retirement savings is a major/minor source of income in
retirement than Black and Hispanic retirees.
• Hispanic retirees were more likely to say that personal retirement savings is a major/minor source of income in
retirement than Black retirees.
• White retirees were more likely to say that an IRA is a major/minor source of income in retirement than Black
and Hispanic retirees.
• Hispanic retirees were more likely to say that an IRA is a major/minor source of income in retirement than
Black retirees.
Figure 84
• Black and Hispanic retirees were more likely to say that work for pay is a major/minor source of income in
retirement than White retirees.
• Black and Hispanic retirees were more likely to say that financial support from family or friends, including
inheritances, is a major/minor source of income in retirement than White retirees.

ebri.org Issue Brief • June 10, 2021 • No. 530 73
Figure 86
• Black and Hispanic retirees were more likely to say that the following reasons are why they worked for pay
after they retired than White retirees: needing money to make ends meet and to help financially support
others.
• Hispanic retirees were more likely to say that the following reason is why they worked for pay after they retired
than White retirees: wanting money to buy extras.
Figure 88
• Black and Hispanic retirees were more likely to say that the following expenses were higher now than what
they expected when they first retired than White retirees: overall expenses/spending and spending to support
or help a family member.
Figure 89
• White and Hispanic retirees were more likely to say that they try to increase their asset level than Black
retirees.
• White retirees were more likely to say that they try to maintain their current asset level than Black and
Hispanic retirees.
• Black retirees were more likely to say that they have no assets/not applicable than White and Hispanic retirees.
Figure 90
• Lower-income White retirees were more likely to say that they try to maintain their current asset level than
Black and Hispanic retirees.
• Lower- and middle-income Black retirees were more likely to say that have no assets/not applicable than White
retirees.
• Lower-income Black retirees were more likely to say that have no assets/not applicable than Hispanic retirees.
• Middle-income Hispanic retirees were more likely to say that they try to increase their asset level than Black
retirees.
ebri.org Issue Brief • June 10, 2021 • No. 530 74
Endnotes
1 See Appendix 1 of this study for the survey details. Also see the 2021 Retirement Confidence Survey, April 2021, at https://www.ebri.org/docs/default-source/rcs/2021-rcs/2021-rcs-summary-report.pdf, and the associated fact sheets at https://www.ebri.org/retirement/retirement-confidence-survey for specific results from the 2021 survey.
2 An oversample refers to collecting more data from groups that are a lower share of the population in order to do a more complete analysis of these groups by having a sufficient sample size to control for other variables besides just the variable of interest, in this case race and ethnicity. However, the overall results are weighted to retain national representation despite the larger sample of Black and Hispanic Americans than would actually be found in the population.
3 Flood, Sarah, Miriam King, Renae Rodgers, Steven Ruggles, and J. Robert Warren. Integrated Public Use Microdata Series, Current Population Survey: Version 8.0 [dataset]. Minneapolis, MN: IPUMS, 2020. https://doi.org/10.18128/D030.V8.0
4 In other studies, it was shown that Hispanic Americans born outside of the United States were less likely to participate in a workplace retirement plan even when controlling for income. For example, see Copeland, Craig, “Retirement Plan Participation and the Current Population Survey: The Impact of New Income Questions on These Estimates,” EBRI Issue Brief no. 499 (Employee Benefit Research Institute, January 20, 2020).
5 The Retirement Confidence Survey does not ask what this teaching about savings and investing involves. Ariel Investments and Charles Schwab asked Black investors what financial topics they talked about with their parents when they were growing up, and the results showed that most of the financial topics were equally likely to be discussed between Black and White investors, except for the stock market, where Black investors were much less likely to discuss it. These discussions are now more likely to be occurring among Black investors. See Ariel Investments and Charles Schwab, “Black Investor Survey 2020: Report of Findings.” February 2021 at https://www.arielinvestments.com/images/stories/PDF/ariel-schwab-black-investor-survey-2020.pdf
6 In a study on the financial wellbeing of women, Black and Hispanic women were found to score lower on a three-question test on financial literacy than White women were, although the scores overall were low. For more information, see Robert Clark et al. “Financial Well-being Among Black and Hispanic Women.” GFLEC Working Paper Series WP 2021-1, February 2021 available at https://gflec.org/wp-content/uploads/2021/02/Financial-Well-being-among-Black-and-Hispanic-Women-WP-Feb2021.pdf?x27564
7 The sources offered as choices were online resources and research you do on your own; family and friends; a personal, professional financial advisor; your employer or information you receive at work; representatives from your workplace retirement plan provider; online advice or advisors that provide guidance based on formulas; financial experts or gurus in the
media; libraries or community centers; church/religious centers or leaders; and other.
8 The list of reasons for retiring earlier than planned offered as choices included the following: You could afford to retire earlier than you planned; You (had/have) a health problem or a disability, not related to COVID-19; There (were/have been) changes at your company, such as downsizing, closure or reorganization, not due to COVID-19 crisis; Because of changes in the skills required for your job or your skills no longer matching job requirements; You (wanted/want) to do something else; You (had/have) to care for a spouse or another family member; There (were/have been) changes at your company, such as downsizing, closure or reorganization, as a result of the COVID-19 crisis; The nature of your work or risk associated with your work changed due to COVID-19, and you no longer (wished/wish) to work anymore; You or someone in your household (had/have) an issue that was related to COVID-19; You were offered an early retirement package or your employer incentivized you to take an early retirement; and You had another work-related reason.
9 The list of factors offered for choosing investments included the following: Performance/growth over time, Matches your risk tolerance, Fees, Recommendations of a professional financial advisor, Easy investment that adjusts for you based on age or risk tolerance, Investment matches a well-known index, It’s the employer default option, Recommendations from a friend or family, Recognize/know the name of fund/investment company, Investment is actively managed by a fund manager, Matches
your views on social and environmental causes, Other, and None of these.
10 The list of potential improvements offered as choices included the following: Better explanations for how much income your savings will produce in retirement; More fund or investment options available; Better explanations for whether you are on track with your retirement savings; More one-on-one, personalized education; More online educational tools; More investment options designed for after you retire; More environmentally or socially responsible investment options available (ESG); Fewer investment options available; Other; and None of the above.
11 The list of reasons for taking a loan or a withdrawal offered as choices included the following: To buy a home, car, or other large purchase; To pay off credit card bill or credit card debt; To cover another emergency expense; To make ends meet; Because of job loss or a spouse’s job loss; To cover a financial need as a result of COVID-19; To cover an education expense (tuition, student loans); To cover medical expenses; To pay for home or car repairs; To pay for child care, eldercare, or another caregiving obligation; Required Minimum Distribution (RMD); and Other.

ebri.org Issue Brief • June 10, 2021 • No. 530 75
12 The list of reasons for working for pay after retirement offered as choices included the following: Needing money to make
ends meet; Wanting money to buy extras; Trying a different career; Enjoying working; Wanting to stay active and involved; Keeping health insurance or other benefits; A decrease in the value of your savings or investments; A job opportunity; To help financially support others; and To avoid reducing your savings, your “nest egg”.