2021 outlook faster, higher, stronger
TRANSCRIPT

JM Financial Institutional Securities Limited
JM Financial Research is also available on: Bloomberg - JMFR <GO>, Thomson Publisher & Reuters,
S&P Capital IQ, FactSet and Visible Alpha Please see Appendix I at the end of this report for Important Disclosures and
Disclaimers and Research Analyst
Certification.
NBFC
Entering into 2021, we believe NBFCs are well placed for a strong revival driven by, a)
significantly improved, diversified and granular liability profile, b) resilient ALMs with highest
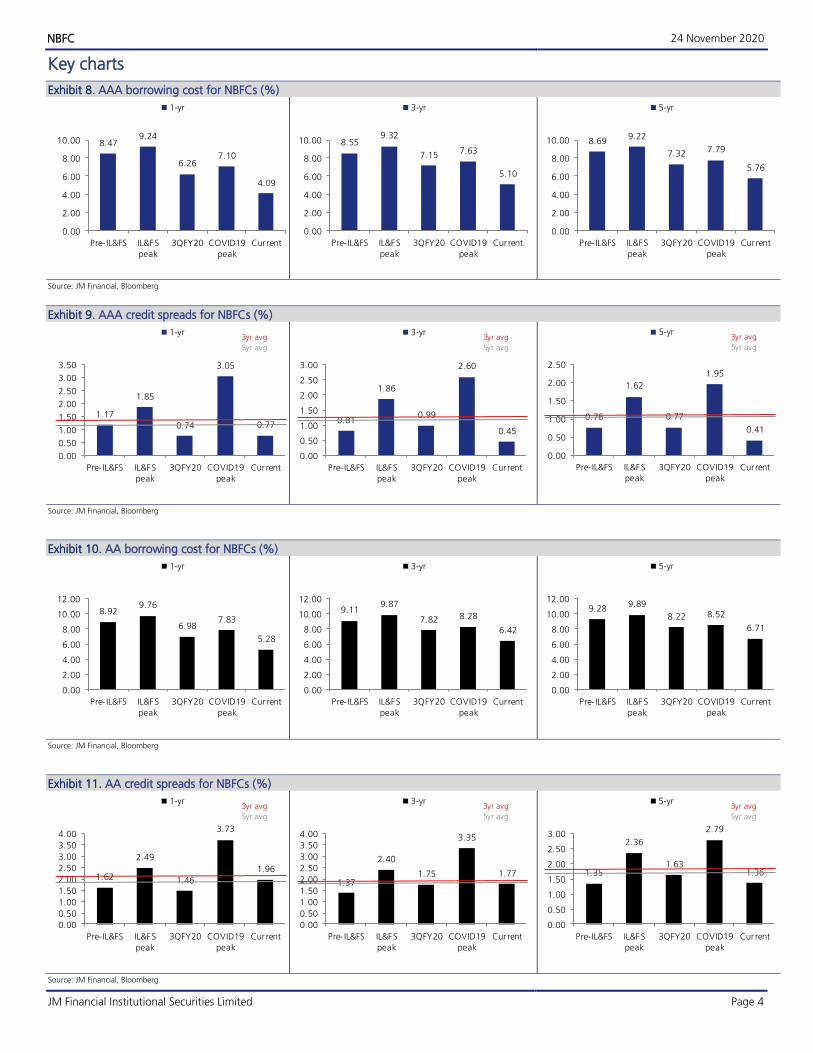
ever on-BS liquidity, c) continued fall in spreads and rates - AAA 1-yr/AA 1-yr credit spreads
are further down by 60/40bps with yields down c.90/70bps since our last note. Cumulatively,
since the May’20 SPV announcement AAA NBFC 1-yr spread is down c.180bps to 77bps vs
LTAs of 130bps. Similarly, AA NBFC 1-yr spread is down 145bps to 196bps, a tad higher than
LTAs of c.190bps. Overall, 1-yr yield at 4.1% for AAA NBFCs and at 5.3% for AA NBFCs is
the lowest in nearly a decade, and d) fortified BS with COVID19 provs of upto 270bps, high
S1&2 coverage and strong capitalisation levels with T1 highest in operating history at 15-
23%. Overall theme for 2021 will be “Faster, Higher and Stronger” in our opinion i.e. 1)
Faster growth aided by improving liability mix and pickup in overall economic recovery, 2)
Higher profitability driven by lower credit costs and 3) Stronger liability profile and fortified
balance sheet. We forecast FY22E PAT growth of c.60% YoY for diversified NBFCs, c.60%
for vehicle financiers and 15% for HFCs on the back of AUM growth of c.17% YoY for
diversified NBFCs, 14% for vehicle financiers and 8% for HFCs. Our preferred picks in the
space are Bajaj Finance, HDFC, MMFS and CIFC. Cyclically, declining AAA rates could help
LICHF to rerate from current levels.
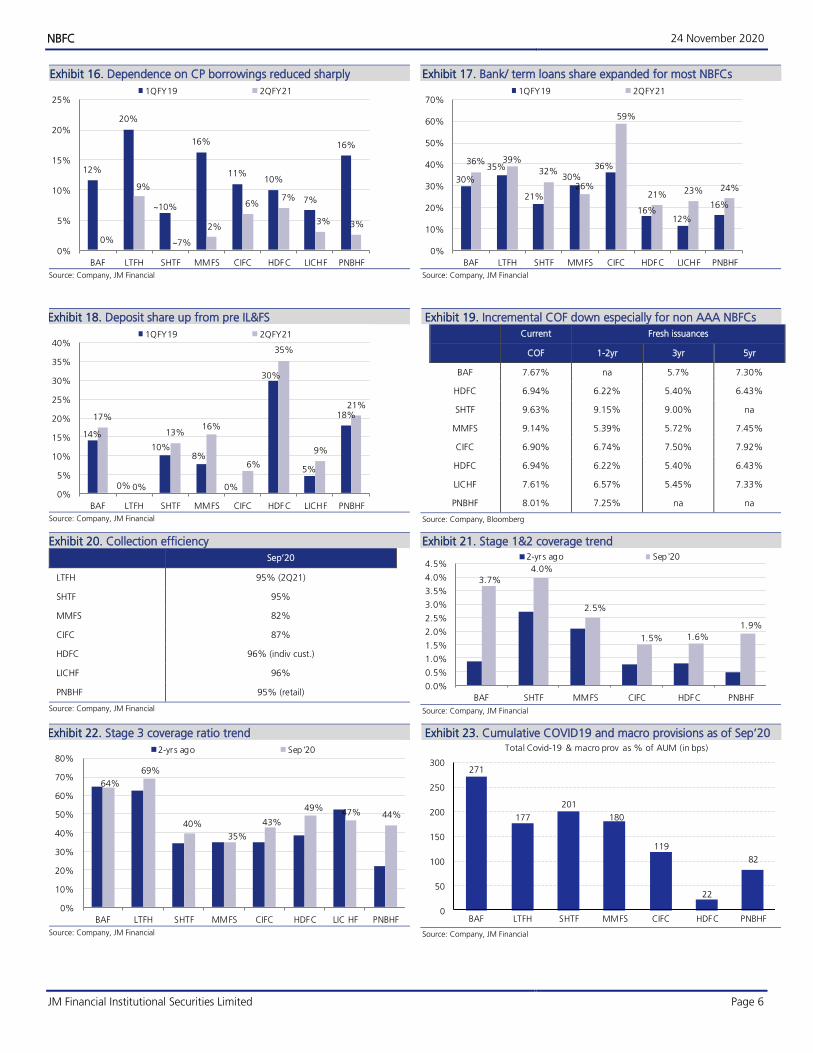
Stronger liability profile with focus on diversified/ sticky sources and reduced reliance on
CPs: NBFCs currently boast stronger liability profiles with a) share of shorter-duration CPs
down to 4% on avg. vs 10-20% of borrowings before IL&FS, b) share of stable bank
loans has gone up to 33% as of 2QFY21 vs 25% in part aided by measures like TLTRO
and decade low benchmark rates, c) rise share of deposits to c.20% of borrowings as of
2QFY21 vs 14% pre-IL&FS as deposit taking NBFCs have increasingly invested in sourcing.
We believe improved borrowing profile and reduced risk aversion towards NBFCS sets the
foundation for a strong revival 2021 onwards.
Stronger ALMs with highest ever on-BS liquidity: ALM profile for NBFCs under our
coverage has witnessed an improvement, wherein BAF and HDFC stand out with
consistently best-in-class ALM even prior to IL&FS. Further on-BS liquidity for NBFCs has
increased from c.7% in 2QFY19 to 11% as of 2QFY21. Going ahead, we believe
normalisation of on-BS liquidity and lower funding costs should aid margin expansion.
Falling spreads resulting in lower incremental borrowing costs: 1yr AAA/AA credit spreads
for NBFCs are down c.180/145bps and 3yr AAA/AA credit spreads are down
c.160/120bps since the May'20 SPV announcement reflecting lower risk aversion given
GOI/RBI steps and positive commentary around CE for out-of-morat borrowers. AAA
credit spreads for NBFCs are already below their LTAs at 77bps for 1yr paper (vs 3/5yr avg
of 145/130bps) and at 45bps for 3yr paper (vs 3/5yr avg of 120/110bps). AA spreads are
at near LTAs (196bps for 1yr paper now vs 3/5yr avg of 210/190bps; 180bps for 3yr
paper vs 3/5yr avg of 190/180bps) which we believe should trend down given GOI/RBI
measures (incl. ECLGS 2.0) and system liquidity which continues to remain in surplus
(c.INR6 trillion). During 2QFY21, most NBFCs under coverage reported meaningful decline
in on-BS funding costs - down 30bps QoQ / c.60bps YoY on avg. On an incremental
basis, fresh borrowing data for coverage set reveals 1/3/5yr rates to have declined by
c.20bps on avg with higher benefit being seen by lower rated peers.
High COVID19 provisions, improvement in CE and expectation of single-digit restructured
portfolio provides comfort: On asset quality front, NBFCs are now better placed given i)
upto 270bps of COVID19 provisions, ii) significant improvement in collection efficiency
(refer exhibit 20), and iii) expectation of restructuring staying under control at 3-7% of
the book. On capital front, the sector is extremely well capitalised with T1 ratios highest
in operating history at 15-23%. Consequently, we expect the phase of further credit
downgrades for the sector to have ended. There could be rating upgrades beginning
2021.
24 November 2020 India | NBFC | Sector Update
2021 Outlook – Faster, Higher, Stronger
Karan Singh [email protected] | Tel: (91 22) 66303082
Bunny Babjee [email protected] | Tel: (91 22) 66303263
Anuj Narula [email protected] | Tel: (91 22) 62241877
Sameer Bhise [email protected] | Tel: (91 22) 66303489
Akshay Jain [email protected] | Tel: (91 22) 66303099
Ankit Bihani [email protected] | Tel: (91 22) 62241881
CMP Target Multiple
(FY22e P/B) TP Upside
BAF 4,811 6.80x 5,000 4%
LTFH 73 0.85x 77 5%
SHTF 975 1.00x 1,000 3%
MMFS* 155 1.25x 200 29%
CIFC 352 2.60x 380 8%
HDFC* 2,333 2.10x 2,600 11%
LICHF 322 0.90x 425 32%
PNBHF 378 0.75x 400 6%
Source: Bloomberg, JM Financial; *Standalone
RoA and RoE
RoA RoE
FY21E FY22E FY21E FY22E
BAF 2.8% 4.3% 13.5% 20.3%
LTFH 1.1% 1.5% 7.8% 10.4%
SHTF 2.2% 2.8% 13.0% 14.8%
MMFS 1.4% 2.7% 8.1% 13.7%
CIFC 2.5% 2.9% 19.1% 20.7%
HDFC 1.9% 2.1% 11.1% 12.1%
LICHF 1.3% 1.3% 14.7% 14.4%
PNBHF 1.2% 1.3% 10.0% 9.1%
Source: Bloomberg, JM Financial

NBFC 24 November 2020
JM Financial Institutional Securities Limited Page 2
Growth to accelerate in 2021 aided by improving liability mix and pickup in overall
economic recovery: We expect growth to revive from 7% YoY in FY21 to 14% in FY22
aided by improving liability mix and pickup in overall economic recovery. Diversified NBFC
like BAF will witness highest growth acceleration from 7% YoY in FY21E to c.30% in
FY22E.
Profitability to improve driven by lower credit costs: We forecast FY22E PAT growth of
c.60% YoY for diversified NBFCs, c.60% for vehicle financiers and 15% for HFCs on the
back of AUM growth of c.17% YoY for diversified NBFCs, 14% for vehicle financiers and
8% for HFCs. Accordingly, ROAs are expected to improve by c.100bps YoY for diversified
NBFCs, c.70bps for vehicle financiers and c.10bps for HFCs driven by lower credit costs.
Our preferred picks in the space are Bajaj Finance, HDFC, MMFS and CIFC. Cyclically,
declining AAA rates could help LICHF to rerate from current levels.
Key risks: 1) COVID19 crisis continues to impact the economy adversely in FY22, 2) RBI
changing its stance with respect to liquidity, 3) Any NBFC converting into a bank (IWG
report) will be disruptive to return ratios over 2-3 years given investment in bank branches
and regulatory requirements such as SLR, CRR and PSL.
JMFL coverage universe: Valuations Exhibit 1.
Mkt Cap RoA RoE P/B (x) P/E (x)
($ bn) FY20 FY21E FY22E FY20 FY21E FY22E FY20 FY21E FY22E FY20 FY21E FY22E
BAF 39.1 3.6% 2.8% 4.3% 20.2% 13.5% 20.3% 8.9 7.8 6.5 54.8 61.7 35.1
LTFH 2.0 1.6% 1.1% 1.5% 12.1% 7.8% 10.4% 1.0 0.9 0.8 8.7 12.3 8.5
SHTF 3.3 2.3% 2.2% 2.8% 14.8% 13.0% 14.8% 1.2 1.1 1.0 8.8 9.5 7.1
MMFS (Standalone) 2.6 1.3% 1.4% 2.7% 8.2% 8.1% 13.7% 0.8 1.1 1.0 9.7 16.2 7.7
CIFC 3.9 1.7% 2.5% 2.9% 14.7% 19.1% 20.7% 3.5 2.9 2.4 27.4 16.7 12.8
HDFC (Standalone) 54.6 3.6% 1.9% 2.1% 21.7%* 11.1% 12.1% 1.8 1.5 1.4 8.6 14.8 11.8
LICHF 2.2 1.2% 1.3% 1.3% 13.9% 14.7% 14.4% 0.9 0.8 0.7 6.8 5.7 5.1
PNBHF 0.9 0.8% 1.2% 1.3% 8.3% 10.0% 9.1% 0.8 0.8 0.8 9.8 9.3 8.6
Source: Bloomberg, JM Financial; *Includes capital gains on GRUH sale

NBFC 24 November 2020
JM Financial Institutional Securities Limited Page 3
CY2021 1) Growth revival in FY22
Stronger growth in FY22 Exhibit 2.
29%
6%7%
15%
19%
15%
8%
2%
-10%
-5%
0%
5%
10%
15%
20%
25%
30%
BAF LTFH SHTF MMFS CIFC HDFC LICHF PNBHF
A UM growthFY21E FY22E
Source: Company, JM Financial
Pickup in NII driven by strong AUM growth Exhibit 3.
21%
8%
13%
23%20%
17%
11%
2%
-10%
-5%
0%
5%
10%
15%
20%
25%
30%
BAF LTFH SHTF MMFS CIFC HDFC LICHF PNBHF
NII growthFY21E FY22E
Source: Company, JM Financial
2) Improvement in profitability
Strong PAT growth in FY22 for most of the NBFCs… Exhibit 4.
76%
44%34%
110%
30%26%
12%8%
-50%
-30%
-10%
10%
30%
50%
70%
90%
110%
BAF LTFH SHTF MMFS CIFC HDFC LICHF PNBHF
PA T growthFY21E FY22E
Source: Company, JM Financial
…with meaningful improvement in RoA Exhibit 5.
4.3%
1.5%
2.8% 2.7%2.9%
2.1%
1.3% 1.3%
0.0%
1.0%
2.0%
3.0%
4.0%
5.0%
6.0%
BAF LTFH SHTF MMFS CIFC HDFC LICHF PNBHF
RoAFY21E FY22E
Source: Company, JM Financial
3) Fortified balance sheet
Significant expansion in Stage 1&2 coverage ratio over past Exhibit 6.few quarters
3.7%
4.0%
2.5%
1.5% 1.6%
1.9%
0.0%
0.5%
1.0%
1.5%
2.0%
2.5%
3.0%
3.5%
4.0%
4.5%
BAF SHTF MMFS CIFC HDFC PNBHF
2-yrs ago Sep'20
Source: Company, JM Financial
Adequately capitalised Exhibit 7.
T1 ratio
(as of 2QFY21)
T1 ratio
(Avg)
BAF 23.0% 17.3%
LTFH 17.3% 13.9%
SHTF 20.1% 15.6%
MMFS 20.8% 15.1%
CIFC 14.9% 13.5%
HDFC 19.5% 15.5%
LICHF 13.0% 12.7%
PNBHF 16.1% 12.9%
Source: Company, JM Financial
NBFC 24 November 2020
JM Financial Institutional Securities Limited Page 4
Key charts
AAA borrowing cost for NBFCs (%) Exhibit 8.
8.479.24
6.267.10
4.09
0.00
2.00
4.00
6.00
8.00
10.00
Pre- IL&FS IL&FS
peak
3QFY20 COVID19
peak
Current
1-yr
8.559.32
7.157.63
5.10
0.00
2.00
4.00
6.00
8.00
10.00
Pre- IL&FS IL&FS
peak
3QFY20 COVID19
peak
Current
3-yr
8.699.22
7.32 7.79
5.76
0.00
2.00
4.00
6.00
8.00
10.00
Pre- IL&FS IL&FS
peak
3QFY20 COVID19
peak
Current
5-yr
Source: JM Financial, Bloomberg
AAA credit spreads for NBFCs (%) Exhibit 9.
1.17
1.85
0.74
3.05
0.77
0.00
0.50
1.00
1.50
2.00
2.50
3.00
3.50
Pre- IL&FS IL&FS
peak
3QFY20 COVID19
peak
Current
1-yr3yr avg
5yr avg
0.81
1.86
0.99
2.60
0.45
0.00
0.50
1.00
1.50
2.00
2.50
3.00
Pre- IL&FS IL&FS
peak
3QFY20 COVID19
peak
Current
3-yr3yr avg
5yr avg
0.76
1.62
0.77
1.95
0.41
0.00
0.50
1.00
1.50
2.00
2.50
Pre- IL&FS IL&FS
peak
3QFY20 COVID19
peak
Current
5-yr3yr avg
5yr avg
Source: JM Financial, Bloomberg
AA borrowing cost for NBFCs (%) Exhibit 10.
8.929.76
6.987.83
5.28
0.00
2.00
4.00
6.00
8.00
10.00
12.00
Pre- IL&FS IL&FS
peak
3QFY20 COVID19
peak
Current
1-yr
9.119.87
7.82 8.28
6.42
0.00
2.00
4.00
6.00
8.00
10.00
12.00
Pre- IL&FS IL&FS
peak
3QFY20 COVID19
peak
Current
3-yr
9.289.89
8.22 8.52
6.71
0.00
2.00
4.00
6.00
8.00
10.00
12.00
Pre- IL&FS IL&FS
peak
3QFY20 COVID19
peak
Current
5-yr
Source: JM Financial, Bloomberg
AA credit spreads for NBFCs (%) Exhibit 11.
1.62
2.49
1.46
3.73
1.96
0.00
0.50
1.00
1.50
2.00
2.50
3.00
3.50
4.00
Pre- IL&FS IL&FS
peak
3QFY20 COVID19
peak
Current
1-yr3yr avg
5yr avg
1.37
2.40
1.75
3.35
1.77
0.00
0.50
1.00
1.50
2.00
2.50
3.00
3.50
4.00
Pre- IL&FS IL&FS
peak
3QFY20 COVID19
peak
Current
3-yr3yr avg
5yr avg
1.35
2.36
1.63
2.79
1.36
0.00
0.50
1.00
1.50
2.00
2.50
3.00
Pre- IL&FS IL&FS
peak
3QFY20 COVID19
peak
Current
5-yr3yr avg
5yr avg
Source: JM Financial, Bloomberg

NBFC 24 November 2020
JM Financial Institutional Securities Limited Page 5
MCLR declined materially across the banks Exhibit 12.
MCLR Current Jul'19 Change (in bps) Pre-ILFS Change (in bps)
6 month 1 year 6 month 1 year 6 month 1 year 6 month 1 year 6 month 1 year
SBIN 6.95% 7.00% 8.25% 8.40% -130 -140 8.10% 8.25% -115 -125
HDFCB 7.10% 7.25% 8.50% 8.70% -140 -145 8.25% 8.40% -115 -115
ICICIBC 7.30% 7.35% 8.60% 8.65% -130 -130 8.35% 8.40% -105 -105
BOB 7.30% 7.45% 8.55% 8.60% -125 -115 8.35% 8.50% -105 -105
AXSB 7.40% 7.45% 8.65% 8.70% -125 -125 8.50% 8.60% -110 -115
Kotak 7.35% 7.35% 8.80% 8.90% -145 -155 8.65% 8.95% -130 -160
IIB 8.65% 8.75% 9.70% 9.75% -105 -100 9.50% 9.55% -85 -80
Source: Company, JM Financial
System in liquidity surplus since Jun’19 Exhibit 13.
5.9
-2.0
0.0
2.0
4.0
6.0
8.0
Apr-
18
Jun-1
8
Aug
-18
Oct
-18
Dec-
18
Feb
-19
Apr-
19
Jun-1
9
Au
g-1
9
Oct
-19
Dec-
19
Feb-2
0
Apr-
20
Jun-2
0
Aug
-20
Oct
-20
Liqu idity O/S (INR trn)
Source: JM Financial, Bloomberg
ALM profiles – under 1-yr bucket mismatch (% of borrowings) Exhibit 14. FY18 FY19 FY20
BAF 26% 21% 18%
LTFH na 22% 26%
SHTF 2% 5% 2%
MMFS 13% 18% 16%
CIFC -13% -5% -7%
HDFC 3% 5% 2%
Source: Company, JM Financial
On-BS liquidity at all time high (% of total assets) Exhibit 15. FY16 FY17 FY18 FY19 FY20 2HFY21
BAF 5.1% 7.0% 4.1% 7.2% 11.5% 15.8%
LTFH 6.2% 9.1% 7.3% 9.9% 12.6% 11.3%
HDFC 7.2% 8.1% 8.1% 10.4% 13.0% 11.3%
SHTF 3.6% 3.6% 3.9% 5.0% 5.5% 10.3%
MMFS 5.3% 5.4% 6.0% 7.1% 9.9% 15.6%
CIFC 3.5% 4.0% 2.2% 6.5% 11.0% 9.8%
HDFC 7.2% 8.1% 8.1% 10.4% 13.0% 11.3%
LICHF 3.2% 3.6% 2.4% 3.3% 3.4% 3.3%
PNBHF 6.3% 8.0% 8.3% 10.2% 13.4% 12.4%
Source: Company, JM Financial; Liquidity includes cash, bank balances and investments
NBFC 24 November 2020
JM Financial Institutional Securities Limited Page 6
Dependence on CP borrowings reduced sharply Exhibit 16.
12%
20%
~10%
16%
11%10%
7%
16%
0%
9%
~7%
2%
6%7%
3% 3%
0%
5%
10%
15%
20%
25%
BAF LTFH SHTF MMFS CIFC HDFC LICHF PNBHF
1QFY19 2QFY21
Source: Company, JM Financial
Bank/ term loans share expanded for most NBFCs Exhibit 17.
30%
35%
21%
30%
36%
16%12%
16%
36% 39%
32%
26%
59%
21% 23% 24%
0%
10%
20%
30%
40%
50%
60%
70%
BAF LTFH SHTF MMFS CIFC HDFC LICHF PNBHF
1QFY19 2QFY21
Source: Company, JM Financial
Deposit share up from pre IL&FS Exhibit 18.
14%
0%
10%8%
0%
30%
5%
18%17%
0%
13%16%
6%
35%
9%
21%
0%
5%
10%
15%
20%
25%
30%
35%
40%
BAF LTFH SHTF MMFS CIFC HDFC LICHF PNBHF
1QFY19 2QFY21
Source: Company, JM Financial
Incremental COF down especially for non AAA NBFCs Exhibit 19.
Current Fresh issuances
COF 1-2yr 3yr 5yr
BAF 7.67% na 5.7% 7.30%
HDFC 6.94% 6.22% 5.40% 6.43%
SHTF 9.63% 9.15% 9.00% na
MMFS 9.14% 5.39% 5.72% 7.45%
CIFC 6.90% 6.74% 7.50% 7.92%
HDFC 6.94% 6.22% 5.40% 6.43%
LICHF 7.61% 6.57% 5.45% 7.33%
PNBHF 8.01% 7.25% na na
Source: Company, Bloomberg
Collection efficiency Exhibit 20.
Sep’20
LTFH 95% (2Q21)
SHTF 95%
MMFS 82%
CIFC 87%
HDFC 96% (indiv cust.)
LICHF 96%
PNBHF 95% (retail)
Source: Company, JM Financial
Stage 1&2 coverage trend Exhibit 21.
3.7%
4.0%
2.5%
1.5% 1.6%
1.9%
0.0%
0.5%
1.0%
1.5%
2.0%
2.5%
3.0%
3.5%
4.0%
4.5%
BAF SHTF MMFS CIFC HDFC PNBHF
2-yrs ago Sep'20
Source: Company, JM Financial
Stage 3 coverage ratio trend Exhibit 22.
64%
69%
40%
35%
43%
49%47% 44%
0%
10%
20%
30%
40%
50%
60%
70%
80%
BAF LTFH SHTF MMFS CIFC HDFC LIC HF PNBHF
2-yrs ago Sep'20
Source: Company, JM Financial
Cumulative COVID19 and macro provisions as of Sep’20 Exhibit 23.
271
177
201
180
119
22
82
0
50
100
150
200
250
300
BAF LTFH SHTF MMFS CIFC HDFC PNBHF
Total Covid-19 & macro prov as % of AUM (in bps)
Source: Company, JM Financial
NBFC 24 November 2020
JM Financial Institutional Securities Limited Page 7
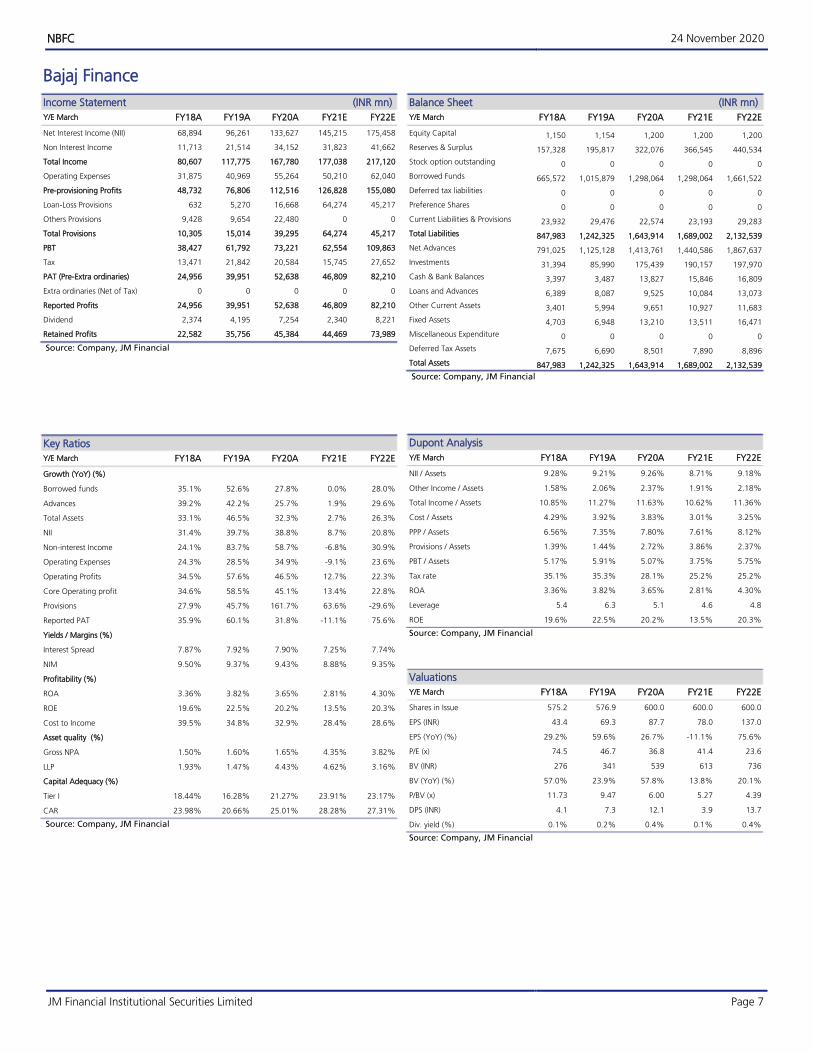
Bajaj Finance
Income Statement (INR mn)
Y/E March FY18A FY19A FY20A FY21E FY22E
Net Interest Income (NII) 68,894 96,261 133,627 145,215 175,458
Non Interest Income 11,713 21,514 34,152 31,823 41,662
Total Income 80,607 117,775 167,780 177,038 217,120
Operating Expenses 31,875 40,969 55,264 50,210 62,040
Pre-provisioning Profits 48,732 76,806 112,516 126,828 155,080
Loan-Loss Provisions 632 5,270 16,668 64,274 45,217
Others Provisions 9,428 9,654 22,480 0 0
Total Provisions 10,305 15,014 39,295 64,274 45,217
PBT 38,427 61,792 73,221 62,554 109,863
Tax 13,471 21,842 20,584 15,745 27,652
PAT (Pre-Extra ordinaries) 24,956 39,951 52,638 46,809 82,210
Extra ordinaries (Net of Tax) 0 0 0 0 0
Reported Profits 24,956 39,951 52,638 46,809 82,210
Dividend 2,374 4,195 7,254 2,340 8,221
Retained Profits 22,582 35,756 45,384 44,469 73,989
Source: Company, JM Financial
Key Ratios
Y/E March FY18A FY19A FY20A FY21E FY22E
Growth (YoY) (%)
Borrowed funds 35.1% 52.6% 27.8% 0.0% 28.0%
Advances 39.2% 42.2% 25.7% 1.9% 29.6%
Total Assets 33.1% 46.5% 32.3% 2.7% 26.3%
NII 31.4% 39.7% 38.8% 8.7% 20.8%
Non-interest Income 24.1% 83.7% 58.7% -6.8% 30.9%
Operating Expenses 24.3% 28.5% 34.9% -9.1% 23.6%
Operating Profits 34.5% 57.6% 46.5% 12.7% 22.3%
Core Operating profit 34.6% 58.5% 45.1% 13.4% 22.8%
Provisions 27.9% 45.7% 161.7% 63.6% -29.6%
Reported PAT 35.9% 60.1% 31.8% -11.1% 75.6%
Yields / Margins (%)
Interest Spread 7.87% 7.92% 7.90% 7.25% 7.74%
NIM 9.50% 9.37% 9.43% 8.88% 9.35%
Profitability (%)
ROA 3.36% 3.82% 3.65% 2.81% 4.30%
ROE 19.6% 22.5% 20.2% 13.5% 20.3%
Cost to Income 39.5% 34.8% 32.9% 28.4% 28.6%
Asset quality (%)
Gross NPA 1.50% 1.60% 1.65% 4.35% 3.82%
LLP 1.93% 1.47% 4.43% 4.62% 3.16%
Capital Adequacy (%)
Tier I 18.44% 16.28% 21.27% 23.91% 23.17%
CAR 23.98% 20.66% 25.01% 28.28% 27.31%
Source: Company, JM Financial
Balance Sheet (INR mn)
Y/E March FY18A FY19A FY20A FY21E FY22E
Equity Capital 1,150 1,154 1,200 1,200 1,200
Reserves & Surplus 157,328 195,817 322,076 366,545 440,534
Stock option outstanding 0 0 0 0 0
Borrowed Funds 665,572 1,015,879 1,298,064 1,298,064 1,661,522
Deferred tax liabilities 0 0 0 0 0
Preference Shares 0 0 0 0 0
Current Liabilities & Provisions 23,932 29,476 22,574 23,193 29,283
Total Liabilities 847,983 1,242,325 1,643,914 1,689,002 2,132,539
Net Advances 791,025 1,125,128 1,413,761 1,440,586 1,867,637
Investments 31,394 85,990 175,439 190,157 197,970
Cash & Bank Balances 3,397 3,487 13,827 15,846 16,809
Loans and Advances 6,389 8,087 9,525 10,084 13,073
Other Current Assets 3,401 5,994 9,651 10,927 11,683
Fixed Assets 4,703 6,948 13,210 13,511 16,471
Miscellaneous Expenditure 0 0 0 0 0
Deferred Tax Assets 7,675 6,690 8,501 7,890 8,896
Total Assets 847,983 1,242,325 1,643,914 1,689,002 2,132,539
Source: Company, JM Financial
Dupont Analysis
Y/E March FY18A FY19A FY20A FY21E FY22E
NII / Assets 9.28% 9.21% 9.26% 8.71% 9.18%
Other Income / Assets 1.58% 2.06% 2.37% 1.91% 2.18%
Total Income / Assets 10.85% 11.27% 11.63% 10.62% 11.36%
Cost / Assets 4.29% 3.92% 3.83% 3.01% 3.25%
PPP / Assets 6.56% 7.35% 7.80% 7.61% 8.12%
Provisions / Assets 1.39% 1.44% 2.72% 3.86% 2.37%
PBT / Assets 5.17% 5.91% 5.07% 3.75% 5.75%
Tax rate 35.1% 35.3% 28.1% 25.2% 25.2%
ROA 3.36% 3.82% 3.65% 2.81% 4.30%
Leverage 5.4 6.3 5.1 4.6 4.8
ROE 19.6% 22.5% 20.2% 13.5% 20.3%
Source: Company, JM Financial
Valuations
Y/E March FY18A FY19A FY20A FY21E FY22E
Shares in Issue 575.2 576.9 600.0 600.0 600.0
EPS (INR) 43.4 69.3 87.7 78.0 137.0
EPS (YoY) (%) 29.2% 59.6% 26.7% -11.1% 75.6%
P/E (x) 74.5 46.7 36.8 41.4 23.6
BV (INR) 276 341 539 613 736
BV (YoY) (%) 57.0% 23.9% 57.8% 13.8% 20.1%
P/BV (x) 11.73 9.47 6.00 5.27 4.39
DPS (INR) 4.1 7.3 12.1 3.9 13.7
Div. yield (%) 0.1% 0.2% 0.4% 0.1% 0.4%
Source: Company, JM Financial
NBFC 24 November 2020
JM Financial Institutional Securities Limited Page 8
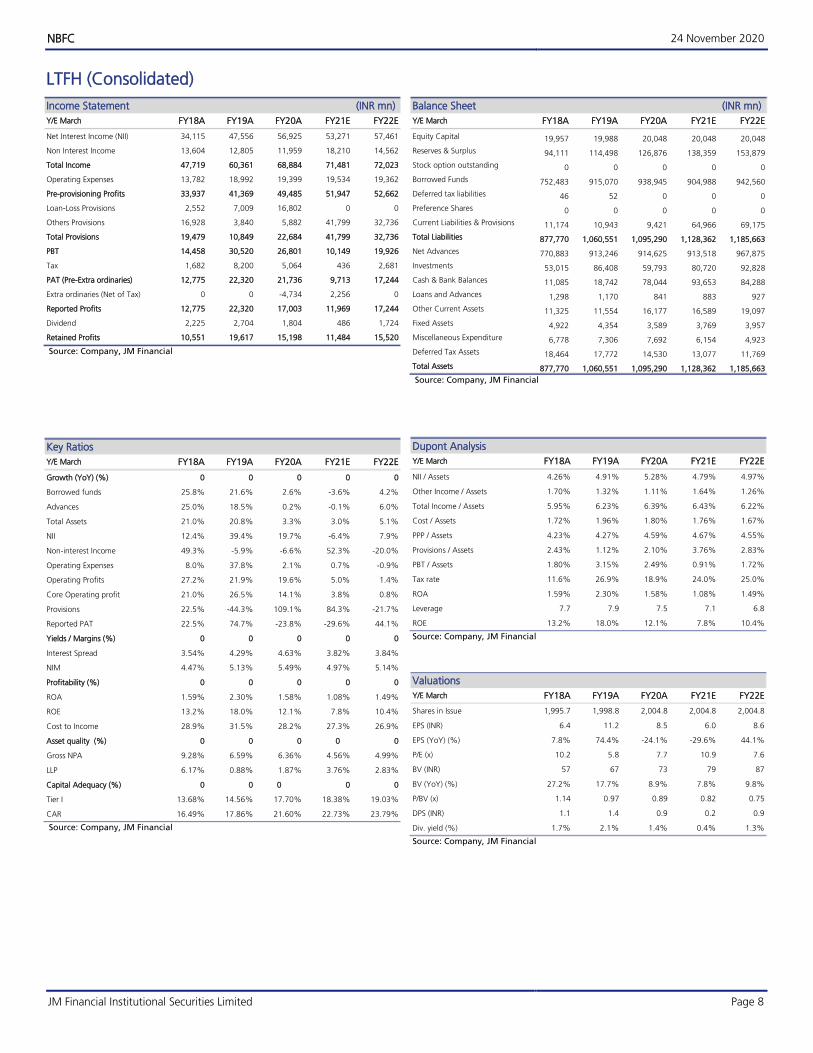
LTFH (Consolidated)
Income Statement (INR mn)
Y/E March FY18A FY19A FY20A FY21E FY22E
Net Interest Income (NII) 34,115 47,556 56,925 53,271 57,461
Non Interest Income 13,604 12,805 11,959 18,210 14,562
Total Income 47,719 60,361 68,884 71,481 72,023
Operating Expenses 13,782 18,992 19,399 19,534 19,362
Pre-provisioning Profits 33,937 41,369 49,485 51,947 52,662
Loan-Loss Provisions 2,552 7,009 16,802 0 0
Others Provisions 16,928 3,840 5,882 41,799 32,736
Total Provisions 19,479 10,849 22,684 41,799 32,736
PBT 14,458 30,520 26,801 10,149 19,926
Tax 1,682 8,200 5,064 436 2,681
PAT (Pre-Extra ordinaries) 12,775 22,320 21,736 9,713 17,244
Extra ordinaries (Net of Tax) 0 0 -4,734 2,256 0
Reported Profits 12,775 22,320 17,003 11,969 17,244
Dividend 2,225 2,704 1,804 486 1,724
Retained Profits 10,551 19,617 15,198 11,484 15,520
Source: Company, JM Financial
Key Ratios
Y/E March FY18A FY19A FY20A FY21E FY22E
Growth (YoY) (%) 0 0 0 0 0
Borrowed funds 25.8% 21.6% 2.6% -3.6% 4.2%
Advances 25.0% 18.5% 0.2% -0.1% 6.0%
Total Assets 21.0% 20.8% 3.3% 3.0% 5.1%
NII 12.4% 39.4% 19.7% -6.4% 7.9%
Non-interest Income 49.3% -5.9% -6.6% 52.3% -20.0%
Operating Expenses 8.0% 37.8% 2.1% 0.7% -0.9%
Operating Profits 27.2% 21.9% 19.6% 5.0% 1.4%
Core Operating profit 21.0% 26.5% 14.1% 3.8% 0.8%
Provisions 22.5% -44.3% 109.1% 84.3% -21.7%
Reported PAT 22.5% 74.7% -23.8% -29.6% 44.1%
Yields / Margins (%) 0 0 0 0 0
Interest Spread 3.54% 4.29% 4.63% 3.82% 3.84%
NIM 4.47% 5.13% 5.49% 4.97% 5.14%
Profitability (%) 0 0 0 0 0
ROA 1.59% 2.30% 1.58% 1.08% 1.49%
ROE 13.2% 18.0% 12.1% 7.8% 10.4%
Cost to Income 28.9% 31.5% 28.2% 27.3% 26.9%
Asset quality (%) 0 0 0 0 0
Gross NPA 9.28% 6.59% 6.36% 4.56% 4.99%
LLP 6.17% 0.88% 1.87% 3.76% 2.83%
Capital Adequacy (%) 0 0 0 0 0
Tier I 13.68% 14.56% 17.70% 18.38% 19.03%
CAR 16.49% 17.86% 21.60% 22.73% 23.79%
Source: Company, JM Financial
Balance Sheet (INR mn)
Y/E March FY18A FY19A FY20A FY21E FY22E
Equity Capital 19,957 19,988 20,048 20,048 20,048
Reserves & Surplus 94,111 114,498 126,876 138,359 153,879
Stock option outstanding 0 0 0 0 0
Borrowed Funds 752,483 915,070 938,945 904,988 942,560
Deferred tax liabilities 46 52 0 0 0
Preference Shares 0 0 0 0 0
Current Liabilities & Provisions 11,174 10,943 9,421 64,966 69,175
Total Liabilities 877,770 1,060,551 1,095,290 1,128,362 1,185,663
Net Advances 770,883 913,246 914,625 913,518 967,875
Investments 53,015 86,408 59,793 80,720 92,828
Cash & Bank Balances 11,085 18,742 78,044 93,653 84,288
Loans and Advances 1,298 1,170 841 883 927
Other Current Assets 11,325 11,554 16,177 16,589 19,097
Fixed Assets 4,922 4,354 3,589 3,769 3,957
Miscellaneous Expenditure 6,778 7,306 7,692 6,154 4,923
Deferred Tax Assets 18,464 17,772 14,530 13,077 11,769
Total Assets 877,770 1,060,551 1,095,290 1,128,362 1,185,663
Source: Company, JM Financial
Dupont Analysis
Y/E March FY18A FY19A FY20A FY21E FY22E
NII / Assets 4.26% 4.91% 5.28% 4.79% 4.97%
Other Income / Assets 1.70% 1.32% 1.11% 1.64% 1.26%
Total Income / Assets 5.95% 6.23% 6.39% 6.43% 6.22%
Cost / Assets 1.72% 1.96% 1.80% 1.76% 1.67%
PPP / Assets 4.23% 4.27% 4.59% 4.67% 4.55%
Provisions / Assets 2.43% 1.12% 2.10% 3.76% 2.83%
PBT / Assets 1.80% 3.15% 2.49% 0.91% 1.72%
Tax rate 11.6% 26.9% 18.9% 24.0% 25.0%
ROA 1.59% 2.30% 1.58% 1.08% 1.49%
Leverage 7.7 7.9 7.5 7.1 6.8
ROE 13.2% 18.0% 12.1% 7.8% 10.4%
Source: Company, JM Financial
Valuations
Y/E March FY18A FY19A FY20A FY21E FY22E
Shares in Issue 1,995.7 1,998.8 2,004.8 2,004.8 2,004.8
EPS (INR) 6.4 11.2 8.5 6.0 8.6
EPS (YoY) (%) 7.8% 74.4% -24.1% -29.6% 44.1%
P/E (x) 10.2 5.8 7.7 10.9 7.6
BV (INR) 57 67 73 79 87
BV (YoY) (%) 27.2% 17.7% 8.9% 7.8% 9.8%
P/BV (x) 1.14 0.97 0.89 0.82 0.75
DPS (INR) 1.1 1.4 0.9 0.2 0.9
Div. yield (%) 1.7% 2.1% 1.4% 0.4% 1.3%
Source: Company, JM Financial

NBFC 24 November 2020
JM Financial Institutional Securities Limited Page 9
Shriram Transport
Income Statement (INR mn)
Y/E March FY18A FY19A FY20A FY21E FY22E
Net Interest Income (NII) 67,887 77,074 78,919 79,984 90,159
Non Interest Income 1,506 2,184 3,084 2,680 3,186
Total Income 69,393 79,258 82,003 82,664 93,345
Operating Expenses 15,373 17,653 19,668 18,280 20,376
Pre-provisioning Profits 54,020 61,605 62,336 64,384 72,969
Loan-Loss Provisions 17,163 24,505 27,911 29,777 26,459
Others Provisions 60 -682 38 0 0
Total Provisions 17,223 23,822 27,949 29,777 26,459
PBT 36,797 37,783 34,387 34,606 46,510
Tax 12,832 13,241 9,368 8,721 11,721
PAT (Pre-Extra ordinaries) 23,965 24,542 25,018 25,886 34,790
Extra ordinaries (Net of Tax) 1,075 1,098 0 0 0
Reported Profits 25,040 25,641 25,018 25,886 34,790
Dividend 2,979 3,009 1,368 1,518 2,531
Retained Profits 22,060 22,632 23,651 24,367 32,259
Source: Company, JM Financial
Key Ratios
Y/E March FY18A FY19A FY20A FY21E FY22E
Growth (YoY) (%)
Borrowed funds 54.6% 7.0% 7.3% 2.2% 4.5%
Advances 38.6% 6.6% 5.7% 5.5% 6.7%
Total Assets 30.7% 8.3% 8.4% 5.3% 6.4%
NII 21.6% 13.5% 2.4% 1.3% 12.7%
Non-interest Income 84.0% 45.0% 41.2% -13.1% 18.9%
Operating Expenses 18.7% 14.8% 11.4% -7.1% 11.5%
Operating Profits 23.7% 14.0% 1.2% 3.3% 13.3%
Core Operating profit 24.2% 13.1% 1.6% 3.3% 13.4%
Provisions -29.5% 38.3% 17.3% 6.5% -11.1%
Reported PAT 99.1% 2.4% -2.4% 3.5% 34.4%
Yields / Margins (%)
Interest Spread 5.99% 6.25% 5.80% 5.31% 5.66%
NIM 7.96% 7.65% 7.27% 6.93% 7.38%
Profitability (%)
ROA 2.92% 2.53% 2.28% 2.21% 2.80%
ROE 20.1% 17.4% 14.8% 13.0% 14.8%
Cost to Income 22.2% 22.3% 24.0% 22.1% 21.8%
Asset quality (%)
Gross NPA 9.52% 8.64% 8.71% 9.06% 9.75%
LLP 2.97% 1.94% 2.19% 3.00% 2.59%
Capital Adequacy (%)
Tier I 14.47% 15.62% 18.13% 20.84% 22.39%
CAR 17.38% 20.27% 21.99% 25.24% 27.35%
Source: Company, JM Financial
Balance Sheet (INR mn)
Y/E March FY18A FY19A FY20A FY21E FY22E
Equity Capital 2,269 2,269 2,269 2,531 2,531
Reserves & Surplus 133,486 156,094 177,783 216,810 249,069
Stock option outstanding 0 0 0 0 0
Borrowed Funds 821,308 879,144 943,718 964,479 1,007,881
Deferred tax liabilities 0 0 0 0 0
Preference Shares 15,387 15,418 17,517 18,453 19,633
Current Liabilities & Provisions 0 0 0 0 0
Total Liabilities 972,450 1,052,925 1,141,286 1,202,273 1,279,113
Net Advances 907,456 967,515 1,022,316 1,078,120 1,150,840
Investments 23,414 39,991 27,985 30,187 31,073
Cash & Bank Balances 14,781 12,402 34,637 36,656 37,978
Loans and Advances 175 284 161 170 182
Other Current Assets 2,918 3,088 12,226 12,448 12,810
Fixed Assets 1,221 1,475 4,824 5,082 5,407
Miscellaneous Expenditure 0 0 0 0 0
Deferred Tax Assets 522 757 625 658 700
Total Assets 972,450 1,052,925 1,141,286 1,202,273 1,279,113
Source: Company, JM Financial
Dupont Analysis
Y/E March FY18A FY19A FY20A FY21E FY22E
NII / Assets 7.91% 7.61% 7.19% 6.83% 7.27%
Other Income / Assets 0.18% 0.22% 0.28% 0.23% 0.26%
Total Income / Assets 8.09% 7.83% 7.47% 7.05% 7.52%
Cost / Assets 1.79% 1.74% 1.79% 1.56% 1.64%
PPP / Assets 6.29% 6.08% 5.68% 5.49% 5.88%
Provisions / Assets 2.01% 2.35% 2.55% 2.54% 2.13%
PBT / Assets 4.29% 3.73% 3.13% 2.95% 3.75%
Tax rate 34.9% 35.0% 27.2% 25.2% 25.2%
ROA 2.92% 2.53% 2.28% 2.21% 2.80%
Leverage 7.2 6.6 6.3 5.5 5.1
ROE 20.1% 17.4% 14.8% 13.0% 14.8%
Source: Company, JM Financial
Valuations
Y/E March FY18A FY19A FY20A FY21E FY22E
Shares in Issue 226.9 226.9 226.9 253.1 253.1
EPS (INR) 110.4 113.0 110.3 102.3 137.5
EPS (YoY) (%) 99.1% 2.4% -2.4% -7.2% 34.4%
P/E (x) 6.3 6.2 6.3 6.8 5.1
BV (INR) 598 698 794 867 994
BV (YoY) (%) 20.1% 16.7% 13.7% 9.2% 14.7%
P/BV (x) 1.17 1.00 0.88 0.81 0.70
DPS (INR) 13.1 13.3 6.0 6.0 10.0
Div. yield (%) 1.9% 1.9% 0.9% 0.9% 1.4%
Source: Company, JM Financial
NBFC 23 November 2020
JM Financial Institutional Securities Limited Page 10
MMFS (Standalone)
Profit & Loss (INR mn)
Y/E March FY18A FY19A FY20A FY21E FY22E
Net Interest Income 35,025 46,700 51,130 56,510 69,338
Profit on Investments 2 68 262 262 282
Exchange Income 0 0 0 0 0
Fee & Other Income 1,009 1,884 2,773 1,977 2,296
Non-Interest Income 1,010 1,953 3,034 2,239 2,578
Total Income 36,036 48,653 54,164 58,749 71,916
Operating Expenses 14,336 18,476 20,182 16,628 19,852
Pre-provisioning Profits 21,700 30,177 33,982 42,121 52,064
Loan-Loss Provisions 5,681 6,352 20,545 27,654 21,522
Provisions on Investments 0 0 0 0 0
Others Provisions 0 0 0 0 0
Total Provisions 5,681 6,352 20,545 27,654 21,522
PBT 16,018 23,824 13,438 14,467 30,542
Tax 5,907 8,254 4,374 3,646 7,697
PAT (Pre-Extraordinaries) 10,111 15,571 9,064 10,821 22,845
Extra ordinaries (Net of Tax) 650 0 0 61 0
Reported Profits 10,761 15,571 9,064 10,882 22,845
Dividend paid 2,938 4,779 0 0 0
Retained Profits 7,823 10,792 9,064 10,882 22,845
Source: Company, JM Financial
Key Ratios
Y/E March FY18A FY19A FY20A FY21E FY22E
Growth (YoY) (%)
Deposits 0.0% 0.0% 0.0% 0.0% 0.0%
Advances 14.2% 26.2% 6.1% 8.3% 15.3%
Total Assets 14.8% 27.1% 10.4% 8.1% 14.0%
NII 13.5% 33.3% 9.5% 10.5% 22.7%
Non-interest Income -65.6% 93.2% 55.4% -26.2% 15.1%
Operating Expenses -1.2% 28.9% 9.2% -17.6% 19.4%
Operating Profits 12.5% 39.1% 12.6% 23.9% 23.6%
Core Operating profit 168.7% 39.7% -47.0% -16.6% 111.1%
Provisions -56.6% 11.8% 223.4% 34.6% -22.2%
Reported PAT 168.9% 44.7% -41.8% 20.1% 109.9%
Yields / Margins (%)
Interest Spread 5.38% 6.15% 5.77% 5.76% 6.45%
NIM 7.24% 7.93% 7.39% 7.50% 8.27%
Profitability (%)
Non-IR to Income 2.8% 4.0% 5.6% 3.8% 3.6%
Cost to Income 39.8% 38.0% 37.3% 28.3% 27.6%
ROA 2.18% 2.60% 1.28% 1.41% 2.67%
ROE 13.4% 15.2% 8.2% 8.1% 13.7%
Assets Quality (%)
Slippages 3.96% 4.34% 5.63% 6.00% 4.00%
Gross NPA 10.00% 6.56% 8.61% 10.84% 10.19%
Net NPAs 6.82% 5.37% 6.10% 6.91% 6.57%
Provision Coverage 34.1% 19.2% 31.0% 39.0% 38.0%
Specific LLP 0.34% 1.51% 2.91% 4.08% 2.84%
Net NPAs / Networth 34.5% 30.3% 35.1% 31.4% 30.0%
Capital Adequacy (%)
Tier I 17.01% 15.52% 15.41% 17.96% 18.37%
CAR 22.68% 20.29% 19.64% 21.92% 22.36%
Source: Company, JM Financial
Balance Sheet (INR mn)
Y/E March FY18A FY19A FY20A FY21E FY22E
Equity Capital 1,229 1,230 1,231 2,466 2,466
Reserves & Surplus 94,777 107,512 111,922 152,458 175,303
Deposits 0 0 0 0 0
Borrowings 400,932 528,469 594,623 610,083 694,275
Other Liabilities 30,777 33,230 32,451 35,073 39,978
Total Liabilities 527,927 670,780 740,712 800,577 912,528
Investments 27,341 37,917 59,110 63,369 64,936
Net Advances 485,470 612,496 649,935 704,099 811,694
Cash & Equivalents 4,111 9,585 14,258 15,490 16,234
Fixed Assets 1,197 1,631 3,635 3,913 4,446
Other Assets 0 0 0 0 0
Total Assets 527,927 670,780 740,712 800,577 912,528
Source: Company, JM Financial
Dupont Analysis
Y/E March FY18A FY19A FY20A FY21E FY22E
NII / Assets 7.09% 7.79% 7.24% 7.33% 8.10%
Other Income / Assets 0.20% 0.33% 0.43% 0.29% 0.30%
Total Income / Assets 7.30% 8.12% 7.67% 7.62% 8.40%
Cost / Assets 2.90% 3.08% 2.86% 2.16% 2.32%
PBP / Assets 4.39% 5.03% 4.82% 5.47% 6.08%
Provisions / Assets 1.15% 1.06% 2.91% 3.59% 2.51%
PBT / Assets 3.24% 3.98% 1.90% 1.88% 3.57%
Tax rate 36.9% 34.6% 32.5% 25.2% 25.2%
ROA 2.18% 2.60% 1.28% 1.41% 2.67%
RoRWAs 2.15% 2.69% 1.43% 1.56% 2.78%
Leverage 5.5 6.2 6.5 5.2 5.1
ROE 13.4% 15.2% 8.2% 8.1% 13.7%
Source: Company, JM Financial
Valuations
Y/E March FY18A FY19A FY20A FY21E FY22E
Shares in Issue 614.5 614.9 615.3 1,233.1 1,233.1
EPS (INR) 17.5 25.3 14.7 8.8 18.5
EPS (YoY) (%) 147.2% 44.6% -41.8% -40.1% 109.9%
PER (x) 7.5 5.2 8.9 14.8 7.1
BV (INR) 156 177 184 126 144
BV (YoY) (%) 36.8% 13.2% 4.0% -31.7% 14.7%
ABV (INR) 134 177 184 126 144
ABV (YoY) (%) -14.2% 31.9% 4.0% -31.7% 14.7%
P/BV (x) 0.84 0.74 0.71 1.04 0.91
P/ABV (x) 0.98 0.74 0.71 1.04 0.91
DPS (INR) 4.8 7.8 0.0 0.0 0.0
Div. yield (%) 3.6% 5.9% 0.0% 0.0% 0.0%
Source: Company, JM Financial
NBFC 23 November 2020
JM Financial Institutional Securities Limited Page 11
Cholamandalam Investment and Finance Co.
Income Statement (INR mn)
Y/E March FY18A FY19A FY20A FY21E FY22E
Net Interest Income (NII) 25,765 30,735 37,792 42,835 51,461
Non Interest Income 2,439 3,304 2,815 2,439 2,804
Total Income 28,203 34,039 40,607 45,275 54,265
Operating Expenses 11,153 12,696 15,776 15,303 17,707
Pre-provisioning Profits 17,051 21,344 24,831 29,972 36,557
Loan-Loss Provisions 366 688 891 4,349 5,084
Others Provisions 2,671 2,425 8,083 2,500 1,350
Total Provisions 3,037 3,112 8,973 6,849 6,434
PBT 14,014 18,232 15,857 23,123 30,123
Tax 4,831 6,370 5,334 5,827 7,591
PAT (Pre-Extra ordinaries) 9,183 11,862 10,524 17,296 22,532
Extra ordinaries (Net of Tax) 0 0 0 0 0
Reported Profits 9,183 11,862 10,524 17,296 22,532
Dividend 1,223 1,225 2,003 0 2,704
Retained Profits 7,960 10,636 8,521 17,296 19,828
Source: Company, JM Financial
Key Ratios
Y/E March FY18A FY19A FY20A FY21E FY22E
Growth (YoY) (%) 0 0 0 0 0
Borrowed funds 58.3% 31.9% 8.8% 7.5% 16.5%
Advances 48.7% 24.5% 5.3% 14.1% 18.7%
Total Assets 43.5% 30.2% 11.4% 12.4% 17.0%
NII 7.2% 19.3% 23.0% 13.3% 20.1%
Non-interest Income 829.3% 35.5% -14.8% -13.3% 14.9%
Operating Expenses 10.1% 13.8% 24.3% -3.0% 15.7%
Operating Profits 20.4% 25.2% 16.3% 20.7% 22.0%
Core Operating profit 20.8% 22.2% 19.1% 20.8% 22.0%
Provisions -2.2% 2.5% 188.3% -23.7% -6.1%
Reported PAT 27.8% 29.2% -11.3% 64.4% 30.3%
Yields / Margins (%) 0 0 0 0 0
Interest Spread 5.82% 5.29% 5.38% 5.29% 5.47%
NIM 7.05% 6.16% 6.36% 6.45% 6.74%
Profitability (%) 0 0 0 0 0
ROA 2.45% 2.34% 1.73% 2.55% 2.89%
ROE 19.5% 21.0% 14.7% 19.1% 20.7%
Cost to Income 39.5% 37.3% 38.9% 33.8% 32.6%
Asset quality (%) 0 0 0 0 0
Gross NPA 3.45% 2.71% 3.84% 4.04% 4.16%
LLP 1.41% 0.50% 1.25% 0.89% 0.93%
Capital Adequacy (%) 0 0 0 0 0
Tier I 13.13% 12.45% 15.28% 16.39% 16.85%
CAR 18.24% 17.37% 20.68% 21.65% 21.79%
Source: Company, JM Financial
Balance Sheet (INR mn)
Y/E March FY18A FY19A FY20A FY21E FY22E
Equity Capital 1,564 1,564 1,640 1,640 1,640
Reserves & Surplus 49,417 60,193 80,079 97,374 117,202
Stock option outstanding 0 0 0 0 0
Borrowed Funds 383,303 505,667 550,054 591,308 688,874
Deferred tax liabilities 0 0 0 0 0
Preference Shares 6,613 6,838 8,158 28,763 33,655
Current Liabilities & Provisions 0 0 0 0 0
Total Liabilities 440,897 574,263 639,930 719,086 841,371
Net Advances 422,532 526,223 554,027 631,894 750,072
Investments 729 729 729 885 1,050
Cash & Bank Balances 8,880 36,749 69,591 69,508 71,257
Loans and Advances 940 435 587 632 750
Other Current Assets 2,554 3,841 6,950 7,126 7,664
Fixed Assets 1,646 1,757 2,837 3,188 3,730
Miscellaneous Expenditure 0 0 0 0 0
Deferred Tax Assets 3,617 4,530 5,208 5,853 6,848
Total Assets 440,897 574,263 639,930 719,086 841,371
Source: Company, JM Financial
Dupont Analysis
Y/E March FY18A FY19A FY20A FY21E FY22E
NII / Assets 6.89% 6.06% 6.23% 6.30% 6.60%
Other Income / Assets 0.65% 0.65% 0.46% 0.36% 0.36%
Total Income / Assets 7.54% 6.71% 6.69% 6.66% 6.95%
Cost / Assets 1.44% 1.16% 1.08% 0.98% 0.97%
PPP / Assets 4.56% 4.20% 4.09% 4.41% 4.69%
Provisions / Assets 0.81% 0.61% 1.48% 1.01% 0.82%
PBT / Assets 3.75% 3.59% 2.61% 3.40% 3.86%
Tax rate 34.5% 34.9% 33.6% 25.2% 25.2%
ROA 2.45% 2.34% 1.73% 2.55% 2.89%
Leverage 8.6 9.3 7.8 7.3 7.1
ROE 19.5% 21.0% 14.7% 19.1% 20.7%
Source: Company, JM Financial
Valuations
Y/E March FY18A FY19A FY20A FY21E FY22E
Shares in Issue 782.0 782.2 819.9 819.9 819.9
EPS (INR) 11.7 15.2 12.8 21.1 27.5
EPS (YoY) (%) 27.7% 29.1% -15.4% 64.4% 30.3%
P/E (x) 21.3 16.5 19.5 11.9 9.1
BV (INR) 65 79 100 121 145
BV (YoY) (%) 18.2% 21.1% 26.2% 21.2% 20.0%
P/BV (x) 3.83 3.17 2.51 2.07 1.72
DPS (INR) 1.6 1.6 2.4 0.0 3.3
Div. yield (%) 0.6% 0.6% 1.0% 0.0% 1.3%
Source: Company, JM Financial
NBFC 23 November 2020
JM Financial Institutional Securities Limited Page 12
HDFC Ltd
Income Statement (INR mn)
Y/E March FY18A FY19A FY20A FY21E FY22E
Net Interest Income (NII) 96,351 114,026 127,639 146,403 171,761
Non Interest Income 20,523 29,278 150,140 39,432 38,320
Total Income 116,874 143,304 277,779 185,835 210,081
Operating Expenses 19,049 14,866 15,139 15,773 17,280
Pre-provisioning Profits 97,825 128,438 262,640 170,063 192,802
Loan-Loss Provisions 4,619 9,203 59,077 38,400 24,960
Others Provisions 0 0 0 0 0
Total Provisions 4,600 9,350 59,131 38,400 24,960
PBT 93,225 119,088 203,509 131,663 167,842
Tax 22,303 31,354 25,813 25,016 33,568
PAT (Pre-Extra ordinaries) 70,922 87,734 177,697 106,647 134,274
Extra ordinaries (Net of Tax) 38,603 8,591 0 0 0
Reported Profits 109,526 96,325 177,697 106,647 134,274
Dividend 34,545 39,645 36,006 17,889 26,833
Retained Profits 74,981 56,679 141,690 88,758 107,440
Source: Company, JM Financial
Key Ratios
Y/E March FY18A FY19A FY20A FY21E FY22E
Growth (YoY) (%) 0 0 0 0 0
Borrowed funds 14.3% 14.2% 14.4% 12.0% 15.0%
Advances 20.5% 12.1% 9.8% 12.0% 15.0%
Total Assets 18.6% 15.0% 14.2% 12.1% 14.2%
NII 4.7% 18.3% 11.9% 14.7% 17.3%
Non-interest Income -11.1% 42.7% 412.8% -73.7% -2.8%
Operating Expenses 127.6% -22.0% 1.8% 4.2% 9.6%
Operating Profits -8.4% 31.3% 104.5% -35.2% 13.4%
Core Operating profit -0.9% 27.5% 11.2% 13.4% 16.8%
Provisions -34.3% 103.3% 532.4% -35.1% -35.0%
Reported PAT 47.2% -12.1% 84.5% -40.0% 25.9%
Yields / Margins (%) 0 0 0 0 0
Interest Spread 1.45% 1.35% 1.47% 1.62% 1.74%
NIM 2.60% 2.65% 2.61% 2.67% 2.76%
Profitability (%) 0 0 0 0 0
ROA 2.98% 2.25% 3.62% 1.92% 2.13%
ROE 20.9% 13.5% 21.7% 11.1% 12.1%
Cost to Income 16.3% 10.4% 5.5% 8.5% 8.2%
Asset quality (%) 0 0 0 0 0
Gross NPA 1.31% 1.42% 2.30% 2.58% 1.97%
LLP 0.14% 0.25% 1.41% 0.82% 0.47%
Capital Adequacy (%) 0 0 0 0 0
Tier I 17.30% 17.50% 16.50% 19.07% 18.84%
CAR 19.20% 19.10% 17.60% 20.05% 19.70%
Source: Company, JM Financial
Balance Sheet (INR mn)
Y/E March FY18A FY19A FY20A FY21E FY22E
Equity Capital 3,352 3,443 3,464 3,578 3,578
Reserves & Surplus 649,297 770,112 858,117 1,049,832 1,157,272
Stock option outstanding 0 0 0 0 0
Borrowed Funds 3,197,157 3,652,657 4,191,016 4,693,938 5,398,029
Deferred tax liabilities 0 0 0 0 0
Preference Shares 139,290 161,564 188,339 127,751 150,755
Current Liabilities & Provisions 0 0 0 0 0
Total Liabilities 3,989,096 4,587,776 5,240,936 5,875,099 6,709,634
Net Advances 3,573,809 4,007,596 4,399,433 4,927,365 5,666,469
Investments 307,167 462,404 649,444 717,765 791,239
Cash & Bank Balances 14,851 15,963 34,257 36,955 39,665
Loans and Advances 28,875 40,812 29,721 33,287 38,280
Other Current Assets 45,202 46,250 102,541 133,303 146,634
Fixed Assets 6,397 6,442 9,861 9,960 10,059
Miscellaneous Expenditure 0 0 0 0 0
Deferred Tax Assets 12,795 8,309 15,679 16,463 17,287
Total Assets 3,989,096 4,587,776 5,240,936 5,875,099 6,709,634
Source: Company, JM Financial
Dupont Analysis
Y/E March FY18A FY19A FY20A FY21E FY22E
NII / Assets 2.62% 2.66% 2.60% 2.63% 2.73%
Other Income / Assets 0.56% 0.68% 3.06% 0.71% 0.61%
Total Income / Assets 3.18% 3.34% 5.65% 3.34% 3.34%
Cost / Assets 0.52% 0.35% 0.31% 0.28% 0.27%
PPP / Assets 2.66% 2.99% 5.34% 3.06% 3.06%
Provisions / Assets 0.13% 0.22% 1.20% 0.69% 0.40%
PBT / Assets 2.54% 2.78% 4.14% 2.37% 2.67%
Tax rate 23.9% 26.3% 12.7% 19.0% 20.0%
ROA 2.98% 2.25% 3.62% 1.92% 2.13%
Leverage 6.1 5.9 6.1 5.6 5.8
ROE 20.9% 13.5% 21.7% 11.1% 12.1%
Source: Company, JM Financial
Valuations
Y/E March FY18A FY19A FY20A FY21E FY22E
Shares in Issue 1,675.9 1,721.5 1,732.1 1,788.9 1,788.9
EPS (INR) 65.4 56.0 102.6 59.6 75.1
EPS (YoY) (%) 50.1% -14.4% 83.3% -41.9% 25.9%
P/E (x) 31.2 36.5 19.9 34.2 27.2
BV (INR) 389 449 497 589 649
BV (YoY) (%) 56.7% 15.4% 10.7% 18.4% 10.2%
P/BV (x) 5.24 4.54 4.10 3.47 3.15
DPS (INR) 20.6 23.0 20.8 10.0 15.0
Div. yield (%) 1.0% 1.1% 1.0% 0.5% 0.7%
Source: Company, JM Financial

NBFC 23 November 2020
JM Financial Institutional Securities Limited Page 13
LIC Housing Finance
Income Statement (INR mn)
Y/E March FY18A FY19A FY20A FY21E FY22E
Net Interest Income (NII) 35,859 43,646 48,215 49,761 55,007
Non Interest Income 1,109 1,036 526 613 717
Total Income 36,968 44,681 48,741 50,374 55,724
Operating Expenses 4,396 4,726 6,167 6,741 7,527
Pre-provisioning Profits 32,572 39,956 42,574 43,633 48,197
Loan-Loss Provisions 4,582 3,504 9,527 7,999 7,659
Others Provisions 233 2,657 357 -500 0
Total Provisions 4,917 6,160 9,884 7,499 7,659
PBT 27,655 33,796 32,690 36,134 40,538
Tax 7,630 9,486 8,672 7,588 8,513
PAT (Pre-Extra ordinaries) 20,025 24,310 24,018 28,546 32,025
Extra ordinaries (Net of Tax) 0 0 0 0 0
Reported Profits 20,025 24,310 24,018 28,546 32,025
Dividend 3,434 4,619 4,040 2,855 3,843
Retained Profits 16,591 19,691 19,979 25,691 28,182
Source: Company, JM Financial
Key Ratios
Y/E March FY18A FY19A FY20A FY21E FY22E
Growth (YoY) (%)
Borrowed funds 15.0% 17.5% 12.1% 5.8% 7.6%
Advances 15.0% 16.1% 7.8% 6.7% 8.5%
Total Assets 13.4% 17.2% 8.1% 6.6% 8.2%
NII -2.7% 21.7% 10.5% 3.2% 10.5%
Non-interest Income -31.8% -6.6% -49.2% 16.6% 16.8%
Operating Expenses -28.1% 7.5% 30.5% 9.3% 11.7%
Operating Profits 0.6% 22.7% 6.6% 2.5% 10.5%
Core Operating profit 0.0% 22.8% 7.1% 2.5% 10.5%
Provisions 74.8% 25.3% 60.5% -24.1% 2.1%
Reported PAT 3.7% 21.4% -1.2% 18.9% 12.2%
Yields / Margins (%)
Interest Spread 0.99% 1.17% 1.28% 1.34% 1.40%
NIM 2.24% 2.36% 2.32% 2.24% 2.30%
Profitability (%)
ROA 1.24% 1.31% 1.15% 1.27% 1.33%
ROE 15.3% 15.9% 13.9% 14.7% 14.4%
Cost to Income 11.9% 10.6% 12.7% 13.4% 13.5%
Asset quality (%)
Gross NPA 0.77% 1.52% 3.00% 3.16% 3.52%
LLP 0.29% 0.20% 0.48% 0.54% 0.39%
Capital Adequacy (%)
Tier I 13.06% 12.30% 12.19% 13.57% 14.18%
CAR 15.49% 14.36% 13.89% 16.01% 16.74%
Source: Company, JM Financial
Balance Sheet (INR mn)
Y/E March FY18A FY19A FY20A FY21E FY22E
Equity Capital 1,010 1,010 1,010 1,010 1,010
Reserves & Surplus 141,402 161,583 180,921 206,612 234,794
Stock option outstanding 0 0 0 0 0
Borrowed Funds 1,453,099 1,706,670 1,913,317 2,024,289 2,178,135
Deferred tax liabilities 0 0 0 0 0
Preference Shares 115,387 136,572 72,808 78,556 84,963
Current Liabilities & Provisions 0 0 0 0 0
Total Liabilities 1,710,898 2,005,835 2,168,056 2,310,467 2,498,902
Net Advances 1,661,623 1,929,927 2,079,880 2,219,499 2,407,073
Investments 19,722 35,951 54,964 54,378 52,233
Cash & Bank Balances 20,964 29,949 19,790 22,195 24,071
Loans and Advances 0 0 0 0 0
Other Current Assets 3,195 3,115 5,679 6,605 7,099
Fixed Assets 971 1,359 2,544 2,711 2,932
Miscellaneous Expenditure 0 0 0 0 0
Deferred Tax Assets 4,423 5,534 5,200 5,080 5,494
Total Assets 1,710,898 2,005,835 2,168,056 2,310,467 2,498,902
Source: Company, JM Financial
Dupont Analysis
Y/E March FY18A FY19A FY20A FY21E FY22E
NII / Assets 2.23% 2.35% 2.31% 2.22% 2.29%
Other Income / Assets 0.07% 0.06% 0.03% 0.03% 0.03%
Total Income / Assets 2.30% 2.40% 2.34% 2.25% 2.32%
Cost / Assets 0.27% 0.25% 0.30% 0.30% 0.31%
PPP / Assets 2.02% 2.15% 2.04% 1.95% 2.00%
Provisions / Assets 0.31% 0.33% 0.47% 0.33% 0.32%
PBT / Assets 1.72% 1.82% 1.57% 1.61% 1.69%
Tax rate 27.6% 28.1% 26.5% 21.0% 21.0%
ROA 1.24% 1.31% 1.15% 1.27% 1.33%
Leverage 12.0 12.3 11.9 11.1 10.6
ROE 15.3% 15.9% 13.9% 14.7% 14.4%
Source: Company, JM Financial
Valuations
Y/E March FY18A FY19A FY20A FY21E FY22E
Shares in Issue 505.0 505.0 505.0 505.0 505.0
EPS (INR) 39.7 48.1 47.6 56.5 63.4
EPS (YoY) (%) 3.7% 21.4% -1.2% 18.9% 12.2%
P/E (x) 8.2 6.7 6.8 5.7 5.1
BV (INR) 282 322 360 411 467
BV (YoY) (%) 18.7% 14.2% 11.9% 14.1% 13.6%
P/BV (x) 1.15 1.01 0.90 0.79 0.69
DPS (INR) 6.8 9.1 8.0 5.7 7.6
Div. yield (%) 2.1% 2.8% 2.5% 1.7% 2.3%
Source: Company, JM Financial
NBFC 23 November 2020
JM Financial Institutional Securities Limited Page 14
PNB Housing Finance (Standalone)
Income Statement (INR mn)
Y/E March FY18A FY19A FY20A FY21E FY22E
Net Interest Income (NII) 16,259 19,338 21,489 19,160 19,464
Non Interest Income 3,264 5,823 4,652 2,982 3,575
Total Income 19,523 25,160 26,141 22,142 23,039
Operating Expenses 4,412 5,927 5,517 4,691 5,322
Pre-provisioning Profits 15,112 19,233 20,624 17,452 17,717
Loan-Loss Provisions 1,127 56 7,022 5,617 3,789
Others Provisions 183 268 782 0 1,162
Total Provisions 2,766 1,890 12,514 5,617 4,951
PBT 12,346 17,344 8,110 11,835 12,766
Tax 3,934 5,429 1,648 2,485 2,681
PAT (Pre-Extra ordinaries) 8,412 11,915 6,462 9,350 10,085
Extra ordinaries (Net of Tax) 0 0 0 0 0
Reported Profits 8,412 11,915 6,462 9,350 10,085
Dividend 1,203 1,817 1,824 935 1,009
Retained Profits 7,209 10,098 4,639 8,415 9,077
Source: Company, JM Financial
Key Ratios
Y/E March FY18A FY19A FY20A FY21E FY22E
Growth (YoY) (%)
Borrowed funds 51.5% 33.6% -5.7% -9.8% 0.2%
Advances 48.4% 30.0% -10.3% -3.3% 3.3%
Total Assets 46.7% 33.1% -5.9% -5.7% 1.4%
NII 63.2% 18.9% 11.1% -10.8% 1.6%
Non-interest Income 21.9% 78.4% -20.1% -35.9% 19.9%
Operating Expenses 23.5% 34.3% -6.9% -15.0% 13.5%
Operating Profits 66.6% 27.3% 7.2% -15.4% 1.5%
Core Operating profit 70.1% 21.4% 6.1% -14.2% 1.3%
Provisions 168.7% -31.7% 562.3% -55.1% -11.9%
Reported PAT 60.6% 41.7% -45.8% 44.7% 7.9%
Yields / Margins (%)
Interest Spread 2.58% 2.34% 2.68% 2.48% 2.10%
NIM 3.10% 2.65% 2.66% 2.53% 2.63%
Profitability (%)
ROA 1.59% 1.62% 0.79% 1.22% 1.35%
ROE 13.9% 16.9% 8.3% 10.0% 9.1%
Cost to Income 22.6% 23.6% 21.1% 21.2% 23.1%
Asset quality (%)
Gross NPA 0.33% 0.48% 2.77% 3.56% 4.33%
LLP 0.32% 0.21% 2.03% 0.80% 0.61%
Capital Adequacy (%)
Tier I 12.75% 11.00% 15.18% 22.62% 24.31%
CAR 16.67% 13.98% 17.98% 26.60% 29.11%
Source: Company, JM Financial
Balance Sheet (INR mn)
Y/E March FY18A FY19A FY20A FY21E FY22E
Equity Capital 1,666 1,675 1,682 2,303 2,303
Reserves & Surplus 64,008 73,764 78,296 104,090 113,167
Stock option outstanding 0 0 0 0 0
Borrowed Funds 537,767 718,588 677,351 610,971 612,193
Deferred tax liabilities 0 0 0 0 0
Preference Shares 0 0 0 0 0
Current Liabilities & Provisions 26,704 44,663 31,969 26,789 27,174
Total Liabilities 630,145 838,690 789,297 744,152 754,836
Net Advances 571,648 742,879 666,280 644,114 665,105
Investments 24,130 45,607 20,757 38,647 39,906
Cash & Bank Balances 28,170 40,340 85,143 45,088 33,255
Loans and Advances 2,411 5,519 7,466 6,441 6,651
Other Current Assets 2,473 2,653 4,240 4,799 4,819
Fixed Assets 858 1,083 2,551 2,368 2,365
Miscellaneous Expenditure 0 0 0 0 0
Deferred Tax Assets 455 610 2,859 2,696 2,735
Total Assets 630,145 838,690 789,297 744,152 754,836
Source: Company, JM Financial
Dupont Analysis
Y/E March FY18A FY19A FY20A FY21E FY22E
NII / Assets 3.07% 2.63% 2.64% 2.50% 2.60%
Other Income / Assets 0.62% 0.79% 0.57% 0.39% 0.48%
Total Income / Assets 3.68% 3.43% 3.21% 2.89% 3.07%
Cost / Assets 0.83% 0.81% 0.68% 0.61% 0.71%
PPP / Assets 2.85% 2.62% 2.53% 2.28% 2.36%
Provisions / Assets 0.52% 0.26% 1.54% 0.73% 0.66%
PBT / Assets 2.33% 2.36% 1.00% 1.54% 1.70%
Tax rate 31.9% 31.3% 20.3% 21.0% 21.0%
ROA 1.59% 1.62% 0.79% 1.22% 1.35%
Leverage 9.6 11.1 9.9 7.0 6.5
ROE 13.9% 16.9% 8.3% 10.0% 9.1%
Source: Company, JM Financial
Valuations
Y/E March FY18A FY19A FY20A FY21E FY22E
Shares in Issue 166.6 167.5 168.2 230.3 230.3
EPS (INR) 50.5 71.1 38.4 40.6 43.8
EPS (YoY) (%) 59.7% 40.9% -46.0% 5.7% 7.9%
P/E (x) 7.0 4.9 9.1 8.6 8.0
BV (INR) 394 450 476 462 501
BV (YoY) (%) 17.1% 14.3% 5.6% -2.8% 8.5%
P/BV (x) 0.89 0.78 0.74 0.76 0.70
DPS (INR) 7.2 10.8 10.8 4.1 4.4
Div. yield (%) 2.1% 3.1% 3.1% 1.2% 1.2%
Source: Company, JM Financial

NBFC 23 November 2020
JM Financial Institutional Securities Limited Page 15
APPENDIX I
JM Financial Inst itut ional Secur it ies Limited
Corporate Identity Number: U67100MH2017PLC296081 Member of BSE Ltd., National Stock Exchange of India Ltd. and Metropolitan Stock Exchange of India Ltd.
SEBI Registration Nos.: Stock Broker - INZ000163434, Research Analyst – INH000000610 Registered Office: 7th Floor, Cnergy, Appasaheb Marathe Marg, Prabhadevi, Mumbai 400 025, India.
Board: +9122 6630 3030 | Fax: +91 22 6630 3488 | Email: [email protected] | www.jmfl.com
Compliance Officer: Mr. Sunny Shah | Tel: +91 22 6630 3383 | Email: [email protected]
Definition of ratings
Rating Meaning
Buy Total expected returns of more than 10% for large-cap stocks* and REITs and more than 15% for all other stocks, over the next twelve months. Total expected return includes dividend yields.
Hold Price expected to move in the range of 10% downside to 10% upside from the current market price for large-cap* stocks and REITs and in the range of 10% downside to 15% upside from the current market price for all other stocks, over the next twelve months.
Sell Price expected to move downwards by more than 10% from the current market price over the next twelve months.
* Large-cap stocks refer to securities with market capitalisation in excess of INR200bn. REIT refers to Real Estate Investment Trusts. Research Analyst(s) Certification The Research Analyst(s), with respect to each issuer and its securities covered by them in this research report, certify that: All of the views expressed in this research report accurately reflect his or her or their personal views about all of the issuers and their securities; and No part of his or her or their compensation was, is, or will be directly or indirectly related to the specific recommendations or views expressed in this research report. Important Disclosures This research report has been prepared by JM Financial Institutional Securities Limited (JM Financial Institutional Securities) to provide information about the
company(ies) and sector(s), if any, covered in the report and may be distributed by it and/or its associates solely for the purpose of information of the select
recipient of this report. This report and/or any part thereof, may not be duplicated in any form and/or reproduced or redistributed without the prior written
consent of JM Financial Institutional Securities. This report has been prepared independent of the companies covered herein.
JM Financial Institutional Securities is registered with the Securities and Exchange Board of India (SEBI) as a Research Analyst and a Stock Broker having trading
memberships of the BSE Ltd. (BSE), National Stock Exchange of India Ltd. (NSE) and Metropolitan Stock Exchange of India Ltd. (MSEI). No material disciplinary
action has been taken by SEBI against JM Financial Institutional Securities in the past two financial years which may impact the investment decision making of the
investor.
JM Financial Institutional Securities renders stock broking services primarily to institutional investors and provides the research services to its institutional
clients/investors. JM Financial Institutional Securities and its associates are part of a multi-service, integrated investment banking, investment management,
brokerage and financing group. JM Financial Institutional Securities and/or its associates might have provided or may provide services in respect of managing
offerings of securities, corporate finance, investment banking, mergers & acquisitions, broking, financing or any other advisory services to the company(ies)
covered herein. JM Financial Institutional Securities and/or its associates might have received during the past twelve months or may receive compensation from
the company(ies) mentioned in this report for rendering any of the above services.
JM Financial Institutional Securities and/or its associates, their directors and employees may; (a) from time to time, have a long or short position in, and buy or sell
the securities of the company(ies) mentioned herein or (b) be engaged in any other transaction involving such securities and earn brokerage or other
compensation or act as a market maker in the financial instruments of the company(ies) covered under this report or (c) act as an advisor or lender/borrower to,
or may have any financial interest in, such company(ies) or (d) considering the nature of business/activities that JM Financial Institutional Securities is engaged in,
it may have potential conflict of interest at the time of publication of this report on the subject company(ies).
Neither JM Financial Institutional Securities nor its associates or the Research Analyst(s) named in this report or his/her relatives individually own one per cent or
more securities of the company(ies) covered under this report, at the relevant date as specified in the SEBI (Research Analysts) Regulations, 2014.
The Research Analyst(s) principally responsible for the preparation of this research report and members of their household are prohibited from buying or selling
debt or equity securities, including but not limited to any option, right, warrant, future, long or short position issued by company(ies) covered under this report.
The Research Analyst(s) principally responsible for the preparation of this research report or their relatives (as defined under SEBI (Research Analysts) Regulations,
2014); (a) do not have any financial interest in the company(ies) covered under this report or (b) did not receive any compensation from the company(ies) covered
under this report, or from any third party, in connection with this report or (c) do not have any other material conflict of interest at the time of publication of this
report. Research Analyst(s) are not serving as an officer, director or employee of the company(ies) covered under this report.
While reasonable care has been taken in the preparation of this report, it does not purport to be a complete description of the securities, markets or
developments referred to herein, and JM Financial Institutional Securities does not warrant its accuracy or completeness. JM Financial Institutional Securities may
not be in any way responsible for any loss or damage that may arise to any person from any inadvertent error in the information contained in this report. This
report is provided for information only and is not an investment advice and must not alone be taken as the basis for an investment decision.

NBFC 23 November 2020
JM Financial Institutional Securities Limited Page 16
The investment discussed or views expressed or recommendations/opinions given herein may not be suitable for all investors. The user assumes the entire risk of
any use made of this information. The information contained herein may be changed without notice and JM Financial Institutional Securities reserves the right to
make modifications and alterations to this statement as they may deem fit from time to time.
This report is neither an offer nor solicitation of an offer to buy and/or sell any securities mentioned herein and/or not an official confirmation of any transaction.
This report is not directed or intended for distribution to, or use by any person or entity who is a citizen or resident of or located in any locality, state, country or
other jurisdiction, where such distribution, publication, availability or use would be contrary to law, regulation or which would subject JM Financial Institutional
Securities and/or its affiliated company(ies) to any registration or licensing requirement within such jurisdiction. The securities described herein may or may not be
eligible for sale in all jurisdictions or to a certain category of investors. Persons in whose possession this report may come, are required to inform themselves of
and to observe such restrictions.
Persons who receive this report from JM Financial Singapore Pte Ltd may contact Mr. Ruchir Jhunjhunwala ([email protected]) on +65 6422 1888 in
respect of any matters arising from, or in connection with, this report.
Additional disclosure only for U.S. persons: JM Financial Institutional Securities has entered into an agreement with JM Financial Securities, Inc. ("JM Financial
Securities"), a U.S. registered broker-dealer and member of the Financial Industry Regulatory Authority ("FINRA") in order to conduct certain business in the
United States in reliance on the exemption from U.S. broker-dealer registration provided by Rule 15a-6, promulgated under the U.S. Securities Exchange Act of
1934 (the "Exchange Act"), as amended, and as interpreted by the staff of the U.S. Securities and Exchange Commission ("SEC") (together "Rule 15a-6").
This research report is distributed in the United States by JM Financial Securities in compliance with Rule 15a-6, and as a "third party research report" for
purposes of FINRA Rule 2241. In compliance with Rule 15a-6(a)(3) this research report is distributed only to "major U.S. institutional investors" as defined in Rule
15a-6 and is not intended for use by any person or entity that is not a major U.S. institutional investor. If you have received a copy of this research report and are
not a major U.S. institutional investor, you are instructed not to read, rely on, or reproduce the contents hereof, and to destroy this research or return it to JM
Financial Institutional Securities or to JM Financial Securities.
This research report is a product of JM Financial Institutional Securities, which is the employer of the research analyst(s) solely responsible for its content. The
research analyst(s) preparing this research report is/are resident outside the United States and are not associated persons or employees of any U.S. registered
broker-dealer. Therefore, the analyst(s) are not subject to supervision by a U.S. broker-dealer, or otherwise required to satisfy the regulatory licensing
requirements of FINRA and may not be subject to the Rule 2241 restrictions on communications with a subject company, public appearances and trading
securities held by a research analyst account.
JM Financial Institutional Securities only accepts orders from major U.S. institutional investors. Pursuant to its agreement with JM Financial Institutional Securities,
JM Financial Securities effects the transactions for major U.S. institutional investors. Major U.S. institutional investors may place orders with JM Financial
Institutional Securities directly, or through JM Financial Securities, in the securities discussed in this research report.
Additional disclosure only for U.K. persons: Neither JM Financial Institutional Securities nor any of its affiliates is authorised in the United Kingdom (U.K.) by the
Financial Conduct Authority. As a result, this report is for distribution only to persons who (i) have professional experience in matters relating to investments
falling within Article 19(5) of the Financial Services and Markets Act 2000 (Financial Promotion) Order 2005 (as amended, the "Financial Promotion Order"), (ii)
are persons falling within Article 49(2)(a) to (d) ("high net worth companies, unincorporated associations etc.") of the Financial Promotion Order, (iii) are outside
the United Kingdom, or (iv) are persons to whom an invitation or inducement to engage in investment activity (within the meaning of section 21 of the Financial
Services and Markets Act 2000) in connection with the matters to which this report relates may otherwise lawfully be communicated or caused to be
communicated (all such persons together being referred to as "relevant persons"). This report is directed only at relevant persons and must not be acted on or
relied on by persons who are not relevant persons. Any investment or investment activity to which this report relates is available only to relevant persons and will
be engaged in only with relevant persons.
Additional disclosure only for Canadian persons: This report is not, and under no circumstances is to be construed as, an advertisement or a public offering of the
securities described herein in Canada or any province or territory thereof. Under no circumstances is this report to be construed as an offer to sell securities or as
a solicitation of an offer to buy securities in any jurisdiction of Canada. Any offer or sale of the securities described herein in Canada will be made only under an
exemption from the requirements to file a prospectus with the relevant Canadian securities regulators and only by a dealer properly registered under applicable
securities laws or, alternatively, pursuant to an exemption from the registration requirement in the relevant province or territory of Canada in which such offer or
sale is made. This report is not, and under no circumstances is it to be construed as, a prospectus or an offering memorandum. No securities commission or
similar regulatory authority in Canada has reviewed or in any way passed upon these materials, the information contained herein or the merits of the securities
described herein and any representation to the contrary is an offence. If you are located in Canada, this report has been made available to you based on your
representation that you are an “accredited investor” as such term is defined in National Instrument 45-106 Prospectus Exemptions and a “permitted client” as
such term is defined in National Instrument 31-103 Registration Requirements, Exemptions and Ongoing Registrant Obligations. Under no circumstances is the
information contained herein to be construed as investment advice in any province or territory of Canada nor should it be construed as being tailored to the
needs of the recipient. Canadian recipients are advised that JM Financial Securities, Inc., JM Financial Institutional Securities Limited, their affiliates and authorized
agents are not responsible for, nor do they accept, any liability whatsoever for any direct or consequential loss arising from any use of this research report or the
information contained herein.