2021 interim results - group.pingan.com
TRANSCRIPT
2021 Interim Results
August 2021

To the extent any statements made in this Report contain information that is not historical, these statements are essentially forward-
looking. These forward-looking statements include but are not limited to projections, targets, estimates and business plans that the
Company expects or anticipates may or may not occur in the future. Words such as “potential”, “estimates”, “expects”, “anticipates”,
“objective”, “intends”, “plans”, “believes”, “will”, “may”, “should”, variations of these words and similar expressions are intended to
identify forward-looking statements.
These forward-looking statements are subject to known and unknown risks and uncertainties that may be general or specific. Readers
should be cautioned that a variety of factors, many of which are beyond the Company’s control, affect the performance, operations
and results of the Company, and could cause actual results to differ materially from the expectations expressed in any of the
Company’s forward-looking statements. These factors include, but are not limited to, exchange rate fluctuations, market shares,
competition, environmental risks, changes in legal, financial and regulatory frameworks, international economic and financial market
conditions and other risks and factors beyond our control. These and other factors should be considered carefully and readers should
not place undue reliance on the Company’s forward-looking statements. In addition, the Company undertakes no obligation to publicly
update or revise any forward-looking statement that is contained in this Report as a result of new information, future events or
otherwise. None of the Company, or any of its employees or affiliates is responsible for, or is making, any representations concerning
the future performance of the Company.
Cautionary Statements Regarding Forward-Looking Statements
2
3
Contents
Performance Overview
Integrated Finance
Life Reform & Technology
Jason Yao
Co-CEO and CFO
Xie Yonglin
President and Co-CEO
Jessica Tan
Co-CEO

4
Performance OverviewJason Yao
Co-CEO and CFO
Performance Overview Integrated Finance Life Reform & Technology
L&H Operating ROEV
(annualized)
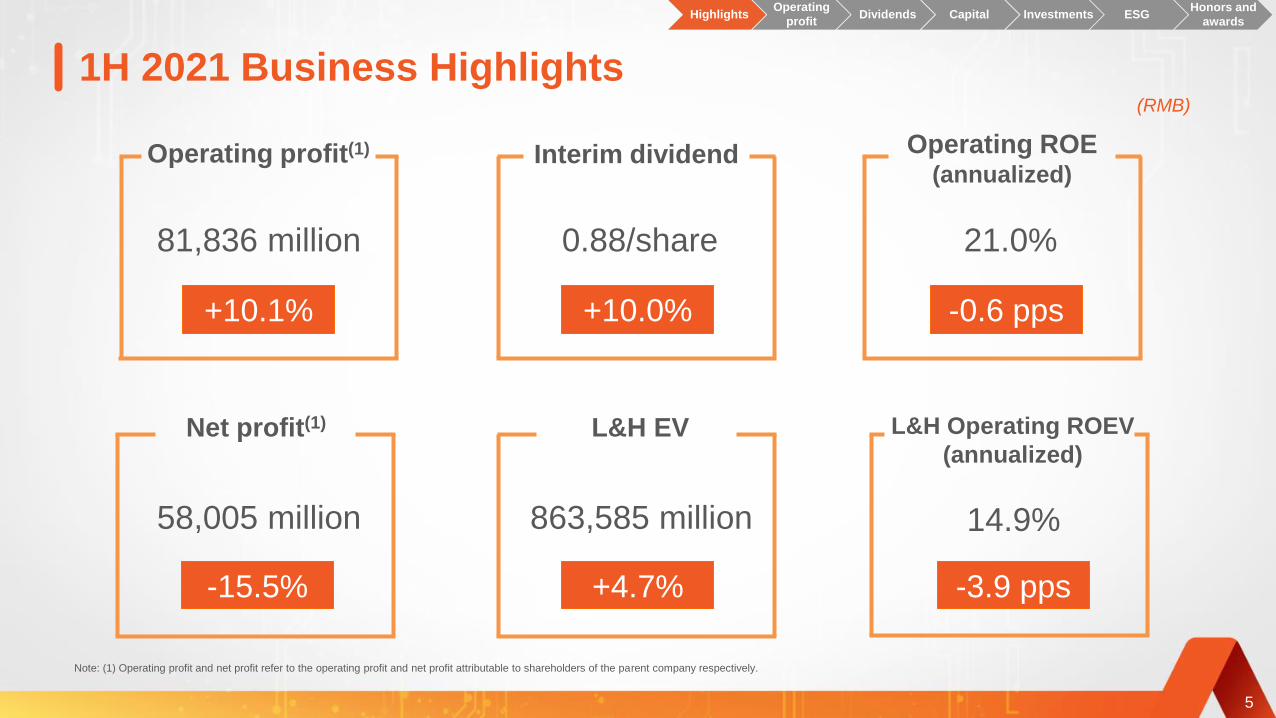
1H 2021 Business Highlights(RMB)
L&H EV
863,585 million
+4.7%
81,836 million
+10.1%
Operating profit(1)
14.9%
-3.9 pps
58,005 million
-15.5%
Net profit(1)
Operating ROE(annualized)
21.0%
-0.6 pps
0.88/share
+10.0%
Interim dividend
Note: (1) Operating profit and net profit refer to the operating profit and net profit attributable to shareholders of the parent company respectively.
5
HighlightsOperating
profitDividends Capital Investments ESG
Honors and
awards

Corporate and other operating
profit (RMB mn)
OPAT growth drivers: 85% Retail vs 15% Corporate & Other
Product profitability
Retail operating profit (RMB mn)
Retail customers
(mn persons)
Operating profit per
customer (RMB)
New customers
(mn persons)
Contracts per customer
Notes: (1) Operating profit refers to the operating profit attributable to shareholders of the parent company.
(2) Figures may not match the calculation due to rounding.
• 35.5% sourced from
Group’s internet users
• 64.5% sourced from
traditional channels
1H 2021/Jun 30, 2021
1H 2020/Jun 30, 2020
+0.1%
2.76
+6.5%
69,240
65,025
+6.4%
223
210
310.42
310.20
16.12
18.09
-10.9%
+2.6%
【】
2.69
2.76+35.7%
12,596
9,285
Group operating profit
(RMB mn)
+10.1%
81,836
74,310
HighlightsOperating
profitDividends Capital Investments ESG
Honors and
awards
6
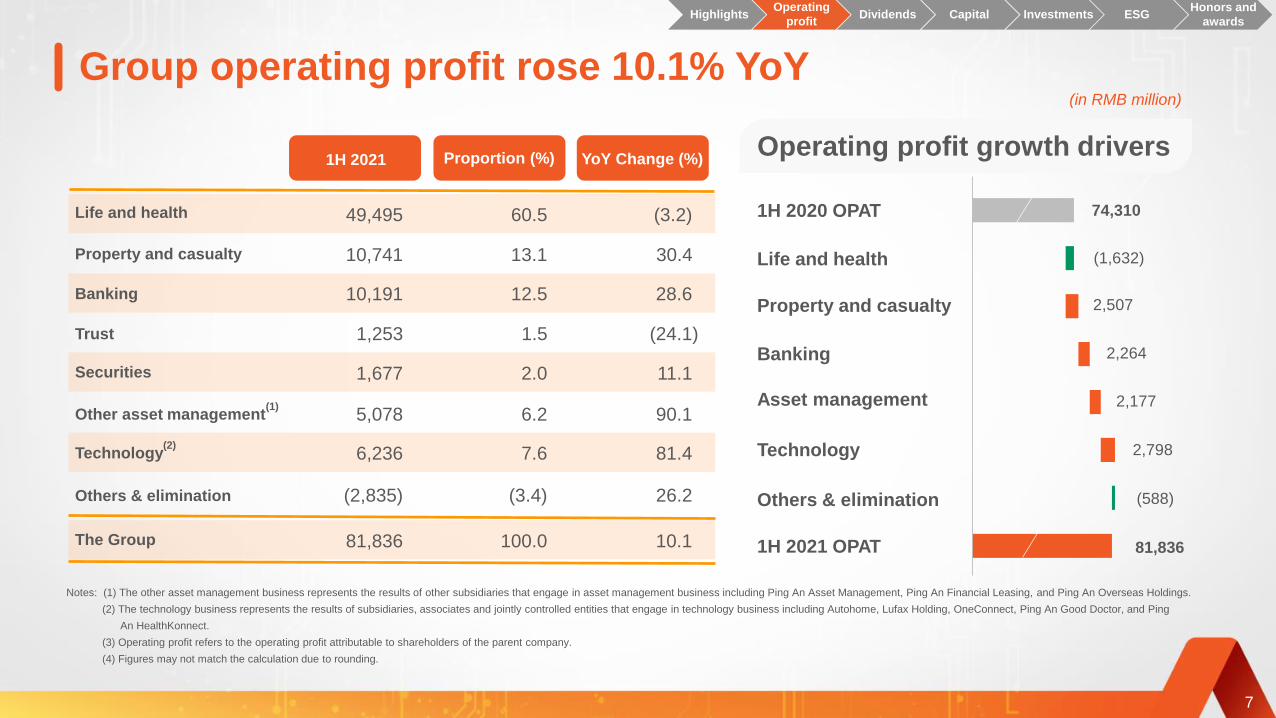
Group operating profit rose 10.1% YoY (in RMB million)
7
Notes: (1) The other asset management business represents the results of other subsidiaries that engage in asset management business including Ping An Asset Management, Ping An Financial Leasing, and Ping An Overseas Holdings.
(2) The technology business represents the results of subsidiaries, associates and jointly controlled entities that engage in technology business including Autohome, Lufax Holding, OneConnect, Ping An Good Doctor, and Ping
An HealthKonnect.
(3) Operating profit refers to the operating profit attributable to shareholders of the parent company.
(4) Figures may not match the calculation due to rounding.
Property and casualty
Banking
Technology(2)
Life and health
Trust
Others & elimination
The Group
1H 2021 Proportion (%) YoY Change (%)
Securities
Other asset management(1)
Operating profit growth driversOperating profit growth drivers
2,264
74,310
Property and casualty
Banking
Technology
Life and health
Others & elimination
Asset management
1H 2020 OPAT
1H 2021 OPAT
2,177
(588)
2,798
81,836
2,507
(1,632)10,741
10,191
6,236
49,495
1,253
(2,835)
81,836
13.1
12.5
7.6
60.5
1.5
(3.4)
100.0
30.4
(3.2)
28.6
81.4
(24.1)
26.2
10.1
1,677
5,078
2.0
6.2
11.1
90.1
HighlightsOperating
profitDividends Capital Investments ESG
Honors and
awards
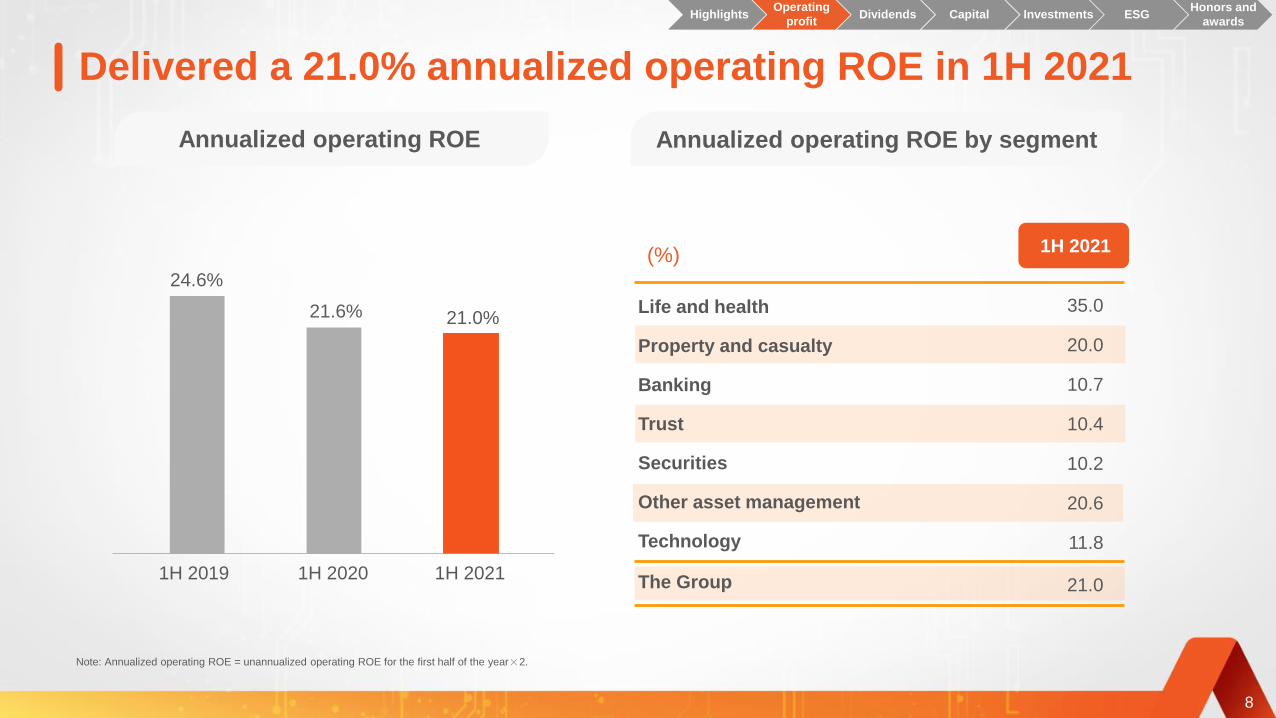
Delivered a 21.0% annualized operating ROE in 1H 2021
Annualized operating ROE
1H 2021
Annualized operating ROE by segment
1H 2020 1H 20211H 2019
(%)
8
Note: Annualized operating ROE = unannualized operating ROE for the first half of the year×2.
21.6% 21.0%
24.6%
35.0
20.0
10.7
10.4
10.2
20.6
11.8
21.0
Property and casualty
The Group
Banking
Securities
Life and health
Trust
Other asset management
Technology
HighlightsOperating
profitDividends Capital Investments ESG
Honors and
awards
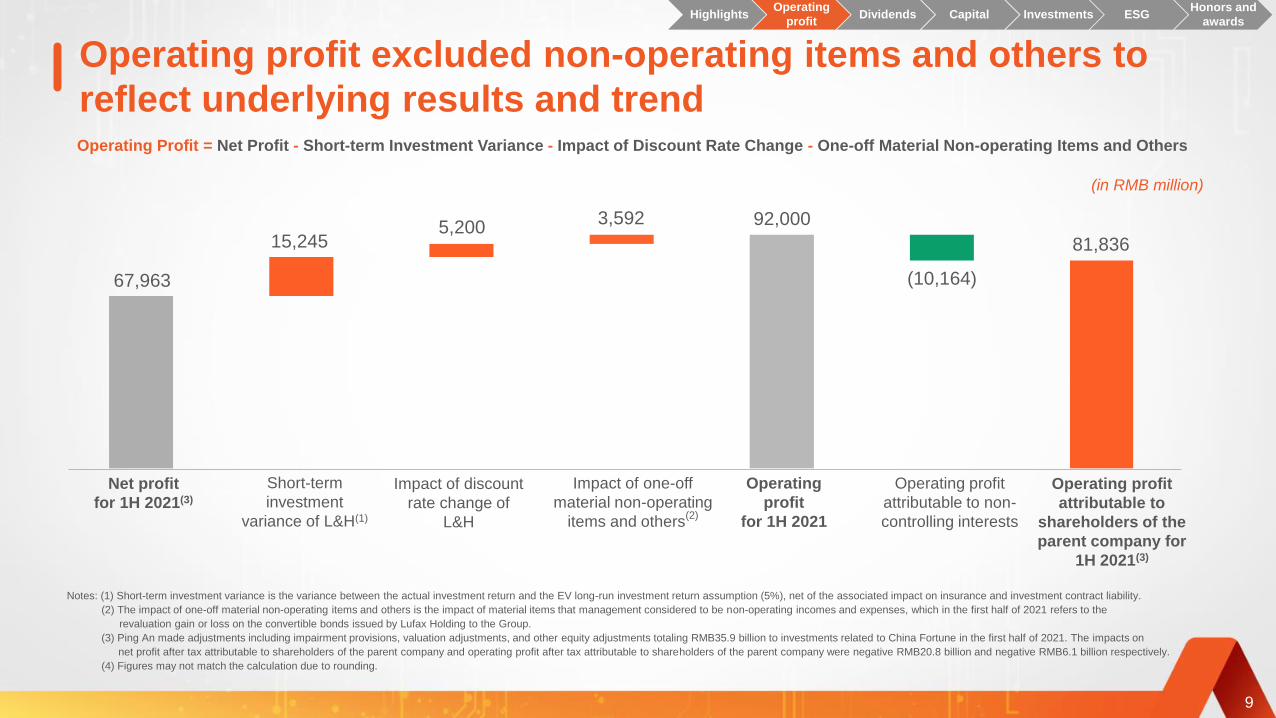
Operating profit excluded non-operating items and others to
reflect underlying results and trend
9
(in RMB million)
Operating Profit = Net Profit - Short-term Investment Variance - Impact of Discount Rate Change - One-off Material Non-operating Items and Others
Net profit
for 1H 2021(3)
Short-term
investment
variance of L&H(1)
Impact of one-off
material non-operating
items and others(2)
Operating profit
attributable to
shareholders of the
parent company for
1H 2021(3)
Impact of discount
rate change of
L&H
Operating
profit
for 1H 2021
Operating profit
attributable to non-
controlling interests
Notes: (1) Short-term investment variance is the variance between the actual investment return and the EV long-run investment return assumption (5%), net of the associated impact on insurance and investment contract liability.
(2) The impact of one-off material non-operating items and others is the impact of material items that management considered to be non-operating incomes and expenses, which in the first half of 2021 refers to the
revaluation gain or loss on the convertible bonds issued by Lufax Holding to the Group.
(3) Ping An made adjustments including impairment provisions, valuation adjustments, and other equity adjustments totaling RMB35.9 billion to investments related to China Fortune in the first half of 2021. The impacts on
net profit after tax attributable to shareholders of the parent company and operating profit after tax attributable to shareholders of the parent company were negative RMB20.8 billion and negative RMB6.1 billion respectively.
(4) Figures may not match the calculation due to rounding.
67,963
15,2455,200
3,592 92,000
(10,164)
81,836
HighlightsOperating
profitDividends Capital Investments ESG
Honors and
awards

L&H operating profit attributable to shareholders of the parent
company decreased by 3.2% YoY(in RMB million)
10
960,183
41,480
18,287
(41,589)
(10,148)
968,212
1H 20201H 2021
7,133
7,011
57,858
(7,629)
50,230
YoY change
(%)
3.1
13.9
(29.1)
(2.4)
(1.6)
(2.5)
49,495 (3.2)
2,125 (23.9)
Release of residual margin
Return on net worth(2)
Operating variances and others(4)
Income tax
Operating profit after tax
Operating profit attributable to
the parent company
Spread income(3)
End-2020 residual
margin of L&H
Expected interest
growth
Mid-2021 residual
margin of L&H
Contribution from
new business
Release of
residual margin
Lapse variances and
others(1)
(1) Lapse variances and others were adverse mainly due to the gradual lapse of customers who stopped paying premiums.
(2) Return on net worth is the investment return on shareholder equity based on the EV long-run investment return assumption (5%).
(3) Spread income is the expected investment return from assets backing contract liability based on the EV long-run investment return assumption (5%) exceeding the interest required on contract liability.
(4) Operating variances and others dropped 29.1% year on year, largely because of factors including slower new business growth, fluctuating policy persistency ratios, and lower claims variance as claim payments normalized in
the first half of 2021 versus lower claim payments in the first half of 2020 because of COVID-19.
(5) Figures may not match the calculation due to rounding.
41,589
Notes:
6,261
9,890
59,284
(7,749)
51,535
51,127
2,791
40,342
Operating profit before tax
HighlightsOperating
profitDividends Capital Investments ESG
Honors and
awards

L&H delivered a 14.9% annualized operating ROEV
11
Unwinding of in-force return was
RMB29,377 million.
ANA return was RMB5,602 million.
Annualized Operating ROEV(1)
of L&H = 14.9%
End-2020 L&H
EV
Expected return
on EV(2)
Operating
contribution(4)
Mid-2021
L&H EV
Value generation
of new business(3)
L&H EV before
non-operating
contributions
Non-operating
profit
Dividend
paid(6)
Investment
variance and
others(5)
Employee stock
ownership plan
Notes: (1) Annualized Operating ROEV = Operating ROEV for the first half of the year x 2.
(2) Expected return on EV consists of the expected return from opening adjusted net assets, the opening value of in-force and the NBV during the Reporting Period.
(3) Value generation of new business comprises NBV (RMB27,387 million) and risk diversification effects (RMB3,831 million).
(4) Operating contribution of L&H comprises the operating assumptions and model changes of RMB1,251 million and the operating variances and others of RMB-6,144 million. The operating variances and others declined as new
business growth declined, and policy persistency ratios fluctuated.
(5) Investment variance and others include the investment variance and market value adjustments.
(6) Dividends paid by Ping An Life to the Group amounted to RMB10,461 million.
(7) Figures may not match the calculation due to rounding.
(in RMB million)
824,574
0
34,97831,218
(4,892)
885,878
(10,136) (1,697) (10,461)
863,585
HighlightsOperating
profitDividends Capital Investments ESG
Honors and
awards
12
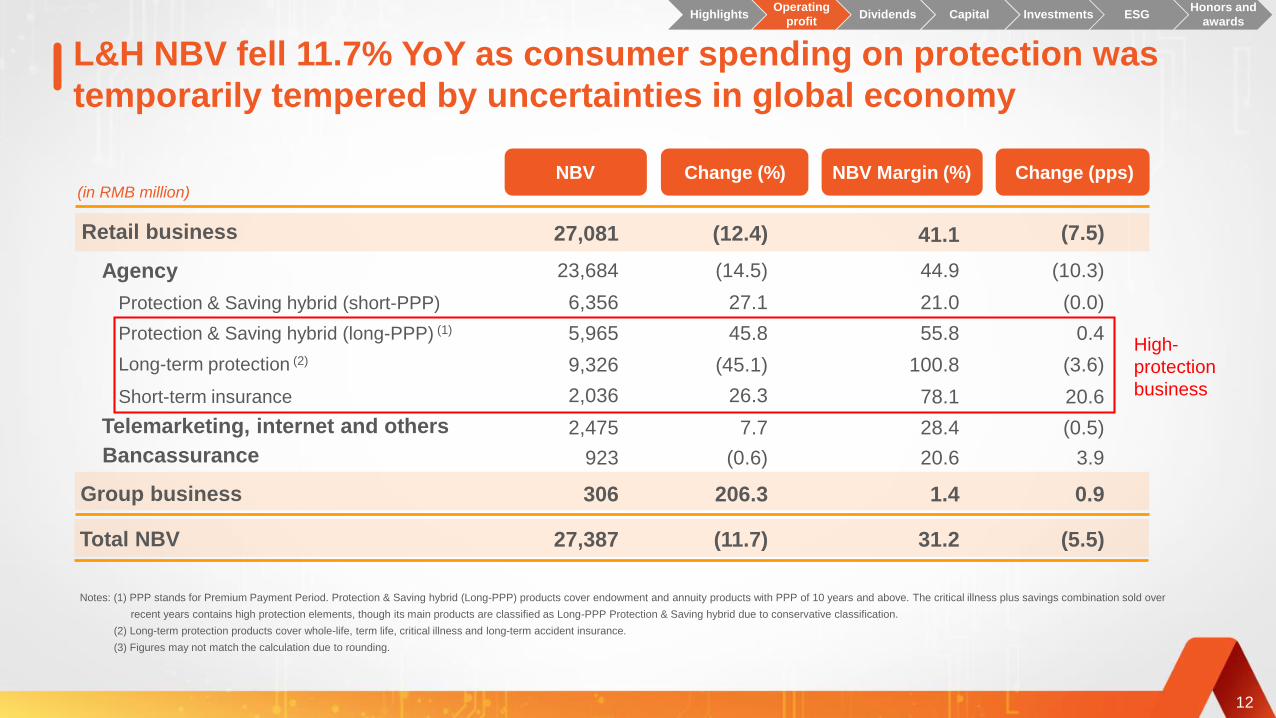
L&H NBV fell 11.7% YoY as consumer spending on protection was
temporarily tempered by uncertainties in global economy
Retail business
Long-term protection (2)
Protection & Saving hybrid (short-PPP)
Protection & Saving hybrid (long-PPP) (1)
Short-term insurance
Telemarketing, internet and others
Bancassurance
Agency
NBV(in RMB million)
Change (%) NBV Margin (%) Change (pps)
Notes: (1) PPP stands for Premium Payment Period. Protection & Saving hybrid (Long-PPP) products cover endowment and annuity products with PPP of 10 years and above. The critical illness plus savings combination sold over
recent years contains high protection elements, though its main products are classified as Long-PPP Protection & Saving hybrid due to conservative classification.
(2) Long-term protection products cover whole-life, term life, critical illness and long-term accident insurance.
(3) Figures may not match the calculation due to rounding.
Group business
Total NBV
High-
protection
business
27,081
306
27,387
(12.4)
206.3
(11.7)
23,684
9,326
5,965
6,356
2,036
2,475
923
(14.5)
(45.1)
45.8
27.1
26.3
7.7
(0.6)
41.1
1.4
31.2
44.9
100.8
55.8
21.0
78.1
28.4
20.6
(7.5)
0.9
(5.5)
(10.3)
(3.6)
0.4
(0.0)
20.6
(0.5)
3.9
HighlightsOperating
profitDividends Capital Investments ESG
Honors and
awards
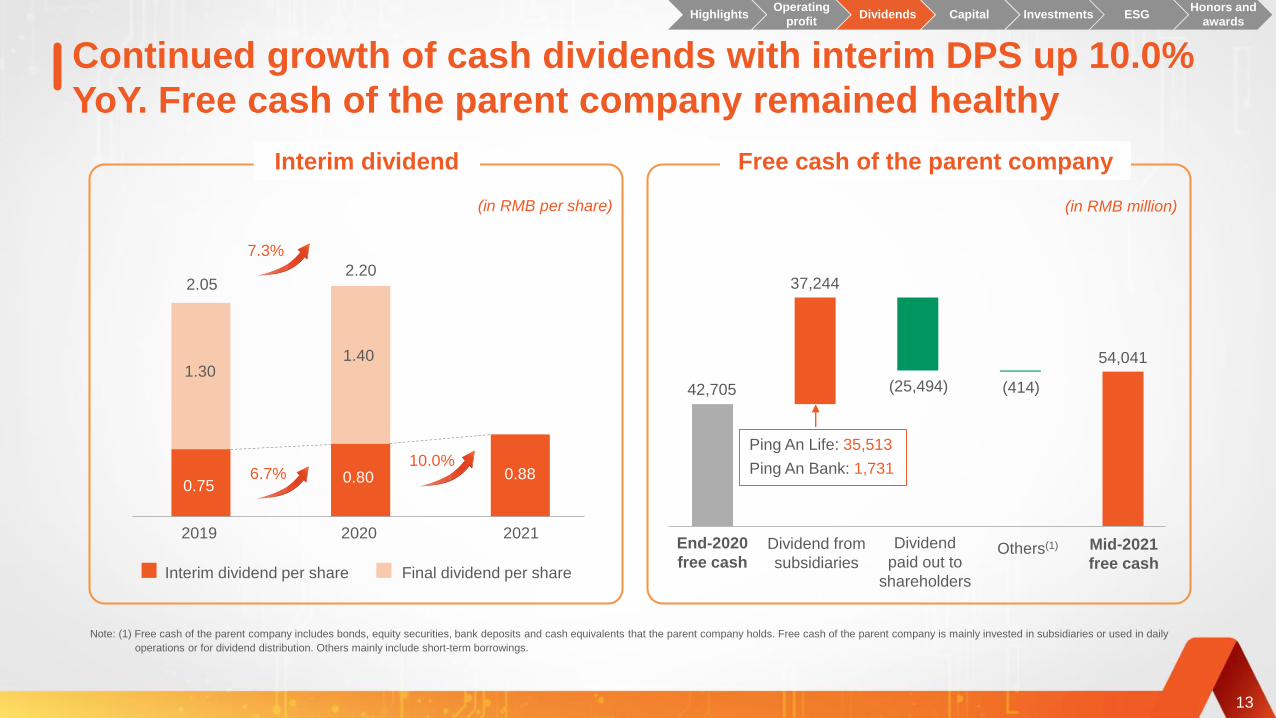
Interim dividend per share Final dividend per share
Continued growth of cash dividends with interim DPS up 10.0%
YoY. Free cash of the parent company remained healthy
13
Note: (1) Free cash of the parent company includes bonds, equity securities, bank deposits and cash equivalents that the parent company holds. Free cash of the parent company is mainly invested in subsidiaries or used in daily
operations or for dividend distribution. Others mainly include short-term borrowings.
2019 2020 2021
Ping An Life: 35,513
Ping An Bank: 1,731
Interim dividend
(in RMB per share)
End-2020
free cashDividend from
subsidiaries
Dividend
paid out to
shareholders
Others(1) Mid-2021
free cash
Free cash of the parent company
(in RMB million)
42,705
37,244
(25,494)
54,041
(414)
HighlightsOperating
profitDividends Capital Investments ESG
Honors and
awards
2.052.20
0.750.75
1.30
0.80
1.40
7.3%
0.8810.0%
6.7% 0.80

The Company plans to repurchase shares worth RMB5-10 billion
14
HighlightsOperating
profitDividends Capital Investments ESG
Honors and
awards
• Amount of shares to be repurchased:
RMB5-10 billion worth of A shares
• Period of time for repurchase: Within 12
months from the date of the approval by
the Company’s Board of Directors.
• All the funds to be used for the repurchase
will come from the Company’s proprietary
funds.
• The repurchase will NOT have material
negative impacts on the Company’s
operations, profitability, financial position,
research and development capability,
fulfillment of repayment obligations and
future development.
Details of the
repurchaseSource of funds Impact of the
repurchase
15
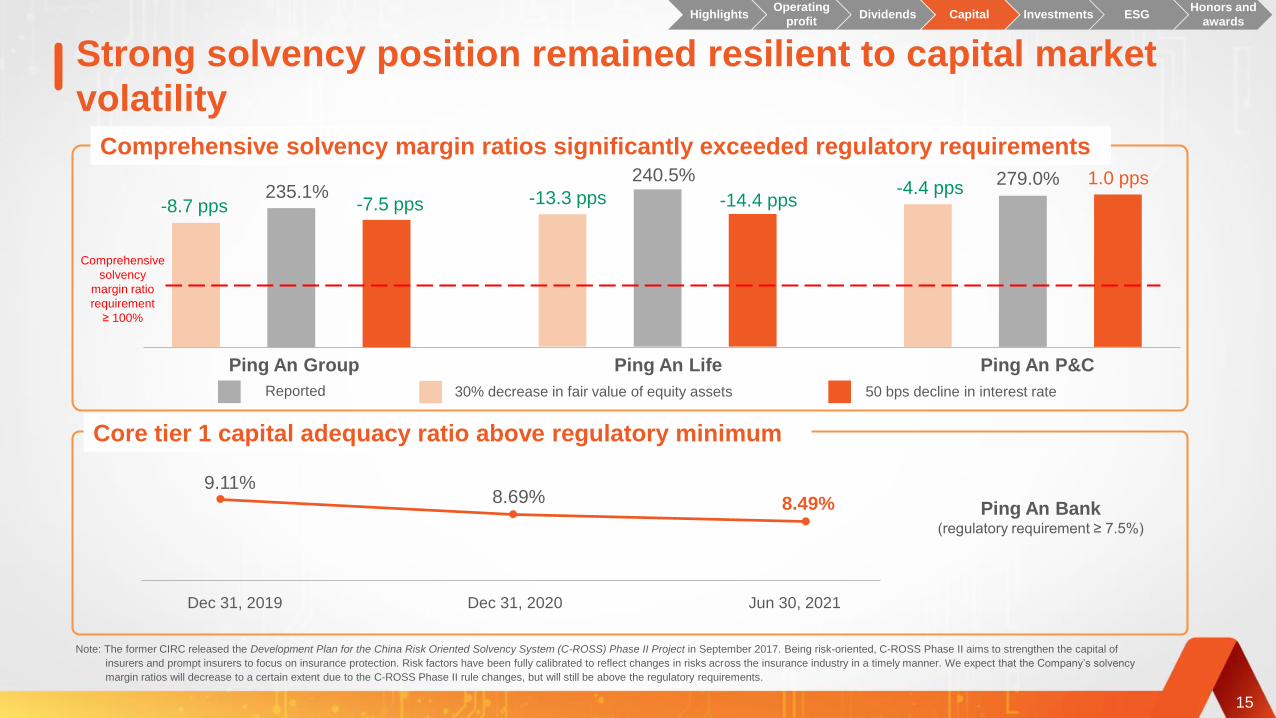
Strong solvency position remained resilient to capital market
volatility
Note: The former CIRC released the Development Plan for the China Risk Oriented Solvency System (C-ROSS) Phase II Project in September 2017. Being risk-oriented, C-ROSS Phase II aims to strengthen the capital of
insurers and prompt insurers to focus on insurance protection. Risk factors have been fully calibrated to reflect changes in risks across the insurance industry in a timely manner. We expect that the Company’s solvency
margin ratios will decrease to a certain extent due to the C-ROSS Phase II rule changes, but will still be above the regulatory requirements.
HighlightsOperating
profitDividends Capital Investments ESG
Honors and
awards
Dec 31, 2020Dec 31, 2019 Jun 30, 2021
Ping An Bank(regulatory requirement ≥ 7.5%)
Core tier 1 capital adequacy ratio above regulatory minimum
Comprehensive solvency margin ratios significantly exceeded regulatory requirements
Ping An Life Ping An P&CPing An Group
Reported 30% decrease in fair value of equity assets 50 bps decline in interest rate
Comprehensive
solvency
margin ratio
requirement
≥ 100%
9.11%8.69% 8.49%
-8.7 pps -7.5 pps235.1% -13.3 pps -14.4 pps
240.5%-4.4 pps
1.0 pps279.0%
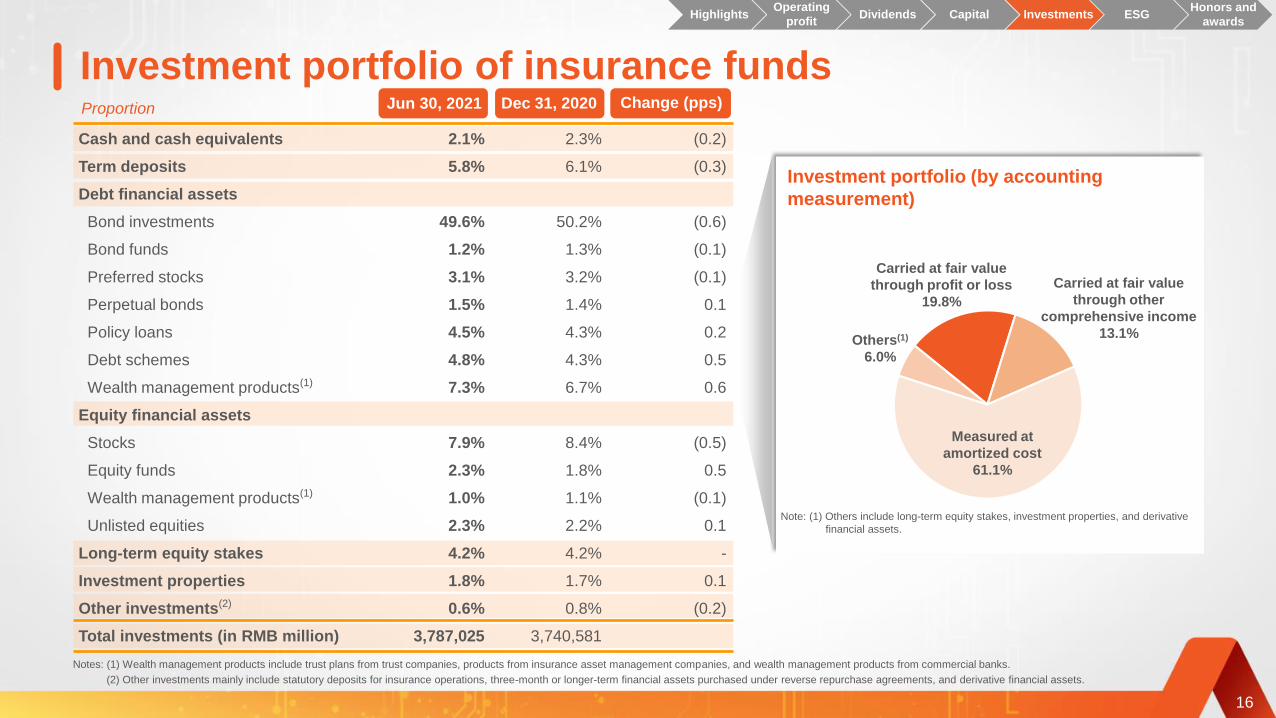
Jun 30, 2021 Dec 31, 2020
Cash and cash equivalents 2.1% 2.3% (0.2)
Term deposits 5.8% 6.1% (0.3)
Debt financial assets
Bond investments 49.6% 50.2% (0.6)
Bond funds 1.2% 1.3% (0.1)
Preferred stocks 3.1% 3.2% (0.1)
Perpetual bonds 1.5% 1.4% 0.1
Policy loans 4.5% 4.3% 0.2
Debt schemes 4.8% 4.3% 0.5
Wealth management products(1) 7.3% 6.7% 0.6
Equity financial assets
Stocks 7.9% 8.4% (0.5)
Equity funds 2.3% 1.8% 0.5
Wealth management products(1) 1.0% 1.1% (0.1)
Unlisted equities 2.3% 2.2% 0.1
Long-term equity stakes 4.2% 4.2% -
Investment properties 1.8% 1.7% 0.1
Other investments(2) 0.6% 0.8% (0.2)
Total investments (in RMB million) 3,787,025 3,740,581
16
Investment portfolio of insurance fundsChange (pps)Proportion
Notes: (1) Wealth management products include trust plans from trust companies, products from insurance asset management companies, and wealth management products from commercial banks.
(2) Other investments mainly include statutory deposits for insurance operations, three-month or longer-term financial assets purchased under reverse repurchase agreements, and derivative financial assets.
Investment portfolio (by accounting
measurement)
Carried at fair value
through other
comprehensive income
13.1%
Carried at fair value
through profit or loss
19.8%
Others(1)
6.0%
Measured at
amortized cost
61.1%
Note: (1) Others include long-term equity stakes, investment properties, and derivative
financial assets.
HighlightsOperating
profitDividends Capital Investments ESG
Honors and
awards
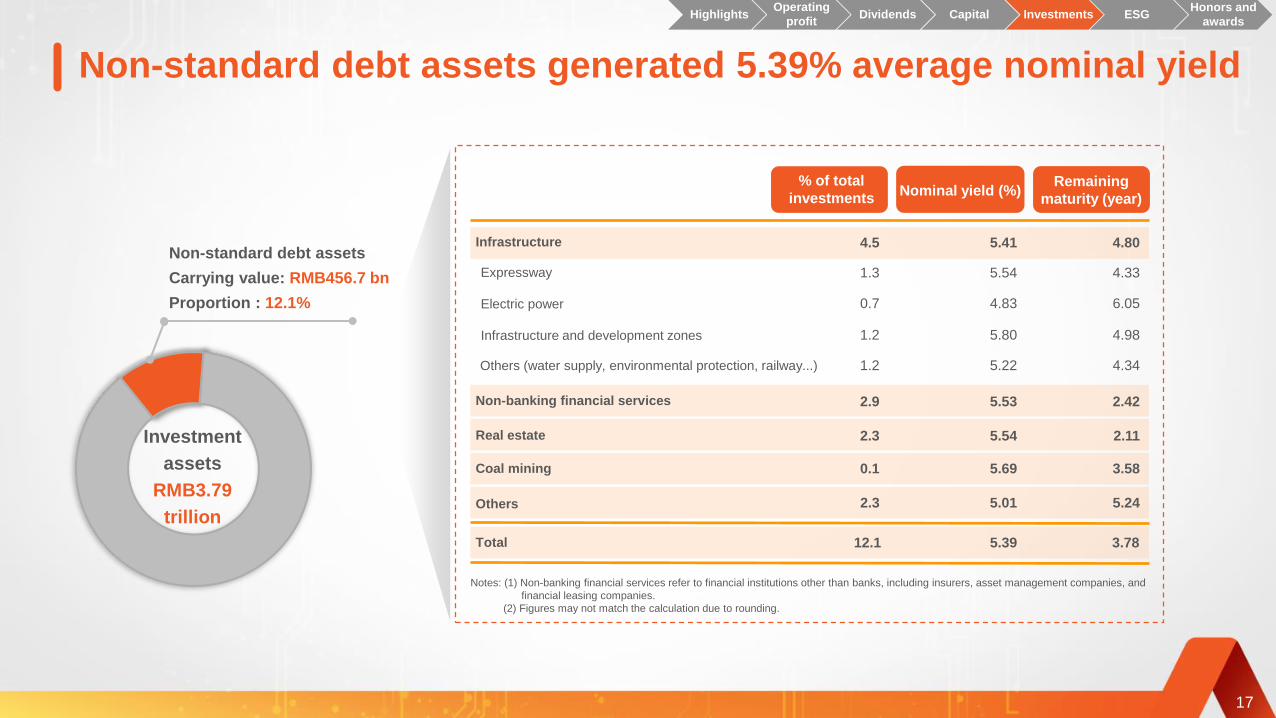
Non-standard debt assets generated 5.39% average nominal yield
Notes: (1) Non-banking financial services refer to financial institutions other than banks, including insurers, asset management companies, and
financial leasing companies.
(2) Figures may not match the calculation due to rounding.
17
HighlightsOperating
profitDividends Capital Investments ESG
Honors and
awards
1.3
0.7
4.5
1.2
1.2
2.9
2.3
0.1
2.3
12.1
% of total
investments
Expressway
Electric power
Infrastructure
Infrastructure and development zones
Others (water supply, environmental protection, railway...)
Non-banking financial services
Real estate
Coal mining
Others
Total
5.54
4.83
5.41
5.80
5.22
5.53
5.54
5.69
5.01
5.39
Nominal yield (%)
4.33
6.05
4.80
4.98
4.34
2.42
2.11
3.58
5.24
3.78
Remaining
maturity (year)
Investment
assets
RMB3.79
trillion
Non-standard debt assets
Carrying value: RMB456.7 bn
Proportion : 12.1%
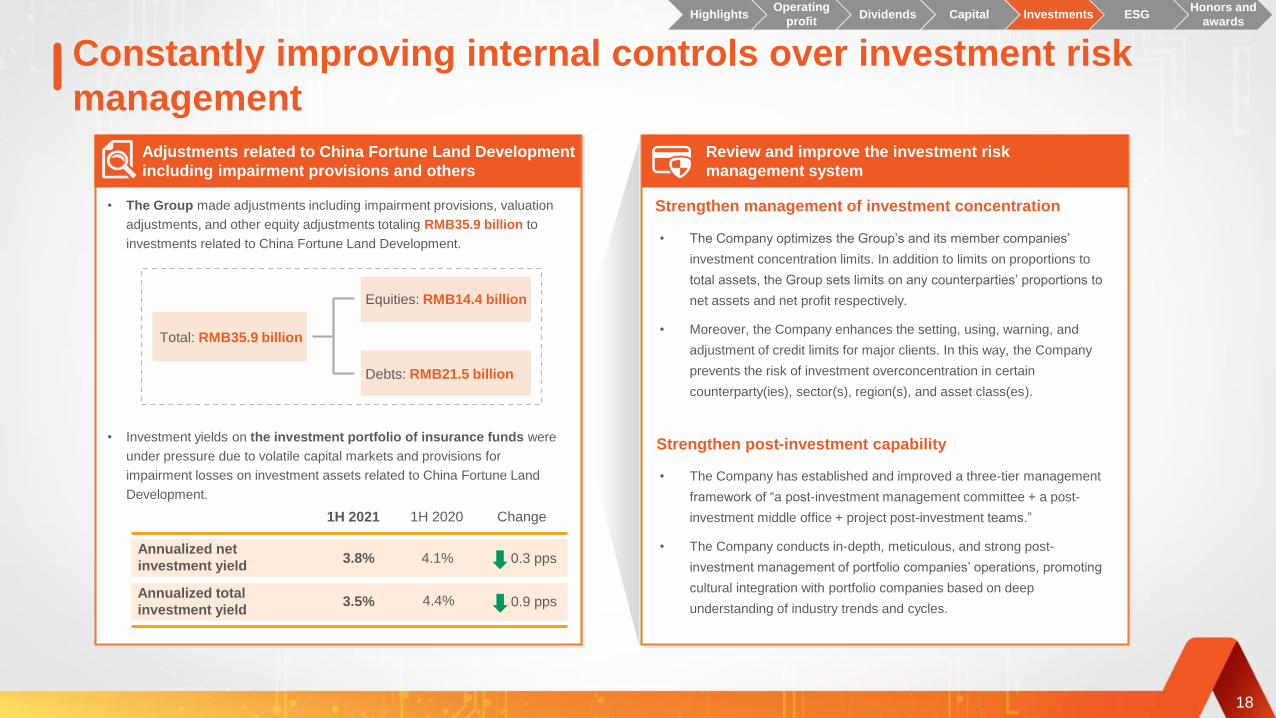
Constantly improving internal controls over investment risk
management
3.8% 4.1%
3.5% 4.4%
0.3 pps
0.9 pps
18
HighlightsOperating
profitDividends Capital Investments ESG
Honors and
awards
Adjustments related to China Fortune Land Development
including impairment provisions and others
Total: RMB35.9 billion
• The Group made adjustments including impairment provisions, valuation
adjustments, and other equity adjustments totaling RMB35.9 billion to
investments related to China Fortune Land Development.
Equities: RMB14.4 billion
Debts: RMB21.5 billion
Review and improve the investment risk
management system
Strengthen management of investment concentration
Strengthen post-investment capability• Investment yields on the investment portfolio of insurance funds were
under pressure due to volatile capital markets and provisions for
impairment losses on investment assets related to China Fortune Land
Development.
1H 2021 1H 2020 Change
Annualized net
investment yield
Annualized total
investment yield
• The Company optimizes the Group’s and its member companies’
investment concentration limits. In addition to limits on proportions to
total assets, the Group sets limits on any counterparties’ proportions to
net assets and net profit respectively.
• Moreover, the Company enhances the setting, using, warning, and
adjustment of credit limits for major clients. In this way, the Company
prevents the risk of investment overconcentration in certain
counterparty(ies), sector(s), region(s), and asset class(es).
• The Company has established and improved a three-tier management
framework of “a post-investment management committee + a post-
investment middle office + project post-investment teams.”
• The Company conducts in-depth, meticulous, and strong post-
investment management of portfolio companies’ operations, promoting
cultural integration with portfolio companies based on deep
understanding of industry trends and cycles.

Index & Rating 1H 2021 Description
MSCI ESG rating A
FTSE4Good Index Series Included
CDP rating A-
Lower
RiskLeading position in China
Hang Seng Corporate
Sustainability IndexA
Leading position in China and an advanced level globally
19
The best rating among financial companies in the Chinese mainland
Responsible
investment reached
RMB1.2 trillion+
Sustainable insurance
products: 1,000+
Social Responsibility
1,775 public welfare initiatives
were sponsored in 1H 2021,
attracting 1.69 million
participants in the 1H 2021.
Total balance of
inclusive loans and
green loans was
nearly RMB0.5
trillion
Ping An Rural
Communities Support
Voluntary services
Investment
Insurance
Credit
We provided
RMB36 billion+
for industrial poverty alleviation
Insured amount of sustainable
insurance: Nearly RMB237 trillion
Sustainability: an ESG leader in China with ongoing positive
impacts
Included in the Hang Seng China Enterprises Index ESG Index and the Hang Seng ESG50 Index
Responsible Investment &
Insurance
HighlightsOperating
profitDividends Capital Investments ESG
Honors and
awards
Global Partnerships
Sustainalystics’s ESG risk rating

Honors and awards
Fortune Global 500
No. 16
Fortune ForbesWPP & Kantar,
the world’s largest
communications group
Brand Finance,
the world’s largest brand
consulting company
Most valuable global
insurance brands
No. 1
Global financial
groups
No. 3
Top 100 most valuable
global brands
No. 49
Global banks and
insurers
No. 1
Global 2000
largest public companies
No. 6Global insurance
conglomerates
No. 1Global financial
groups
No. 5
Global financial
groups
No. 2
20
HighlightsOperating
profitDividends Capital Investments ESG
Honors and
awards

21
Integrated FinanceXie Yonglin
President and Co-CEO
Performance Overview Integrated Finance Life Reform & Technology
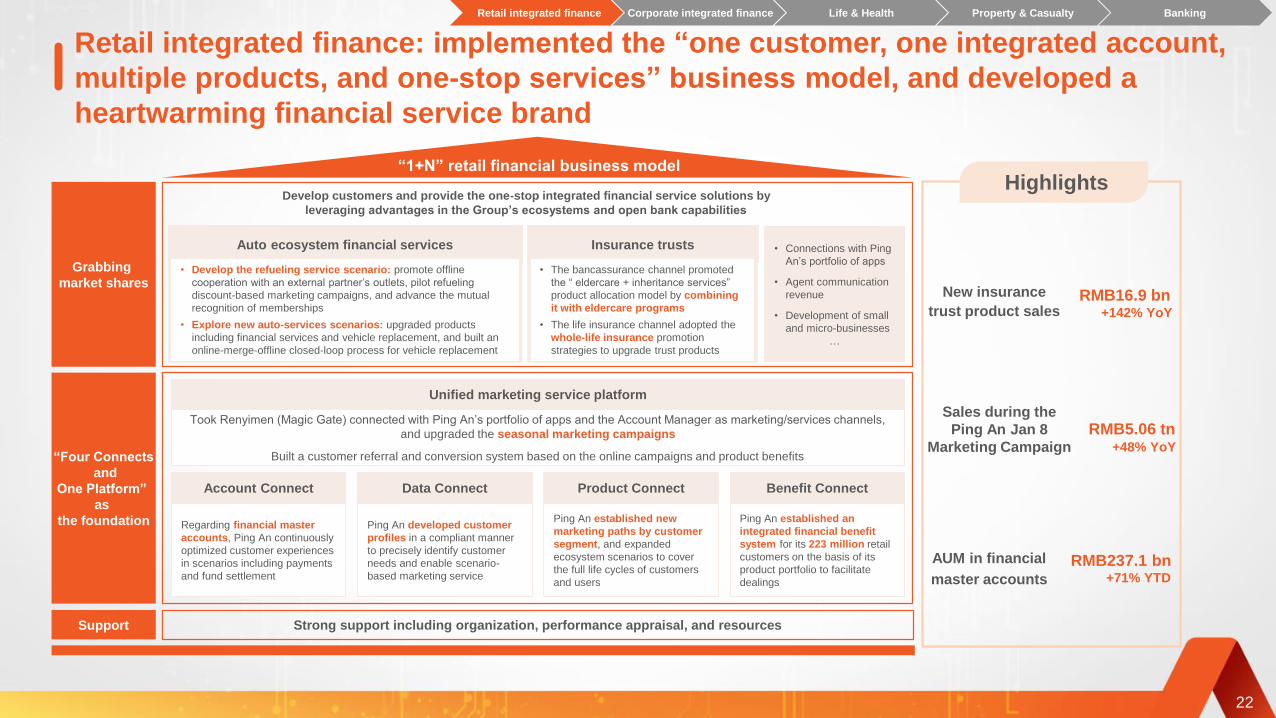
Retail integrated finance: implemented the “one customer, one integrated account,
multiple products, and one-stop services” business model, and developed a
heartwarming financial service brand
“Four Connects
and
One Platform”
as
the foundation
Grabbing
market shares
Support Strong support including organization, performance appraisal, and resources
22
Develop customers and provide the one-stop integrated financial service solutions by
leveraging advantages in the Group’s ecosystems and open bank capabilities
Auto ecosystem financial services
• Develop the refueling service scenario: promote offline
cooperation with an external partner’s outlets, pilot refueling
discount-based marketing campaigns, and advance the mutual
recognition of memberships
• Explore new auto-services scenarios: upgraded products
including financial services and vehicle replacement, and built an
online-merge-offline closed-loop process for vehicle replacement
• Connections with Ping
An’s portfolio of apps
• Agent communication
revenue
• Development of small
and micro-businesses
…
“1+N” retail financial business model
Insurance trusts
• The bancassurance channel promoted
the “ eldercare + inheritance services”
product allocation model by combining
it with eldercare programs
• The life insurance channel adopted the
whole-life insurance promotion
strategies to upgrade trust products
New insurance
trust product salesRMB16.9 bn
+142% YoY
Sales during the
Ping An Jan 8
Marketing Campaign
RMB5.06 tn+48% YoY
AUM in financial
master accounts
RMB237.1 bn+71% YTD
Took Renyimen (Magic Gate) connected with Ping An’s portfolio of apps and the Account Manager as marketing/services channels,
and upgraded the seasonal marketing campaigns
Built a customer referral and conversion system based on the online campaigns and product benefits
Unified marketing service platform
Ping An developed customer
profiles in a compliant manner
to precisely identify customer
needs and enable scenario-
based marketing service
Data Connect
Ping An established new
marketing paths by customer
segment, and expanded
ecosystem scenarios to cover
the full life cycles of customers
and users
Product Connect
Ping An established an
integrated financial benefit
system for its 223 million retail
customers on the basis of its
product portfolio to facilitate
dealings
Benefit Connect
Regarding financial master
accounts, Ping An continuously
optimized customer experiences
in scenarios including payments
and fund settlement
Account Connect
Highlights
Retail integrated finance Corporate integrated finance Life & Health Property & Casualty Banking

Retail customers
Significant potential to further penetrate our 627 million internet user base
Internet users who were retail customers
Internet users who were not yet retail
customers
(million persons)
Dec 31, 2018 Dec 31, 2019 Dec 31, 2020Dec 31, 2017Dec 31, 2016
(million persons)
23
430 444516
157 180 200303 296342
127 148 174
598
218
404
194
223
427
200
346
131 247
99
Jun 30, 2021
627
Cross-selling penetration ratio has increased materially despite rapid growth in customers
24.0%
29.6%34.3%
36.8% 38.0%
3246
6274
83 Proportion of retail customers
holding multiple contracts with
different subsidiaries
Number of retail customers
holding multiple contracts
with different subsidiaries
38.7%
86
Dec 31, 2018 Dec 31, 2019 Dec 31, 2020Dec 31, 2017Dec 31, 2016 Jun 30, 2021
Notes: (1) We tightened the definitions of retail customers and internet users by removing customers with complimentary insurance only and unique users of suspended internet platforms respectively at the end of 2019, and restated
data for the comparable periods of 2017 and 2018.
(2) Figures may not match the calculation due to rounding.
Retail integrated finance: increased customers, users and
cross-selling
Retail integrated finance Corporate integrated finance Life & Health Property & Casualty Banking

3 innovative
breakthrough
models
Ongoing
customer
development
Technological
empowerment
“1+N” corporate business model
Strategic/large customers and
government customers
• Integrated “finance + ecosystem” resources
across the Group, and developed business in
industry scenarios; leveraged advantages in
licenses and products to provide tailor-made
integrated finance solutions
Micro-, small and medium-sized
business customers
• All-around digital, smart operations
• Online and mass customer development
through a uniform customer development
platform
Financial institution customers
• Driven by expertise and technology
• Empower transactions with technology, and
leverage advantages in strategies, pricing and
post-investment empowerment
Sophisticated investment and
financing model
• Developed business in industry scenarios:
taking advantage of the “industry expert + solution
expert + diverse funding” model
• Ping An provided key customers with
differentiated financial services including capital
increases, share purchases, and asset
mobilization, involving total project investments
of over RMB15 billion
• Developed the bond business ecosystem and
the inquiries and bidding mechanisms, and
empowered investment banks in terms of
strategies, pricing and post-investment
• Unified post-investment risk warning:
conducted analysis and gave risk warning on
specific industries
• Yields continue to outperform the market
Trading collaboration model
• “Four Connects and One Platform” : developed
a uniform customer development platform for
micro-, small and medium-sized enterprises
• The registered users of the “Ping An Digital
Pocket” app amounted to 4.87 million, up
368.5% year to date
Simple standard model
Developed the online industrial platform to develop business
in industry scenarios for up/down-stream companies
Provided rich data from multiple dimensions including profiles of
the Group’s customers, cross-selling performance analysis and
market overviewsDataSystems
Corporate integrated finance: ongoing customer development
and three innovative breakthrough models
24
Retail integrated finance Corporate integrated finance Life & Health Property & Casualty Banking
25
1H 2020 1H 2021
1H 2020 1H 2021Dec 31, 2020 Jun 30, 2021
1H 2020 1H 2021
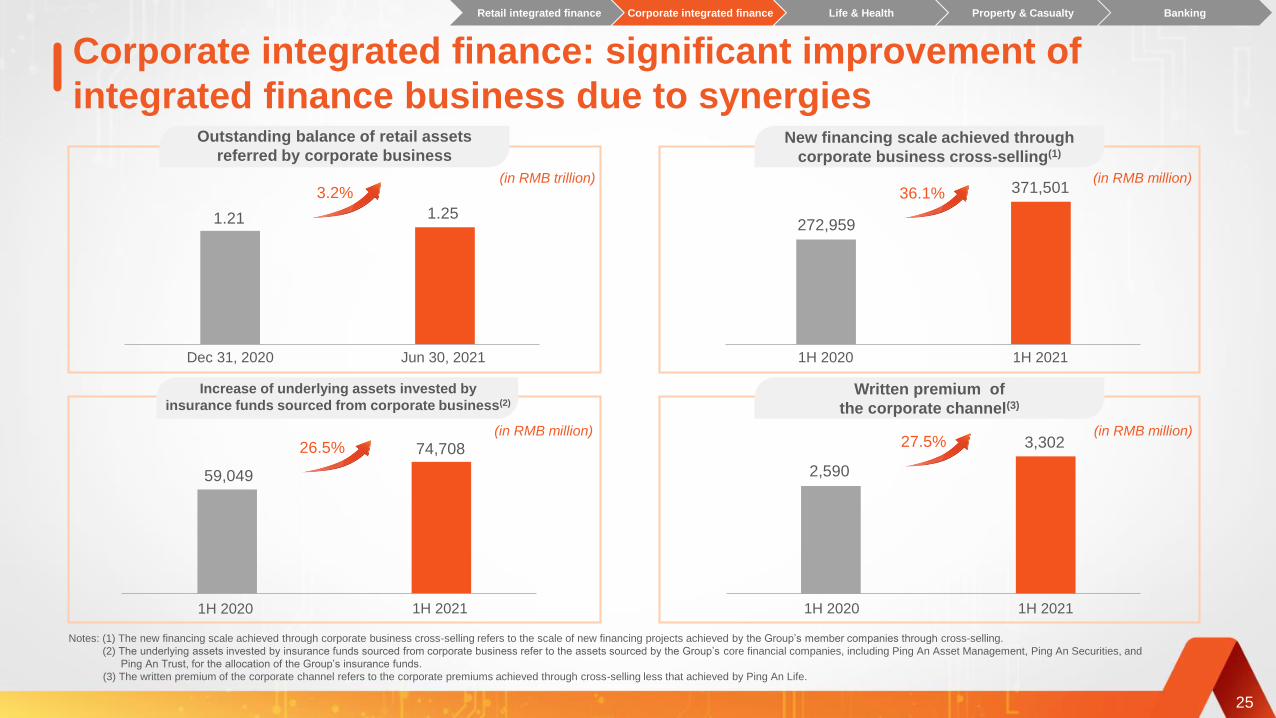
Notes: (1) The new financing scale achieved through corporate business cross-selling refers to the scale of new financing projects achieved by the Group’s member companies through cross-selling.
(2) The underlying assets invested by insurance funds sourced from corporate business refer to the assets sourced by the Group’s core financial companies, including Ping An Asset Management, Ping An Securities, and
Ping An Trust, for the allocation of the Group’s insurance funds.
(3) The written premium of the corporate channel refers to the corporate premiums achieved through cross-selling less that achieved by Ping An Life.
Outstanding balance of retail assets
referred by corporate business
Corporate integrated finance: significant improvement of
integrated finance business due to synergies New financing scale achieved through
corporate business cross-selling(1)
Written premium of
the corporate channel(3)
Increase of underlying assets invested by
insurance funds sourced from corporate business(2)
(in RMB trillion)
(in RMB million)(in RMB million)
(in RMB million)
27.5% 3,302
2,590
1.25
3.2%
1.21 272,959
371,50136.1%
59,049
74,70826.5%
Retail integrated finance Corporate integrated finance Life & Health Property & Casualty Banking
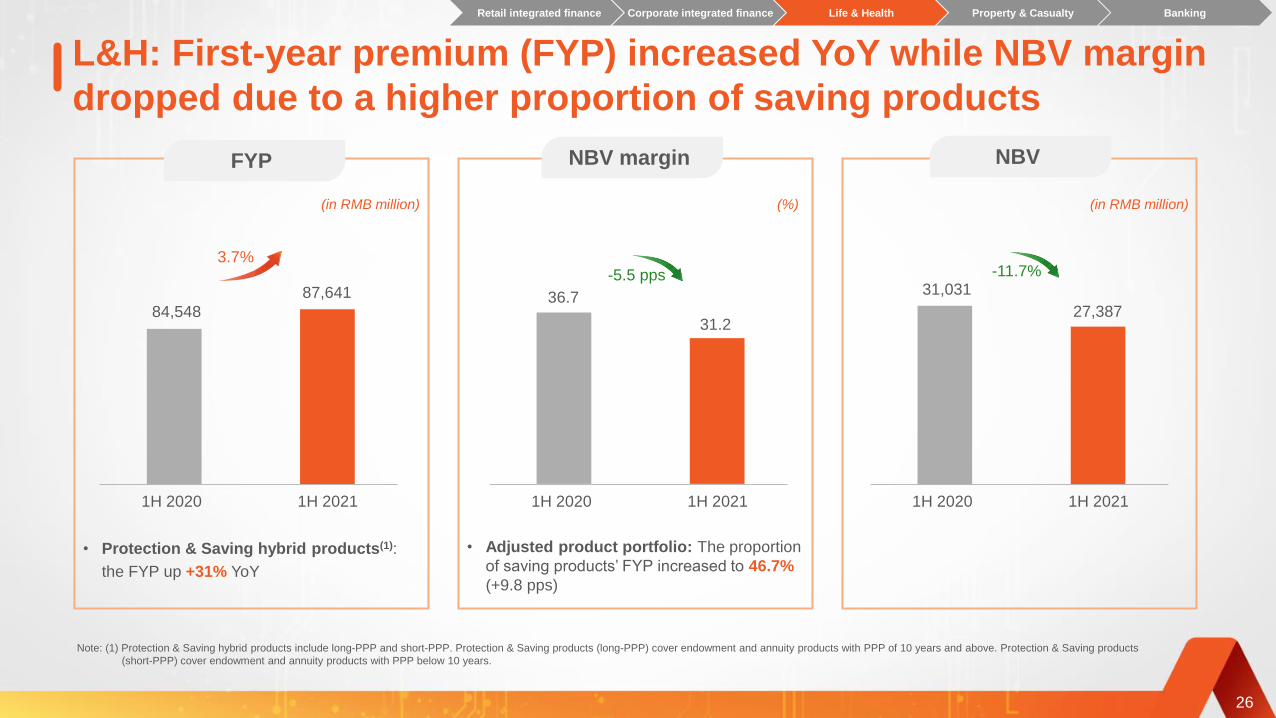
L&H: First-year premium (FYP) increased YoY while NBV margin
dropped due to a higher proportion of saving products
26
(in RMB million) (%)
FYP
(in RMB million)
NBV margin NBV
1H 2020 1H 2021
• Adjusted product portfolio: The proportion
of saving products’ FYP increased to 46.7%
(+9.8 pps)
• Protection & Saving hybrid products(1):
the FYP up +31% YoY
3.7%
84,548
87,641
1H 2020 1H 2021
36.7
31.2
-5.5 pps
1H 2020 1H 2021
31,031
27,387
-11.7%
Note: (1) Protection & Saving hybrid products include long-PPP and short-PPP. Protection & Saving products (long-PPP) cover endowment and annuity products with PPP of 10 years and above. Protection & Saving products
(short-PPP) cover endowment and annuity products with PPP below 10 years.
Retail integrated finance Corporate integrated finance Life & Health Property & Casualty Banking

L&H: developing high-quality teams with increasing productivity
and declining headcount
27
1H 2020 1H 2021
(in thousand) (RMB per agent per month)
Average number
of agents
1,108
FYP per agent Agent income
940
1H 2020 1H 2021
7,555
9,350
1H 2020 1H 2021
6,1895,889
-4.8%
• Market slowdown: sales agents in the market
decreased by over 20% YoY
• Improved mix: the Company retains high-
productivity agents to improve quality
-15.2%
End-of-
period
agents1,145,142 877,751
• High-productivity Diamond Agents: FYP per
Diamond Agent is over 5 times the average of all
agents
• Commission structure: indirect commission
dropped 20%+ YoY
• Auto insurance pricing reform: revenue from
cross-selling dropped 12% YoY
23.8%
5,127
1,062
4,954
935Cross-
selling
Ping An
Life’s
products
(RMB per agent per month)
Retail integrated finance Corporate integrated finance Life & Health Property & Casualty Banking
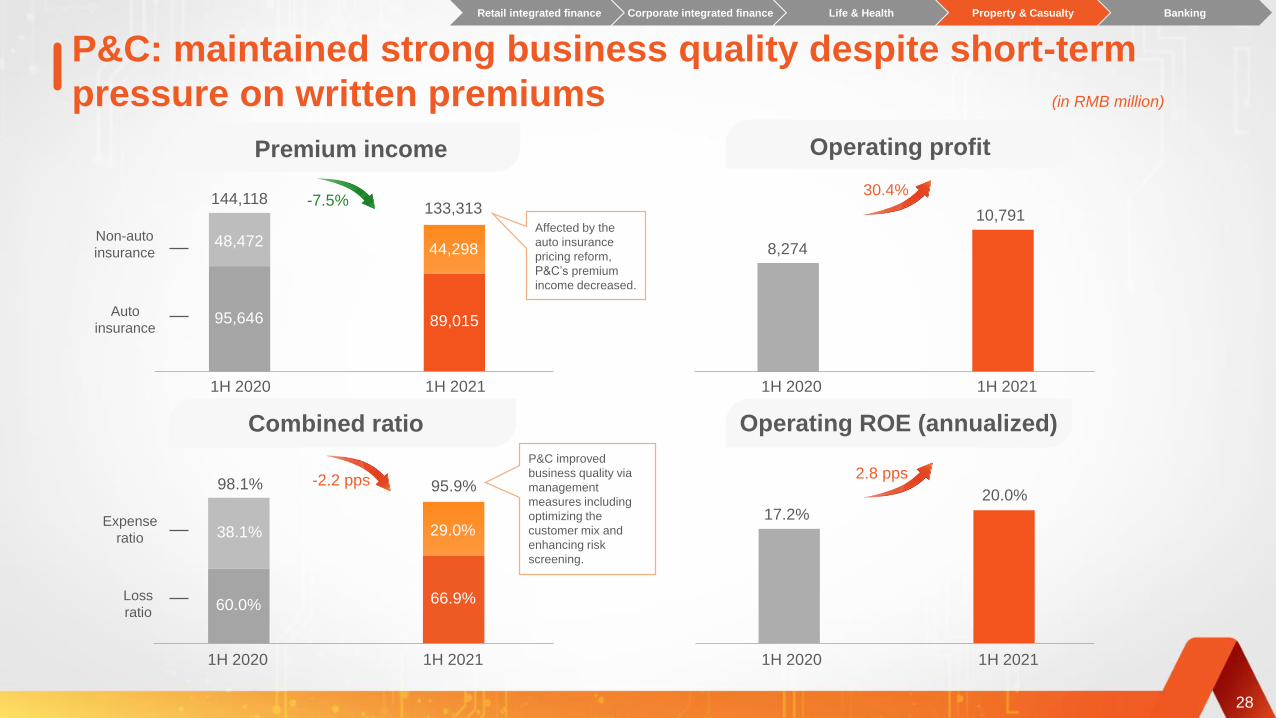
P&C: maintained strong business quality despite short-term
pressure on written premiums
Combined ratio
1H 2020 1H 2021
Premium income
144,118133,313
30.4%
95,646 89,015
48,47244,298
1H 2020 1H 2021
98.1% 95.9%
66.9%
38.1%
60.0%
29.0%
Operating profit
Operating ROE (annualized)
8,274
10,791
1H 2020 1H 2021
17.2%
20.0%
1H 2020 1H 2021
28
-2.2 pps
-7.5%
2.8 pps
(in RMB million)
Auto
insurance
Non-auto
insurance
Loss
ratio
Expense
ratio
Affected by the
auto insurance
pricing reform,
P&C’s premium
income decreased.
P&C improved
business quality via
management
measures including
optimizing the
customer mix and
enhancing risk
screening.
Retail integrated finance Corporate integrated finance Life & Health Property & Casualty Banking

P&C: combined ratio continued to improve
88.2%
125.6%
1H 2020 1H 2021
-37.4 pps
29
Combined ratio of
guarantee insuranceBreakdown of premium income
and combined ratio
89,015
8,508
4,795
(6.9)
24.0
14.8
97.4
91.8
92.1
2.7
4.1
(0.6)
Auto insurance
9,757 (52.3) 88.2 (37.4)Guarantee
insurance
11,118 38.3 99.5 6.2Liability insurance
Accidental injury
insurance
Corporate property &
casualty insurance
(in RMB million)
Premium income Combined ratio
AmountYoY change
(%)Ratio
(%)YoY change
(pps)
Retail integrated finance Corporate integrated finance Life & Health Property & Casualty Banking

30
84,68078,32867,829
1H 2019 1H 2020 1H 2021
15.5%8.1%
(in RMB million)
Steady revenue growth Surging net profit
Banking: revenue grew steadily and net profit increased
strongly on effective management of liabilities
Earnings grew as expectedYoY growth for 1H 2021 was 10 pps higher than that for 1Q 2021
2.22%2.42%2.69%
2.83%2.87%
1H 2020 1H 2021 1H 2019 1H 2020 1H 2021 Dec 31, 2020
Corporate
deposits
Retail
deposits
7.2%
Jun 30, 2021
2,132,592
734,086
2,866,678
1,988,449
684,669
2,673,118
7.2%
7.2%
Stable annualized net
interest margin
Average cost of liabilities
droppedDeposits grew significantly
Note: The revenue from credit card installment services was reclassified from fee and commission revenue to interest revenue in accordance with the Circular on Strictly Implementing the Accounting Standards for Business
Enterprises and Effectively Strengthening the Work on the 2020 Annual Reports of Enterprises (Cai Kuai [2021] No.2) jointly issued by the Ministry of Finance and related commissions of the PRC on February 5, 2021.
Corresponding financial indicators for the comparable period have been restated accordingly.
1Q 2020 1H 20211Q 2021 1H 2020
17,583
13,67818.5%
28.5%
8,54810,132
Retail integrated finance Corporate integrated finance Life & Health Property & Casualty Banking
31
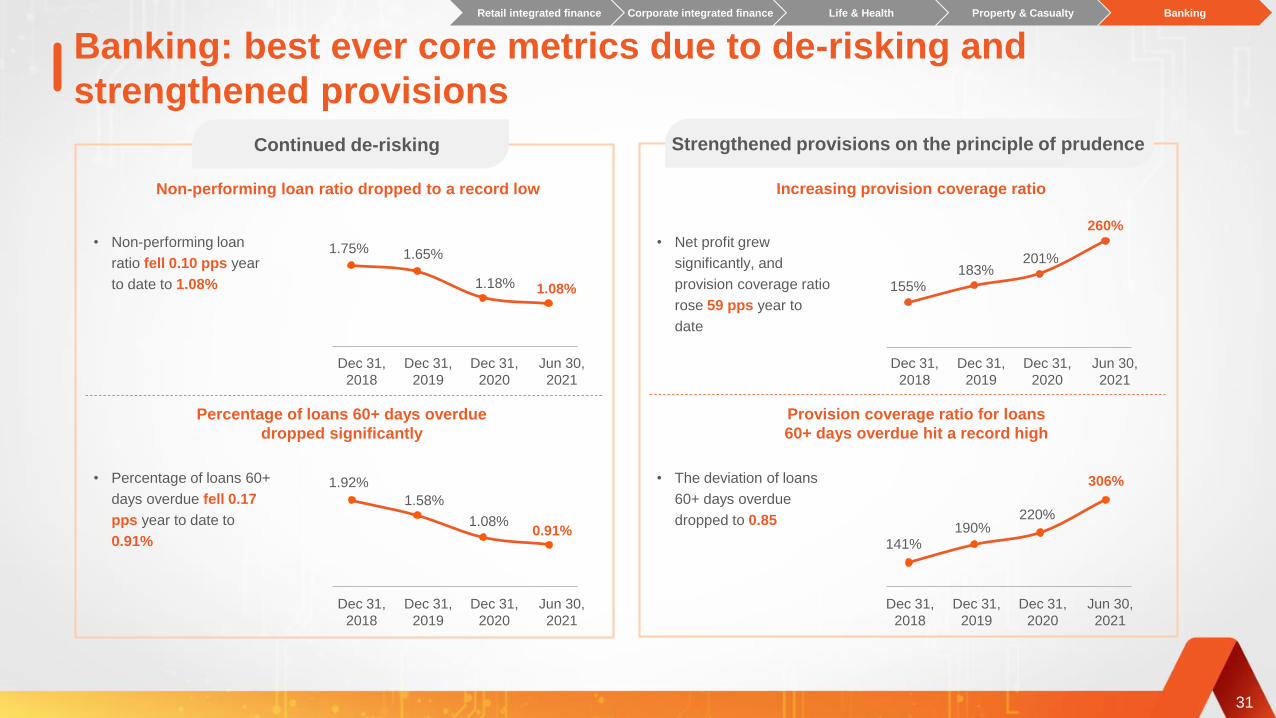
Banking: best ever core metrics due to de-risking and
strengthened provisions
Strengthened provisions on the principle of prudence
155%183%
260%
201%
141%190%
306%
220%
Continued de-risking
• Non-performing loan
ratio fell 0.10 pps year
to date to 1.08%
• Percentage of loans 60+
days overdue fell 0.17
pps year to date to
0.91%
1.92%
1.58%
0.91%1.08%
Percentage of loans 60+ days overdue
dropped significantly
1.75% 1.65%
1.08%1.18%
Dec 31,
2018
Dec 31,
2019
Dec 31,
2020
Jun 30,
2021
Non-performing loan ratio dropped to a record low
Dec 31,
2018
Dec 31,
2019
Dec 31,
2020
Jun 30,
2021
• Net profit grew
significantly, and
provision coverage ratio
rose 59 pps year to
date
Increasing provision coverage ratio
Dec 31,
2018
Dec 31,
2019
Dec 31,
2020
Jun 30,
2021
Dec 31,
2018
Dec 31,
2019
Dec 31,
2020
Jun 30,
2021
Provision coverage ratio for loans
60+ days overdue hit a record high
• The deviation of loans
60+ days overdue
dropped to 0.85
Retail integrated finance Corporate integrated finance Life & Health Property & Casualty Banking
32
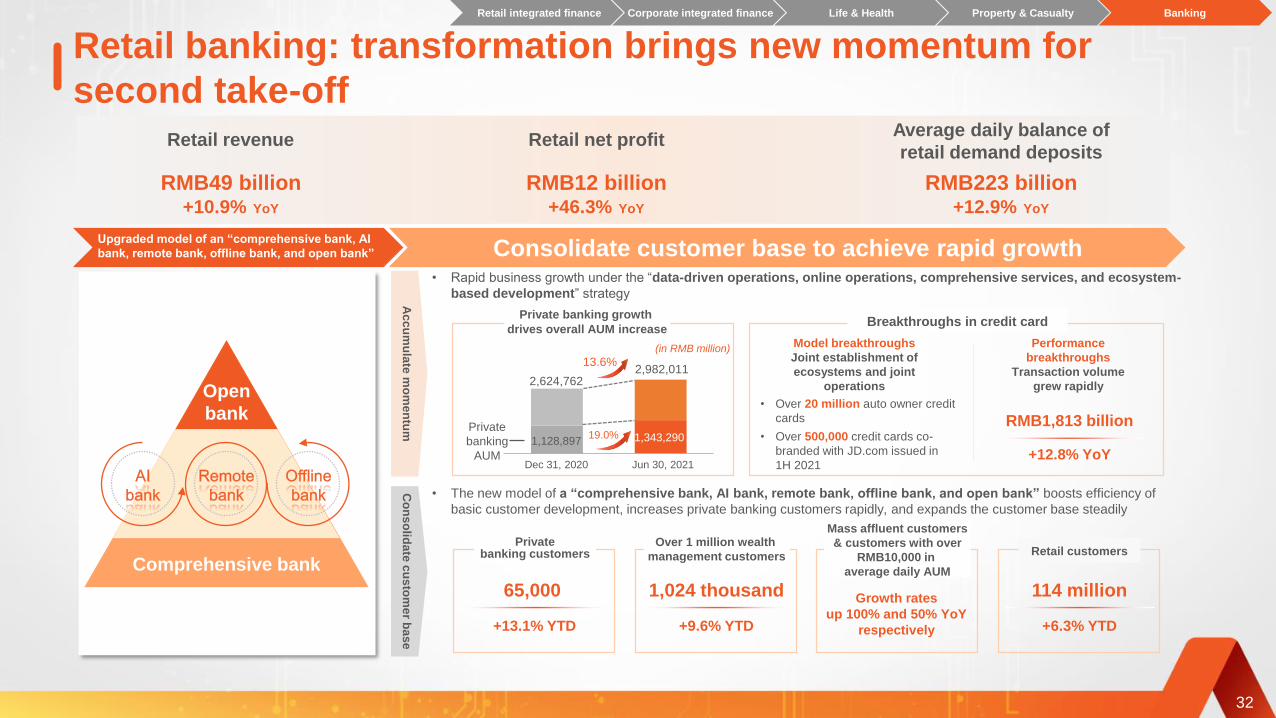
Retail banking: transformation brings new momentum for
second take-off
Consolidate customer base to achieve rapid growth
Ac
cu
mu
late
mo
me
ntu
m
• The new model of a “comprehensive bank, AI bank, remote bank, offline bank, and open bank” boosts efficiency of
basic customer development, increases private banking customers rapidly, and expands the customer base steadily
114 million
+6.3% YTD
Retail customers
Growth rates
up 100% and 50% YoY
respectively
Mass affluent customers
& customers with over
RMB10,000 in
average daily AUM
Over 1 million wealth
management customers
65,000
+13.1% YTD
Privatebanking customers
Co
ns
olid
ate
cu
sto
me
r ba
se
• Rapid business growth under the “data-driven operations, online operations, comprehensive services, and ecosystem-
based development” strategy
2,982,01113.6%
19.0%1,128,897 1,343,290
2,624,762
Dec 31, 2020 Jun 30, 2021
Private
banking
AUM
Private banking growth
drives overall AUM increaseBreakthroughs in credit card
(in RMB million)
• Over 20 million auto owner credit
cards
• Over 500,000 credit cards co-
branded with JD.com issued in
1H 2021
Model breakthroughs
Joint establishment of
ecosystems and joint
operations
Performance
breakthroughs
Transaction volume
grew rapidly
RMB1,813 billion
+12.8% YoY
1,024 thousand
+9.6% YTD
Comprehensive bank
Open
bank
RMB49 billion+10.9% YoY
Retail revenue
RMB12 billion+46.3% YoY
Retail net profit
RMB223 billion+12.9% YoY
Average daily balance of
retail demand deposits
Retail integrated finance Corporate integrated finance Life & Health Property & Casualty Banking
Upgraded model of an “comprehensive bank, AI
bank, remote bank, offline bank, and open bank”

33
(in RMB million)
Corporate banking: strong momentum under the “enhancement of
corporate banking” strategy
Dec 31, 2020
10.9% 477
Jun 30, 2021
430
(in thousand)
• Net increase in corporate customers up 250% YoY
Inclusive finance: “larger scale, wider
coverage, better quality, and lower cost”Corporate customer development
yielded results
Average daily balance
of corporate deposits
Corporate deposits: increased
balance and decreased cost
Average cost of
corporate deposits
New inclusive small
and micro-business
loans
Technology empowerment Cross-selling
• The “Nebula-IoT” platform has connected over 2.30 million
IoT devices, supporting financing of over RMB110 billion
• Leverage the open bank to enhance customer acquisition,
acquire customers through ecosystems and deepen customer
development on the Ping An Digital Pocket and the digital
treasury management platform
• Registered users of the Ping An Digital Pocket amounted
to 4.87 million, up 369% YTD
Duplicate the
success of retail
banking with two
trump cards
• Industry banking + investment banking + corporate cross-
selling generates significant synergies
• Sophisticated investment and financing reached RMB621.8
billion in 1H 2021, up 9.5% YoY. New investment and
financing projects implemented in partnership with other
member companies of the Group grew 22.1% YoY to
RMB286.9 billion. Average daily balance of corporate deposits
sourced through cross-selling grew 19.0% compared with that
for 2020 to RMB171.4 billion, of which demand deposits
accounted for 51.8%
Compared with
that for 2020 0.52 ppsYoY59%
Weighted average
interest rateLoans issued
Corporate customers
- 0.32 pps
1.97%2.29%
1H 2020 1H 2021 1H 2020 1H 2021
1,919,2482,026,734
5.6%
Retail integrated finance Corporate integrated finance Life & Health Property & Casualty Banking
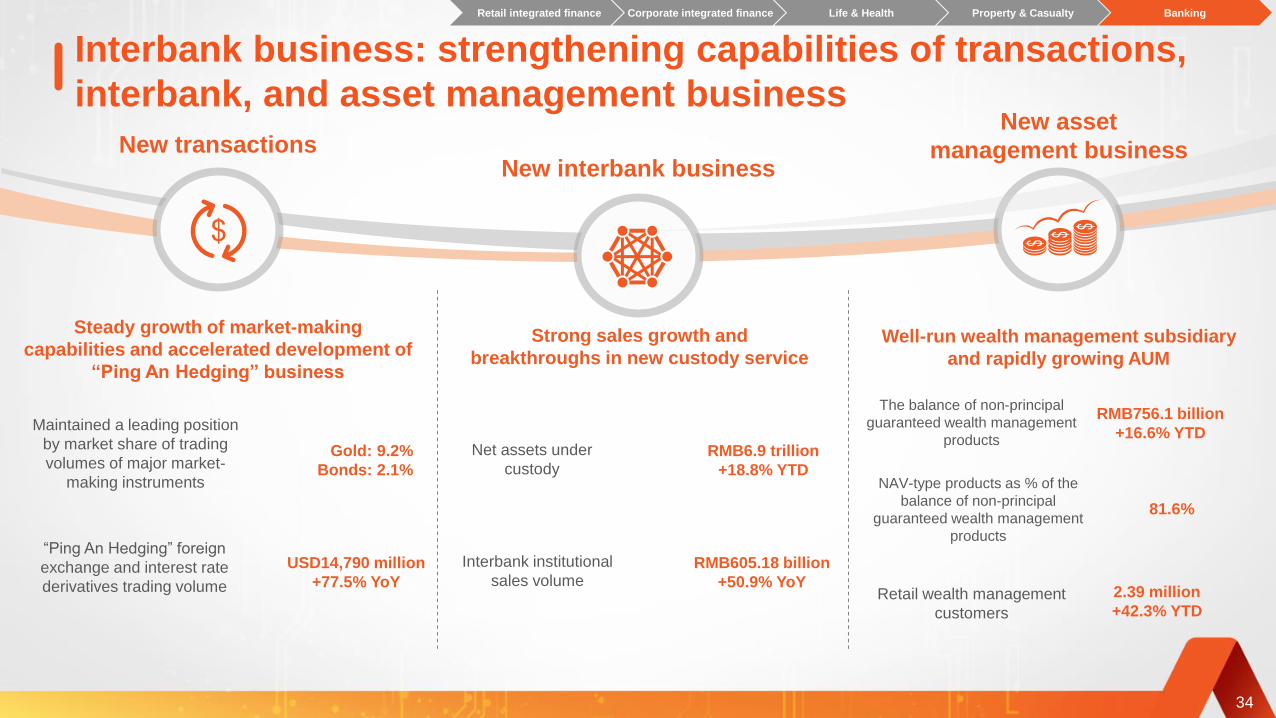
New transactionsNew interbank business
New asset
management business
RMB756.1 billion
+16.6% YTD
The balance of non-principal
guaranteed wealth management
products
NAV-type products as % of the
balance of non-principal
guaranteed wealth management
products
81.6%
34
RMB605.18 billion
+50.9% YoY
Interbank institutional
sales volumeUSD14,790 million
+77.5% YoY
“Ping An Hedging” foreign
exchange and interest rate
derivatives trading volume
Gold: 9.2%
Bonds: 2.1%
Maintained a leading position
by market share of trading
volumes of major market-
making instruments
Net assets under
custodyRMB6.9 trillion
+18.8% YTD
Interbank business: strengthening capabilities of transactions,
interbank, and asset management business
Steady growth of market-making
capabilities and accelerated development of
“Ping An Hedging” business
Strong sales growth and
breakthroughs in new custody serviceWell-run wealth management subsidiary
and rapidly growing AUM
Retail wealth management
customers
2.39 million
+42.3% YTD
Retail integrated finance Corporate integrated finance Life & Health Property & Casualty Banking

35
Life Reform Jessica Tan
Co-CEO
Performance Overview Integrated Finance Life Reform & Technology
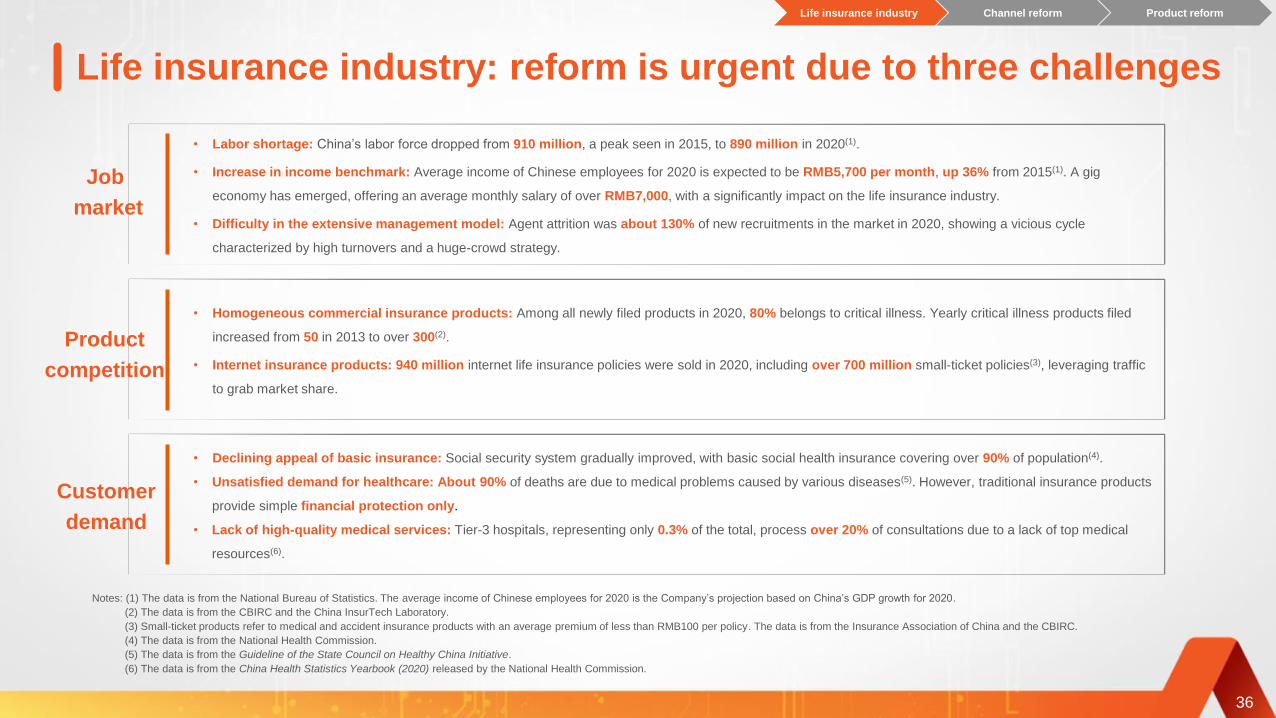
Life insurance industry: reform is urgent due to three challenges
• Labor shortage: China’s labor force dropped from 910 million, a peak seen in 2015, to 890 million in 2020(1).
• Increase in income benchmark: Average income of Chinese employees for 2020 is expected to be RMB5,700 per month, up 36% from 2015(1). A gig
economy has emerged, offering an average monthly salary of over RMB7,000, with a significantly impact on the life insurance industry.
• Difficulty in the extensive management model: Agent attrition was about 130% of new recruitments in the market in 2020, showing a vicious cycle
characterized by high turnovers and a huge-crowd strategy.
• Homogeneous commercial insurance products: Among all newly filed products in 2020, 80% belongs to critical illness. Yearly critical illness products filed
increased from 50 in 2013 to over 300(2).
• Internet insurance products: 940 million internet life insurance policies were sold in 2020, including over 700 million small-ticket policies(3), leveraging traffic
to grab market share.
• Declining appeal of basic insurance: Social security system gradually improved, with basic social health insurance covering over 90% of population(4).
• Unsatisfied demand for healthcare: About 90% of deaths are due to medical problems caused by various diseases(5). However, traditional insurance products
provide simple financial protection only.
• Lack of high-quality medical services: Tier-3 hospitals, representing only 0.3% of the total, process over 20% of consultations due to a lack of top medical
resources(6).
Notes: (1) The data is from the National Bureau of Statistics. The average income of Chinese employees for 2020 is the Company’s projection based on China’s GDP growth for 2020.
(2) The data is from the CBIRC and the China InsurTech Laboratory.
(3) Small-ticket products refer to medical and accident insurance products with an average premium of less than RMB100 per policy. The data is from the Insurance Association of China and the CBIRC.
(4) The data is from the National Health Commission.
(5) The data is from the Guideline of the State Council on Healthy China Initiative.
(6) The data is from the China Health Statistics Yearbook (2020) released by the National Health Commission.
Product
competition
Customer
demand
Job
market
36
Life insurance industry Channel reform Product reform

Life industry: Great growth potential, agent remains the key
distribution channel
Disposable income per capita per annum in China(1)
2015 2020
22
32
CAGR
7.9%
Notes: (1) The data is from the National Bureau of Statistics.
(2) The data is from the National Health Commission and the World Bank. Asian developed countries and regions include Singapore, Taiwan China, Hong Kong China.
(3) The data is from the CBIRC. Main customers’ ages are between 26 to 45. Developed countries include the United States, Britain and Canada.
37
Total health expenditure per capita in China(2)
2015 2020
2,952
5,146
CAGR
12%
• Per capita total healthcare expenditure was about 1/3
of that in Asian developed countries and regions for
2015-2019
Disposable income per
capita grew steadily
Total health expenditure per capita well
below that in Asian developed markets
(in RMB thousand) (in RMB )
Underpenetrated market and reliance of
long-term protection sales on agents
< 40%
Main customers
remained
underpenetrated by
protection products
35%Extremely low in China
vs. developed countries
China Developed countries
2%
Protection penetration of main customers (3)
Pension % of total life insurance premium (3)
For many long-term protection products, an agent needs
to interact with a customer before a deal is struck.
Multiple times
Life insurance industry Channel reform Product reform
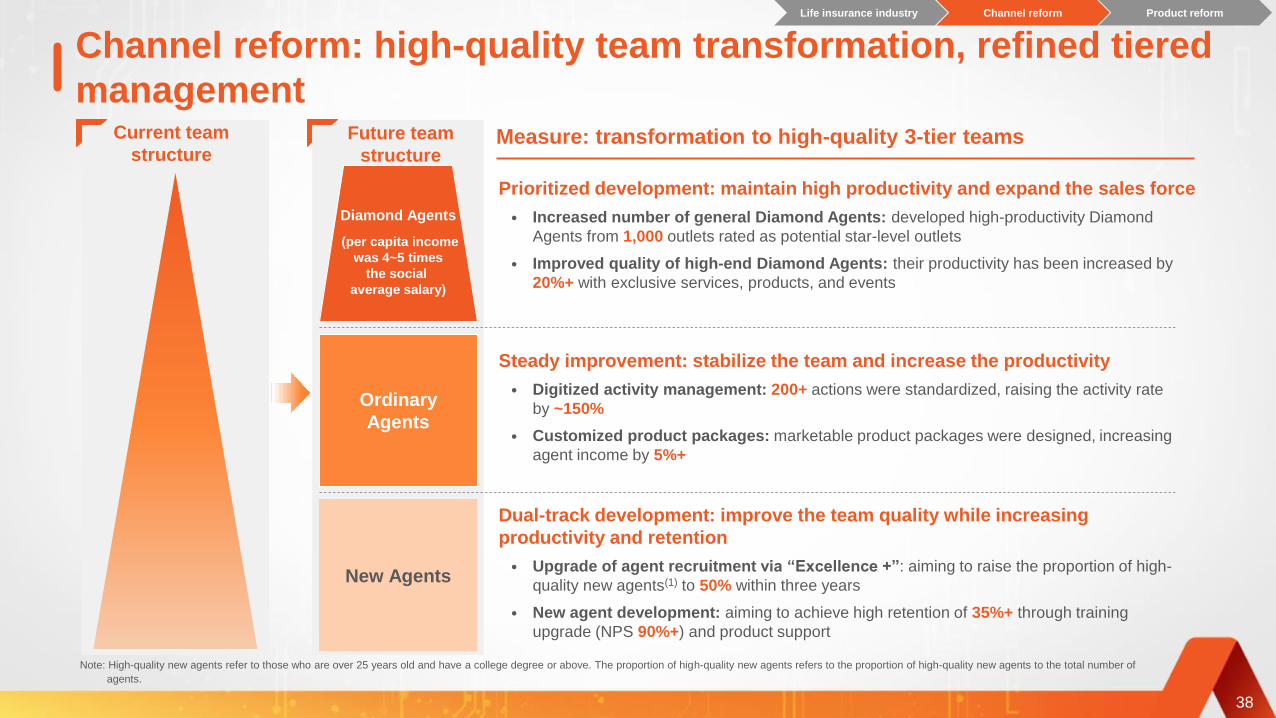
Channel reform: high-quality team transformation, refined tiered
managementMeasure: transformation to high-quality 3-tier teams
Ordinary
Agents
Diamond Agents
(per capita income
was 4~5 times
the social
average salary)
New Agents
Current team
structureFuture team
structure
38
Note: High-quality new agents refer to those who are over 25 years old and have a college degree or above. The proportion of high-quality new agents refers to the proportion of high-quality new agents to the total number of
agents.
Prioritized development: maintain high productivity and expand the sales force
• Increased number of general Diamond Agents: developed high-productivity Diamond
Agents from 1,000 outlets rated as potential star-level outlets
• Improved quality of high-end Diamond Agents: their productivity has been increased by
20%+ with exclusive services, products, and events
Steady improvement: stabilize the team and increase the productivity
• Digitized activity management: 200+ actions were standardized, raising the activity rate
by ~150%
• Customized product packages: marketable product packages were designed, increasing
agent income by 5%+
Dual-track development: improve the team quality while increasing
productivity and retention
• Upgrade of agent recruitment via “Excellence +”: aiming to raise the proportion of high-
quality new agents(1) to 50% within three years
• New agent development: aiming to achieve high retention of 35%+ through training
upgrade (NPS 90%+) and product support
Life insurance industry Channel reform Product reform

Channel reform: Stronger performance driven by pilot digital
channel reformStronger performance driven by improved
behaviors and quality
Customer visits
increased ~150% compared with the
control group
Long-term
insurance policies
sold per capita
increased ~140%compared with the
control group
Better behaviors
Better quality
Tool example: activity dashboard
A digital
dashboard
manages 30+
metrics on
behavior, quality,
and performance
Tool example: customer center
200+ customer
development
processes were
reshaped for
refined
management
FYP per outlet increased 6% FYP per retained agent
increased nearly 30%
(RMB per month)
+6%
Some of the pioneering outlets in the pilot projects have seen stronger
performance
+30%
Before pilot reform Recent 3 months Before pilot reform Recent 3 months
39
(RMB per month)
Note: Recent 3 months indicate the recent 3 months as of Jun 30, 2021.
Life insurance industry Channel reform Product reform
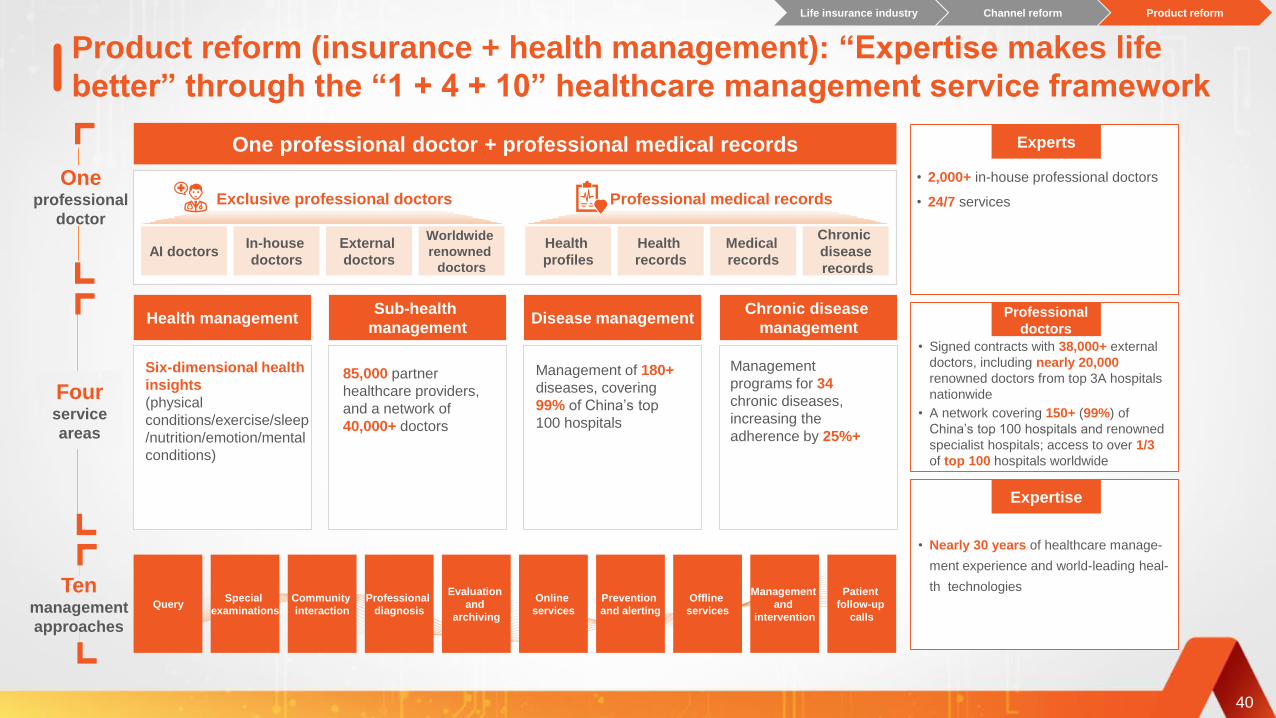
Product reform (insurance + health management): “Expertise makes life
better” through the “1 + 4 + 10” healthcare management service framework
Oneprofessional
doctor
Tenmanagement
approaches
Fourservice
areas
One professional doctor + professional medical records
40
Exclusive professional doctors Professional medical records
AI doctorsWorldwide
renowned
doctors
Chronic
disease
records
Medical
records
Health
profiles
Health
records
QueryCommunity
interaction
Evaluation
and
archiving
Prevention
and alerting
Management
and
intervention
Special
examinations
Professional
diagnosis
Online
services
Offline
services
Patient
follow-up
calls
Health management
Six-dimensional health
insights
(physical
conditions/exercise/sleep
/nutrition/emotion/mental
conditions)
Sub-health
management
85,000 partner
healthcare providers,
and a network of
40,000+ doctors
Chronic disease
management
Management
programs for 34
chronic diseases,
increasing the
adherence by 25%+
Disease management
Management of 180+
diseases, covering
99% of China’s top
100 hospitals
Experts
Expertise
• 2,000+ in-house professional doctors
• 24/7 services
• Signed contracts with 38,000+ external
doctors, including nearly 20,000
renowned doctors from top 3A hospitals
nationwide
• A network covering 150+ (99%) of
China’s top 100 hospitals and renowned
specialist hospitals; access to over 1/3
of top 100 hospitals worldwide
• Nearly 30 years of healthcare manage-
ment experience and world-leading heal-
th technologies
External
doctors
In-house
doctors
Professional
doctors
Life insurance industry Channel reform Product reform
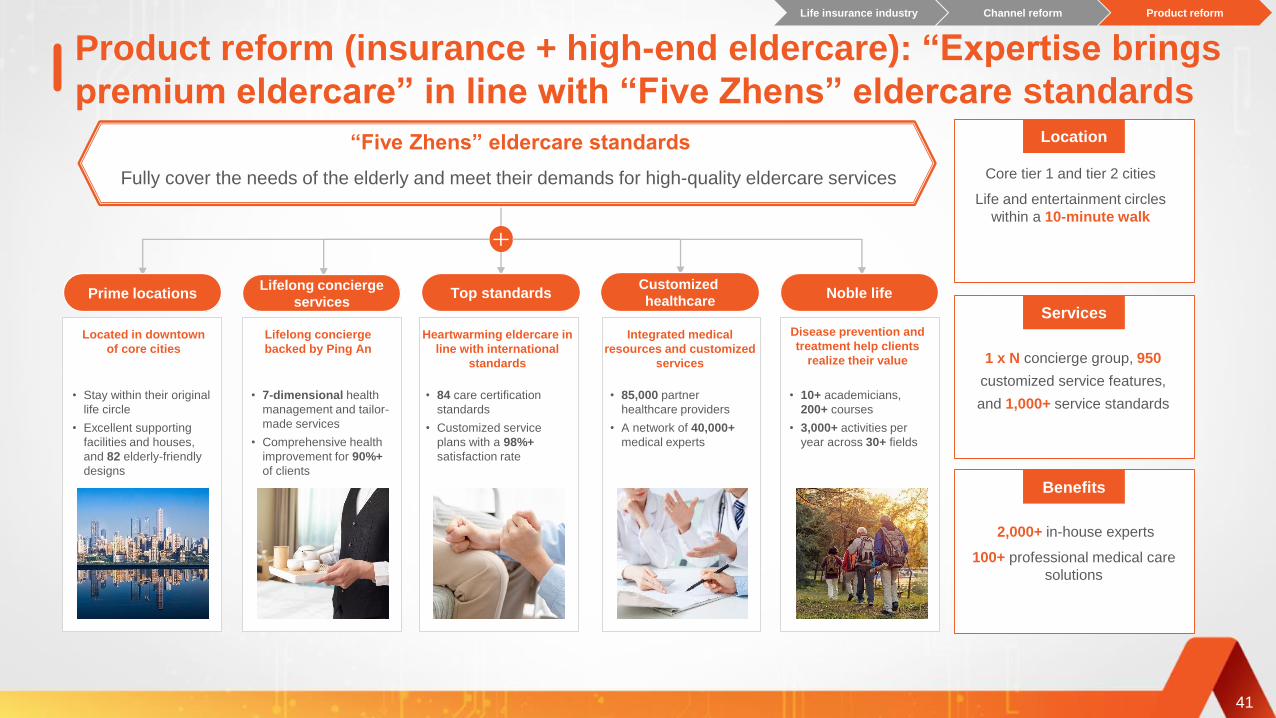
Product reform (insurance + high-end eldercare): “Expertise brings
premium eldercare” in line with “Five Zhens” eldercare standards
41
Fully cover the needs of the elderly and meet their demands for high-quality eldercare services
“Five Zhens” eldercare standards Location
Services
Benefits
Core tier 1 and tier 2 cities
Life and entertainment circles
within a 10-minute walk
1 x N concierge group, 950
customized service features,
and 1,000+ service standards
2,000+ in-house experts
100+ professional medical care
solutions
Prime locationsLifelong concierge
servicesTop standards
Customized
healthcareNoble life
• Stay within their original
life circle
• Excellent supporting
facilities and houses,
and 82 elderly-friendly
designs
Located in downtown
of core cities
• 7-dimensional health
management and tailor-
made services
• Comprehensive health
improvement for 90%+
of clients
Lifelong concierge
backed by Ping An
• 84 care certification
standards
• Customized service
plans with a 98%+
satisfaction rate
Heartwarming eldercare in
line with international
standards
• 85,000 partner
healthcare providers
• A network of 40,000+
medical experts
Integrated medical
resources and customized
services
• 10+ academicians,
200+ courses
• 3,000+ activities per
year across 30+ fields
Disease prevention and
treatment help clients
realize their value
Life insurance industry Channel reform Product reform

1.4 x 1.4 x
1.8
2.5
3.7 x
12.8%
3.5%
55
79
Proportion of Ping An Life’s new customers sourced
via healthcare services each year
Customer acquisition: each year 20%+ of Ping An Life’s
new customers are sourced via healthcare services
Customer stickiness enhancement: customers using healthcare products and
services bring higher value to Ping An Life
Product reform: Healthcare services bring customers to Ping An
Life and increase customer stickiness
42
2018 2019 2020 1H 2021
18%20%
21%
26%
Customers not
using healthcare
services
Customers using
healthcare
services
(Policy) (in RMB thousand)
Ping An Life’s policies
held per customer
Premium of Ping An Life’s
policies held per customerUpselling rate
Customers not
using healthcare
services
Customers using
healthcare
services
Customers not
using online
consultation
Customers
using online
consultation
Life insurance industry Channel reform Product reform

43
TechnologyJessica Tan
Co-CEO
Performance Overview Integrated Finance Life Reform & Technology
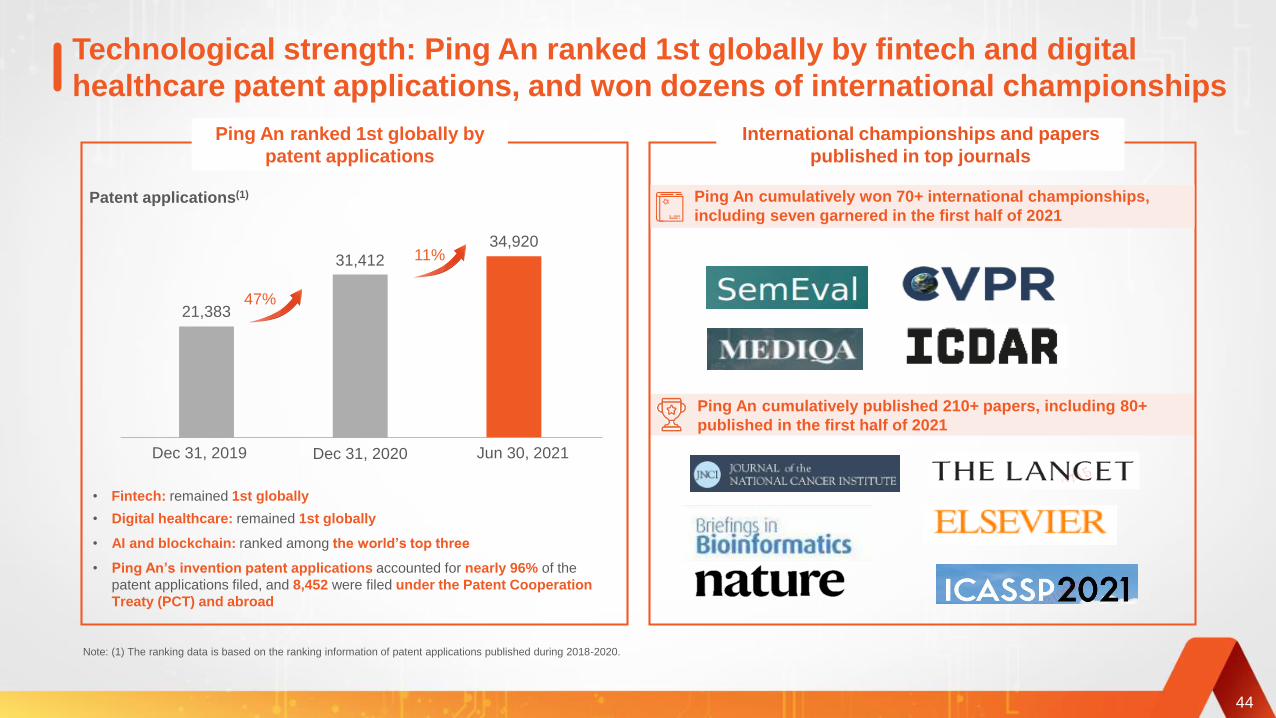
Technological strength: Ping An ranked 1st globally by fintech and digital
healthcare patent applications, and won dozens of international championships
44
Ping An ranked 1st globally by
patent applications
Patent applications(1)
31,412
21,383
34,920
Dec 31, 2020 Jun 30, 2021Dec 31, 2019
47%
11%
International championships and papers
published in top journals
• Fintech: remained 1st globally
• Digital healthcare: remained 1st globally
• AI and blockchain: ranked among the world’s top three
• Ping An’s invention patent applications accounted for nearly 96% of the
patent applications filed, and 8,452 were filed under the Patent Cooperation
Treaty (PCT) and abroad
Note: (1) The ranking data is based on the ranking information of patent applications published during 2018-2020.
Ping An cumulatively published 210+ papers, including 80+
published in the first half of 2021
Ping An cumulatively won 70+ international championships,
including seven garnered in the first half of 2021
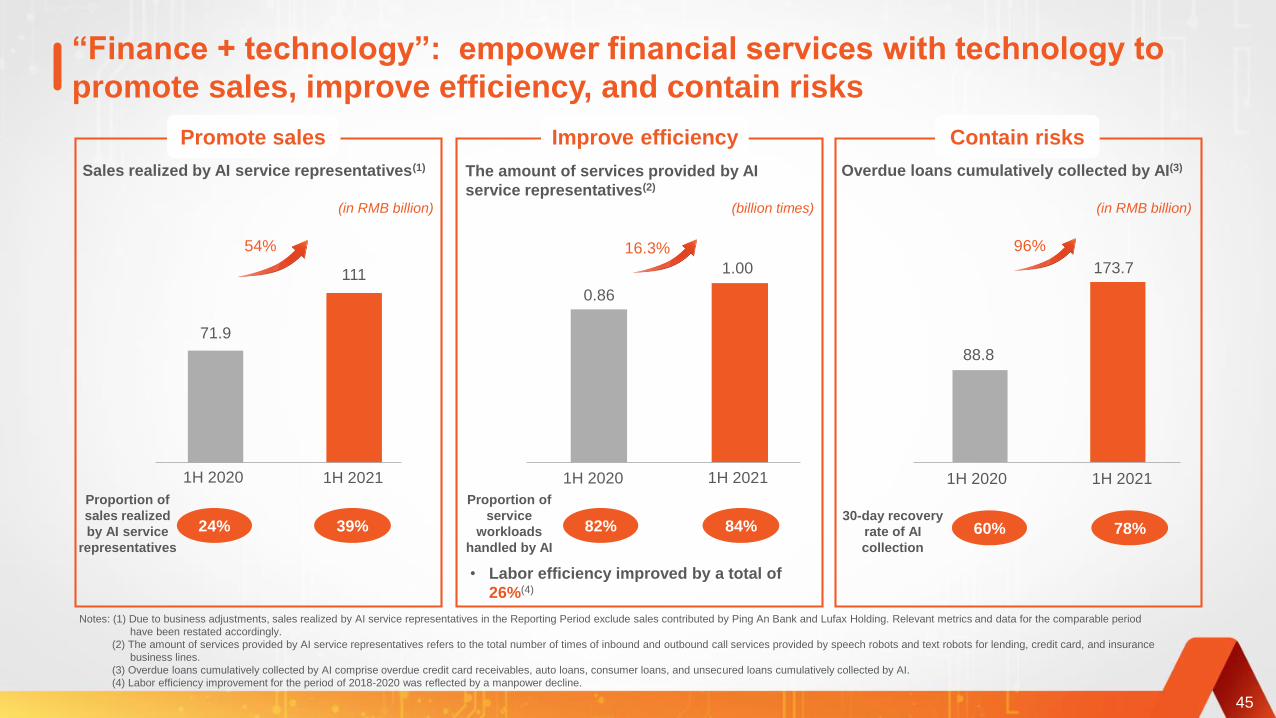
“Finance + technology”: empower financial services with technology to
promote sales, improve efficiency, and contain risks
88.8
173.7
71.9
111
0.86
1.00
54% 16.3%
1H 2020 1H 2021 1H 2020 1H 2021 1H 2020 1H 2021
96%
24% 39% 82% 84% 60% 78%
45
Promote sales Improve efficiency Contain risks
The amount of services provided by AI
service representatives(2)
Sales realized by AI service representatives(1) Overdue loans cumulatively collected by AI(3)
(in RMB billion) (billion times) (in RMB billion)
Proportion of
sales realized
by AI service
representatives
• Labor efficiency improved by a total of
26%(4)
Proportion of
service
workloads
handled by AI
30-day recovery
rate of AI
collection
Notes: (1) Due to business adjustments, sales realized by AI service representatives in the Reporting Period exclude sales contributed by Ping An Bank and Lufax Holding. Relevant metrics and data for the comparable period
have been restated accordingly.
(2) The amount of services provided by AI service representatives refers to the total number of times of inbound and outbound call services provided by speech robots and text robots for lending, credit card, and insurance
business lines.
(3) Overdue loans cumulatively collected by AI comprise overdue credit card receivables, auto loans, consumer loans, and unsecured loans cumulatively collected by AI.
(4) Labor efficiency improvement for the period of 2018-2020 was reflected by a manpower decline.
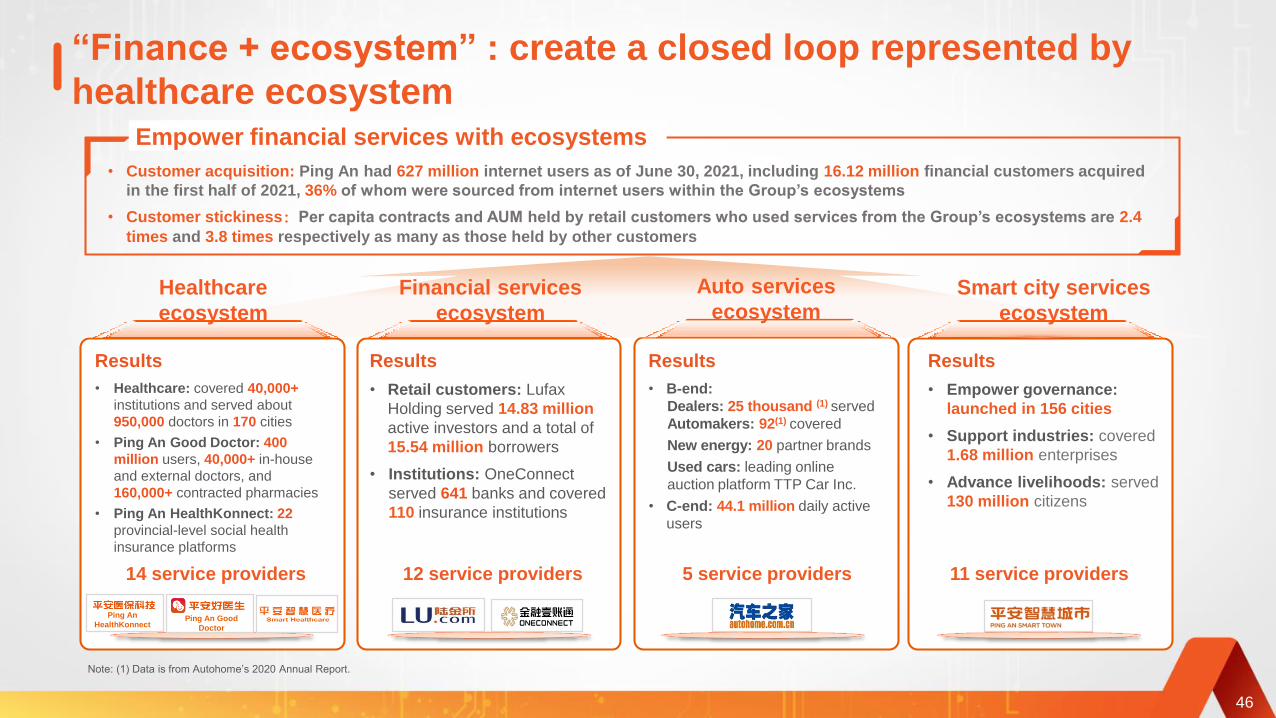
“Finance + ecosystem” : create a closed loop represented by
healthcare ecosystem
• Customer acquisition: Ping An had 627 million internet users as of June 30, 2021, including 16.12 million financial customers acquired
in the first half of 2021, 36% of whom were sourced from internet users within the Group’s ecosystems
• Customer stickiness:Per capita contracts and AUM held by retail customers who used services from the Group’s ecosystems are 2.4
times and 3.8 times respectively as many as those held by other customers
Empower financial services with ecosystems
Auto services
ecosystemHealthcare
ecosystem
Financial services
ecosystem
Smart city services
ecosystem
Results
• Healthcare: covered 40,000+
institutions and served about
950,000 doctors in 170 cities
• Ping An Good Doctor: 400
million users, 40,000+ in-house
and external doctors, and
160,000+ contracted pharmacies
• Ping An HealthKonnect: 22
provincial-level social health
insurance platforms
Results
• Retail customers: Lufax
Holding served 14.83 million
active investors and a total of
15.54 million borrowers
• Institutions: OneConnect
served 641 banks and covered
110 insurance institutions
Results
• B-end:
Dealers: 25 thousand (1) served
Automakers: 92(1) covered
New energy: 20 partner brands
Used cars: leading online
auction platform TTP Car Inc.
• C-end: 44.1 million daily active
users
Results
• Empower governance:
launched in 156 cities
• Support industries: covered
1.68 million enterprises
• Advance livelihoods: served
130 million citizens
12 service providers 5 service providers 11 service providers14 service providers
46
Ping An
HealthKonnect Ping An Good
Doctor
Note: (1) Data is from Autohome’s 2020 Annual Report.
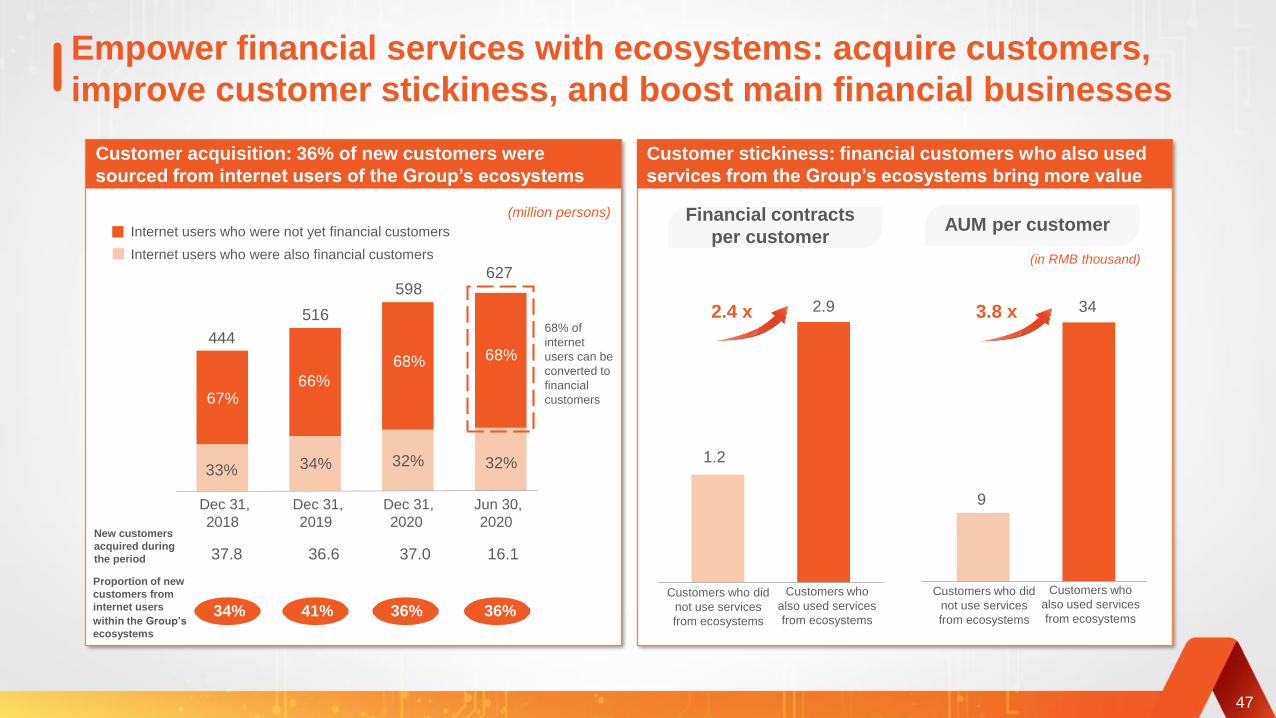
Empower financial services with ecosystems: acquire customers,
improve customer stickiness, and boost main financial businesses
Customer stickiness: financial customers who also used
services from the Group’s ecosystems bring more value
Dec 31,
2018
Dec 31,
2019
Dec 31,
2020
2.4 x 3.8 x
Financial contracts
per customerAUM per customer
34
9
1.2
2.9
Customer acquisition: 36% of new customers were
sourced from internet users of the Group’s ecosystems
34%
598
41% 36%
37.8 36.6 37.0
516
444
Jun 30,
2020
36%
627
16.1
67%66%
68% 68%
33% 34% 32% 32%
47
(million persons)
Internet users who were not yet financial customers
Internet users who were also financial customers
68% of
internet
users can be
converted to
financial
customers
Proportion of new
customers from
internet users
within the Group’s
ecosystems
New customers
acquired during
the period
(in RMB thousand)
Customers who did
not use services
from ecosystems
Customers who
also used services
from ecosystems
Customers who did
not use services
from ecosystems
Customers who
also used services
from ecosystems
68 financial
institution partners
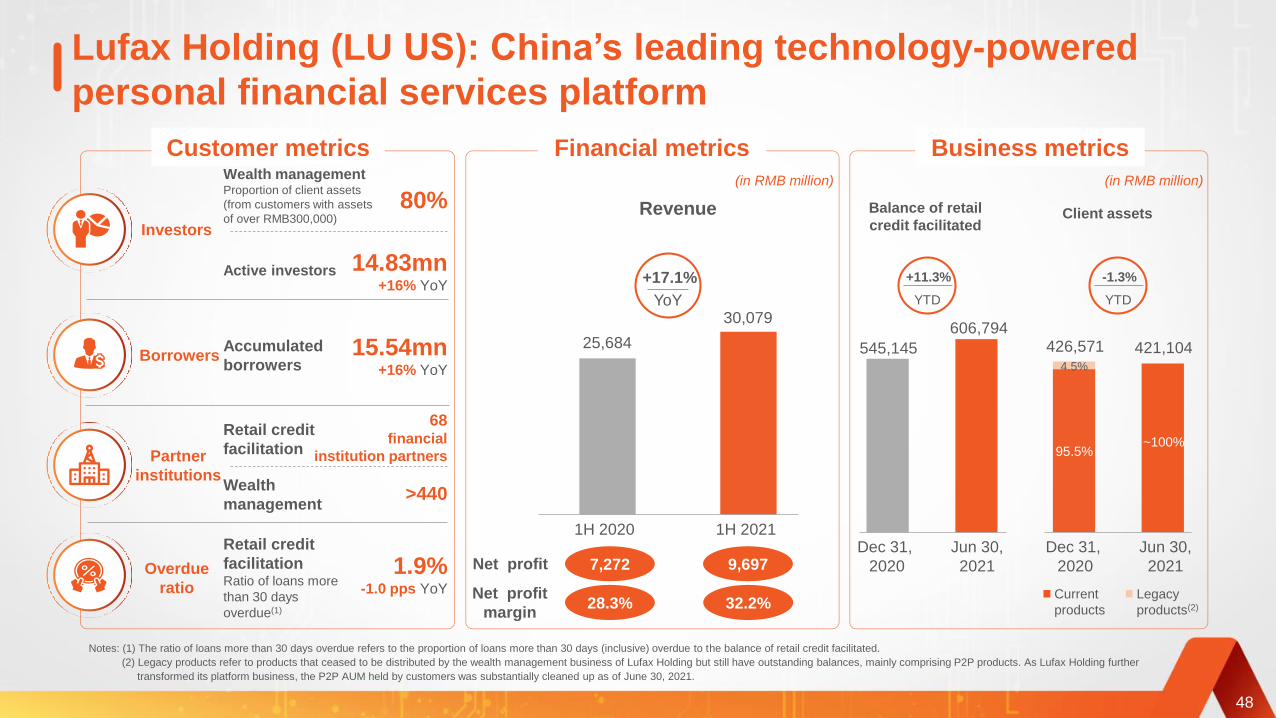
Lufax Holding (LU US): China’s leading technology-powered
personal financial services platform
48
Investors
Partner
institutions
Overdue
ratio
Borrowers
1.9%-1.0 pps YoY
80%
+17.1%
YoY
1H 2020 1H 2021
25,684
30,079
Customer metrics Financial metrics Business metrics
28.3% 32.2%
Dec 31,
2020
Jun 30,
2021
+11.3%
YTD
545,145
606,794426,571 421,104
-1.3%
YTD
Dec 31,
2020
Jun 30,
2021
95.5%
4.5%
(in RMB million)(in RMB million)Wealth managementProportion of client assets
(from customers with assets
of over RMB300,000)
Active investors 14.83mn+16% YoY
Accumulated
borrowers15.54mn
+16% YoY
Wealth
management
Retail credit
facilitation
>440
Retail credit
facilitationRatio of loans more
than 30 days
overdue(1)
Notes: (1) The ratio of loans more than 30 days overdue refers to the proportion of loans more than 30 days (inclusive) overdue to the balance of retail credit facilitated.
(2) Legacy products refer to products that ceased to be distributed by the wealth management business of Lufax Holding but still have outstanding balances, mainly comprising P2P products. As Lufax Holding further
transformed its platform business, the P2P AUM held by customers was substantially cleaned up as of June 30, 2021.
Net profit
margin
Revenue Balance of retail
credit facilitatedClient assets
Current
products
Legacy
products(2)
Net profit 7,272 9,697
~100%
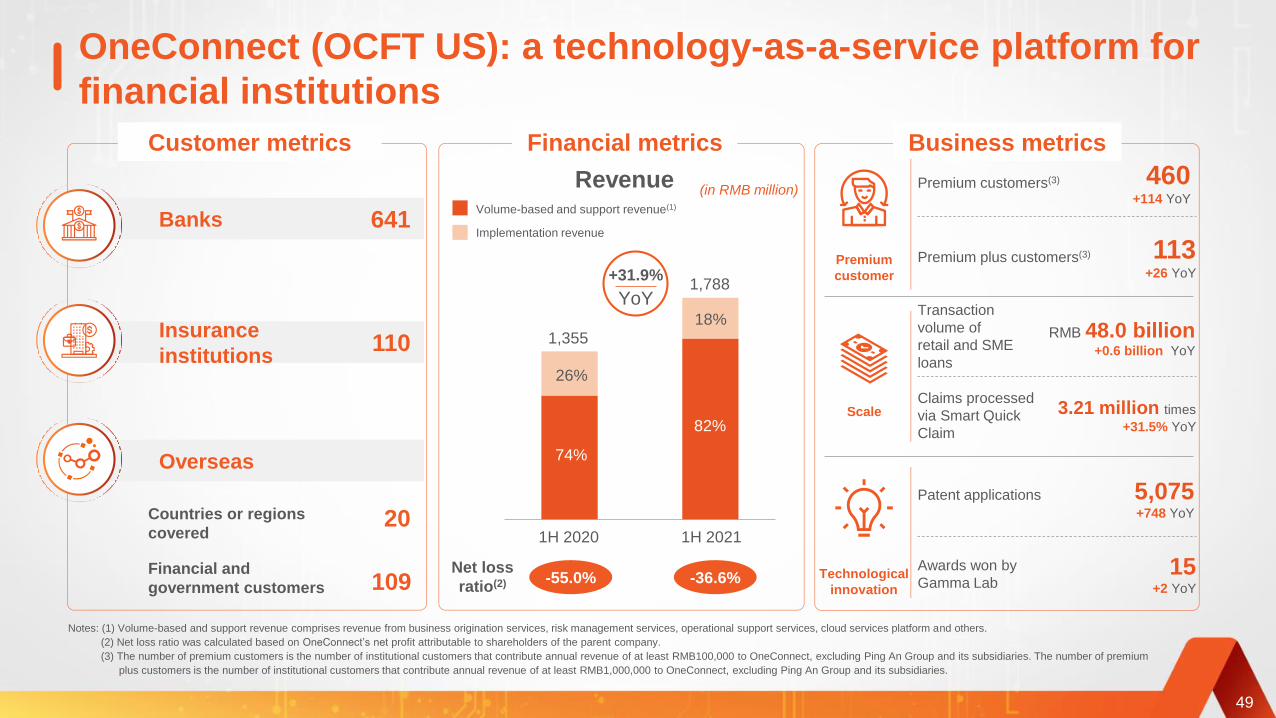
OneConnect (OCFT US): a technology-as-a-service platform for
financial institutions
Overseas
Banks
Insurance
institutions
Revenue
641
110
1H 2020 1H 2021
+31.9%
YoY
20
109 -55.0% -36.6%
82%
74%
1,788
1,355
26%
18%
Volume-based and support revenue(1)
Customer metrics Financial metrics
Countries or regions
covered
Financial and
government customers
Notes: (1) Volume-based and support revenue comprises revenue from business origination services, risk management services, operational support services, cloud services platform and others.
(2) Net loss ratio was calculated based on OneConnect’s net profit attributable to shareholders of the parent company.
(3) The number of premium customers is the number of institutional customers that contribute annual revenue of at least RMB100,000 to OneConnect, excluding Ping An Group and its subsidiaries. The number of premium
plus customers is the number of institutional customers that contribute annual revenue of at least RMB1,000,000 to OneConnect, excluding Ping An Group and its subsidiaries.
(in RMB million)
Net loss
ratio(2)
Implementation revenue
49
Technological
innovation
Scale
Premium
customer
Transaction
volume of
retail and SME
loans
RMB 48.0 billion+0.6 billion YoY
Claims processed
via Smart Quick
Claim
3.21 million times
+31.5% YoY
Awards won by
Gamma Lab15
+2 YoY
Patent applications 5,075+748 YoY
Business metrics
Premium customers(3) 460+114 YoY
Premium plus customers(3) 113+26 YoY
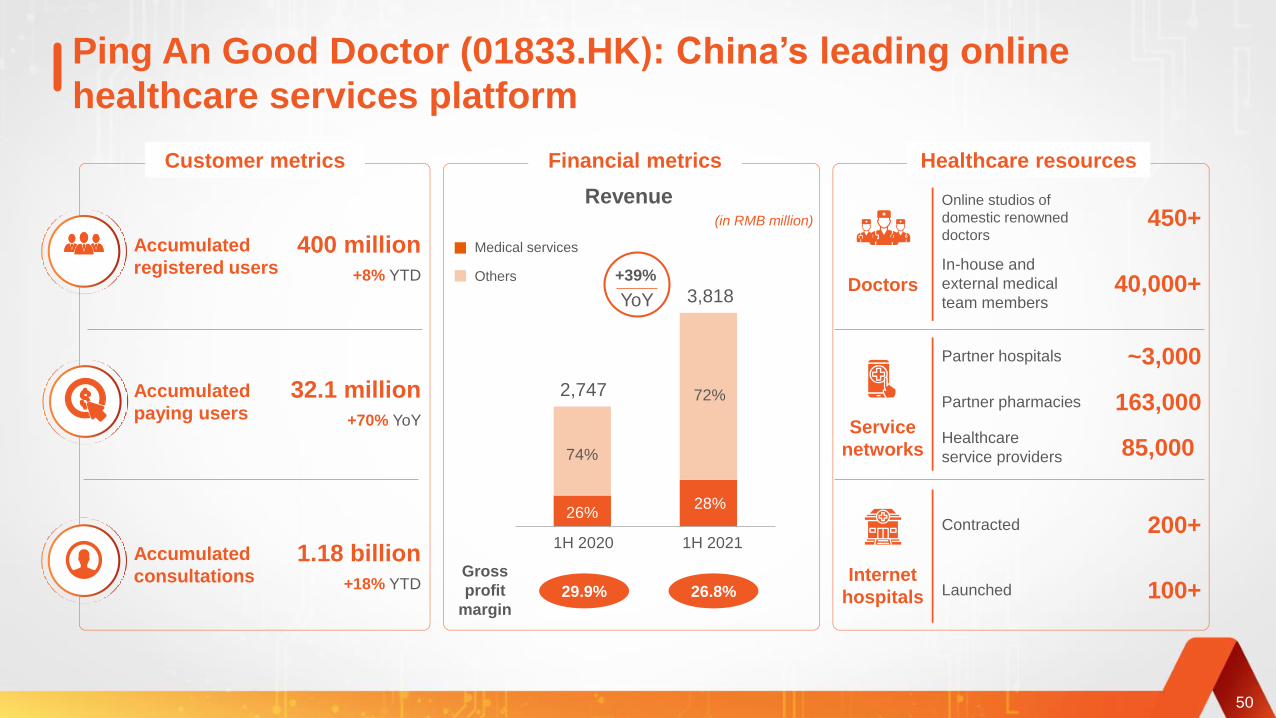
Ping An Good Doctor (01833.HK): China’s leading online
healthcare services platform
1H 2020 1H 2021
Doctors
Service
networks
29.9% 26.8%Internet
hospitals
2,747
3,818
26%
+39%
YoY
Medical services
Others
74%
72%
28%
50
400 million+8% YTD
Accumulated
registered users
Customer metrics Financial metrics Healthcare resources
32.1 million+70% YoY
Accumulated
paying users
Gross
profit
margin
1.18 billion+18% YTD
Accumulated
consultations
(in RMB million)
Revenue
In-house and
external medical
team members40,000+
Online studios of
domestic renowned
doctors450+
Healthcare
service providers 85,000
Partner hospitals ~3,000
Partner pharmacies 163,000
Launched 100+
Contracted 200+
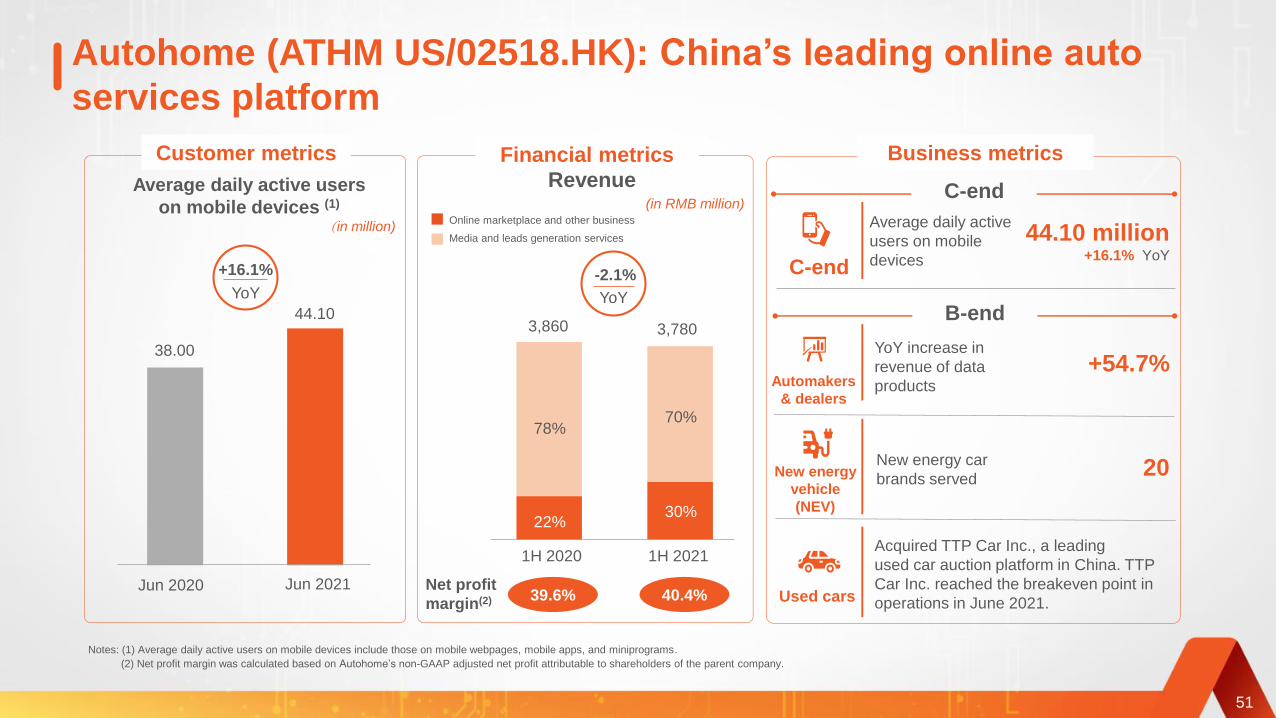
Autohome (ATHM US/02518.HK): China’s leading online auto
services platform
Automakers
& dealers
+54.7%
20
Used cars
New energy
vehicle
(NEV)
C-end
C-end
B-end
Jun 2021
Average daily active users
on mobile devices (1)
+16.1%
YoY
44.10
38.00
-2.1%
YoY
1H 2020 1H 2021
3,860 3,780
39.6% 40.4%
78%
Media and leads generation services
Online marketplace and other business
70%
22%30%
Jun 2020
51
Customer metrics Business metricsFinancial metrics
(in million)
Revenue(in RMB million)
Net profit
margin(2)
Notes: (1) Average daily active users on mobile devices include those on mobile webpages, mobile apps, and miniprograms.
(2) Net profit margin was calculated based on Autohome’s non-GAAP adjusted net profit attributable to shareholders of the parent company.
Average daily active
users on mobile
devices
44.10 million+16.1% YoY
YoY increase in
revenue of data
products
New energy car
brands served
Acquired TTP Car Inc., a leading
used car auction platform in China. TTP
Car Inc. reached the breakeven point in
operations in June 2021.
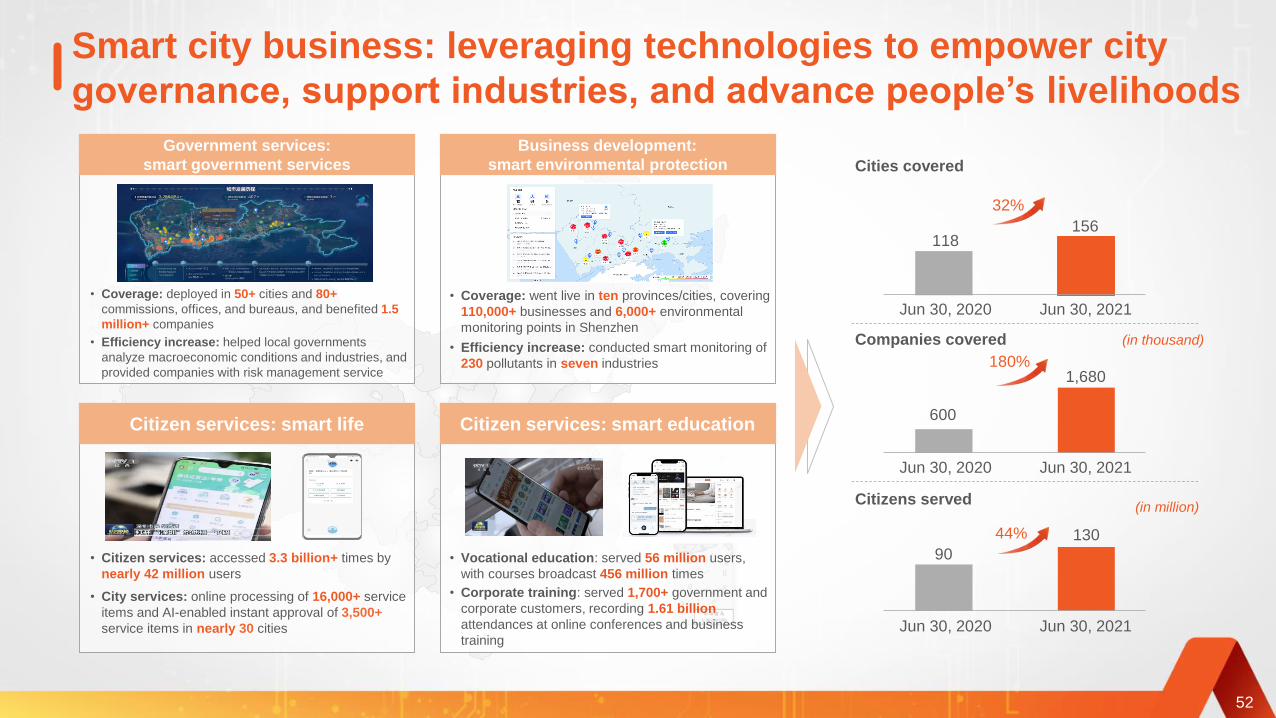
1:96 000 000
南海诸岛
Smart city business: leveraging technologies to empower city
governance, support industries, and advance people’s livelihoods
Cities covered
Jun 30, 2021Jun 30, 2020
118156
Jun 30, 2021
32%
Companies covered
180%
Jun 30, 2020
600
1,680
Citizens served
Jun 30, 2020
90
130
Jun 30, 2021
44%
Citizen services: smart life Citizen services: smart education
Government services:
smart government services
Business development:
smart environmental protection
52
(in thousand)
(in million)
• Coverage: deployed in 50+ cities and 80+
commissions, offices, and bureaus, and benefited 1.5
million+ companies
• Efficiency increase: helped local governments
analyze macroeconomic conditions and industries, and
provided companies with risk management service
• Coverage: went live in ten provinces/cities, covering
110,000+ businesses and 6,000+ environmental
monitoring points in Shenzhen
• Efficiency increase: conducted smart monitoring of
230 pollutants in seven industries
• Vocational education: served 56 million users,
with courses broadcast 456 million times
• Corporate training: served 1,700+ government and
corporate customers, recording 1.61 billion
attendances at online conferences and business
training
• Citizen services: accessed 3.3 billion+ times by
nearly 42 million users
• City services: online processing of 16,000+ service
items and AI-enabled instant approval of 3,500+
service items in nearly 30 cities

53
Expertise makes life simple
Technology makes integrated financial
services heartwarming
Healthcare makes life better

Q&A
54

Appendices: 1H 2021 Group operating profit (Table A-1)
(in RMB million)Life & Health P&C Banking Trust Securities
Other Asset
ManagementTechnology Other businesses
and eliminationThe Group
Impact of discount rate change (C)
Short-term investment variance (B)
Impact of one-off material non-
operating items and others (D)
Net profit (A)
Net profit attributable to
non-controlling interests
Net profit attributable to shareholders
of the parent company
See
Table BSee
Table C
See
Table D
See
Table ESee
Table F
Excluding:
Operating profit (E = A – B – C – D)
Operating profit attributable to
non-controlling interests
Operating profit attributable to
shareholders of the parent company
Note: Figures may not match the calculation due to rounding.
55
(15,245)
(5,200)
29,785 10,791 17,583 1,254 1,748 5,815 3,370 (2,383) 67,963
529 50 7,392 1 71 737 726 452 9,958
29,256 10,741 10,191 1,253 1,677 5,078 2,644 (2,835) 58,005
50,230 10,791 17,583 1,254 1,748 5,815 6,962 (2,383) 92,000
735 50 7,392 1 71 737 726 452 10,164
49,495 10,741 10,191 1,253 1,677 5,078 6,236 (2,835) 81,836
- -
-
-
-
-
-
-
-
-
-
-
-
-
-
-
(3,592)
-
-
-
-
-
(3,592)
(15,245)
(5,200)

Appendices: 1H 2020 Group operating profit (Table A-2)
(in RMB million)Life & Health P&C Banking Trust Securities
Other Asset
ManagementTechnology Other businesses
and eliminationThe Group
Impact of discount rate change (C)
Short-term investment variance (B)
Impact of one-off material non-
operating items and others (D)
Net profit (A)
Net profit attributable to
non-controlling interests
Net profit attributable to shareholders
of the parent company
See
Table BSee
Table C
See
Table D
See
Table ESee
Table F
Excluding:
Operating profit (E = A – B – C – D)
Operating profit attributable to
non-controlling interests
Operating profit attributable to
shareholders of the parent company
Note: Figures may not match the calculation due to rounding.
56
(1,987) (1,987)
(3,660) (3,660)
45,888 8,274 13,678 1,653 1,565 3,220 4,045 (2,355) 75,968
388 40 5,751 2 56 549 607 (108) 7,285
45,500 8,234 7,927 1,651 1,509 2,671 3,438 (2,247) 68,683
51,535 8,274 13,678 1,653 1,565 3,220 4,045 (2,355) 81,615
408 40 5,751 2 56 549 607 (108) 7,305
51,127 8,234 7,927 1,651 1,509 2,671 3,438 (2,247) 74,310
- -
-
-
-
-
-
-
-
-
-
-
-
-
-
-
-
-
-
-
-
-
-
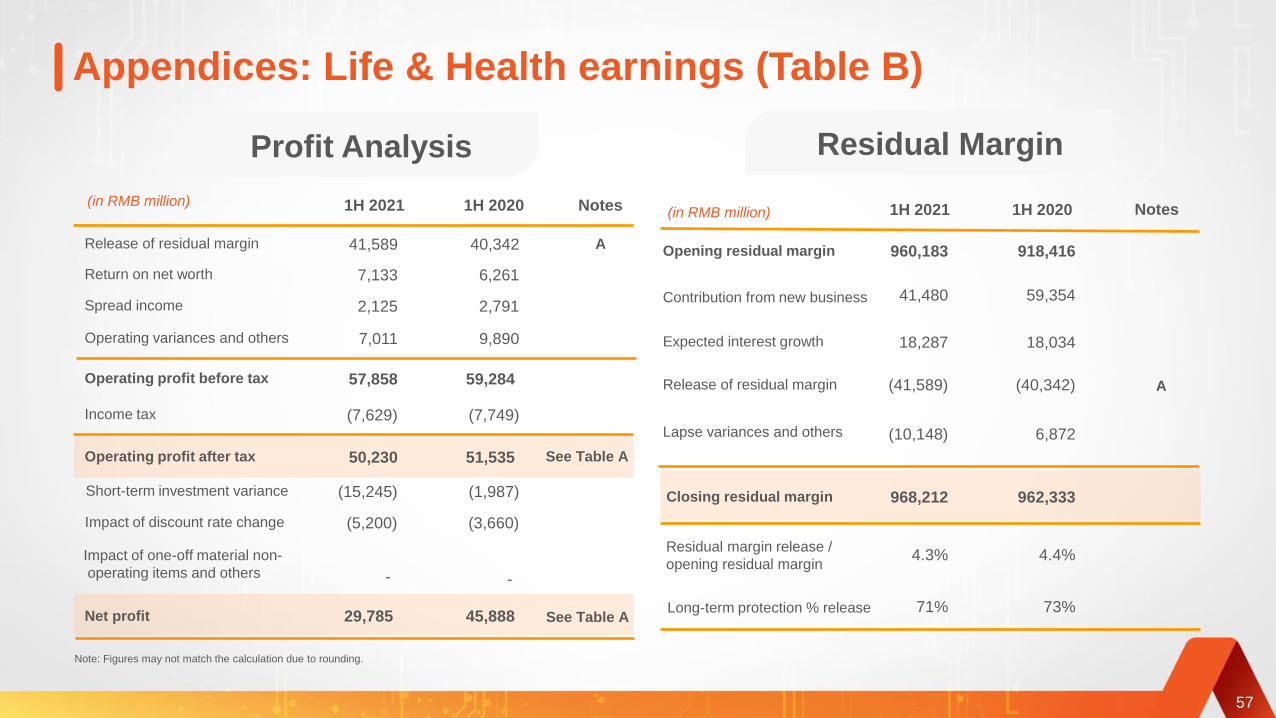
Appendices: Life & Health earnings (Table B)
Profit Analysis Residual Margin
Note: Figures may not match the calculation due to rounding.
(in RMB million)
Release of residual margin
Spread income
Return on net worth
Operating variances and others
Operating profit before tax
Income tax
Operating profit after tax
Net profit
Opening residual margin
Expected interest growth
Contribution from new business
Release of residual margin
Closing residual margin
Lapse variances and others
A
1H 2021 1H 2020 Notes
A
See Table A
See Table A
(in RMB million)1H 2021 1H 2020 Notes
Short-term investment variance
Impact of discount rate change
Impact of one-off material non-
operating items and others
57
Residual margin release /
opening residual margin
Long-term protection % release
57,858
50,230
(7,629)
29,785
(15,245)
(5,200)
-
40,342
6,261
2,791
59,284
9,890
51,535
(7,749)
45,888
(1,987)
(3,660)
-
7,133
7,011
2,125
41,589 960,183
41,480
18,287
968,212
(41,589)
(10,148)
918,416
59,354
18,034
962,333
(40,342)
6,872
4.3% 4.4%
71% 73%

Appendices: P&C earnings (Table C)1H 2021 Notes(in RMB million)
Premium income
Claim expenses
Net earned premiums
Commission expenses of insurance operations
Underwriting profit
1H 2020
B
Administrative expenses
Reinsurance commission revenue
Combined ratio (%)
Average investment assets
Total investment income
Total investment yield (unannualized, %)
Other net revenue and expenses
Profit before tax
Net profit
Income tax
D = B x (1-C)
C
E = F x G
F
G
See Table A
Note: Figures may not match the calculation due to rounding.
Operating profit See Table A
58
133,313
127,255
(85,812)
5,210
(15,594)
(23,855)
95.9
7,973
318,510
2.5
(419)
12,764
10,791
(1,973)
10,791
2,586
144,118
122,339
(73,431)
2,396
(21,613)
(27,932)
98.1
8,406
298,591
2.8
(565)
10,237
8,274
(1,963)
8,274
3,033

Appendices: Banking earnings (Table D)(in RMB million)
Net interest revenue
Net interest margin (unannualized, %)
Average balance of interest-earning assets
Net non-interest revenue
1H 2021 1H 2020
I
Notes
General and administrative expenses
Profit before tax
Net profit
Income tax
Revenue K
Cost-to-income ratio (%)
J
H = I x J
L = - (K x M)
M
Other expenses
O
P
N = - (O x P)
See Table A
Note: Figures may not match the calculation due to rounding.
59
Tax and surcharges
59,361
4,224,570
1.41
25,319
(23,160)
22,341
17,583
(4,758)
84,680
27.35
(25,121)
2,759,354
0.91
(74)
(820)
55,580
3,887,854
1.43
22,748
(21,380)
17,587
13,678
(3,909)
78,328
27.30
(32,302)
2,429,534
1.33
(72)
(798)
Impairment losses on credit and other assets (38,285) (38,491)
Average balance of loans (including discounted bills)
Including: Loan impairment loss
Credit cost (unannualized, %)
Operating profit before impairment loss 60,700 56,150

Appendices: Trust earnings (Table E)
(in RMB million)
Fees and commission revenue
Fee rate of assets held in trust (%)
Monthly average assets held in trust
Fees and commission expenses
1H 2021 1H 2020 Notes
Administrative expenses
Profit before tax
Net profit
Income tax
Net fees and commission revenue
Total investment income
Other net revenue and expenses
R
S
Q = R x S
See Table A
Note: Figures may not match the calculation due to rounding.
60
1,961
408,194
0.48
(243)
(584)
1,629
1,254
(375)
1,718
253
242
2,259
435,772
0.52
(160)
(513)
2,141
1,653
(488)
2,099
293
262
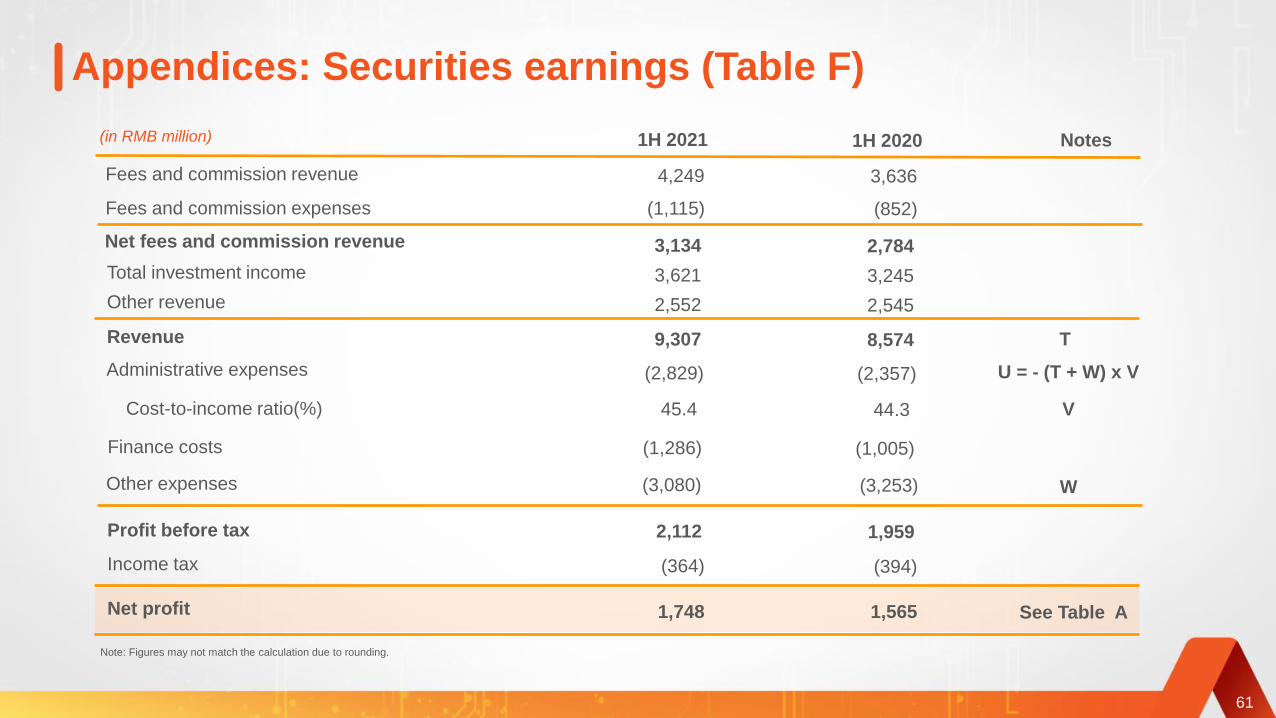
Appendices: Securities earnings (Table F)
(in RMB million) Notes
Fees and commission revenue
Fees and commission expenses
1H 2021 1H 2020
Net fees and commission revenue
Total investment income
Administrative expenses
Cost-to-income ratio(%)
Finance costs
Other expenses
Profit before tax
Net profit
Income tax
V
U = - (T + W) x V
See Table A
Other revenue
Revenue
W
T
Note: Figures may not match the calculation due to rounding.
61
4,249
(1,115)
45.4
3,134
3,621
(2,829)
(1,286)
(3,080)
2,112
(364)
1,748
2,552
9,307
3,636
(852)
44.3
2,784
3,245
(2,357)
(1,005)
(3,253)
1,959
(394)
1,565
2,545
8,574
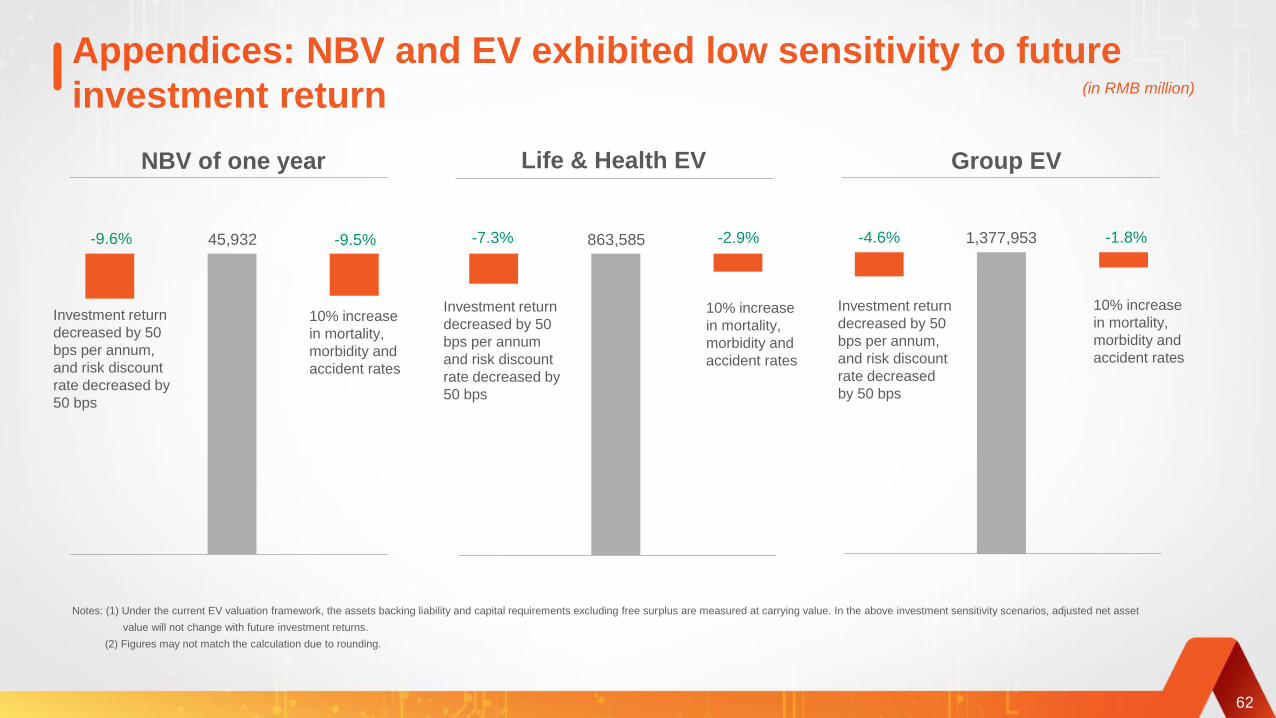
Appendices: NBV and EV exhibited low sensitivity to future
investment return (in RMB million)
62
-4.6% -1.8%
Group EV
Investment return
decreased by 50
bps per annum,
and risk discount
rate decreased
by 50 bps
10% increase
in mortality,
morbidity and
accident rates
45,932-9.6% -9.5%
NBV of one year
Investment return
decreased by 50
bps per annum,
and risk discount
rate decreased by
50 bps
10% increase
in mortality,
morbidity and
accident rates
-7.3% -2.9%
Life & Health EV
Investment return
decreased by 50
bps per annum
and risk discount
rate decreased by
50 bps
10% increase
in mortality,
morbidity and
accident rates
Notes: (1) Under the current EV valuation framework, the assets backing liability and capital requirements excluding free surplus are measured at carrying value. In the above investment sensitivity scenarios, adjusted net asset
value will not change with future investment returns.
(2) Figures may not match the calculation due to rounding.
863,585 1,377,953