2021 housing experience survey report - all students
TRANSCRIPT

2021 Housing Experience Survey Report - All Students Prepared by IRDS
Last updated: February 26, 2021
Administration and Response Rate: The survey was administered between February 8th and February 19th, 2021 to all students who live in campus sponsored housing. Student employees who are compensated with room/board were not included. Of the 413 students invited to complete the survey 175 (42%) provided complete or partial (i.e., answered at least one question) responses. Because students could choose whether or not to answer particular questions, the response rates varied by question. Unless otherwise noted, all respondents could answer a particular question.
Respondent Characteristics: Please refer to Tables 1-4 below for respondent characteristics, including information about the representativeness of the respondent sample relative to the invitee population. The respondent sample was roughly representative of the invitee population with a few exceptions, noted below. Note that percents should be interpreted with caution when there are small cell sizes.
• Females were more likely to respond (49%) compared to males (33%; Table 1), which is typical in surveyresearch.
• There were also some differences across residence halls (Table 3) and room types (Table 4) that should beexamined by Housing and Residence Education staff to determine representativeness as well as to suggestresidence halls and/or room types where survey promotion efforts could be strengthened for the next surveyadministration.
1

Table 1: Comparison of student characteristics for survey invitees and respondents – background
Student Characteristic # Invited (of 413 Total)
% Invited # Responded (of 175 Total)
% Responded Response Rate (# responded/ # Invited)
Entering Level Entering Frosh 394 95% 167 95% 42%
Transfer Students 15 4% 6 3% 40% Unknown 4 1% 2 1% 50%
Race/Ethnicity International 38 9% 17 10% 45%
Hispanic 252 61% 99 57% 39% African American 32 8% 15 9% 47% American Indian 2 1% 1 1% 50%
Asian 36 9% 19 11% 53% Pacific Islander 0 0% 0 0% N/A
White 32 8% 16 9% 50% Multi-racial 17 4% 6 3% 35%
Unknown 4 1% 2 1% 50% Gender
Female 229 55% 112 64% 49% Male 173 42% 57 33% 33%
Unknown 11 3% 6 3% 55% Note: % values may not sum to 100 due to rounding error
Table 2: Comparison of student characteristics for survey invitees and respondents – background
Student Characteristic # Invited (of 413 Total)
% Invited # Responded (of 175 Total)
% Responded Response Rate (# responded/
# Invited) Pell Grant Eligibility Status
Pell Grant Eligible 289 70% 119 68% 41% Non-Pell Grant Eligible 121 29% 54 31% 45%
Unknown 3 1% 2 1% 67% First Generation Status
First Generation 325 79% 135 77% 42% Non-First Generation 83 20% 37 21% 45%
Unknown 5 1% 3 2% 60% Note: % values may not sum to 100 due to rounding error
Table 3: Comparison of student characteristics for survey invitees and respondents – housing
Student Characteristic # Invited (of 413 Total)
% Invited # Responded (of 175 Total)
% Responded Response Rate (# responded/ # Invited)
Cathedral 62 15% 30 17% 48% Half Dome 146 35% 66 38% 45%
Kern Hall 10 2% 7 4% 70% Mariposa 65 16% 24 14% 37%
Tenaya 53 13% 18 10% 34% Tulare Hall 9 2% 6 3% 67% Tuolumne 68 17% 24 14% 35%
Note: % values may not sum to 100 due to rounding error
2

Table 4: Comparison of student characteristics for survey invitees and respondents – housing
Room Type # Invited (of 413 Total)
% Invited # Responded (of 175 Total)
% Responded Response Rate (# responded/ # Invited)
Double 26 6% 18 10% 69% Quad 150 36% 65 37% 43% Triple 225 55% 86 49% 38%
Single/Safe Room Single 12 3% 6 3% 50% Note: % values may not sum to 100 due to rounding error
3

To what extent do you agree or disagree with each statement about your experience on the UC Merced campus.
Strongly Agree Agree Somewhat Agree Neither Agree nor Disagree Somewhat Disagree
Disagree Strongly Disagree
I see myself as part of the campuscommunity.
I feel that I am a member of thecampus community.
I feel a sense of belonging to thecampus community.
0% 20% 40% 60% 80% 100%
17%
16%
17%
41%
40%
39%
23%
23%
25%
10%
14%
14%
6%
FieldStrongly
Agree AgreeSomewhat
Agree
NeitherAgree norDisagree
SomewhatDisagree Disagree
StronglyDisagree Total
I see myself as part ofthe campus community.
30 71 40 18 10 4 2 175
I feel that I am amember of the campuscommunity.
28 70 39 24 7 3 2 173
I feel a sense ofbelonging to thecampus community.
29 67 43 24 5 3 3 174
4
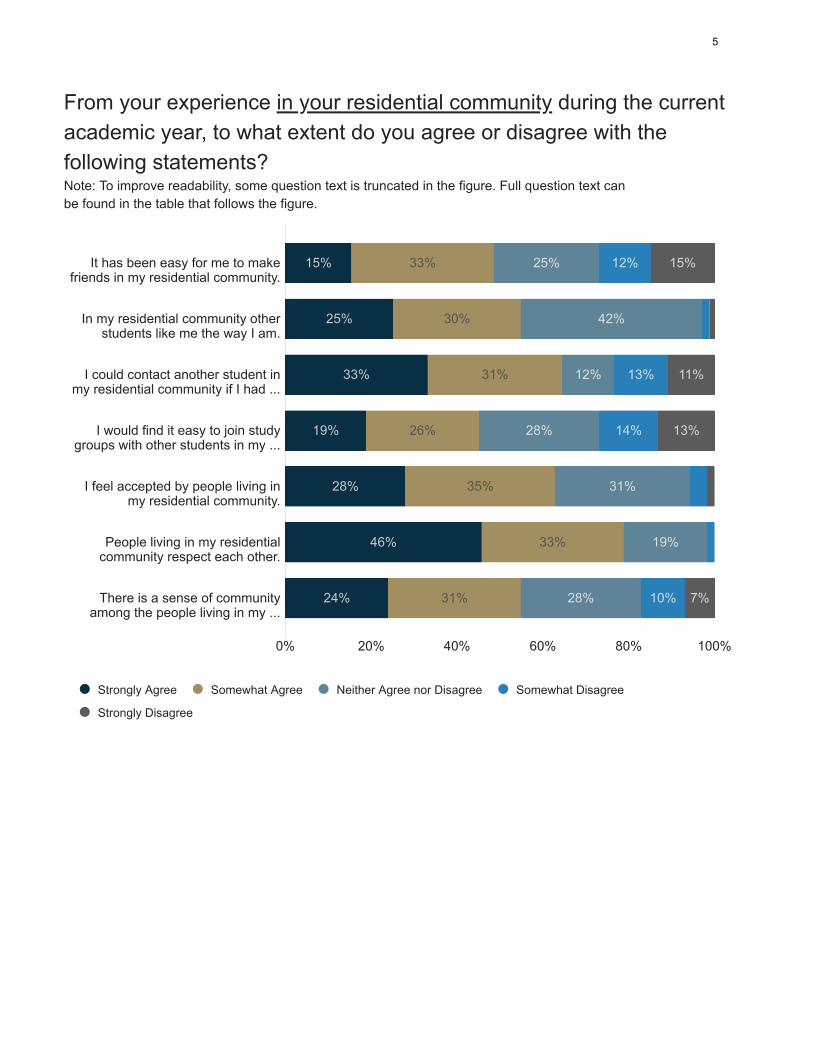
From your experience in your residential community during the current academic year, to what extent do you agree or disagree with the following statements? Note: To improve readability, some question text is truncated in the figure. Full question text canbe found in the table that follows the figure.
Strongly Agree Somewhat Agree Neither Agree nor Disagree Somewhat Disagree
Strongly Disagree
It has been easy for me to makefriends in my residential community.
In my residential community otherstudents like me the way I am.
I could contact another student inmy residential community if I had ...
I would find it easy to join studygroups with other students in my ...
I feel accepted by people living inmy residential community.
People living in my residentialcommunity respect each other.
There is a sense of communityamong the people living in my ...
0% 20% 40% 60% 80% 100%
15%
25%
33%
19%
28%
46%
24%
33%
30%
31%
26%
35%
33%
31%
25%
42%
12%
28%
31%
19%
28%
12%
13%
14%
10%
15%
11%
13%
7%
5

From your experience in your residential community during the current academic year, to what extent do you agree or disagree with the following statements?Note: This data is presented as a figure (percentages) on the previous page.
FieldStrongly
AgreeSomewhat
Agree
NeitherAgree norDisagree
SomewhatDisagree
StronglyDisagree Total
It has been easy for me to make friends inmy residential community.
27 58 43 21 26 175
In my residential community other studentslike me the way I am.
44 52 74 3 2 175
I could contact another student in myresidential community if I had a questionabout an assignment.
58 55 21 22 19 175
I would find it easy to join study groups withother students in my residential community ifI wanted to.
33 46 49 24 23 175
I feel accepted by people living in myresidential community.
49 61 55 7 3 175
People living in my residential communityrespect each other.
80 58 34 3 0 175
There is a sense of community among thepeople living in my residential community.
42 54 49 18 12 175
6

These questions are about your ethnicity or your ethnic group and how you feel about it or react to it. Please indicate how much you agree or disagree with each statement.
Strongly Agree Somewhat Agree Neither Agree nor Disagree Somewhat Disagree
Strongly Disagree
I have a strong sense of belongingto my own racial/ethnic group.
I feel a strong attachment towardsmy own racial/ethnic group.
0% 20% 40% 60% 80% 100%
40%
37%
25%
27%
26%
25%
5%
7%
5%
Field StronglyAgree
SomewhatAgree
Neither Agreenor Disagree
SomewhatDisagree
StronglyDisagree
Total
I have a strong sense of belonging tomy own racial/ethnic group.
70 43 45 9 8 175
I feel a strong attachment towards myown racial/ethnic group.
65 47 44 13 6 175
7

Please indicate your agreement of disagreement with each statement about the staff and services offered at the Housing and Residence Education offices.Note: To improve readability, some question text is truncated in the figure. Full question text canbe found in the table that follows the figure.
Strongly Agree Agree Disagree Strongly Disagree
I am able to get my questionsanswered by Housing and ...
The staff at the front desk arehelpful.
0% 20% 40% 60% 80% 100%
50%
50%
46%
47%
Field StronglyAgree
Agree Disagree StronglyDisagree
Total
I am able to get my questions answered by Housing andResidence Education staff.
83 76 6 0 165
The staff at the front desk are helpful. 82 77 5 0 164
8

Please indicate your agreement or disagreement with each statement. Housing and Residence Education:Note: To improve readability, some question text is truncated in the figure. Full question text canbe found in the table that follows the figure.
Strongly Agree Agree Neither Agree nor Disagree Disagree Strongly Disagree
Staff are genuinely interested in ...
Provides information about ...
Provides information about ...
Provides education about the ...
Provides information about how ...
Provides information about what ...
0% 20% 40% 60% 80% 100%
30%
32%
31%
31%
48%
38%
42%
48%
44%
48%
45%
45%
24%
15%
18%
16%
13%
5%
5%
FieldStrongly
Agree AgreeNeither
Agree norDisagree
DisagreeStrongly
Disagree Total
Staff are genuinely interested in my educationaland personal development.
52 72 41 5 2 172
Provides information about resources to help me beacademically successful (e.g., GPA calculation,tutoring).
55 83 26 7 1 172
Provides information about self-care (e.g., stressmanagement, making time for family).
54 76 31 9 2 172
Provides education about the effects and risks ofdrug and alcohol use, and other high risk behaviors.
54 82 27 8 1 172
Provides information about how to access studentservices (e.g., work orders, mail/packages, lostkeys).
82 77 6 6 1 172
Provides information about what to do when thereis an emergency (e.g., fire, medical).
65 78 22 6 1 172
9

Please indicate your agreement or disagreement with each statement about the opportunities, experiences, and services offered to on campus residents. Living on campus:Note: To improve readability, some question text is truncated in the figure. Full question text canbe found in the table that follows the figure.Note: Some questions were not asked due to faulty skip logic.
Strongly Agree Agree Neither Agree nor Disagree Disagree Strongly Disagree
Helps me develop independence andself-sufficiency.
Facilitates my personal growth,reflection, and development.
Helps me develop a sense of justiceand fairness.
Facilitates a respect for self, others,and property.
Helps me appreciate culturaldifferences, perspectives, lifestyles, ...
Helps me develop leadership skills.
Helps me develop problem-solving anddecision-making skills.
Helps me understand how to applyknowledge I learned in the classroom ...
Helps me understand the importance ofconfronting inappropriate or ...
Helps me understand how to handleconflict within my community.
0% 10% 20% 30% 40% 50% 60% 70% 80% 90% 100%
51%
43%
30%
43%
43%
23%
31%
22%
26%
26%
39%
44%
43%
47%
40%
38%
48%
46%
51%
47%
10%
10%
21%
8%
13%
31%
16%
25%
19%
21%
5%
4%4%
10

Please indicate your agreement or disagreement with each statement about the opportunities, experiences, and services offered by Housing and Residence Life. Housing and Residence Life:Note: This data is presented as a figure (percentages) on the previous page.
FieldStrongly
Agree AgreeNeither
Agree norDisagree
DisagreeStrongly
Disagree Total
Helps me develop independence and self-sufficiency.
85 65 16 1 1 168
Facilitates my personal growth, reflection, anddevelopment.
73 74 16 2 3 168
Helps me develop a sense of justice and fairness. 51 72 36 5 4 168
Facilitates a respect for self, others, and property. 71 78 14 3 1 167
Helps me appreciate cultural differences,perspectives, lifestyles, spirituality, and otherforms of diversity.
71 67 22 5 2 167
Helps me develop leadership skills. 39 64 52 8 5 168
Helps me develop problem-solving and decision-making skills.
52 80 27 5 4 168
Helps me understand how to apply knowledge Ilearned in the classroom outside of class.
36 76 41 7 7 167
Helps me understand the importance ofconfronting inappropriate or disruptive behavior.
43 85 32 4 3 167
Helps me understand how to handle conflict withinmy community.
44 78 35 5 5 167
11

Which of the following experiences have you participated in?Note: To improve readability, some question text is truncated in the figure. Full question text canbe found in the table that follows the figure.
Met with an academic advisor
Studied or worked on a project ...
Used academic support services ...
Participated in my Student Den
Social activities and clubs
Attended health and wellness ...
Employment on or off campus
Met with a faculty member
Leadership role on campus
Research with faculty/staff
Attended diversity-related activities
Leadership role in the community ...
Internship(s)
Study abroad
0% 10% 20% 30% 40% 50% 60% 70% 80% 90% 100%
26%
14%
12%
11%
10%
7%
6%
6%
2%
2%
2%
1%
1%
0%
12

Which of the following experiences have you participated in? (Please select all that apply)Note: This data is presented as a figure (percentages) on the previous page.
Field Choice Count
Met with an academic advisor 129
Studied or worked on a project with other students 72
Used academic support services (e.g. tutoring, studying and class registration workshops) 61
Participated in my Student Den 53
Social activities and clubs 52
Attended health and wellness activities 34
Employment on or off campus 31
Met with a faculty member 30
Leadership role on campus 11
Research with faculty/staff 10
Attended diversity-related activities 8
Leadership role in the community (off campus) 6
Internship(s) 6
Study abroad 0
13

How do you learn about campus events, programs and activities? (Please select all that apply)Note: To improve readability, some question text is truncated in the figure. Full question text canbe found in the table that follows the figure.
Happenings emails
Social media (e.g., Facebook, ...
Word of mouth from other students
Word of mouth from Resident ...
Posters/flyers
Monthly newsletters or bulletin ...
Events calendar on UC Merced ...
Housing and Residence ...
Other (please specify)
Commercials/advertisements on ...
Digital screens in the library
0% 10% 20% 30% 40% 50% 60% 70% 80% 90% 100%
27%
20%
14%
10%
9%
9%
5%
4%
1%
0%
0%
Field Choice Count
Happenings emails 135
Social media (e.g., Facebook, Instagram, Twitter) 102
Word of mouth from other students 73
Word of mouth from Resident Assistants or Programming Assistants 52
Posters/flyers 48
Monthly newsletters or bulletin board posted by RA 47
Events calendar on UC Merced website 25
Housing and Residence Education website 18
Other (please specify) 6
Commercials/advertisements on the Claw Channel 36 0
Digital screens in the library 0
14

Please select your level of agreement or disagreement with the following statement - I feel safe in my residential community.
Strongly Agree
Agree
Disagree
Strongly Disagree
0% 20% 40% 60% 80% 100%
57%
43%
1%
0%
Field Choice Count
Strongly Agree 95
Agree 72
Disagree 1
Strongly Disagree 0
15

Imagine that you are leaving your residence hall and you hear yelling and noises coming from a nearby room. You can tell that the people involved are angry and they sound like they are a couple; you then hear a loud noise that sounds like something breaking. What would you do? (Select all that apply.) Note: To improve readability, some question text is truncated in the figure. Full question text canbe found in the table that follows the figure.
Direct - I would directly intervene ...
Distract - I would create a ...
Delegate - I would call my RA or ...
I wouldn't get involved.
Other (please describe)
0% 20% 40% 60% 80% 100%
21%
15%
82%
9%
1%
Field ChoiceCount
Direct - I would directly intervene by going to the room to see what's going on. 35
Distract - I would create a distraction (e.g., ask them about an event on campus or if they wanted togo grab food).
26
Delegate - I would call my RA or get another staff member involved. 138
I wouldn't get involved. 15
Other (please describe) 1
16

If a friend in your residence hall told you that they experienced a sexual assault, domestic violence, or stalking incident, would you be comfortable telling them about campus resources that could help?
Yes
No/Not Sure
0% 20% 40% 60% 80% 100%
93%
7%
Field Choice Count
Yes 155
No/Not Sure 11
17

What resource(s) would you share with them? (Select all that apply.)Note: To improve readability, some question text is truncated in the figure. Full question text canbe found in the table that follows the figure.
Counseling and Psychological ...
Campus Police
The CARE Office/Campus ...
An RA or other Housing staff
A professor or other non-Housing ...
Other (please describe)
0% 20% 40% 60% 80% 100%
86%
74%
72%
61%
10%
2%
Field Choice Count
Counseling and Psychological Services (CAPS) 133
The CARE Office/Campus Advocate 112
Campus Police 115
An RA or other Housing staff 95
A professor or other non-Housing staff member 15
Other (please describe) 3
18

Please select your level of agreement or disagreement with the following statements regarding the Pavilion Dining Center.Note: To improve readability, some question text is truncated in the figure. Full question text canbe found in the table that follows the figure.
Strongly Agree Agree Disagree Strongly Disagree
I am satisfied with the quality of ...
I am satisfied with the variety of ...
I am satisfied with the service ...
I am satisfied with the cleanliness.
I am happy with the hours it is ...
I am able to select healthy food ...
I am able to select food options ...
0% 20% 40% 60% 80% 100%
18%
20%
66%
67%
29%
37%
49%
59%
48%
33%
30%
40%
45%
42%
19%
25%
21%
14%
8%
7%
10%
Field StronglyAgree
Agree Disagree StronglyDisagree
Total
I am satisfied with the quality of food served. 24 80 25 6 135
I am satisfied with the variety of food served. 27 66 35 10 138
I am satisfied with the service provided by staff. 90 45 0 1 136
I am satisfied with the cleanliness. 93 42 1 2 138
I am happy with the hours it is open. 39 54 29 14 136
I am able to select healthy food options. 51 62 19 5 137
I am able to select food options that satisfy dietary restrictions(e.g., vegetarian, vegan, gluten-free).
64 55 10 2 131
19

During your time as a student, how often have you used the following resources at UC Merced?Note: To improve readability, some question text is truncated in the figure. Full question text canbe found in the table that follows the figure.
Very often Often Sometimes Rarely Never
CalFresh application assistance
Information on how to preparehealthy meals
Bobcat Pantry
UC Merced Community Garden
Financial Literacy Workshops
0% 20% 40% 60% 80% 100%
8%
12%
10%
5%
12%
10%
14%
14%
11%
15%
78%
68%
70%
82%
70%
Field Very often Often Sometimes Rarely Never Total
CalFresh application assistance 2 4 13 17 128 164
Information on how to prepare healthy meals 5 6 19 23 112 165
Bobcat Pantry 2 7 17 23 115 164
UC Merced Community Garden 2 2 8 18 134 164
Financial Literacy Workshops 3 2 20 24 115 164
20

Please indicate which of the following might prevent you from using each resource below. (Select all that apply.)
Resource not needed Have not heard of this resource Inconvenient time or hours
Inconvenient location Other reason
CalFresh application assistance
Information on how to preparehealthy meals
Bobcat Pantry
UC Merced Community Garden
Financial Literacy Workshops
0% 20% 40% 60% 80% 100%
35%
32%
34%
31%
32%
44%
54%
31%
46%
40%
8%
9%
20%
11%
16%
3%
2%
3%
3%
2%
10%
4%
12%
9%
10%
21

Please indicate which of the following might prevent you from using each resource below. (Select all that apply.)Note: This data is presented as a figure (percentages) on the previous page.
Field Resourcenot needed
Have not heard ofthis resource
Inconvenienttime or hours
Inconvenientlocation
Otherreason
Total
CalFresh applicationassistance
66 82 14 6 18 186
Information on how toprepare healthy meals
54 90 15 3 6 168
Bobcat Pantry 55 50 32 5 19 161
UC Merced CommunityGarden
53 79 18 5 16 171
Financial LiteracyWorkshops
53 67 27 4 16 167
22

When do you need to park a motor vehicle on campus? (select all that apply)
Not applicable - I do not own amotor vehicle.
Never - I own a motor vehicle butdo not park on campus.
Monday to Friday (weekdays)
Friday night to Sunday (weekends)
Holidays and Break periods
0% 20% 40% 60% 80% 100%
73%
7%
19%
18%
5%
Field Choice Count
Not applicable - I do not own a motor vehicle. 120
Never - I own a motor vehicle but do not park on campus. 11
Monday to Friday (weekdays) 31
Friday night to Sunday (weekends) 29
Holidays and Break periods 8
23

When do you need to ride CatTracks? (select all that apply)
Not applicable - I do not rideCatTracks
Monday to Friday (weekdays)
Friday night to Sunday (weekends)
Holidays and Break periods
0% 20% 40% 60% 80% 100%
44%
40%
42%
21%
Field Choice Count
Not applicable - I do not ride CatTracks 71
Monday to Friday (weekdays) 65
Friday night to Sunday (weekends) 68
Holidays and Break periods 34
24
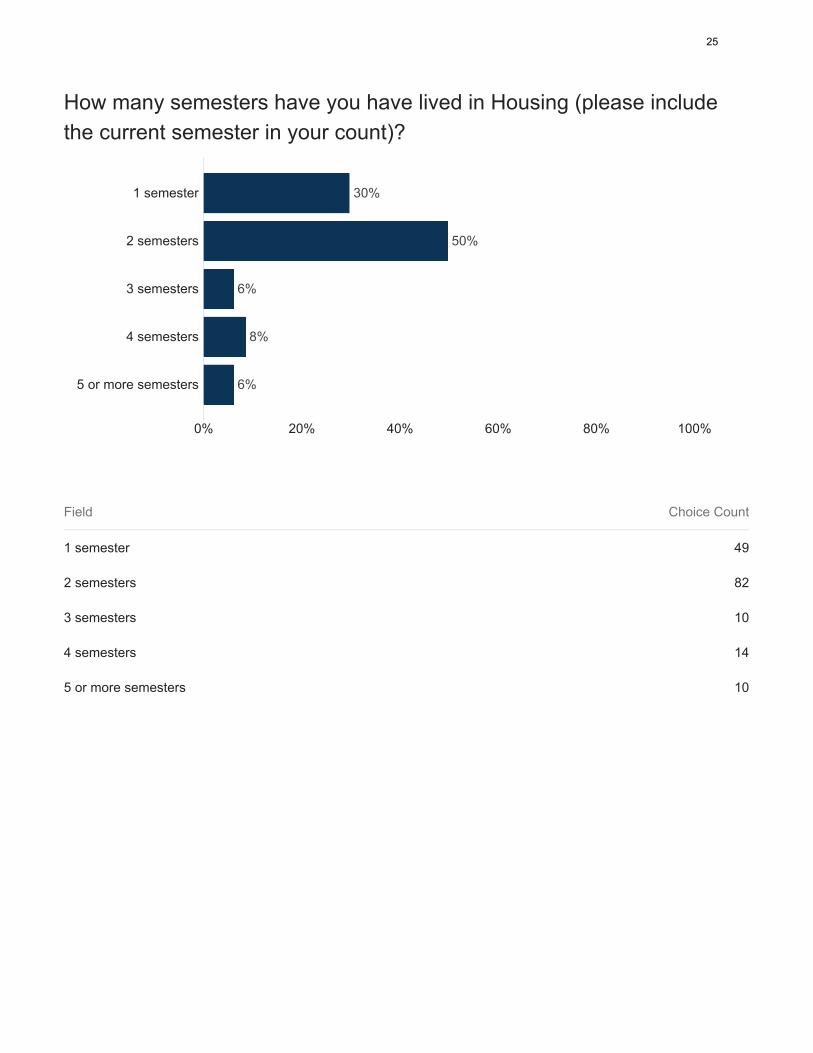
How many semesters have you have lived in Housing (please include the current semester in your count)?
1 semester
2 semesters
3 semesters
4 semesters
5 or more semesters
0% 20% 40% 60% 80% 100%
30%
50%
6%
8%
6%
Field Choice Count
1 semester 49
2 semesters 82
3 semesters 10
4 semesters 14
5 or more semesters 10
25

Overall, I am satisfied with my experience living on campus.
0% 20% 40% 60% 80% 100%
41%
54%
4%
2%
Field Choice Count
Strongly Agree 67
Agree 89
Disagree 6
Strongly Disagree 3
26