2021 digital future project
TRANSCRIPT

2021 Digital Future Project
Surveying the Digital Future The 17th study on the impact of
digital technology on Americans
The 2021 Digital Future Report
Surveying the Digital Future
Year Seventeen
Jeffrey I. Cole, Ph.D.
Director, Center for the Digital Future at USC Annenberg
Founder and Organizer, World Internet Project
Michael Suman, Ph.D., Research Director
Phoebe Schramm, Associate Director
Liuning Zhou, Ph.D., Project Manager
Graph preparation by Monica Dunahee
Edited by Harlan Lebo

The 2021 Digital Future Report
Surveying the Digital Future
Year Seventeen
Copyright 2021 University of Southern California
Copies
You are welcome to download the full text and graphs at www.digitalcenter.org.
Attribution
Excerpted material from this report can be cited in media coverage and institutional publications. Text excerpts should be attributed to The Digital
Future Report.
Graphs should be attributed in a source line to:
The 2021 Digital Future Report
Center for the Digital Future at USC Annenberg
Reprinting
Reprinting of this report in any form other than brief excerpts requires permission from the Center for the Digital Future at USC Annenberg, using the
address below.
Questions
Email: [email protected]
Center for the Digital Future at USC Annenberg
11444 West Olympic Blvd, Suite 120
Los Angeles, CA 90064
(310)235-4444
www.digitalcenter.org
The 2021 Digital Future Report
Surveying the Digital Future
Year Seventeen
Introduction 8
Device ownership and use 12
1. Computers in the household 13
2. Mobile phones and smartphones in the household 14
3. Internet-connected video at home 15
4. Technology devices in the home 16
5. Gaming and e-readers 17
6. At-a-glance: technology devices in the household 18
7. Digital assistants and their uses 19
8. Digital assistants: views and useage 20
9. Digital monitoring of individuals 21
Internet use and trust 22
10. Reliability of information on the internet 23
11. Reliability of regularly-used websites 24
12. Reliability of news pages posted by established media 25
13. Reliability of information posted by individuals 26
14. Reliability of information on government websites 27
15. Reliability of information on websites with strong political views 28
16. Views about mainstream media 29
17. Views about “fake news” 30
18. The news media’s role in politics 31
19. Government regulation of Facebook and Twitter 32
20. Self-regulation of social media sites 33
21. Views about presidential communication 34
22. Communication technologies and their impact on the world 35
23. The internet and political power 36
24. The internet and political influence for the people 37
25. The internet’s role in helping people understand politics 38
26. The internet encouraging public officials to care about what people think 39
27. Comfort in expressing views about politics 40
28. Views about political expression while online 41
29. Criticizing the government while online 42
30. Views about expressing extreme ideas on the internet 43
31. Government regulation of the internet 44
32. Use of paid online news 45
33. Online music subscriptions 46
34. Binge-watching videos 47
35. Watching videos as a social experience 48
36. Videos and social media spoilers 49
37. Use of postings on Facebook 50
38. Using Facebook for information about companies 51
Consumer Behavior 52
39. Buying online 53
40. Banking online 54
41. Selling online 55
42. Products not bought online 56
43. Products not bought online (men vs. women) 57
44. Internet used for investing 58

Social Effects 59
45. Privacy violated online 60
46. Consequences of privacy violated online 61
47. Privacy of personal information: private companies tracking online behavior 62
48. Concerns about corporate protection of personal information 63
49. Personal privacy online: concerns about government violation 64
50. Personal privacy online: concerns about corporate violation 65
51. Personal privacy online: concerns about individuals 66
52. Concerns about privacy online: comparison 67
53. Protecting personal privacy online 68
54. Online privacy during the coronavirus pandemic 69
55. Online bullying or harassment 70
56. Online bullying or harassment: impact 71
57. Knowledge of bullying or harassment 72
58. User experiences while online 73
59. Concerns about credit card security while buying on the internet 74
60. Privacy of personal information while buying on the internet 75
61. Privacy of personal information while on social networking sites 76
62. Privacy of personal information: companies tracking online behavior 77
63. Concerns about corporate protection of personal information 78
64. Password access by parents to children’s social networking accounts 79
65. Monitoring access to social networks by children 80
60. Reasons for not monitoring children’s access to social networks 81
61. Appropriate age for mobile phones and Facebook accounts 82
62. Are you ignored because others spend too much time online? 83
63. Are you ignored because others spend too much time on a mobile phone? 84

Supplement 1: Center for the Digital Future at USC Annenberg 85
Supplement 2: The World Internet Project – International Contacts 86
Supplement 3: Research methods and demographic data
Sample Procurement 90
Data Collection and Weighting 91
Demographic Data 92

8
The 2021 Digital Future Report
Surveying the Digital Future
Introduction: Seventeen annual studies on the impact of digital technology
Welcome to “Surveying the Digital Future,” the findings from the annual survey by the Center for the Digital Future at USC Annenberg on
the impact of the internet and related technology on Americans.
This report marks the completion of the 17th annual study by the Center of the views and behavior of internet users in the United States.
After 17 studies, we continue to find profound and enlightening information about how digital technology is changing American life.
You will find details about these changes – findings on more than 50 issues – in the pages that follow.
The Center continues this work in its role as one of the first research organizations to devote its primary efforts to exploring the views and
behavior of internet users in the United States. The Center was the first to develop a longitudinal panel study of these issues; the annual
report we produce is the longest continuing study of its kind.
The Center initiated its work in 1999, and published its first study in 2000. This project has become the focal point of comprehensive, year-
to-year examination of the impact of online technology in the United States.
The objective of our 17th report is the same as the first: to explore actions and opinions related to the use of online technology, as well as
to chronicle the emergence of changes as they occur.
The ongoing evolution in digital technology and how Americans adapt to these developments are primary focal points of our research.
Through our 17 studies, we have found that online behavior changes constantly, and users’ views and behavior adjust as technology
emerges, and then thrives, fades away, or morphs in new directions. This report, the 16 studies that preceded it, and those that will follow,
represent our commitment to chronicle this fascinating relationship between technology and behavior.
This work is part of the World Internet Project, which is organized and coordinated by the Center for the Digital Future at USC Annenberg.
Included in the World Internet Project are the Center’s work and partner studies in countries in North America, Europe, South America,
Asia, the Middle East, Australasia, and Africa.
9
The Center for the Digital Future at USC Annenberg: Exploring the internet’s impact
We created this project because the internet represents the most important technological development of our generation; its effects may
surpass those of television and could someday rival those of the printing press. If similar research had been conducted on television as it
evolved in the late 1940s, the information would have provided policymakers, the media, and ultimately historians with insights about how
broadcasting changed the world.
Our objective is to ensure that the Digital Future Project studies online technology and capitalizes on the opportunity that was missed as
television developed. By beginning our study of the internet early in its evolution as a worldwide communication and information-
gathering tool, we are able to better understand the effects of the internet as it grows, and not as a postscript after it has matured.
Why an ongoing study of the internet?
The Digital Future Project differs from most other studies of the internet in three principal areas:
The Digital Future Project looks at the social impact of the internet – Most internet studies gather data about who is online,
how long they are online, and what they do online. The Digital Future Project also compiles this information, but then deepens
the inquiry by examining the implications of the use of online technology, and links this use to a broad range of values, behavior,
attitudes, and perceptions.
A worldwide effort – The Center for the Digital Future at USC Annenberg created and organizes the World Internet Project,
which includes the Digital Future Project and similar studies in countries worldwide (see Supplement 2). Through this team of
international partners, the World Internet Project studies and compares changes associated with the internet in different
countries and regions, creating an international picture of change in online technology, use, and impact.
A principal goal of the Digital Future Project is to engage government and private industry decision-makers who can create
policy based on our findings – For this project to be truly impactful, we involve public and private organizations that are
committed to using our results. We have been allied with an unprecedented array of corporations – several of which are direct
competitors – and foundations that are engaged with us in an ongoing dialogue about the issues we explore in our studies.
The Digital Future Project: Key Areas
The current Digital Future Report includes findings that explore the views and behavior of users in four general subject areas:
Device Ownership and Use
Internet Use and Trust
Consumer Behavior
Social Effects

10
The 2021 Digital Future Report includes a broad sampling of more than 50 major issues from this year’s survey.
We hope you will be enlightened by our 17th study of the views and behavior of Americans, as we continue to develop our understanding of
how the internet is transforming our world.
Jeffrey I. Cole, Ph.D.
Director, Center for the Digital Future at USC Annenberg
Founder and Organizer, World Internet Project
11
The 2021 Digital Future Report
Surveying the Digital Future Year Seventeen
Each Digital Future Project explores 50 major issues in broad categories involving the impact of digital
technology in the United States.
This report explores only a sampling of the findings from the survey. For more detailed data, contact the
Center for the Digital Future at [email protected].

12
Device ownership and use

13
1. Computers in the household
Desktop computer use has trended downward, laptop use has been consistent, and
tablet use, after increasing significantly, has been stable over the past five years.
Which of the following devices, if any, do you have in your household?
Q146 (U-1a)
Desktop ownership drops from nearly three-quarters
to slightly more than half in eight years.
14
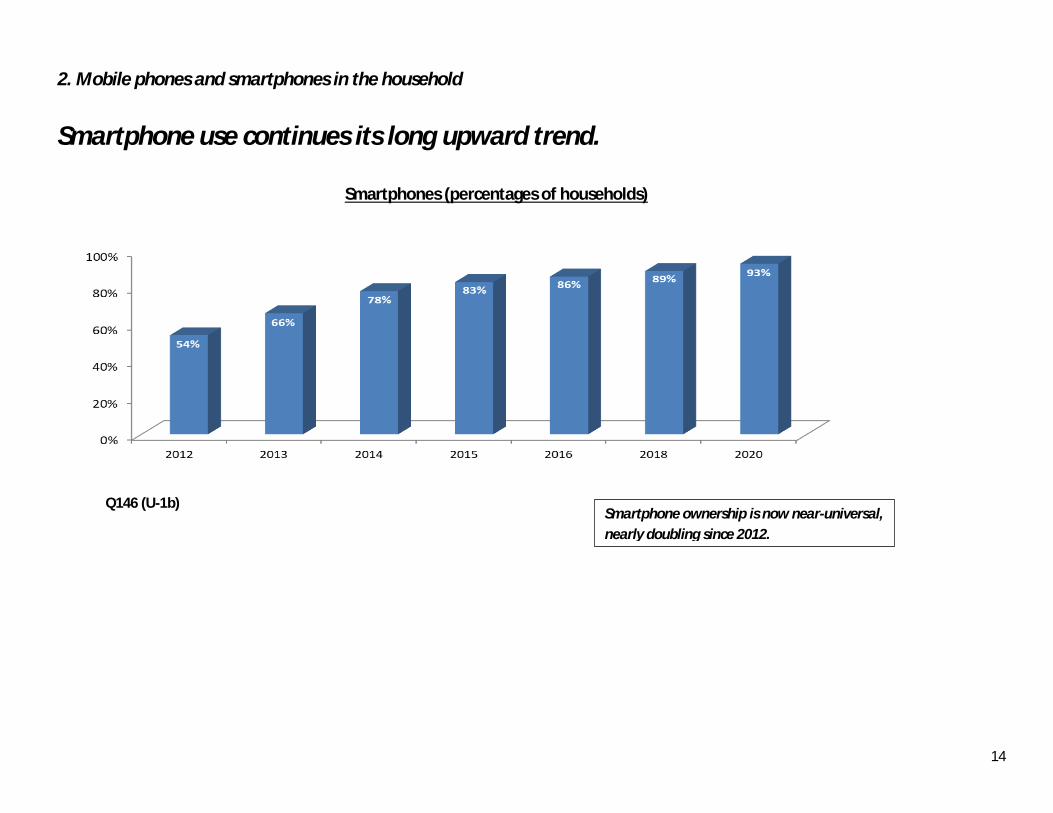
2. Mobile phones and smartphones in the household
Smartphone use continues its long upward trend.
Smartphones (percentages of households)
Q146 (U-1b)
Smartphone ownership is now near-universal,
nearly doubling since 2012.

15
3. Internet-connected video at home
After gradual decline, DVR use has been stable over the past two years. Following
three years of growth, Internet-connected TV use has been generally steady for the
last several years.
Which of the following devices, if any, do you have in your household?
Q146 (U-1c)
Internet-connected television continues to be
used by more than half of viewers.
line 2

16
4. Technology devices in the home
Console game use remains steady, while e-reader use continues a three-year slip. A
quarter of Americans have a smartwatch in their household.
Which of the following devices, if any, do you have in your household?
Q146 (U-1d)
E-reader use declined from more than one-third in
2015 (34%) to slightly more than one-quarter (26%) in
the current study.

17
5. Gaming and e-readers
Console game use remains steady, while e-reader use continues a three-year slump.
Which of the following devices, if any, do you have in your household?
Q146 (U-1d)
E-reader use declines from a peak of one-third
to slightly more than one-quarter.

18
6. At-a-glance: technology devices in the household
Smartphone and tablet use increase significantly.
Which of the following devices, if any, do you have in your household?
(NET PERCENT CHANGE 2012-2020)
Q146 (Percent change) (U-2)

19
7. Digital assistants and their uses
Use of digital assistants is increasing for entertainment, information-seeking, alerts,
device management, and news.
How do you use your digital assistant?
Q154B (D-1a and 1b)
Use of digital assistants for entertainment has
increased 22 percentage points; use of digital
assistants for news up 15 percentage points.

20
8. Digital assistants: views and usage
Use of digital assistants is climbing substantially.
How do you feel about your digital assistant?
Q154C (D-1)
Frequent use of digital assistants almost double since 2018.

21
9. Digital monitoring of individuals
Personal digital monitoring with an embedded chip is not favored by many.
If a digital chip could be put into your finger that is painless, invisible and removable,
and that allows you to eliminate all keys, IDs, boarding passes, credit cards, passports and all possibilities of fraud,
would you consider doing it?
Q 155 (U-1)
41% oppose personal digital monitoring; only 22% support.

22
Internet use and trust

23
10. Reliability of information on the internet
Decreasing percentages of people believe that most or all information on the internet
overall is generally reliable; increasing percentages say that none, a small portion, or
about half of online information is generally reliable.
How much of the information on the internet overall is generally reliable?
Q160 (U-1)
Views about reliability of the internet overall drop for the fourth
straight study; now more than 50% say about half of information
online is reliable.
24
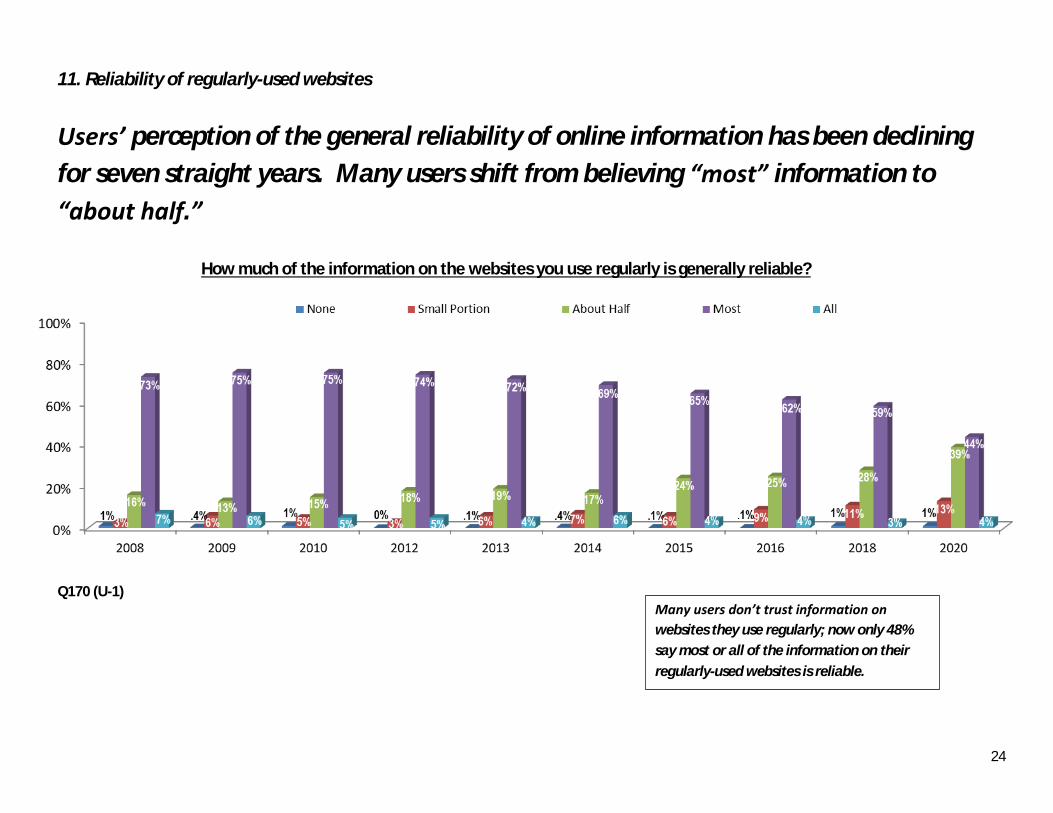
11. Reliability of regularly-used websites
Users’ perception of the general reliability of online information has been declining
for seven straight years. Many users shift from believing “most” information to
“about half.”
How much of the information on the websites you use regularly is generally reliable?
Q170 (U-1)
Many users don’t trust information on
websites they use regularly; now only 48%
say most or all of the information on their
regularly-used websites is reliable.

25
12. Reliability of news pages posted by established media
Perceived reliability of online information from established news media has dropped.
How much of the information on news pages posted by established media
such as The New York Times, CNN, etc., is generally reliable and accurate?
Q173A (U-1)
Almost one-third say only about half of the
information posted by established media is reliable.
26
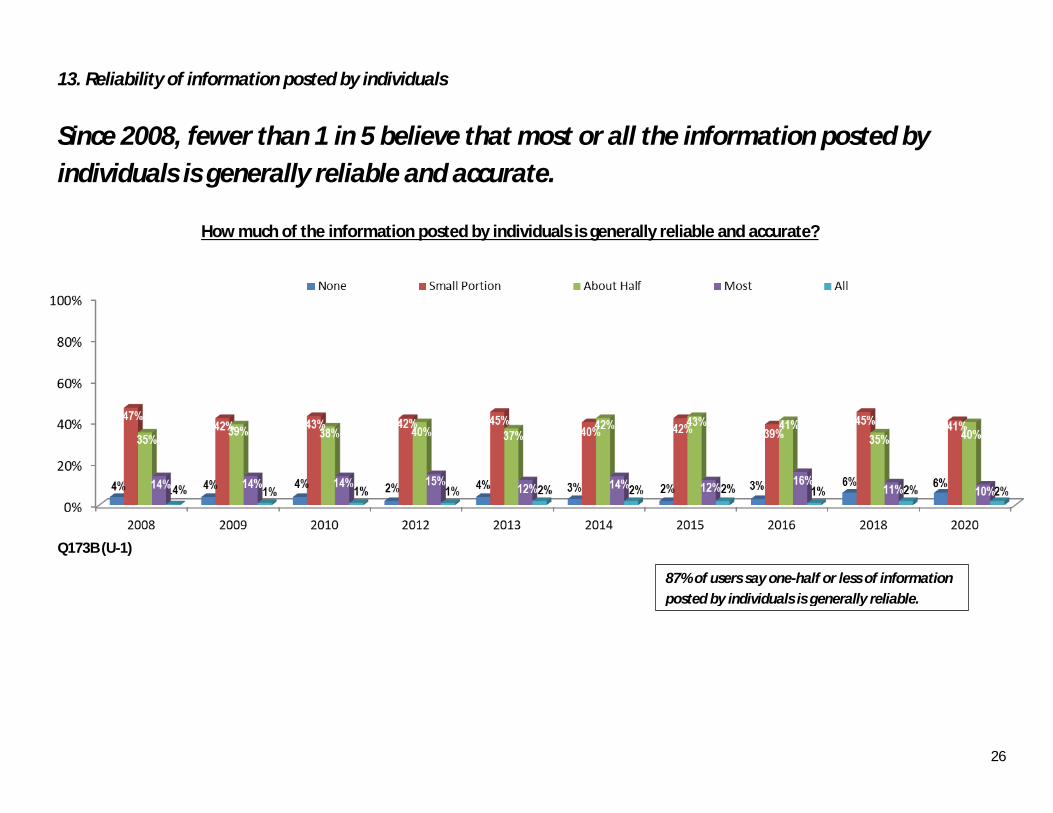
13. Reliability of information posted by individuals
Since 2008, fewer than 1 in 5 believe that most or all the information posted by
individuals is generally reliable and accurate.
How much of the information posted by individuals is generally reliable and accurate?
Q173B (U-1)
87% of users say one-half or less of information
posted by individuals is generally reliable.

27
14. Reliability of information on government websites
The perceived reliability and accuracy of government websites is in a three-year
decline, with a significant drop in 2020.
How much of information on government websites is generally reliable and accurate?
Q173 (U-1)
Perceived reliability of information on
government websites is at all-time low; now
only 43% say most or all government
information online is reliable.

28
15. Reliability of information on websites with strong political views
The perceived reliability and accuracy of websites with strong political views is low.
How much of information found on websites with strong political views,
such as HuffPost, Breitbart, Slate, and Drudge Report, is generally reliable and accurate?
Q173D (U-1)
Only 16% say most or all information on
websites with strong political views is reliable.

29
16. Views about mainstream media
Almost a third of Americans say mainstream media is “the enemy of the people.”
Mainstream media is the enemy of the people
Q176A
42% disagree that mainstream media is the
enemy of the people.

30
17. Views about “fake news”
Thirty percent of Americans believe that concerns about fake news are overblown.
Concerns about fake news are overblown
Q176B
Half of Americans are concerned about fake news,
up 10 percentage points since 2018.

31
18. The news media’s role in politics
A large but declining percentage have faith in the news media’s role in politics.
Mainstream news media have an even more important role to play in today’s political environment
Q176C (agree/disagree)
62% say media has important role in politics,
down from 71%.

32
19. Government regulation of Facebook and Twitter
Support increases slightly for government regulation of Facebook and Twitter.
Facebook and Twitter need to be regulated by the government
Q176D (U-1)
A small but notable percentage (24%) say
Facebook and Twitter should be government
regulated, up from 20% in 2018.

33
20. Self-regulation of social media sites
Support declines for self-regulation of social media sites.
Rather than government regulation, social media channels need to regulate themselves more
to protect us from fake news
Q176E (U-1)
Compared to those who believe in government
regulation (see previous question), a much higher
percentage (66%) agrees that social media should
regulate themselves – down from 72%.
34
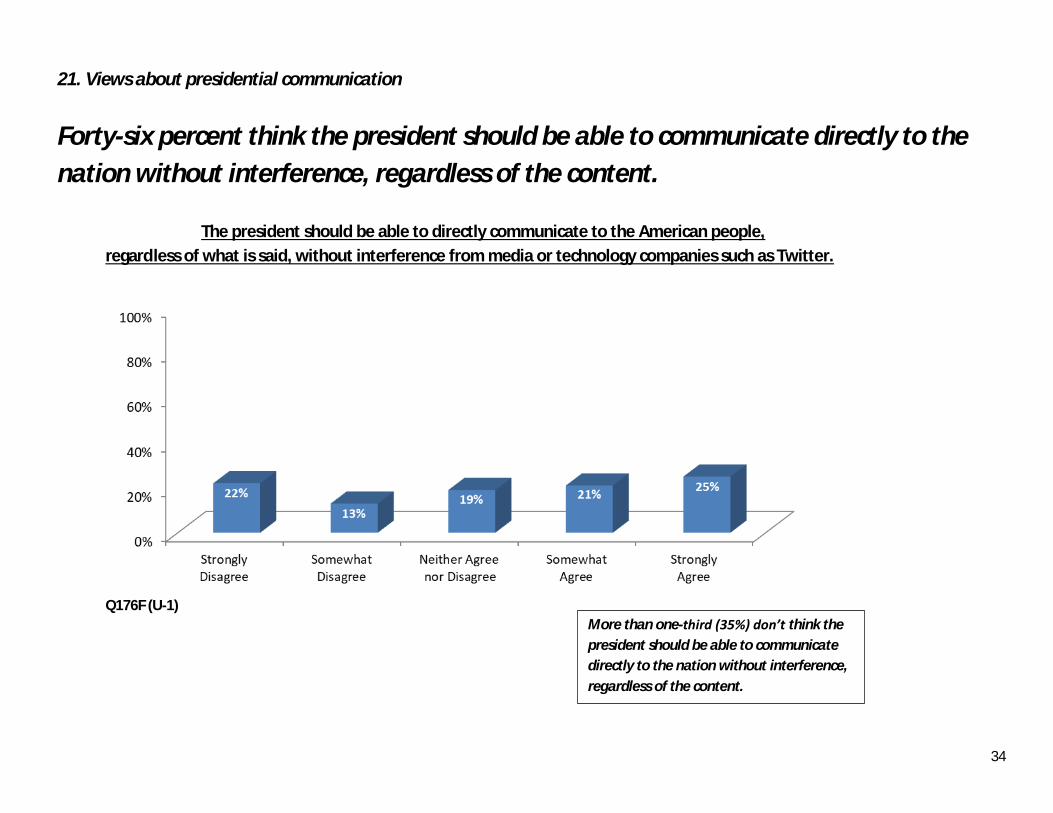
21. Views about presidential communication
Forty-six percent think the president should be able to communicate directly to the
nation without interference, regardless of the content.
The president should be able to directly communicate to the American people,
regard less of what is said, without interference from media or technology companies such as Twitter.
Q176F (U-1)
More than one-third (35%) don’t think the
president should be able to communicate
directly to the nation without interference,
regardless of the content.

35
22. Communication technologies and their impact on the world
Belief that communication technology makes the world a better place
continues to weaken.
Overall, do you think that communications technology such as the internet, mobile phones, and tablets
have made the world a better place, a worse place, or neither better nor worse?
Q180 (S-1)
Those who say communication technology makes the
world a better place is near the all-time low (48%).

36
23. The internet and political power
Belief in political empowerment through the internet increased from 2008 to 2015,
but has stabilized since.
Do you think by using the internet, people like you can have more political power?
Q190A (U-1)
Agreement that the internet is a tool for
political power continues at 40+ percent
for fifth straight study (now 43%).
37
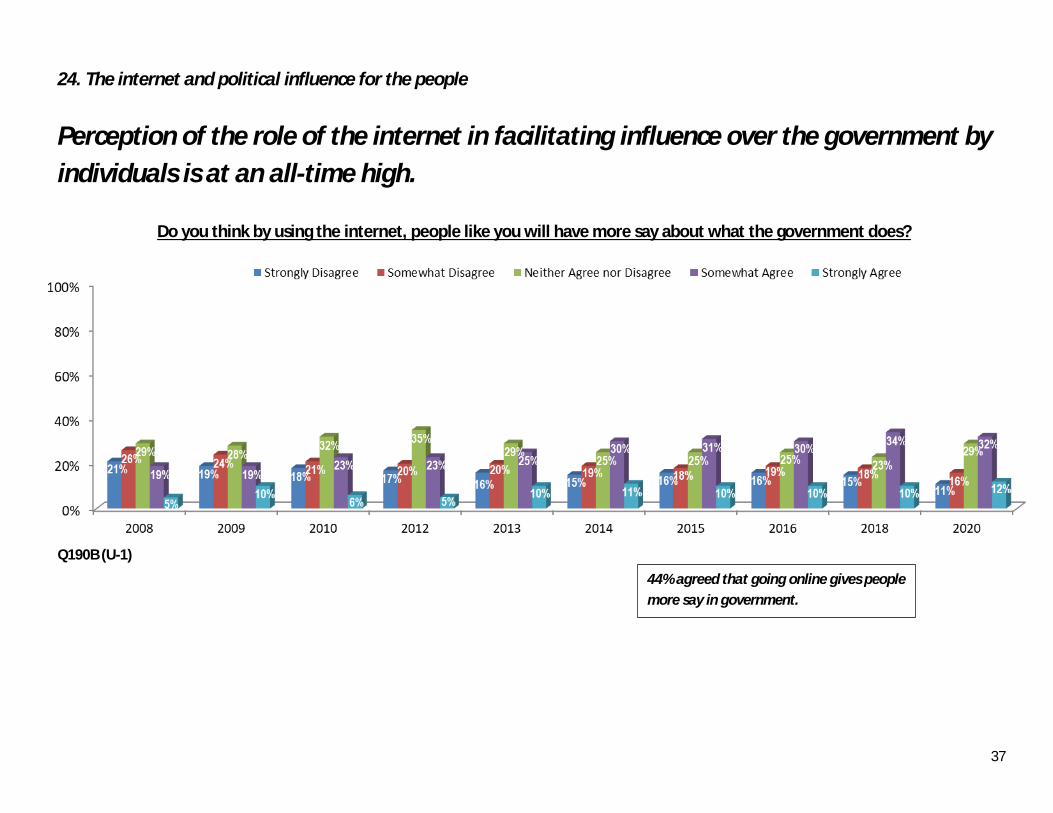
24. The internet and political influence for the people
Perception of the role of the internet in facilitating influence over the government by
individuals is at an all-time high.
Do you think by using the internet, people like you will have more say about what the government does?
Q190B (U-1)
44% agreed that going online gives people
more say in government.

38
25. The internet’s role in helping people understand politics
There has been a slight decline in belief about the power of the internet as a tool for
understanding politics.
Do you think by using the internet, people like you can better understand politics?
Q190C (U-1)
63% say the internet can help people
better understand politics.
39
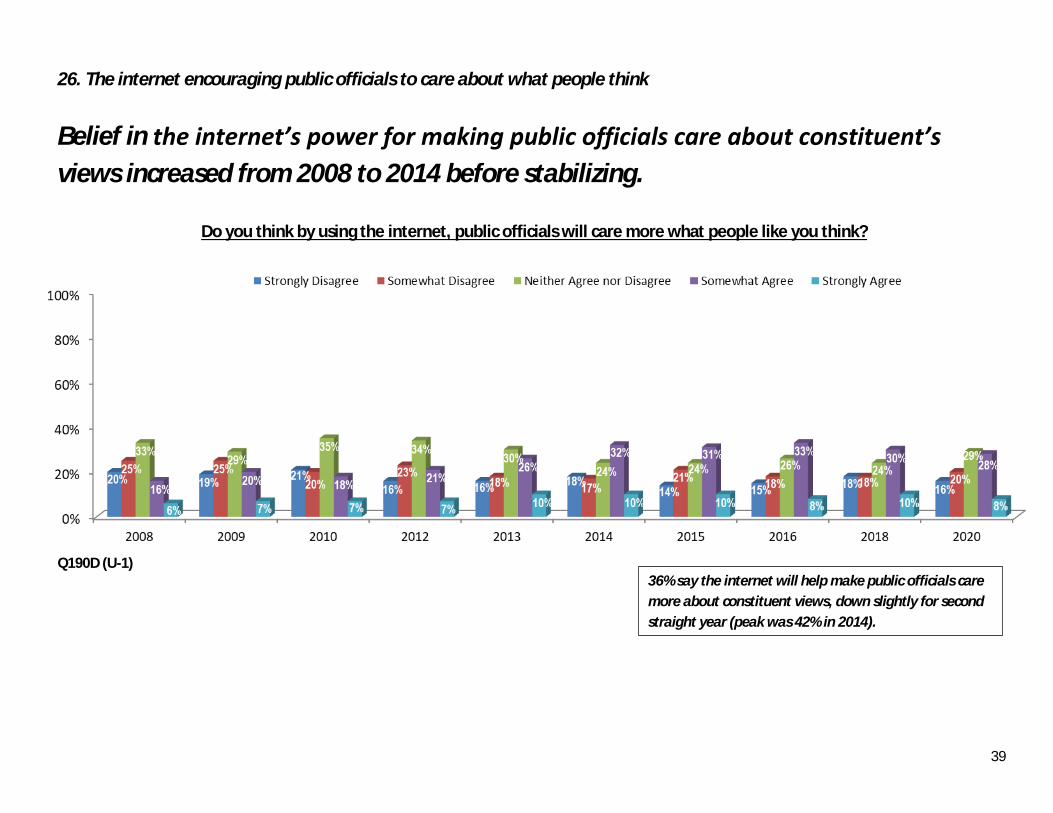
26. The internet encouraging public officials to care about what people think
Belief in the internet’s power for making public officials care about constituent’s
views increased from 2008 to 2014 before stabilizing.
Do you think by using the internet, public officials will care more what people like you think?
Q190D (U-1)
36% say the internet will help make public officials care
more about constituent views, down slightly for second
straight year (peak was 42% in 2014).

40
27. Comfort in expressing views about politics
A majority of people (for all but one year) are comfortable expressing political views
in general.
In general, I feel comfortable saying whatever I think about politics
Q195A (U-1)
56% said they are comfortable expressing their views
about politics.
41
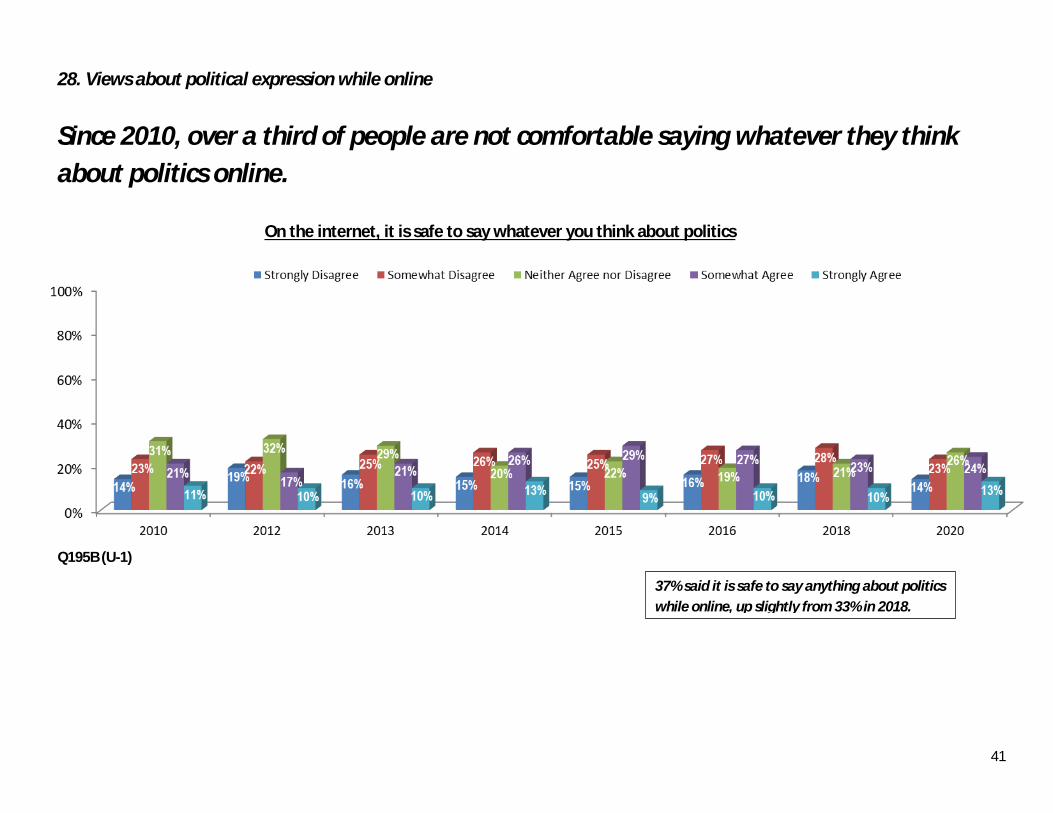
28. Views about political expression while online
Since 2010, over a third of people are not comfortable saying whatever they think
about politics online.
On the internet, it is safe to say whatever you think about politics
Q195B (U-1)
37% said it is safe to say anything about politics
while online, up slightly from 33% in 2018.

42
29. Criticizing the government while online
A large percentage agree that criticizing the government online is OK.
People should be free to criticize their government on the internet
Q195C (U-1)
More than three-quarters (78%) said that people should
be free to criticize the government while online.

43
30. Views about expressing extreme ideas on the internet
Since 2013, a majority of people believe it is ok to express extreme ideas online.
It is okay for people to express their ideas on the internet, even if they are extreme
Q195D (U-1)
55% agree that expressing extreme ideas online is OK.
44
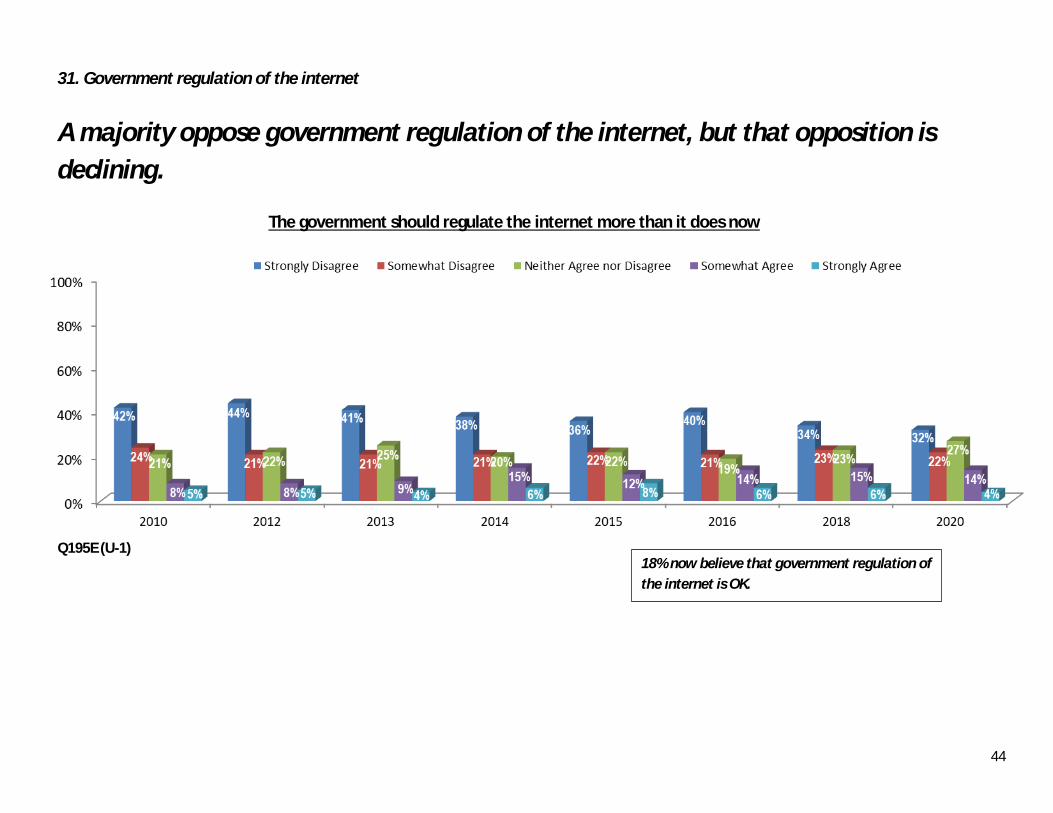
31. Government regulation of the internet
A majority oppose government regulation of the internet, but that opposition is
declining.
The government should regulate the internet more than it does now
Q195E (U-1)
18% now believe that government regulation of
the internet is OK.
45
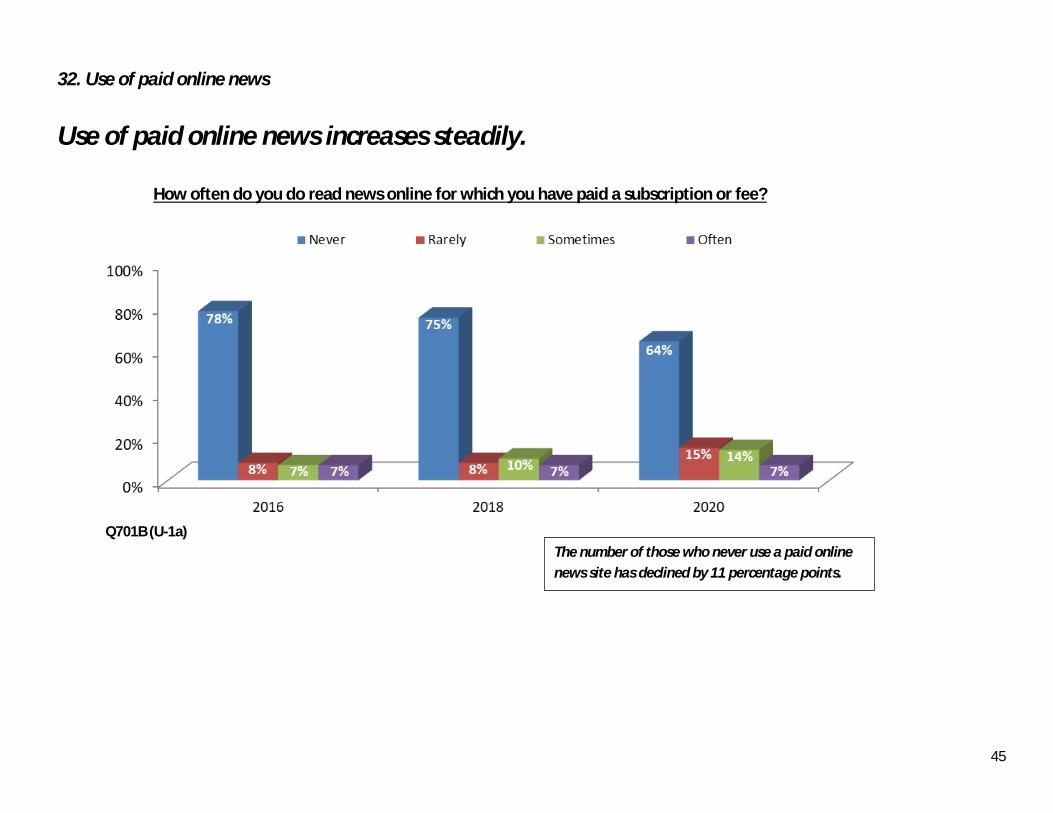
32. Use of paid online news
Use of paid online news increases steadily.
How often do you do read news online for which you have paid a subscription or fee?
Q701B (U-1a)
The number of those who never use a paid online
news site has declined by 11 percentage points.

46
33. Online music subscriptions
Subscribing to paid music online is increasing.
How often do you do listen to music online for which you have paid a subscription or fee?
Q701B (U-1g)
Use of music subscription sites jumps to 21%,
up from 13% in 2018.
47
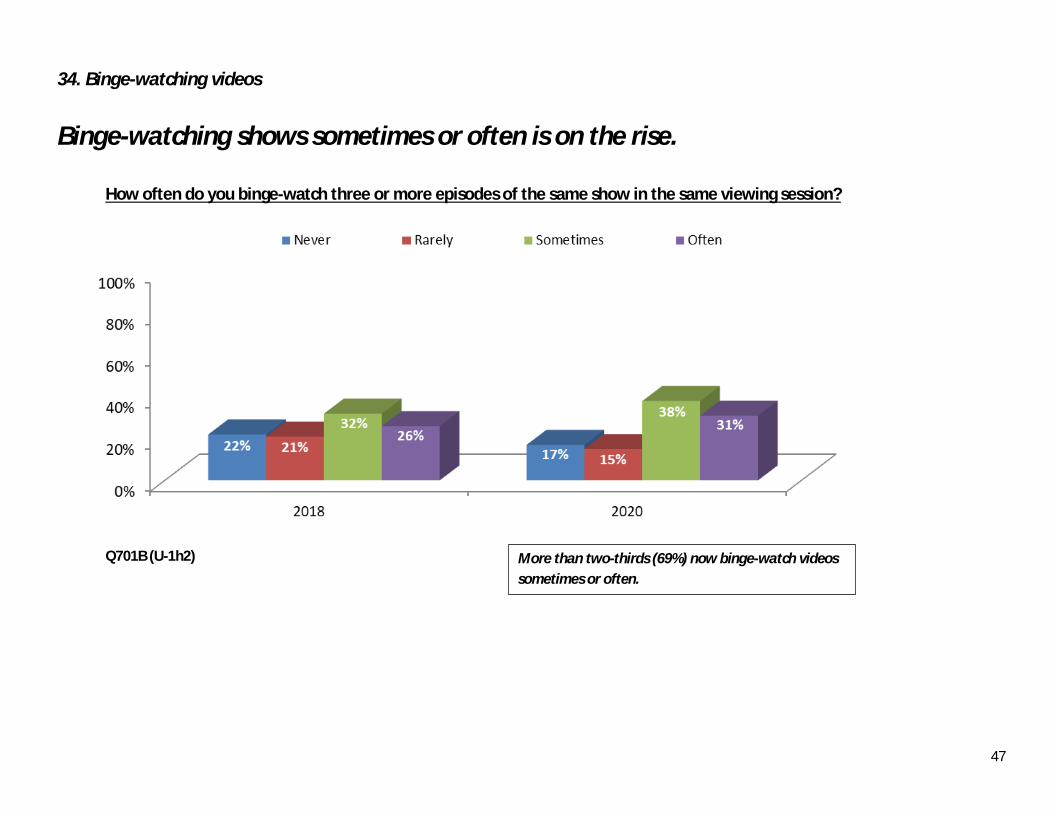
34. Binge-watching videos
Binge-watching shows sometimes or often is on the rise.
How often do you binge-watch three or more episodes of the same show in the same viewing session?
Q701B (U-1h2)
More than two-thirds (69%) now binge-watch videos
sometimes or often.

48
35. Watching videos as a social experience
Almost a quarter of people schedule and view a show at the same time as their
friends to share the experience.
How often do you schedule the watching of a show around the same time
as your friends elsewhere so you can share the experience?
Q701B (U-1j2)
Watching videos as a shared social experience with friends
elsewhere sometimes or often has increased to 23%, up
from 20% in 2018.

49
36. Videos and social media spoilers
More viewers watch new programs as soon as possible to avoid social media spoilers.
How often do you watch an original program as close to its first airing as possible
so that it is not spoiled by people telling you what happens on social media?
Q701B (U-1k2) Almost half of viewers (47%) sometimes or often watch a
new program as soon as possible after its premiere
specifically to avoid seeing spoilers on social media.
50
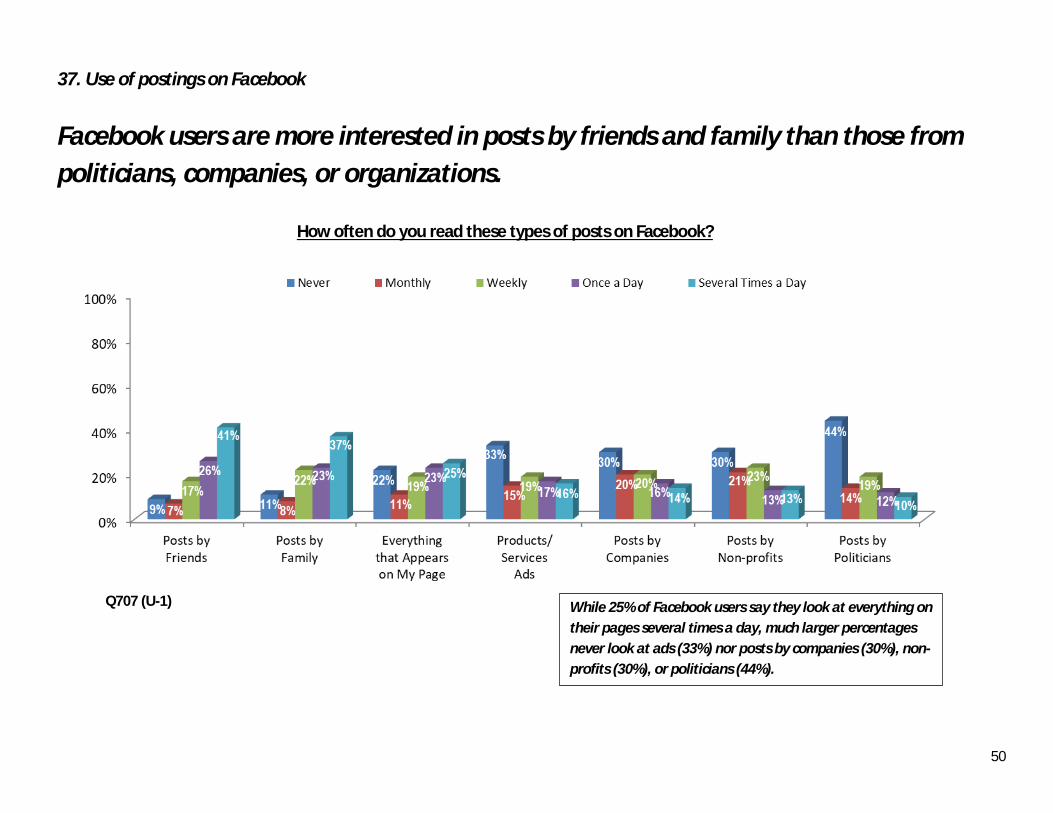
37. Use of postings on Facebook
Facebook users are more interested in posts by friends and family than those from
politicians, companies, or organizations.
How often do you read these types of posts on Facebook?
Q707 (U-1)
While 25% of Facebook users say they look at everything on
their pages several times a day, much larger percentages
never look at ads (33%) nor posts by companies (30%), non-
profits (30%), or politicians (44%).
51
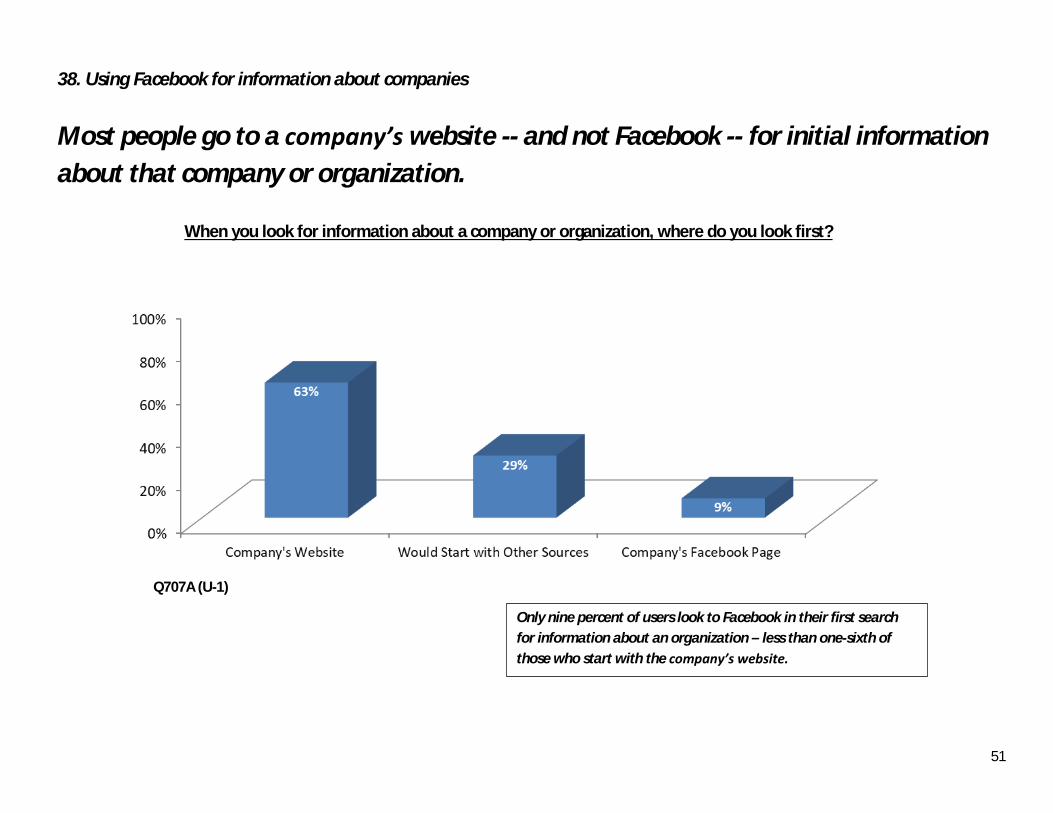
38. Using Facebook for information about companies
Most people go to a company’s website -- and not Facebook -- for initial information
about that company or organization.
When you look for information about a company or organization, where do you look first?
Q707A (U-1)
Only nine percent of users look to Facebook in their first search
for information about an organization – less than one-sixth of
those who start with the company’s website.

52
Consumer Behavior

53
39. Buying online
Online purchasing frequency increases for nine years in a row; now more than
40 percent are buying online at least weekly.
On average, how often do you use the internet to buy things online?
Q708B (U-1)
Daily purchasing online increases for third year in a row.

54
40. Banking online
Most Americans bank or pay bills online.
On average, how often do you use the internet to pay bills online or do banking?
Q708C (U-1)
13% pay bills or bank online at least daily, while those
who never bank online drops to a new low.
55
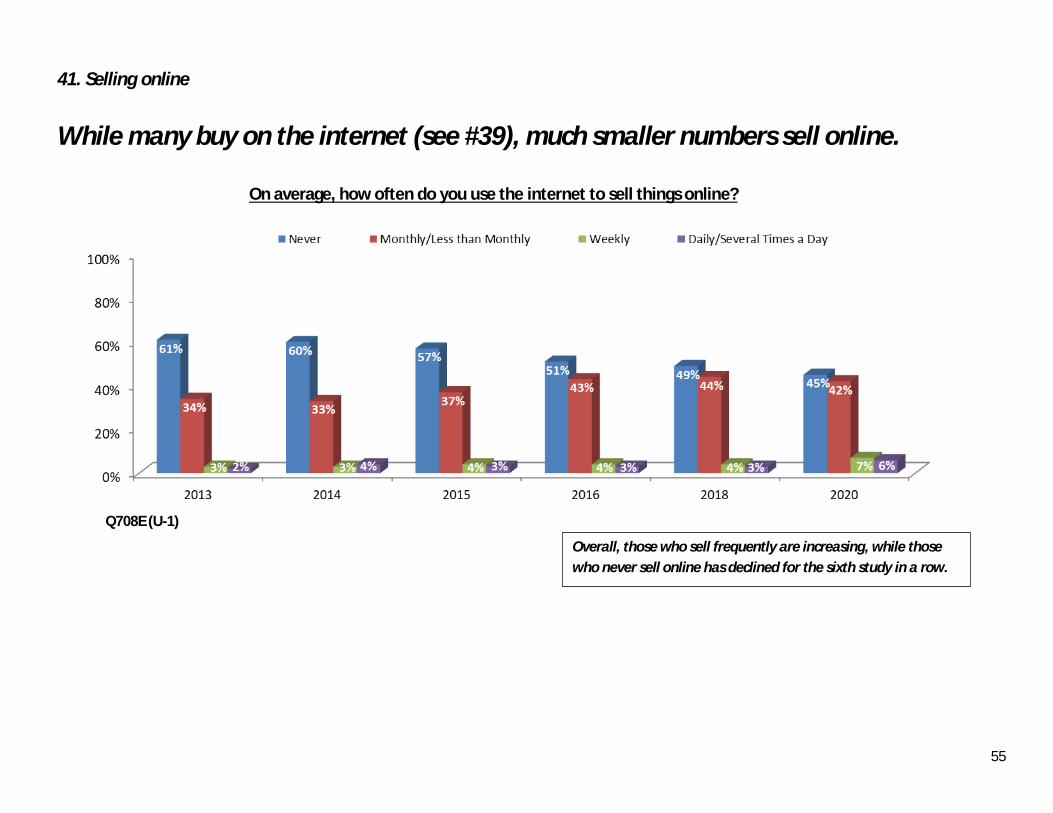
41. Selling online
While many buy on the internet (see #39), much smaller numbers sell online.
On average, how often do you use the internet to sell things online?
Q708E (U-1)
Overall, those who sell frequently are increasing, while those
who never sell online has declined for the sixth study in a row.

56
42. Products not bought online
While more than half of internet users say there are certain products they will not buy
online, this view is decreasing.
Are there products you will not buy online?
Q812
Top 5 products that users will not buy online
(47.6% ) Food
(16.7%) Clothing
(8.5%) Appliances/Furniture
(7.9%) Cars/motorcycles
(4.5%) Hygiene/personal care

57
43. Products not bought online (men vs. women)
Men are slightly more resistant than women about buying some products online.
Are there products you will not buy online? (Men vs. Women)
Q812 (G-2)
Resistance among women to buying specific products
online declines by 30 percentage points since 2018.
58
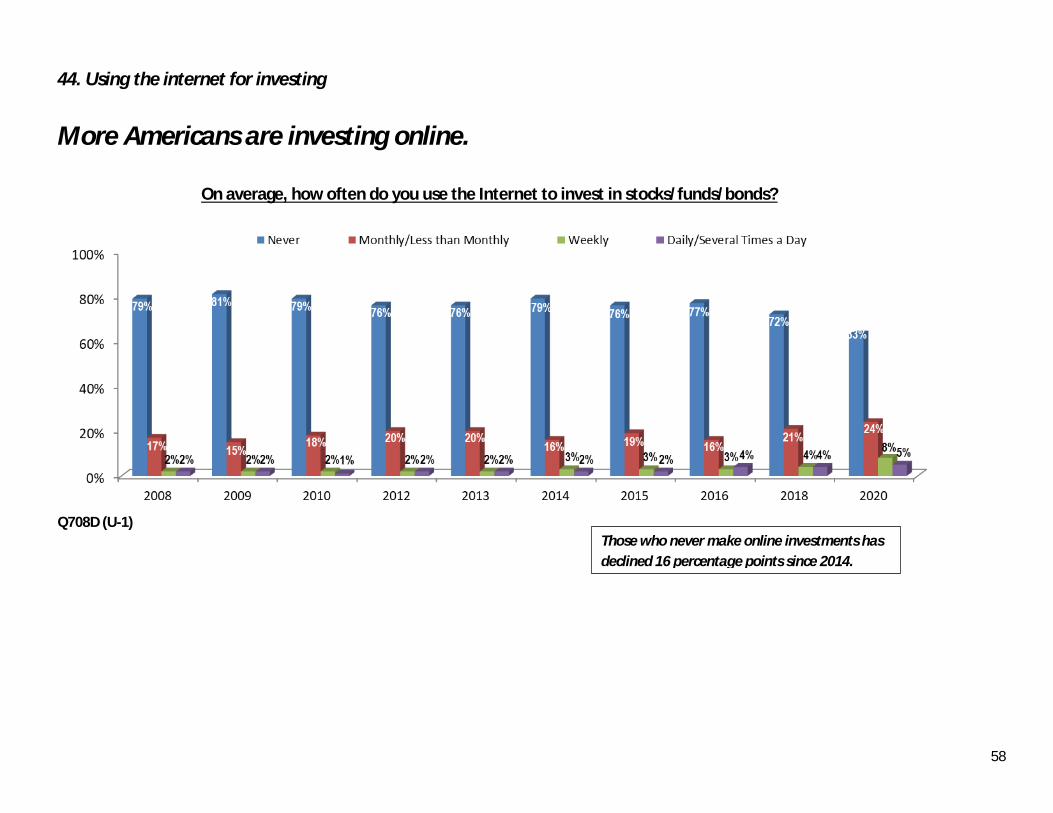
44. Using the internet for investing
More Americans are investing online.
On average, how often do you use the Internet to invest in stocks/funds/bonds?
Q708D (U-1) Those who never make online investments has
declined 16 percentage points since 2014.

59
Social Effects

60
45. Privacy violated online
Most have not had their privacy violated online, but an increasing number reports
privacy violations.
In the past year, have you had your privacy violated online?
If so, how much of a problem was this?
Q842A (U-1)
Close to 30% have had privacy violated online (28%) –
double the number from 2016.

61
46. Consequences of privacy violated online
Privacy violations result in a variety of personal and psychological consequences.
What were the consequences of this privacy violation?
Q842B (U-1) Multiple responses possible
Almost one-third of privacy violations (32%) lead
to financial implications or impersonation.

62
47. Privacy of personal information: private companies tracking online behavior
Overall concerns remain high about the privacy of personal information because of
companies tracking online.
How concerned would you be about the privacy of your personal information
because of the ability of companies to track your online behavior?
Q843 (U-1)
Almost all internet users (91%) express some level of concern
about privacy because of companies tracking their behavior
online.
63
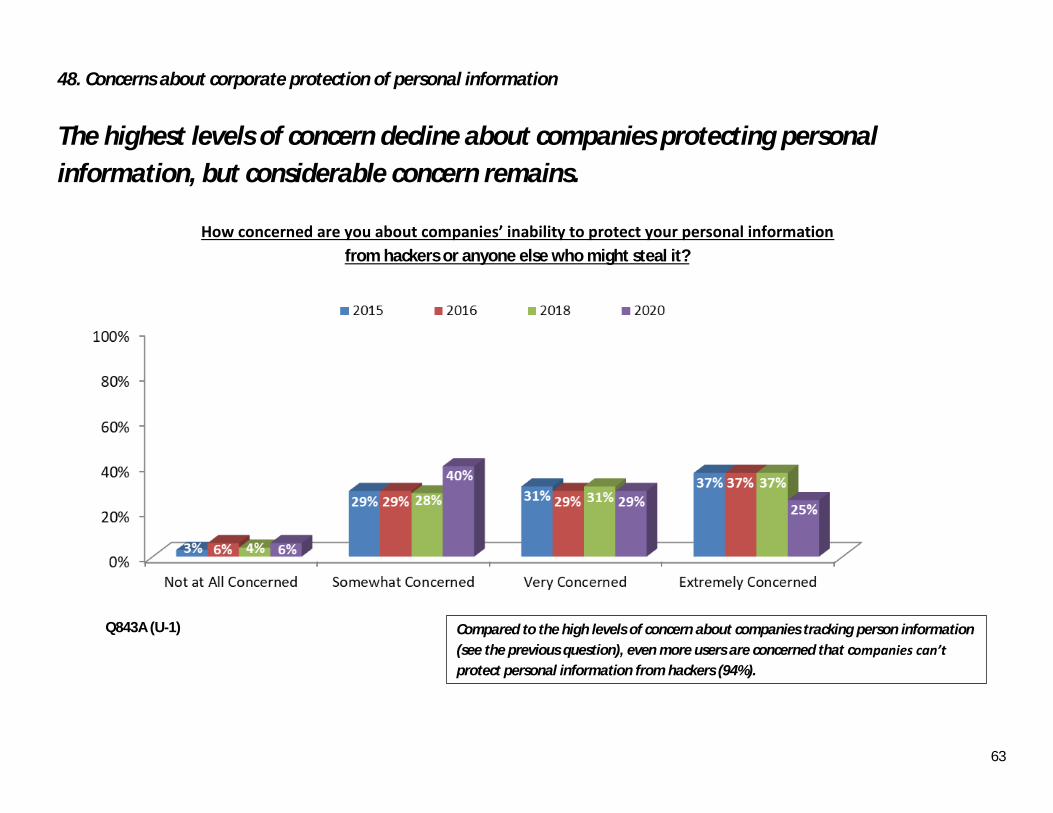
48. Concerns about corporate protection of personal information
The highest levels of concern decline about companies protecting personal
information, but considerable concern remains.
How concerned are you about companies’ inability to protect your personal information
from hackers or anyone else who might steal it?
Q843A (U-1)
Compared to the high levels of concern about companies tracking person information
(see the previous question), even more users are concerned that companies can’t
protect personal information from hackers (94%).

64
49. Personal privacy online: concerns about government violation
Concerns increase about government violating privacy online.
I am concerned governments are violating my privacy online
Q844 (U-2)
Now 59% are concerned about government violating their
privacy -- a new high for the studies.

65
50. Personal privacy online: concerns about corporate violation
High levels of concern remain about corporate violations of personal privacy.
I am concerned corporations are violating my privacy online
Q844 (U-3)
Concerns about corporate violation of privacy are as
high as concerns about government violations (see
the previous question) and have now reached their
highest levels in the studies (59%).

66
51. Personal privacy online: concerns about individuals
The highest percentages thus far in the Digital Future Studies are concerned about
individuals violating personal privacy online.
I am concerned other people are violating my privacy online
Q844 (U-4)
60% are concerned that individuals may violate
their personal privacy.
67
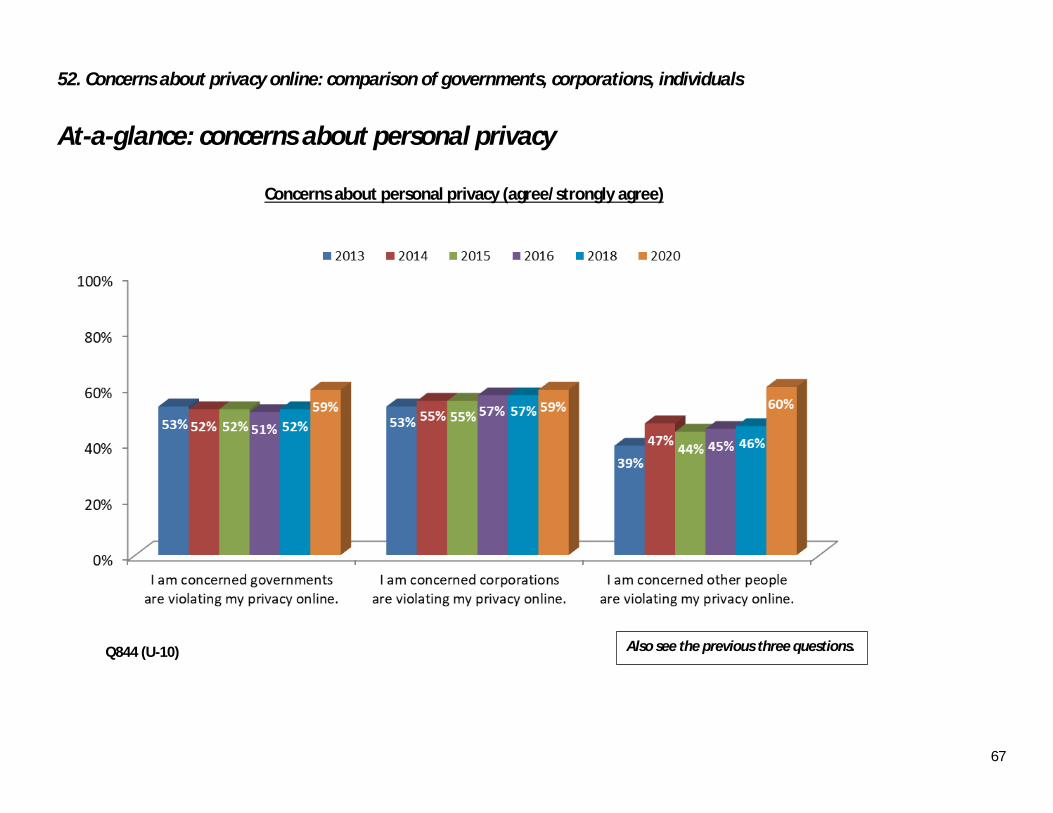
52. Concerns about privacy online: comparison of governments, corporations, individuals
At-a-glance: concerns about personal privacy
Concerns about personal privacy (agree/strongly agree)
Q844 (U-10)
Also see the previous three questions.

68
53. Protecting personal privacy online
More than two thirds of people actively protect their personal privacy online.
I actively protect my personal privacy online
Q844 (U-5)
After reaching a peak of 73% in 2018, now 67% say
they actively protect their personal privacy online.

69
54. Online privacy during the coronavirus pandemic
Almost one-third would trade their personal privacy for better health protection
during the coronavirus pandemic.
I would allow the government or technology companies to track my locations during the coronavirus pandemic
if it would protect the health of my family and me
Q844 (U-8)
32% would allow the government or technology companies to track their
behavior in return for better health protection during the COVID-19 pandemic.
70
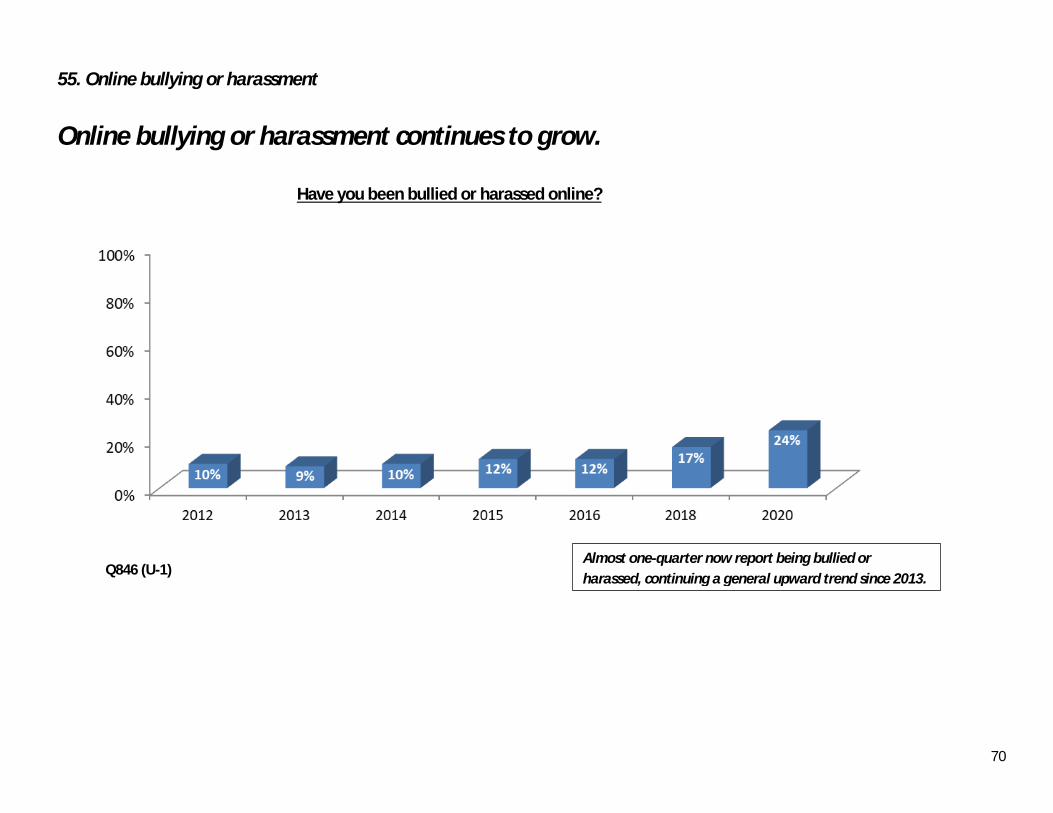
55. Online bullying or harassment
Online bullying or harassment continues to grow.
Have you been bullied or harassed online?
Q846 (U-1)
Almost one-quarter now report being bullied or
harassed, continuing a general upward trend since 2013.

71
56. Online bullying or harassment: impact
Bullying or harassment online is growing, and nearly half report
moderate to serious effects.
How severe was the bullying or harassment?
Q847 (U-1)
49% say the bullying or harassment they
experienced was moderate or serious.
72
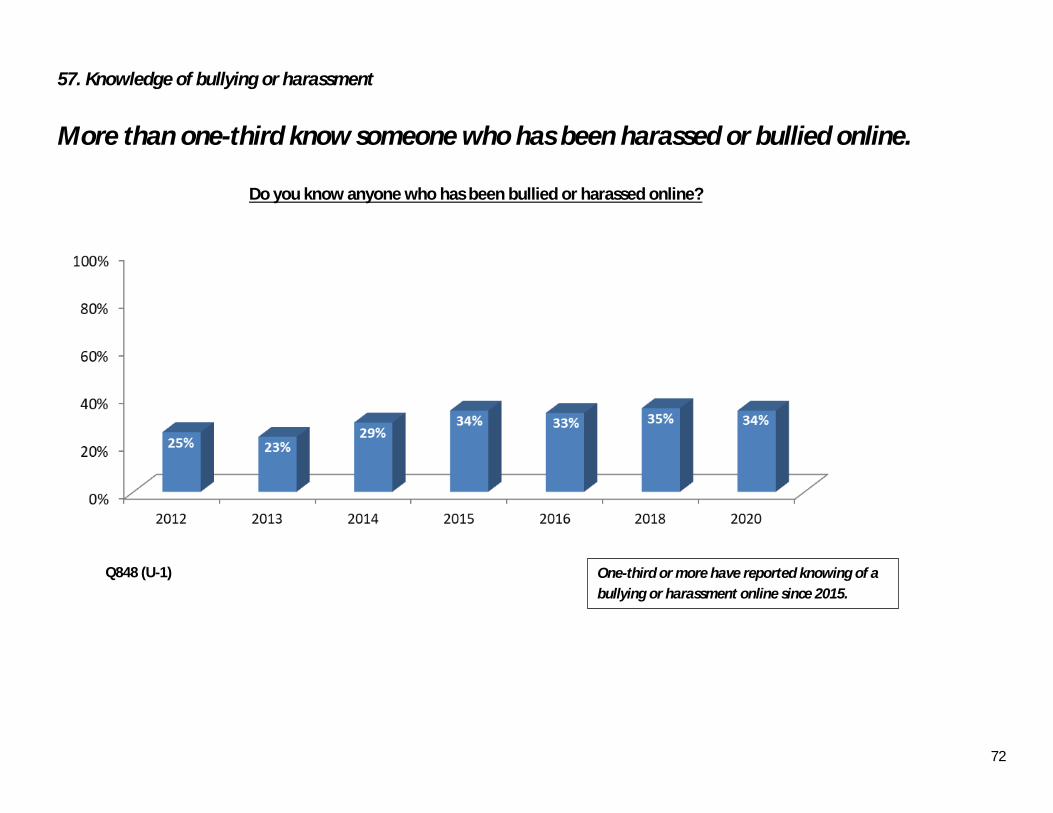
57. Knowledge of bullying or harassment
More than one-third know someone who has been harassed or bullied online.
Do you know anyone who has been bullied or harassed online?
Q848 (U-1)
One-third or more have reported knowing of a
bullying or harassment online since 2015.
73
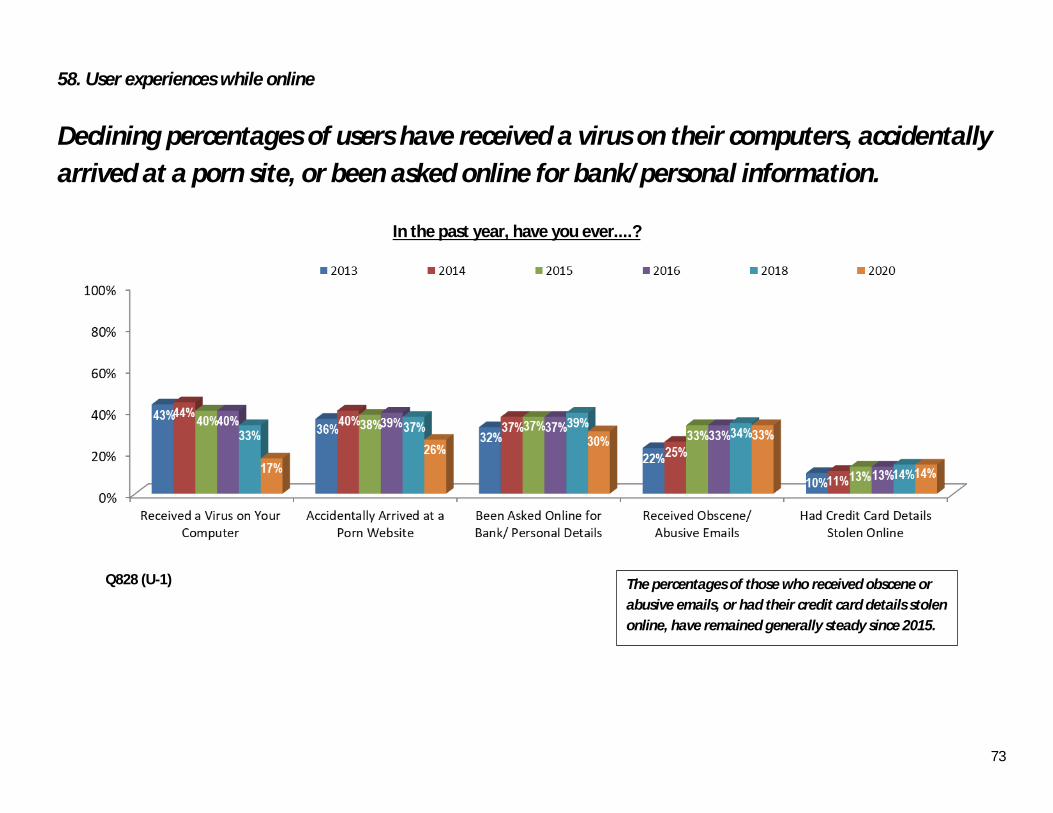
58. User experiences while online
Declining percentages of users have received a virus on their computers, accidentally
arrived at a porn site, or been asked online for bank/personal information.
In the past year, have you ever....?
Q828 (U-1)
The percentages of those who received obscene or
abusive emails, or had their credit card details stolen
online, have remained generally steady since 2015.

74
59. Concerns about credit card security while buying on the internet
Sizeable but declining percentages of users are very or extremely concerned about
credit card security when buying online.
How concerned would you be about the security of your credit card or bank card information
when or if you ever bought something online?
Q830
The largest change is the percentage who reported
the lowest level of concern (somewhat concerned
now 54%).
75
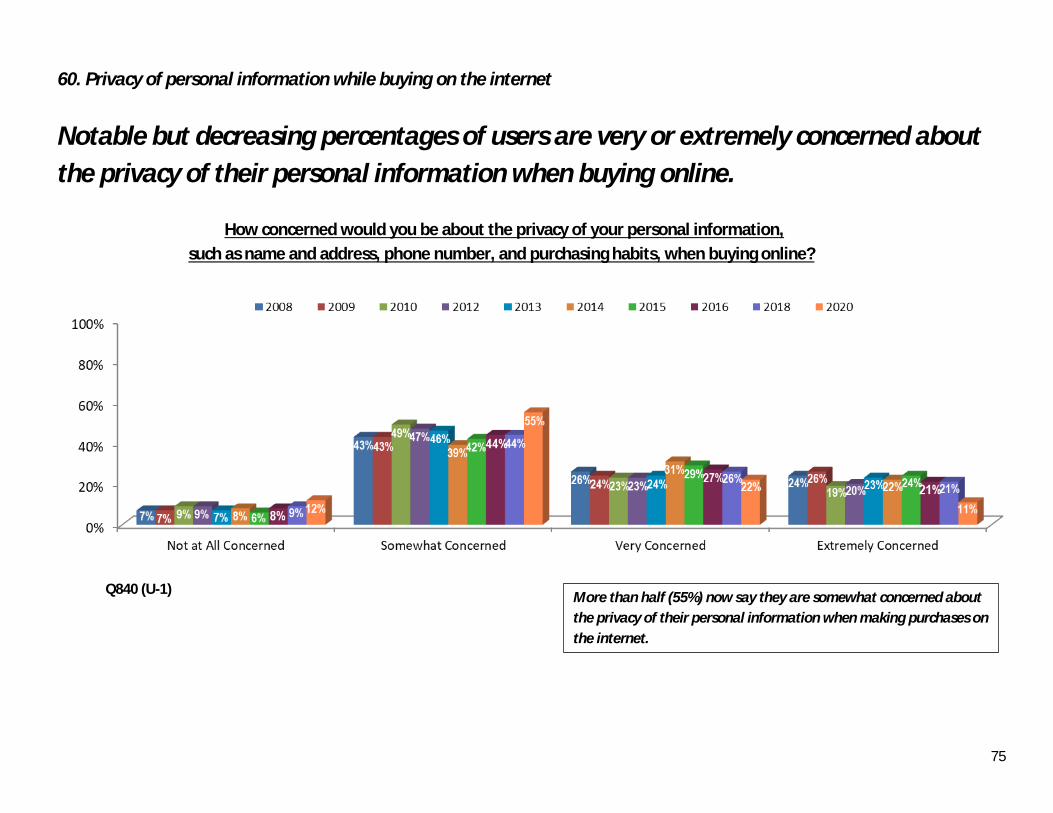
60. Privacy of personal information while buying on the internet
Notable but decreasing percentages of users are very or extremely concerned about
the privacy of their personal information when buying online.
How concerned would you be about the privacy of your personal information,
such as name and address, phone number, and purchasing habits, when buying online?
Q840 (U-1)
More than half (55%) now say they are somewhat concerned about
the privacy of their personal information when making purchases on
the internet.
76
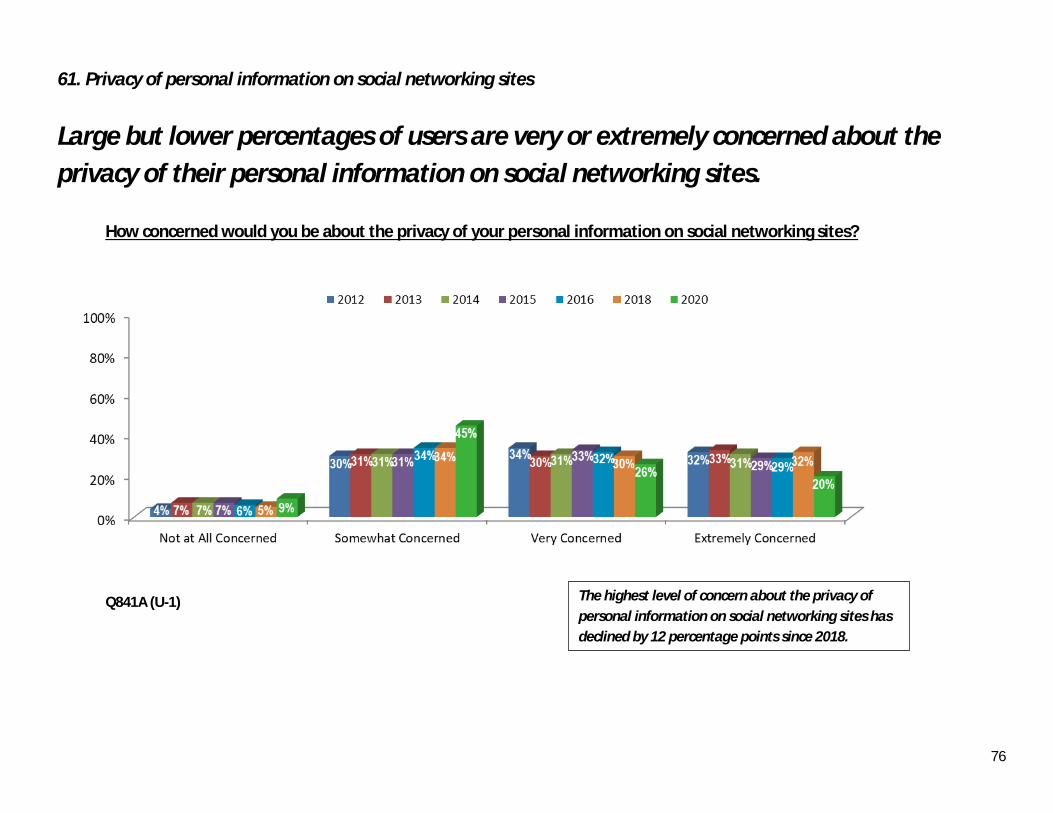
61. Privacy of personal information on social networking sites
Large but lower percentages of users are very or extremely concerned about the
privacy of their personal information on social networking sites.
How concerned would you be about the privacy of your personal information on social networking sites?
Q841A (U-1)
The highest level of concern about the privacy of
personal information on social networking sites has
declined by 12 percentage points since 2018.

77
62. Privacy of personal information: companies tracking online behavior
Fewer people are extremely concerned about the privacy of personal information
because of private companies tracking online behavior.
How concerned would you be about the privacy of your personal information
because of the ability of companies to track your online behavior?
Q843 (U-1)
As with #61, the percentage reporting the highest level of concern
has declined substantially – 10 percentage points lower.
78
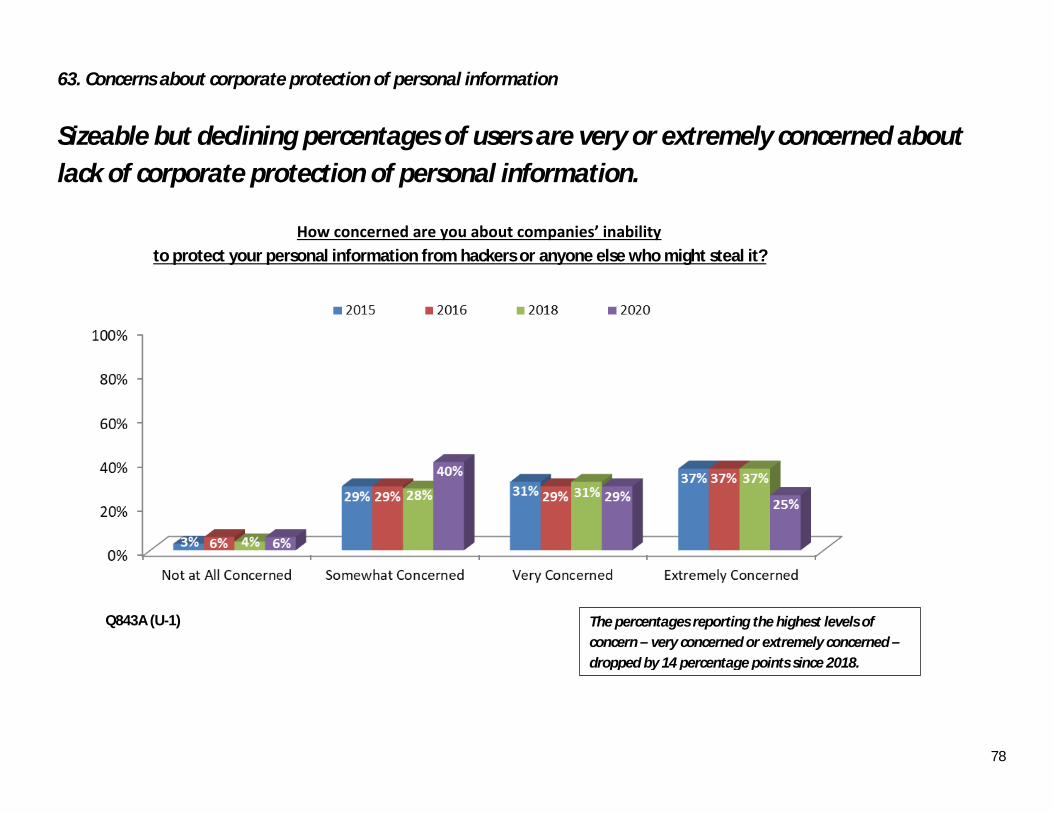
63. Concerns about corporate protection of personal information
Sizeable but declining percentages of users are very or extremely concerned about
lack of corporate protection of personal information.
How concerned are you about companies’ inability
to protect your personal information from hackers or anyone else who might steal it?
Q843A (U-1)
The percentages reporting the highest levels of
concern – very concerned or extremely concerned –
dropped by 14 percentage points since 2018.

79
64. Password access by parents to children’s social networking accounts
Only about half of parents can access their children’s social networking accounts.
Do you have password access to one or more of your children's social networking accounts, such as Facebook?
Q1104 (S-1)
Even as problems involving social networking have grown, the
percentage of parents who can access their children’s accounts
have stayed generally consistent since 2013.
80
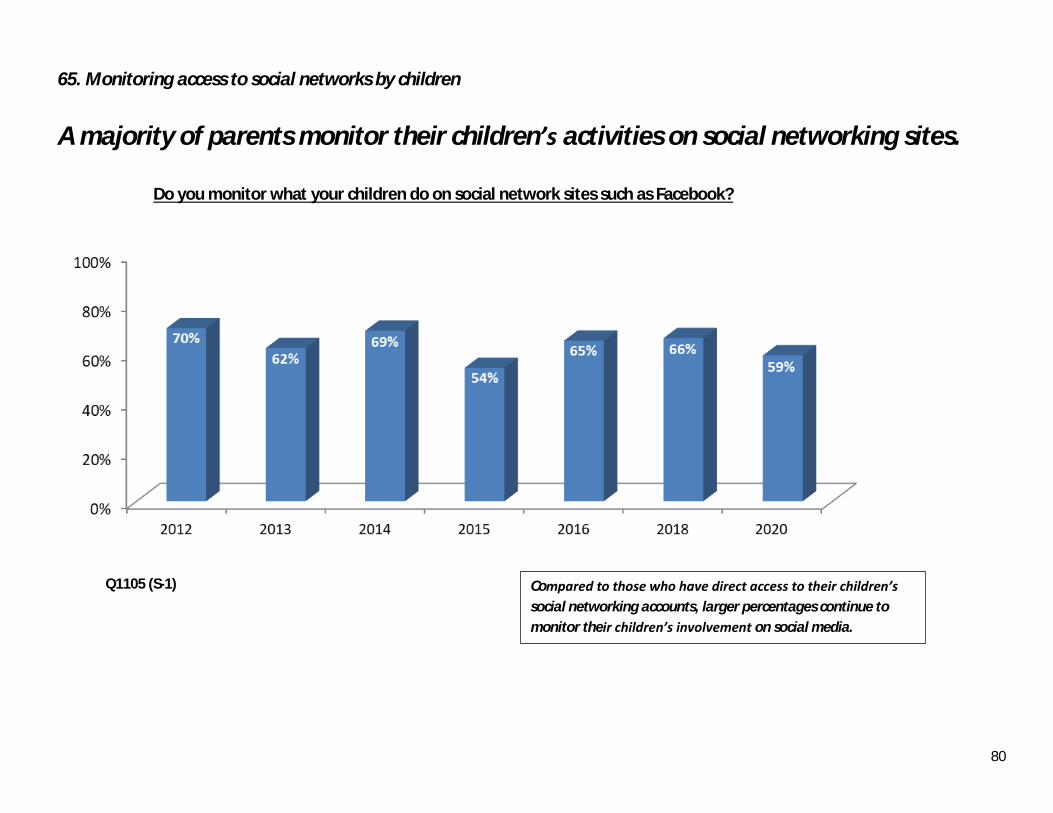
65. Monitoring access to social networks by children
A majority of parents monitor their children’s activities on social networking sites.
Do you monitor what your children do on social network sites such as Facebook?
Q1105 (S-1)
Compared to those who have direct access to their children’s
social networking accounts, larger percentages continue to
monitor their children’s involvement on social media.
81
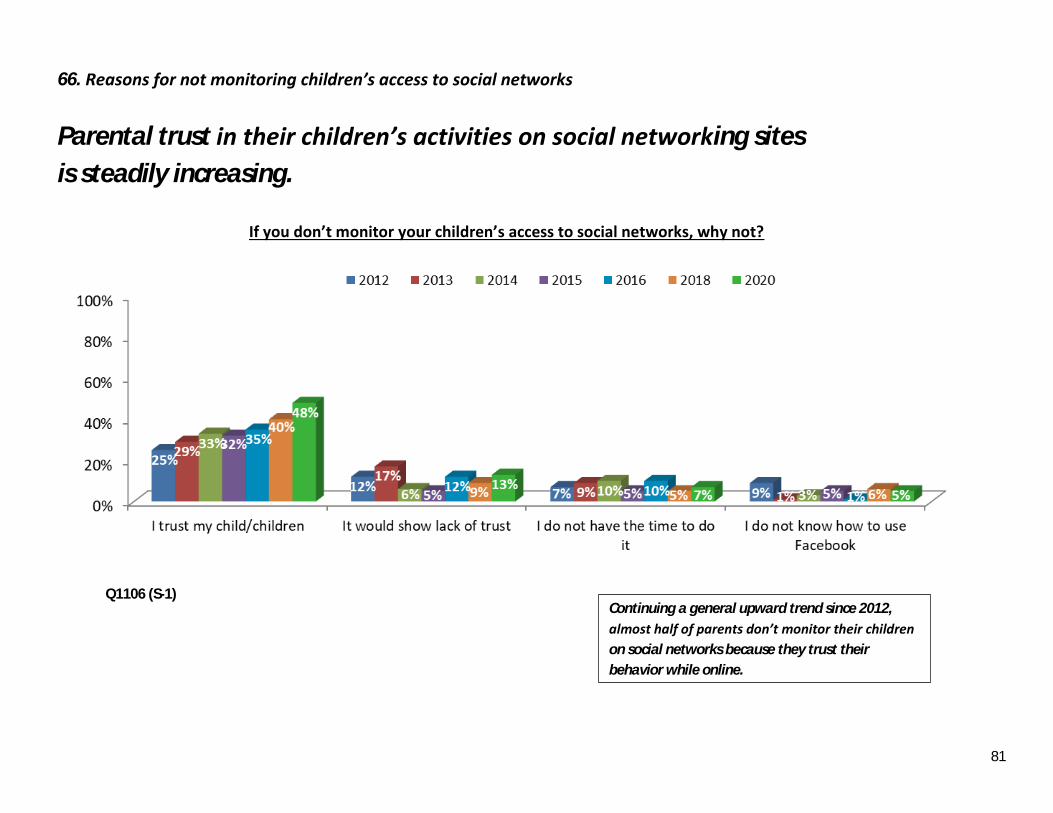
66. Reasons for not monitoring children’s access to social networks
Parental trust in their children’s activities on social networking sites
is steadily increasing.
If you don’t monitor your children’s access to social networks, why not?
Q1106 (S-1)
Continuing a general upward trend since 2012,
almost half of parents don’t monitor their children
on social networks because they trust their
behavior while online.

82
67. Appropriate age for mobile phones and Facebook accounts
Parental views about the appropriate age for children to have a mobile phone or a
Facebook account have been remarkably consistent since 2012.
At what age is it appropriate for a child to have a.....?
Q1136 (U-1)
Parents are willing to give children a mobile phone
a year earlier than a Facebook account.

83
68. Are you ignored because others spend too much time online?
The percentage of people who feel ignored by a household member spending too
much time online is declining.
Do you feel you are ignored because a household member spends too much time on the internet?
Q1020 (S-1)
Now more than half (51%) say they never feel ignored
by others who are online.
84
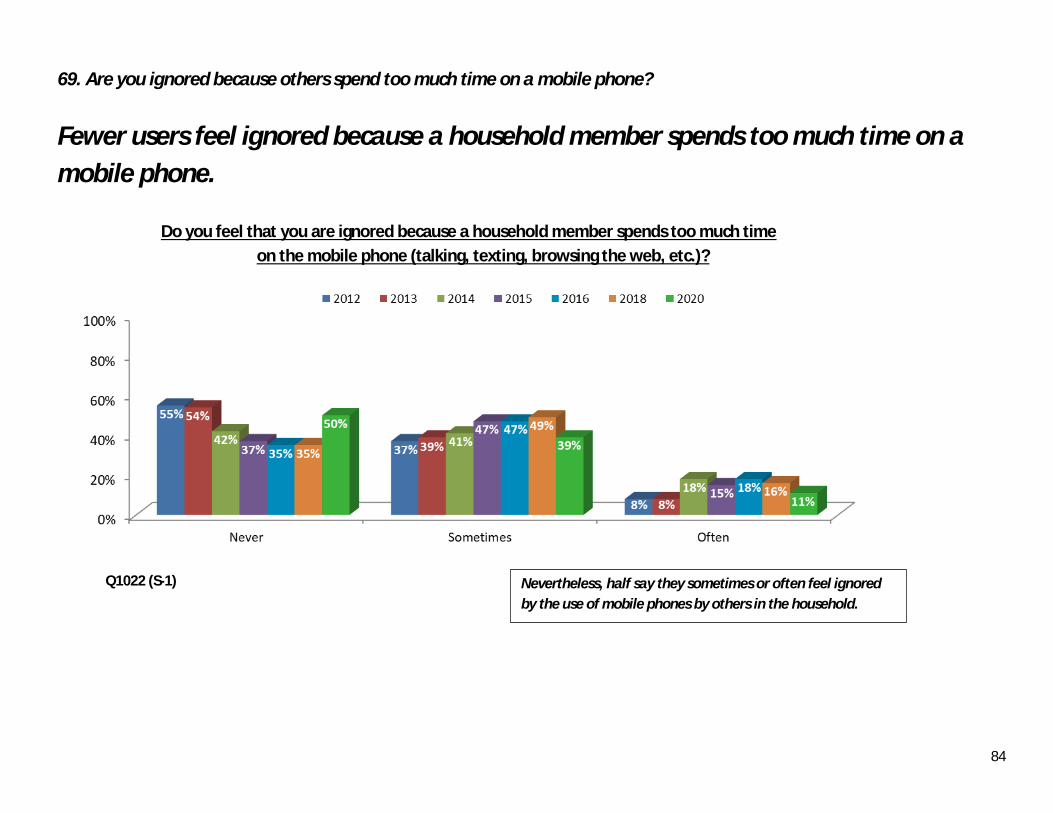
69. Are you ignored because others spend too much time on a mobile phone?
Fewer users feel ignored because a household member spends too much time on a
mobile phone.
Do you feel that you are ignored because a household member spends too much time
on the mobile phone (talking, texting, browsing the web, etc.)?
Q1022 (S-1)
Nevertheless, half say they sometimes or often feel ignored
by the use of mobile phones by others in the household.

85
Supplement 1: Center for the Digital Future at USC Annenberg
The Center for the Digital Future at USC Annenberg is a forum for the discussion and development of policy alternatives addressing the
leading issues in media and communication.
The Center conducts and facilitates research, courses, seminars, working groups, and conferences designed to have a major impact on
policy at the local, national, and international levels. It also provides a base for visiting scholars who are engaged in efforts to examine and
shape communication policy. The Center’s goals include using the vast intellectual resources of USC to deal with some of the most
important concerns of the day and to have a transforming effect on the issues.
The Center is based in the Annenberg School for Communication and Journalism at the University of Southern California. Until July 2004, it
was housed at UCLA in the Anderson Graduate School of Management.
In October 2000, the Center released its first report on the internet, the beginning of an international, long-term exploration of the impact
of the internet on society. This work is part of the World Internet Project, which is organized and coordinated by the Center; included in the
World Internet Project are the Center’s work and partner studies in countries in North America, Europe, South America, Asia, the Middle
East, Australasia, and Africa. The first comparative results from the World Internet Project were released in January 2004. The first
comprehensive International Report of the World Internet Project was released at the end of 2008, and the tenth in 2019.
Since the Center’s creation in September 1993, it has been awarded multi-million-dollar research grants from the National Science
Foundation and the U.S. Department of Defense, held numerous national and local conferences, conducted three nationwide surveys with
one of America’s leading news magazines, and established a strong national and international identity in media and communication
technology issues.
The Center for the Digital Future has become an internationally regarded policy studies center. The Center is committed to studying,
through a variety of prisms, the important communication issues that transform our lives.
For more information about the Center, visit www.digitalcenter.org.
86
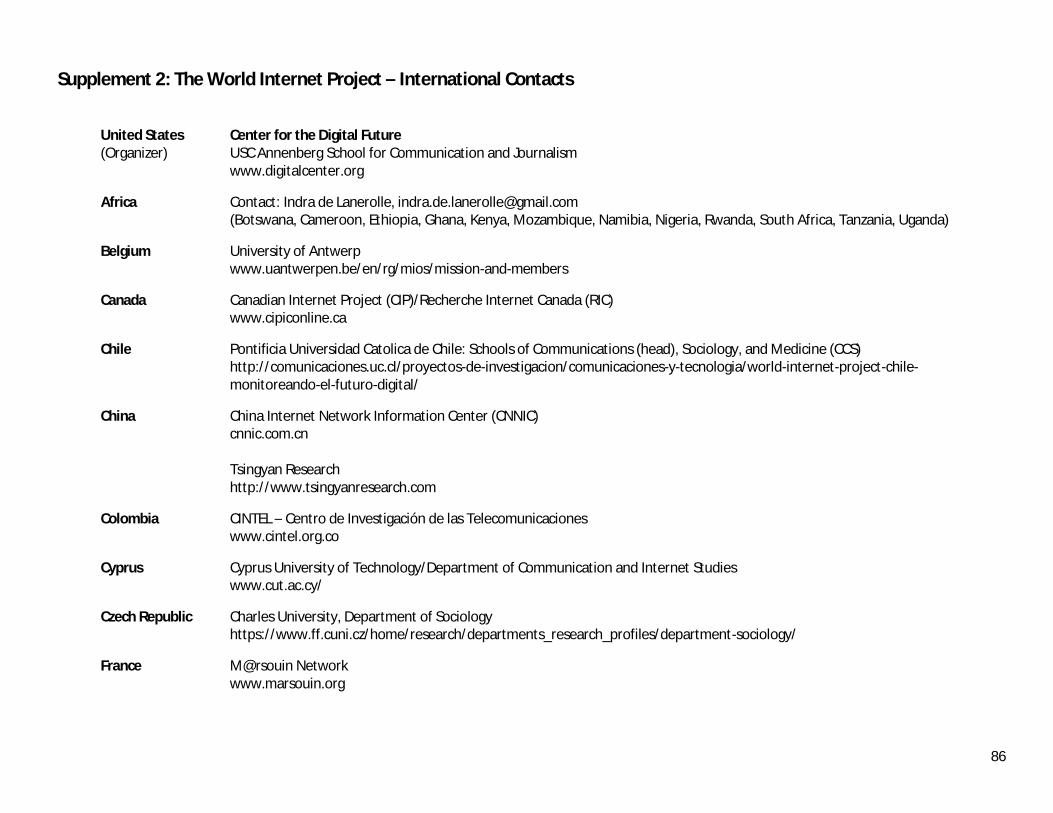
Supplement 2: The World Internet Project – International Contacts
United States Center for the Digital Future (Organizer) USC Annenberg School for Communication and Journalism www.digitalcenter.org
Africa Contact: Indra de Lanerolle, [email protected] (Botswana, Cameroon, Ethiopia, Ghana, Kenya, Mozambique, Namibia, Nigeria, Rwanda, South Africa, Tanzania, Uganda)
Belgium University of Antwerp www.uantwerpen.be/en/rg/mios/mission-and-members
Canada Canadian Internet Project (CIP)/Recherche Internet Canada (RIC) www.cipiconline.ca
Chile Pontificia Universidad Catolica de Chile: Schools of Communications (head), Sociology, and Medicine (CCS) http://comunicaciones.uc.cl/proyectos-de-investigacion/comunicaciones-y-tecnologia/world-internet-project-chile-
monitoreando-el-futuro-digital/
China China Internet Network Information Center (CNNIC) cnnic.com.cn
Tsingyan Research http://www.tsingyanresearch.com
Colombia CINTEL – Centro de Investigación de las Telecomunicaciones www.cintel.org.co
Cyprus Cyprus University of Technology/Department of Communication and Internet Studies www.cut.ac.cy/
Czech Republic Charles University, Department of Sociology https://www.ff.cuni.cz/home/research/departments_research_profiles/department-sociology/
France M@rsouin Network www.marsouin.org
87
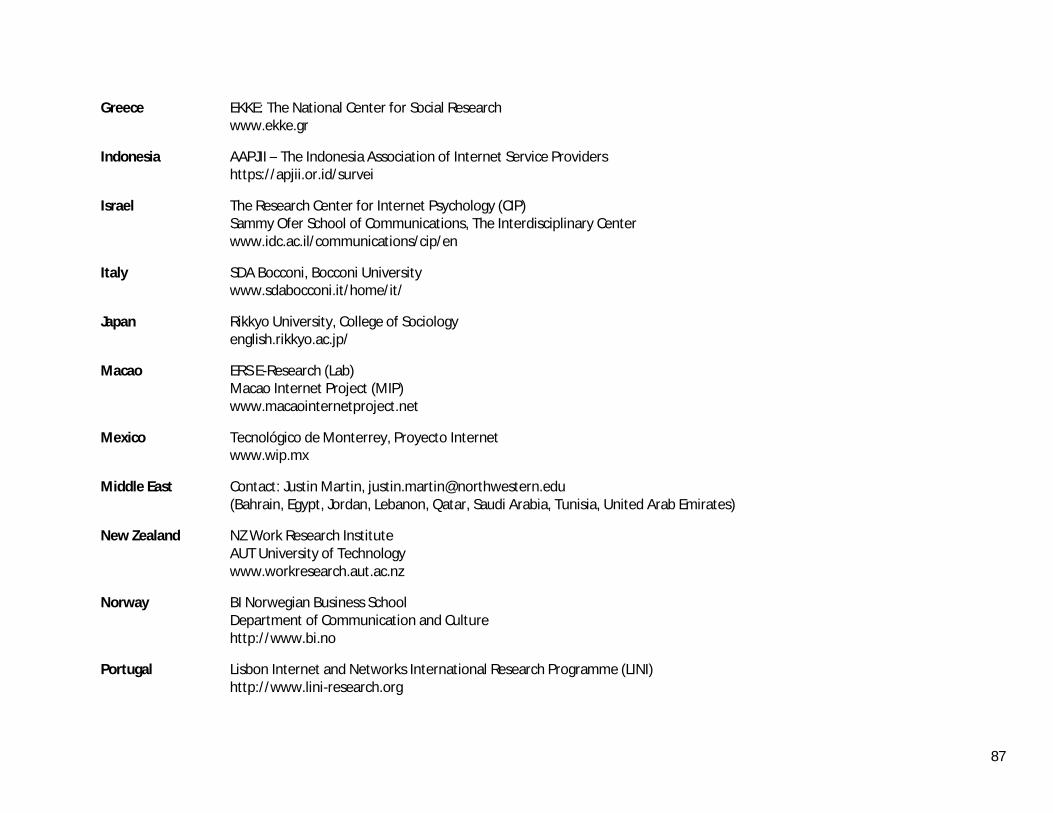
Greece EKKE: The National Center for Social Research www.ekke.gr
Indonesia AAPJII – The Indonesia Association of Internet Service Providers https://apjii.or.id/survei
Israel The Research Center for Internet Psychology (CIP) Sammy Ofer School of Communications, The Interdisciplinary Center www.idc.ac.il/communications/cip/en
Italy SDA Bocconi, Bocconi University www.sdabocconi.it/home/it/
Japan Rikkyo University, College of Sociology english.rikkyo.ac.jp/
Macao ERS E-Research (Lab) Macao Internet Project (MIP) www.macaointernetproject.net
Mexico Tecnológico de Monterrey, Proyecto Internet www.wip.mx
Middle East Contact: Justin Martin, [email protected] (Bahrain, Egypt, Jordan, Lebanon, Qatar, Saudi Arabia, Tunisia, United Arab Emirates)
New Zealand NZ Work Research Institute AUT University of Technology www.workresearch.aut.ac.nz
Norway BI Norwegian Business School Department of Communication and Culture http://www.bi.no
Portugal Lisbon Internet and Networks International Research Programme (LINI) http://www.lini-research.org

88
Qatar Northwestern University in Qatar (NU-Q) www.qatar.northwestern.edu
Russia Sholokhov Moscow State University for the Humanities http://mggu-sh.ru/en
South Africa University of Witwatersrand, Johannesburg The Media Observatory Wits Journalism, www.journalism.co.za
Sweden IIS (The Internet Infrastructure Foundation) www.iis.se
Switzerland University of Zurich, Switzerland Media Change & Innovation Division IPMZ – Institute of Mass Communication and Media Research www.mediachange.ch
Taiwan Taiwan e-Governance Research Center Department of Public Administration, National Chengchi University www.teg.org.tw http://pa.nccu.edu.tw
United Kingdom Oxford Internet Institute https://www.oii.ox.ac.uk/research/projects/wip
Uruguay Universidad Católica del Uruguay www.ucu.edu.uy

89
Supplement 3: Research methods and demographic data
Sample Procurement
For both the original sample drawn in 2000, and the replacement samples selected in subsequent years until 2013, a national Random Digit Dial
(RDD) telephone sample was used. This method gives every telephone number in the 50 states and the District of Columbia a close to equal
chance of being selected.
Due to the increased difficulty in finding hard-to-reach respondents (namely teens/young adults, African Americans, and Hispanics) using
traditional RDD recruitment, a condition attributed to the rapid shift of households to mobile phones and growing lack of response to unsolicited
phone calls, a new sampling method was introduced in 2014. As an alternate probability-based sampling method, letter mailers sent to Address
Based Sampling replaced RDD telephone recruitment as the primary source of replacement recruits.
The address-based sample was comprised of a random set of mailing addresses drawn from the entire universe of non-business residences
maintained and provided by the United States Postal Service. Mailers sent to address based samples allowed for inbound respondents who could
either go online to a new dedicated website to sign-up for an email or SMS (text message) invitation link and/or start the web survey immediately
or call a toll-free number to request a callback to complete the survey on the phone. Outbound calls were also made to hard-to-reach households
within the address-based samples that were matched to phone numbers to boost participation among these groups. Name recognition due to
receiving the mailer ahead of time assisted cooperation rates for these calls.
Prior to 2014, in the initial recruitment call, an interviewer spoke to a person in the household 18 years of age or older to obtain a roster of all
household members. At this point, a computer system (“CFMC Survent” CATI) randomly selected one individual from among those 12 years of age
and over in the household to be the interviewee from that household. If the randomly selected individual was between 12 and 17 years of age,
the interviewer asked a parent or guardian for permission to interview the child.
In years 2000 to 2007, once the selection of a household member was made, only that individual was eligible to complete the interview. In years
2008 to 2013, if the household member who was originally selected to complete the interview was not available, up to two other individuals
could be randomly selected from the roster to represent the household in the survey. If both of the randomly selected individuals were not
available, the individual on the phone was interviewed.

90
Beginning in 2014, this random selection method within the household was abandoned due to its detrimental effects on actually achieving an
interview with the household. Instead, attempts were made to interview the initial household member contacted, whether that contact was
made offline via the letter mailers or through a phone call. Near the end of field study, quotas were implemented to cap the representation of
certain demographic groups and continue with the collection of only the most needed groups. Additionally, teens were augmented after adult
quotas were met by specifically requesting their participation through adults in the household and receiving the consent of parents as needed.
From 2010 to 2013, up to 3 call attempts were made to complete an interview. If a household refused once, it was not contacted again. Starting
in 2014, RDD recruitment continued as a secondary source of replacement recruits with a focus on mobile phone numbers only. As in previous
years, up to 3 call attempts were made to reach a respondent at each randomly generated phone number. The data were collected through a
combination of telephone and web surveys. In 2014, the web survey was re-optimized to be usable on mobile devices as well as desktop and
laptop computers. Parallel testing was conducted to measure any effect the changes in survey format might have on study results and no effects
were found.
Starting in 2015, the mobile-optimized survey was utilized as the sole survey platform for data collection. Starting in 2010, repeat respondents
and new random respondents who indicated by phone that they had Internet access were directed to complete the interview via the Web. A URL
was provided and a web link was emailed to the potential respondent to allow that respondent to complete the survey via the Web. Beginning in
2014, sending the web link via SMS (text message) was added as an additional option for all respondents.
Prior to 2014, a small number of respondents who indicated that they had Internet access but preferred to complete the survey over the phone
were allowed to do so. Starting in 2014, all respondents contacted by phone were first asked to complete the survey immediately over the phone
in addition to being given/sent the web link to complete the survey at a later time. Additional discretion was given to the phone interviewers to
use all options to best achieve a complete interview in the interest of the study goals.
Starting in 2010, when contacting panel members from the original sample, up to 10 call attempts were made to reach them. If the person
interviewed in the prior year was no longer a member of the household, no substitution of a different household member was made. Starting in
2010, all respondents were paid a $10 incentive. Starting in 2013, respondents in hard-to-reach groups were paid a $20 incentive to increase
participation rates.
91
To deal with ongoing sampling and methodological challenges, starting in 2020, respondents were recruited from Bovitz, Inc.’s US consumer panel
platform, Forthright Access, which offers nationally representative online survey sampling capabilities. Respondent recruitment used a non-
probability sampling method to achieve a representative sample.
Panel members age 18+ within demographic subgroup strata were randomly invited to the survey. Measures were taken to ensure that the proper
number of panelists responded by strata to yield a representative sample. The sampling and invitation process proactively accounts for variance
in response rates by strata. The demographic composition of survey respondents is tracked closely during data collection; additional rounds of
outgoing survey invitations are adjusted accordingly if needed to ensure representativeness. Each selected panel member receives an initial email
invitation and two or more reminder emails with the survey link. Most panelists have also opted into SMS (text message) invitations. These
members receive the survey link via text message as well as email.
Data Collection and Weighting
Self-administered, mobile friendly online surveys were conducted in English. Fieldwork took place June 15-22, 2020. No sample weighting was
applied.

92
Demographic Data
2010 Census
2012 with
Weighting
2013 with
Weighting
2014 with
Weighting
2015 with
Weighting
2016 with
Weighting
2018 with
Weighting
2020 w/o
Weighting
Income
Less than or equal to 29,999 31% 27% 31% 31% 30% 30% 31% 48%
30,000 to 49,999 20% 18% 19% 19% 20% 20% 19%
50,000 to 99,999 30% 33% 29% 30% 30% 30% 30% 33%
100,000 or more 20% 22% 20% 20% 20% 20% 20% 15%
Age/Gender
Males :12-17 5% 3% 5% 5% 5% 5% 5% n/a
Males :18-24 6% 5% 6% 6% 6% 6% 6% 6%
Males :25-34 8% 5% 8% 8% 8% 8% 8% 8%
Males :35-44 8% 8% 8% 8% 8% 8% 8% 9%
Males :45-54 9% 9% 9% 9% 9% 8% 8% 8%
Males :55-64 7% 8% 7% 7% 7% 7% 7% 8%
Males :65-74 4% 5% 4% 4% 4% 4% 4% 7%
Males :75-84 2% 3% 2% 2% 2% 2% 2% 1%
Males :85 & Above 1% 1% 1% 1% 1% 1% 1%
Females :12-17 5% 3% 5% 5% 5% 5% 5% n/a
Females :18-24 6% 4% 6% 6% 6% 6% 6% 6%
Females :25-34 8% 6% 8% 8% 8% 8% 8% 8%
Females :35-44 8% 9% 8% 8% 8% 8% 8% 9%
Females :45-54 9% 10% 9% 9% 9% 9% 9% 9%
Females :55-64 7% 9% 7% 7% 7% 7% 7% 9%
Females :65-74 4% 6% 5% 4% 4% 5% 4% 7%
Females :75-84 3% 4% 4% 3% 3% 3% 3% 3%
Females :85 & Above 1% 1% 1% 1% 1% 1% 1%
Education
Less than HS Grad 22% 12% 21% 21% 21% 21% 21% 3%
HS Grad no college 27% 25% 27% 27% 27% 27% 27% 22%
Some college/associates degree 26% 30% 25% 26% 25% 26% 25% 43%
Bachelor’s degree or higher 25% 34% 27% 26% 26% 26% 27% 32%
Ethnicity
Hispanic 17% 11% 16% 16% 16% 16% 16% 16%
White/Anglo/Caucasian/
Middle-eastern 75% 81% 77% 73% 73% 74% 73%
77%
Black/African American 14% 10% 14% 13% 13% 13% 13% 14%
Asian/ Pacific Islander 6% 6% 6% 6% 6% 6% 6% 6%
93
Center for the Digital Future at USC Annenberg
11444 West Olympic Blvd, Suite 120
Los Angeles, CA 90064
(310)235-4444
www.digitalcenter.org