2021 annual report - boq.com.au
TRANSCRIPT

2021 ANNUAL REPORT
Year ended 31 August 2021
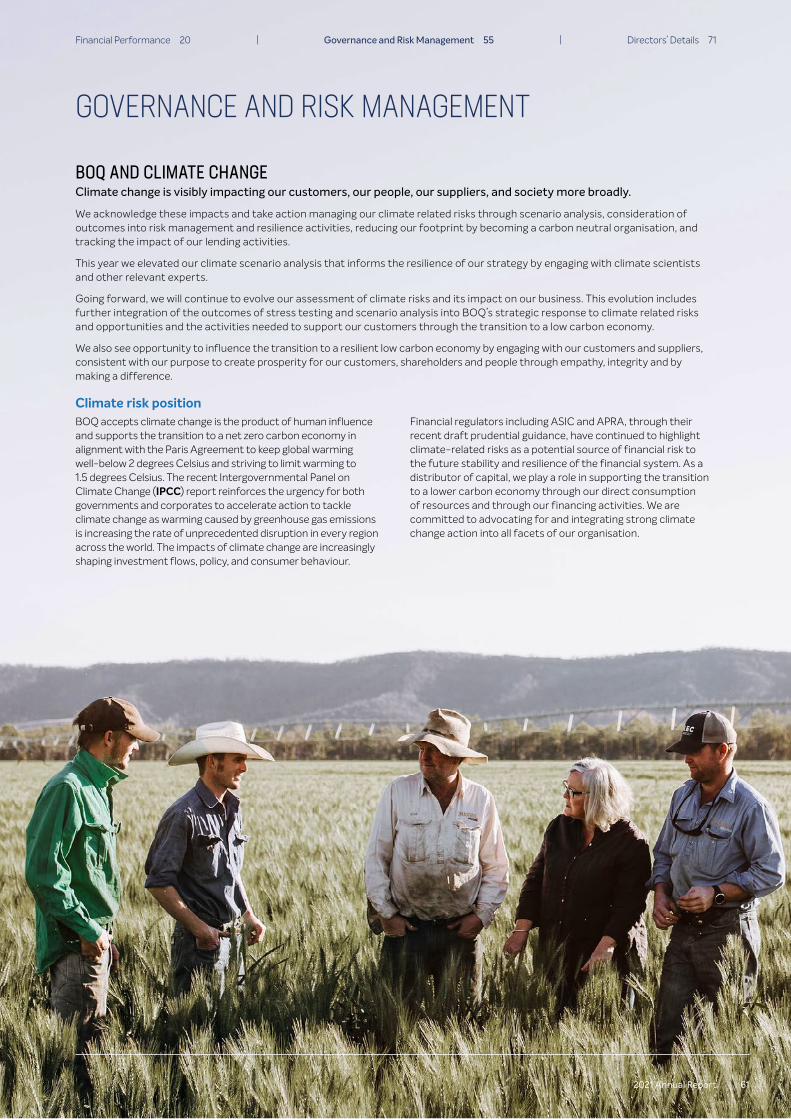
The Charvel property in Theodore Queensland has been in the Hewitt family since 1958 when Alanrsquos parents first purchased the land Since then Alan and his wife Tracey have run the mixed operation of cattle grazing and irrigated cropping with the help of their three sons
After many years with another bank the Hewitts switched to BOQ in 2013 and formed a strong bond with BOQ Agribusiness Manager Ian Mills who has now become part of the furniture It was important to Tracey and Alan that they have a real and honest partnership with their bank and work with people who understand their business and believe in what theyrsquore doing
With over 30 yearsrsquo experience working in agribusiness across Queensland Ian is extremely passionate about the industry and enjoys his frequent visits to the Charvel property Ian plays his part by understanding who the Hewitts are as a family what the farm needs season to season and how it all fits together
BOQ Agribusiness Manager Ian said ldquoItrsquos incredibly important to make that effort to understand the business This is not just a financial transaction at the bank itrsquos about understanding whatrsquos important to them listening where they want to get to and workshopping your ideas together Itrsquos a real partnership and thatrsquos what we work to strive forrdquo
Most recently Ian met with the Hewitts about purchasing more property After discussing their goals and priorities they chose to instead finance a loan for a bulldozer and a renovation project which for the same investment provided a much greater return over time
Tracey was particularly pleased with the time care and thought that went into the decision from Ian and the agribusiness team and felt as though they were part of a real partnership
A TRUE PARTNERSHIP WITH FAMILY RUN BUSINESSES
COVER STORY
ldquo Wersquove been with other banks that make you feel like yoursquore just another asset or liability They like to keep an eye on what yoursquore doing to make sure their money is safe but at BOQ you feel like yoursquore part of a team They keep an eye on what yoursquore doing because they have a genuine interest and want to understand how they can help you betterrdquo
- Tracey Hewitt BOQ agribusiness customer
2 Bank of Queensland Limited and its Controlled Entities
OverviewFY21 Financial Results 4
Chairmanrsquos Review 6
Managing Director and CEOrsquos Message 8
Directorsrsquo Report 12About BOQ 12
Responding to COVID-19 14
Acquisition of ME Bank 15
Value Creation and Strategy 16
Financial Performance 20
Governance and Risk Management 55
Directorsrsquo Details 71
Remuneration Report 76
Lead Auditorrsquos Independence Declaration 105
Financial Report 107Income Statements 108
Statements of Comprehensive Income 109
Balance Sheets 110
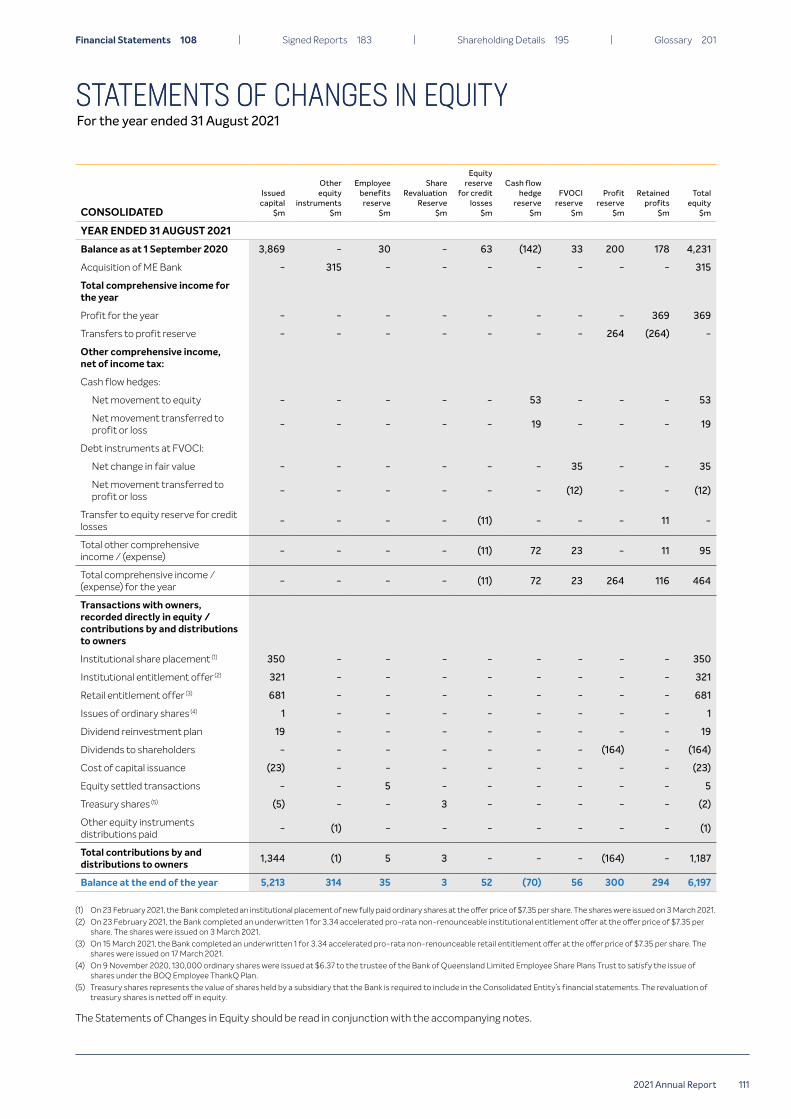
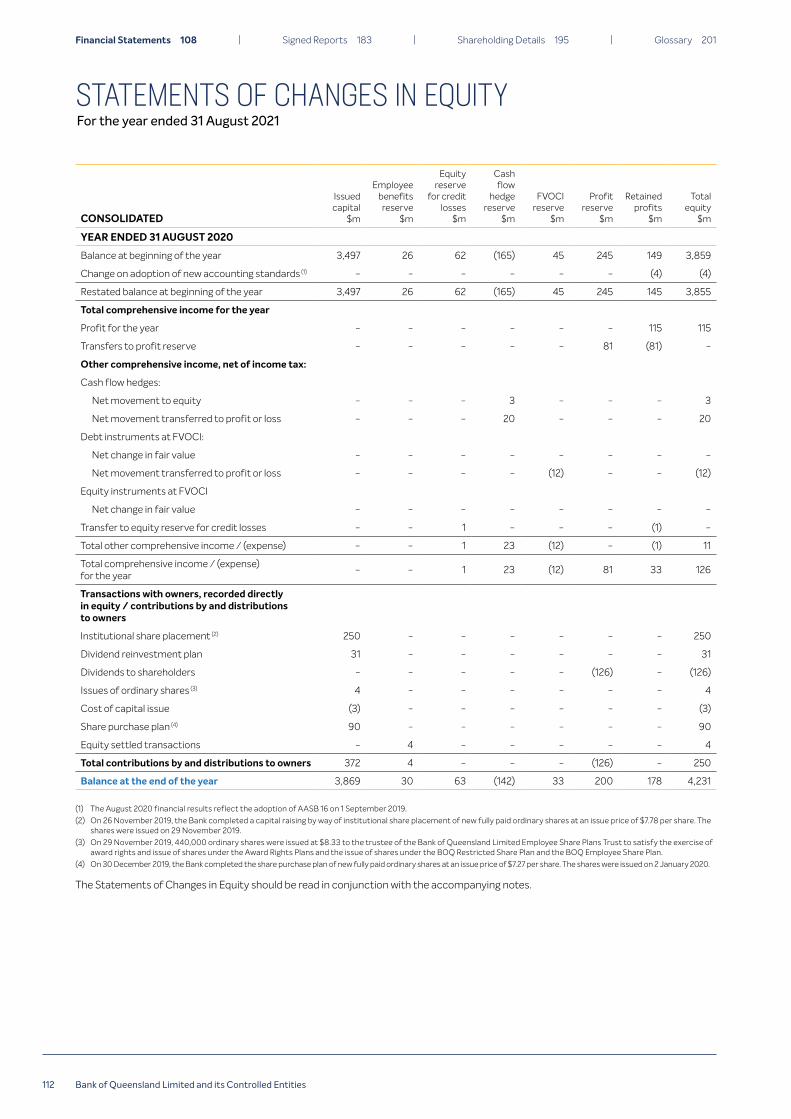
Statements of Changes In Equity 111
Statements of Cash Flows 115
Notes to the Financial Statements 116
Other InformationDirectorsrsquo Declaration 183
Independent Auditorrsquos Report to the Members 184
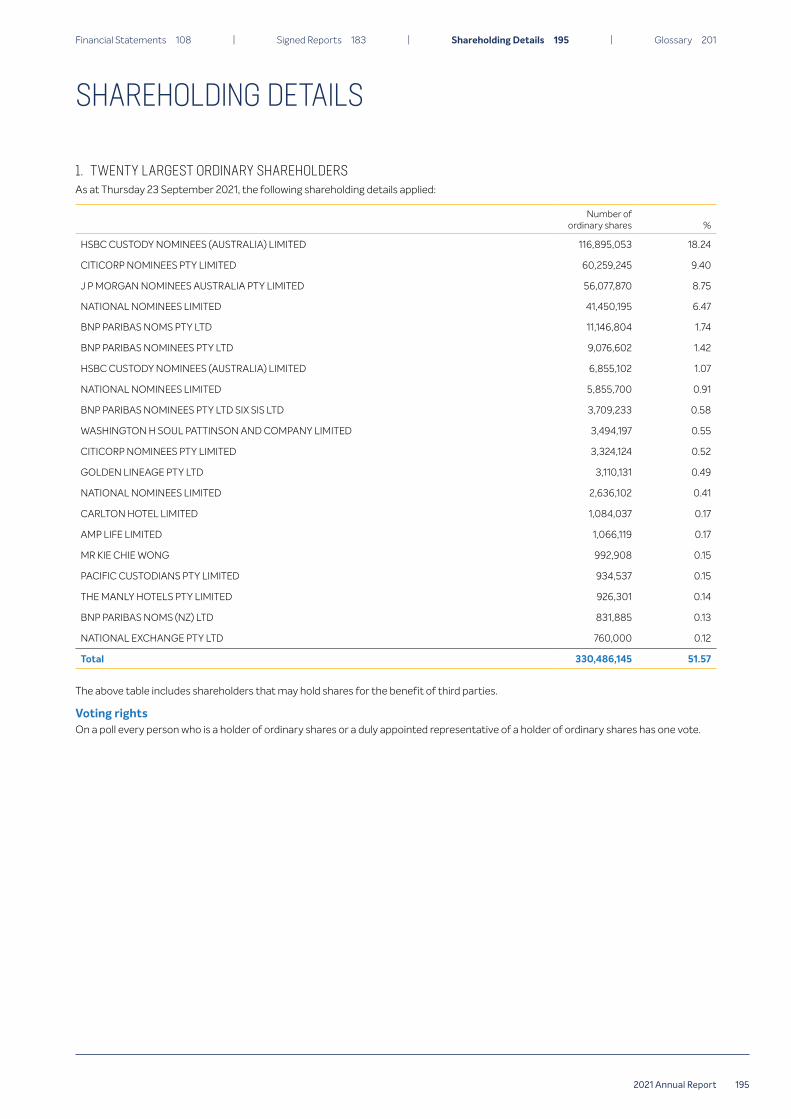
Shareholding Details 195
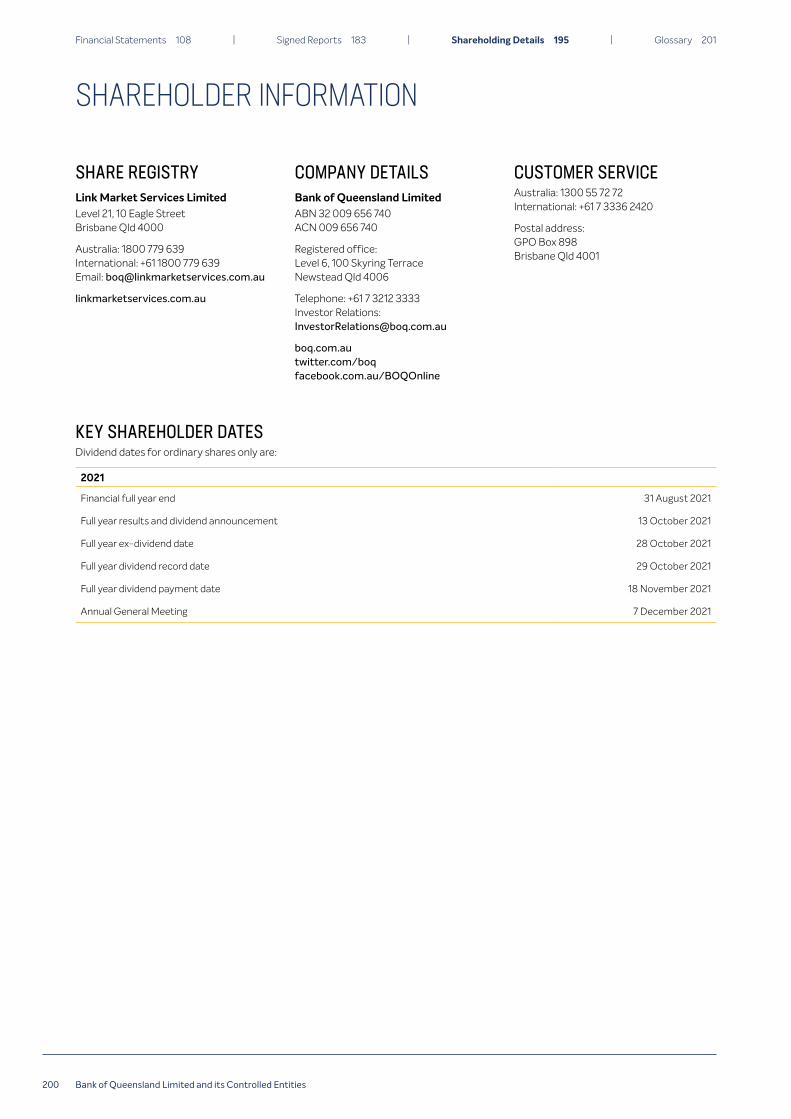
Shareholder Information 200
Glossary 201
We are always looking for ways to improve our reporting Please send your questions or suggestions to our Investor Relations team at InvestorRelationsboqcomau
CONTENTSABOUT THIS REPORT
Bank of Queensland Limited ABN 32 009 656 740 AFSL No 244616 Level 6 100 Skyring Terrace Newstead QLD 4006
About this report This yearrsquos Annual Report includes details of BOQrsquos purpose and values strategy our value creation story operations audited financial statements and other statutory disclosures The report predominantly focuses on our financial performance with further detail on our non-financial performance measures contained in the 2021 Sustainability Report We are continuing to enhance our reporting to explain to stakeholders how we deliver long-term value
Unless otherwise stated the Annual Report encompasses all BOQ activities for the financial year commenced 1 September 2020 and ended 31 August 2021 All monetary values in this document are presented in Australian dollars which is the Bankrsquos functional currency Our Operating and Financial review is contained in pages 12 - 75 of this report
Other documents in our 2021 reporting suiteBOQ produces a range of reports designed to meet the evolving expectations of a wide number of stakeholders Our 2021 annual reporting suite also includes the following documents
Sustainability ReportOur 2021 Sustainability Report outlines information about our performance against social environmental and economic opportunities and challenges This report is available on the Annual Reports page of our website and is supported by supplementary information available on the Sustainability section of our website
Corporate Governance Statement Our 2021 Corporate Governance Statement discloses how we have complied with the ASX Corporate Governance Councilrsquos Corporate Governance Principles amp Recommendations (4th edition) and is available on the Corporate Governance page of our website
FY21 Investor Materials Our FY21 Investor Materials provide a high level overview of the Grouprsquos performance along with a detailed result analysis and a discussion on the outlook which covers the macro environment and the Grouprsquos high level priorities Investor Materials are available on the Financial Results page of our website
32021 Annual Report
2018 2019 2020 2021
PROFIT RESULTS ($m)
LOAN IMPAIRMENT EXPENSE ($m)
2018 2019 20212020
EARNINGS amp DIVIDENDS (cent per ordinary share)
FY21 CASH EARNINGSafter tax
$412m83 221 51
from FY20
from FY20
from FY20 225
from FY20
STATUTORY NET PROFITafter tax
$369m
CASH BASIC EARNINGS PER ORDINARY SHARE(cent per share)
747cent
DIVIDENDS PER ORDINARY SHARE(cent per share)
39cent
NET INTEREST MARGIN CASH COST TO INCOME RATIO CASH RETURN ON EQUITY
2018 2019 2020 2021
41 69 175 (21)
($21m)Includes $71 million
reduction in the collective provision
372 336 747320 298 225 115 412 369 496
12
770 65915 76
82Up 280bps from FY20
192Up 1bp from FY20
544Down 50bps from FY20
Cash Earnings after Tax Cash Basic Earnings per Ordinary ShareStatutory Net Profit after Tax Dividends per Ordinary Share
39
FY21 FINANCIAL RESULTS
4 Bank of Queensland Limited and its Controlled Entities
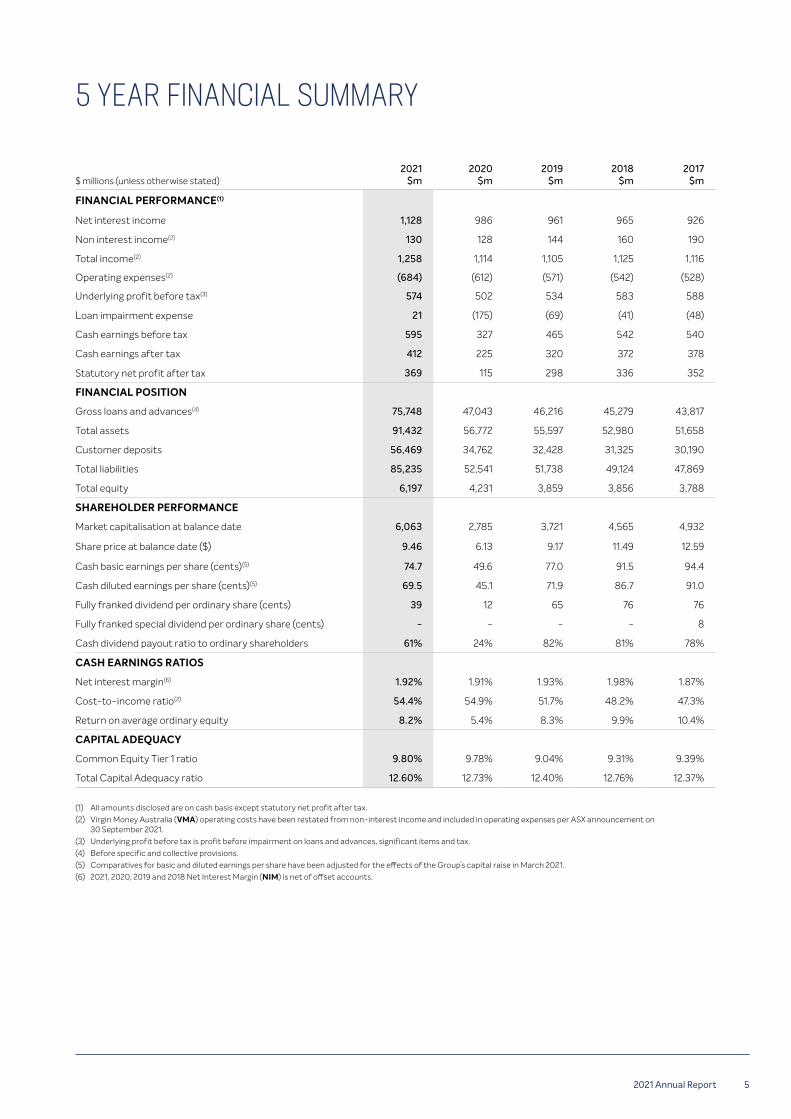
$ millions (unless otherwise stated)2021
$m2020
$m2019
$m2018
$m2017
$m
FINANCIAL PERFORMANCE(1)
Net interest income 1128 986 961 965 926
Non interest income(2) 130 128 144 160 190
Total income(2) 1258 1114 1105 1125 1116
Operating expenses(2) (684) (612) (571) (542) (528)
Underlying profit before tax(3) 574 502 534 583 588
Loan impairment expense 21 (175) (69) (41) (48)
Cash earnings before tax 595 327 465 542 540
Cash earnings after tax 412 225 320 372 378
Statutory net profit after tax 369 115 298 336 352
FINANCIAL POSITION
Gross loans and advances(4) 75748 47043 46216 45279 43817
Total assets 91432 56772 55597 52980 51658
Customer deposits 56469 34762 32428 31325 30190
Total liabilities 85235 52541 51738 49124 47869
Total equity 6197 4231 3859 3856 3788
SHAREHOLDER PERFORMANCE
Market capitalisation at balance date 6063 2785 3721 4565 4932
Share price at balance date ($) 946 613 917 1149 1259
Cash basic earnings per share (cents)(5) 747 496 770 915 944
Cash diluted earnings per share (cents)(5) 695 451 719 867 910
Fully franked dividend per ordinary share (cents) 39 12 65 76 76
Fully franked special dividend per ordinary share (cents) - - - - 8
Cash dividend payout ratio to ordinary shareholders 61 24 82 81 78
CASH EARNINGS RATIOS
Net interest margin(6) 192 191 193 198 187
Cost-to-income ratio(2) 544 549 517 482 473
Return on average ordinary equity 82 54 83 99 104
CAPITAL ADEQUACY
Common Equity Tier 1 ratio 980 978 904 931 939
Total Capital Adequacy ratio 1260 1273 1240 1276 1237
(1) All amounts disclosed are on cash basis except statutory net profit after tax(2) Virgin Money Australia (VMA) operating costs have been restated from non-interest income and included in operating expenses per ASX announcement on
30 September 2021(3) Underlying profit before tax is profit before impairment on loans and advances significant items and tax(4) Before specific and collective provisions(5) Comparatives for basic and diluted earnings per share have been adjusted for the effects of the Grouprsquos capital raise in March 2021(6) 2021 2020 2019 and 2018 Net Interest Margin (NIM) is net of offset accounts
5 YEAR FINANCIAL SUMMARY
52021 Annual Report
CHAIRMANrsquoS REVIEW
Dear Fellow Shareholders
I am delighted to be able to report a strong financial and operating performance for BOQ in FY21
BOQ has delivered both statutory and cash earnings growth of 221 per cent and 83 per cent respectively We have achieved statutory net profit after tax of $369 million and cash earnings after tax of $412 million
Key highlights of our transformation progress this year include our strong financial results achieving above system mortgage growth whilst maintaining prudent risk settings strengthening our team with improved leadership and execution capability further embedding our values driven performance culture improving loan approval times for our customers delivering phase 1 of our digital first strategy and the successful acquisition of Members Equity Bank Limited (ME Bank or ME)
The value accretive acquisition of ME Bank is strategically aligned and is expected to deliver material scale and synergies a diversified customer footprint and rebalanced revenue channels with improved return on equity The ME Bank integration is on track and is a key strategic deliverable over the next 12 months
We are making material progress in delivering our growth strategy to uplift our financial and customer performance and build a scalable multi-brand digital-first bold challenger bank with a personal touch
These pleasing results underscore our continuous improvement journey and high ambition to delight our customers be a great place to work and to grow shareholder value
CustomersContinuing to improve the customer experience and delight our customers every day is at the heart of our strategic transformation
During FY21 we enhanced the digital bank proposition for Virgin Money Australia customers by offering transaction and saving account services for the first time This was built on a digital platform that we will extend to form the foundation for the Retail Bank delivering improved digital customer offerings and experiences for all the BOQ Group brands
We will continue to work closely with our customers the government and regulators to ensure we maintain support for customers facing hardship or requiring help resulting from the COVID-19 pandemic
Shareholders amp Capital ManagementThe transformative acquisition of ME Bank and our improved performance this financial year have enhanced shareholder value
We recognise the importance of dividends to our shareholders and the Board has determined to pay a final fully franked dividend of 22 cents per share bringing the FY21 dividend to 39 cents per share Barring unforeseen circumstances we are targeting a dividend payout ratio between 60 per cent and 75 per cent of cash earnings going forward We believe this payout ratio enables BOQ to balance an attractive annual distribution to shareholders against the capital needed to support our business transformation growth and the resilience of the bank
We remain committed to prudent balance sheet and capital management Our CET1 ratio at financial year end was 980 per cent During this higher risk period we intend to retain our CET1 ratio above the top end of our target range of 90 - 95 per cent(1)
We funded the ME Bank acquisition via a $135 billion capital raising and we thank shareholders for their support Due to unforeseen extensive delays in Australia Post some of our retail shareholders missed the cut-off date for acceptance of the rights issue offer We sincerely apologise to those shareholders that were unable to participate
The capital raising timeline and structure was determined based on the material size of the capital raising as a per cent of our market capitalisation and the need to present an attractive fully underwritten bid to provide certainty of funding and price in a competitive tender process We believe the accelerated timeline and non-renounceable structure were critical to BOQ Group achieving a timely underwritten capital raising winning the bid minimising the dilution impact of the capital raising and providing the opportunity to create value for all of our shareholders
People amp CultureEmbedding a performance driven culture through empowering our people and holding them to account to deliver against our key performance indicators is core to our strategic transformation We are encouraging our people to speak up question the status quo and experiment to achieve improved outcomes
Reliability transparency and trust are at the core of everything we do Living our purpose and values drive excellent conduct and better customer and community outcomes
Keeping our people safe and informed and maintaining continuity of our operations have been key priorities during the pandemic We have adopted an agile approach to working that includes a hybrid model of returning to the office when health directions permit along with remote flexible working Our branches remained open throughout the various pandemic restrictions and we are proud of the dedication shown by our people who continue to attend our workplaces to support our customers
We recognise that quality people and strong leadership will drive our success We continue to enhance and develop the calibre of the leadership team and our people building a diverse team with strong execution capability
(1) BOQ intends to operate above the management target range of 90 - 95 per cent in FY22 until the final impacts of APRArsquos changes to RWAs and capital calibration are understood Refer to page 54 in the ME Bank acquisition investor presentation for further detail
6 Bank of Queensland Limited and its Controlled Entities
Building a sustainable businessBOQ remains committed to building a sustainable business and recognises our social responsibility to deliver improved outcomes for all stakeholders and the environment We continue our journey to being a more sustainable organisation by achieving carbon neutral certification during FY21
Board renewalThe BOQ Board embarked on a period of renewal and continuous improvement in late 2019 to enhance our diversity future fit skills mix and intellectual curiosity Effective from the 2021 AGM the Board renewal program will be complete The size of the Board will have reduced from 11 to 8 Directors (7 non-executive)
I welcome Mickie Rosen and Deborah Kiers who joined the Board in 2021 and look forward to the considerable contribution they will bring across their combined skills of digital transformation consumer experiences organisational design people amp culture strategy and ME Bank Heritage
I would like to take this opportunity to thank Kathleen Bailey-Lord who retired from the Board in 2021 for her contribution to BOQ
Looking aheadUnder the strong leadership of George Frazis our Managing Director amp CEO and the Executive Committee we have good momentum in the business and are well positioned to continue to progress our transformation journey We are 18 months into this journey and have a lot more to do to meet our ambitious aspirations for BOQ to create long term value for our customers shareholders and our people
Our operating environment remains uncertain with the ongoing pandemic high asset prices and increased leverage at a low point in the interest rate cycle We will continue to support our customers with flexible policies and relief packages manage prudent risk settings in this higher risk environment and refine our strategy where appropriate
With the increased vaccine rollout across Australia we are cautiously optimistic about the future We encourage all of our stakeholders to get vaccinated to support their well-being and the lifting of lockdown restrictions enabling the re-opening of Australia
I express my deepest thanks to my colleagues on the Board our CEO the Executive Committee and all our employees for their material contribution to BOQ
Thank you to our customers and shareholders for your ongoing support of BOQ
ldquo Continuing to improve the customer experience and delight our customers every day is at the heart of our strategic transformationrdquo
Patrick Allaway Chairman
72021 Annual Report
Dear Shareholder
This year we have seen economic conditions improve compared to the previous year due to the commencement of the vaccine rollout and related consumer and business optimism However recent lockdowns and restrictions have reminded us that COVID-19 and the associated economic consequences remain present I believe the saying is ldquotough times donrsquot last tough people dordquo and that has never been more true of our people and our customers who have shown resilience and optimism despite the challenges
As stewards of a business with a long heritage my team and I have continued to focus on delivering our strategy to enhance the experience for our customers stakeholders and people
Customers and CommunityBOQrsquos strong balance sheet and the commitment of our people allows us to support customers in hardship as well as contribute to meaningful community initiatives In the past 12 months BOQ supported hundreds of customers in hardship with personal and business loan deferrals and in August we simplified our systems and removed dishonour fees for overdrawn accounts We have maintained our retail and business Net Promoter Score ranking of 3rd during FY21 by delivering a superior customer experience
We recognise the role BOQ plays in the communities in which it operates We continued our support of Aboriginal and Torres Strait Islander peoples through our work with the STARS and Clontarf Foundations that provide education and development of life skills for these communities We also continued our relationship with our community partner Orange Sky during the year to provide laundry and shower vans for people in need
Progress against strategyOur experienced executive team continues to deliver against the strategy outlined to the market in February 2020 The ME Bank acquisition underscores our growth agenda by significantly expanding our Retail bank and allowing the Group to diversify its revenue profile and geographic presence
Significant progress has been made against the transformation roadmap with a key achievement being the launch of savings and transactions accounts for Virgin Money entrenching its credentials as a digital bank Another important step on our digital roadmap was the upgrade and integration of our card management system This has allowed us to put both BOQ and VMA cards on the same platform which enables improved digital banking app capability This has also delivered the choice and convenience customers have been requesting as the new digital wallet capability now allows them to link their cards to Apple Pay Samsung Pay and Google Pay
MANAGING DIRECTOR AND CEOrsquoS MESSAGE
ldquo I believe the saying is ldquotough times donrsquot last tough people dordquo and that has never been more true of our people and our customersrdquo
8 Bank of Queensland Limited and its Controlled Entities
The second phase of the Virgin Money Digital bank to include home loans and additional deposit products is well progressed and the scalability of the API based digital platform allows this technology to be leveraged as a strategic Group platform with the build of a BOQ Digital Bank substantially underway
The multi-year roadmap incorporates the ME Bank integration to ultimately deliver a common cloud based Retail platform for all BOQ brands
Work continues on enhancing our lending process from front to back with the Small Business Enablement program underway identifying efficiencies Other key investment includes the build of the Intelligent Data Platform foundations to enable Open Banking capabilities and a program to enhance the user experience for our people
We have delivered a further $30 million in productivity savings across the Bank in FY21 in addition to the $30 million delivered in FY20 These savings have enabled us to invest in new digital risk and regulatory programs
The sale of St Andrewrsquos is expected to be completed in 1H22 enabling BOQ to simplify its business model and focus on niche customer segments
PeopleThe Executive Team and I are united in our commitment to making BOQ Group a great place to work and pleasingly our engagement score increased five per cent in FY21 compared to last yearrsquos score
We have built a strong leadership team with the addition of Martine Jager as our Group Executive Retail Banking and CEO ME Bank Danielle Keighery as the Chief Customer Officer and Nicholas Allton in the role of Group General Counsel and Company Secretary We have recently announced the appointment of Chris Screen to the role of Group Executive Business Banking and we will welcome David Watts as BOQrsquos Group Chief Risk Officer in early 2022
During the year we welcomed a large number of new employees to the Group through the acquisition of ME Bank This team enhances our presence in Victoria and we believe our aligned customer-focused cultures will see a successful integration of ME Bank into the BOQ Group while continuing to maintain a differentiated proposition through the ME brand
We continued to focus on the wellbeing of our people during the year and to manage for impacts from COVID-19 we implemented flexible policies for non-front line workers and ensured eligible employees could take advantage of special leave for vaccinations I am proud of our people and the key role they continue to play in supporting customers I thank them for their dedication and acknowledge their hard work over the course of another trying year
PerformanceThe execution of our strategy throughout FY21 has driven our strong business performance for the year
Total income increased by 13 per cent as we continued to grow our balance sheet above system while preserving our margins Our expenses grew 12 per cent during the year as we supported volume growth while investing for the future
Impairment expenses decreased during FY21 as we reduced the collective provision in light of changes to the economic environment and expected future loan losses Maintaining a strong balance sheet continues to be important for BOQ and our capital remains comfortably above APRArsquos benchmark with a CET1 ratio of 980 per cent
Overall our improvement in statutory NPAT of 221 per cent to $369 million reflects the improved business performance operating conditions and a customer focused culture
Having completed the acquisition of ME Bank on 1 July 2021 our integration program has shown solid progress with early momentum and focus resulting in the acceleration of synergies and the development of a clear integration roadmap
The futureEven as our future feels uncertain because of the ongoing impact from the pandemic Irsquove never felt more optimistic about the ability of our people and customers to pull through to better times As the vaccine rollout gathers pace and policy settings encourage economic stability and growth Irsquom hopeful our customers stakeholders and people will join our business in returning to a more stable operating environment
Looking ahead I am very excited about the future The integration of ME Bank is underway and we have a clear strategic roadmap which we are executing against We are committed to repaying the support of our shareholders by delivering sustainable profitable returns
I believe we have the right people in place to execute on our strategy to transform BOQ into a digital bank with a personal touch to create a compelling proposition for our shareholders customers people and the community
George Frazis Managing Director and CEO
92021 Annual Report
2021 DIRECTORSrsquo REPORT
BOQ HAS A SIGNIFICANT PRESENCE AROUND AUSTRALIA
Customers in every State and Territory
$565bnCustomer deposits
163Branches
15mCustomers
$757bnGross loans
and advances
BOQ is one of Australiarsquos leading regional banks having served customers for 147 years
During BOQrsquos long history it has evolved from a Queensland focused retail branch-based bank to a national diversified financial services business with a focus on niche commercial lending segments highly specialised bankers and branches run by small business owners who are deeply anchored in their communities In FY21 BOQ has been further strengthened and diversified through the acquisition of ME Bank
We provide a range of products to support the financial needs of our customers and pride ourselves on building long term customer relationships that are digitally enabled with a personal touch
Purpose and Values
Our purpose is to create prosperity for our customers shareholders and people through empathy integrity and by making a difference
Our values are contained within the purpose statement ensuring our people are clear on the key values to which BOQ subscribes
Our purpose and values communicate a simple and clear message for our people We are committed to ensuring our purpose and values are reflected in everything we do ndash from the development of our strategy to our everyday interactions with our customers and communities
We recognise we have more to do to ensure all our interactions and decisions have empathy at the core and this is an aspirational target for BOQ
bull We take pride in doing whatrsquos right speaking up and we do what we say we will do
bull We establish high and clear standards and hold ourselves and others accountable
bull We have the courage to raise and own mistakes and empower others to do the same
Integrity
bull We are bold and take reasonable risks to create prosperity
bull We focus on delivering outcomes for our customers and improving the way things are done
bull We achieve together and celebrate the positive impact we create
Making a difference
bull We seek to understand and feel what others are experiencing then we take action to help them We are curious and interested in other perspectives
bull We ask great questions to understand where our customers and colleagues are coming from
bull We use our insights to create great experiences by showing care providing and receiving feedback building trust and taking action
Empathy
ABOUT BOQ
12 Bank of Queensland Limited and its Controlled Entities
About BOQ 12 | Responding to COVID-19 14 | Acquisition of ME Bank 15 | Value Creation and Strategy 16
Distinctive brands serving attractive niche customer segments
Over time BOQ has successfully acquired a portfolio of brands which form the basis of our multi-brand strategy These different and complementary business lines provide us with a competitive advantage due to our specialised knowledge in these niche segments
Retail Banking
BOQ BusinessBOQ Business is a relationship led business with specialist bankers providing client solutions across Small Business Agribusiness Corporate Banking Property Finance Healthcare amp Retirement and Tourism Leisure amp Hospitality BOQ Business also works closely with the Owner Manager network to support commercial customers who value a more intimate business banking relationship with passionate industry experts
FinanceBOQ Finance is a wholly owned subsidiary of BOQ Group Limited specialising in asset finance and leasing solutions
BOQ Finance is a mid-market financier providing deep industry and product skills to its partner base BOQ Finance has been operating in the Australian and New Zealand markets for more than 45 years
BOQ SpecialistBOQ Specialist delivers distinctive banking solutions to niche market segments including medical dental and veterinary professionals BOQ acquired the business (previously Investec Professional Finance) from Investec Bank (Australia) Limited in 2014 BOQ Specialist operates as a niche brand within BOQrsquos Business Bank
BOQ Business
BOQrsquos business lines are supported by a number of Group functions including Group Customer Technology Risk Finance Transformation amp Operations Legal and our People amp Culture teams These key functions support our bank by managing our operations property strategy finance treasury technology architecture infrastructure amp operations risk compliance legal human resources and corporate affairs
Group Functions
Commercial lending deposits financial markets and insurance
Asset finance and leasing Lending deposits credit cards and leasing for medical and professional services
ABOUT BOQ
Retail and SME lending deposits credit cards and insurance
BOQBOQ is the Retail banking arm of the BOQ Group and is comprised of 163 branches across Australia offering a range of banking products Our 103 Owner-Managed Branches (OMB) are run by local Owner-Managers who understand the importance of delivering high quality customer service and are deeply committed to the communities in which they operate
Digital home loans deposits credit cards insurance and superannuation
VMAVMA is a digital first retail financial services company which provides a wide range of financial products that are easy to understand and is a compelling alternative to the big banks BOQ acquired VMA in 2013 and it operates as a standalone brand within the BOQ Group
Home loans personal loans deposits and credit cards
ME BankME Bank is a branchless retail bank which provides a wide range of banking products to customers through mobile bankers direct channels and brokers ME Bank was acquired by BOQ in July 2021 and operates as a distinct brand within the BOQ Group
132021 Annual Report
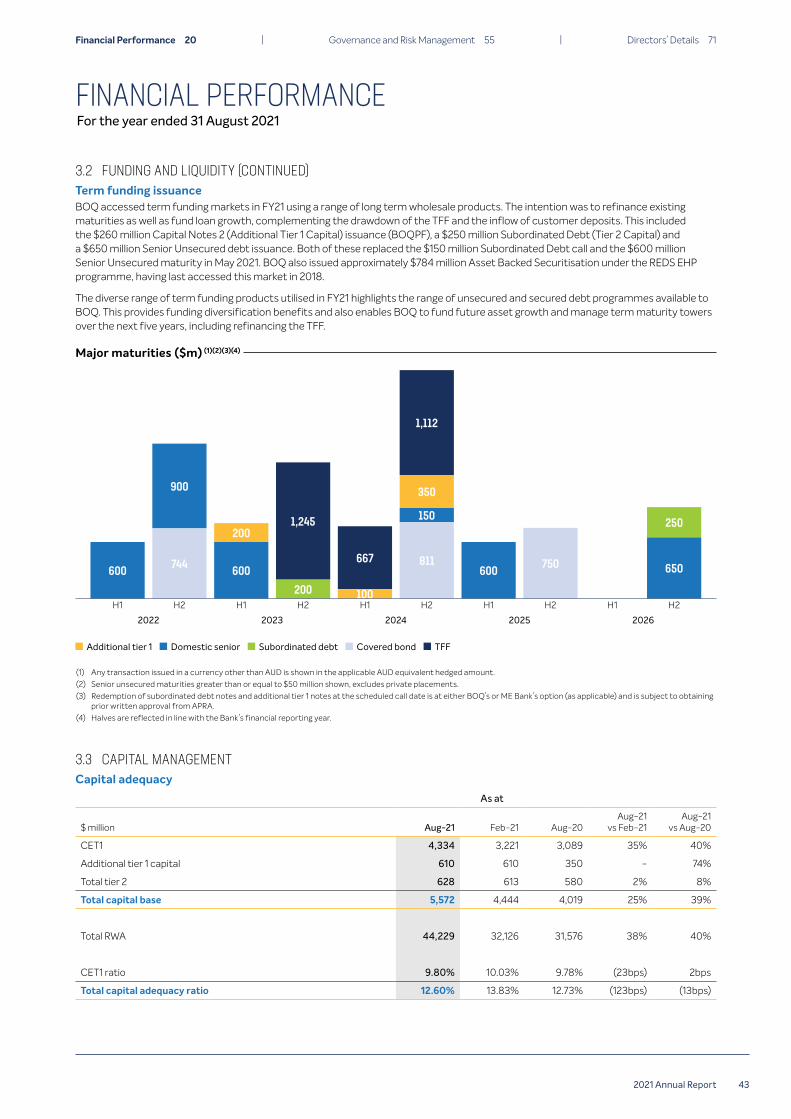
Financial Performance 20 | Governance and Risk Management 55 | Directorsrsquo Details 71
Employee supportThe health and wellbeing of our people has remained a key focus throughout FY21 We have built upon lessons from 2020 to ensure the health wellbeing and safety of our people is protected and our actions have been continually updated based on guidance from State and Federal authorities and the World Health Organisation We are supportive of the National Cabinet reopening plan and vaccination program and have provided our people with paid vaccination leave
Banking is an essential service and accordingly we have kept our branch network open throughout this period as well as maintaining our other operations
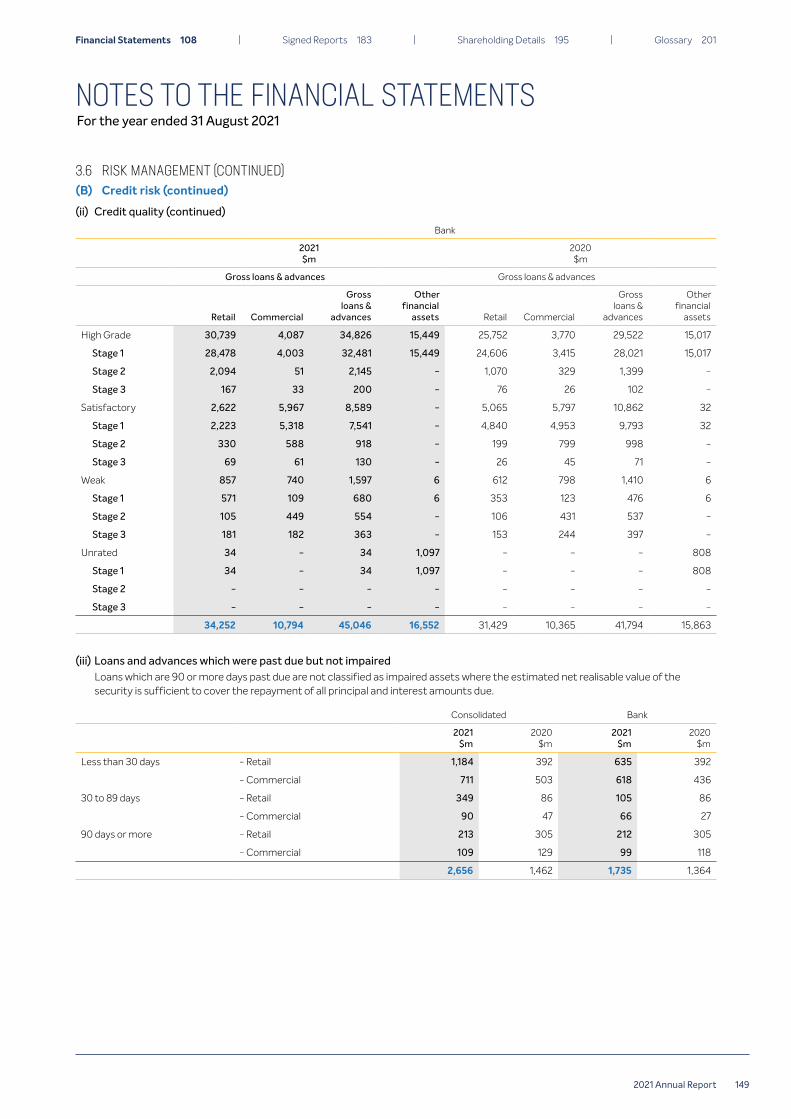
Managing our credit riskBuilding upon the processes implemented in 2020 BOQ is continuing to monitor the credit quality of the portfolio to assess economic impacts due to COVID-19 particularly in light of the recent spike in cases causing the reintroduction of more severe restrictions and lockdowns
BOQ has a number of credit models designed to assist in measuring the credit risk in the portfolio based on changing economic and environmental conditions
Customer SupportWhile the first banking relief package came to an end on 31 March 2021 our Retail and Business Bankers and BOQ Specialist relationship managers continue to work very closely with their customers to understand their needs during this time and to support them in the ever changing COVID-19 environment This includes re-introducing a relief package in July 2021 to support customers impacted by an extended period of lockdown
Support for Personal CustomersTo help customers experiencing difficulty BOQrsquos Customer Assistance Team provides access to a range of support measures including
bull The ability to defer mortgage andor loan repayments or make interest only repayments for a short period
bull Special arrangements in relation to arrearsbull Early access to Term Deposit funds with wavier of
redemption feebull Waiver of other fees and charges related to non-paymentIn addition BOQ has supported retail customers to manage their cash flow needs through offering competitive home loan and deposit products with flexible features such as interest only offset and redraw facilities
Support for Business CustomersAustralian businesses have also been under pressure from restrictions and lockdowns and we continue to offer financial assistance to our Business Banking customers which include
bull Small business customers are able to defer repayments for up to 3 months with loan terms extended accordingly
bull Eligible customers are able to receive refunds of merchant terminal rental fees for up to 3 months
bull Eligible customers do have early access to Term Deposit and Farm Management Deposit funds and a waiver of redemption fee for up to 3 months
We note that further deferrals or restructuring for businesses facing extended disruption may not be in their best interest In these circumstances BOQ works closely with our customers to find a responsible solution
RESPONDING TO COVID-19The COVID-19 pandemic has had ongoing impacts for our customers and people throughout FY21 and we remain committed to supporting them through these challenging times We recognise our responsibility to maintain confidence in the economy and our role is to ensure the systems and processes we have in place underpin the resilience of the business and our people which in turn supports customers
Business resilienceBOQ Group continues to develop scenario models to identify potential risks to our business under a range of different economic outcomes The application of these models ensures BOQ is able to respond quickly to either the economy showing signs of recovery as shown in the first half of 2021 or the reintroduction of restrictions and lockdowns as we are currently experiencing in some parts of Australia
Our strong levels of capital and liquidity positions us well for any potential scenario and we continue to refine our risk models as additional economic data becomes available
About BOQ 12 | Responding to COVID-19 14 | Acquisition of ME Bank 15 | Value Creation and Strategy 16
14 Bank of Queensland Limited and its Controlled Entities
At BOQ we have a strong history of servicing our customers with a focus on niche segments through our owner managers and specialised bankers We have evolved from a Queensland focused retail branch-based bank to a national diversified financial services business through our multi-brand strategy building relationships with the communities we support In February 2021 we announced the exciting acquisition of ME Bank adding a strong complementary customer focused brand
Strategic rationaleThe ME Bank Acquisition is expected to deliver strategic and financial benefits to the BOQ Group
bull significantly enhanced scale broadly doubling the retail bank and providing geographic loan portfolio and revenue diversification
bull strong complementary trusted brands with shared customer-centric cultures and differentiated customer segments
bull a clear pathway to a scaled common cloud based digital retail bank technology platform
bull attractive financial outcomes including improved returns on equity and earnings per share whilst also maintaining a strong balance sheet
IntegrationPlanning for the integration commenced soon after we announced the intended acquisition of ME Bank in February 2021
In order to deliver the strategic and financial benefits of the acquisition BOQ has developed an Integration program with Board and Executive sponsorship and established an Integration Management Office (IMO) to manage the overall program The IMO has introduced strong governance across the program developing risk management frameworks and program management capabilities to support the delivery work streams
Prior to completion there was good engagement between the BOQ and ME Bank teams which enabled a day 1 readiness program to be built and successfully executed Post completion the integration program has been able to deliver a number of quick wins as well as develop detailed integration plans and validate the due diligence assumptions The integration plan and associated technology roadmap ensures there is a clear pathway to deliver on BOQrsquos strategic ambitions
Further information on ME Bank and the integration is available in the FY21 Sustainability report pages 28 - 29
ACQUISITION OF ME BANK
About ME BankME Bank is a branchless retail bank which provides a wide range of banking products to customers through mobile bankers direct channels and brokers ME Bank was acquired by BOQ in July 2021 and operates as a distinct brand within the BOQ Group
CUSTOMER NUMBERS
CUSTOMER DEPOSITS
EMPLOYEES (1)
GROSS LOANS AND ADVANCES
~580k$18bn
~1100$25bn
ldquo The acquisition of ME Bank was a defining moment for BOQ delivering on our transformation strategy and benefitting our customers shareholders and people The addition of ME Bank delivers material scale broadly doubles our Retail Bank and provides geographic diversificationrdquo- BOQ Managing Director and CEO George Frazis
(1) Excludes contingent workers
Financial Performance 20 | Governance and Risk Management 55 | Directorsrsquo Details 71
152021 Annual Report
Our em
pathetic
culture sets us apart
Distinctive brands serving
attractive niche customer segmentsDigital bank of the futurewith a personal touch
Simple and intuitive business
with strong execution capability
Stron
g fin
anci
al a
nd ri
sk p
ositi
on
with
att
ract
ive
retu
rns
CUSTOMER
COMMUNITY
PEOPLE ENVIRONMENT amp
CLIMATE CHANGE
FINANCE
TECH
NOLO
GY amp
DA
TA C
APAB
ILIT
IES
bull Quality custom
er relationships
bull Custom
ers
bull Relationships with local communities
bull Owner manager branches
bull Employees bull Diversity and Inclusion bull Capabilities and skills
bull Organisational culture and values
bull Impact on the natural environment
both directly and through the use
of products
bull Shareholders
debt invest
ors
bull Pool o
f funds a
vailable
bull E
cien
t and
e
ectiv
e us
e of
dig
ital
capa
bilit
ies
to d
eliv
er b
anki
ng s
ervi
ces
We provide a range of financial services to
meet the needs of our custom
ers
We are focused on supporting individuals and small
and family business customers in our niche segments We aim to provide exceptional customer experiences
and believe in fair outcomes for customers
We invest in our people to build a diverse and inclusive workforce with key
competencies to execute our strategy
We c
ontr
ibut
e to
the
wel
lbei
ng o
f the
com
mun
ities
in w
hich
we
oper
ate
OPERATING ENVIRONMENT
Improving
credit growth
environment
Changing
customer
needsIncreasedregulatoryamp compliance requirements
Environment
amp climate
Macro-
economic amp
demographic
tre
ndsD
igit
al a
nd
tech
nolo
gy
adva
ncem
ents
BOQ VALUE DRIVER INPUTS
ACTIVITIESOUR BUSINESS
OUTPUTSBOQ
BOQrsquoS FIVE STRATEGIC PRIORIT
IES
Retail and SME lending deposits credit cards and insurance
Digital home loans deposits credit cards insurance and superannuation
BOQ VALUE
bull Build trusted customer relationships with a personalised touch
bull Achieve fairer customer outcomes bull Support individuals and businesses to achieve
their financial goals
bull Experienced bankers anchored in the community
bull Increase access to financial services and ongoing support
bull Improve financial literacy and wellbeing of the community
bull A resilient adaptable empowered diverse and inclusive workforce with a strong sense of purpose and ethics
bull Increase skills and capabilities of our peoplebull BOQ is seen as an employer of choice
CUSTOMER PEOPLE FINANCE TECHNOLOGY ampDATA CAPABILITIES
ENVIRONMENT amp CLIMATE CHANGECOMMUNITY
HOW WE CREATE VALUE
bull Build trusted customer relationships with a personalised touch
bull Achieve fairer customer outcomes bull Support individuals and businesses to achieve
their financial goals
bull Experienced bankers anchored in the community
bull Increase access to financial services and ongoing support
bull Improve financial literacy and wellbeing of the community
bull A resilient adaptable empowered diverse and inclusive workforce with a strong sense of purpose and ethics
bull Increase skills and capabilities of our peoplebull BOQ is seen as an employer of choice
Home loans personal loans deposits and credit cards
View our Sustainability Report
Further information on our strategic priorities is contained on pages 18 - 19
boqcomau2021 View our Sustainability Report boqcomau2021 View our Sustainability Report boqcomau2021
16 Bank of Queensland Limited and its Controlled Entities
About BOQ 12 | Responding to COVID-19 14 | Acquisition of ME Bank 15 | Value Creation and Strategy 16
Our em
pathetic
culture sets us apart
Distinctive brands serving
attractive niche customer segmentsDigital bank of the futurewith a personal touch
Simple and intuitive business
with strong execution capability
Stron
g fin
anci
al a
nd ri
sk p
ositi
on
with
att
ract
ive
retu
rns
CUSTOMER
COMMUNITY
PEOPLE ENVIRONMENT amp
CLIMATE CHANGE
FINANCE
TECH
NOLO
GY amp
DA
TA C
APAB
ILIT
IES
bull Quality custom
er relationships
bull Custom
ers
bull Relationships with local communities
bull Owner manager branches
bull Employees bull Diversity and Inclusion bull Capabilities and skills
bull Organisational culture and values
bull Impact on the natural environment
both directly and through the use
of products
bull Shareholders
debt invest
ors
bull Pool o
f funds a
vailable
bull E
cien
t and
e
ectiv
e us
e of
dig
ital
capa
bilit
ies
to d
eliv
er b
anki
ng s
ervi
ces
We provide a range of financial services to
meet the needs of our custom
ers
We are focused on supporting individuals and small
and family business customers in our niche segments We aim to provide exceptional customer experiences
and believe in fair outcomes for customers
We invest in our people to build a diverse and inclusive workforce with key
competencies to execute our strategy
We c
ontr
ibut
e to
the
wel
lbei
ng o
f the
com
mun
ities
in w
hich
we
oper
ate
OPERATING ENVIRONMENT
Improving
credit growth
environment
Changing
customer
needsIncreasedregulatoryamp compliance requirements
Environment
amp climate
Macro-
economic amp
demographic
tre
ndsD
igit
al a
nd
tech
nolo
gy
adva
ncem
ents
BOQ VALUE DRIVER INPUTS
ACTIVITIESOUR BUSINESS
OUTPUTSBOQ
BOQrsquoS FIVE STRATEGIC PRIORIT
IES
At the core of how we create long term value for our stakeholders is our purpose led culture and the execution of our strategy This is underpinned by our value drivers and the associated business activities which we undertake with the aim of delivering a set of key outcomes for our stakeholders
Commercial lending deposits financial markets insurance
Lending deposits credit cards insurance for doctors and dentists
DRIVER OUTCOMES
CUSTOMER PEOPLE FINANCE TECHNOLOGY ampDATA CAPABILITIES
ENVIRONMENT amp CLIMATE CHANGECOMMUNITY
bull Accountability of BOQrsquos impact on the environmentbull Attract customers employees and shareholders
whose values and banking choices are aligned to BOQrsquos environmental goals
bull Contribute to Australiarsquos transition to a lower carbon economy
bull Returns to shareholders and capital reinvested for future growth
bull Trusted to deliver sustainable returnsbull Increased market share in niche segments
bull Improve customer experience through flexible and resilient digital infrastructure
bull Data insights driving customer relationships and experience
bull Increase business efficienciesbull Data security governance and privacy
Asset Finance Cashflow and Structured Finance solutions
Pages 61 ndash 69 Financial Performance pages 20 - 54
This report includes details on how we are managing the key risks associated
with our value drivers on pages 55-70 to achieve strong financial returns
Further information on management of the non-financial risks is contained
within the FY21 Sustainability Report and Corporate Governance Statement
View our Sustainability Report boqcomau2021
172021 Annual Report
Financial Performance 20 | Governance and Risk Management 55 | Directorsrsquo Details 71
Developing and executing against our strategy
Our strategy aims to deliver an exceptional customer experience through digital channels and specialised bankers to create long term shareholder valueThe strategy was informed by our key differentiators unique brands with proud history an innovative digital offering and loyalty programme deeply anchored in local communities with a strong customer focus and highly specialised industry expertise
We continue to work toward a distinctive approach for our customers and people a comprehensive digital transformation and a focus on delivering sustainable profitable growth and attractive returns
Our strategy is built on five clear strategic priorities focused on our customers people and shareholders We have set ourselves bold targets and have made good progress towards these in FY21
OUR STRATEGIC PRIORITIES AND VALUE DRIVERS
bull Clear Purpose amp Valuesbull BOQ Retail NPS ranked 3rd at +23 (up 6ppt from FY20 and ranking
remains consistent) (2)
bull VMA NPS 14th at -16 (up 4ppt from -20 in FY20) (3)
bull ME Bank NPS ranked equal 7th at +17 (down from +23 in FY20) (2)
bull BOQ Mortgage NPS ranked equal 4th at +4 (from 5th in FY20) (2)
bull Ongoing support of customers and people impacted by COVID-19bull Executive team in place and deliveringbull Employee engagement score 64 (up from 59 in FY20)bull BOQ was awarded the WGEA Employer of Choice for
Gender Equality citation
EMPATHETIC CULTURE bull Top 3 NPS for personal and
SME customersbull Employee engagement from
56 to top quartile
bull Customer base of 15m customersbull Home lending growth of c$29bn (17x system)bull Business lending and Asset finance growth of c$600m
(08x system) (4)
bull All Owner Managers on new franchise agreementbull Expanded strategic 3rd party distribution partnerships with
quality aggregators
bull Grow customer base to c15m customers
bull Growing above system from FY20 optimising revenue and return
bull Ongoing Risk Weighted Assets (RWA) optimisation
DISTINCTIVE BRANDS
bull Products for sale reduced by from 202 to 127 since FY19bull During August we reached time to conditional yes held of 1 day
for Proprietary and 3 days for our Broker channel even as volume growth occurred (5)
bull Year 2 productivity benefits of $30m delivered in FY21 bringing the total to $60m
bull Lifting our capability to improve delivery
bull Productivity benefits of c$90m annualised run rate from FY23 containing expense growth to lt10 pa in FY21 and FY22
bull Halve the products for salebull Within 1-day time to conditional
approval for home lending
SIMPLE amp INTUITIVE
bull VMA phase 1 launched in March 2021bull Second phase of VMA digital bank incorporating home loans
and term deposits underwaybull BOQ retail digital bank Phase 1 well progressedbull Implemented new Card Management System providing
customers instant card issuance digital wallet capability amp self service convenience
bull FX digital platform and currency exchange
bull Deliver a new Digital Bankbull Transition customers from
old to new cloud based core services platform
DIGITAL BANK
Our strategic priorities Target (1) Progress
Value driver
bull Positive jaws of 2 delivered in FY21bull Deposit to Loan ratio increased to 75bull Ongoing enhancements in risk-based pricing and margin
managementbull Governance risk and compliance tool implemented
bull Positive jaws in FY21 expanding in FY22
bull Strong risk and compliance outcomes
bull Maintain group deposit-to-loan ratio of ge70
bull Capital investment of c$100m pa FY20-FY22
STRONG FINANCIAL amp
RISK POSITION
(1) Targets set prior to the inclusion to ME Bank(2) RFi XPRT Report August 2021(3) DBM Atlas Report August 2021 NPS refers to Any Financial Relationship (AFR) and businesses under $40 million turnover(4) Reflects the APRA definition of lending and will therefore not directly correlate to the balance sheet growth Adjustments made to include BOQ Finance non-Authorised
deposit-taking institution (ADI) balances in overall growth result(5) Time to conditional yes varies during the year based on volumes and customer mix
18 Bank of Queensland Limited and its Controlled Entities
About BOQ 12 | Responding to COVID-19 14 | Acquisition of ME Bank 15 | Value Creation and Strategy 16
Technology amp data capabilities
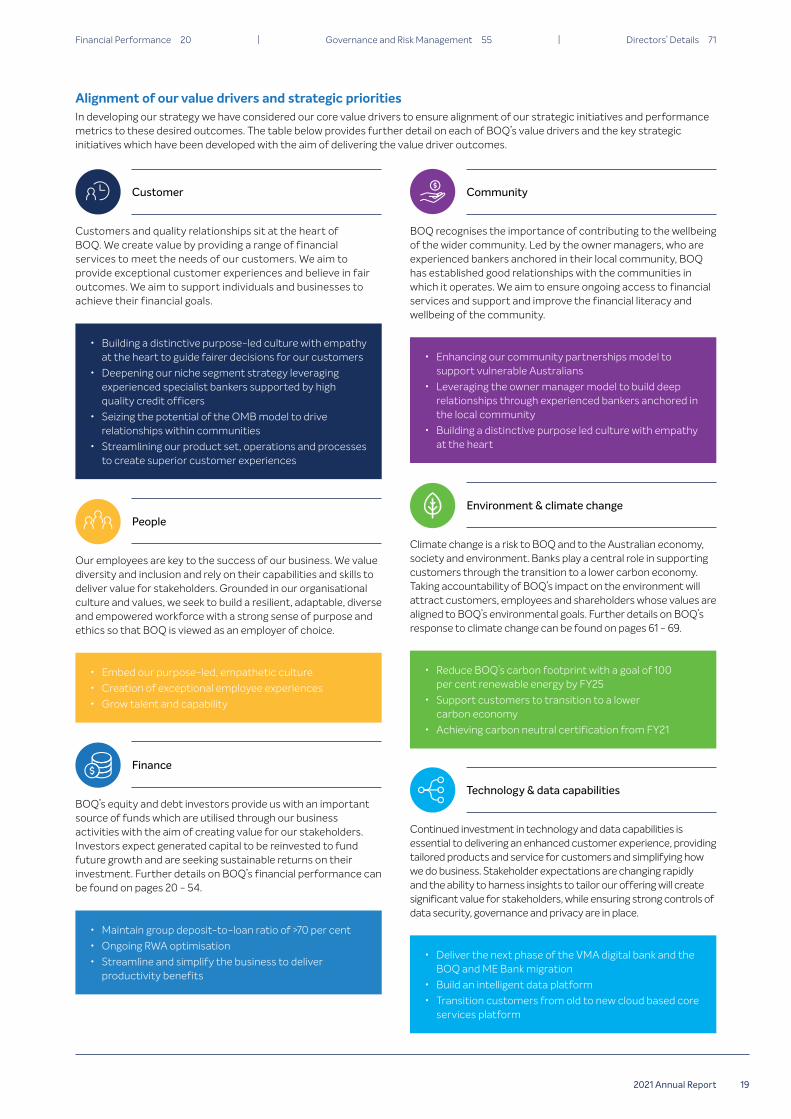
Alignment of our value drivers and strategic priorities In developing our strategy we have considered our core value drivers to ensure alignment of our strategic initiatives and performance metrics to these desired outcomes The table below provides further detail on each of BOQrsquos value drivers and the key strategic initiatives which have been developed with the aim of delivering the value driver outcomes
BOQ recognises the importance of contributing to the wellbeing of the wider community Led by the owner managers who are experienced bankers anchored in their local community BOQ has established good relationships with the communities in which it operates We aim to ensure ongoing access to financial services and support and improve the financial literacy and wellbeing of the community
Community
bull Enhancing our community partnerships model to support vulnerable Australians
bull Leveraging the owner manager model to build deep relationships through experienced bankers anchored in the local community
bull Building a distinctive purpose led culture with empathy at the heart
Customers and quality relationships sit at the heart of BOQ We create value by providing a range of financial services to meet the needs of our customers We aim to provide exceptional customer experiences and believe in fair outcomes We aim to support individuals and businesses to achieve their financial goals
Customer
bull Building a distinctive purpose-led culture with empathy at the heart to guide fairer decisions for our customers
bull Deepening our niche segment strategy leveraging experienced specialist bankers supported by high quality credit officers
bull Seizing the potential of the OMB model to drive relationships within communities
bull Streamlining our product set operations and processes to create superior customer experiences
Our employees are key to the success of our business We value diversity and inclusion and rely on their capabilities and skills to deliver value for stakeholders Grounded in our organisational culture and values we seek to build a resilient adaptable diverse and empowered workforce with a strong sense of purpose and ethics so that BOQ is viewed as an employer of choice
People
bull Embed our purpose-led empathetic culturebull Creation of exceptional employee experiencesbull Grow talent and capability
BOQrsquos equity and debt investors provide us with an important source of funds which are utilised through our business activities with the aim of creating value for our stakeholders Investors expect generated capital to be reinvested to fund future growth and are seeking sustainable returns on their investment Further details on BOQrsquos financial performance can be found on pages 20 - 54
Finance
bull Maintain group deposit-to-loan ratio of gt70 per centbull Ongoing RWA optimisationbull Streamline and simplify the business to deliver
productivity benefits
Continued investment in technology and data capabilities is essential to delivering an enhanced customer experience providing tailored products and service for customers and simplifying how we do business Stakeholder expectations are changing rapidly and the ability to harness insights to tailor our offering will create significant value for stakeholders while ensuring strong controls of data security governance and privacy are in place
bull Deliver the next phase of the VMA digital bank and the BOQ and ME Bank migration
bull Build an intelligent data platformbull Transition customers from old to new cloud based core
services platform
Climate change is a risk to BOQ and to the Australian economy society and environment Banks play a central role in supporting customers through the transition to a lower carbon economy Taking accountability of BOQrsquos impact on the environment will attract customers employees and shareholders whose values are aligned to BOQrsquos environmental goals Further details on BOQrsquos response to climate change can be found on pages 61 - 69
Environment amp climate change
bull Reduce BOQrsquos carbon footprint with a goal of 100 per cent renewable energy by FY25
bull Support customers to transition to a lower carbon economy
bull Achieving carbon neutral certification from FY21
192021 Annual Report
Financial Performance 20 | Governance and Risk Management 55 | Directorsrsquo Details 71
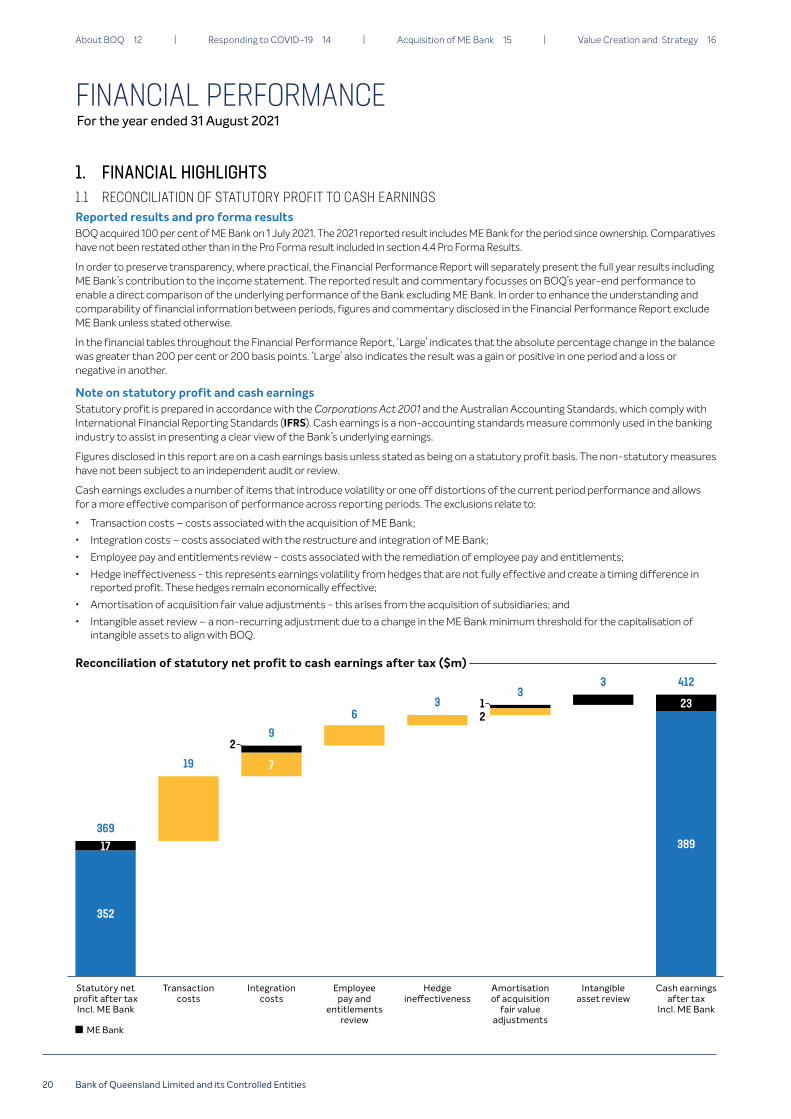
Transaction costs
Integration costs
1 FINANCIAL HIGHLIGHTS11 RECONCILIATION OF STATUTORY PROFIT TO CASH EARNINGSReported results and pro forma resultsBOQ acquired 100 per cent of ME Bank on 1 July 2021 The 2021 reported result includes ME Bank for the period since ownership Comparatives have not been restated other than in the Pro Forma result included in section 44 Pro Forma Results
In order to preserve transparency where practical the Financial Performance Report will separately present the full year results including ME Bankrsquos contribution to the income statement The reported result and commentary focusses on BOQrsquos year-end performance to enable a direct comparison of the underlying performance of the Bank excluding ME Bank In order to enhance the understanding and comparability of financial information between periods figures and commentary disclosed in the Financial Performance Report exclude ME Bank unless stated otherwise
In the financial tables throughout the Financial Performance Report lsquoLargersquo indicates that the absolute percentage change in the balance was greater than 200 per cent or 200 basis points lsquoLargersquo also indicates the result was a gain or positive in one period and a loss or negative in another
Note on statutory profit and cash earningsStatutory profit is prepared in accordance with the Corporations Act 2001 and the Australian Accounting Standards which comply with International Financial Reporting Standards (IFRS) Cash earnings is a non-accounting standards measure commonly used in the banking industry to assist in presenting a clear view of the Bankrsquos underlying earnings
Figures disclosed in this report are on a cash earnings basis unless stated as being on a statutory profit basis The non-statutory measures have not been subject to an independent audit or review
Cash earnings excludes a number of items that introduce volatility or one off distortions of the current period performance and allows for a more effective comparison of performance across reporting periods The exclusions relate to
bull Transaction costs ndash costs associated with the acquisition of ME Bank
bull Integration costs ndash costs associated with the restructure and integration of ME Bank
bull Employee pay and entitlements review - costs associated with the remediation of employee pay and entitlements
bull Hedge ineffectiveness - this represents earnings volatility from hedges that are not fully effective and create a timing difference in reported profit These hedges remain economically effective
bull Amortisation of acquisition fair value adjustments - this arises from the acquisition of subsidiaries and
bull Intangible asset review ndash a non-recurring adjustment due to a change in the ME Bank minimum threshold for the capitalisation of intangible assets to align with BOQ
Reconciliation of statutory net profit to cash earnings after tax ($m)
Hedge ineffectiveness
Employee pay and
entitlements review
ME Bank
Amortisation of acquisition
fair value adjustments
Intangible asset review
352
17
Statutory net profit after tax Incl ME Bank
369389
23
Cash earnings after tax
Incl ME Bank
412
19
9
36
33
7
21
2
20 Bank of Queensland Limited and its Controlled Entities
For the year ended 31 August 2021FINANCIAL PERFORMANCE
About BOQ 12 | Responding to COVID-19 14 | Acquisition of ME Bank 15 | Value Creation and Strategy 16
11 RECONCILIATION OF STATUTORY PROFIT TO CASH EARNINGS (CONTINUED)
(a) Reconciliation of Cash Earnings to Statutory Net Profit after tax
BOQ Year End Performance BOQ Half Year PerformanceYear End Incl ME
($ million) Aug-21 Aug-20Aug-21
vs Aug-20 Aug-21 Feb-21Aug-21
vs Feb-21 Aug-21
Cash earnings after tax 389 225 73 224 165 36 412
Amortisation of acquisition fair value adjustments (2) (4) (50) (1) (1) - (3)
Hedge ineffectiveness (3) (10) (70) (2) (1) 100 (3)
Transaction costs (19) - 100 (16) (3) Large (19)
Integration costs (7) - 100 (7) - 100 (9)
Intangible asset review and restructure - (80) (100) - - - (3)
Regulatory compliance - (5) (100) - - - -
Employee pay and entitlements review (6) (8) (25) - (6) (100) (6)
Other legacy items - (3) (100) - - - -
Statutory net profit after tax 352 115 Large 198 154 29 369
(b) Non-Cash Earnings Reconciling items
($ million)
Cash earnings
Aug-21
Amortisation of acquisition
fair value adjustments
Hedge ineffectiveness
Transaction costs
Integration costs
Employee pay and
entitlements review
Intangible asset
review
Statutory net profit
Aug-21
Net interest Income 1050 - - - - - - 1050
Non-Interest Income 125 - (5) - - - - 120
Total income 1175 - (5) - - - - 1170
Operating expenses (633) (3) - (20) (12) (10) - (678)
Underlying profit 542 (3) (5) (20) (12) (10) - 492
Loan impairment expense 20 - - - - - 20
Profit before tax 562 (3) (5) (20) (12) (10) - 512
Income tax expense (173) 1 2 1 5 4 - (160)
BOQ Profit after tax 389 (2) (3) (19) (7) (6) - 352
ME Bank Profit after tax 23 (1) - - (2) - (3) 17
Profit after tax 412 (3) (3) (19) (9) (6) (3) 369
212021 Annual Report
For the year ended 31 August 2021FINANCIAL PERFORMANCE
Financial Performance 20 | Governance and Risk Management 55 | Directorsrsquo Details 71
12 FINANCIAL SUMMARY
(1) Based on the Australian Prudential Regulation Authority guidance issued on 7 April 2020 BOQ determined to defer the decision on payment of an interim dividend Refer to BOQ Australian Securities Exchange (ASX) Release ldquoBOQ FY20 Interim Dividend Deferralrdquo 8 April 2020
(2) The basic and diluted earnings per share for 1H21 2H20 and 1H20 have been adjusted per ASX announcement on 20 April 2021(3) NIM including the two month impact of ME Bank is 190 per cent in 2H21 and 192 per cent in FY21(4) VMA operating costs have been restated from non-interest income and included in operating expenses per ASX announcement on 30 September 2021
Down 160bps (Excl ME)
Up 540bps
78 75
2H19 1H202H19 1H20
525 550 549 545
34
78
10
2H20 1H21 2H212H20 1H21 2H21
Cash cost to income (CTI) () (4) Cash return on average equity (ROE) ()
88533
Statutory net profit after tax ($m)Cash earnings after tax ($m)
Up 203 (Excl Me)Up 800 (Excl ME)
Up 29
2H19 1H202H19 1H20
14293
22
154198
17
2H20 1H21 2H21
153 15174
165224
23
2H20 1H21 2H21
Up 2bps
31
1722
6
6
2H19 1H20
904 991
2H19 1H20
DEFERRED
2H20 1H21 2H21
978 1003 980
2H20 1H21 2H21
Dividends per ordinary share (cents) (1)Common equity tier 1 (CET1) ()
ME Bank
Up 146
Up 3bps (Excl ME)
192 189366 343
2H19 1H20 2H19 1H20
192 195 195
158
355
2H20 1H21 2H21 2H20 1H21 2H21
Cash net interest margin (NIM) () (3)Cash basic earnings per share (EPS) (cents) (2)
388
22 Bank of Queensland Limited and its Controlled Entities
For the year ended 31 August 2021FINANCIAL PERFORMANCE
About BOQ 12 | Responding to COVID-19 14 | Acquisition of ME Bank 15 | Value Creation and Strategy 16
12 FINANCIAL SUMMARY (CONTINUED)
CASH EARNINGS AFTER TAX (1)
$389mIncrease of 73 per cent on FY20 driven by income growth and lower impairment provisions
CASH NET INTEREST MARGIN (1)
195Increase of four basis points on FY20 Flat NIM since 1H21 with funding cost benefits offsetting competition price pressures
CASH OPERATING EXPENSES (1)
$633mIncrease of three per cent on FY20 driven by investments in strategic technology projects and supporting business growth
LOAN IMPAIRMENT EXPENSE (1)
($20m)Includes a $69 million reduction in the collective provision
CET1
980Increase of two basis points on FY20 driven by cash earnings offset by high risk weighted asset (RWA) growth dividends and investment
CASH ROE
82Increase of 280 basis points on FY20 driven by higher earnings
BOQrsquos cash earnings after tax for FY21 was $389 million 73 per cent higher than the FY20 result Statutory net profit after tax was $352 million a 206 per cent increase on FY20 The increase in earnings was the result of a credit to loan impairment expense and increased net interest income partly offset by higher operating expenses
The Bank acquired 100 per cent of ME Bank on 1 July 2021 ME Bankrsquos cash earnings after tax for the two months since acquisition was $23 million Statutory net profit after tax was $17 million
Net interest incomeNet interest income of $1050 million increased by $64 million or six per cent on FY20 This was driven by four per cent growth in average interest earning assets and a four basis point increase in net interest margin to 195 per cent
Gross loans and advances growth of eight per cent was primarily driven by home lending which achieved growth of nine per cent This reflected continued strong new business volumes The commercial lending portfolio grew four per cent with growth across all business areas
NIM increased four basis points on FY20 This was primarily driven by lower funding costs due to the benefit of deposit repricing and improved mix together with lower hedging costs These were partially offset by competition in the market and the ongoing impact of a low interest rate environment on the returns on capital and the low cost deposit portfolio
Non-interest incomeNon-interest income of $125 million decreased by $3 million or two per cent on FY20 This was driven by lower insurance income with the material closure of St Andrewrsquos to new business in FY20 lower trading income and lower VMA card and insurance income that continued to be adversely impacted by the effect of COVID-19 on the travel industry
These were partly offset by income from a new card services arrangement with a third party supplier the reinstatement of some fees paused during COVID-19 and higher financial markets customer transactions
Operating expensesTotal operating expenses of $633 million increased by $21 million or three per cent on FY20 This increase was primarily driven by an investment in employees to deliver strategic priorities including the build out of the new Digital Bank and other technology projects and to support volume growth
The focus on growth and cost discipline has resulted in positive Jaws of two per cent and a reduction in the cost to income (CTI) ratio of 100 basis points on FY20
Loan impairment expenseLoan impairment expense was a credit of $20 million and compares to an expense of $175 million in FY20 This credit was driven by a reduction in the collective provision in FY21 of $69 million primarily due to an improved economic outlook and improvements in data quality relating to collateral In FY20 a collective provision overlay of $133 million was recorded for the potential impacts of COVID-19
Specific provision expense of $49 million increased by $2 million or four per cent on FY20 This was driven by one large facility in Retail and the impact of lockdowns on some niche medical practices in Asset finance partly offset by a write back of one large Agribusiness exposure that returned to performing
Capital managementCapital management BOQ CET1 ratio of 980 per cent is 23 basis points lower than 1H21 This was driven by strong growth in risk weighted assets and continued capital investment in the digital transformation The acquisition of ME Bank was fully capital funded with no impact on CET1
Shareholder returnsBOQ has determined to pay an ordinary dividend of 22 cents per share for 2H21 That takes the FY21 dividend to 39 cents per share which is 61 per cent of FY21 cash earnings The Board has committed to a target dividend payout ratio of 60-75 per cent of full year cash earnings
(1) Metrics relate to BOQ only and do not include ME Bank
232021 Annual Report
For the year ended 31 August 2021FINANCIAL PERFORMANCE
Financial Performance 20 | Governance and Risk Management 55 | Directorsrsquo Details 71
12 FINANCIAL SUMMARY (CONTINUED)
Acquisition of ME Bank
Acquisition overview and AccountingBOQ acquired 100 per cent of the share capital of ME Bank on 1 July 2021 ME Bank operates in the retail segment of the domestic market offering primarily home loan products and everyday transaction and online savings accounts The acquisition provides BOQ with significantly enhanced scale and portfolio mix broadly doubling the Retail bank GLAs and providing geographical and customer segment diversification BOQ and ME Bank have strong complementary challenger brands with a shared customer centric culture It also provides an opportunity to accelerate BOQrsquos digital strategy providing a clear pathway to a cloud based common digital Retail bank core banking platform
The fair values of the ME assets and liabilities acquired have been determined on a provisional basis with resulting goodwill of $35 million as outlined below
($ million) Aug-21
ME Bank book value of assets acquired 1646
Fair value adjustments
Loans and advances 16
Deposits and other borrowings (5)
Intangibles
Brand 26
Customer relationships 31
Total Intangibles 57
Deferred tax liabilities (46)
Total fair value adjustments of net assets acquired 22
Net identifiable assets and liabilities 1668
Other equity instruments (1) (315)
Provisional goodwill arising on acquisition 35
Total purchase consideration transferred 1388
(1) Other equity instruments of $315 million include Additional Tier 1 (AT1) securities assumed on the acquisition of ME Bank
The intangibles are expected to amortise over a period of between 6 and 10 years Similar to previous acquisitions this amortisation will be treated as a statutory adjustment and not included in cash earnings Further details of the acquisition are disclosed in Note 55 (ii) Business combinations during the year
Integration progressThe integration of ME Bank is well progressed In order to reduce risk a phased approach to integration was developed Following the pre-completion phase and successful completion of the transaction on 1 July 2021 a 90 day sprint was undertaken to ensure a strong start to the integration program and to build momentum During this period a number of key integration milestones have been achieved
bull Ensuring continuity of operations for our customers
bull Validation of integration hypotheses and development of detailed work stream integration plans finalised
bull BOQ Group operating model refreshed and communicated
bull Consolidated leadership team in place with clear accountabilities
bull Strategic sourcing consolidation commenced
bull Refinement of the BOQ Group Technology roadmap and
bull Clear pathway to ME Bank ADI license handback determined expected to occur in early calendar 2022
The scale phase of the integration program will include
bull Consolidation of ME Bank and BOQ on to a single ADI which is critical to delivery of a number of synergies
bull Execution of the technology roadmap alongside the broader transformation program and
bull Consolidation of shared service functions supply chain and property activities
24 Bank of Queensland Limited and its Controlled Entities
For the year ended 31 August 2021FINANCIAL PERFORMANCE
About BOQ 12 | Responding to COVID-19 14 | Acquisition of ME Bank 15 | Value Creation and Strategy 16
12 FINANCIAL SUMMARY (CONTINUED)
Acquisition of ME Bank (continued)
Integration expenses and synergiesIntegration expenditure is expected to range between $130 million and $140 million (pre-tax) with the majority to be incurred in the first two years Due to the size and non-recurring nature of these costs they will be treated as a statutory adjustment and not included in cash earnings
The amount of integration expenditure for the two months to 31 August 2021 including ME Bank was $13 million (pre-tax) Further integration costs of between $70 million and $80 million (pre-tax) are expected to be incurred in FY22
The acquisition is expected to realise significant pre-tax cost synergies with further potential upside from revenue benefits funding savings and investment net capitalised investment (CAPEX) synergies
The cost synergies are primarily expected to be derived from having complementary businesses alignment of operating models and technology roadmaps and consolidation of supply chains and shared services functions Approximately 60 per cent of the synergies are expected to be delivered through operating model changes with the balance from reduced project expenditure supply chain and other synergies
The fast start to the integration program has accelerated the delivery of these synergies with accelerated cost synergies of $30 to $34 million expected to be delivered in FY22 The remainder of the $70 to $80 million of cost synergies is expected to be delivered in FY23 with potential upside for additional synergies in FY24 following completion of the technology integration initiatives
Other benefits expected to be derived in FY22 from the acquisition include
bull CAPEX expenditure benefits of circa $15 million from the consolidated investment roadmap
bull further NIM benefits from wholesale and retail deposits and
bull non-interest income benefits
252021 Annual Report
For the year ended 31 August 2021FINANCIAL PERFORMANCE
Financial Performance 20 | Governance and Risk Management 55 | Directorsrsquo Details 71
2 GROUP PERFORMANCE ANALYSIS21 INCOME STATEMENT AND KEY METRICS
Year End Performance Half Year PerformanceYear End Incl ME
($ million) Aug-21 Aug-20Aug-21
vs Aug-20 Aug-21 Feb-21Aug-21 vs
Feb-21 Aug-21
Net interest income 1050 986 6 538 512 5 1128
Non-interest income (1)(2) 125 128 (2) 59 66 (11) 130
Total income (2) 1175 1114 5 597 578 3 1258
Operating expenses (1)(2) (633) (612) 3 (318) (315) 1 (684)
Underlying profit (2) 542 502 8 279 263 6 574
Loan impairment expense 20 (175) Large 44 (24) Large 21
Profit before tax (2) 562 327 72 323 239 35 595
Income tax expense (2) (173) (102) 70 (99) (74) 34 (183)
Cash earnings after tax 389 225 73 224 165 36 412
Statutory net profit after tax (2) 352 115 Large 198 154 29 369
Year End Performance Half Year Performance
Key Metrics Aug-21 Aug-20Aug-21
vs Aug-20 Aug-21 Feb-21Aug-21
vs Feb-21
SHAREHOLDER RETURNS (3)
Share price ($) 946 613 54 946 879 8
Market capitalisation (4) ($ million) 6063 2785 118 6063 4004 51
Dividends per ordinary share (fully franked) (5) (cents) 39 12 Large 22 17 29
CASH EARNINGS BASIS (3)
Basic earnings per share (EPS) (5)(6) (cents) 747 496 51 388 355 9
Diluted EPS (5)(6) (cents) 695 451 54 362 328 10
Dividend payout ratio () 606 242 Large 571 659 Large
STATUTORY BASIS (3)
Basic EPS (6) (cents) 670 254 164 340 329 3
Diluted EPS (6) (cents) 626 244 157 318 305 4
Dividend payout ratio () 677 474 Large 656 706 Large
(1) VMA operating costs have been restated from non-interest income and included in operating expenses per ASX announcement on 30 September 2021(2) Refer to Section 11 Reconciliation of statutory net profit to cash earnings after tax for a reconciliation of cash earnings to statutory net profit after tax(3) All metrics relate to BOQ including ME Bank(4) Includes $135 billion capital raise announced 22 February 2021 for ME Bank acquisition(5) The basic and diluted earnings per share for all prior periods have been adjusted per ASX announcement on 20 April 2021(6) The sum of 1H21 and 2H21 EPS does not equal FY21 due to the impact of the capital raising and the uneven distribution of cash earnings after tax across the two halves
of the year
26 Bank of Queensland Limited and its Controlled Entities
For the year ended 31 August 2021FINANCIAL PERFORMANCE
About BOQ 12 | Responding to COVID-19 14 | Acquisition of ME Bank 15 | Value Creation and Strategy 16
21 INCOME STATEMENT AND KEY METRICS (CONTINUED)
Year End Performance Half Year PerformanceYear End Incl ME
Key Metrics Aug-21 Aug-20Aug-21
vs Aug-20 Aug-21 Feb-21Aug-21
vs Feb-21 Aug-21
PROFITABILITY AND EFFICIENCY MEASURES
CASH EARNINGS BASIS
Net profit after tax ($ million) 389 225 73 224 165 36 412
Underlying profit (1) ($ million) 542 502 8 279 263 6 574
NIM(2) () 195 191 4bps 195 195 - 192
Cost to income ratio (CTI) (3) () 539 549 (100bps) 533 545 (120bps) 544
Loan Impairment expense to GLA (bps) (4) 37 (41bps) (17) 10 (27bps) (3)
Return on average equity (ROE) (4) () 82 54 Large 88 78 100bps 82
Return on average tangible equity (ROTE) (4)(5) () 102 69 Large 109 99 100bps 102
STATUTORY BASIS
Net profit after tax ($ million) 352 115 Large 198 154 29 369
Underlying profit (1) ($ million) 492 348 41 245 247 (1) 517
NIM(2) () 195 191 4bps 195 195 - 192
CTI () 579 684 Large 587 572 150bps 587
Loan impairment expense to GLA (bps) (4) 37 (41bps) (17) 10 (27bps) (3)
ROE (4) () 74 28 Large 78 72 60bps 74
ROTE (4)(5) () 92 36 Large 96 92 40bps 92
ASSET QUALITY
30 days past due (dpd) arrears (6) ($ million) 516 567 (9) 516 575 (10) 941
90dpd arrears (6) ($ million) 321 433 (26) 321 381 (16) 593
Impaired assets ($ million) 209 195 7 209 194 8 243
Specific provisions to impaired assets () 51 48 Large 51 53 (200bps) 44
Total provision and general reserve for credit losses (GRCL) coverage GLA (6) (bps) 76 98 (22bps) 76 95 (19bps) 63
CAPITAL (7)
CET1 ratio () 980 978 2bps 980 1003 (23bps) 980
Total capital adequacy ratio () 1260 1273 (13bps) 1260 1383 (123bps) 1260
Risk weighted assets ($ million) 44229 31576 40 44229 32126 38 44229
(1) Profit before loan impairment expense and tax(2) NIM is calculated net of offset accounts(3) VMA operating costs have been restated from non-interest income and included in operating expenses per ASX announcement on 30 September 2021(4) Metrics relate to BOQ Including ME Bank(5) Based on after tax earnings applied to average shareholdersrsquo equity (excluding shares and treasury shares) less goodwill and identifiable intangible assets (customer related
intangiblesbrands and computer software)(6) Excludes the impact of fair value adjustments on the acquisition of ME Bank Arrears have been presented on an unadjusted basis(7) All capital measures are as at 31 August 2021 and include ME Bank impacts
272021 Annual Report
For the year ended 31 August 2021FINANCIAL PERFORMANCE
Financial Performance 20 | Governance and Risk Management 55 | Directorsrsquo Details 71
22 NET INTEREST INCOME
Year End Performance Half Year PerformanceYear End Incl ME
$ million Aug-21 Aug-20Aug-21
vs Aug-20 Aug-21 Feb-21Aug-21
vs Feb-21 Aug-21
Net Interest Income 1050 986 6 538 512 5 1128
Average interest earning assets 53810 51763 4 54667 52952 3 58656
NIM 195 191 4bps 195 195 - 192
Net interest income increased by $64 million or six per cent on FY20 driven by four per cent growth in average interest earnings assets and a four basis points increase in NIM
2H21 net interest income also increased $26 million or five per cent on 1H21 driven by three per cent growth in average interest earnings assets and three extra days which added $9 million NIM was flat in 2H21 as the benefits from deposit repricing and lower wholesale funding costs were offset by the ongoing impact of competition for new housing on front book rates retention discounting and a switch from variable to fixed rate lending The low interest rate environment continued to adversely impact returns on capital and the low cost deposit portfolio
ME Bank net interest income in the two months since acquisition of $78 million was earned on $285 billion of average interest earning assets This includes an effective interest adjustment of $5 million following a fair value adjustment to the loan portfolio on acquisition This results in a Group NIM for FY21 including ME of 192 per cent (2H21 of 190 per cent)
Net interest margin - February 2021 to August 2021
NIM in 2H21 was in line with the prior half at 195 per cent The key drivers of the movement are set out below
Asset pricing and mix Reduced margin by 10 basis points on 1H21 This was driven by continued competition for new housing and commercial lending through lower front book rates retention discounting and customers switching from variable to lower margin fixed rate loans
Funding costs and mix Improved margin by 13 basis points This was primarily driven by active repricing of at-call retail and Treasury term deposits and money market portfolios as well as an improvement in portfolio mix as at-call growth continued while more expensive term deposit funding was run-off Margin also benefitted from a reduction in wholesale funding costs including a one basis point benefit from utilisation of the Term Funding Facility (TFF)
Hedging costs No change as cash-bills spreads were steady at an average of one basis point
Capital and low cost deposits Reduced margin by two basis points as the low market rate environment continued to impact on returns from the $46 billion replicating portfolio (covering BOQrsquos capital and invested low cost deposits) uninvested capital and low cost deposits
Liquidity and other Reduced margin by one basis point due to lower wholesale asset spreads higher amortisation of acquisition costs and owner manager commissions due to higher asset growth and the conversion of branches from corporate to owner-manager Liquidity levels had minimal impact on NIM during the half
2H21 Excl ME Bank
036 (1)
195
231
ME Bank 2H21 Incl ME Bank
032 (1)
190
222
1H21
035 (1)
195
230
Asset pricing and mix
(010)
Funding costs and mix
013
Hedging costs
000 (001) (005)
Capital and low cost deposits
(002)
Liquidity and other
(1) Third party costs largely represent commissions to owner-managers and brokers
ME Bank NIM Third party costs (1)
28 Bank of Queensland Limited and its Controlled Entities
For the year ended 31 August 2021FINANCIAL PERFORMANCE
About BOQ 12 | Responding to COVID-19 14 | Acquisition of ME Bank 15 | Value Creation and Strategy 16
23 NON-INTEREST INCOME
Year End Performance Half Year PerformanceYear End Incl ME
$ million Aug-21 Aug-20Aug-21 vs
Aug-20 Aug-21 Feb-21Aug-21 vs
Feb-21 Aug-21
Banking Income 69 69 - 34 35 (3) 72
Insurance Income 7 11 (36) 3 4 (25) 7
Other Income (1)(2) 48 43 12 23 25 (8) 50
Trading income 1 5 (80) (1) 2 (150) 1
Total non-interest income (1)(2) 125 128 (2) 59 66 (11) 130
(1) VMA operating costs have been restated from non-interest income and included in operating expenses per ASX announcement on 30 September 2021(2) Refer to Section 11 (B) Non-cash earnings reconciling items for a reconciliation of cash non-interest income to statutory non-interest income
Non-interest income of $125 million decreased by $3 million or two per cent on FY20 driven by lower insurance and trading income
Banking income was in line with FY20 and decreased $1 million or three per cent on 1H21 This reflects the ongoing shift in consumer preference to low or no fee products and a reduction in dishonour and overdrawn account fees This was partly offset by increased merchant terminal income from small business customers Financial Markets customer transactions and the reinstatement of some fees that were paused during COVID-19 in FY20
Other income increased $5 million or 12 per cent on FY20 The increase was mainly due to income from a new card services arrangement with a third party supplier including a one-off benefit in 1H21 of $3 million This was partly offset by lower VMA card and insurance income that continued to be adversely impacted by the effect of COVID-19 on the travel industry
Trading income of $1 million decreased by $4 million or 80 per cent on FY20 as a lack of volatility and lower interest rate environment reduced trading income opportunities together with reduced market exposures and widening in credit spreads in 2H21
Insurance income is discussed in detail in Section 24 below
ME Bank non-interest income in the two months since acquisition of $5 million primarily comprised banking fee income in relation to lending and in the cards portfolio
24 INSURANCE OVERVIEWYear End Performance Half Year Performance
$ million Aug-21 Aug-20Aug-21 vs
Aug-20 Aug-21 Feb-21Aug-21 vs
Feb-21
Gross written premium (net of refunds) 46 49 (6) 23 23 -
Net earned premium 42 50 (16) 21 21 -
Underwriting result 6 9 (33) 2 4 (50)
Other insurance income - 1 (100) - - -
Total income 6 10 (40) 2 4 (50)
Consolidation adjustment 1 1 - 1 - -
Group insurance result 7 11 (36) 3 4 (25)
St Andrewrsquos contributed $7 million to non-interest income in FY21 a decrease of $4 million or 36 per cent on FY20 This reflects the decision to materially close to new business in FY20
Gross written premium (net of refunds) declined $3 million on FY20 The underwriting result was also $3 million lower compared to the prior year with reduced net earned premium partly offset by reduced commission and acquisition costs Other insurance income was impacted by reduced yields on term deposits and no account management service fees which ceased in 1H20 With the exception of term deposit yields which are market driven these trends are consistent with the decision to close to new business
The sale of St Andrewrsquos is subject to regulatory approval and is expected to complete in 1H22
292021 Annual Report
For the year ended 31 August 2021FINANCIAL PERFORMANCE
Financial Performance 20 | Governance and Risk Management 55 | Directorsrsquo Details 71
25 OPERATING EXPENSES
Year End Performance Half Year PerformanceYear End Incl ME
$ million Aug-21 Aug-20Aug-21 vs
Aug-20 Aug-21 Feb-21Aug-21 vs
Feb-21 Aug-21
Salaries and on costs (1) 305 274 11 152 153 (1) 329
Employee share programs and other 14 14 - 7 7 - 14
EMPLOYEE EXPENSES (1) 319 288 11 159 160 (1) 343
Data processing (1) 117 118 (1) 58 59 (2) 120
Amortisation - intangible assets 39 39 - 22 17 29 43
Depreciation - fixed assets 1 1 - 1 - 100 1
TECHNOLOGY EXPENSES (1) 157 158 (1) 81 76 7 164
Marketing (1) 32 28 14 20 12 67 34
Commission to owner-managed branches (OMB) 4 5 (20) 2 2 - 4
Communications print and stationery 19 20 (5) 9 10 (10) 23
Processing costs 14 13 8 7 7 - 14
Other (1) 18 29 (38) 7 11 (36) 25
OPERATIONAL EXPENSES (1) 87 95 (8) 45 42 7 100
Depreciation - right-of-use assets amp lease expenses 28 27 4 14 14 - 30
Depreciation - fixed assets 9 10 (10) 4 5 (20) 9
Other 3 2 50 2 1 100 3
OCCUPANCY EXPENSES 40 39 3 20 20 - 42
Professional fees 17 21 (19) 7 10 (30) 21
Directors fees 2 2 - 1 1 - 2
Other 11 9 22 5 6 (17) 12
ADMINISTRATION EXPENSES 30 32 (6) 13 17 (24) 35
Total operating expenses (1)(2) 633 612 3 318 315 1 684
CTI (1) 539 549 (100bps) 533 545 (120bps) 544
Number of employees (FTE) (1) 2218 2052 8 2218 2176 2 3319
(1) VMA operating costs have been restated from non-interest income and included in operating expenses per ASX announcement on 30 September 2021 FTE has also been restated
(2) Refer to Section 11 (B) Non-cash earnings reconciling items for a reconciliation of cash operating expenses to statutory operating expenses
SummaryTotal operating expenses of $633 million increased by $21 million or three per cent on FY20 This increase was primarily driven by an investment in employees to deliver strategic priorities including the build out of the new Digital Bank and to support volume growth particularly in the areas of operations product and marketing
Employee expensesEmployee expenses of $319 million increased by $31 million or 11 per cent on FY20 This was driven by an increase of eight per cent in full time equivalent staff
The staff increases were primarily due to continued investment in strategic technology projects including the build out of the new Digital Bank additional resources to support volume growth to provide support to customers impacted by COVID-19 and for risk and compliance activities including financial crime It also reflects higher annual leave expense impacted by continued lockdowns These were partly offset by the full year benefits from restructures in the prior year
Technology expensesTechnology expenses of $157 million decreased by $1 million or one per cent on FY20 The decrease was mainly driven by costs incurred in the prior year on risk and regulatory projects one-off costs for the transition of data centres and productivity initiatives including supply chain management These were partly offset by additional costs associated with the new Digital Bank and higher storage and support costs driven by business volumes
Amortisation expense of $39 million was in line with FY20 Projects that became fully amortised were replaced by newly amortising assets with the newly amortising assets including Phase 1 of the new Digital Bank being more weighted to 2H21
30 Bank of Queensland Limited and its Controlled Entities
For the year ended 31 August 2021FINANCIAL PERFORMANCE
About BOQ 12 | Responding to COVID-19 14 | Acquisition of ME Bank 15 | Value Creation and Strategy 16
25 OPERATING EXPENSES (CONTINUED)Operational expensesOperational expenses of $87 million decreased by $8 million or eight per cent on FY20 The primary drivers were lower discretionary expenditure including travel and entertainment lower non-lending losses and lower consumable costs associated with COVID-19 These were partly offset by higher marketing spend on the launch of the new Digital Bank and to drive increased lending volumes
Administration expensesAdministration expenses of $30 million decreased by $2 million or six per cent on FY20 driven by lower external legal costs partly offset by an increase in group insurance costs
ME Bank expensesME Bank operating expenses in the two months since acquisition of $51 million are primarily driven by employee expenses in relation to MErsquos 1101 FTE
26 CAPITALISED INVESTMENT EXPENDITUREBOQrsquos comprehensive digital transformation continues with Phase 1 of building a next generation core platform through VMA delivered and providing an enhanced experience for customers using our transaction accounts savings accounts and credit cards Leveraging this foundational work to ensure a similar experience is delivered to new BOQ Retail deposit customers is well progressed Investment continues in the digital capability of VMA and BOQ Retail Transformation with an expanded offering to Term Deposit and Lending customers currently in development
In addition to these customer focused initiatives we have completed key foundational components of Open Banking and are well progressed in our planning and development of key workplace tools that will assist in delivering a productive and engaged workforce ME Bank will continue with its development of innovative consumer deposit and lending solutions whilst we look to leverage synergies and capability across our complete digital transformation program
Subject to the intangible asset review in 1H22 the carrying value of intangible assets is expected to increase further in FY22 with continued investment in the digital capability of VMA digital transformation of Retail banking (ME Bank and BOQ) Open Banking and BOQrsquos Enterprise Data Management Platform These foundational investments align to BOQrsquos digital transformation strategy and will provide our customers with better access to our products and services through easy to use digital experiences that are focused on their needs
Carrying value of IT intangible assets ($m)
Feb 20
94
129
223
Aug 20
95
121
216
Feb 21
105
131
236
Aug 21
193
97
110
400
ME Bank Intangibles
Assets under construction
Software intangible assets
312021 Annual Report
For the year ended 31 August 2021FINANCIAL PERFORMANCE
Financial Performance 20 | Governance and Risk Management 55 | Directorsrsquo Details 71
27 LENDINGGross loans and advances of $506 billion grew by $36 billion or eight per cent on FY20 This was primarily achieved through above system growth in home lending with BOQ Blue BOQ Specialist and VMA all contributing strong lending volumes Commercial lending growth recovered in 2H21 at seven per cent with all business units reflecting growth
As at Incl ME
$ million Aug-21 Feb-21 Aug-20 Aug-21
vs Feb-21 (1) Aug-21
vs Aug-20 Aug-21
Housing lending 32433 30187 28891 15 12 53146
Housing Lending - APS 120 qualifying securitisation (2) 1668 1965 2264 (30) (26) 5907
34101 32152 31155 12 9 59053
Commercial lending (3) 9879 9531 9479 7 4 9879
Asset finance 6457 6278 6259 6 3 6457
Consumer (3) 152 147 150 7 1 359
Gross loans and advances (4) 50589 48108 47043 10 8 75748
Provisions for impairment (313) (374) (369) (33) (15) (311)
Net loans and advances 50276 47734 46674 11 8 75437
(1) Growth rates have been annualised(2) Securitised loans subject to capital relief under APRA Prudential Standard APS 120 Securitisation (APS 120)(3) BOQ Specialist consumer products have been reclassified to commercial lending to align product definitions All periods reflect this restatement and are presented on a
like-for-like basis(4) Gross loans and advances aligns to the Financial Statement Note 33 Loans and Advances Gross loans and advances after deducting Unearned finance lease income
32 Bank of Queensland Limited and its Controlled Entities
For the year ended 31 August 2021FINANCIAL PERFORMANCE
About BOQ 12 | Responding to COVID-19 14 | Acquisition of ME Bank 15 | Value Creation and Strategy 16
27 LENDING (CONTINUED)
Growth in housing lending ($m)
Housing (Excl ME Bank)The housing portfolio grew by $29 billion or nine per cent on FY20 representing 17x system growth Positive growth was achieved across all three channels for the first time since FY15 as momentum steadily accelerated over the financial year
Settlement volumes increased 55 per cent on FY20 a function of strong application flow in a buoyant property market and improved conversion rates 1H21 growth was largely driven by owner occupied loans weighted towards fixed rate lending 2H21 growth was characterised by growth across investor and owner occupied loans resulting in an improved margin outcome The turnaround in performance was driven by embedding the Retail Banking strategy which included mortgage process simplification improved retail banking and lending capability an uplift in customer experience and quality third party broker relationships The mortgage net promoter score (NPS) has also improved from -2 in August 2020 to +4 in August 2021
The BOQ Blue portfolio grew by $14 billion a turnaround of $21 billion from the previous year and the first positive full year result since FY15 This strong result was underpinned by a back-to-growth performance delivered out of the branch network and a doubling of Broker originated settlements
The Broker channel grew by $11 billion or 36 per cent on FY20 This result was achieved by a focus on building and growing quality new and existing third party partnerships competitive pricing and consistent credit decisions Broker and customer experience have improved due to the release of new broker enabled technologies and the delivery of consistent process efficiencies reflected in an improved NPS result Focus remains on continually improving mortgage processes
The BOQ branch portfolio also reflected a turnaround in its performance of $11 billion as it delivered positive growth of $04 billion the first full year of growth since FY14 The corporate and owner-manager network both contributed to the improved performance with a combined uplift in settlement volumes of 55 per cent
The VMA mortgage portfolio continued to deliver strong growth in FY21 The portfolio grew by $10 billion or 32 per cent on FY20 taking the portfolio to over $43 billion The VMA brand is a globally recognised brand which tends to attract a more tech-savvy customer base and contributes to the Bankrsquos geographical diversification by targeting metropolitan-based customers across Australia
BOQ Specialist home lending portfolio grew by $05 billion or nine per cent on FY20 Settlement volumes increased in the second half and the focus returned to new business as clientsrsquo exited COVID-19 relief and returned to normal payment cycles BOQ Specialist continues to deliver above system growth by building relationships with health professionals in the early stages of their careers and providing a superior service and modern digital banking solutions creating future opportunities for BOQ Specialist to meet the commercial lending needs of these medical dental veterinary and accounting professionals
Housing (Incl ME Bank) The consolidated housing portfolio grew by $24 billion or four per cent on FY20 ME Bank housing portfolio contracted $05 billion in the two months since acquisition largely due to softer application flow in the preceding quarter which has since improved and an increase in runoff
Integration activities and mortgage process simplification work is well underway with the objective of returning the ME housing portfolio to growth in a sustainable way
FY21
95 GROWTH17X SYSTEM (1)
1040
476
1430
(484)
2946 (Excl ME)
FY20
17 GROWTH09X SYSTEM (1)
714
508
(714)
508
(1) Source represents latest available APRA Monthly Banking Statistics as at August 2021 Reflects the APRA definition of lending and therefore will not directly correlate to the balance sheet growth
(2) BOQ Blue includes housing in both the Retail Bank and BOQ Business primarily from the branch network and broker channels
ME Bank
VMA Home Loans
BOQ Specialist
BOQ Blue (2)
332021 Annual Report
For the year ended 31 August 2021FINANCIAL PERFORMANCE
Financial Performance 20 | Governance and Risk Management 55 | Directorsrsquo Details 71
The commercial lending portfolio grew by $04 billion in FY21 representing growth of four per cent on FY20 or 08x system growth BOQ Commercial lending includes both corporate and small business lending while BOQ Specialist has commercial lending and Asset finance products and BOQ Finance has asset finance products
BOQ commercial lending grew by $02 billion or four per cent and was mainly driven by growth in the corporate lending portfolio across construction agribusiness and property segments The small business lending portfolio contributed over $50 million of growth driven by more simplified credit assessments automation in the application process and was supported by several small business strategic initiatives This result reverses over five years of contraction in this portfolio and was underpinned by the deeper relationships established through the COVID-19 support offered to clients The small business strategy continues to focus on improving branch capability risk policy product features and business lending process transformation to further grow our portfolio in this segment
The BOQ Specialist commercial lending portfolio grew by $02 billion or seven per cent due to a strong second half The growth was mainly achieved in corporate healthcare and small business lending as the brand offers bespoke solutions to medical dental and veterinary professionals Corporate Healthcare lending also grew as customer relationships are built from graduation through to retirement increasing the diversity of both the home lending and business lending portfolios
The Asset finance portfolio grew by $02 billion or three per cent on FY20 compared to negative system growth The growth was driven by continued momentum in the Equipment Finance portfolio which grew by $02 billion The main growth industries in FY21 were transport agriculture and healthcare This growth was partly offset by a contraction in BOQ Specialist asset financing in particular in the dentistry industry where fewer new practices were established
27 LENDING (CONTINUED)Growth in commercial lending ($m)
Growth in Asset finance lending ($m)
FY20
237
106
343
38 GROWTHPOSITIVE SYSTEM (1)(3)
FY21
249
151
400
42 GROWTH08X SYSTEM (1)
FY20
02 GROWTHPOSITIVE SYSTEM (2)(3)
FY21
198
32 GROWTHPOSITIVE SYSTEM (2)
(1) Commercial system growth represents latest available APRA Monthly Banking Statistics as at August 2021 Reflects the APRA definition of lending adjusted for intra period reclassifications and growth in the BOQ Finance non-ADI Asset finance business ldquoPositive systemrdquo represents a growth better than system whereas ldquoNegative systemrdquo represents growth worse than system
(2) Asset finance system growth represents latest available Australian Finance Industry Association (AFIA) system growth statistics as at July 2021
(3) FY20 commercial lending growth increased from 34 per cent to 38 per cent due to the following restatements(a) Commercial lending growth increased by $13 million to align product
definitions where BOQ Specialist working capital products have been reclassified from consumer to commercial lending and
(b) BOQ Specialist Asset finance products were reclassified from commercial lending to Asset finance This decreased commercial lending growth and increased Asset finance growth by $7 million
BOQ Specialist
BOQ Blue
15
273
(75)
BOQ Finance
BOQ Specialist
78
34 Bank of Queensland Limited and its Controlled Entities
For the year ended 31 August 2021FINANCIAL PERFORMANCE
About BOQ 12 | Responding to COVID-19 14 | Acquisition of ME Bank 15 | Value Creation and Strategy 16
28 CUSTOMER DEPOSITSAs at Incl ME
$ million Aug-21 Feb-21 Aug-20 Aug-21
vs Feb-21 (1) Aug-21
vs Aug-20 Aug-21
Term deposits 14678 14240 15013 6 (2) 21991
Savings and investment accounts 15643 14411 13337 17 17 24293
Transaction accounts 4409 4020 3596 19 23 5377
Sub-total 34730 32671 31946 13 9 51661
Mortgage offsets (2) 3302 3152 2816 10 17 4808
Customer deposits 38032 35823 34762 12 9 56469
Deposit to loan ratio 75 74 74 1 1 75
(1) Growth rates have been annualised (2) Mortgage offset balances are netted against home loans for the purposes of customer interest payments
Customer depositsCustomer deposits grew by $33 billion or nine per cent on FY20 consistent with the Bankrsquos strategy to increase stable sources of funding while also reflecting ongoing high levels of liquidity in the market
The Retail Bank remains the primary source of customer deposits with the majority generated through the branch network The majority of inflows in FY21 have been in transaction savings and investment accounts partially reducing reliance on term deposits as the customer deposits mix rebalanced
The Bank has continued to maintain a strong liquidity position As growth in customer deposits was slightly above lending growth the deposit to loan ratio increased by one per cent on FY20 to 75 per cent
Term depositsTerm deposits decreased by $03 billion or two per cent on FY20 This was due to pricing actions to manage liquidity and reduce the cost of funds in the low rate environment and changes in customer preferences towards call accounts As a result term deposits have reduced from 43 per cent of the total portfolio in August 2020 to 39 per cent in August 2021
Savings and investment accountsSavings and investment accounts grew by $23 billion or 17 per cent on FY20 with both retail and commercial accounts growing strongly
The Bonus Interest Savings Account (BISA) achieved growth of over 30 per cent in FY21 and 17 per cent (annualised) in 2H21 and accounted for the majority of the growth in retail products across both periods The growth is attributed to the highly accessible and flexible product offering competitive rates during FY21
Transaction accounts and mortgage offsetsTransaction accounts and mortgage offsets grew by $08 billion and $05 billion on FY20 respectively The growth in transaction accounts reflected COVID-19 government stimulus payments to both small businesses and individuals and the impact of lockdowns in reducing living costs including travel and entertainment Higher offset balances also reflected the growth in home lending
ME Bank customer depositsME Bank customer deposits contributed $184 billion to Group deposits at August 2021 resulting in a combined deposit to loan ratio of 75 per cent The customer deposit products are similar to BOQ and the mix is comparable with term deposits representing 40 per cent of the total portfolio Savings and Investment accounts achieved the highest growth at over 30 per cent since August 2020 partly offset by a decrease in term deposits of three per cent
352021 Annual Report
For the year ended 31 August 2021FINANCIAL PERFORMANCE
Financial Performance 20 | Governance and Risk Management 55 | Directorsrsquo Details 71
3 BUSINESS SETTINGS31 ASSET QUALITY
Full Year Performance Half Year PerformanceYear End Incl ME
Aug-21 Aug-20Aug-21
vs Aug-20 Aug-21 Feb-21Aug-21
vs Feb-21 Aug-21
Loan impairment expense ($ million) (20) 175 Large (44) 24 Large (21)
Loan impairment expense GLA (bps) (4) 37 (41bps) (17) 10 (27bps) (3)
Impaired assets ($ million) 209 195 7 209 194 8 243
30dpd arrears (1) ($ million) 516 567 (9) 516 575 (10) 941
90dpd arrears (1) ($ million) 321 433 (26) 321 381 (16) 593
90dpd arrears GLA (1) (bps) 63 92 (29bps) 63 79 (16bps) 78
Total provision and GRCL GLA (1)(2) (bps) 76 98 (22bps) 76 95 (19bps) 63
(1) Excludes the impact of the fair value adjustments on acquisition of ME Bank Arrears have been presented on an unadjusted basis(2) GRCL gross of tax effect
BOQrsquos loan impairment expense was a credit of $20 million in FY21 which was driven by a reduction in the collective provision in FY21 of $69 million This was primarily due to an improved economic outlook with a further reduction from improvements in data quality relating to collateral This has resulted in a 22 basis points decrease in the BOQrsquos total provision and GRCL coverage which is 76 basis points of GLAs The total provision and GRCL coverage of 63 basis points inclusive of ME Bank is 13 basis points lower than FY20 due to a different product mix
Impaired assets of $209 million increased by $14 million or seven per cent on FY20 This was primarily driven by the impairment of one large facility with the underlying loan portfolio remaining strong
Arrears in the 30 day and 90 day categories improved compared to both FY20 and 1H21 The 90 days arrears ratio to GLAs reduced by 29 basis points to 63 basis points This was primarily driven by the Retail portfolio which has benefitted from record low interest rates increased household deposits house price growth and improved economic conditions
Loan impairment expenseFull Year Performance Half Year Performance Year End Incl ME
Aug-21 Aug-20 Aug-21 Feb-21 Aug-21
Expense($m)
ExpenseGLA (bps)
Expense($m) (1)(2)
ExpenseGLA
(bps) (1)(2)Expense
($m)
ExpenseGLA
(bps) (3)Expense($m) (1)(2)
ExpenseGLA
(bps) (1)(2)(3)Expense
($m)
ExpenseGLA (bps)
Retail lending (12) (4) 61 19 (2) (1) (8) (4) (13) (2)
Commercial lending (9) (9) 57 60 (26) (52) 17 36 (9) (9)
Asset finance 1 2 57 91 (16) (49) 15 48 1 2
Total loan impairment expense (20) (4) 175 37 (44) (17) 24 10 (21) (3)
(1) BOQ Specialist Asset finance products were reclassified from Commercial lending to Asset finance Prior periods have been restated(2) BOQ Specialist consumer products have been reclassified to commercial lending to align product definitions All periods reflect this restatement and are presented on
a like-for-like basis(3) Metrics have been annualised
The loan impairment expense was a credit of $20 million in FY21 compared to an expense of $175 million in FY20 FY20 included a $133 million collective provision overlay for the potential impacts of COVID-19 FY21 included a $69 million reduction in the collective provision due to an improved economic outlook and improvements in data quality relating to collateral This was partly offset by an increase in specific provision expense from $47 million in FY20 to $49 million in FY21 driven by a provision for one large facility in Retail and the impact of lockdowns on a small number of niche medical practices in Asset finance
Retail loan impairment expense was a credit of $12 million in FY21 This was driven by a reduction in the collective provision in FY21 of $32 million due to an improved economic outlook notably for the housing market driven by a rebound in expectations for residential house prices Underlying specific provisioning activity was largely consistent with FY20 but specific provision expense increased in FY21 driven by a provision for one large facility
Commercial loan impairment expense was a credit of $9 million in FY21 This was driven by a reduction in the collective provision in FY21 of $22 million due to improvements in data quality relating to collateral as well as an improved economic outlook Specific provisioning was also lower than FY20 driven by a write back of one large Agribusiness exposure that returned to performing following strong crop harvests due to improved weather conditions Underlying specific provisioning activity remained subdued reflecting improved economic conditions and government stimulus
Asset finance loan impairment expense of $1 million for FY21 was driven by a reduction in the collective provision in FY21 of $15 million due to an improved economic outlook This was partly offset by an increase in specific provision expense as lockdowns impacted a small number of niche medical practices
36 Bank of Queensland Limited and its Controlled Entities
For the year ended 31 August 2021FINANCIAL PERFORMANCE
About BOQ 12 | Responding to COVID-19 14 | Acquisition of ME Bank 15 | Value Creation and Strategy 16
31 ASSET QUALITY (CONTINUED)Impaired assets
As at Incl ME
$ million Aug-21 Feb-21 Aug-20Aug-21
vs Feb-21Aug-21
vs Aug-20 Aug-21
Retail lending 94 84 70 12 34 128
Commercial lending (1) 77 78 86 (1) (10) 77
Asset finance (1) 38 32 39 19 (3) 38
Total impaired assets 209 194 195 8 7 243
Impaired assets GLA 41bps 40bps 41bps 1bp - 32bps
(1) BOQ Specialist Asset finance products were reclassified from Commercial lending to Asset finance Prior periods have been restated
BOQ impaired assets of $209 million increased by $15 million or eight per cent on 1H21 This was primarily driven by an impairment of one large facility in the Retail portfolio
Retail impaired assets increased by $10 million or 12 per cent on 1H21 driven by one new impaired facility for $12 million Excluding this impaired assets decreased in 2H21 as increasing house prices supported low specific provisioning activity
Commercial impaired assets decreased by $1 million or one per cent on 1H21 This was due to low specific provisioning activity 1H21 was impacted by one large Agribusiness exposure of $28 million returning to performing which was partially offset by the impacts of COVID-19 and the initial lockdowns 2H21 reflected low specific provisioning activity as economic conditions improved
Asset finance impaired assets increased by $6 million or 19 per cent on 1H21 but decreased $1 million or three per cent on FY20 1H21 was impacted by one large facility of $4 million exiting the Group Impairment of medical equipment and fixtures and fittings among General Practitioners contributed over $3 million towards the increase in 2H21
The Group holds three exposures with impaired balances greater than $5 million for a combined total of $27 million This increase from $15 million at February 2021 was due to a new $12 million impaired balance for one large facility in the Retail portfolio This was however a decrease from $54 million at August 2020 as the Group returned a $28 million Agribusiness facility to performing in 1H21 following strong crop harvests due to improved weather conditions The Group now holds one exposure with an impaired balance greater than $10 million
ME Bank impaired assets of $34 million represent 14 basis points of GLAs reflecting a portfolio that is 99 per cent housing
The following chart outlines the movements in impaired assets since August 2020
Impaired assets ($m)
195
Aug 20
194
Feb 21
209
24334
Aug 21 Excl ME Bank
Aug 21 Incl ME Bank
7
New impaired
61
Realisations
(62)
New impaired
52
86
70
39
78
84
32
77
94
38
34
77
94
38
3426
2510
(34)
(11)(17)
1128
13
(12)(18)
(7)
Realisations
(37)
ME Bank
ME Bank Commercial Retail Asset finance
372021 Annual Report
For the year ended 31 August 2021FINANCIAL PERFORMANCE
Financial Performance 20 | Governance and Risk Management 55 | Directorsrsquo Details 71
31 ASSET QUALITY (CONTINUED)Provision coverage
As at Incl ME
$ million Aug-21 Feb-21 Aug-20Aug-21
vs Feb-21 Aug-21
vs Aug-20 Aug-21
Specific provision 107 103 94 4 14 107
Collective provision (CP) 206 271 275 (24) (25) 204
Total provisions 313 374 369 (16) (15) 311
GRCL ($ million) 52 58 64 (10) (19) 52
Specific provisions to impaired assets (1) 51 53 48 200bps Large 47
Total provisions and GRCL coverage impaired assets (1)(2) 185 236 236 Large Large 198
CP and GRCL Total RWA (bps) (1)(2) 63bps 111bps 116bps 47bps (53bps) 84bps
Total provisions and GRCL coverage GLA (1)(2) 76bps 95bps 98bps 19bps (22bps) 63bps
(1) Excludes the impact of the fair value adjustments on acquisition of ME Bank(2) GRCL gross of tax effect
BOQ provisions of $313 million decreased by $56 million or 15 per cent from FY20 This was driven by a decrease in the collective provision partly offset by an increase in specific provisions
Specific provisions of $107 million increased by $13 million or 14 per cent from FY20 This has increased the coverage of impaired assets from 48 per cent to 51 per cent This increase was primarily driven by the Retail and Asset finance portfolios The increase in the Retail portfolio was driven by one large facility partly offset by low specific provisioning activity supported by the low interest rate environment and buoyant house prices The Asset finance portfolio increased $6 million driven by a small number of niche medical practices within the BOQ Specialist portfolio The Commercial portfolio decreased as an Agribusiness facility returned to performing
The collective provision of $206 million decreased $69 million or 25 per cent from FY20 This included a $75 million release in the third quarter due to an improved economic outlook and improvements in data quality relating to collateral Economic model assumptions and management overlays are prudently managed to ensure sufficient provisions are held due to the ongoing uncertainty from COVID-19
As a result of the decrease in the collective provision and growth in GLAs total provisions and GRCL coverage of 76 basis points decreased by 22 basis points from FY20
The following chart outlines the movements in specific provisions since August 2020
Specific provisions ($m)
Aug 21
94
Aug 20
38
25
31
103
Feb 21
46
32
25
107
42
33
32
New Specific
32
13
118
Realisations
(23)
(5)(4)
(14)
New Specific
31
510
16
(9)(9)(9)
Realisations
(27)
Commercial Retail Asset finance
38 Bank of Queensland Limited and its Controlled Entities
For the year ended 31 August 2021FINANCIAL PERFORMANCE
About BOQ 12 | Responding to COVID-19 14 | Acquisition of ME Bank 15 | Value Creation and Strategy 16
31 ASSET QUALITY (CONTINUED)Arrears
Portfolio Balance
($m)Year End Incl ME
Key Metrics BOQ Group Aug-21 Feb-21 Aug-20Aug-21
vs Feb-21Aug-21
vs Aug-20 Aug-21
Total lending - portfolio balance ($ million) 50589 48108 47043 5 8 75748
30 days past due ($ million) (1) 516 575 567 (10) (9) 941
90 days past due ($ million) (1) 321 381 433 (16) (26) 593
Proportion of portfolio
30 days past due GLAs (1) 102 120 121 (18bps) (19bps) 124
90 days past due GLAs (1) 063 079 092 (16bps) (29bps) 078
By portfolio
30 days past due GLAs (Retail Excl ME Bank) 34253 094 125 125 (31bps) (31bps) 094
90 days past due GLAs (Retail Excl ME Bank) 064 088 097 (24bps) (33bps) 064
30 days past due GLAs (ME Bank) (1) 25232 - - - - - 168
90 days past due GLAs (ME Bank) (1) - - - - - 108
30 days past due GLAs (Commercial) 9879 152 148 153 4bps (1bp) 152
90 days past due GLAs (Commercial) 093 091 125 2bps (32bps) 093
30 days past due GLAs (Asset finance) 6457 069 048 050 21bps 19bps 069
90 days past due GLAs (Asset finance) 020 015 017 5bps 3bps 020
(1) Excludes the impact of the fair value adjustments on the acquisition of ME Bank Arrears have been presented on an unadjusted basis
Retail arrearsRetail arrears decreased in both the 30 day and 90 day categories since 1H21 and FY20 Banking Relief Package (BRP) and government stimulus has provided support for customers experiencing difficulty and has allowed repayments to resume in a timely manner Record low interest rates strong house prices and improved economic conditions have further supported the decrease in arrears
Commercial arrearsCommercial arrears increased by four basis points in the 30 day category and by two basis points in the 90 day category since 1H21 The increase in commercial arrears since 1H21 is in line with expectations as COVID-19 imposed lockdowns have reduced trading and a pause has been placed on collection activity in lockdown affected areas
Arrears in the 90 day category have decreased by 32 basis points since FY20 with improvements across the whole portfolio as customers returned to performing from banking relief and collection activity on late stage arrears recommenced following an extended moratorium in FY20
Asset finance arrearsAsset finance arrears increased by 21 basis points in the 30 day category and by five basis points in the 90 day category since 1H21 While arrears have been largely stable during most of the year the increase reflects the negative impact of recent lockdowns on the arrears position as well as the pause placed on collection activity in lockdown effected areas The increase was mainly in customers in NSW and those in health care industries within the BOQ Specialist portfolio
COVID-19 Banking relief packageFrom July 2021 the Bank reinstated a number of support measures to retail and business customers impacted by COVID-19 as part of Banking Relief support initiatives Utilisation of this latest assistance at less than one per cent of GLAs is considerably lower than during the initial BRP phase at more than 15 per cent of GLAs
In line with APRArsquos regulatory approach loans deferred as part of the COVID-19 Banking Relief support measures are not included in arrears where the loans were otherwise performing
ME Bank arrearsOver 50 per cent of ME Bank arrears are supported by Lenders Mortgage Insurance The higher level of ME arrears also reflects changes to collection practices to provide increased support to customers impacted by lockdown
392021 Annual Report
For the year ended 31 August 2021FINANCIAL PERFORMANCE
Financial Performance 20 | Governance and Risk Management 55 | Directorsrsquo Details 71
32 FUNDING AND LIQUIDITYBOQrsquos liquidity and funding risk appetite strategy is designed to ensure that the Bank has the ability to meet its financial obligations as they fall due under all market conditions Management of liquidity risk at BOQ is focused on developing a stable customer deposit base maintaining access to diversified wholesale funding markets and disciplined management of maturity profiles BOQ regularly stress tests itrsquos liquidity risk profile to identify vulnerabilities under a diverse range of market scenarios
As at 31 August BOQ (including ME Bank) had utilised its full Term Funding Facility allowance of $3 billion which is comprised of an initial allowance ($18 billion) supplementary allowance ($11 billion) and additional allowance ($01 billion) The Term Funding Facility was made available to ADIrsquos as part of a package of measures to support the Australian economy by providing three-year funding through repurchase transactions at the official cash rate target
Liquidity Coverage Ratio (LCR)APRA requires ADIs to maintain a minimum LCR of 100 per cent BOQ manages its LCR on a daily basis and actively maintains a buffer above the regulatory minimum in line with BOQrsquos prescribed risk appetite and policy settings
BOQrsquos Level 2 LCR (including ME Bank) at 31 August 2021 was 149 per cent which was 33 per cent lower than 1H21 ME Bankrsquos LCR was 169 per cent at 31 August 2021 The average Level 2 LCR since the settlement of ME Bank on 1 July 2021 was 151 per cent
The decrease in LCR was primarily due to negative impacts from
1 A $500 million reduction in the 2021 committed liquidity facility (CLF) due to a decline in CLF available to the banking system
2 A reduction in the available CLF due to the final drawing of the TFF
3 An increase to net cash outflows relating to increased retail at-call deposits and
4 The normalisation of contractual inflows following the settlement of BOQrsquos equity raising for the ME Bank acquisition
These were partly offset by a higher balance of HQLA1 and uplift from ME Bankrsquos strong liquidity position
LCR waterfall 28 February 2021 - 31 August 2021
Aug 21
1492
Feb 21
1824
HQLA1
379 (133)
Internal RMBS
(144)
Other ALA
Customer deposits
(36)
(148)
Wholesale funding
(345)
Other cash outflows
ME Bank
95
ME Bank
(1) Alternative liquid assets (ALA) qualifying as collateral for the CLF excluding internal residential mortgage backed securities (RMBS) within the CLF limit
LCR - August 2021 (149)
$92 BILLION
$66 BILLION
Liquid assets
OTHER ALA (1)
ME BANK
HIGH QUALITY LIQUID ASSETS
(HQLA)
INTERNAL RMBS
$144 BILLION
$97 BILLION
Net cash outflows
CUSTOMER DEPOSITS
OTHER
ME BANK
WHOLESALE FUNDING
40 Bank of Queensland Limited and its Controlled Entities
For the year ended 31 August 2021FINANCIAL PERFORMANCE
About BOQ 12 | Responding to COVID-19 14 | Acquisition of ME Bank 15 | Value Creation and Strategy 16
NSFR waterfall 28 February 2021 - 31 August 2021
Liquid assetsBOQ maintains a portfolio of high quality diversified liquid assets to facilitate balance sheet liquidity and meet internal and regulatory requirements Liquid assets are comprised of HQLA1 (cash Australian Semi-Government and Commonwealth Government securities) and alternative liquid assets covered under the CLF provided by the RBA CLF assets include senior unsecured bank debt covered bonds asset backed securities (ABS) and RMBS that are eligible for repurchase with the RBA
BOQ was granted a $29 billion CLF commencing on 1 April 2021 APRA has confirmed that the CLF allowance for the banking system will be reduced to zero by the end of 2022 which is in response to the increase in HQLA available to the banking system to meet LCR requirements
32 FUNDING AND LIQUIDITY (CONTINUED)
Aug 21
1222
Feb 21
1179
Capital
10
46
Customer deposits
28
Wholesale funding amp
other liabilities
Liquid assets
04
Residential mortgages
le 35
(49)
Other loans
(06)
Other assets
(27)
ME Bank
37
Net stable funding ratio (NSFR)The NSFR encourages ADIs to fund their lending activities with more stable sources of funding thereby promoting greater balance sheet resilience
BOQ manages its NSFR on a daily basis and actively maintains a buffer above the regulatory minimum in line with BOQrsquos prescribed risk appetite and policy settings
BOQrsquos Level 2 NSFR (including ME Bank) at 31 August 2021 was 122 per cent and ME Bankrsquos NSFR was 132 per cent For BOQ this represents an increase of four per cent over 1H21 which is largely reflective of the benefit received from ME Bankrsquos funding profile Retail customer deposit growth has been particularly strong over the half but the benefit to the NSFR has been offset by loan growth
ME Bank
NSFR - August 2021 (122)
$441 BILLION $372
BILLION
Available stable funding
$627 BILLION
CUSTOMER DEPOSITS
WHOLESALE FUNDING amp OTHER LIABILITIES
ME BANK
CAPITAL
$513 BILLION
Required stable funding
LIQUIDS amp OTHER ASSETS
OTHER LOANS
ME BANK
RESIDENTIAL MORTGAGES le 35
RISK WEIGHT
412021 Annual Report
For the year ended 31 August 2021FINANCIAL PERFORMANCE
Financial Performance 20 | Governance and Risk Management 55 | Directorsrsquo Details 71
32 FUNDING AND LIQUIDITY (CONTINUED)FundingBOQrsquos funding strategy and risk appetite reflects the Grouprsquos business strategy adjusted for the current economic environment Funding is managed to allow for various scenarios that may impact BOQrsquos funding position
Wholesale fundingBOQ focuses on three main strategic elements in delivering its wholesale funding objectives - capacity growth resilience and diversity - while minimising the cost of funds and maintaining its ability to take advantage of opportunities in the most appropriate markets BOQ continues to optimise the mix of wholesale and retail funding whilst also increasing stable sources of funding
In FY21 BOQrsquos continued focus on growing customer deposits through a variety of channels has seen strong growth of $33 billion As a result loan growth was fully funded by stable funding sources and the deposit to loan ratio increased from 74 per cent at 1H21 to 75 per cent at FY21 (excluding ME Bank) The remaining retail funding gap was funded through drawing down the TFF as well as accessing wholesale funding markets including both in secured and unsecured formats
(1) The classification of customer deposits is defined as all deposits excluding those from financial institutions as defined under APS 210 Liquidity(2) Foreign currency balances have been translated at end of day spot rates(3) ME Bank Funding mix of $283 billion includes $184 billion customer deposits $59 billion long term wholesale and $40 billion short term wholesale(4) ME Bank long term wholesale funding of $59 billion includes $46 billion securitisation $09 billion TFF and $04 billion senior unsecured debt
Funding mix ($billion) (1)
Long term wholesale ($billion) (1)
Aug 20
347(68)
48 (10)
113 (22)
508
Aug 20
113
07
34
40
24
08
Feb 21
108
10
29
34
23
12
Aug 21
177
10
30
32
24
22
59
Feb 21
358 (69)
52 (10)
108 (21)
518
Aug 21
380 (46)
54 (6)
118 (14)
283 (34)
835
Customer deposits (1)
Short term wholesale
Long term wholesale (2) Additional tier 1 notes subordinated debt
Senior unsecured Securitisation
Covered bond TFF
ME Bank (3) ME Bank (4)
$552 BILLION
$118 BILLION
42 Bank of Queensland Limited and its Controlled Entities
For the year ended 31 August 2021FINANCIAL PERFORMANCE
About BOQ 12 | Responding to COVID-19 14 | Acquisition of ME Bank 15 | Value Creation and Strategy 16
32 FUNDING AND LIQUIDITY (CONTINUED)Term funding issuance BOQ accessed term funding markets in FY21 using a range of long term wholesale products The intention was to refinance existing maturities as well as fund loan growth complementing the drawdown of the TFF and the inflow of customer deposits This included the $260 million Capital Notes 2 (Additional Tier 1 Capital) issuance (BOQPF) a $250 million Subordinated Debt (Tier 2 Capital) and a $650 million Senior Unsecured debt issuance Both of these replaced the $150 million Subordinated Debt call and the $600 million Senior Unsecured maturity in May 2021 BOQ also issued approximately $784 million Asset Backed Securitisation under the REDS EHP programme having last accessed this market in 2018
The diverse range of term funding products utilised in FY21 highlights the range of unsecured and secured debt programmes available to BOQ This provides funding diversification benefits and also enables BOQ to fund future asset growth and manage term maturity towers over the next five years including refinancing the TFF
33 CAPITAL MANAGEMENT Capital adequacy
As at
$ million Aug-21 Feb-21 Aug-20Aug-21
vs Feb-21Aug-21
vs Aug-20
CET1 4334 3221 3089 35 40
Additional tier 1 capital 610 610 350 - 74
Total tier 2 628 613 580 2 8
Total capital base 5572 4444 4019 25 39
Total RWA 44229 32126 31576 38 40
CET1 ratio 980 1003 978 (23bps) 2bps
Total capital adequacy ratio 1260 1383 1273 (123bps) (13bps)
Major maturities ($m) (1)(2)(3)(4)
(1) Any transaction issued in a currency other than AUD is shown in the applicable AUD equivalent hedged amount(2) Senior unsecured maturities greater than or equal to $50 million shown excludes private placements(3) Redemption of subordinated debt notes and additional tier 1 notes at the scheduled call date is at either BOQrsquos or ME Bankrsquos option (as applicable) and is subject to obtaining
prior written approval from APRA(4) Halves are reflected in line with the Bankrsquos financial reporting year
600
H1
600 650
H1
667
H1
600
H1 H1
900
744
H2
150
811
350
H2
750
H2 H2
2022 2023 2024 2025 2026
H2
1245
1112
200
Additional tier 1 Domestic senior Covered bondSubordinated debt TFF
200250
100
432021 Annual Report
For the year ended 31 August 2021FINANCIAL PERFORMANCE
Financial Performance 20 | Governance and Risk Management 55 | Directorsrsquo Details 71
34 TAX EXPENSEBOQ including ME Bank tax expense arising on cash earnings for FY21 amounted to $183 million This represented an effective tax rate of 308 per cent which is above the corporate tax rate of 30 per cent primarily due to the non-deductibility of interest payable on Capital Notes issued in FY18 and FY21
33 CAPITAL MANAGEMENT (CONTINUED)The Grouprsquos CET1 ratio decreased by 23 basis points during 2H21 from 1003 per cent to 980 per cent
The ME Bank acquisition was funded by proceeds from the capital raising This increased CET1 by 412 basis points which was fully offset by ME Banksrsquo risk weighted assets CET1 deductions and other CET1 deductions arising from Purchase Price Allocation (PPA)
Cash NPAT including ME Bank generated 49 basis points of capital with an additional 7 basis points contribution from the collective provision release in the half This was partly offset by RWA growth of 31 basis points and increased loan origination costs of six basis points driven by above system GLA growth
The normalisation of the dividend (net of the Dividend Reinvestment Plan (DRP)) reduced CET1 by 22 basis points CAPEX is in line with the strategic roadmap net of amortisation and utilised 12 basis points of capital Run-off in capital relief securitised housing loans increased risk weighted assets and reduced CET1 by two basis points Other items utilised six basis points of capital and included statutory adjustments net of reserves and deferred tax movements
Total capital adequacy ratio decreased by 13 basis points to 1260 per cent in FY21 This was primarily due to a lower Tier 2 ratio as ME Bank was lower than BOQ in this tier on a relative basis which was partially offset by an increase in subordinated debt issuance
2H21
980
1H21
1003
Securitisation impact
(006)
(006)
Other items
2H21 cash earnings
after tax
049
Collective provision
release
Dividend net of DRP
007
(012)
RWA growth
(031)
Loan origination
costs
(022)
Net CAPEX
(002)
2H21 CET1 Walk
Underlying capital utilisation of -3bps
44 Bank of Queensland Limited and its Controlled Entities
For the year ended 31 August 2021FINANCIAL PERFORMANCE
About BOQ 12 | Responding to COVID-19 14 | Acquisition of ME Bank 15 | Value Creation and Strategy 16
4 DIVISIONAL PERFORMANCE41 RETAIL INCOME STATEMENT KEY METRICS AND FINANCIAL PERFORMANCE REVIEWOverviewThe Retail Bank meets the financial needs and services of personal customers The division supports customers through owner-managed and corporate branch networks third party intermediaries VMA distribution channels more than 1300 ATMrsquos an Australian based customer call centre digital services and mobile mortgage specialists BOQ acquired 100 per cent of the share capital of ME Bank on 1 July 2021 ME Bank operates in the retail segment of the domestic market primarily offering home loan products everyday transaction and online savings accounts
Year End Performance Half Year PerformanceYear End Incl ME
$ million Aug-21 Aug-20Aug-21 vs
Aug-20 Aug-21 Feb-21Aug-21 vs
Feb-21 Aug-21
Net interest income 492 437 13 256 236 8 570
Non-interest income (1) 69 74 (7) 33 36 (8) 74
Total income 561 511 10 289 272 6 644
Operating expenses (356) (335) 6 (180) (176) 2 (407)
Underlying profit 205 176 16 109 96 14 237
Loan impairment expense 20 (56) Large 14 6 133 21
Profit before tax 225 120 88 123 102 21 258
Income tax expense (70) (37) 89 (38) (32) 19 (80)
Cash earnings after tax 155 83 87 85 70 21 178
KEY METRICS Year End Performance Half Year PerformanceYear End Incl ME
Aug-21 Aug-20Aug-21
vs Aug-20 Aug-21 Feb-21Aug-21
vs Feb-21 Aug-21
PERFORMANCE INDICATORS
CTI (1) () 635 656 Large 623 647 Large 632
Net interest income average GLA (2) () 201 187 14bps 205 200 5bps 193
ASSET QUALITY
90dpd arrears ($ million) 204 294 (31) 204 274 (26) 205
Impaired assets ($ million) 86 66 30 86 78 10 120
Loan impairment expense GLA (bps) (7) 22 (29bps) (10) (5) (5bps) (3)
BALANCE SHEET
GLA ($ million) 27724 25253 10 27724 26055 6 52883
Housing ($ million) 27674 25195 10 27674 25990 6 52626
Other retail ($ million) 50 58 (14) 50 65 (23) 257
Average Credit RWA ($ million) 9934 8720 14 9934 9158 8 11245
Customer deposits (3) ($ million) 18609 17210 8 18609 17424 7 37046
Term deposits ($ million) 4706 5647 (17) 4706 4833 (3) 12019
Mortgage offsets ($ million) 2183 1801 21 2183 2030 8 3689
Savings amp investment ($ million) 9197 7784 18 9197 8398 10 17847
Transaction accounts ($ million) 2523 1978 28 2523 2163 17 3491
Deposit to loan ratio () 67 68 (100bps) 67 67 - 70
(1) VMA operating costs have been restated from non-interest income and included in operating expenses per ASX announcement on 30 September 2021(2) Calculated on a cash earnings basis and net of offset accounts (3) Treasury managed deposits are included in the Bankrsquos Other operating segment
452021 Annual Report
For the year ended 31 August 2021FINANCIAL PERFORMANCE
Financial Performance 20 | Governance and Risk Management 55 | Directorsrsquo Details 71
41 RETAIL INCOME STATEMENT KEY METRICS AND FINANCIAL PERFORMANCE REVIEW (CONTINUED)Business reviewThe Retail Bank remains focussed on executing its strategic initiatives and is committed to supporting our customers in the current environment Strong growth in cash earnings has been driven by lower loan impairments improved lending margins and above system lending growth The housing momentum generated at the end of 2H20 has translated into positive lending growth across all core channels in FY21 The BOQ Blue brand has achieved positive growth for the first time since FY15 as settlements increased 72 per cent on FY20 The successful turnaround in the BOQ Blue brand is attributed to improvements which have been delivered over the past two years including the home buying transformation program an experienced retail leadership team quality third party relationships and a focus on expanding and enabling our unique and strategically important owner-managed network
The BOQ branch network consists of 103 owner-managed and 53 corporate branches supported by seven transaction centres The first Business Relationship Centre a lower cost branch model focussed on lending and deposit acquisition was opened in November 2020 in New Farm Queensland Expanding and leveraging the unique owner-manager model anchored in the communities we serve remains a strategic focus The branch network has delivered a turnaround in performance by reporting positive housing growth the first time since FY14 Settlement volumes increased 55 per cent on FY20 whilst run-off has been managed through proactive retention initiatives
The broker channel recorded home lending growth of $11 billion representing growth of 36 per cent on FY20 This was driven by building new and existing quality third party relationships focussed customer retention and simplified end-to-end mortgage processes Whilst further improvement are a continued focus specifically processing times the improvements delivered to date have enabled the settlement of more than double the volume of broker originated loans Customer experience has improved through the delivery of new broker enabled technologies
The VMA brand is a globally recognised brand which appeals to a more tech savvy customer base and continues to contribute to the Bankrsquos geographical diversification by targeting metropolitan-based customers across Australia VMA has a proven track record in executing on strong customer value led propositions This is evidenced by a home loan portfolio which has grown to more than $43 billion since the mid-2016 launch The business has been impacted by subdued credit card performance due to the portfolio being largely linked to frequent flyer cards The reduction in non-interest income from FY20 was more than offset by a strong uplift in interest revenue generated from VMArsquos home loan business VMA has launched its Digital Bank offering representing the largest production deployment in the Grouprsquos history The Digital Bank launched with transaction savings and an integrated credit card and loyalty offering Leveraging this foundational work to ensure a similar customer experience is delivered to new BOQ Retail deposit customers is scheduled to be delivered in 1H22 Work on Phase 2 for VMA and BOQ Retail Transformation continues with an expanded offering to term deposits and lending customers on track to deliver in 2022
ME Bank acquisitionDuring FY21 BOQ acquired 100 per cent of the share capital of ME Bank The ME Bank brand is a strong complementary brand with a shared customer centric culture which is recognised nationally with a notable Victorian emphasis The target customer base is slightly more digitally aware and therefore not reliant on face-to-face support The ME Bank brand has a housing portfolio of $250 billion which is supported by a broker channel and propriety network of mobile bankers
The housing portfolio decreased by $05 billion in the two months since acquisition This decline was in line with recent historical trends and reflected softer application flow in the preceding quarter which has since improved and an increase in run-off ME Bank contributed to the Grouprsquos funding with customer deposits in excess of $184 billion
Integration activities and mortgage process simplification work is well underway with the objective of returning the ME housing portfolio to growth in a sustainable way
Financial performance review Retail Bank cash earnings after tax increased $72 million or 87 per cent on FY20 Improved margins lending growth and lower collective provisioning were partially offset by the increased investment in the VMA digital transformation
ME Bank contributed $23 million to the divisionrsquos cash earnings after tax for the two months since acquisition
Net interest incomeNet interest income increased $55 million or 13 per cent on FY20 This was driven by margin improvement and strong lending balance growth
Housing margins improved due to lower funding and hedging costs and repricing Front-to-back book and retention discounting impacts continued due to ongoing competition in the market
Deposit margins decreased due to a lower interest rate environment impacting transaction and saving deposit account margins Strong transaction and savings balances growth a function of high levels of liquidity in the market has continued throughout FY21 resulting in total deposit growth of $14 billion or eight per cent Term deposits decreased $09 billion or 17 per cent to $47 billion in FY21 as the customer deposits mix rebalanced
Third party cost increases were driven by higher payments to owner-managers and brokers relative to FY20 as a result of higher growth whilst the increased settlement volumes have resulted in higher amortised acquisition costs
Non-interest incomeNon-interest income decreased by $5 million or seven per cent on FY20 as COVID-19 continued to impact several transaction fee categories notably those related to travel whilst an ongoing shift in customer preference to lower or no fee product also continued to impact fee revenue Lower VMA card and insurance revenue continued to be adversely impacted by the effect of COVID-19 on the travel industry These were partly offset by income from a new card services arrangement with a third party supplier
Operating expensesOperating expenses increased $21 million or six per cent on FY20 This was largely driven by an investment in employees to deliver strategic priorities including the VMA digital transformation and to support volume growth particularly in the areas of operations product marketing
Loan impairment expenseLoan impairment expense was a credit of $20 million in FY21 compared to an expense of $56 million in FY20 This was primarily driven by a reduction in the collective provision in FY21 of $37 million which reflected an improved economic outlook In FY20 a collective provision overlay of $44 million was recorded for the potential impacts of COVID-19
46 Bank of Queensland Limited and its Controlled Entities
For the year ended 31 August 2021FINANCIAL PERFORMANCE
About BOQ 12 | Responding to COVID-19 14 | Acquisition of ME Bank 15 | Value Creation and Strategy 16
42 BOQ BUSINESS INCOME STATEMENT KEY METRICS AND FINANCIAL PERFORMANCE REVIEWOverviewBOQ Business includes BOQ branded commercial lending BOQ Finance BOQ Specialist and financial markets The division provides tailored business banking solutions including commercial lending equipment finance and leasing cashflow finance foreign exchange hedging and international transfers interest rate hedging transaction banking and deposit solutions for business customers The division also provides home loans and consumer banking for BOQ Specialist customers
Year End Performance Half Year Performance
$ million Aug-21 Aug-20Aug-21 vs
Aug-20 Aug-21 Feb-21Aug-21 vs
Feb-21
Net interest income 555 543 2 285 270 6
Non-interest income 48 40 20 23 25 (8)
Total income 603 583 3 308 295 4
Operating expenses (262) (258) 2 (130) (132) (2)
Underlying profit 341 325 5 178 163 9
Loan impairment expense - (119) Large 30 (30) Large
Profit before tax 341 206 66 208 133 56
Income tax expense (106) (64) 66 (65) (41) 59
Cash earnings after tax 235 142 65 143 92 55
KEY METRICS Year End Performance Half Year Performance
Aug-21 Aug-20Aug-21
vs Aug-20 Aug-21 Feb-21Aug-21
vs Feb-21
PERFORMANCE INDICATORS
CTI () 434 443 (90bps) 422 447 Large
Net interest income average GLA (1) () 264 259 5bps 267 260 7bps
ASSET QUALITY
90dpd arrears ($ million) 118 139 (15) 118 107 10
Impaired assets ($ million) 123 129 (5) 123 115 7
Loan impairment expense GLA (bps) - 55 (55bps) (26) 27 (53bps)
BALANCE SHEET
GLA ($ million) 22865 21790 5 22865 22053 4
Housing ($ million) 6427 5960 8 6427 6162 4
Commercial and other ($ million) 9981 9571 4 9981 9613 4
Asset finance ($ million) 6457 6259 3 6457 6278 3
Average Credit RWA ($ million) 18147 17736 2 18147 17553 3
Customer deposits (2) ($ million) 10838 9726 11 10838 10339 5
Term deposits ($ million) 1393 1543 (10) 1393 1349 3
Mortgage offsets ($ million) 1119 1015 10 1119 1122 -
Savings amp investment ($ million) 6443 5550 16 6443 6011 7
Transaction accounts ($ million) 1883 1618 16 1883 1857 1
Deposit to loan ratio () 47 45 200bps 47 47 -
(1) Calculated on a cash earnings basis and net of offset accounts (2) Treasury managed deposits are included in the Bankrsquos Other operating segment
472021 Annual Report
For the year ended 31 August 2021FINANCIAL PERFORMANCE
Financial Performance 20 | Governance and Risk Management 55 | Directorsrsquo Details 71
42 BOQ BUSINESS INCOME STATEMENT KEY METRICS AND FINANCIAL PERFORMANCE REVIEW (CONTINUED)Business reviewBOQ Business has continued to support its large and small customers during the current difficult economic climate through ongoing lending and specific COVID-19 relief where required
The business continued to execute on its niche segment strategy of providing a tailored relationship offering to customers and achieving total asset growth of $11 billion or five per cent on FY20 This was matched by strong deposit growth of $11 billion or 11 per cent over FY21 largely in the transaction and savings account products
BOQ commercial growth of $04 billion or 08x system Other banking solutions such as merchant facilities and foreign exchange contributed to the diversification of the portfolio and stronger non-interest income
The small business strategy remains a key focus and improvements to the lending offering have been made to policy product and process This has resulted in growth of $52 million in the BOQ small business portfolio and the first year of growth in this portfolio since 2012 Both retention and new business volumes improved through the branch broker and direct business banker channels
BOQ Specialist commercial lending portfolio grew by $02 billion or seven per cent on FY20 whilst asset financing in this channel contracted Home lending grew by $05 billion or nine per cent with a strong second half as confidence returned to the sector The mortgage offering provides a pipeline of customers with potential commercial lending needs in the future
Improvements were made to online banking in BOQ Specialist that continued to drive deposit growth in transaction and savings accounts BOQ Specialist focuses on clearly defined niches and has developed deep client relationships offering tailored consumer and commercial products and services to assist professionals
BOQ Finance grew its $55 billion asset finance portfolio by $03 billion or five per cent due to record settlement volumes in Equipment finance and strong structured finance growth Key industry growth continues to be in the transport agriculture and construction industries This was partly offset by a decline in the BOQ Specialist Asset finance book of $75 million which was driven by lower levels of investment from dentistry and medical practices
Financial performance reviewBOQ Business cash earnings after tax increased by $93 million or 65 per cent on FY20 This result was driven by both improved underlying profit and favourable loan impairment expense due to a reduction in the collective provision
Net interest incomeNet interest income increased $12 million or two per cent on FY20 This was driven by margin improvement in the business lending and asset finance portfolios
Asset margins improved due to lower funding and hedging costs and whilst maintaining pricing Income growth from assets was impacted as the lending growth occurred late in the year
Deposit margins decreased due to a lower interest rate environment impacting transaction and saving deposit account margins Strong deposit growth has continued throughout FY21 reflecting the higher liquidity in the market and government stimulus for small business Total deposit growth of $11 billion or 11 per cent was driven by growth in transaction and savings accounts partly offset by a decrease in term deposits as the customer deposits mix rebalanced
Non-interest incomeNon-interest income increased by $8 million or 20 per cent on FY20 The increase was mainly driven by higher merchant terminal revenue from small business customers financial markets customer transactions the reinstatement of some fees paused during COVID-19 and income from a new card services arrangement with a third party supplier
Operating expensesOperating expenses increased by $4 million or two per cent on FY20 This was driven by investment in small business initiatives banker capability and regulatory and technology projects This is targeting an improved customer experience and efficiency in the operational aspects of lending fulfilment
The increase also reflected additional staff to support customers impacted by COVID-19 and increasing Know Your Customer (KYC) regulatory compliance costs This was partly offset by lower discretionary spend particularly travel and entertainment
Loan impairment expenseLoan impairment expense decreased by $119 million on FY20 This was primarily driven by a reduction in the collective provision in FY21 of $32 million due to improvements in data quality relating to collateral as well as an improved economic outlook In FY20 a collective provision overlay of $89 million was recorded for the potential impacts of COVID-19
Specific provisions were largely unchanged on FY20 as activity remained subdued reflecting improved economic conditions and government stimulus A write back of one large commercial Agribusiness exposure that returned to performing following strong crop harvests due to improved weather conditions was offset by an increase in specific provision expense in Asset finance as lockdowns impacted some niche medical practices
48 Bank of Queensland Limited and its Controlled Entities
For the year ended 31 August 2021FINANCIAL PERFORMANCE
About BOQ 12 | Responding to COVID-19 14 | Acquisition of ME Bank 15 | Value Creation and Strategy 16
43 OTHER SEGMENT INCOME STATEMENT AND FINANCIAL PERFORMANCE REVIEW OverviewThe Other segment includes Treasury St Andrewrsquos Insurance and Group head office
Year End Performance Half Year Performance
$ million Aug-21 Aug-20Aug-21 vs
Aug-20 Aug-21 Feb-21Aug-21 vs
Feb-21
Net interest income (expense) 3 6 (50) (3) 6 (150)
Non-interest income 8 14 (43) 3 5 (40)
Total income 11 20 (45) - 11 (100)
Operating expenses (15) (19) (21) (8) (7) 14
Underlying profit (loss) (4) 1 Large (8) 4 Large
Loan impairment expense - - (100) - - (100)
Profit (loss) before tax (4) 1 Large (8) 4 Large
Income tax (expense) benefit 3 (1) Large 4 (1) Large
Cash profit (loss) after tax (1) - 100 (4) 3 Large
Financial performance reviewCash earnings after tax was a loss of $1 million in FY21 compared to $nil for FY20
Net interest income (expense)Net interest income decreased by $3 million or 50 per cent on FY20 This primarily reflected lower income from Treasuryrsquos hedging of interest rate risk partly offset by higher home loan break cost income
Non-interest incomeNon-interest income comprises St Andrewrsquos insurance revenue and Treasury trading income Non-interest income decreased by $6 million or 43 per cent on FY20 This was mainly driven by lower insurance income following a decision in FY20 by St Andrewrsquos to materially close to new business It also reflects lower Treasury trading income as a lack of volatility and lower interest rate environment reduced trading income opportunities together with reduced market exposures and widening in credit spreads in 2H21
Operating expensesOperating expenses decreased by $4 million or 21 per cent on FY20 This primarily reflected a decrease in St Andrewrsquos expenses following its closure to new business in FY20
492021 Annual Report
For the year ended 31 August 2021FINANCIAL PERFORMANCE
Financial Performance 20 | Governance and Risk Management 55 | Directorsrsquo Details 71
44 PRO FORMA RESULTS The following Pro Forma results are designed to facilitate a meaningful understanding of the combined Grouprsquos performance for FY20 and FY21 and to form a basis for the outlook for FY22
They have been prepared on the basis that ME Bank was included for the full twelve months of FY20 and FY21 They reflect a number of adjustments to both BOQ and ME Bank in order to make the results more indicative of future performance including
bull Alignment of ME Bank to BOQrsquos August year end
bull Alignment of ME Bank to BOQrsquos presentation of net interest income non-interest income and operating expenses and
bull Removal of St Andrewrsquos insurance
The Pro Forma results for the years ended 31 August 2020 and 2021 are outlined below
Pro Forma Year Ended Performance Aug-21 vs Aug-20
$ million
BOQ Adjusted (1)
Aug-20
ME Bank
AdjustedAug-20
BOQ Group
Pro FormaAug-20
BOQ Adjusted (1)
Aug-21
ME Bank
Adjusted (2)
Aug-21
BOQ Group
Pro FormaAug-21
BOQ Adjusted (1)
ME Bank
Adjusted
BOQ Group
Pro Forma
Net interest income 986 470 1456 1050 489 1539 6 4 6
Non-interest income 117 16 133 118 16 134 1 - 1
Total income 1103 486 1589 1168 505 1673 6 4 5
Operating expenses (603) (283) (886) (626) (307) (933) 4 8 5
Underlying profit 500 203 703 542 198 740 8 (2) 5
Loan impairment expense (175) (60) (235) 20 9 29 Large Large Large
Profit before tax 325 143 468 562 207 769 73 45 64
Income tax expense (101) (42) (143) (173) (64) (237) (71) (52) (66)
Cash earnings after tax 224 101 325 389 143 532 74 42 64
Statutory net profit after tax (3) 114 87 201 352 111 463 Large 28 130
KEY METRICS Aug-20 Aug-20 Aug-20 Aug-21 Aug-21 Aug-21 Aug-21 vs Aug-20
Profitability and efficiency measures
NIM () 191 159 179 195 170 186 4bps 11bps 7bps
CTI () 547 582 558 536 608 558 (110bps) Large -
LIE to GLA (bps) 37 22 32 (4) (4) (4) (41bps) (26bps) (36bps)
(1) BOQ result has been adjusted as follows (a) VMA operating costs have been restated from non-interest income and included in operating expenses per ASX announcement on 30 September 2021(b) St Andrewrsquos income as disclosed in note 24 and operating expenses and non-interest income of $7 million in FY21 and operating expenses of $9 million and non-interest
income of $11 million in FY20 have been removed to reflect the planned divestment in 1H22(2) Includes the amortisation of fair value adjustments on acquisition including an effective interest adjustment following a fair value adjustment to the loan portfolio on
acquisition of ME Bank(3) ME statutory adjustments for FY21 include transaction costs ($23 million) hedge ineffectiveness intangible asset review integration costs and amortisation of acquisition
fair value adjustments
50 Bank of Queensland Limited and its Controlled Entities
For the year ended 31 August 2021FINANCIAL PERFORMANCE
About BOQ 12 | Responding to COVID-19 14 | Acquisition of ME Bank 15 | Value Creation and Strategy 16
45 OUTLOOK Despite the uncertain environment we are cautiously optimistic that Australia remains well placed for economic recovery characterised by further house price rises and solid growth in consumer spending and business investment
There may still be uncertainty associated with COVID-19 for at least the next year We expect that fiscal and monetary policy will continue to underpin the economic recovery Over the next year we will continue to maintain a prudent approach to provisioning given the ongoing impact of lockdowns
512021 Annual Report
For the year ended 31 August 2021FINANCIAL PERFORMANCE
Financial Performance 20 | Governance and Risk Management 55 | Directorsrsquo Details 71
5 APPENDIX51 CASH EPS CALCULATIONS
Year End Performance Half Year Performance
Aug-21 Aug-20 (1)Aug-21
vs Aug-20 Aug-21 (2) Feb-21 (1)(2)Aug-21
vs Feb-21
Reconciliation of cash earnings for EPS
Cash earnings after tax ($ million) 412 225 83 247 165 50
Returns to other equity instruments (3) ($ million) (1) - (100) (1) - (100)
Cash earnings available for ordinary shareholders ($ million) 411 225 83 246 165 49
Effect of Wholesale Capital Notes ($ million) - 4 (100) - - -
Effect of Capital Notes 1 ($ million) 9 11 (18) 5 5 -
Effect of Capital Notes 2 ($ million) 5 - 100 4 2 100
Cash diluted earnings available for ordinary shareholders ($ million) 425 240 77 255 172 48
Weighted average number of shares (WANOS)
Basic WANOS - Ordinary shares (million) 550 455 21 630 468 35
Effect of award rights (million) 3 2 50 3 3 -
Effect of Wholesale Capital Notes (million) - 18 (100) - - -
Effect of Capital Notes 1 (million) 38 59 (36) 38 40 (5)
Effect of Capital Notes 2 (million) 21 - 100 28 15 87
Diluted WANOS for cash earnings EPS (4) (million) 612 534 15 699 526 33
Earnings per share
Basic EPS - Ordinary shares (cents) 747 496 51 388 355 9
Diluted EPS - Ordinary shares (cents) 695 451 54 362 328 10
(1) The basic and diluted earnings per share for August 2020 and February 2021 have been adjusted per ASX announcement on 20 April 2021 (2) The sum of 1H21 and 2H21 EPS and cash earning adjustments do not equal FY21 due to the impact of the capital raising and the uneven distribution of cash earnings after tax
across the two halves of the year(3) Other equity instruments assumed on the acquisition ME Bank Refer to Note 310(B) in the Financial Statements(4) During the year ended 31 August 2021 the Group granted 8033732 premium priced options to eligible employees The options were anti-dilutive during the period and
therefore have not impacted the diluted WANOS during the period
52 Bank of Queensland Limited and its Controlled Entities
For the year ended 31 August 2021FINANCIAL PERFORMANCE
About BOQ 12 | Responding to COVID-19 14 | Acquisition of ME Bank 15 | Value Creation and Strategy 16
52 AVERAGE BALANCE SHEET AND MARGIN ANALYSIS FY21 (1) FY20 (2)
Average balance
$mInterest
$m
Average rate
Average balance
$mInterest
$m
Average rate
INTEREST EARNING ASSETS
Loans amp advances (3) 45241 1430 316 44375 1656 373
Investments amp other securities 8569 28 033 7388 59 080
Total interest earning assets 53810 1458 271 51763 1715 331
Non-interest earning assets
Property plant amp equipment 134 157
Other assets 1679 1696
Provision for impairment (355) (257)
Total non-interest earning assets 1458 1596
Total assets 55268 53359
INTEREST BEARING LIABILITIES
Retail deposits 33185 202 061 30378 397 131
Wholesale deposits amp borrowings (4) 15964 206 129 17603 332 189
Total interest bearing liabilities 49149 408 083 47981 729 152
Non-interest bearing liabilities 1178 1240
Total liabilities 50327 49221
Shareholdersrsquo funds 4941 4138
Total liabilities amp shareholdersrsquo funds 55268 53359
INTEREST MARGIN amp INTEREST SPREAD
Interest earning assets 53810 1458 271 51763 1715 331
Interest bearing liabilities 49149 408 083 47981 729 152
Net interest spread 188 179
Benefit of free funds 007 012
NIM - on average interest earning assets 53810 1050 195 51763 986 191
(1) Relates to BOQ only(2) Comparative periods have been restated to conform to presentation in the current period Derivatives have been reallocated to better match their association to assets
or liabilities(3) Net of average mortgage offset balances(4) Includes hedging costs execution costs and dealer fees
532021 Annual Report
For the year ended 31 August 2021FINANCIAL PERFORMANCE
Financial Performance 20 | Governance and Risk Management 55 | Directorsrsquo Details 71
52 AVERAGE BALANCE SHEET AND MARGIN ANALYSIS (CONTINUED) 2H21 (1) 1H21 (2)
Average balance
$mInterest
$m
Average rate
Average balance
$mInterest
$m
Average rate
INTEREST EARNING ASSETS
Loans amp advances (3) 45970 706 305 44511 724 328
Investments amp other securities 8697 14 032 8441 14 033
Total interest earning assets 54667 720 261 52952 738 281
Non-interest earning assets
Property plant amp equipment 126 144
Other assets 1732 1626
Provision for impairment (350) (360)
Total non-interest earning assets 1508 1410
Total assets 56175 54362
INTEREST BEARING LIABILITIES
Retail deposits 33851 85 050 32518 117 073
Wholesale deposits amp borrowings (4) 15643 97 123 16285 109 135
Total interest bearing liabilities 49494 182 073 48803 226 093
Non-interest bearing liabilities 1126 1231
Total liabilities 50620 50034
Shareholdersrsquo funds 5555 4328
Total liabilities amp shareholdersrsquo funds 56175 54362
INTEREST MARGIN amp INTEREST SPREAD
Interest earning assets 54667 720 261 52952 738 281
Interest bearing liabilities 49494 182 073 48803 226 093
Net interest spread 188 188
Benefit of free funds 007 007
NIM - on average interest earning assets 54667 538 195 52952 512 195
(1) Relates to BOQ only(2) Comparative periods have been restated to conform to presentation in the current period Derivatives have been reallocated to better match their association to assets
or liabilities(3) Net of average mortgage offset balances(4) Includes hedging costs execution costs and dealer fees
54 Bank of Queensland Limited and its Controlled Entities
For the year ended 31 August 2021FINANCIAL PERFORMANCE
About BOQ 12 | Responding to COVID-19 14 | Acquisition of ME Bank 15 | Value Creation and Strategy 16
Managing our risk landscape BOQrsquos approach to the effective and prudent management of key risks is at the forefront of our business strategy Key risks are identified and managed as part of a Group Risk Management Framework that includes the Board approved Business Plans Risk Management Strategy and Risk Appetite Statement followed by the capital and funding plans
A cornerstone of the enterprise-wide strategy is the annual Board Strategic Review which provides a forward outlook taking into consideration various factors
bull Macroeconomic and financial services outlook
bull Internal environmental and competitive assessment
bull Group strategic risk and financial objectives
bull Group strategy statement
bull Financial forecast
bull System growth assumptions and relative returns of business lines (Banking)
bull Key strategic initiatives
bull Strategic goals and targets
bull Material strategy execution risks and proposed mitigating actions
Another cornerstone of the enterprise-wide strategy is the Group Risk Appetite Statement which covers the principal sources of risk and is cascaded to businesses as part of the business unit planning process qualitatively (through risk policies standards and operating procedures) and quantitatively (through risk limits settings and decision authorities)
The below diagram illustrates the governance framework for managing BOQrsquos key risks and how they are identified measured monitored and reported from Management up to the Board
Bank of Queensland Board
Executive Committee
(ExCo)
Executive Risk Committee
Executive Credit
Committee
Asset amp Liability
Committee
Risk Committee
Strategic Risk Non-Financial RisksFinancial Risks
Sustainability amp Climate
Change Risk
Insurance Risk
Credit Risk
Market Risk
Liquidity amp Funding Risk
Compliance Conduct amp Regulatory
Risk
Operational Risk
Reputational Risk
GOVERNANCE AND RISK MANAGEMENT
Financial Performance 20 | Governance and Risk Management 55 | Directorsrsquo Details 71
552021 Annual Report
BOQrsquos operations and performance are impacted by strategic risks financial risks and non-financial risks Key risks are identified and managed as part of BOQrsquos risk management framework The below table outlines the key risks impacting the business and how BOQ manages these
Risk Description Management of Risk Value Drivers
Compliance conduct amp regulatory engagement risk
The risk of failure to comply with any regulatory obligations including data privacy breaches the risk of inadequate response to regulatory change not acting in accordance with customersrsquo best interests not designing and distributing products and services to customers in an adequate accurate and proper manner not acting in accordance with BOQrsquos values and Code of Conduct not acting in accordance with Workplace Health and Safety laws not complying with Environmental laws Failure to adhere to the requirements of BOQrsquos Financial Crime Compliance Framework which includes BOQs Anti-Money Laundering and Counter-Terrorism Financing Program - Parts A and B Anti-Bribery and Corruption and Sanctions Evasion
BOQ has a Compliance Management Framework and underlying standards and procedures that outline how compliance risks are identified and managed within risk appetite and tolerance to meet regulatory requirements This is supported by a Privacy Management and Financial Crime Compliance Framework to manage the risk of money laundering and terrorism financing and other financial crime risks and a Conduct Risk Standard that outlines the approach to establishing and maintaining a strong ethical culture via embedded principles and policies Regulatory obligations are mapped to controls and captured in the Governance Risk and Compliance (GRC) tool to allow early identification of potential obligation breaches via incident management assurance and issue management Incident management also includes ensuring timely and appropriate notifications to regulators Regulatory change is managed through a Regulatory Change Roadmap
Customer
Finance
Credit riskThe risk that a debtor or transactional counterparty will default andor fail to meet their contractual obligations and includes the risk of loss of value of assets due to deterioration in credit quality and credit concentration risk This risk primarily arises from BOQrsquos lending activities and the holding of various financial instruments for investment or liquidity purposes
Risk management practices in place to support effective credit risk management include the establishment and ongoing maintenance of a limits monitoring and management framework BOQrsquos Credit Risk Management Principles provide core standards for the provision of credit for all customers The credit risk management principles express the expectations of the Board for both the analytical and behavioural aspects of granting of credit to customers BOQ maintains a suite of credit policies to address the range of lending products provided to customers and to satisfy the Board level requirements expressed in the Credit Risk Management Principles and Risk Appetite Statement
Customer
Finance
Environment amp climate change
Liquidity and funding risk
The risk that BOQ cannot meet or generate sufficient cash resources to meet its payment obligations in full as they fall due or can only do so at materially disadvantageous terms
BOQ maintains a diverse and stable pool of potential funding sources The Bank maintains adequate liquidity buffers and short-term funding capacity to withstand periods of disruption in long-term wholesale funding markets BOQ adopts a robust limit framework including stress testing and scenario analysis that enables risk based decisioning ensuring the business remains within risk appetite
Finance
Operational risk The risk of loss resulting from inadequate or failed internal processes people and systems andor from external events As such operational risk captures business continuity plans crisis management process systems and operations risk people related risks health and safety related risks information technology information security and data risks
BOQ has an Operational Risk Management Framework and underlying standards and procedures that outlines how operational risks are identified and managed within risk appetite and tolerance to meet regulatory customer operational and strategic requirements This includes mechanisms to undertake risk-reward business decisions taking into account operational risk exposures and the control environment These risks are managed through our GRC tool
Customer
People
Environment amp climate change
Finance
Insurance riskInsurance risk arises from the ownership and operation of insurance companies Insurance Risk can be broadly defined as an unexpected economic gain or loss relating to movements in claim costs This includes the risk that inadequate or inappropriate product design (including pricing) underwriting claims management and reinsurance management will expose the business to financial loss and the consequent inability to meet its liabilities
St Andrewrsquos manages insurance risk through the Reinsurance Management Strategy Claims Management Policy and the Risk Appetite Statement The divestment of St Andrewrsquos will significantly reduce the exposure BOQ has toward insurance and therefore the necessity to have this as a material risk class
Finance
Contagion riskThe primary sources of market contagion risk relate to correlated concentrations balance sheet contagion and severe market liquidity events Internal contagion risk is the risk that problems arising in BOQrsquos subsidiaries may compromise the financial and operational position of the BOQ Group
BOQrsquos credit portfolio limit framework and risk appetite measures enable effective management of market contagion risk BOQ applies common risk management practices across all Group subsidiaries The performance of subsidiaries is subject to ongoing review and oversight with senior management representation on subsidiary management committees and boards
Finance
Reputation riskThe risk to earnings and capital arising from negative public opinion resulting from the loss of reputation public trust or standing and is considered to be a risk derived from business activities and is considered in conjunction with the underlying risks resulting from those activities
BOQ has relevant risk management frameworks for the management of the underlying risks which can have an impact on reputation risk as outlined in this section Supporting this are conduct and reputational risk frameworks outlining the approach to establishing and maintaining a strong ethical culture via embedded principles and policies throughout the Group to support the management of reputation risk
Customer
Finance
Strategic risk Strategic Risk is the risk that might arise from the pursuit of a business model or strategy that is not viable
Business strategy development incorporates risk management practices to ensure any potential changes in the level of risk including new risks are continuously considered when making strategic decisions Key strategic risks are subject to ongoing review and analysis with monthly reporting provided to management and the Board including performance against strategic growth targets
Finance
Technology amp data capabilities
Sustainability and climate change risk
More detail on climate change risk can be found on pages 61 - 69 Refer to page 62 for full details on how we are managing sustainability risk and climate change
Community
Environment amp climate change
GOVERNANCE AND RISK MANAGEMENT
About BOQ 12 | Responding to COVID-19 14 | Acquisition of ME Bank 15 | Value Creation and Strategy 16
56 Bank of Queensland Limited and its Controlled Entities
Risk Description Management of Risk Value Drivers
Compliance conduct amp regulatory engagement risk
The risk of failure to comply with any regulatory obligations including data privacy breaches the risk of inadequate response to regulatory change not acting in accordance with customersrsquo best interests not designing and distributing products and services to customers in an adequate accurate and proper manner not acting in accordance with BOQrsquos values and Code of Conduct not acting in accordance with Workplace Health and Safety laws not complying with Environmental laws Failure to adhere to the requirements of BOQrsquos Financial Crime Compliance Framework which includes BOQs Anti-Money Laundering and Counter-Terrorism Financing Program - Parts A and B Anti-Bribery and Corruption and Sanctions Evasion
BOQ has a Compliance Management Framework and underlying standards and procedures that outline how compliance risks are identified and managed within risk appetite and tolerance to meet regulatory requirements This is supported by a Privacy Management and Financial Crime Compliance Framework to manage the risk of money laundering and terrorism financing and other financial crime risks and a Conduct Risk Standard that outlines the approach to establishing and maintaining a strong ethical culture via embedded principles and policies Regulatory obligations are mapped to controls and captured in the Governance Risk and Compliance (GRC) tool to allow early identification of potential obligation breaches via incident management assurance and issue management Incident management also includes ensuring timely and appropriate notifications to regulators Regulatory change is managed through a Regulatory Change Roadmap
Customer
Finance
Credit riskThe risk that a debtor or transactional counterparty will default andor fail to meet their contractual obligations and includes the risk of loss of value of assets due to deterioration in credit quality and credit concentration risk This risk primarily arises from BOQrsquos lending activities and the holding of various financial instruments for investment or liquidity purposes
Risk management practices in place to support effective credit risk management include the establishment and ongoing maintenance of a limits monitoring and management framework BOQrsquos Credit Risk Management Principles provide core standards for the provision of credit for all customers The credit risk management principles express the expectations of the Board for both the analytical and behavioural aspects of granting of credit to customers BOQ maintains a suite of credit policies to address the range of lending products provided to customers and to satisfy the Board level requirements expressed in the Credit Risk Management Principles and Risk Appetite Statement
Customer
Finance
Environment amp climate change
Liquidity and funding risk
The risk that BOQ cannot meet or generate sufficient cash resources to meet its payment obligations in full as they fall due or can only do so at materially disadvantageous terms
BOQ maintains a diverse and stable pool of potential funding sources The Bank maintains adequate liquidity buffers and short-term funding capacity to withstand periods of disruption in long-term wholesale funding markets BOQ adopts a robust limit framework including stress testing and scenario analysis that enables risk based decisioning ensuring the business remains within risk appetite
Finance
Operational risk The risk of loss resulting from inadequate or failed internal processes people and systems andor from external events As such operational risk captures business continuity plans crisis management process systems and operations risk people related risks health and safety related risks information technology information security and data risks
BOQ has an Operational Risk Management Framework and underlying standards and procedures that outlines how operational risks are identified and managed within risk appetite and tolerance to meet regulatory customer operational and strategic requirements This includes mechanisms to undertake risk-reward business decisions taking into account operational risk exposures and the control environment These risks are managed through our GRC tool
Customer
People
Environment amp climate change
Finance
Insurance riskInsurance risk arises from the ownership and operation of insurance companies Insurance Risk can be broadly defined as an unexpected economic gain or loss relating to movements in claim costs This includes the risk that inadequate or inappropriate product design (including pricing) underwriting claims management and reinsurance management will expose the business to financial loss and the consequent inability to meet its liabilities
St Andrewrsquos manages insurance risk through the Reinsurance Management Strategy Claims Management Policy and the Risk Appetite Statement The divestment of St Andrewrsquos will significantly reduce the exposure BOQ has toward insurance and therefore the necessity to have this as a material risk class
Finance
Contagion riskThe primary sources of market contagion risk relate to correlated concentrations balance sheet contagion and severe market liquidity events Internal contagion risk is the risk that problems arising in BOQrsquos subsidiaries may compromise the financial and operational position of the BOQ Group
BOQrsquos credit portfolio limit framework and risk appetite measures enable effective management of market contagion risk BOQ applies common risk management practices across all Group subsidiaries The performance of subsidiaries is subject to ongoing review and oversight with senior management representation on subsidiary management committees and boards
Finance
Reputation riskThe risk to earnings and capital arising from negative public opinion resulting from the loss of reputation public trust or standing and is considered to be a risk derived from business activities and is considered in conjunction with the underlying risks resulting from those activities
BOQ has relevant risk management frameworks for the management of the underlying risks which can have an impact on reputation risk as outlined in this section Supporting this are conduct and reputational risk frameworks outlining the approach to establishing and maintaining a strong ethical culture via embedded principles and policies throughout the Group to support the management of reputation risk
Customer
Finance
Strategic risk Strategic Risk is the risk that might arise from the pursuit of a business model or strategy that is not viable
Business strategy development incorporates risk management practices to ensure any potential changes in the level of risk including new risks are continuously considered when making strategic decisions Key strategic risks are subject to ongoing review and analysis with monthly reporting provided to management and the Board including performance against strategic growth targets
Finance
Technology amp data capabilities
Sustainability and climate change risk
More detail on climate change risk can be found on pages 61 - 69 Refer to page 62 for full details on how we are managing sustainability risk and climate change
Community
Environment amp climate change
GOVERNANCE AND RISK MANAGEMENT
Financial Performance 20 | Governance and Risk Management 55 | Directorsrsquo Details 71
572021 Annual Report
The financial services industry continues to receive significant focus from the Federal Government regulators investors and consumers A summary of the key areas of reform and areas of increased risk focus are outlined below
Regulatory developmentsPolicy and Priorities Following a suspension in March 2020 later in the year APRA recommenced its planned policy and supervision agenda to prioritise activities that responded to the impacts of COVID-19
In February 2021 APRA released its policy and supervision activities across 202122 A key focus was on enhancing the resilience and crisis readiness of Australiarsquos financial system Achieved by working closely with peer regulators to support the recovery from the impacts of COVID-19 through delivery of efficient proportionate regulation that facilitates a resilient competitive and innovative financial sector
For the remainder of 2021 APRArsquos policy priorities will centre on completing key reforms to strengthen financial resilience Of relevance to BOQ these include
bull Completing the bank capital reforms with three final standards for capital adequacy to be released in November 2021 and to apply from January 2023
bull Consulting on reforms to the insurance capital framework to reflect changes in the accounting standard AASB17
bull Consulting on new standards for financial contingency planning and resolution to be released in November 2021 for an extended consultation
In addition APRA advised it also plans to release final guidance on managing the financial risks of climate change in addition to an Information Paper setting out APRArsquos framework for the use of macro-prudential policy tools
APRA also noted that several other policy releases originally scheduled for this 2021 have been deferred to 2022 including standards for operational resilience remuneration disclosure requirements interest rate risk in the banking book and offshore reinsurance
ASIC released an interim one year corporate plan refreshing its strategic priorities in response to the impact of COVID-19 The priorities for 2020ndash21 are
bull Protecting consumers from harm at a time of heightened vulnerability
bull Maintaining financial system resilience and integritybull Supporting Australian businesses to respond to the effects of
the COVID-19 pandemicbull Continuing to identify disrupt and deter the most harmful
conduct including through enforcement action bull Continuing to build our organisational capability in
challenging times
Capital ManagementAPRA provided guidance to all ADIs and Insurers on capital management to ensure entities can fulfil their role in supporting the economy which included
bull Regular stress testing to assess financial resilience in a range of scenarios including severe but plausible downturn conditions
bull Assurance on the capacity to continue to lend and underwrite insurance with the use of capital buffers to absorb the impacts of stress if needed
bull A rigorous approach to recovery planning to ensure readiness to initiate contingency measures and respond to conditions if required
bull Caution in capital distributions with an ongoing measured approach to dividends in this heightened risk environment
ConductRoyal Commission into Misconduct in the Banking Superannuation and Financial Services Industry (Royal Commission)On 12 November 2020 the Financial Sector Reform (Hayne Royal Commission Response) Bill 2020 was introduced into the House of Representatives implementing 21 of the 76 recommendations from the Royal Commission
The package of reforms implements a significant number of the Royal Commission recommendations and the additional commitments made by the Government to improve consumer protections and strengthen regulators This includes addressing conflicts between the interests of financial institutions and their customers ensuring customers are treated fairly in dealings with the financial sector and ensuring regulators have the powers and resources needed to be effective in their enforcement and supervision role
The Bill was passed on 10 December 2020
While the reforms apply across all financial services including superannuation and insurance and also impact the roles of APRA and ASIC the key impacts for BOQ are as follows
Legislation Start date
Substantial changes to mandatory breach reporting
1 October 2021
Expansion of the anti-hawking rules
5 October 2021
Introduction of a deferred sales model for add-on insurance
5 October 2021
Caps on commissions for add-on insurance
1 January 2021 (but no caps enacted at this stage)
Enforceable code provisions 1 January 2021 (but no codes prescribed as enforceable at this stage)
MANAGING THE EVOLVING RISK ENVIRONMENT
GOVERNANCE AND RISK MANAGEMENT
About BOQ 12 | Responding to COVID-19 14 | Acquisition of ME Bank 15 | Value Creation and Strategy 16
58 Bank of Queensland Limited and its Controlled Entities
Conduct (continued)Risk Governance Self-AssessmentBOQ is committed to continuous improvement in our risk governance practices During the year BOQ continued to advance our risk maturity and capabilities to manage non-financial risks in order to deliver sustainable improvement in risk management practices including enhancements to our key risk frameworks mechanisms to monitor maturity and risk appetite
Financial Accountability RegimeOn 16 July 2021 the Federal Treasury released exposure draft legislation to implement further recommendations of the Banking Superannuation and Financial Services Royal Commission including the Financial Accountability Regime (FAR) that will replace the current Banking Executive Accountability Regime (BEAR) applicable to ADIs
FAR imposes a strengthened responsibility and accountability framework within financial institutions absorbs the BEAR requirements and makes a number of changes including
bull Extension of the regime beyond the banking industry to include insurance and superannuation sectors
bull Introduction of new responsibilities including product dispute resolution customer remediation and breach reporting which will be allocated to senior executives
bull ASIC will join APRA as a co-regulator
Timeliness for implementation of the FAR forms part of the current consultation which BOQ continues to actively engage in and is committed to comply with the requirements of FAR
Regulatory oversight amp changeDesign and Distribution ObligationsThe Treasury Laws Amendment (Design and Distribution Obligations and Product Intervention Powers) Act 2019 (DDO) is an end-to-end approach to manage design and distribution of products DDO places responsibility on financial firms to ensure that products are designed and distributed to the appropriate class of customer This will be achieved by defining who the target market is for each product and then taking measures to ensure that only customers who fall within that target market are issued with that product (Target Market Definitions) The obligations will apply to all products within BOQ with the exception of business credit The DDO are broken into two separate categories lsquodesign obligationsrsquo and lsquodistribution obligationsrsquo The lsquodesign obligationsrsquo will belong to the product issuer and the lsquodistribution obligationsrsquo will belong to the product lsquodistributorrsquo In many cases BOQ will act as both product issuer and distributor In other cases broker and white label partners will be the distributors
DDO was implemented by the BOQ group prior to the 5 October 2021 deadline BOQ already has processes in place for managing the life cycle of its products which will be updated to include the new requirements introduced by DDO
New Regulatory Guide 271 ndash Internal Dispute ResolutionOn 30 July 2020 ASIC released the Regulatory Guide (RG) 271 on Internal Dispute Resolution (IDR) which seeks to raise the IDR standards across the financial sector The new RG makes parts of the IDR standards and requirements enforceable which will require an increased focus on complaints handling across the industry
The changes that will likely have the greatest operational impact include
bull The updated requirement to acknowledge complaints within 24 hours of receiving it
bull The new 30-day resolution timeframe for standard complaints reduced from 45 days
bull The heightened focus and new requirements for the early identification and investigation of systemic issues
bull The need to ensure that all the social media platforms owned or controlled by a firm will be monitored for complaint identification
The new RG comes into effect on 5 October 2021 the same go-live date as the DDO regime The effective and appropriate management of complaints continues to be a focus for BOQ and a regulatory change group will work towards effective implementation of this new RG
Consumer Data Right Bill (CDR) and Open BankingCDR is designed to give customers more control over their banking data and improve customersrsquo ability to compare and switch between products and services The Government has committed to implementing CDR in the banking energy and telecommunications sector For the banking sector this is referred to as ldquoOpen Bankingrdquo and is the first sector to apply the CDR
At BOQ the sharing of consumer reference data was due to take place by 1 July 2021 BOQ did not meet compliance by 1 July 2021 and has a rectification schedule in place to commence sharing consumer reference data later this year and to ensure compliance with the CDR regime more broadly
MANAGING THE EVOLVING RISK ENVIRONMENT (CONTINUED)
GOVERNANCE AND RISK MANAGEMENT
Financial Performance 20 | Governance and Risk Management 55 | Directorsrsquo Details 71
592021 Annual Report
Hawking of Financial ProductsThe new anti-hawking rules came into effect on 5 October 2021 and they expand the current anti-hawking regime applicable to general insurance by making it apply to all financial products (as defined in the Corporations Act) sold to a retail customer Credit products are not in-scope under the new rules
Broadly speaking the legislation prohibits an offer to issue or sell a financial product to a retail customer or invite the customer to ask for a product unless the contact occurs following a positive express request from the customer The prohibition applies to real-time contact which the customer does not expressly and positively request for example contact in-person in online chats and by phone The regime is not intended to apply to emails or other written correspondence where the customer is not expected to respond immediately Once the customer has made such a request regarding a financial product there is a period of 6 weeks in which to discuss the product and make an offer to the customer before the customer consentrequest is deemed expired
BOQ had a project team working to ensure compliance with the new hawking regime BOQ has provided training to employees to ensure compliance with the new rules and implemented a refreshed approach to providing insurance products to ensure only positive express requests from the customer are actioned
Breach ReportingThe legislation relating to breach reporting represents a substantial overhaul of the mandatory breach reporting regime
From 1 October 2021 BOQ has to report
a) Every breach of a civil penalty provision eg this would include every breach of the requirement to act efficiently honestly and fairly ndash no materiality threshold
b) Every breach of the misleading and deceptive conduct provisions ndash no materiality threshold
c) Every breach of a criminal penalty provisiond) Every breach that may result in material loss or damage to a
persons to whom BOQ provides financial servicese) Every investigation into a potentially reportable matter that
runs beyond 30 days including where the matter is deemed non-reportable after investigation
The breaches must be reported 30 calendar days from when BOQ knew or should have known about the issue
In addition there is what is being referred to as the ldquodobbing obligationsrdquo where BOQ has a duty to lodge a report with ASIC where there are reasonable ground to believe there is reportable conduct by a mortgage broker or financial advisor (in relation to complex financial products sold to retail customers)
BOQ had a project team working to ensure compliance with the new breach reporting regime BOQ has provided training to employees to ensure compliance with the new rules and implemented a refreshed approach including GRC Tool enhancements to breach reporting to ensure the regulatory requirements are achieved
Financial crimeAnti-Money Laundering and Counter Terrorism Financing ComplianceRecognising that banks play a vital role in preventing and detecting financial crime to protect Australiarsquos financial system from criminal exploitation BOQ continues to build its financial crime capability through technology people partnerships and a strong Anti-Money Laundering (AML)Counter Terrorism Financing (CTF) framework
BOQ continues to engage with Australian Transaction Reports and Analysis Centre (AUSTRAC) in relation to BOQrsquos AML CTF program and continues to enhance and strengthen its AMLCTF systems and controls following the closure of the findings by AUSTRAC post their onsite review in 2018 The deployment of a new platform for AMLCTF controls has enhanced BOQrsquos capability to prevent detect and mitigate financial crime risks across BOQ
Credit riskResponse to COVID-19BOQ worked swiftly and decisively with the Australian Banking Association (ABA) the Federal Government and regulators to establish the Banking Relief Package program for customers impacted by COVID-19 BOQ deployed 70 highly skilled individuals into the Customer Assistance Team dedicated to assisting customers impacted by COVID-19
Building upon the processes implemented in 2020 BOQ continues to monitor the credit quality of the portfolio to assess economic impacts due to COVID-19 particularly in light of the recent spike in cases causing the reintroduction of more severe restrictions and lockdowns BOQ has a number of credit models designed to assist in measuring the credit risk in the portfolio based on changing economic and environmental conditions
Further information on BOQrsquos response to COVID-19 can be found on page 14
MANAGING THE EVOLVING RISK ENVIRONMENT (CONTINUED)
GOVERNANCE AND RISK MANAGEMENT
About BOQ 12 | Responding to COVID-19 14 | Acquisition of ME Bank 15 | Value Creation and Strategy 16
60 Bank of Queensland Limited and its Controlled Entities
BOQ AND CLIMATE CHANGEClimate change is visibly impacting our customers our people our suppliers and society more broadly
We acknowledge these impacts and take action managing our climate related risks through scenario analysis consideration of outcomes into risk management and resilience activities reducing our footprint by becoming a carbon neutral organisation and tracking the impact of our lending activities
This year we elevated our climate scenario analysis that informs the resilience of our strategy by engaging with climate scientists and other relevant experts
Going forward we will continue to evolve our assessment of climate risks and its impact on our business This evolution includes further integration of the outcomes of stress testing and scenario analysis into BOQrsquos strategic response to climate related risks and opportunities and the activities needed to support our customers through the transition to a low carbon economy
We also see opportunity to influence the transition to a resilient low carbon economy by engaging with our customers and suppliers consistent with our purpose to create prosperity for our customers shareholders and people through empathy integrity and by making a difference
Climate risk positionBOQ accepts climate change is the product of human influence and supports the transition to a net zero carbon economy in alignment with the Paris Agreement to keep global warming well-below 2 degrees Celsius and striving to limit warming to 15 degrees Celsius The recent Intergovernmental Panel on Climate Change (IPCC) report reinforces the urgency for both governments and corporates to accelerate action to tackle climate change as warming caused by greenhouse gas emissions is increasing the rate of unprecedented disruption in every region across the world The impacts of climate change are increasingly shaping investment flows policy and consumer behaviour
Financial regulators including ASIC and APRA through their recent draft prudential guidance have continued to highlight climate-related risks as a potential source of financial risk to the future stability and resilience of the financial system As a distributor of capital we play a role in supporting the transition to a lower carbon economy through our direct consumption of resources and through our financing activities We are committed to advocating for and integrating strong climate change action into all facets of our organisation
GOVERNANCE AND RISK MANAGEMENT
Financial Performance 20 | Governance and Risk Management 55 | Directorsrsquo Details 71
612021 Annual Report
GovernanceThe Board and Risk Committee directly oversees BOQrsquos climate-related risks opportunities and strategies and are responsible for reviewing and approving respective climate-related objectives performance goals and targets Progress on climate change commitments and targets are reviewed by the Board on a quarterly basis through our Sustainability Balanced Scorecard Updates to policy regulatory and liability responses to climate change are reported to the Board and the Risk Committee on a regular basis as needed
The Board delegates the day to day management of environmental and social risks and opportunities including climate change to the Executive Team The Executive Team are accountable for BOQrsquos actions and commitments to embed climate change into BOQrsquos business strategy and risk management
The Sustainability Working Group (SWG) supports executive management with the development and implementation of climate initiatives and reporting requirements The SWG is made up of senior representatives across the Group who are involved in the day to day management of climate change and other sustainability matters SWG members are responsible for ensuring the leadership teams across the bank remain informed on climate related issues and our progress on climate change commitments and targets
Risk management Our processes for identifying and assessing climate-related risks are integrated into multi-disciplinary company-wide risk management activities with a focus on material credit and operational risks
We have updated our Risk Management Strategy (RMS) and Risk Appetite Statement (RAS) to specifically address climate and sustainability risk These policies set out the Boardrsquos expectations regarding the degree of risk that BOQ is prepared to accept The RMS and RAS are updated annually informed by workshops to validate and prioritise our approach to climate change risks This process is supported by scenario analysis and external climate consultants and scientists
Scenario analysis is used to inform potential future exposure to material climate risks and opportunities across business units and locations This provides insight into where climate change mitigation and adaptation could be incorporated into our strategy to support our customers as well as to capture commercial opportunities and ensure our business operations are resilient
The management of climate change is embedded in our business through credit policies overseen by the Executive Credit Committee such as the Ecological Care and Sustainability Lending Policy to assess potential environmental implications to credit risk Credit risk operational activities are assessed at a portfolio level as well as at an individual credit exposure level on a case-by-case basis Property valuations take into account factors such as flooding and environmental risk including insurance impacts in estimating the value of properties which BOQ uses as a basis for determining an appropriate level of lending to be extended relative to that property value The climate scenario analysis is undertaken at the portfolio level
We are also continually monitoring trends concerns publications and actions that emerge from regulators and investors through structured engagement and industry forums
This allows BOQ to keep abreast of changes to climate-related risks including compliance with any legislative or regulatory obligations We are continuing to evolve how we assess climate risk and its impact on our business which will include the development of a Climate Change Risk Management Framework
BOQ AND CLIMATE CHANGE (CONTINUED)
Board
Risk Committee
Executive Team
Sustainability Working Group
The board is responsible for oversight of the Grouprsquos approach to and management of climate change
Oversight of management of climate-related risks
Ultimately responsible for embedding climate change into the Grouprsquos risk management and business strategy
Supports Executive Team with development and implementation of climate initiatives
and reporting requirements
GOVERNANCE AND RISK MANAGEMENT
About BOQ 12 | Responding to COVID-19 14 | Acquisition of ME Bank 15 | Value Creation and Strategy 16
62 Bank of Queensland Limited and its Controlled Entities
Strategy BOQ is committed to supporting Australia and our customers to transition to a low carbon and climate-resilient economy Our approach to climate change is informed by prioritised risks and opportunities This has led to an initial set of commitments covering BOQrsquos operations and includes achieving carbon neutrality and sourcing 100 per cent renewable energy
This year we have increased the sophistication of our climate scenario analysis by engaging with climate scientists and relevant experts to better understand the potential financial-related impacts of key risks and opportunities delivering on our prior year commitment
With a focus on credit liquidity market and operational risks we have prioritised the below climate risks and opportunities over the short term (0-5 years) medium term (10 years) and long term (20+ years) informing areas required for further climate scenario analysis
BOQ AND CLIMATE CHANGE (CONTINUED)
Climate Risks (R) Opportunities (O) Timeframe Potential impacts on BOQ customers and BOQ
Physical
Acute
bull Decline in value of assets due to impact bull Rise in insurance premiums or inability to obtain insurancebull Business disruption bull Devaluation of collateral bull Increased expenses bull Reduced profitability bull Increased arrears hardship and impairments
R amp OExtreme weather events including flooding associated with extreme rain cyclones storms and bushfires
Short to long term
Chronic
RLong-term weather changes such as rising temperatures sea level rise and drought
Long term
Transition
Policy
R Government climate policies (eg carbon taxes and cross border tariffs)
Short to medium term
bull Reduced market competitiveness bull Increased operating costs complexity bull Increased credit risk
R Increased climate regulation for financial institutions Short term bull Enhanced reporting and compliance obligations
Technology
R amp OTransition to renewable energy lower emissions technology and electrification
Short to medium term
bull Increased decreased costs bull Increased decreased profitability bull Obsolete assetsbull Increased decreased credit risk
Market
R Disruption of carbon intensive industries and associated value chains
Short to medium term
bull Obsolete assets bull Devaluation of collateral bull Increased arrears hardship and impairments
O Growth of low carbon sectors Short to long term bull Increased profitabilitybull Reduced carbon intensity of loan book
R amp O Shift in demand for services and products
Short to medium term
bull Increase decrease of customers and income bull Increased costs complexity from new products
Reputation
R amp O Increased climate risk focus from investors
Short to medium term bull Increased decreased cost of capital
R amp O Alignment with customer and employee values on climate change
Short to medium term
bull Higher productivity increased ability to retain and attract talent bull Increase decrease of customers and income
Liability
RIncreased stakeholder activism litigation against organisations demonstrating insufficient climate action
Short to medium term
bull Business disruption increased costs bull Director liability bull Reputational damage
GOVERNANCE AND RISK MANAGEMENT
Financial Performance 20 | Governance and Risk Management 55 | Directorsrsquo Details 71
632021 Annual Report
Climate scenario analysisIn FY21 we expanded our scenario analyses of climate risks to include physical risks from climate extremes to BOQrsquos residential lending portfolios across (including ME Bank) and the BOQ Business property and construction portfolios
We also enhanced our transition risk analysis of commercial lending and asset finance and leasing across BOQ BOQ Finance and BOQ Specialist to assess risks and opportunities from disruption of carbon intensive sectors and growth of low carbon sectors
The scenario analysis evaluated the impact of both physical and transition risk to BOQ in line with the latest industry guidance and best practice utilising reference scenarios sourced from global sources including
bull IPCC to describe plausible physical climate futures resulting from global Representative Concentration Pathway (RCPs) andbull Network for Greening the Financial System (NGFS) transition pathway scenarios to assess the impact of climate-related transition risks
Physical Risk Transition Risk amp Opportunities
Climate Extremes Growth of low carbon sectors or disruption of carbon intensive sectors
Businesses and portfolios
Residential portfolio across all BOQ brands
BOQB property and construction portfolio
Commercial lending and asset finance and leasing across BOQ BOQF and BOQS
Risks Assessed Extreme heat
Extreme rain
Very high fire days
Cyclones and east coast lows
Extreme sea level events
Chronic temperature and sea level rise
Change in exposure to transition risk estimated as the additional costs upon a sector as a result of its direct and indirect emissions from a carbon price under the relevant scenario
Approach BOQrsquos portfolio was mapped on a postcode scale nationally(1) These locations were overlayed with multi-model averaged future climate change projections from publicly available regional (5 km scale) and global (~100 km scale) climate model datasets and peer reviewed literature
Using downscaled Australian-level data from global NGFS models in addition to Australian statistics regarding emissions and industry value added Calculated the change in sectoral emissions and additional costs upon a sector as a result of its direct and indirect emissions from a carbon price(2) under different scenarios BOQrsquos financial sectoral exposure is overlaid to infer the implications for the bank The composition of sectoral exposure was held constant for the purposes of the analysis
Timeframe 2030 2050 2030 2040 2050
Reference scenarios
Strong climate action (RCP45)
No global climate action (RCP85)
NGFS
Orderly - Below 2degC ndash (2degC aligned) - Net Zero 2050 - (15degC aligned)
Disorderly - Delayed Transition - (2degC aligned) - Divergent Net Zero - (15degC aligned)
Metrics considered
Number of days over 35degC annually
1-in-20yr wettest day rainfall
Number of days annually where the Forest Fire Danger Index exceeds 25 (very high rating)
Cyclone intensity frequency and land rainfall rate
1-in-100yr Extreme sea level events
Industry value added
Sectoral emissions
Carbon price
(1) Assessment includes 85 of BOQrsquos total credit risk (2) Scenario analysis process uses a carbon price as a representation of a suite of policies and regulations which may or may not be purely financial
BOQ AND CLIMATE CHANGE (CONTINUED)
GOVERNANCE AND RISK MANAGEMENT
About BOQ 12 | Responding to COVID-19 14 | Acquisition of ME Bank 15 | Value Creation and Strategy 16
64 Bank of Queensland Limited and its Controlled Entities
Climate scenario analysis (continued)Physical risk scenario analysis insightsProlonged exposure to hotter temperatures and extreme temperature events such as widespread drought and heatwaves extreme rainfall events and rising sea levels can damage property and reduce health and liveability Severe weather and long-term changing weather patterns may reduce collateral values thereby increasing credit risk via a higher loss given default or result in loss of asset values and increase volatility Moreover macroeconomic shocks may increase liquidity risk It is expected there will be future changes in physical climate hazards (extreme rain heat fire and sea level events) across BOQrsquos residential and construction portfolio assets
Figure 1 shows the concentration of assessed collateral by postcode The highest concentration of collateral is located on the north to south-east QLD coast central and south-east NSW coast and metropolitan Victoria While the ME Bank has diversified the geographic spread of BOQ all states in the portfolio are at risk to increasing frequency of one or more climate hazards
BOQ AND CLIMATE CHANGE (CONTINUED)
Figure 1 Concentration of BOQrsquos Portfolio
Low High
QLD - 33
NSW - 25
ACT - 4
VIC - 22
TAS - 2
SA - 3
WA - 11
NT - 1
GOVERNANCE AND RISK MANAGEMENT
Financial Performance 20 | Governance and Risk Management 55 | Directorsrsquo Details 71
652021 Annual Report
Climate scenario analysis (continued)Physical risk scenario analysis insights (continued)Scenario analysis found increases in extreme rain are likely to be experienced across Australia Changes are non-uniformly distributed across time and spatially Figure 2 shows the projected future change in the intensity of the 1-in-20 year extreme rainfall across BOQrsquos portfolio under a strong climate action (RCP45) and no global climate action (RCP85) scenario
By 2030 under RCP85 the annual average temperature in Australia is projected to increase by 06-13degC above the mean temperature and extreme heat risk similarly increases Extreme heat conditions can disrupt construction labour and change soil structure The scenario analysis found that the BOQB property and construction portfolio is projected to experience at least 7 additional hot days over 25degC annually across inland NT SA WA NSW and QLD portfolios
A warmer and drier climate provides favourable conditions for increases in bushfire risk Models project that under RCP85 in 2030 the majority of the NT SA and WA portfolios will experience at least an additional 6 days of very high fire danger (Figure 3)
Our strategy and risk management framework has controls in place to ensure we appropriately manage physical risks An important mechanism in ensuring our exposure to physical climate risk remains low is our customers maintaining insurance protection in accordance with their lending contracts
In the longer term insurance affordability or inability to insure will need to be tracked in addition to enhanced consideration of potential flood and other hazards at loan origination
Figure 3 Future change in very high fire days annually compared to (1986-2005)
0 Days gt 30 Days
2030 2050RCP45
2030 2050RCP85
Figure 2 Future change in the 1-in-20yr extreme rainfall in 2030 compared to (1986-2005)
30mm decrease
100mm increase
2030 2050RCP45
2030 2050RCP85
BOQ AND CLIMATE CHANGE (CONTINUED)
GOVERNANCE AND RISK MANAGEMENT
About BOQ 12 | Responding to COVID-19 14 | Acquisition of ME Bank 15 | Value Creation and Strategy 16
66 Bank of Queensland Limited and its Controlled Entities
Climate scenario analysis (continued)Transition risk scenario analysis insightsSome sectors are likely to face significant challenges because of their current high emissions intensity and the rapid rate of decarbonisation needed under low emissions scenarios BOQrsquos lending portfolio has no exposure to fossil fuel power generation and minimal direct exposure to fossil fuels extraction
BOQrsquos business lending portfolios have minimal exposure to sectors with greater than 50 per cent of exposure to transition risk under the most ambitious disorderly decarbonisation scenario
Sectors contributing to the provision of clean energy are expected to thrive under the scenarios Opportunity sectors exist in industries aligned with BOQrsquos portfolio including agri-tech bioenergy critical minerals and carbon forestry
More than 70 per cent of BOQrsquos business lending portfolio is exposed to sectors with a minimal impact (lt10 per cent of sectoral exposure) from the additional costs expected to be incurred during a transition to net zero emissions under both orderly and disorderly 15˚C and 20˚C scenarios at 2030 2040 and 2050
Industries including agriculture non-metallic mineral product manufacturing and waste collection and disposal services are likely to face transition challenges despite their products remaining in demand BOQrsquos behavioural loan term for these sectors is generally short providing an opportunity to re-assess and support our customerrsquos transition at renewal points
Future scenario analysis The results from our scenario analysis work inform where to best prioritise mitigation and adaptation options whilst simultaneously harnessing the opportunities identified The focus of our scenario analysis will evolve as our understanding of the impact of climate risks and opportunities on ourselves and our customers matures
Climate risk scenario analysis and climate vulnerability analysis is a developing area and BOQrsquos approach will evolve and mature over time
Areas for further refinement include enhancing our understanding of the interaction between physical climate risks property damage and the resilience of construction and insurance including underinsurance and noninsurance and subsequent impacts on credit stress testing
We also see opportunity to continue to collaborate with broader industry groups to ensure the best outcomes for our customers and communities
BOQ AND CLIMATE CHANGE (CONTINUED)BOQ AND CLIMATE CHANGE (CONTINUED)
BOQrsquoS BUSINESS LENDING (1) PORTFOLIO EXPOSURE TO TRANSITION RISK UNDER AN ORDERLY 2degC SCENARIO
Sectors Current Portfolio Sector Exposure due to transition to low carbon economy under orderly 2ordmC Scenario
$m 2030 2040 2050
Professional Services and Real Estate 4850 31 0 0 0
Accommodation and Health Services 3617 23 1 1 1
Construction 2003 13 1 1 1
Agriculture 1232 8 25 25 23
Manufacturing and Mining 779 5 5 5 4
Transport 843 5 4 4 4
Other 2509 16 1 1 1
Total 15833 100
(1) Includes commercial and asset financing from BOQB BOQS and BOQF
The table above shows sectors exposure due to the transition to a low carbon economy under an orderly 2˚C scenario and our proportionate credit exposures in our business lending portfolio Under an orderly 2˚C scenario BOQrsquos portfolio has low exposure to high emitting sectors The projected risk identified may not necessarily be realised for all customers within the sector Customer level impacts will likely be realised based on unique exposures from geography asset type diversity and operations of business models therein
GOVERNANCE AND RISK MANAGEMENT
Financial Performance 20 | Governance and Risk Management 55 | Directorsrsquo Details 71
672021 Annual Report
Healthcare
Agriculture
Other
Residential MortgagesProfessional Services
Manufacturing amp Mining
Property amp ConstructionHospitality and Accommodation
Transport
BOQ Group Lending
of emissions by sector (1)
2714
5
9
4
27
4
8
3
Targets amp Metrics Industry exposuresThe table below outlines the proportionate credit exposures of lending activities
The acquisition of ME Bank has significantly shifted proportional exposures to residential lending This shift highlights the need for continued enhancement of data and risk management processes to help pinpoint risks and impacts such as improving our geo-locational data mapping to better understand potential physical impacts and increasing our understanding of which mortgage customers may be exposed to high risk industries
Financed emissionsBOQ recognises that measuring financed emissions is an important consideration in managing climate related risks and opportunities
In FY21 the carbon intensity of the loan (3) book was 025kg of CO2-e per $1 loaned a reduction of 19 per cent(4) largely driven by the shift in portfolio mix from the increase in residential exposures resulting from the integration of ME Bank and improvements in the method to estimate residential lending emissions
Residential and commercial property makes up 86 per cent of our credit risk exposure and comprises 54 per cent of the carbon emissions from our lending portfolio as at August 2021
BOQ AND CLIMATE CHANGE (CONTINUED)
Credit Risk FY21 FY20
Sector $m of Total Exposure $m
of Total Exposure
Residential Mortgages 59053 785 31155 669
Property amp Construction 5627 75 5046 108
Healthcare 3017 40 3305 71
Professional Services 1453 19 1272 27
Agriculture 1232 16 1105 24
Transportation 843 11 750 16
Manufacturing amp Mining 779 10 788 17
Hospitality amp Accommodation 622 08 618 13
Other 2598 35 2522 54
Total (1) 75244 1000 46560 1000
Per Balance Sheet (2) 75748 47043
(1) Due to rounding numbers presented may not add up to the totals provided(2) This includes unearned income reallocated in Credit Risk and the balance of credit cards overdrafts and personal loans(3) Financed emissions calculations include estimates greenhouse gas emissions associated with residential mortgages commercial loans and asset financing(4) The FY20 carbon intensity of the loan book has been revised to 031 kg of CO2-e per $1 loaned
GOVERNANCE AND RISK MANAGEMENT
About BOQ 12 | Responding to COVID-19 14 | Acquisition of ME Bank 15 | Value Creation and Strategy 16
68 Bank of Queensland Limited and its Controlled Entities
Targets amp Metrics (continued) Operational Greenhouse Gas FootprintIn FY21 we have met our ambition to be carbon neutral across our operations By becoming a carbon neutral organisation we have achieved a balance between the greenhouse gas emissions associated with running our business and the emission reduction activities we support
We have looked to reduce emissions associated with fuel and electricity consumption and emissions in the BOQ supply chain including embodied emissions from data centres IT software and hardware office equipment furniture legal amp insurance and consultants supporting BOQ strategy and head office operations The reduction in greenhouse gas emissions between FY20 and FY21 has been largely driven by a combination of transient COVID-19 related savings (lowering consumption of electricity and reducing staff commuting) and lower indirect supply chain related emissions
BOQ will reduce operational emissions through our commitment to purchase 100 per cent of our operational electricity from renewable sources by 2025 exploration of low emissions fleet options and implementation of a Supplier Code of Conduct that allows for climate engagement While we work towards minimising our footprint BOQ supports accredited projects that reduce emissions and produce verified offsets More details of the offsets our use of offsets can be found in our FY21 Sustainability Report on page 20
Greenhouse gas emissions (tCO2-e) (1) FY21 FY20 Change
Scope 1 248 252 (2)
Scope 2 4521 5007 (10)
Scope 3 29702 36944 (20)
Total 34470 42203 (18)
Climate related targetsBOQ is committed to cease funding equipment directly involved in the extraction of fossil fuels by 2024 As at 31 August 2021 our exposure to this industry was $127 million representing 001 per cent of lending
In FY21 we have taken action by becoming a carbon neutral organisation and joining the Australia Government Climate Active certification programme The BOQ certification includes operations and supply chain contribution from BOQ Retail (including branches) Virgin Money Australia BOQ Business and BOQ Finance and BOQ Specialist ME Bank has a separate Climate Active certification The BOQ and ME Bank certifications will be integrated in 2022
We are well progressed with our commitment to source 100 per cent of our operational electricity from renewable sources by 2025 The Sustainability Working Group has endorsed the Renewable Energy Strategy and by the end of FY22 BOQ intends to operate its major Brisbane Sydney and Melbourne support centres on renewable electricity
BOQ AND CLIMATE CHANGE (CONTINUED)
(1) Emissions estimates are calculated in accordance with the GHG Protocol using the factors consistent with Climate Active carbon neutral program Emission estimates exclude ME Bank BOQ and ME Bank emission estimates will be integrated in 2022
Scope 1 includes direct emissions from transport fleet Scope 2 includes electricity purchased Scope 3 includes purchased goods and services capital goods fuel and energy-related emissions from fuel extraction waste generated in operations business travel employee commuting and working from home Due to rounding numbers presented may not add up to the totals provided
GOVERNANCE AND RISK MANAGEMENT
Financial Performance 20 | Governance and Risk Management 55 | Directorsrsquo Details 71
692021 Annual Report
OUR APPROACH TO CORPORATE GOVERNANCEBOQ continues to focus on enhancing our governance and risk management practices to meet the expectations of our stakeholders Further details on our Corporate Governance policies and practices are set out in our Corporate Governance Statement which has been prepared in accordance with the ASX Corporate Governance Councilrsquos Corporate Governance Principles amp Recommendations (4th edition) The FY21 Corporate Governance Statement can be viewed at boqcomau2021
Corporate governance frameworkBOQrsquos Board is responsible for setting the strategy and risk appetite of the Bank and for leading the culture and values for our people The Corporate Governance framework sets out how the Board delegates to Management and provides oversight and governance of key decisions
Board Reserved Powers and Delegation of Authority Policy
Chief Executive Officer
BOQ Board
Shareholders
Group Executive Committee
Investment Committee
Audit Committee
Nomination amp Governance Committee
Risk Committee
People Culture amp
Remuneration Committee
Transformation amp Technology Committee
(Previously known as Information Technology
Committee)
Leadership amp talentbull Focused on an uplift in leadership amp talent
to drive our successbull Oversight of programs to enhance
the calibre of the leadership team and our people including development and retention
6
1 Customer experience oversightbull Continue to improve the
customer experience and delight our customers every day
bull Focus on the customer voice in all Board decisions
2 Strategybull Ensuring a clear strategy is in place with
disciplined executionbull Successful ME Bank acquisition
strategically alignedbull Reimagining our long term vision and new
options for growth
3 Culturebull Cultural transformation underway with
purpose and values of empathy integrity and making a difference being embedded
bull Improving employee engagement empowerment and accountability
4 Building a Sustainable business bull Achieved carbon neutral certificationbull Key sustainability targets incorporated
in risk management framework
5 Digital transformationbull Commitment to a three-year technology
uplift program (supported by the November ndash December 2019 capital raise)
bull Focus on (1) the modernisation of infrastructure (2) moving to a cloud based digital banking platform and (3) automating processes
bull By FY23 we aim to have implemented c$90 million of productivity benefits
7 Business Performance Oversightbull Continuous improvement in our financial
performance growing EPS and ROEbull Delivering against our
transformation programbull Pathway to delivering a scalable operating
model lowering our cost to income ratio
8 Financial amp non-financial risk oversightbull Strengthening amp embedding our risk culturebull Management of the business within our
risk framework with optimal growthbull Regulatory compliance
9 Capital managementbull Prudent capital management to protect
deposit holders debt security holders and shareholder interests
bull ME Bank acquisition successfully funded via a $135 billion capital raising
10 Future-Fit Boardbull Board composition reviewed with Board
renewal program to be complete by the 2021 AGM
bull Board refresh focused on building a diverse and contemporary Board with the appropriate mix of skills high emotional intelligence and intellectual curiosity
bull Strong presence in the business with increased interactions with key stakeholders including our people regulators and investors
Board areas of focusDuring FY21 the Board and its Committees have focused on 10 key strategic governance and oversight activities
GOVERNANCE AND RISK MANAGEMENT
About BOQ 12 | Responding to COVID-19 14 | Acquisition of ME Bank 15 | Value Creation and Strategy 16
70 Bank of Queensland Limited and its Controlled Entities
For the year ended 31 August 2021
BOARD OF DIRECTORS
Patrick Allaway BA LLB
Independent non-executive director since May 2019 Chairman since October 2019 Chair Investment Committee and Nomination amp Governance Committee Member Transformation amp Technology People Culture amp Remuneration Audit and Risk Committees
John Lorimer B Com
Independent non-executive director since January 2016 Member Transformation amp Technology Risk People Culture amp Remuneration Audit and Nomination amp Governance Committees
George Frazis B Eng (Hons) MBA
Managing Director and Chief Executive Officer since September 2019
Independent non-executive director since September 2016 Chair People Culture amp Remuneration Committee Member Audit Risk Transformation amp Technology Investment and Nomination amp Governance Committees
Warwick Negus B Bus M Com SF Fin
Karen Penrose B Com CPA FAICD
Independent non-executive director since November 2015 Chair Audit Committee Member People Culture amp Remuneration Risk Transformation amp Technology Investment and Nomination amp Governance Committees
Bruce Carter B Econ MBA FAICD FICA
Independent non-executive director since February 2014 Chairman Risk Committee Member Audit Transformation amp Technology Investment People Culture amp Remuneration and Nomination amp Governance Committees
Mickie Rosen BA Economics MBA
Independent non-executive director since March 2021 Chair Transformation amp Technology Member Risk People Culture amp Remuneration Audit and Nomination amp Governance Committees
Independent non-executive director since August 2021 Member Transformation amp Technology Risk People Culture amp Remuneration Audit and Nomination amp Governance Committees
Deborah Kiers B Sc (Hons) MPA MAICD
DIRECTORSrsquo DETAILS
Financial Performance 20 | Governance and Risk Management 55 | Directorsrsquo Details 71
712021 Annual Report
For the year ended 31 August 2021
The Directors present their report together with the financial report of Bank of Queensland Limited (the Bank or BOQ) and of the Consolidated Entity (or the Group) being the Bank and its controlled entities for the year ended 31 August 2021 and the independent auditorrsquos report thereon
The Directors of the Bank at any time during or since the end of the financial year are
Name qualifications amp independence status Experience special responsibilities and other Directorships
Patrick AllawayBALLB
Chairman
Mr Allaway was appointed as a Non-Executive Director of the Bank in May 2019 and was appointed Chairman on 18 October 2019
Mr Allaway has extensive senior executive non-executive and corporate advisory experience across the financial services property media and retail sectors
Mr Allawayrsquos executive career was in financial services with Citibank and Swiss Bank Corporation (now UBS) working in Sydney New York Zurich and London Mr Allaway was Managing Director SBC Capital Markets amp Treasury with direct responsibility for a global business
Mr Allaway brings over 30 years of experience in financial services across financial markets capital markets and corporate advisory This included an advisory role in the media sector responding to considerable digital disruption
Mr Allaway has over 15 years Non-Executive Director experience and was formerly a Non-Executive Director of Macquarie Goodman Industrial Trust Metcash Limited Fairfax Media Woolworths South Africa David Jones Country Road Group and Nine Entertainment Co Mr Allaway chaired the Audit amp Risk Committees for Metcash David Jones and Country Road Group
Mr Allaway is currently a Non-Executive Director of Allianz Australia and Dexus Funds Management Limited and a member of the Adobe International Advisory Board He chairs BOQrsquos Investment and Nomination amp Governance Committees and is member of the People Culture amp Remuneration Transformation amp Technology Audit and Risk Committees
George FrazisB Eng (Hons) MBA
Managing Director amp Chief Executive Officer
Mr Frazis joined BOQ as Managing Director and CEO in September 2019 and has over 26 years of corporate experience
Mr Frazis has a long history in Banking and Finance having worked in the industry for the past 17 years Most recently he was Chief Executive of Westpac Grouprsquos Consumer Bank Prior to that Mr Frazis was CEO St George Banking Group and Chief Executive Westpac New Zealand Limited
Mr Frazis has held senior executive roles at National Australia Bank Commonwealth Bank of Australia as well as Air New Zealand He started his career as an officer in the Royal Australian Air Force
DIRECTORSrsquo DETAILS
About BOQ 12 | Responding to COVID-19 14 | Acquisition of ME Bank 15 | Value Creation and Strategy 16
72 Bank of Queensland Limited and its Controlled Entities
For the year ended 31 August 2021
Name qualifications amp independence status Experience special responsibilities and other Directorships
Bruce Carter B Econ MBA FAICD FICA
Non-Executive Independent Director
Mr Carter was appointed a Non-Executive Director of BOQ on 27 February 2014
Mr Carter was a founding Managing Partner of Ferrier Hodgson South Australia a corporate advisory and restructuring business and has worked across a number of industries and sectors in the public and private sectors He has been involved with a number of state government-appointed restructures and reviews including chairing a task force to oversee the governmentrsquos involvement in major resource and mining infrastructure projects Mr Carter had a central role in a number of key government economic papers including the Economic Statement on South Australian Prospects for Growth the Sustainable Budget Commission and the Prime Ministerrsquos 2012 GST Distribution Review
Mr Carter has worked with all the major financial institutions in Australia Before Ferrier Hodgson Mr Carter was at Ernst amp Young for 14 years including four years as Partner in Adelaide During his time at Ernst amp Young he worked across the London Hong Kong Toronto and New York offices Mr Carter is the Chair of the Australian Submarine Corporation Aventus Capital Limited and One Rail Australia Boards and a Non-Executive Director of Crown Resorts Limited AIG Australia Limited and Sage Group Holdings Limited
Mr Carter is Chair of the Risk Committee and a member of the Audit Transformation amp Technology Investment People Culture amp Remuneration and Nomination amp Governance Committees
Deborah KiersBSc (Hons) MPA MAICD
Non-Executive Independent Director
Ms Kiers was appointed as a Non-Executive Director of the Bank on 5 August 2021
Ms Kiers previously acted as a Director of ME Bank since July 2020 and acted as Chair of the ME Bank Boardrsquos People and Culture sub-committee and as a member of the Risk and Compliance Committee
Ms Kiers brings over 30 years of strategic advisory and consulting experience to boards and executive management teams across a wide range of industries including Financial Services Energy and Resources Industrials Property Infrastructure and Regulated Utilities both in Australia and internationally
As Managing Director of JMW Consultants (Asia Pacific) Ms Kiersrsquos support for companies included strategic advice business model transformations MampA integration leadership transition and development for CEOs executive teams and board directors as well as building synergies between culture performance and remuneration strategies
Ms Kiers is currently a Non-Executive Director for IFM Investors and holds the position of Chair of the IFM Board Responsible Investment and Sustainability Committee and is a member of the Board Audit and Risk Committee Ms Kiers is also a Non-Executive Director of the Tiverton Agriculture Impact Fund
Ms Kiers is a member of the Audit Risk Nomination amp Governance People Culture and Remuneration and Transformation amp Technology Committees
John LorimerB Com
Non-Executive Independent Director
Mr Lorimer was appointed a Non-Executive Director of BOQ on 29 January 2016
Mr Lorimer has spent more than 30 years in financial services and held executive roles in Australia Asia and Europe Mr Lorimerrsquos most recent executive roles were in the United Kingdom where he was Group Head of Finance and then Group Head of Regulatory Risk and Compliance for Standard Chartered Bank He also held a number of management positions in the retail bank of Citigroup and served as the Chairman of CAF Bank Limited (a subsidiary of Charities Aid Foundation based in the United Kingdom) In addition Mr Lorimer was a Non-Executive Director of Aberdeen New Dawn Investment Trust plc and International Personal Finance plc
Currently Mr Lorimer is a Non-Executive Director of Bupa Australia Pty Ltd and Bupa Aged Care Holdings Pty Ltd and is Chairman of Bupa (Asia) Ltd
Mr Lorimer a member of BOQrsquos Transformation amp Technology Risk People Culture amp Remuneration Audit and Nomination amp Governance Committees
DIRECTORSrsquo DETAILS
Financial Performance 20 | Governance and Risk Management 55 | Directorsrsquo Details 71
732021 Annual Report
For the year ended 31 August 2021
Name qualifications amp independence status Experience special responsibilities and other Directorships
Warwick NegusB Bus M Com SF Fin
Non-Executive Independent Director
Mr Negus was appointed a Non-Executive Director of BOQ on 22 September 2016
Mr Negus brings more than 30 years of finance industry experience in Asia Europe and Australia His most recent executive roles include Chief Executive Officer of 452 Capital Chief Executive Officer of Colonial First State Global Asset Management and Goldman Sachs Managing Director in Australia London and Singapore He was also a Vice President of Bankers Trust Australia and a Director of the University of NSW (UNSW) Foundation and FINSIA
Mr Negus is Chair of Pengana Capital Group and a Non-Executive Director of Washington H Soul Pattinson amp Co Ltd Dexus Funds Management Limited Virgin Australia Holdings Pty Ltd and Terrace Tower Group He is a member of the Council of UNSW and Chair of UNSW Global Limited
Mr Negus is Chair of the People Culture amp Remuneration Committee and a member of the Audit Risk Transformation amp Technology Investment and Nomination amp Governance Committees
Karen PenroseB Com CPA FAICD
Non-Executive Independent Director
Ms Penrose was appointed a Non-Executive Director of BOQ on 26 November 2015
Ms Penrose is an experienced non-executive director and banker As a banker Ms Penrose has 20 years of experience leading businesses within Commonwealth Bank of Australia and HSBC and over ten years in accounting and finance roles Ms Penrose has particular expertise in the financial services health property resources and energy sectors Ms Penrose is a Non-Executive Director of Vicinity Centres Limited Ramsay Health Care Limited Estia Health Limited and Rugby Australia Limited Ms Penrose was formerly a Non-Executive Director of AWE Limited Spark Infrastructure Group Landcom and Future Generation Global Investment Company Limited She is a member of Chief Executive Women
Ms Penrose is Chair of the Audit Committee and is a member of the People Culture amp Remuneration Risk Transformation amp Technology Investment and Nomination amp Governance Committees
Mickie RosenBA Economics MBA
Non-Executive Independent Director
Ms Rosen was appointed a Non-Executive Director of BOQ on 4 March 2021
Ms Rosen has three decades of strategy operating advisory and board experience across media technology and e-commerce She has built and led global businesses for iconic brands such as Yahoo Fox and Disney as well as early-stage companies including Hulu and Fandango
Ms Rosen is also a Non-Executive Director of Nine Entertainment Co and Ascendant Digital Acquisition Company in the United States Until recently Ms Rosen served on the board of Pandora Media and was the President of Tribune Interactive the digital arm of Tribune Publishing and was concurrently the President of the Los Angeles Times Ms Rosen commenced her career with McKinsey amp Company is based on the West Coast of the United States and holds an MBA from Harvard Business School
Ms Rosen currently chairs the Transformation amp Technology Committee and is a member of the Risk People Culture amp Remuneration Audit and Nomination amp Governance Committees
DIRECTORSrsquo DETAILS
About BOQ 12 | Responding to COVID-19 14 | Acquisition of ME Bank 15 | Value Creation and Strategy 16
74 Bank of Queensland Limited and its Controlled Entities
For the year ended 31 August 2021
Company Secretaries
Fiona DalyLLB LLM AGIA ACG MAICD
Ms Daly joined BOQ in October 2018 and was appointed joint company secretary on 30 April 2019 Ms Daly commenced her career as a corporate lawyer at Phillips Fox (now DLA Piper) before joining Allens Prior to working for BOQ Ms Daly held senior legal and regulatory roles including as senior legal counsel global regulatory affairs manager and joint company secretary at Energy Developments an international energy company
Nicholas AlltonLLB LLM GAICD
Mr Allton joined BOQ as Group General Counsel and Company Secretary on 1 February 2021 Nicholas has more than 27 yearsrsquo experience across Financial Services including 11 years in private practice for top-tier Australian English and US firms Prior to joining BOQ Nicholas held the role of Group General Counsel and Company Secretary at MLC and spent 15 years working across a number of senior roles within the Macquarie Group
Directorsrsquo MeetingsThe number of meetings of the Bankrsquos Directors (including meetings of Committees of Directors) and the number of meetings attended by each Director during the financial year were
Board of Directors
Board of Directors - St Andrews
Risk Committee
Audit Committee
Nomination amp Governance Committee
People Culture amp
Remuneration Committee - BOQ amp St
Andrews
Transformation amp Technology Committee (1)
Investment Committee
Due Diligence
Committee
Tenure as at 31 August
2021
Patrick Allaway 2121 66 88 22 66 55 22 1414 2 years
4 months
George Frazis 2121 2 years
Bruce Carter 2021 66 88 22 66 55 22 1314 7 years
6 months
Deborah Kiers (2) 11 00 11 00 00 11 1 month
John Lorimer 2121 66 88 22 66 55 5 years
7 months
Warwick Negus 2021 66 88 22 66 55 22 1414 4 years 11
months
Karen Penrose 2121 99 66 88 22 66 55 22 1414 5 years 9
months
Mickie Rosen (3) 66 33 44 11 22 33 6 months
Kathleen Bailey-Lord (4)
2020 66 77 22 66 44 2 years 3 months
Michelle Tredenick (5) 66 23 34 11 44 22 9 years 9
months
(1) Information Technology Committee changed its name to Transformation amp Technology Committee effective 26 November 2020(2) Deborah Kiers appointed as a Director on 5 August 2021(3) Mickie Rosen appointed as a Director on 4 March 2021(4) Kathleen Bailey-Lord ceased as a Director on 5 August 2021(5) Michelle Tredenick ceased as a Director on 8 December 2020
DIRECTORSrsquo DETAILS
Financial Performance 20 | Governance and Risk Management 55 | Directorsrsquo Details 71
752021 Annual Report
CONTENTS
78 Section 1 Remuneration Snapshot
80 Section 2 Key Management Personnel (KMP)
81 Section 3 Remuneration Outcomes
88 Section 4 Remuneration Strategy and Structure
90 Section 5 Remuneration Governance
94 Section 6 Non-Executive Director (NED) Remuneration
95 Section 7 Statutory Tables
Dear Shareholder
IntroductionAt BOQ our ambition is to be known as the bold challenger bank with multi-brands that are digitally enabled with a personal touch Achieving this ambition is dependent on the successful delivery of our strategy which is dependent on our people culture and remuneration settings
On behalf of the Board I am delighted to present the Remuneration Report for the period 1 September 2020 to 31 August 2021 (FY21) and share with you our progress and achievements against our people amp culture and organisational strategies
FY21 performance FY21 performance was compelling led by strong financial returns quality above system growth in mortgages good margin management and execution of strategic projects such as the launch of the Virgin Money digital bank These results were achieved whilst also successfully acquiring ME Bank raising capital and undertaking a 90 day sprint to accelerate the integration program for the two organisations
FY21 remuneration changes In last yearrsquos Report we shared a summary of our new Senior Executive Remuneration Framework (the Framework) which took effect on 1 September 2020 The introduction of the Framework which includes fixed reward (FR) and a total variable reward opportunity comprising Performance Shares and Premium Priced Options is focused on alignment with shareholders balanced measures of performance and long term deferral As part of the transition to the new Framework Senior Executives no longer have any cash incentives Instead 100 per cent of their variable at-risk reward which is a fixed percentage of FR is awarded in equity and deferred over multiple years This significantly increases the alignment between the interests of Senior Executives and shareholders
After the 2020 Annual General Meeting (AGM) Senior Executives were awarded grants of Performance Shares and Premium Priced Options
Performance Shares differ from traditional short-term incentives that typically involve a combination of cash and shares and where the outcome varies within a range often dictated by complicated formulae Performance Shares are granted as Rights with each Senior Executive being awarded a fixed percentage of their FR at the beginning of the financial year The Rights convert to Restricted Shares at the completion of the financial year based on an assessment undertaken by the Board Upside is determined by the continued performance of the business throughout the financial year and by share price growth in future years until vesting
Whilst in most years it is expected that management will achieve a conversion of Rights into Restricted Shares the outcome can be varied up or down should exceptional or threshold performance both financial and non-financial dictate
Premium Priced Options have a single performance hurdle - an exercise price that is 120 per cent of the share price after the AGM in December This aligns the interests of Senior Executives with those of Shareholders as participants derive zero value unless the share price at vesting (four and five years from grant) exceeds the exercise price The BOQ share price is determined by financial performance effective risk management and other non-financial factors (including reputation customer growth and future outlook)
FY21 remuneration outcomes Fixed reward for Senior Executives is set based on a combination of the executiversquos experience and capability competitiveness relative to the financial services sector and similarly sized ASX listed companies and internal relativities Ewen Stafford our Chief Financial Officer and Chief Operating Officer was our only Senior Executive to receive a fixed reward increase during FY21
Remuneration outcomes for FY21 reflect a range of relevant factors
bull the Grouprsquos performance in relation to the five strategic priorities in the Group Scorecard and achievement of the Board-approved financial and non-financial measures
bull Senior Executive contribution to the Group Scorecard performance and progress toward the achievement of our strategic priorities
bull explicit consideration of risk events behaviours and outcomes based on input from the Chief Risk Officer and Board Risk Committee
bull the additional demands and expectations of MampA activity alongside the challenges of an ongoing pandemic and
bull the experience of our shareholders during the year in terms of share price and dividends
The Board assessed performance against the Group Scorecard as Exceeds This outcome combined with separate consideration of risk resulted in the 100 per cent conversion of Performance Shares awarded at the start of FY21 to Restricted Shares for all continuing Senior Executives
The Board has considered the feedback provided regarding transparency in relation to the Group Scorecard and greater disclosure of the FY21 Group Scorecard is provided in this Report
For the year ended 31 August 2021REMUNERATION REPORT
Remuneration Snapshot 78 | Key Management Personnel 80 | Remuneration Outcomes 81 | Remuneration Strategy amp Structure 88
76 Bank of Queensland Limited and its Controlled Entities
The performance hurdles for the FY17 long-term incentive (LTI) grant of Performance Award Rights (PARs) were tested in December 2020 Results for both measures relative Total Shareholder Return (rTSR) and relative Earnings per Share (rEPS) were below the minimum performance threshold As a result the FY17 grant of PARs lapsed in full Whilst PARs are no longer offered by the Group awards from FY18 and FY19 remain on-foot to be tested in FY23 and FY24 respectively
To encourage alignment between employees and shareholders and to promote ownership across the employee population BOQ offered a tax-exempt employee gift share plan which we refer to as ThankQ Shares for the first time during FY21 The ThankQ Share Plan was offered to eligible employees who would generally not participate in other forms of equity-based remuneration and saw approximately 1600 employees receive $1000 in BOQ shares At BOQ we have a focus on encouraging employee equity ownership and permanent employees are given the opportunity to become shareholders either through equity-based remuneration or employee share plans
FY22 remunerationAfter two years in the role the fixed reward of our Managing Director amp Chief Executive Officer was benchmarked and increased from $13 million to $15 million effective from 1 September 2021 Two other Senior Executives also received increases in their fixed reward from 1 September 2021 - the Chief Information Officer and Group Executive People amp Culture
The FY22 Group Scorecard continues to focus our Senior Executives on achieving the Grouprsquos strategy and fulfilling our ambition The collective performance of Senior Executives and the conversion of Performance Shares granted in FY22 will be assessed against this
Non-executive Director (NED) fees were increased effective 1 September 2021 this represents the first increase to NED fees since FY14 A reduction to the number of NEDs (from 10 at the beginning of FY20 to 7 effective from the 2021 AGM) ensures that the total fees payable for FY22 will remain within the shareholder approved fee pool of $28 million
ME Bank acquisitionThe acquisition of ME Bank on 1 July 2021 saw the Group welcome around 1200 new team members and expanded our employee ranks to around 3500 Part of the appeal of ME Bank as an investment for the Group was its cultural alignment and we are strengthened by the addition of so many dedicated and customer-centric team members
Our people are responsible for the success to date having delivered consistently through all stages of the MampA process to completion on 1 July 2021 and we are now progressing well on integration Looking ahead the program of work required for successful integration will primarily be completed within 18 months with the balance of the integration activities to be incorporated into the Grouprsquos broader Transformation program at that time
As part of the capital raising for the ME Bank acquisition employee shareholders were offered participation consistent with all other retail shareholders Many employees took up that offer The equity incentive plan rules confer on the Board the power to extend eligibility to participate in an entitlement offer to employees Senior Executives and NEDs who hold Rights to BOQ shares After consideration despite the possible dilution impact on our employee rights holders the Board determined not to extend this eligibility The Board also determined that although the ASX Listing Rules allow us to do so the exercise price on the Premium Priced Options would not be reduced
People amp culture strategyFollowing the FY20 launch of a cultural change program designed to ensure that we have the right organisational conditions to support the delivery of the Group strategy we launched the Achievement Approach in FY21 The Achievement Approach brings together career planning development and performance By focusing on achievement we empower our people to pursue personal and professional success which in turn contributes to our success as a Group
Highlights observed during the FY21 roll-out of the Achievement Approach include a meaningful improvement to the number of our people with documented performance goals in place at the beginning of the performance period (meaning our people commenced FY21 with clarity of priorities and expectations) showcasing the diverse career paths of a broad group of BOQ employees and the roll-out of two signature capability programs Coaching for Achievement and Wellbeing and In the Moment Feedback
Two Pulse surveys were conducted in FY21 and we were pleased to see improvements to employee sentiment in the areas of engagement and culture Further detail is provided in section 34 (Group Scorecard)
As part of our commitment to our customers employees shareholders and community each of our employees was offered two half days of paid leave for the purposes of obtaining full COVID-19 vaccination
Key management personnel changesLyn McGrath former Group Executive Retail Banking retired on 31 January 2021 In April 2021 we welcomed Martine Jager to the role of Group Executive Retail Banking On 30 September 2021 Fiamma Morton ceased as Group Executive Business Banking and Chris Screen was appointed to the role effective 1 October 2021 Adam McAnalen will transition to a new role in the Group when David Watts commences as Group Chief Risk Officer in early 2022
We are confident that our strength at both Senior Executive and Board levels will enable our continued success
ConclusionThe Board remains committed to ensuring that the Grouprsquos people culture and remuneration frameworks and practices further the interests of all stakeholders including customers shareholders regulators and employees This extends to having adequate flexibility to anticipate and respond to labour market trends as we navigate a new normal through COVID-19 recovery It is the Boardrsquos view that the remuneration outcomes for FY21 are appropriate in light of our consistent and positive progress against our five strategic priorities and the environment in which we operate
I welcome any feedback on the remuneration report and look forward to engaging with you again
Warwick Negus Chair People Culture amp Remuneration Committee
For the year ended 31 August 2021REMUNERATION REPORT
Remuneration Governance 90 | Non-Executive Director Remuneration 94 | Statutory Tables 95
772021 Annual Report
Our empathetic culture sets us apart
Distinctive brands serving attractive niche customer segments
Digital Bank of the future with a personal touch
Simple and intuitive business with strong execution capability
Strong financial and risk position with attractive returns
STRATEGIC PRIORITIES
SECTION 1 REMUNERATION SNAPSHOT
Reward sustainable profitable growth as BOQ executes its strategy
Reward our people for delivering exceptional customer experiences
Align our people to long term value creation for our shareholders
Provide exceptional employee experiences including performance and reward to attract and retain a
diversity of high-quality talent
Take into account prudent risk management in accordance with
BOQrsquos risk appetite
Ensure remuneration structures are consistent with our purpose-led culture
clear accountability frameworks and robust risk management framework
REMUNERATION OBJECTIVES
Empathy Integrity Making a difference
OUR PURPOSE AND VALUESCreating prosperity for our customers shareholders and people through
AMBITIONWe will be known as the bold challenger bank with multi-brands that are
digitally enabled with a personal touch
For the year ended 31 August 2021REMUNERATION REPORT
Remuneration Snapshot 78 | Key Management Personnel 80 | Remuneration Outcomes 81 | Remuneration Strategy amp Structure 88
78 Bank of Queensland Limited and its Controlled Entities
SENIOR EXECUTIVE REMUNERATION FRAMEWORK SUMMARYThe Framework is anchored in the remuneration objectives and designed to support the Grouprsquos ambition by facilitating the successful achievement of the strategic priorities in line with our purpose and values
Fixed reward Performance Shares Premium Priced Options
Purpose To attract and retain talent and reflect the individualrsquos skills capabilities and experience
To focus Senior Executives on delivering against the Grouprsquos strategy collaboratively and as a team
To align Senior Executivesrsquo interests with the interests of shareholders to achieve improved outcomes for all stakeholders and grow shareholder value
Delivery Cash Rights that convert to Restricted Shares
Options with a premium exercise price (120 of share price at grant)
Proportion of fixed reward
NA MD amp CEO 88
Other Senior Executives 78
MD amp CEO 58
Other Senior Executives 52
Performance criteria
Satisfactory performance compliance with the terms and conditions of employment including the Code Of Conduct and fulfilment of accountabilities under the Banking Executive Accountability Regime (BEAR)
Performance against the Group Scorecard over the one year performance period (the FY) modified by the Boardrsquos overall assessment of risk performance and behaviours determines the conversion from Rights to Restricted Shares
BOQrsquos share price must exceed the exercise price set for the award and a risk assessment conducted by the Board
Risk NA Risk assessment prior to vesting
Unvested awards are subject to malus
A clawback period of two years applies to each tranche after vesting
Risk assessment prior to vesting
Unvested awards are subject to malus
MD amp CEO Each tranche is subject to dealing restrictions for two years after vesting
Other Senior Executives Each tranche is subject to the dealing restrictions for one year after vesting
For all participants a clawback period of two years applies to each tranche after vesting
Vesting profile NA 33 in December 2022 33 in December 2023 and 34 in December 2024 (ie after two three and four years)
50 in December 2024 and 50 in December 2025 (ie after four and five years)
For the year ended 31 August 2021REMUNERATION REPORT
Remuneration Governance 90 | Non-Executive Director Remuneration 94 | Statutory Tables 95
792021 Annual Report
SECTION 2 KEY MANAGEMENT PERSONNELThis section identifies Directors and Senior Executives who are KMP and sets out the changes that have occurred within this cohort during FY21 and up until the date of this Report
TABLE 1 - EXECUTIVE amp NON-EXECUTIVE DIRECTORS
Current Directors
Patrick Allaway Chair (Non-executive)
Bruce Carter Non-executive Director
George Frazis Managing Director amp Chief Executive Officer
Deborah Kiers Non-executive Director (from 5 August 2021)
John Lorimer Non-executive Director
Warwick Negus Non-executive Director
Karen Penrose Non-executive Director
Mickie Rosen Non-executive Director (from 4 March 2021)
Former Directors
Kathleen Bailey-Lord Non-executive Director (ceased 5 August 2021)
Michelle Tredenick Non-executive Director (ceased 8 December 2020)
TABLE 2 - OTHER SENIOR EXECUTIVES
Current Senior Executives
Debra Eckersley Group Executive People and Culture
Martine Jager Group Executive Retail Banking (from 27 April 2021)
Adam McAnalen Chief Risk Officer
Fiamma Morton Group Executive Business Banking
Craig Ryman Chief Information Officer
Ewen Stafford Chief Financial Officer and Chief Operating Officer
Former Senior Executives
Lyn McGrath Group Executive Retail Banking (ceased 31 January 2021)
The following changes are effective during FY22
1 Fiamma Morton ceased as Group Executive Business Banking on 30 September 2021
2 Chris Screen was appointed Group Executive Business Banking on 1 October 2021
3 Adam McAnalen will transition to a new role in the Group when David Watts commences as Group Chief Risk Officer in early 2022
For the year ended 31 August 2021REMUNERATION REPORT
Remuneration Summary 78 | Key Management Personnel 80 | Remuneration Outcomes 81 | Remuneration Strategy amp Structure 88
80 Bank of Queensland Limited and its Controlled Entities
SECTION 3 REMUNERATION OUTCOMES This section details remuneration outcomes for Senior Executives during the FY21 year
31 REMUNERATION MIXFigure 1 illustrates the mix of Fixed Reward Performance Shares and Premium Priced Options awarded to Senior Executives in FY21
32 FIXED REWARDEwen Stafford the Chief Financial Officer amp Chief Operating Officer was awarded a fixed reward increase during FY21 The increase of 14 per cent took effect 1 June 2021 and took into account Mr Staffordrsquos contribution to Group his capability and market-competitive fixed reward levels for comparable roles in the financial services sector and similarly sized ASX listed companies
Fixed remuneration at 1 September 2020 informed the face value of annual awards of Performance Shares and Premium Priced Options
George Frazis the MD amp CEO Debra Eckersley Group Executive People amp Culture and Craig Ryman Chief Information Officer were awarded fixed reward increases for FY22 effective 1 September 2021 The average increase awarded for FY22 was 12 per cent
33 LINKING PERFORMANCE amp REWARD OUTCOMESThe Grouprsquos financial performance is summarised in Table 3 together with its relationship to the aggregate value of Performance Shares granted and converted or for one former Senior Executive STI awarded in relation to FY21 and for prior years the amount of STI paid
TABLE 3 - GROUP PERFORMANCE
5 Year Company Performance FY21 (1) FY20 FY19 FY18 FY17
Statutory net profit(loss) after tax ($m) 369 115 298 336 352
Cash net profit after tax (2) ($m) 412 225 320 372 378
Cash basic earnings per share (2)(3) (cents) 747 496 795 947 976
Cash cost to income ratio (2) () 544 549 510 475 466
Share price at balance sheet date ($) 946 613 917 1149 1259
Total shareholder return () 6375 (298) (139) (27) 265
Value of dividends paid ($m) 164 126 288 341 308
Senior Executive Performance Shares converted STI awarded (4) ($m) 379 178 - 273 402
(1) All results are inclusive of ME Bank(2) Non-statutory measures are not subject to audit(3) The basic and diluted earnings per share for all prior periods have been adjusted per ASX announcement on 20 April 2021(4) Performance Shares are converted based on the Boardrsquos assessment of the Group Scorecard and other considerations
Managing Director amp CEO 406 356 238
Senior Executives 435 339 226
Fixed Reward Performance Shares
Figure 1 - Remuneration Mix (at Target level)
Premium Priced Options
For the year ended 31 August 2021REMUNERATION REPORT
Remuneration Governance 90 | Non-Executive Director Remuneration 94 | Statutory Tables 95
812021 Annual Report
33 LINKING PERFORMANCE amp REWARD OUTCOMESFigure 2 compares the total Performance Shares converted based on FY21 Group Scorecard results and STI awarded for one former Senior Executive and STI awarded to Senior Executives from FY17 to FY20 with BOQrsquos Cash NPAT over the past 5 years
Figure 2 FY21 Performance Shares converted STI awarded vs 5 year NPAT
(1) FY21 includes pro-rated STI award for Lyn McGrath former Group Executive Retail Banking All current executives participated in Performance Shares
34 GROUP SCORECARDAt the commencement of FY21 the Group Scorecard was approved by the Board The Group Scorecard is based on the priorities that underpin the five-year strategy announced by the MD amp CEO in 2020
The Group Scorecard articulates the areas of focus that support the achievement of the strategy and sets the tone for how achievement is measured throughout the performance period for Senior Executives and all other employees of the Group It connects the Grouprsquos vision with tangible outcomes that contain an appropriate degree of stretch
The Boardrsquos assessment of achievement against the Group Scorecard together with holistic consideration of risk performance or any other matters considered relevant by the Board determine the conversion of Performance Shares
For FY21 the overall outcome against the Group Scorecard is Exceeds This is based on achievement of the targets against each measure modified by the Boardrsquos separate and explicit consideration of risk and any other relevant considerations
Figure 3 details the FY21 Group Scorecard including strategic priorities and weightings set by the Board together with FY21 outcomes
Figure 3 Assessment of FY21 Group Scorecard
Strategic Priority Weighting FY21 assessment
Our empathetic culture sets us apartDelighting our Customers - Net Promoter Score
bull Consumer NPS ranked 3rd
bull Business Bank SME NPS ranked 3rd
Engagement culture and leadership compared to prior year
bull Engagement score increased by 5 points
bull Culture score increased by 10 points
bull I feel safe to speak up score increased by 13 points
bull Senior Women in Leadership improved by 4 points
bull Overall Women in Leadership regressed by 1 point
10
Distinctive brands serving attractive niche customer segmentsDemonstrated by above-system growth in mortgages and business lending
bull Mortgage growth of 17x system
bull Business lending growth of 08x system
10
$m$m
Cash NPAT
Performance Shares converted STI awarded
FY20 FY21 (1)FY19FY18FY17
350
400
300
250
200
150
100
50
0
30
45
25
40
20
35
15
10
05
00
Achieving
Achieving
For the year ended 31 August 2021REMUNERATION REPORT
Remuneration Snapshot 81 | Key Management Personnel 80 | Remuneration Outcomes 81 | Remuneration Strategy amp Structure 88
82 Bank of Queensland Limited and its Controlled Entities
Strategic Priority Weighting FY21 assessment
Digital bank of the future with a personal touchDelivery of Virgin Money Australia and BOQ Retail digital banks
bull Virgin Money Australia Phase 1 completed and launched and Phase 2 now in build and delivery
bull Strong progress on BOQ Retail Phase 1
bull Phases 1 and 2 of a new Card Management System delivered
10
Simple and intuitive business with strong execution capabilityProductivity benefits containing expense growth
bull $30m productivity benefits
bull Expense growth of 3
bull JAWS 2
Product simplification and improved efficiency and customer experience
bull 15 of products were closed for sale during FY21 with a 26 reduction to the product register
bull During August we reached time to conditional yes of 1 day for Proprietary and 3 days for our Broker channel even as volume growth occurred (1)
Project delivery and execution
bull 20+ strategic projects delivered with strong benefits realisation
10
Strong risk positionStrengthen the bank through CET1 ratio and deposit growth
bull CET1 ratio 98
bull Deposit to Loan Ratio 75
Strong risk and compliance outcomes
bull Delivery of key regulatory compliance projects including AML and prudential reporting
bull A strengthened AMLCTF program
bull Embedding the 3 lines of defence model
10
Strong financial position with attractive returnsProfitable and sustainable growth in Cash Earnings and Earnings per Share strong return on equity and organic capital growth
bull Cash earnings $389m (excluding ME Bank) 73 growth
bull Earnings per Share 747c up 51 (including ME Bank)
bull Return on Equity 82 up 280bps (including ME Bank)
bull Organic Capital Generation 93bps (including ME Bank)
50
Overall including consideration of risk
(1) Time to conditional yes varies during the year based on volumes and customer mix
34 GROUP SCORECARD (CONTINUED)
Achieving
Exceeds
Exceeds
Exceeds
Exceeds
1 532 4
Underachieving Threshold Achieving Exceeds Exceptional
Rating scale
For the year ended 31 August 2021REMUNERATION REPORT
Remuneration Governance 90 | Non-Executive Director Remuneration 94 | Statutory Tables 95
832021 Annual Report
35 GRANT AND CONVERSION OF PERFORMANCE SHARESPerformance Shares were granted to Senior Executives in FY21 Performance Shares are intended to drive collaboration and encourage Senior Executives to achieve strong business outcomes as a team The Board undertakes a holistic assessment of performance against the Group Scorecard and other factors including a risk assessment to determine the proportion of Performance Shares that convert on completion of the performance period Whilst in most years it is expected that management will achieve a conversion of awarded Rights into Restricted Shares the outcome can be varied up or down at the Boardrsquos discretion should exceptional or threshold performance both financial and non-financial dictate
The face value of the MD amp CEOrsquos allocation was 88 per cent of fixed reward for other Senior Executives the face value of their allocation was 78 per cent of fixed reward Annual grants were made on 6 January 2021 Martine Jagerrsquos award was granted on 9 June 2021
The MD amp CEOrsquos grant of Performance Shares was approved by shareholders at the 2020 AGM
The number of Performance Shares allocated as part of the annual grant was determined using the face value of the award divided by the Volume Weighted Average Price (VWAP) of BOQ shares over the five trading days immediately following the 2020 AGM Intra-year awards for Senior Executives who join part way through the performance period are based on the VWAP over the five trading days immediately preceding their date of commencement with BOQ
Based on the Boardrsquos assessment of the Group Scorecard and consideration of risk for all continuing Senior Executives 100 per cent of Performance Shares granted in FY21 converted on completion of the one year performance period (1 September 2020 to 31 August 2021) Post-conversion the Restricted Shares will vest over three years subject to service conditions a pre-vesting assessment by the Board and all other original terms including malus
Performance Shares that converted to Restricted Shares will vest in three tranches 33 per cent in December 2022 33 per cent in December 2023 and 34 per cent in December 2024 subject to the Boardrsquos assessment of risk prior to each vesting date Each tranche is subject to a clawback period of two years from the vesting date
Table 4 details the grants and conversion of FY21 Performance Shares
TABLE 4 - PERFORMANCE SHARES GRANTED AND CONVERTED
Name Position Title
Fixed reward at time of
grant
Performance Shares as
of FR
Face value of Performance Shares award VWAP
Performance Shares
granted
of Performance
Shares converted
Performance Shares lapsed
George Frazis
Managing Director amp Chief Executive Officer
$1300000 88 $1140000 $77781 146566 100 -
Debra Eckersley
Group Executive People amp Culture $560000 78 $436800 $77781 56158 100 -
Martine Jager (1) Group Executive Retail Banking $685000 78 $185907 $90718 20493 100 -
Adam McAnalen Chief Risk Officer $675000 78 $526500 $77781 67691 100 -
Fiamma Morton (2)
Group Executive Business Banking $700000 78 $546000 $77781 70198 65 24568
Craig Ryman
Chief Information Officer $700000 78 $546000 $77781 70198 100 -
Ewen Stafford
Chief Financial Officer amp Chief Operating Officer
$700000 78 $546000 $77781 70198 100 -
(1) Martine Jager commenced as a KMP on 27 April 2021 therefore her award for FY21 has been pro-rated(2) The portion of Performance Shares that converted for Fiamma Morton will remain on foot to vest in accordance with the original terms of the Award
For the year ended 31 August 2021REMUNERATION REPORT
Remuneration Snapshot 81 | Key Management Personnel 80 | Remuneration Outcomes 81 | Remuneration Strategy amp Structure 88
84 Bank of Queensland Limited and its Controlled Entities
36 LTI VESTED DURING FY21PARs granted in 2017 were tested in December 2020 consistent with plan terms This grant was subject to two performance hurdles being rTSR (with an 80 per cent weighting) and rEPS (with a 20 per cent weighting) None of the PARs granted in 2017 vested in FY21
The statutory tables in Section 7 set out the detail of LTI awards forfeited by individual qualifying Senior Executives The results of the testing are presented in Table 5 below
TABLE 5 - LTI VESTING OUTCOMES - FY17 GRANT
Grant Date Performance Period Vesting Hurdle Performance Outcome
13122017 12 October 2017 to 13 October 2020
TSR ranking of at least 50th percentile BOQ TSR achieved ranking of 19th percentile resulting in 0 of the TSR tranche vesting
Relative EPS ranking of at least 60th percentile BOQ EPS achieved a ranking of 45th percentile resulting in 0 of the EPS tranche vesting
Figure 4 Percentage of LTI vesting of the last five years
37 PREMIUM PRICED OPTIONS GRANTEDPremium Priced Options were granted to Senior Executives in FY21 As approved by shareholders at the 2020 AGM the face value of the MD amp CEOrsquos allocation was 58 per cent of fixed reward For other Senior Executives the face value of their allocation was 52 per cent of fixed reward Annual grants were made on 6 January 2021 Martine Jagerrsquos award was granted on 9 June 2021
To determine the number of Premium Priced Options each Senior Executive was allocated the face value of their award was divided by the option value as determined by the Board For the annual grant the Board determined that the value of a Premium Priced Option was six per cent of the VWAP over the five trading days immediately following the 2020 AGM The Exercise Price was set at 120 per cent of the same VWAP
Intra-year awards for Senior Executives who join part way through the performance period were determined using the same methodology to derive a value that is based on the VWAP of BOQ shares over the five trading days immediately preceding their date of commencement with BOQ This approach is adopted so that the Exercise Price for intra-year awards remains consistent with the Exercise Price for annual grants
For Ms Jagerrsquos award the value of an option was nine per cent of the VWAP over the five trading days immediately preceding her commencement
70
60
50
40
30
20
10
0
FY17 FY18 FY19 FY20 FY21
65
55
16
0 0
BOQ no longer offers PARs
For the year ended 31 August 2021REMUNERATION REPORT
Remuneration Governance 90 | Non-Executive Director Remuneration 94 | Statutory Tables 95
852021 Annual Report
37 PREMIUM PRICED OPTIONS GRANTED (CONTINUED)Table 6 details the Premium Priced Options awarded to participants in FY21
TABLE 6 - PREMIUM PRICED OPTIONS GRANTED
Name Position Title
Fixed reward at time of
grantOptions of fixed reward
Options grant at Face Value VWAP
Options value
FY21 Options granted
Exercise price
George Frazis
Managing Director amp Chief Executive Officer
$1300000 58 $760000 $77781 $04667 1628456 $93337
Debra Eckersley
Group Executive People amp Culture $560000 52 $291200 $77781 $04667 623956 $93337
Martine Jager (1) Group Executive Retail Banking $685000 52 $123938 $90718 $08165 151792 $93337
Adam McAnalen Chief Risk Officer $675000 52 $351000 $77781 $04667 752090 $93337
Fiamma Morton (2) Group Executive Business Banking $700000 52 $364000 $77781 $04667 779945 $93337
Craig Ryman
Chief Information Officer $700000 52 $364000 $77781 $04667 779945 $93337
Ewen Stafford
Chief Financial Officer amp Chief Operating Officer
$700000 52 $364000 $77781 $04667 779945 $93337
(1) Martine Jager commenced as a KMP on 27 April 2021 therefore her award for FY21 has been pro-rated(2) Fiamma Mortonrsquos Premium Priced Options will be pro-rated to her cessation date with the pro-rated portion to remain on foot to vest in accordance with the original terms
of the Award
Participants derive value from Premium Priced Options only if the Exercise Price is exceeded at the relevant vesting date Premium Priced Options vest four and five years after grant
38 SENIOR EXECUTIVE TOTAL REWARD OUTCOMES FOR FY21 (NON-STATUTORY DISCLOSURE)This section provides a summary of the total benefit earned by Senior Executives with respect to performance over FY21 As in previous years this non-statutory table shows the Senior Executivesrsquo actual remuneration in respect of FY21
Table 7 includes a breakdown of the following components of Senior Executive remuneration
bull FY21 fixed reward (including base salary and employer superannuation contributions)bull the value of non-monetary and other short-term benefits provided in FY21 andbull the value of any variable remuneration which vested lapsed or was forfeited during FY21
For the year ended 31 August 2021REMUNERATION REPORT
Remuneration Snapshot 81 | Key Management Personnel 80 | Remuneration Outcomes 81 | Remuneration Strategy amp Structure 88
86 Bank of Queensland Limited and its Controlled Entities
38
SENI
OR E
XECU
TIVE
TOT
AL R
EWAR
D OU
TCOM
ES F
OR F
Y21 (
NON-
STAT
UTOR
Y DI
SCLO
SURE
)(CON
TINU
ED)
TAB
LE 7
- N
ON
-STA
TUTO
RY D
ISC
LOSU
RE
Cur
rent
Posi
tion
Tit
leYe
arFi
xed
Rem
uner
atio
n (1)
STI c
ash (2
)Va
lue
of
Ben
efit
s (3)
Valu
e of
D
efer
red
Equi
ty
Vest
ed in
Pe
riod (4
)Te
rmin
atio
n B
enef
its
Valu
e of
LTI
Ve
sted
in
Perio
d (5)
Tota
l Rew
ard
Valu
e (6)
Prio
r Yea
rsrsquo
Equi
ty
Forf
eite
d
Laps
ed (7
)
Geo
rge
Fraz
isM
anag
ing
Dire
ctor
amp
Chi
ef E
xecu
tive
Off
icer
2021
129
521
2 -
1116
83
-
--
140
689
5 -
2020
128
07
89
- 5
928
9 -
-
- 1
340
078
-
Deb
ra E
cker
sley
Gro
up E
xecu
tive
Peo
ple
amp C
ultu
re20
21 5
580
47
- -
-
-
- 5
580
47
-
2020
541
914
-
-
-
--
541
914
-
Mar
tine
Jag
er (8
)G
roup
Exe
cuti
ve R
etai
l Ban
king
2021
237
141
-2
971
-
--
240
112
-
Ada
m M
cAna
len
Chi
ef R
isk
Off
icer
2021
672
60
6 -
65
27
22
823
--
70
195
6 (6
794
3)
2020
640
639
-
60
40
276
62
--
674
341
(8
323
5)
Fiam
ma
Mor
ton
Gro
up E
xecu
tive
Bus
ines
s B
anki
ng20
21 6
975
11
- 15
840
-
-
- 7
133
51
-
2020
169
551
- 2
237
-
--
1717
88
-
Cra
ig R
yman
Chi
ef In
form
atio
n O
ffic
er20
21 6
975
11
- 15
840
-
-
- 7
133
51
-
2020
911
87
- 2
08
3 -
--
93
270
-
Ewen
Sta
ffor
dC
hief
Fin
anci
al O
ffic
er
amp C
hief
Ope
rati
ng O
ffic
er20
21 7
216
49
- 4
70
04
-
--
768
653
-
2020
564
762
-
32
119
--
- 5
968
81
-
Form
er-
--
-
Lyn
McG
rath
(9)
Gro
up E
xecu
tive
Ret
ail B
anki
ng20
21 3
2614
9 50
00
0 8
729
3
18
35
--
416
713
(965
573
)
2020
627
70
7 -
20
823
7
458
3 -
- 7
2311
3 -
(1)
Bas
e sa
lary
and
sup
eran
nuat
ion
mak
e up
a S
enio
r Exe
cuti
versquos
fix
ed re
mun
erat
ion
incl
udin
g an
nual
leav
e pa
id d
urin
g th
e ye
ar F
or d
epar
ting
KM
P th
is in
clud
es a
ny le
ave
that
is p
aid
out u
pon
term
inat
ion
of e
mpl
oym
ent
w
hich
is n
ot in
clud
ed in
Sta
tuto
ry T
able
13 in
sec
tion
7
(2)
Pro-
rate
d FY
21 S
TI fo
r Lyn
McG
rath
for
mer
Gro
up E
xecu
tive
Ret
ail B
anki
ng i
n re
spec
t of t
he p
erio
d 1 S
epte
mbe
r 20
20 -
31 J
anua
ry 2
021
in
FY20
all
KMP
STI w
as a
war
ded
in R
estr
icte
d Sh
ares
(3)
Val
ue o
f ben
efit
s in
clud
es b
oth
non-
mon
etar
y an
d ot
her s
hort
-ter
m b
enef
its
and
rela
tes
to b
enef
its
(and
ass
ocia
ted
FBT)
suc
h as
car
par
king
acc
omm
odat
ion
or re
loca
tion
and
tra
vel
(4)
The
valu
e of
all d
efer
red
cash
and
or e
quit
y aw
ards
(usi
ng th
e cl
osin
g sh
are
pric
e on
the
vest
ing
date
) tha
t ves
ted
durin
g th
e pe
riod
It e
xclu
des
defe
rred
equ
ity
awar
ds g
rant
ed in
pre
viou
s ye
ars
that
did
not
ves
t dur
ing
the
perio
d(5
) Th
is re
late
s to
PA
Rs
that
ves
ted
duri
ng t
he p
erio
d (u
sing
the
clo
sing
sha
re p
rice
on
the
vest
ing
date
) (6
) Th
is is
the
tot
al d
olla
r val
ue o
f fix
ed re
mun
erat
ion
Val
ue o
f Ben
efit
s V
alue
of D
efer
red
Equi
ty V
este
d in
Per
iod
Ter
min
atio
n B
enef
its
and
Val
ue o
f LTI
Ves
ted
in P
erio
d(7
) Th
is re
late
s to
PA
Rs
that
laps
ed d
urin
g th
e ye
ar a
s a
resu
lt o
f hur
dles
not
bei
ng m
et a
ndo
r as
a re
sult
of c
easi
ng e
mpl
oym
ent (
clos
ing
shar
e pr
ice
on la
pse
date
)(8
) M
arti
ne J
ager
com
men
ced
as G
roup
Exe
cuti
ve R
etai
l on
27
Apr
il 20
21
(9)
Lyn
McG
rath
reti
red
and
ceas
ed a
s G
roup
Exe
cuti
ve R
etai
l Ban
king
on
31 J
anua
ry 2
021
FY2
1 STI
aw
ard
is in
clus
ive
of s
uper
annu
atio
n an
d pr
o-ra
ted
for 5
mon
ths
The
STI
aw
arde
d w
as 2
5 pe
r cen
t of p
ro-r
ated
tar
get S
TI
and
14 p
er c
ent o
f pro
-rat
ed m
axim
um S
TI 8
6 pe
r cen
t of p
ro-r
ated
max
imum
STI
was
forf
eite
d L
yn e
lect
ed t
o fo
rfei
t her
20
18 P
AR
s a
pro
-rat
a po
rtio
n of
her
20
19 P
AR
s re
mai
ns o
n fo
ot t
o ve
st in
the
nor
mal
cou
rse
su
bjec
t to
the
orig
inal
ter
ms
and
cond
itio
ns o
f the
aw
ard
For the year ended 31 August 2021REMUNERATION REPORT
Remuneration Governance 90 | Non-Executive Director Remuneration 94 | Statutory Tables 95
872021 Annual Report
SECTION 4 REMUNERATION STRATEGY AND STRUCTUREThis sections outlines the Grouprsquos remuneration strategy and the structure of senior executive remuneration
41 STRATEGYThe Grouprsquos remuneration objectives articulate the remuneration strategy and apply at all levels throughout the organisation These are to
bull reward sustainable profitable growth as BOQ executes its strategybull reward our people for delivering exceptional customer experiencesbull align our people to long-term value creation for our shareholdersbull provide exceptional employee experiences including performance and reward to attract and retain a diversity of high-quality talentbull ensure remuneration structures are consistent with our purpose-led culture clear accountability frameworks and robust risk
management framework andbull take into account prudent risk management in accordance with BOQrsquos risk appetite
42 STRUCTURESenior Executivesrsquo remuneration is structured in accordance with the Framework that was introduced on 1 September 2020 The particular objectives of the Framework are to
bull increase alignment with shareholder interests by delivering a sizeable proportion of total remuneration in equity bull encourage long-term performance with an appropriate focus on financial and non-financial metrics bull focus senior executives on improving absolute shareholder returnsbull provide a simple and transparent executive remuneration framework andbull attract and retain executive talent
The features of the Framework are outlined in Table 8
TABLE 8 - THE SENIOR EXECUTIVE REMUNERATION FRAMEWORK
Fixed reward Performance Shares Premium Priced Options
Purpose To attract and retain talent and reflect the individualrsquos skills capabilities and experience
To focus Senior Executives on delivering against the Grouprsquos strategy collaboratively and as a team
To align Senior Executivesrsquo interests with the interests of shareholders to achieve improved outcomes for all stakeholders and grow shareholder value
Delivery Cash Rights that convert to Restricted Shares
Options with a premium exercise price (120 of share price at grant)
Opportunity Based on capability experience and complexity of role
MD amp CEO 88 of FR
Other Senior Executives 78 of FR
MD amp CEO 58 of FR
Other Senior Executives 52 of FR
Eligibility NA At least three monthsrsquo active employment during the performance period
At least three monthsrsquo active employment during the performance period
Allocated Value Fixed reward levels are informed by benchmarking comparable roles in financial services andor similarly sized ASX listed companies
The face value of the Senior Executiversquos opportunity is divided by the VWAP of BOQ shares
For the annual grant the VWAP is calculated over the 5 trading days immediately following the AGM
For Senior Executives who join part-way through the performance period the VWAP is calculated over the 5 trading days immediately preceding their commencement date
The face value of each Senior Executiversquos opportunity is divided by the value of an option which was calculated by applying the Board approved valuation percentage of 6 to the VWAP calculated over the 5 trading days immediately following the AGM
For Senior Executives who join part-way through the performance period a percentage of the VWAP as determined by the Board calculated over the 5 trading days immediately preceding their commencement date
For the year ended 31 August 2021REMUNERATION REPORT
Remuneration Snapshot 81 | Key Management Personnel 80 | Remuneration Outcomes 81 | Remuneration Strategy amp Structure 88
88 Bank of Queensland Limited and its Controlled Entities
Fixed reward Performance Shares Premium Priced Options
Performance criteria
Satisfactory performance compliance with the terms and conditions of employment including the Code Of Conduct and fulfilment of accountabilities under the Banking Executive Accountability Regime (BEAR)
Performance against the Group Scorecard over the one year performance period (the FY) modified by the Boardrsquos overall assessment of risk and performance determines the conversion from Rights to Restricted Shares
BOQrsquos share price must exceed the exercise price set for the award and a risk assessment conducted by the Board
The exercise price is set at 120 of the VWAP
Risk NA Risk assessment prior to vesting
Unvested awards are subject to malus
A clawback period of two years applies to each tranche after vesting
Risk assessment prior to vesting
Unvested awards are subject to malus
MD amp CEO Each tranche is subject to dealing restrictions for two years after vesting
Other Senior Executives Each tranche is subject to the dealing restrictions for one year after vesting
For all participants a clawback period of two years applies to each tranche after vesting
Vesting profile NA 33 in December 2022 33 in December 2023 and 34 in December 2024 (ie after two three and four years)
50 in December 2024 and 50 in December 2025 (ie after four and five years)
43 DELIVERY AND REALISATION TIMEFRAMESFigure 5 illustrates the delivery profile of the different components of Senior Executivesrsquo remuneration for FY21
Figure 5 Delivery and realisation timeframes MD amp CEO
Fixed Reward Cash
Performance Shares
Premium Priced Options
FY21 FY22 FY23 FY24 FY25 FY26 FY27 FY28
Other Senior Executives
Fixed Reward Cash
Performance Shares
Premium Priced Options
FY21 FY22 FY23 FY24 FY25 FY26 FY27 FY28
42 STRUCTURE (CONTINUED)
Grant Convert Vest Restrictions lifted Clawback period
For the year ended 31 August 2021REMUNERATION REPORT
Remuneration Governance 90 | Non-Executive Director Remuneration 94 | Statutory Tables 95
892021 Annual Report
SECTION 5 REMUNERATION GOVERNANCE51 GROUP REMUNERATION POLICYThe Group Remuneration Policy (the Policy) sets out the governance structure for oversight of BOQrsquos remuneration frameworks and practices and the minimum expectations for their implementation Specifically the Policy requires that the Grouprsquos performance and remuneration frameworks
bull align the design and management of remuneration with mdash BOQrsquos strategic customer and financial objectives and mdash prudent risk-taking incorporating adjustments to reflect
bull the outcomes of business activities bull the risks related to those activities taking account where relevant the cost of the associated capital and bull the time necessary for the outcomes of those business activities to be reliably measured and
bull encourage behaviours that mdash are consistent with BOQrsquos purpose and values mdash align with and reward the delivery of superior customer outcomes mdash support BOQrsquos Risk Management Framework (RMF) prudent risk-taking and long-term financial success mdash prevent matters that may negatively impact prudential standing or reputation and mdash comply with all relevant jurisdictional legislative and regulatory requirements
52 ROLES AND RESPONSIBILITIES
521 The BoardThe Board is responsible for determining BOQrsquos Remuneration Policy and through the People Culture and Remuneration Committee (PCRC) focuses on strategic human resources and remuneration
The Board must at least annually review and approve
bull the Policybull individual remuneration arrangements including but not limited to fixed remuneration levels variable reward targets and outcomes
make-good awards retention awards and other benefits of significant value for those employees designated as Accountable Persons and Responsible Persons
bull collectively remuneration structures for other cohorts specified by APRA andbull all equity plans including the terms and conditions under which grants are offered
522 The People Culture amp Remuneration CommitteeIn accordance with its Charter the PCRC will
bull review and make recommendations to the Board on the performance objectives and individual remuneration arrangements for the MD amp CEO at least annually
bull make recommendations to the Board on individual remuneration arrangements for Accountable Persons and Responsible Persons including Senior Executives at least annually as part of the remuneration review and as otherwise required (eg on appointment for out-of-cycle awards and on separation if outside of policy)
bull make recommendations to the Board on collective remuneration arrangements for other cohorts specified by APRAbull at least annually review the Policy and where necessary recommend amendments to the Board The review must include an
assessment of the Policyrsquos mdash effectiveness and compliance with prudential standards and any other relevant legal regulatory andor governance requirements
including an assessment of underlying procedures controls and oversight mdash effectiveness in supporting BOQrsquos purpose strategy and objectives including to identify material deviations from the intent of the
Policy and unreasonable or undesirable outcomes that flow from existing arrangements mdash effectiveness in protecting the interests of customers and quality outcomes for customers mdash alignment with shareholder interests and mdash alignment with BOQrsquos RMF and the protection of BOQrsquos long-term financial soundness
All members of the PCRC are also members of the Board Audit Committee and the Board Risk Committee This construct supports the alignment of audit risk and reward matters and facilitates the effective sharing of information between the various committees
Where appropriate the Board Audit Committee and Board Risk Committee make recommendations to the PCRC to inform its decision-making in relation to performance and reward matters This includes input from the Board Risk Committee as it relates to setting objectives for and assessing the performance of the Chief Risk Officer
The PCRC may seek advice from external advisers to assist with the execution of its responsibilities
For the year ended 31 August 2021REMUNERATION REPORT
Remuneration Snapshot 78 | Key Management Personnel 80 | Remuneration Outcomes 81 | Remuneration Strategy amp Structure 88
90 Bank of Queensland Limited and its Controlled Entities
53 BOARD DISCRETIONSenior Executivesrsquo remuneration is determined by the remuneration strategy Policy and the Framework Remuneration outcomes are determined in accordance with relevant performance measures plan design and the Equity Incentive Plan (EIP) rules
The PCRC and Board recognise that there are a range of factors which are specific to current and future years and these may be taken into account when considering the overall remuneration outcomes for each year To account for those factors the PCRC and Board may make discretionary adjustments to remuneration outcomes for Senior Executives and those employees classified as Accountable Persons andor Responsible Persons These discretionary adjustments may impact an individualrsquos remuneration positively or negatively In accordance with this principle remuneration outcomes have been adjusted both positively and negatively in prior years
The criteria used by the PCRC and the Board to recommend and approve discretionary adjustments respectively include
bull factors either not known or not relevant at the beginning of a performance period or financial year which can impact performance positively or negatively during the course of that performance period or financial year
bull the degree of stretch implicit in the performance measures and targets and the environment and market context in which the targets were set
bull whether the operating environment during the performance period or financial year was materially different than forecastbull comparison of the Grouprsquos performance relative to its competitors bull the emergence of any major positive or negative risk or reputational issues bull the quality of financial results as shown by their composition and consistency bull whether leadership behaviours consistent with the Grouprsquos Code of Conduct and values have been regularly demonstrated throughout
the performance period or financial year andbull any other matters that the PCRC and Board deem to be relevant and which are not outlined above
54 RISK ADJUSTMENTThe Chief Risk Officer presents a report to the PCRC on a biannual basis This report which is also reviewed by the Chair of the Board Risk Committee covers significant and thematic risk events and is used by the PCRC to inform variable reward decisions including the granting of equity to Senior Executives and other employees and the Boardrsquos assessment of risk prior to vesting of equity awards The findings of the CROrsquos Report are typically discussed at a closed PCRC session which also provides the Chair of the Board Risk Committee an opportunity to provide input
The PCRC and Board have at their disposal three avenues for making risk adjustments to remuneration These include
bull in-period adjustment where all or a portion of potential variable reward may be reduced including to zerobull malus where the Board may determine that all or a portion of any unvested award will be lapsed or forfeited andbull clawback where subject to legal limitations the Board may seek to recover all or a portion of an award that has been paid andor vested
Circumstances in which the PCRC may recommend and the Board may approve to invoke in-period adjustment malus andor clawback provisions include where in the opinion of the Board a Senior Executive or other individual has
bull engaged in serious misconduct or a breach of their employment obligations (including fraud dishonesty gross negligence recklessness or wilful indifference)
bull failed to meet BOQrsquos conduct and behavioural standards including a determination that a former employee engaged in conduct that would be considered failure of the conduct and behavioural standards if still employed
bull contributed to a material misstatement in or omission from BOQrsquos financial statements or a misstatement of a performance condition applicable to a variable remuneration plan
bull acted or failed to act in a way that contributed to material reputational damage to BOQ orbull received a variable reward where all or part of the initial award was not justified having regard to the circumstances or information
which has come to light after an award was made
For the year ended 31 August 2021REMUNERATION REPORT
Remuneration Governance 90 | Non-Executive Director Remuneration 94 | Statutory Tables 95
912021 Annual Report
55 CESSATION OF EMPLOYMENT AND CHANGE OF CONTROLThe treatment of future awards and unvested deferred awards depends on the circumstances under which employment ceases Generally
bull in the event of summary dismissal or resignation Senior Executives are not eligible to be awarded any further grants of Performance Shares or Premium Priced Options and any unvested equity will be lapsed or forfeited (as relevant to the particular award andor instrument)
bull in particular circumstances referred to as Qualifying Reasons or where minimum service requirements have been met (as approved by the Board) it may be possible and permitted for a Senior Executiversquos unvested equity to remain on foot Qualifying Reasons include redundancy retirement death mutual agreement for cessation and total and permanent disablement
bull where a Senior Executive ceases employment for a Qualifying Reason but is subsequently employed by a competitor of BOQ within six months of ceasing any unvested equity will be lapsed or forfeited (as relevant to the particular award andor instrument) as though they had resigned unless the Board consents otherwise
bull The Policy and various plan documentation also sets out the relevant treatment on change of control
Generally speaking in relation to awards granted up to and including FY21 where an employee separates for a Qualifying Reason or due to a Change of Control event unvested awards will be pro-rated to cessation date and remain on foot to vest in the normal course subject to the original terms and conditions unless the Board determines otherwise
56 MINIMUM SHAREHOLDING REQUIREMENTSNEDs are required to hold shares equal in value to one times their base fee within three years of their appointment to the Board
There are no minimum shareholding requirements for Senior Executives However the prevalence of equity and the long-dated vesting timeframes that underpin the Framework ensures that all Senior Executives will have at a minimum equity interests reflecting at least one times their fixed remuneration once they have been awarded an annual grant of Performance Shares and Premium Priced Options
57 SECURITIES TRADING POLICYThe Grouprsquos Securities Trading Policy regulates dealings by Directors employees and contractors in BOQ securities Under the policy Prescribed Persons (those employees with the authority responsibility participatory role in or knowledge of the planning directing or controlling of the activities of the Group) are prohibited from dealing in BOQ securities during certain blackout periods including
bull the period commencing 1 March and ending at the close of trading on the ASX one day after the announcement of BOQrsquos half year results
bull the period commencing 1 September and ending at the close of trading on the ASX one day after the announcement of BOQrsquos full year results or
bull any other period nominated from time to time by the Chair MD amp CEO or Chief Financial Officer of BOQ
If a Director employee or contractor has inside information about the BOQ Group they must not deal in BOQ securities at any time including outside of a blackout period
58 USE OF REMUNERATION CONSULTANTSWhere necessary the Board seeks advice from independent experts and advisors including remuneration consultants The remuneration consultants are engaged by the Chair of the PCRC in order to ensure upon engagement that the appropriate level of independence exists from Management Reports provided by independent consultants are submitted directly to the Chair of the PCRC Where the consultantrsquos engagement requires a recommendation the recommendation is provided to and discussed directly with the PCRC Chair in accordance with the requirements of the Corporations Act
During FY21 the PCRC did not engage independent advisors to provide remuneration recommendations
For the year ended 31 August 2021REMUNERATION REPORT
Remuneration Snapshot 78 | Key Management Personnel 80 | Remuneration Outcomes 81 | Remuneration Strategy amp Structure 88
92 Bank of Queensland Limited and its Controlled Entities
59 EXECUTIVE CONTRACTSThe remuneration and terms of Senior Executivesrsquo employment are formalised in their Executive Services Agreement (ESA) Each ESA provides for the payment of fixed and performance-based variable remuneration superannuation and other benefits such as statutory leave entitlements The employment terms of each ESA is summarised in Table 9
TABLE 9 - SENIOR EXECUTIVE CONTRACT TERMS
Position TitleNotice Period by Executive
Employer Notice Period Termination Payments (includes Notice Periods)
Current Senior Executives
George Frazis Managing Director amp Chief Executive Officer 6 months 9 months 9 monthsrsquo fixed remuneration in lieu of notice
Debra Eckersley Group Executive People amp Culture 6 months 6 months 6 monthsrsquo fixed remuneration in lieu of notice
Martine Jager Group Executive Retail Banking 6 months 6 months 6 monthsrsquo fixed remuneration in lieu of notice
Adam McAnalen Chief Risk Officer 6 months 6 months 6 monthsrsquo fixed remuneration in lieu of notice
Fiamma Morton Group Executive Business Banking 6 months 6 months 6 monthsrsquo fixed remuneration in lieu of notice
Craig Ryman Chief Information Officer 6 months 6 months 6 monthsrsquo fixed remuneration in lieu of notice
Ewen Stafford Chief Financial Officer amp Chief Operating Officer 6 months 6 months 6 monthsrsquo fixed remuneration in lieu of notice
Former Senior Executives
Lyn McGrath Group Executive Retail Banking 3 months 3 months 3 monthsrsquo fixed remuneration in lieu of notice
For the year ended 31 August 2021REMUNERATION REPORT
Remuneration Governance 90 | Non-Executive Director Remuneration 94 | Statutory Tables 95
932021 Annual Report
SECTION 6 NON-EXECUTIVE DIRECTOR REMUNERATION61 FEE POOLNED fees are determined within an aggregate fee pool limit The pool currently stands at $2800000 inclusive of superannuation and was approved by shareholders on 30 November 2016 The fee pool allows the Board flexibility with changes to its size and composition The Board will not be seeking an increase to the fee pool at the 2021 AGM
62 REMUNERATION FRAMEWORKNED fees are set to attract and retain individuals of appropriate calibre to the Board and Committees Fees are reviewed annually by the PCRC having regard for the external market of similarly sized and comparably complex organisations
The Board Chairrsquos fee is determined independently from the fees of other Directors and is also based on the external market The Chair is not present at any discussions relating to the determination of his own remuneration
In order to maintain independence and impartiality NEDs to do not receive any performance-based remuneration including share options or rights subject to a performance condition in addition to their prescribed fees NEDs are not provided with retirement benefits apart from statutory superannuation
The BOQ Constitution allows the Company to pay Directors additional remuneration for extra or special services performed
63 BOARD COMMITTEESFrom 1 September 2020 all NEDs serve on the Board Audit Nomination amp Governance People Culture amp Remuneration Risk and Transformation amp Technology (previously Information Technology until 26 November 2020) Committees
64 ME BANKBOQ NEDs became Directors of the ME Bank Limited Board on 1 July 2021 All NEDs assumed equivalent roles with ME Bank Limited for example Patrick Allaway is the Chair of the ME Bank Board and all other NEDs are members
In accordance with APRA regulation the Board of ME Bank Limited is required to maintain its own Board Audit and Board Risk Committees Karen Penrose serves as the Chair of the ME Bank Board Audit Committee and Bruce Carter serves as the Chair of the ME Bank Board Risk Committee All other NEDs are members of both committees
No additional fees are payable for chairmanship or membership of the ME Bank Board or its Board committees
65 NED FEE STRUCTURETo reflect the revised committee composition and to provide fairness and simplicity on 1 September 2020 BOQ moved to a flat fee structure inclusive of superannuation which is payable up to the maximum contributions base The only instances where additional committee fees are payable are in relation to the Due Diligence Committee and the Investment Committee which are paid on a per-meeting basis
During FY21 the Board approved an additional fee for three NEDs resulting from additional work undertaken in relation to the ME Bank acquisition
A benchmarking exercise was undertaken during FY21 and consequently the Board approved an increase to NED fees for FY22 effective 1 September 2021
For the year ended 31 August 2021REMUNERATION REPORT
Remuneration Snapshot 78 | Key Management Personnel 80 | Remuneration Outcomes 81 | Remuneration Strategy amp Structure 88
94 Bank of Queensland Limited and its Controlled Entities
65 NED FEE STRUCTURE (CONTINUED)The FY21 and FY22 fee structures are set out in Table 10
TABLE 10 - FY21 AND FY22 NED FEES (INCLUSIVE OF SUPERANNUATION)
FY21 (01092020 - 31082021) FY22 (01092021 - 31082022)
ChairCommittee Chair (1)
$
DirectorsCommittee
Members$
ChairCommittee Chair
$
DirectorsCommittee
Members$
Annual Fees
Base fees 420000 165000 500000 185000
Committee fees(2) 30000 80000 50000 80000
St Andrewrsquos Board(3) - 50000 - 50000
Per meeting Fees
Investment Committee 2500 1750 2500 1750
Due Diligence Committee 2500 1750 2500 1750
One-off fees
ME Bank acquisition(4) 50000 25000 na na
(1) The Chair receives no additional remuneration for involvement with Committees(2) A flat fee applies for the following Committees Audit Nomination amp Governance People Culture amp Remuneration Risk and Transformation amp Technology(3) Karen Penrose is also a member of the St Andrewrsquos Board of Directors(4) The Board approved payment of an additional one-off fee of $50000 to Patrick Allaway the Chair and $25000 each to NEDs Karen Penrose and Warwick Negus due to their
involvement in the due diligence phase of the ME Bank acquisition For Ms Penrose and Mr Negus this fee was paid instead of their per-meeting Due Diligence Committee fees
66 NED FEE SACRIFICE RIGHTS PLANAt the beginning of FY21 as in prior years offers were made under the NED Fee Sacrifice Rights Plan Five NEDs elected to participate in the Plan the details of which are provided in Table 11
TABLE 11 - TERMS OF THE NED FEE SACRIFICE RIGHTS PLAN
Purpose The Planrsquos purpose is to provide an opportunity for NEDs to increase their shareholding in a tax effective manner The Plan meets regulatory and tax requirements
Value At the beginning of the participation period NEDs can nominate a percentage of their pre-tax fees (up to 100) to receive in Rights to shares in BOQ
Vesting PeriodRights vest and convert to shares following the completion of the participation period For FY21 the participation period was the twelve months from 1 September 2020 to 31 August 2021 The rights do not have any performance conditions in order to preserve the NEDsrsquo independence
Disposal Restrictions Shares received on exercise will be subject to a disposal restriction of at least three years or longer as nominated by the Director (up to 15 years from grant date)
Cessation of DirectorshipIf a participant ceases to be a NED prior to the Rights vesting they will retain a pro-rata number of Rights based on the period they were a NED If directorship ceases during the restriction period any disposal restrictions on the shares will be lifted subject to a minimum trading restriction of 12 months
SECTION 7 STATUTORY TABLES71 STATUTORY DISCLOSURESThe following tables include details of the nature and amount as required by the Corporations Act 2001 (Cth) of each major element of the remuneration of each Director and Senior Executive of the Group calculated in accordance with accounting standards
For the year ended 31 August 2021REMUNERATION REPORT
Remuneration Governance 90 | Non-Executive Director Remuneration 94 | Statutory Tables 95
952021 Annual Report
71
STAT
UTOR
Y DI
SCLO
SURE
S (C
ONTI
NUED
)
TAB
LE 12
- D
IREC
TORS
rsquo REM
UN
ERAT
ION
Det
ails
of t
he n
atur
e an
d am
ount
of e
ach
maj
or e
lem
ent o
f the
rem
uner
atio
n of
eac
h D
irect
or o
f the
Gro
up a
re a
s ou
tline
d in
the
tabl
e be
low
Shor
t-Te
rm
Long
-Ter
m
Shar
e B
ased
Pay
men
ts
Sala
ry
and
fees
(1) $
Non
-m
onet
ary
bene
fits
(2) $
Oth
er
shor
t ter
m
bene
fits
(3) $
Tota
l sh
ort t
erm
be
nefi
ts $
Post
em
ploy
men
t (4) $
Oth
er
long
term
(5) $
Term
inat
ion
Ben
efit
sRi
ghts
(6) $
Shar
es
and
unit
s(7) $
Tota
l $
Prop
ortio
n of
re
mun
erat
ion
perf
orm
ance
re
late
d
Valu
e of
rig
hts a
s pr
opor
tion
of
rem
uner
atio
n
Exec
utiv
e D
irec
tor
Geo
rge
Fraz
is20
211
262
032
158
4095
843
137
371
522
163
445
75-
545
249
219
375
220
50
7735
25
2020
124
782
315
840
434
491
3071
1226
426
375
5-
982
7721
937
516
549
4519
6
Non
-Exe
cuti
ve D
irec
tors
- C
urre
nt (8
)
Patr
ick
Alla
way
Patr
ick
Alla
way
2021
361
724
--
361
724
242
81
--
-8
399
547
00
00
--
2020
293
201
--
293
201
219
90-
--
787
5639
394
7-
-
Bru
ce C
arte
r20
2123
90
6-
-23
90
62
125
--
274
998
301
029
--
2020
115
--
115
--
--
266
00
326
611
8 -
-
Deb
orah
Kie
rs(9
)20
2115
186
--
1518
61
519
--
--
167
05
--
John
Lor
imer
2021
223
575
--
223
575
214
25-
--
-24
50
00
--
2020
197
540
-
-19
754
0
187
66-
--
-21
630
6 -
-
War
wic
k N
egus
2021
392
75-
-39
275
147
7-
-27
499
831
575
0-
-
2020
222
59-
-22
259
--
--
208
050
230
30
9-
-
Kare
n Pe
nros
e20
2131
543
131
543
123
113
324
9437
10
38-
-
2020
263
566
--
263
566
212
72
--
-25
60
031
04
38-
-
Mic
kie
Ros
en (1
0)20
2111
177
1-
-11
177
110
566
--
--
122
337
--
Non
-Exe
cuti
ve D
irec
tors
- F
orm
er (8
)
Kath
leen
Bai
ley-
Lor
d (11)
20
2116
30
16-
-16
30
1619
935
--
-45
373
228
324
--
2020
1371
46-
-13
7146
129
14
--
-60
773
210
833
--
Mic
helle
Tre
deni
ck (1
2)20
2169
150
--
6915
05
895
--
--
750
45-
-
2020
235
00
0
--
235
00
020
898
--
--
255
898
--
(1)
For G
eorg
e Fr
azis
sal
ary
and
fees
refe
rs t
o fi
xed
rem
uner
atio
n in
clud
ing
annu
al le
ave
accr
ued
or u
tilis
ed d
urin
g th
e fi
nanc
ial y
ear
(2)
Non
-mon
etar
y be
nefi
ts re
late
to
com
pany
-fun
ded
bene
fits
suc
h ca
r par
king
acc
omm
odat
ion
and
trav
el
(3)
Oth
er s
hort
ter
m b
enef
its
rela
tes
to a
ccom
mod
atio
n al
low
ance
(4
) Po
st-e
mpl
oym
ent i
nclu
des
supe
rann
uati
on b
enef
its
(5)
Com
pris
es lo
ng s
ervi
ce le
ave
accr
ued
or u
tilis
ed d
urin
g th
e fi
nanc
ial y
ear
(6)
The
fair
valu
e of
the
rig
hts
is c
alcu
late
d at
the
dat
e of
gra
nt u
sing
an
indu
stry
acc
epte
d op
tion
pri
cing
mod
el a
nd
allo
cate
d to
eac
h re
port
ing
peri
od e
venl
y ov
er t
he p
erio
d fr
om g
rant
dat
e to
ves
ting
dat
e
(7)
Repr
esen
ts t
he v
alue
of r
estr
icte
d sh
ares
aw
arde
d th
roug
h de
ferr
ed S
TI p
aym
ents
or N
on-E
xecu
tive
Dire
ctor
Fee
Sa
crif
ice
Righ
ts P
lan
(8)
The
Ban
k ha
s al
so p
aid
insu
ranc
e pr
emiu
ms
in re
spec
t of D
irect
orrsquos
and
Offi
cers
rsquo Lia
bilit
y In
sura
nce
whi
ch is
not
re
flec
ted
in t
he a
bove
tab
le a
s th
ere
is n
o ap
prop
riat
e ba
sis
for a
lloca
tion
(9
) C
omm
ence
d as
KM
P on
5 A
ugus
t 20
21
(10)
Com
men
ced
as K
MP
on 4
Mar
ch 2
021
(1
1) C
ease
d as
KM
P on
5 A
ugus
t 20
21
(12)
Cea
sed
as K
MP
on 8
Dec
embe
r 20
20
For the year ended 31 August 2021REMUNERATION REPORT
Remuneration Snapshot 78 | Key Management Personnel 80 | Remuneration Outcomes 81 | Remuneration Strategy amp Structure 88
96 Bank of Queensland Limited and its Controlled Entities
71
STAT
UTOR
Y DI
SCLO
SURE
S (C
ONTI
NUED
)
TAB
LE 13
- S
ENIO
R EX
ECU
TIV
E R
EMU
NER
ATIO
ND
etai
ls o
f the
nat
ure
and
amou
nt o
f eac
h m
ajor
ele
men
t of t
he re
mun
erat
ion
of e
ach
Seni
or E
xecu
tive
of t
he G
roup
are
as
outli
ned
in th
e ta
ble
belo
w
Shor
t-Te
rm
Long
-Ter
m
Shar
e B
ased
Pay
men
ts
Sala
ry
and
fees
(1) $
STI a
t ri
sk(2
) $
Non
-m
onet
ary
bene
fits
(3) $
Oth
er
shor
t ter
m
bene
fits
(4) $
Tota
l sh
ort t
erm
be
nefi
ts $
Post
em
ploy
men
t (5) $
Oth
er
long
ter
m(6
) $Te
rmin
atio
n B
enef
its
Righ
ts(7
) $
Shar
es
and
unit
s(8) $
Tota
l $
Prop
orti
on o
f re
mun
erat
ion
perf
orm
ance
re
late
d
Val
ue o
f ri
ghts
as
prop
orti
on o
f re
mun
erat
ion
Exec
utiv
es -
Cur
rent
Deb
ra E
cker
sley
2021
549
832
--
549
832
2216
326
215
-27
560
694
50
096
83
1638
28
2020
518
88
5 -
-
51
88
85
2117
62
796
-10
472
994
50
074
20
86
27
14
Mar
tine
Jag
er(8
)20
2124
366
42
971
-24
663
511
316
438
1-
209
06
-28
323
87
7
Ada
m M
cAna
len
2021
682
993
533
211
9568
952
022
163
78
13-
274
244
113
906
110
764
633
25
2020
6316
04
512
0
920
637
644
21
176
340
28-
102
315
113
906
909
069
17
11
Fiam
ma
Mor
ton
2021
662
212
158
40-
678
052
2216
315
530
-19
313
229
531
938
40
824
21
2020
173
850
2
237
-
176
087
83
8949
1-
-29
531
214
498
14
-
Cra
ig R
yman
2021
703
652
158
40-
719
492
2216
314
30
9-
193
132
153
5696
445
222
20
2020
926
06
20
83
-94
689
5
424
265
--
153
5611
573
413
-
Ewen
Sta
ffor
d20
2170
328
947
00
4-
750
293
2216
325
064
-26
771
710
621
511
714
5232
23
2020
548
421
3211
9-
580
540
2117
6 16
23-
525
1610
621
576
20
7021
7
Exec
utiv
es -
For
mer
Lyn
McG
rath
(9)
2021
278
00
950
00
08
729
-33
673
810
073
--
(114
860
)99
844
331
795
11
(35
)
2020
612
922
208
23
-63
374
521
176
368
8-
118
08
111
48
44
891
534
26
13
(1)
Sala
ry a
nd fe
es re
fers
to
fixe
d re
mun
erat
ion
incl
udin
g an
nual
leav
e ac
crue
d or
uti
lised
dur
ing
the
fina
ncia
l yea
r(2
) Pr
o-ra
ted
FY21
STI
for L
yn M
cGra
th f
orm
er G
roup
Exe
cuti
ve R
etai
l Ban
king
in
resp
ect o
f the
per
iod
1 Sep
tem
ber 2
020
- 3
1 Jan
uary
20
21 i
n FY
20 a
ll KM
P ST
I was
aw
arde
d in
Res
tric
ted
Shar
es(3
) C
ompa
ny-f
unde
d be
nefi
ts (a
nd a
ssoc
iate
d FB
T) s
uch
as c
ar p
arki
ng a
ccom
mod
atio
n or
relo
cati
on a
nd t
rave
l(4
) B
enef
its
such
as
allo
wan
ces
(5)
Post
-em
ploy
men
t inc
lude
s su
pera
nnua
tion
ben
efit
s(6
) C
ompr
ises
long
ser
vice
leav
e ac
crue
d or
uti
lised
dur
ing
the
fina
ncia
l yea
r (7
) Th
e fa
ir va
lue
of t
he r
ight
s is
cal
cula
ted
at t
he d
ate
of g
rant
usi
ng a
n in
dust
ry a
ccep
ted
opti
on p
rici
ng m
odel
and
allo
cate
d to
eac
h re
port
ing
peri
od e
venl
y ov
er t
he p
erio
d fr
om g
rant
dat
e to
ves
ting
dat
e(8
) Re
pres
ents
the
val
ue o
f res
tric
ted
shar
es a
war
ded
thro
ugh
defe
rred
STI
pay
men
ts o
r in
lieu
of fo
rgon
e in
cent
ives
(9
) M
arti
ne J
ager
com
men
ced
as G
roup
Exe
cuti
ve R
etai
l Ban
king
on
27 A
pril
2021
(1
0) L
yn M
cGra
th re
tire
d an
d ce
ased
as
Gro
up E
xecu
tive
Ret
ail B
anki
ng o
n 31
Jan
uary
20
21 F
Y21 S
TI a
war
d is
incl
usiv
e of
sup
eran
nuat
ion
and
was
pro
-rat
ed fo
r 5 m
onth
s T
he S
TI a
war
ded
was
25
per c
ent o
f pro
-rat
ed t
arge
t STI
and
14 p
er c
ent o
f pr
o-ra
ted
max
imum
STI
86
per c
ent o
f pro
-rat
ed m
axim
um S
TI w
as fo
rfei
ted
Lyn
ele
cted
to
forf
eit h
er 2
018
PA
Rs
a p
ro-r
ata
port
ion
of h
er 2
019
PA
Rs
rem
ains
on
foot
to
vest
in t
he n
orm
al c
ours
e s
ubje
ct t
o th
e or
igin
al t
erm
s an
d co
ndit
ions
of
the
awar
d
For the year ended 31 August 2021REMUNERATION REPORT
Remuneration Governance 90 | Non-Executive Director Remuneration 94 | Statutory Tables 95
972021 Annual Report
72 EQUITY HELD BY SENIOR EXECUTIVES
TABLE 14 - MOVEMENT IN EQUITY AWARDS HELD BY SENIOR EXECUTIVES DURING THE FINANCIAL YEAR 2021
Movements during the 2021 Financial Year
Senior (1) Executive Type
Grant Date
Share Price at
Grant Date (2)
$
Balance at 1 Sep
2020 Granted (3) Exercised Lapsed
Balance at 31 Aug
2021 (3)(4)
Vested during
the Year (5)
()
Current
George Frazis 2019 PARs 19122019 736 143215 - - - 143215 -
2021 Performance Shares 6012021 770 - 146566 - - 146566 -
2021 Premium Priced Options 6012021 770 - 1628456 - - 1628546 -
Restricted Shares 6012021 770 - 85443 - - 85443 -
Debra Eckersley 2018 PARs 11122018 974 49450 - - - 49450 -
2019 PARs 19122019 736 57397 - - 57397 -
2021 Performance Shares 6012021 770 - 56158 - - 56158 -
2021 Premium Priced Options 6012021 770 - 623956 - - 623956 -
Restricted Shares 6012021 770 - 36807 - - 36807 -
Martine Jager 2021 Performance Shares 30062021 911 - 20493 - - 20493 -
2021 Premium Priced Options 30062021 911 - 151792 - - 151792 -
Adam McAnalen 2017 PARs 13122017 1271 7634 - - 7634 - -
2017 DARs 13122017 1271 1909 - 1909 - - 50
2018 PARs 11122018 974 10361 - - - 10361 -
2018 DARs 11122018 974 3014 - 1130 - 1884 30
2019 PARs 19122019 736 65597 - - - 65597 -
2021 Performance Shares 6012021 770 - 67691 - - 67691 -
2021 Premium Priced Options 6012021 770 - 752090 - - 752090 -
Restricted Shares 6012021 770 - 44365 - - 44365 -
Fiamma Morton 2021 Performance Shares 6012021 770 - 70198 - - 70198 -
2021 Premium Priced Options 6012021 770 - 779945 - - 779945 -
Restricted Shares 6012021 770 - 11502 - - 11502 -
Craig Ryman 2021 Performance Shares 6012021 770 - 70198 - - 70198 -
2021 Premium Priced Options 6012021 770 - 779945 - - 779945 -
Restricted Shares 6012021 770 - 5981 - - 5981 -
Ewen Stafford 2019 PARs 19122019 736 76529 - - - 76529 -
2021 Performance Shares 6012021 770 - 70198 - - 70198 -
2021 Premium Priced Options 6012021 770 - 779945 - - 779945 -
Restricted Shares 6012021 770 - 41369 - - 41369 -
Former
Lyn McGrath 2018 PARs 11122018 974 59811 - - 59811 - -
Restricted Shares 11122018 974 8478 - 4239 - 4239 30
2019 PARs 10022020 736 68877 - - 50038 18839 -
Restricted Shares 6012021 770 - 34506 - - 34506 -
(1) Senior Executives with nil shareholding movements while KMP have been excluded from the table above (2) Restricted shares granted on 6 January 2021 are valued as at the FY20 STI allocation date rather than the grant date(3) This represents the maximum number of equity awards that may vest to each Executive(4) Balance amounts as at 31 August 2021 are unvested and not yet exercisable(5) Percentage of initial grant
For the year ended 31 August 2021REMUNERATION REPORT
Remuneration Snapshot 78 | Key Management Personnel 80 | Remuneration Outcomes 81 | Remuneration Strategy amp Structure 88
98 Bank of Queensland Limited and its Controlled Entities
72 EQUITY HELD BY SENIOR EXECUTIVES (CONTINUED)
TABLE 15 - VALUE OF EQUITY AWARDS HELD BY SENIOR EXECUTIVES DURING THE FINANCIAL YEAR 2021
Senior Executive Grant Grant Date
Fair Value per equity
award at Grant Date (1)
$
Value at Grant Date (2)
$ Exercise Date
Share Price at Exercise
Date (3) $
Value at Exercise
Date (4)
$
Expiry Lapsing
Date
Current
George Frazis 2019 PARs 19122019 361 517006 - - - 191220262021 Performance Shares 6012021 749 1097779 - - - -
2021 Premium Priced Options 6012021 057 928220 - - - 8122027
Restricted Shares 6012021 685 585285 - - - -
Debra Eckersley 2018 PARs 11122018 491 242800 - - - 11122025
2019 PARs 19122019 361 207203 - - - 191220262021 Performance Shares 6012021 749 420623 - - - -
2021 Premium Priced Options 6012021 056 349415 - - - 8122026
Restricted Shares 6012021 685 252128 - - - -
Martine Jager 2021 Performance Shares 30062021 886 181568 - - - -
2021 Premium Priced Options 30062021 099 150274 - - - 29062026
Adam McAnalen 2016 DARs 23122016 1145 41529 19122017 1266 9179 2312202113122018 956 10401 2312202123122019 735 13333 23122021
2017 PARs 13122017 714 54507 - - - 080320212017 DARs 13122017 1105 42178 13122018 956 7294 13122022
09122019 745 8530 1312202214122020 760 14508 13122022
2018 PARs 11122018 491 50873 - - - 111220252018 DARs 11122018 821 30935 09122019 745 5617 11122025
14122020 760 8588 111220252019 PARs 19122019 361 236805 - - - 191220262021 Performance Shares 6012021 749 507006 - - - -
2021 Premium Priced Options 6012021 056 421170 - - - 8122026
Restricted Shares 6012021 685 303900 - - - -
Fiamma Morton 2021 Performance Shares 6012021 749 525783 - - - -
2021 Premium Priced Options 6012021 056 436769 - - - 8122026
Restricted Shares 6012021 685 78789 - - - -
Craig Ryman 2021 Performance Shares 6012021 749 525783 - - - -
2021 Premium Priced Options 6012021 056 436769 - - - 8122026
Restricted Shares 6012021 685 40970 - - - -
(1) Restricted shares granted on 6 January 2021 are valued as at the FY20 STI allocation date rather than the grant date(2) Represents equity awards held at 1 September 2020 or granted during FY21(3) Closing share price on exercise date of rights that have a nil exercise price(4) Closing share price on exercise date multiplied by the number of rights exercised during the year
For the year ended 31 August 2021REMUNERATION REPORT
Remuneration Governance 90 | Non-Executive Director Remuneration 94 | Statutory Tables 95
992021 Annual Report
72 EQUITY HELD BY SENIOR EXECUTIVES (CONTINUED)
TABLE 15 - VALUE OF RIGHTS HELD BY SENIOR EXECUTIVES DURING THE FINANCIAL YEAR 2021 (CONTINUED)
Senior Executive Grant Grant Date
Fair Value per Right at
Grant Date (1) $
Value at Grant Date (2)
$ Exercise Date
Share Price at Exercise
Date (3) $
Value at Exercise
Date (4)
$
Expiry Lapsing
Date
Current (continued)
Ewen Stafford 2019 PARs 19122019 361 276270 - - - 19122026
2021 Performance Shares 6012021 749 525783 - - - -
2021 Premium Priced Options 6012021 056 436769 - - - 8122026
Restricted Shares 6012021 685 283378 - - - -
Former
Lyn McGrath Restricted Shares 17102018 1091 611702 30042019 889 348746 -
15082019 885 108244 -
11122019 727 33500 -
2018 PARs 11122018 491 293672 - - - 25022021
Restricted Shares 11122018 1062 150050 11122019 727 41083 -
7122020 765 32428 -
2019 PARs 10022020 361 248646 (5) - - - 19122026
Restricted Shares 6012021 685 236366 - - - -
(1) Restricted shares granted on 6 January 2021 are valued as at the FY20 STI allocation date rather than the grant date(2) Represents equity awards held at 1 September 2020 or granted during FY21(3) Closing share price on exercise date of rights that have a nil exercise price(4) Closing share price on exercise date multiplied by the number of rights exercised during the year(5) 18839 with a fair value of $68009 PARs remain as at 31 August 2021
For the year ended 31 August 2021REMUNERATION REPORT
Remuneration Snapshot 78 | Key Management Personnel 80 | Remuneration Outcomes 81 | Remuneration Strategy amp Structure 88
100 Bank of Queensland Limited and its Controlled Entities
73 OTHER EQUITY INSTRUMENTS - HOLDINGS AND MOVEMENTSThe number of other equity instruments held directly indirectly or beneficially by each Director Senior Executive or related party is set out in Table 16 All shares were acquired by NEDs under normal terms and conditions or through the NED Fee Sacrifice Rights Plan
TABLE 16 - NUMBER OF OTHER EQUITY INSTRUMENTS HELD DIRECTLY INDIRECTLY OR BENEFICIALLY
Ordinary shares (1)
Held at 1 September
2020Purchases
(Sales)
Rights granted under NED Fee
Sacrifice Rights Plan
Received on Exercise of
Rights Vesting of Restricted
Shares
Held at 31 August
2021
Directors - Current
Patrick Allaway 142737 42737 12268 - 197742
Bruce Carter 75620 22642 40165 - 138427
George Frazis 50000 40552 - - 90552
John Lorimer 21128 6326 - - 27454
Warwick Negus 51872 15531 40165 - 107568
Karen Penrose 19828 5937 4746 - 30511
Director - Former
Kathleen Bailey-Lord 13903 4163 6627 - na
Michelle Tredenick 19762 - - - na
Executives - Current
Debra Eckersley - 14879 - - 14879
Adam McAnalen 43614 36791 - 3039 83444
Executives - Former
Lyn McGrath 61719 - - 4239 na
(1) Directors and Senior executives with nil shareholding balances as at 31 August 2021 have been excluded from the table above
For the year ended 31 August 2021REMUNERATION REPORT
Remuneration Governance 90 | Non-Executive Director Remuneration 94 | Statutory Tables 95
1012021 Annual Report
74 TRANSACTIONS WITH KEY MANAGEMENT PERSONNEL (DIRECTORS amp SENIOR EXECUTIVES)
Loan transactionsLoans to KMP and their related parties (including close family members and entities over which the KMP andor their close family members have control joint control or significant influence) are provided in the ordinary course of business Normal commercial terms and conditions are applied to all loans Any discounts provided to KMP are the same as those available to all employees of the Group There have been no write-downs or amounts recorded as provisions during FY21
Details of loans held by KMP and their related parties during FY21 where the individualrsquos aggregate loan balance exceeded $100000 at any time in this period are as follows
TABLE 17 - INDIVIDUAL LOAN TRANSACTIONS WITH KMP (OVER $100000)
Balance at 1 September 2020
$
Interest charged during the year
$
Balance at 31 August 2021
$
Highest balance during the year
$
Executives
Debra Eckersley 350000 11508 350000 351046
Other Related Parties
George Frazis related parties 760430 34998 743279 763433
Details regarding the aggregate value of loans made guaranteed or secured by any entity in the Group to all Senior Executives and their related parties and the number of individuals in each group are as follows
TABLE 18 - AGGREGATED LOAN TRANSACTIONS WITH KMP
Balance at 1 September 2020
$
Interest charged during the year
$
Balance at 31 August 2021
$
Number in group at 31 August 2021
Executives 350000 11508 350000 1
Other Related Parties 760430 34998 743279 1
For the year ended 31 August 2021REMUNERATION REPORT
Remuneration Governance 90 | Non-Executive Director Remuneration 94 | Statutory Tables 95
102 Bank of Queensland Limited and its Controlled Entities
Indemnification of officersThe Bankrsquos Constitution supported by a Deed of Indemnity Insurance and Access provides an indemnity in favour of all directors and officers of the Bank against liabilities incurred by them in the capacity as officer to the maximum extent permitted by law
Insurance of officers Since the end of the previous financial year the Bank has paid insurance premiums in respect of a Directorsrsquo and Officersrsquo liability insurance contract The contract insures each person who is or has been a director or officer (as defined in the relevant policy) of the Bank against certain liabilities arising in the course of their duties to the Bank and its subsidiaries as defined in the relevant policy The Directors have not included details of the nature of the liabilities covered or the amount of the premium paid in respect of the insurance contract as such disclosure is prohibited under the terms of the contract
Directorsrsquo interestsDirectorsrsquo interests as at the date of this report were as follows
Ordinary shares
Patrick Allaway 197742
George Frazis 90552
Bruce Carter 138427
John Lorimer 27454
Warwick Negus 107568
Karen Penrose 30511
Deborah Kiers (1) -
Mickie Rosen (2) -
(1) Deborah Kiers was appointed as a Director of the Board on 5 August 2021(2) Mickie Rosen was appointed as a Director of the Board on 4 March 2021
Audit and non-audit servicesDuring the year KPMG the Bankrsquos auditor has performed certain other services in addition to their statutory duties The Board has considered the non-audit services provided during the year by the auditor are compatible with and did not compromise the auditorrsquos independence requirements of the Corporations Act 2001 (Cth) for the following reasons
bull all non-audit services were subject to the corporate governance procedures adopted by the Bank and have been reviewed by the Audit Committee to ensure they do not impact the integrity and objectivity of the auditor and
bull the non-audit services provided do not undermine the general principles relating to auditorrsquos independence as set out in APES 110 Code of Ethics for Professional Accountants as they did not involve reviewing or auditing the auditorrsquos own work acting in a management or decision making capacity for the Bank or acting as an advocate for the Bank or jointly sharing risks and rewards
Details of the amounts paid to the auditor of the Bank KPMG and its related practices for audit and non-audit services provided during the year are set out below and in Note 57 Auditor Remuneration
Consolidated Bank
KPMG Australia2021
$0002020$000
2021$000
2020$000
Audit services
- Statutory audits and reviews of the financial reports 2172 1857 1826 1437
- Regulatory audits and reviews as required by regulatory authorities 704 762 611 667
Total audit services 2876 2619 2437 2104
Audit related services
- Other assurance services 373 402 154 143
Total audit related services 373 402 154 143
Non-audit services
- Taxation services 116 122 116 77
- Other 250 192 250 174
Total non-audit services 366 314 366 251
Details of the amounts paid to other auditor for audit services provided during the year in respect of Members Equity Bank Limited (ME Bank) acquisition are set out below and in Note 57 Auditor Remuneration
Consolidated Bank
Other auditor2021
$0002020$000
2021$000
2020$000
Audit services
- Statutory audits and reviews of the financial reports 202 - - -
Total audit services 202 - - -
1032021 Annual Report
For the year ended 31 August 2021DIRECTORSrsquo REPORT
Lead auditorrsquos independence declarationThe lead auditorrsquos independence declaration is set out on page 105 and forms part of the Directorsrsquo report for the year ended 31 August 2021
Director and management changesDirector changes during the year
bull On 8 December 2020 Michelle Tredenick retired as Director of the Board
bull Mickie Rosen was appointed as a Director of the Board on 4 March 2021
bull Deborah Kiers was appointed as a Director of the Board on 5 August 2021
bull On 5 August 2021 Kathleen Bailey-Lord retired as Director of the Board
Management changes during the year
bull On 31 January 2021 Lyn McGrath retired as Group Executive Retail Banking
bull On 27 April 2021 Martine Jager commenced as Group Executive Retail Banking
bull On 30 September 2021 Fiamma Morton retired as Group Executive Business Banking
bull Chris Screen commenced as Group Executive Business Banking on 1 October 2021
bull Adam McAnalen will transition to a new role in the Group when David Watts commences as Group Chief Risk Officer in early 2022
Management attestationThe Board has been provided with a joint written statement from the Grouprsquos Managing Director amp CEO and Chief Financial Officer amp Chief Operating Officer confirming that in their opinion the financial records of the Bank and the Group have been properly maintained and the accompanying financial statements and notes are in accordance with the Corporations Act 2001 (Cth) and comply with accounting standards and present a true and fair view in all material respects of the Bankrsquos and Grouprsquos financial position and performance as at and for the year ended 31 August 2021
The Directorsrsquo Declaration can be found on page 183 of the financial statements
Environmental regulationThe Grouprsquos operations are not subject to any significant environmental regulations under either Commonwealth or State legislation The Board confirms that the Group is not aware of any breach of environmental requirements
Subsequent eventsDividends have been determined after 31 August 2021 The financial effect of the dividends has not been brought to account in the financial statements for the year ended 31 August 2021 Further details with respect to the dividend amounts per share payment date and dividend reinvestment plan can be obtained from Note 24 Dividends of the consolidated financial statements
The evolution of the COVID-19 pandemic remains uncertain including the duration of the pandemic the severity of the downturn and the speed of the economic recovery BOQ has considered whether events subsequent to the reporting date have confirmed conditions existing as at reporting date and has not identified any COVID-19 related developments which would require adjustments to the amounts or disclosures contained in the consolidated financial statements Future economic conditions may differ to the assumptions and scenarios used in the consolidated financial statements the impact of which will be reflected in future reporting periods
No matters or circumstances have arisen since the end of the financial year and up until the date of this report which significantly affect the operations of the Bank the results of those operations or the state of affairs of the Bank in subsequent years
RoundingIn accordance with applicable financial reporting regulations and current industry practices amounts in this report have been rounded to the nearest one million dollars unless otherwise stated Any discrepancies between total and sums of components in tables contained in this report are due to rounding
Operating and Financial ReviewOur Operating and Financial Review is contained in pages 12 ndash 75 of this report
Signed in accordance with a resolution of the Directors
George Frazis Managing Director amp CEO 12 October 2021
Patrick Allaway Chairman 12 October 2021
104 Bank of Queensland Limited and its Controlled Entities
For the year ended 31 August 2021DIRECTORSrsquo REPORT
105 KPMG an Australian partnership and a member firm of the KPMG global organisation of independent member firms
affiliated with KPMG International Limited a private English company limited by guarantee All rights reserved The KPMG name and logo are trademarks used under license by the independent member firms of the KPMG global organisation Liability limited by a scheme approved under Professional Standards Legislation
Lead Auditorrsquos Independence Declaration under
Section 307C of the Corporations Act 2001
To the Directors of Bank of Queensland Limited
I declare that to the best of my knowledge and belief in relation to the audit of Bank of Queensland Limited for the financial year ended 31 August 2021 there have been
i no contraventions of the auditor independence requirements as set out in the Corporations Act 2001 in relation to the audit and
ii no contraventions of any applicable code of professional conduct in relation to the audit
KPM_INI_01
KPMG Shaun Kendrigan Partner Sydney 12 October 2021
LEAD AUDITORrsquoS INDEPENDENCE DECLARATION UNDER SECTION 307C OF THE CORPORATIONS ACT 2001
105 KPMG an Australian partnership and a member firm of the KPMG global organisation of independent member firms
affiliated with KPMG International Limited a private English company limited by guarantee All rights reserved The KPMG name and logo are trademarks used under license by the independent member firms of the KPMG global organisation Liability limited by a scheme approved under Professional Standards Legislation
Lead Auditorrsquos Independence Declaration under
Section 307C of the Corporations Act 2001
To the Directors of Bank of Queensland Limited
I declare that to the best of my knowledge and belief in relation to the audit of Bank of Queensland Limited for the financial year ended 31 August 2021 there have been
i no contraventions of the auditor independence requirements as set out in the Corporations Act 2001 in relation to the audit and
ii no contraventions of any applicable code of professional conduct in relation to the audit
KPM_INI_01
KPMG Shaun Kendrigan Partner Sydney 12 October 2021
1052021 Annual Report
2021 FINANCIAL STATEMENTS
Consolidated Bank
Note2021
$m2020
$m2021
$m2020
$m
Interest income
Effective interest income 21 1576 1676 1367 1597
Other 21 112 120 117 134
Interest expense 21 (560) (810) (705) (1008)
Net interest income 21 1128 986 779 723
Other operating income 21 118 103 228 220
Net banking operating income 1246 1089 1007 943
Net insurance operating income 21 7 11 - -
Total operating income before impairment and operating expenses 21 1253 1100 1007 943
Expenses 22 (736) (752) (641) (705)
Impairment gain (loss) on loans and advances 33 21 (175) 13 (116)
Profit before income tax 538 173 379 122
Income tax expense 23 (169) (58) (115) (41)
Profit for the year 369 115 264 81
Profit attributable to
Equity holders of the parent 368 115 264 81
Other equity instruments holders 1 - - -
Profit for the year 369 115 264 81
Earnings per share (EPS) (1)
Basic EPS - Ordinary shares (cents) 26 670 254
Diluted EPS - Ordinary shares (cents) 26 626 244
(1) The basic and diluted earnings per share for August 2020 have been adjusted for the effects of the Grouprsquos capital raise that occurred in March 2021 The basic and diluted earnings per share for August 2021 have been adjusted for the effects of other equity instruments assumed on ME Bank acquisition (refer Note 310(B))
The Income Statements should be read in conjunction with the accompanying notes
108 Bank of Queensland Limited and its Controlled Entities
For the year ended 31 August 2021INCOME STATEMENTS
Financial Statements 108 | Signed Reports 183 | Shareholding Details 195 | Glossary 201
Consolidated Bank
2021$m
2020 $m
2021 $m
2020 $m
Profit for the year 369 115 264 81
Other comprehensive income net of income tax
Items that may be reclassified subsequently to profit or loss
Cash flow hedges
Net movement taken to equity 53 3 53 4
Net movement transferred to profit or loss 19 20 19 20
Debt instruments at fair value through other comprehensive income (FVOCI)
Net change in fair value 35 - 35 -
Net movement transferred to profit or loss (12) (12) (12) (12)
Other comprehensive income net of income tax 95 11 95 12
Total comprehensive income for the year 464 126 359 93
Total comprehensive income attributable to
Equity holders of the parent 463 126 359 93
Other equity instruments holders 1 - - -
Total comprehensive income for the year 464 126 359 93
The Statements of Comprehensive Income should be read in conjunction with the accompanying notes
1092021 Annual Report
For the year ended 31 August 2021STATEMENTS OF COMPREHENSIVE INCOMESTATEMENTS OF COMPREHENSIVE INCOME
Financial Statements 108 | Signed Reports 183 | Shareholding Details 195 | Glossary 201
Consolidated Bank
Note2021
$m2020
$m2021
$m2020
$m
ASSETS
Cash and cash equivalents 31 2563 1353 1373 835
Due from other financial institutions 827 860 708 826
Derivative financial assets 38 137 154 86 101
Financial assets at fair value through profit or loss (FVTPL) 32 1087 1854 1087 1854
Debt instruments at FVOCI 32 9701 4530 5548 4530
Equity instruments at FVOCI 32 9 6 6 6
Debt instruments at amortised cost 32 - - 7699 7662
Loans and advances 33 75437 46674 44827 41520
Other assets 190 148 1154 1031
Current tax assets - 2 - 2
Property plant and equipment 198 148 120 142
Assets held for sale 55 43 - 30 -
Shares in controlled entities 55 - - 1910 552
Deferred tax assets 23 50 122 85 113
Intangible assets 41 1180 908 915 838
Investments in joint arrangements and associates 56 10 13 - -
Total assets 91432 56772 65548 60012
LIABILITIES
Due to other financial institutions - accounts payable at call 273 296 273 296
Deposits 34 65902 39593 43569 39810
Derivative financial liabilities 38 653 803 620 799
Accounts payable and other liabilities 575 458 360 385
Current tax liabilities 28 - 24 -
Liabilities held for sale 55 17 - - -
Provisions 42 64 47 43 38
Amounts due to controlled entities - - 6241 6707
Insurance policy liabilities - 5 - -
Borrowings 35 17723 11339 8806 7914
Total liabilities 85235 52541 59936 55949
Net assets 6197 4231 5612 4063
EQUITY
Issued capital 5213 3869 5224 3875
Other equity instruments 310 314 - - -
Reserves 376 184 383 194
Retained profits 294 178 5 (6)
Total equity 6197 4231 5612 4063
The Balance Sheets should be read in conjunction with the accompanying notes
110 Bank of Queensland Limited and its Controlled Entities
As at 31 August 2021BALANCE SHEETSBALANCE SHEETS
Financial Statements 108 | Signed Reports 183 | Shareholding Details 195 | Glossary 201
CONSOLIDATED
Issued capital
$m
Other equity
instruments $m
Employee benefits reserve
$m
Share Revaluation
Reserve $m
Equity reserve
for credit losses
$m
Cash flow hedge
reserve $m
FVOCI reserve
$m
Profit reserve
$m
Retained profits
$m
Total equity
$m
YEAR ENDED 31 AUGUST 2021
Balance as at 1 September 2020 3869 - 30 - 63 (142) 33 200 178 4231
Acquisition of ME Bank - 315 - - - - - - - 315
Total comprehensive income for the year
Profit for the year - - - - - - - - 369 369
Transfers to profit reserve - - - - - - - 264 (264) -
Other comprehensive income net of income tax
Cash flow hedges
Net movement to equity - - - - - 53 - - - 53
Net movement transferred to profit or loss - - - - - 19 - - - 19
Debt instruments at FVOCI
Net change in fair value - - - - - - 35 - - 35
Net movement transferred to profit or loss - - - - - - (12) - - (12)
Transfer to equity reserve for credit losses - - - - (11) - - - 11 -
Total other comprehensive income (expense) - - - - (11) 72 23 - 11 95
Total comprehensive income (expense) for the year - - - - (11) 72 23 264 116 464
Transactions with owners recorded directly in equity contributions by and distributions to owners
Institutional share placement (1) 350 - - - - - - - - 350
Institutional entitlement offer (2) 321 - - - - - - - - 321
Retail entitlement offer (3) 681 - - - - - - - - 681
Issues of ordinary shares (4) 1 - - - - - - - - 1
Dividend reinvestment plan 19 - - - - - - - - 19
Dividends to shareholders - - - - - - - (164) - (164)
Cost of capital issuance (23) - - - - - - - - (23)
Equity settled transactions - - 5 - - - - - - 5
Treasury shares (5) (5) - - 3 - - - - - (2)
Other equity instruments distributions paid - (1) - - - - - - - (1)
Total contributions by and distributions to owners 1344 (1) 5 3 - - - (164) - 1187
Balance at the end of the year 5213 314 35 3 52 (70) 56 300 294 6197
(1) On 23 February 2021 the Bank completed an institutional placement of new fully paid ordinary shares at the offer price of $735 per share The shares were issued on 3 March 2021(2) On 23 February 2021 the Bank completed an underwritten 1 for 334 accelerated pro-rata non-renounceable institutional entitlement offer at the offer price of $735 per
share The shares were issued on 3 March 2021(3) On 15 March 2021 the Bank completed an underwritten 1 for 334 accelerated pro-rata non-renounceable retail entitlement offer at the offer price of $735 per share The
shares were issued on 17 March 2021(4) On 9 November 2020 130000 ordinary shares were issued at $637 to the trustee of the Bank of Queensland Limited Employee Share Plans Trust to satisfy the issue of
shares under the BOQ Employee ThankQ Plan(5) Treasury shares represents the value of shares held by a subsidiary that the Bank is required to include in the Consolidated Entityrsquos financial statements The revaluation of
treasury shares is netted off in equity
The Statements of Changes in Equity should be read in conjunction with the accompanying notes
1112021 Annual Report
For the year ended 31 August 2021STATEMENTS OF CHANGES IN EQUITYSTATEMENTS OF CHANGES IN EQUITY
Financial Statements 108 | Signed Reports 183 | Shareholding Details 195 | Glossary 201
CONSOLIDATED
Issued capital
$m
Employee benefits reserve
$m
Equity reserve
for credit losses
$m
Cash flow
hedge reserve
$m
FVOCI reserve
$m
Profit reserve
$m
Retained profits
$m
Total equity
$m
YEAR ENDED 31 AUGUST 2020
Balance at beginning of the year 3497 26 62 (165) 45 245 149 3859
Change on adoption of new accounting standards (1) - - - - - - (4) (4)
Restated balance at beginning of the year 3497 26 62 (165) 45 245 145 3855
Total comprehensive income for the year
Profit for the year - - - - - - 115 115
Transfers to profit reserve - - - - - 81 (81) -
Other comprehensive income net of income tax
Cash flow hedges
Net movement to equity - - - 3 - - - 3
Net movement transferred to profit or loss - - - 20 - - - 20
Debt instruments at FVOCI
Net change in fair value - - - - - - - -
Net movement transferred to profit or loss - - - - (12) - - (12)
Equity instruments at FVOCI
Net change in fair value - - - - - - - -
Transfer to equity reserve for credit losses - - 1 - - - (1) -
Total other comprehensive income (expense) - - 1 23 (12) - (1) 11
Total comprehensive income (expense) for the year - - 1 23 (12) 81 33 126
Transactions with owners recorded directly in equity contributions by and distributions to owners
Institutional share placement (2) 250 - - - - - - 250
Dividend reinvestment plan 31 - - - - - - 31
Dividends to shareholders - - - - - (126) - (126)
Issues of ordinary shares (3) 4 - - - - - - 4
Cost of capital issue (3) - - - - - - (3)
Share purchase plan (4) 90 - - - - - - 90
Equity settled transactions - 4 - - - - - 4
Total contributions by and distributions to owners 372 4 - - - (126) - 250
Balance at the end of the year 3869 30 63 (142) 33 200 178 4231
(1) The August 2020 financial results reflect the adoption of AASB 16 on 1 September 2019 (2) On 26 November 2019 the Bank completed a capital raising by way of institutional share placement of new fully paid ordinary shares at an issue price of $778 per share The
shares were issued on 29 November 2019(3) On 29 November 2019 440000 ordinary shares were issued at $833 to the trustee of the Bank of Queensland Limited Employee Share Plans Trust to satisfy the exercise of
award rights and issue of shares under the Award Rights Plans and the issue of shares under the BOQ Restricted Share Plan and the BOQ Employee Share Plan(4) On 30 December 2019 the Bank completed the share purchase plan of new fully paid ordinary shares at an issue price of $727 per share The shares were issued on 2 January 2020
The Statements of Changes in Equity should be read in conjunction with the accompanying notes
112 Bank of Queensland Limited and its Controlled Entities
For the year ended 31 August 2021STATEMENTS OF CHANGES IN EQUITY
Financial Statements 108 | Signed Reports 183 | Shareholding Details 195 | Glossary 201
BANK
Issued capital
$m
Employee benefits reserve
$m
Equity reserve
for credit losses
$m
Cash flow
hedge reserve
$m
FVOCI reserve
$m
Profit reserve
$m
Retained profits
$m
Total equity
$m
YEAR ENDED 31 AUGUST 2021
Balance as at 1 September 2020 3875 30 64 (133) 33 200 (6) 4063
Total comprehensive income for the year
Profit for the year - - - - - - 264 264
Transfers to profit reserve - - - - - 264 (264) -
Other comprehensive income net of income tax
Cash flow hedges
Net movement to equity - - - 53 - - - 53
Net movement transferred to profit or loss - - - 19 - - - 19
Debt instruments at FVOCI
Net change in fair value - - - - 35 - - 35
Net movement transferred to profit or loss - - - - (12) - - (12)
Transfer to equity reserve for credit losses - - (11) - - - 11 -
Total other comprehensive income (expense) - - (11) 72 23 - 11 95
Total comprehensive income (expense) for the year - - (11) 72 23 264 11 359
Transactions with owners recorded directly in equity contributions by and distributions to owners
Institutional share placement (1) 350 - - - - - - 350
Institutional entitlement offer (2) 321 - - - - - - 321
Retail entitlement offer (3) 681 - - - - - - 681
Issues of ordinary shares (4) 1 - - - - - - 1
Dividend reinvestment plan 19 - - - - - - 19
Dividends to shareholders - - - - - (164) - (164)
Cost of capital issue (23) - - - - - - (23)
Equity settled transactions - 5 - - - - - 5
Total contributions by and distributions to owners 1349 5 - - - (164) - 1190
Balance at the end of the year 5224 35 53 (61) 56 300 5 5612
(1) On 23 February 2021 the Bank completed an institutional placement offer at the offer price of $735 per share The shares were issued on 3 March 2021(2) On 23 February 2021 the Bank completed an underwritten 1 for 334 accelerated pro-rata non-renounceable institutional entitlement offer at the offer price of $735 per
share The shares were issued on 3 March 2021(3) On 15 March 2021 the Bank completed an underwritten 1 for 334 accelerated pro-rata non-renounceable retail entitlement offer at the offer price of $735 per share The
shares were issued on 17 March 2021(4) On 9 November 2020 130000 ordinary shares were issued at $637 to the trustee of the Bank of Queensland Limited Employee Share Plans Trust to satisfy the issue of
shares under the BOQ Employee ThankQ Plan
The Statements of Changes in Equity should be read in conjunction with the accompanying notes
1132021 Annual Report
For the year ended 31 August 2021STATEMENTS OF CHANGES IN EQUITY
Financial Statements 108 | Signed Reports 183 | Shareholding Details 195 | Glossary 201
BANK
Issued capital
$m
Employee benefits reserve
$m
Equity reserve
for credit losses
$m
Cash flow
hedge reserve
$m
FVOCI reserve
$m
Profit reserve
$m
Retained profits
$m
Total equity
$m
YEAR ENDED 31 AUGUST 2020
Balance at beginning of the year 3503 26 63 (157) 45 245 (1) 3724
Change on adoption of new accounting standards (1) - - - - - - (4) (4)
Restated balance at beginning of the year 3503 26 63 (157) 45 245 (5) 3720
Total comprehensive income for the year
Profit for the year - - - - - - 81 81
Transfers to profit reserve - - - - - 81 (81) -
Other comprehensive income net of income tax
Cash flow hedges
Net movement to equity - - - 4 - - - 4
Net movement transferred to profit or loss - - - 20 - - - 20
Debt instruments at FVOCI
Net change in fair value - - - - - - - -
Net movement transferred to profit or loss - - - - (12) - - (12)
Equity instruments at FVOCI
Net change in fair value - - - - - - - -
Transfer to equity reserve for credit losses - - 1 - - - (1) -
Total other comprehensive income (expense) - - 1 24 (12) - (1) 12
Total comprehensive income (expense) for the year - - 1 24 (12) 81 (1) 93
Transactions with owners recorded directly in equity contributions by and distributions to owners
Institutional share placement (2) 250 - - - - - - 250
Dividend reinvestment plan 31 - - - - - - 31
Dividends to shareholders - - - - - (126) - (126)
Issues of ordinary shares (3) 4 - - - - - - 4
Cost of capital issue (3) - - - - - - (3)
Share purchase plan (4) 90 - - - - - - 90
Equity settled transactions - 4 - - - - - 4
Total contributions by and distributions to owners 372 4 - - - (126) - 250
Balance at the end of the year 3875 30 64 (133) 33 200 (6) 4063
(1) The August 2020 financial results reflect the adoption of AASB 16 on 1 September 2019 (2) On 26 November 2019 the Bank completed a capital raising by way of institutional share placement of new fully paid ordinary shares at an issue price of $778 per share
The shares were issued on 29 November 2019(3) On 29 November 2019 440000 ordinary shares were issued at $833 to the trustee of the Bank of Queensland Limited Employee Share Plans Trust to satisfy the exercise
of award rights and issue of shares under the Award Rights Plans and the issue of shares under the BOQ Restricted Share Plan and the BOQ Employee Share Plan(4) On 30 December 2019 the Bank completed the share purchase plan of new fully paid ordinary shares at an issue price of $727 per share
The shares were issued on 2 January 2020
The Statements of Changes in Equity should be read in conjunction with the accompanying notes
114 Bank of Queensland Limited and its Controlled Entities
For the year ended 31 August 2021STATEMENTS OF CHANGES IN EQUITY
Financial Statements 108 | Signed Reports 183 | Shareholding Details 195 | Glossary 201
Consolidated Bank
Note2021
$m2020
$m2021
$m2020
$m
CASH FLOWS FROM OPERATING ACTIVITIES
Interest received 1663 1694 1387 1537
Fees and other income received 127 125 205 206
Interest paid (569) (733) (712) (925)
Cash paid to suppliers and employees (622) (577) (531) (508)
Income tax paid (100) (89) (91) (87)
499 420 258 223
Increase (decrease) in operating assets
Loans and advances at amortised cost (3070) (874) (3443) (809)
Other financial assets (1001) (272) (173) (309)
Increase in operating liabilities
Deposits 3953 1318 3738 1330
Net cash inflow (outflow) from operating activities 31 381 592 380 435
CASH FLOWS FROM INVESTING ACTIVITIES
Acquisition of ME Bank net of cash acquired 55 (746) - (1388) -
Payments for property plant and equipment (9) (9) (9) (9)
Proceeds from sale of property plant and equipment 6 6 - 1
Payments for intangible assets 41 (119) (102) (115) (101)
Proceeds (payments) for investments in joint arrangements 2 - - -
Dividends received from controlled entities - - 4 4
Net cash inflow (outflow) from investing activities (866) (105) (1508) (105)
CASH FLOWS FROM FINANCING ACTIVITIES
Proceeds from borrowings 35 3628 2583 1844 2205
Repayments of borrowings 35 (3063) (3193) (937) (1625)
Net movement in other financing activities - - (378) (962)
Proceeds for issue of ordinary shares 1329 336 1329 336
Payments for treasury shares (7) (1) (7) (1)
Other equity instruments distribution paid (1) - - -
Dividends paid (145) (95) (145) (95)
Payment of lease liabilities (42) (38) (40) (38)
Net cash inflow (outflow) from financing activities 1699 (408) 1666 (180)
Net increase (decrease) in cash and cash equivalents 1214 79 538 150
Cash and cash equivalents at beginning of year 1353 1274 835 685
Cash and cash equivalents at end of year 31 2567 1353 1373 835
Cash and cash equivalents included in assets held for sale 55 (4) - - -
Cash and cash equivalents as presented in the Balance Sheets 2563 1353 1373 835
The Statements of Cash Flows should be read in conjunction with the accompanying notes
1152021 Annual Report
For the year ended 31 August 2021STATEMENTS OF CASH FLOWS
Financial Statements 108 | Signed Reports 183 | Shareholding Details 195 | Glossary 201
Page
Note 1 Basis of preparation 117
11 Reporting entity 117
12 Basis of preparation 117
13 Use of estimates and judgements 117
14 COVID-19 financial reporting considerations 118
15 New Australian accounting standards 119
Note 2 Financial performance 120
21 Operating income 120
22 Expenses 121
23 Income tax expense and deferred tax 122
24 Dividends 125
25 Operating segments 126
26 Earnings per share 128
Note 3 Capital and balance sheet management 129
31 Cash and cash equivalents 129
32 Financial assets and liabilities 130
33 Loans and advances 132
34 Deposits 141
35 Borrowings 142
36 Risk management 144
37 Fair value of financial instruments 154
38 Derivative financial instruments and hedge accounting 157
39 Capital management 163
310 Capital and reserves 164
Note 4 Other assets and liabilities 166
41 Intangible assets 166
42 Provisions 169
Note 5 Other notes 170
51 Employee benefits 170
52 Commitments 173
53 Contingent liabilities 173
54 Related parties information 173
55 Controlled entities 175
56 Investments in joint arrangements and associates 179
57 Auditorrsquos remuneration 180
58 Events subsequent to balance date 180
59 Significant accounting policies 181
116 Bank of Queensland Limited and its Controlled Entities
For the year ended 31 August 2021NOTES TO THE FINANCIAL STATEMENTS
Financial Statements 108 | Signed Reports 183 | Shareholding Details 195 | Glossary 201
NOTE 1 BASIS OF PREPARATION11 REPORTING ENTITYThe Bank of Queensland Limited (the Bank or BOQ) is a for-profit company domiciled in Australia Its registered office is Level 6 100 Skyring Terrace Newstead QLD 4006
The consolidated financial statements of the Bank for the financial year ended 31 August 2021 comprise the Consolidated Entity (or the Group) being the Bank and its controlled entities and the Consolidated Entityrsquos interest in equity accounting investments The principal activity of the Group is the provision of financial services to the community
12 BASIS OF PREPARATION(A) Statement of complianceThese general purpose financial statements have been prepared in accordance with Australian Accounting Standards and interpretations issued by the Australian Accounting Standards Board (AASB) and the Corporations Act 2001 (Cth) The consolidated financial statements and notes thereto also comply with International Financial Reporting Standards (IFRS) as issued by the International Accounting Standards Board (IASB) The consolidated financial statements were authorised for issue by the Directors on 12 October 2021
(B) Basis of measurementThe consolidated financial statements are prepared on a historical cost basis with the exception of the following assets and liabilities which are stated at their fair value
bull Derivative financial instruments
bull Financial instruments at FVTPL and
bull Financial instruments at FVOCI
(C) Functional and presentation currencyThe consolidated financial statements are presented in Australian dollars which is the Bankrsquos functional currency
(D) RoundingThe Group is of a kind referred to in ASIC Corporations Instrument 2016191 dated 24 March 2016 and in accordance with that instrument amounts in the consolidated financial statements have been rounded to the nearest million dollars unless otherwise stated
13 USE OF ESTIMATES AND JUDGEMENTS The preparation of a financial report in conformity with Australian Accounting Standards requires management to make judgements estimates and assumptions that affect the application of accounting policies and reported amounts of assets liabilities income and expenses These estimates and associated assumptions are based on historical experience and various other factors that are believed to be reasonable under the circumstances the results of which form the basis of making the judgements about carrying values of assets and liabilities that are not readily apparent from other sources Actual results may differ from these estimates These accounting policies have been consistently applied throughout the Group
The estimates and underlying assumptions are reviewed on an ongoing basis Revisions to accounting estimates are recognised in the period in which the estimates are revised if the revision only affects that period or in the period of the revision and future periods if the revision affects both current and future periods
Information about significant areas of estimation uncertainty and critical judgements in applying accounting policies that have the most significant effect on the amounts recognised in the financial statements are described below
bull Loans and advances - Expected credit losses (ECL) - Note 33
bull Financial instruments ndash Notes 32 and 37
bull Carrying value of goodwill and other intangible assets ndashNote 41
bull Provisions - Note 42 and
bull Business combinations - Note 55
1172021 Annual Report
For the year ended 31 August 2021NOTES TO THE FINANCIAL STATEMENTS
Financial Statements 108 | Signed Reports 183 | Shareholding Details 195 | Glossary 201
14 COVID-19 FINANCIAL REPORTING CONSIDERATIONSBackgroundThe COVID-19 pandemic together with measures implemented to contain the virus continues to create uncertainty for the Australian economy Although Gross Domestic Product (GDP) property prices and unemployment have been less severe than anticipated in FY20 we have seen on-going COVID-19 lockdowns across several states To mitigate the economic impact of the COVID-19 pandemic the Australian Banking Association (ABA) Council proposed that the banking industry offer further relief packages to small businesses and home loan customers that have been significantly impacted by current or recent lockdowns BOQ continues to support customers by offering Business Banking repayment deferrals Everyday Banking support and Home Loan support as proposed by the ABA
The Group continues to carefully consider the impact of COVID-19 in preparing its financial statements for the year ended 31 August 2021 including the increased estimation uncertainty associated with
bull Disruption to businesses as a result of continuing lockdowns
bull The extent and duration of the expected economic downturn including forecasts for growth unemployment and property prices and
bull The effect of government incentives and banking relief packages to support businesses and consumers through this economic downturn
The key impacts on the consolidated financial statements including the use of critical estimates and judgements are as follows
Provisions for impairmentIn assessing forecast conditions the Group has incorporated the effects of COVID-19 and government support measures based on reasonable and supportable information at the reporting date Model updates including a complete review of the overlays and adjustments in place as well as updated scenarios and scenario weightings to cater for economic uncertainties have been implemented in 2H21 Forward looking adjustments have been determined based on a probability weighted range of plausible economic and industry stress scenarios taking into account the mitigating impacts of government and industry assistance packages including loan repayment deferrals As the economy showed signs of a rebound and the economic outlook improved since the outbreak of COVID-19 this allowed for the release of some provisions raised in prior periods while maintaining a prudent provision coverage to cater for the ongoing uncertainty of the pandemic In line with guidance from APRA the Group has not treated the period of repayment deferrals offered as support for affected customers as a period of arrears nor an automatic significant increase in credit risk Refer to Note 33
GoodwillThe Group tested goodwill for impairment updating the assumptions and cash flow forecasts where necessary to reflect the potential impact of COVID-19 No impairments were required to be recognised for goodwill held across the Group as at 31 August 2021 Management judgement is required to determine the assumptions underpinning value-in-use calculations and changes in these key assumptions could have an adverse impact on the carrying value of goodwill Refer to Note 41
Hedge AccountingThe Group has considered the continued impact of COVID-19 on its existing hedges and whether they continue to meet the criteria for Hedge Accounting Hedged future cash flows including forecast rollovers of variable rate assets and liabilities remain highly probable Refer to Note 38
BorrowingsThe Term Funding Facility (TFF) was announced by the Reserve Bank of Australia (RBA) in March 2020 to provide three-year funding to ADIs as part of a package of measures to support the Australian economy The facility initially provided three-year funding to ADIs through repurchase transactions at a fixed pricing of 025 per cent per annum From 4 November 2020 the interest rate on new drawings was lowered to 01 per cent per annum As at 31 August 2021 $3 billion of the group facility has been drawn
The TFF is accounted for as borrowings with the securities pledged as collateral There are no substantive conditions attached to the ongoing use of the TFF and it is not linked to the provision of specific loans to customers However as the funding is in effect a below market interest loan from a Government entity the loan is classified as a Government Grant under AASB 120 Accounting for Government grants and Disclosure of Government Assistance Grants related to income can be deducted in reporting the related expense and as such the net interest expense will reflect the TFF reduced cost of borrowing Refer to Note 35
118 Bank of Queensland Limited and its Controlled Entities
For the year ended 31 August 2021NOTES TO THE FINANCIAL STATEMENTS
Financial Statements 108 | Signed Reports 183 | Shareholding Details 195 | Glossary 201
14 COVID-19 FINANCIAL REPORTING CONSIDERATIONS (CONTINUED)
Events subsequent to reporting dateThe evolution of the COVID-19 pandemic remains uncertain including the duration of the pandemic the severity of the downturn and the speed of the economic recovery BOQ has considered whether events subsequent to the reporting date have confirmed conditions existing as at reporting date and has not identified any COVID-19 related developments which would require adjustments to the amounts or disclosures contained in the consolidated financial statements Future economic conditions may differ to the assumptions and scenarios used in the consolidated financial statements the impact of which will be reflected in future reporting periods
15 NEW AUSTRALIAN ACCOUNTING STANDARDS
International Financial Reporting Standards Interpretations Committee final agenda decisions not yet adopted
In April 2021 the IFRS Interpretations Committee (IFRIC) published its second agenda decision in relation to Software as a Service (SaaS) cloud computing arrangements The decision discusses whether configuration or customisation expenditure relating to SaaS arrangements is able to be recognised as an intangible asset and if not over what time period the expenditure is expensed Specifically IFRIC stated that in most instances configuration and customisation costs incurred in implementing SaaS solutions will be treated as an operating expense
The Grouprsquos accounting policy has historically been to capitalise costs related to SaaS arrangements as intangible assets The adoption of the IFRIC decision could result in a reclassification of these intangible assets to either a prepaid asset on the Balance Sheet or recognition as an expense in the Income Statement impacting both the current and prior periods presented For ME Bank assets the adoption could result in an adjustment to the fair value of assets acquired and a corresponding increase to goodwill as part of the Grouprsquos acquisition accounting (refer Note 55 (C))
The Group has over 110 software assets and 40 software assets under construction (AUC) Both the scale and complexity of assessing such a large number of complex projects is such that BOQ has been unable to adopt this IFRIC agenda decision in advance of the year-end reporting date As such the existing policy of capitalising configuration and customisation costs continues to apply as at 31 August 2021
The complexity of the assessment also means that the impact of the IFRIC decision cannot be reasonably estimated at the reporting date At 31 August 2021 software assets with net book value of $188 million were subject to the detailed assessment BOQ will adopt the IFRIC decision in the HY2022 Consolidated Interim Report and restate prior period comparatives
1192021 Annual Report
For the year ended 31 August 2021NOTES TO THE FINANCIAL STATEMENTS
Financial Statements 108 | Signed Reports 183 | Shareholding Details 195 | Glossary 201
NOTE 2 FINANCIAL PERFORMANCE 21 OPERATING INCOME
Consolidated Bank
2021 $m
2020 $m
2021 $m
2020 $m
INTEREST INCOME
Effective interest income 1576 1676 1367 1597
Other Securities at fair value 112 120 117 134
Total interest income 1688 1796 1484 1731
INTEREST EXPENSE
Retail deposits (206) (388) (192) (388)
Wholesale deposits and borrowings (351) (419) (510) (617)
Lease liabilities (3) (3) (3) (3)
Total interest expense (560) (810) (705) (1008)
Net interest income 1128 986 779 723
INCOME FROM OPERATING ACTIVITIES
Customer fees and charges (1) 62 61 62 63
Share of fee revenue paid to owner-managed branches (6) (6) (6) (6)
Commissions 31 34 12 12
Foreign exchange income ndash customer based 13 11 13 12
Net profit (loss) on sale of property plant and equipment 5 4 - -
Net (loss) income from financial instruments and derivatives at fair value (4) (10) (5) (9)
Securitisation income - - 111 119
Dividend income - - 4 4
Management fees ndash controlled entities - - 29 21
Other income 17 9 8 4
Other operating income 118 103 228 220
INCOME FROM INSURANCE ACTIVITIES
Premiums from insurance contracts 42 50 - -
Investment revenue - 1 - -
Claims and policyholder liability expense from insurance contracts (35) (40) - -
Net insurance operating income 7 11 - -
Total operating income 1253 1100 1007 943
(1) Customer charges on lending banking and leasing products
Interest income and expenseInterest income and expense for all interest bearing financial instruments is recognised in the profit or loss using the effective interest rates of the financial assets or financial liabilities to which they relate
Interest income on finance lease receivables is recognised progressively over the life of the lease reflecting a constant periodic rate of return on the net investment
Other operating incomeOther operating income and expenses that are considered an integral part of the effective interest rate on a financial instrument are included in the measurement of the effective interest rate
Non-yield related application and activation lending fee revenue is recognised over the contract period in line with the performance obligation delivered to the customers Customer service fees that represent the recoupment of the costs of providing the service are recognised when the service is provided Commissions are recognised as income when performance obligations in respect of those commissions have been satisfied
Dividends are recognised when control of a right to receive consideration is established
120 Bank of Queensland Limited and its Controlled Entities
For the year ended 31 August 2021NOTES TO THE FINANCIAL STATEMENTS
Financial Statements 108 | Signed Reports 183 | Shareholding Details 195 | Glossary 201
22 EXPENSESConsolidated Bank
Note2021
$m2020
$m2021
$m2020
$m
OPERATING EXPENSES
Advertising 33 28 19 16
Commissions to owner-managed branches 4 5 4 4
Communications and postage 20 17 16 17
Printing and stationery 4 3 3 3
Processing costs 14 13 14 13
Impairment - 41 - 41
Other 36 43 32 48
111 150 88 142
ADMINISTRATIVE EXPENSES
Professional fees 38 24 32 21
Directorsrsquo fees 2 2 2 2
Other 17 9 23 15
57 35 57 38
IT EXPENSES
Data processing 121 126 112 120
Amortisation ndash computer software 41 47 77 36 71
Depreciation ndash IT equipment 1 1 1 1
169 204 149 192
OCCUPANCY EXPENSES
Depreciation - ROU assets and lease expenses 29 28 26 26
Depreciation ndash property plant and equipment 9 10 9 10
Other 3 2 3 2
41 40 38 38
EMPLOYEE EXPENSES
Salaries wages and superannuation contributions 313 289 272 265
Payroll tax 16 14 14 12
Equity settled transactions 8 9 7 8
Other 17 6 14 6
354 318 307 291
OTHER
Amortisation ndash acquired intangibles 41 4 5 2 4
4 5 2 4
Total expenses 736 752 641 705
1212021 Annual Report
For the year ended 31 August 2021NOTES TO THE FINANCIAL STATEMENTS
Financial Statements 108 | Signed Reports 183 | Shareholding Details 195 | Glossary 201
23 INCOME TAX EXPENSE AND DEFERRED TAXIncome tax expenseThe major components of income tax expense along with a reconciliation between pre-tax profit and tax expense are detailed below
Consolidated Bank
2021 $m
2020 $m
2021 $m
2020 $m
CURRENT TAX EXPENSE
Current year 123 103 113 83
Adjustments for prior years (2) (8) (7) (6)
121 95 106 77
DEFERRED TAX EXPENSE
Origination and reversal of temporary differences 48 (37) 9 (36)
Total income tax expense 169 58 115 41
DEFERRED TAX RECOGNISED IN EQUITY
Cash flow hedge reserve 20 6 19 7
Retained profits - (2) - (2)
Other 10 (4) 10 (4)
30 - 29 1
Numerical reconciliations between tax expense and pre-tax profit
Profit before tax 538 173 379 122
Income tax using the domestic corporate tax rate of 30 (2020 30) 161 52 114 37
Increase in income tax expense due to
Non-deductible expenses 10 7 9 6
Decrease in income tax expense due to
Other (1) (2) (1) (8) (2)
Income tax expense on pre-tax net profit 169 58 115 41
(1) In the Bank this includes a prior period adjustment and the impact of dividends received from subsidiary members in the tax consolidated group which are both eliminated at a group level
122 Bank of Queensland Limited and its Controlled Entities
For the year ended 31 August 2021NOTES TO THE FINANCIAL STATEMENTS
Financial Statements 108 | Signed Reports 183 | Shareholding Details 195 | Glossary 201
23 INCOME TAX EXPENSE AND DEFERRED TAX (CONTINUED)Recognised deferred tax assets and liabilitiesDeferred tax assets and liabilities are attributable to the following
Assets Liabilities Net
CONSOLIDATED2021
$m2020
$m2021
$m2020
$m2021
$m2020
$m
Accruals 4 3 - - 4 3
Capitalised expenditure - - (5) (6) (5) (6)
Provisions for impairment 119 111 - - 119 111
Other provisions 30 16 - - 30 16
Equity reserves 6 36 - - 6 36
ROU Asset and Lease Liability 41 47 (32) (38) 9 9
Lease financing relating to lessor activities - - (87) (45) (87) (45)
Intangibles 4 - (18) (2) (14) (2)
Consolidation - Taxation of Financial Arrangements (TOFA) (1) - - (22) - (22) -
Other 13 2 (3) (2) 10 -
Total tax assets (liabilities) (2) 217 215 (167) (93) 50 122
BANK
Accruals 3 2 - - 3 2
Capitalised expenditure - - (1) (2) (1) (2)
Provisions for impairment 66 76 - - 66 76
Other provisions 19 14 - - 19 14
Equity reserves 2 31 - - 2 31
ROU Asset and Lease Liability 41 47 (32) (38) 9 9
Lease financing relating to lessor activities - - (18) (18) (18) (18)
Other 8 2 (3) (1) 5 1
Total tax assets (liabilities) 139 172 (54) (59) 85 113
Unrecognised deferred tax assets Deferred tax assets have not been brought to account for the following items as realisation of the benefit is not regarded as probable
2021$m
2020$m
Gross income tax losses (3) 23 24
Gross capital gains tax losses 50 50
(1) The provisional business combination balances relating to the acquisition of ME Bank include a transitional deferred tax liability that will unwind equally across the current and next three years
(2) The St Andrewrsquos Group is classified as held for sale at the reporting date of 31 August 2021 refer to Note 55(E) for further information Net deferred tax assets of $1 million have been reclassified as held for sale The above table excludes these net deferred tax assets
(3) Income tax losses are subject to utilisation over an expected 15-20 year period
1232021 Annual Report
For the year ended 31 August 2021NOTES TO THE FINANCIAL STATEMENTS
Financial Statements 108 | Signed Reports 183 | Shareholding Details 195 | Glossary 201
Accounting for income taxIncome tax expense comprises current and deferred tax Income tax is recognised in profit or loss in the Income Statement except to the extent that it relates to items recognised directly in equity or other comprehensive income
Current tax is the expected tax payable receivable on the taxable income loss for the year and any adjustment to the tax payable receivable in respect of previous years It is measured using tax rates enacted or substantially enacted at the reporting date
Deferred tax is recognised in respect of temporary differences between the carrying amounts of assets and liabilities for financial reporting purposes and the amounts used for taxation purposes
Deferred tax assets are recognised for unused tax losses and deductible temporary differences to the extent that it is probable that future taxable profits will be available against which they can be utilised Deferred tax assets are reviewed at each reporting date and are reduced to the extent that it is no longer probable that the related tax benefit will be realised
Deferred tax is measured at the tax rates that are expected to be applied to temporary differences when they reverse using tax rates enacted or substantially enacted at the reporting date The measurement of deferred tax reflects the tax consequences that would follow the manner in which the Group expects at the reporting date to recover or settle the carrying amount of its assets and liabilities
Tax consolidationThe Bank is the head entity in the tax-consolidated group comprising all the Australian wholly-owned subsidiaries The implementation date for the tax-consolidated group was 1 September 2003
Current tax expense (income) deferred tax liabilities and deferred tax assets arising from temporary differences of the members of the tax-consolidated group are recognised in the separate financial statements of the members of the tax-consolidated group using a lsquogroup allocationrsquo approach by reference to the carrying amounts in the separate financial statements of each entity and the tax values applying under tax consolidation
Any current tax liabilities (or assets) and deferred tax assets arising from unused tax losses of the subsidiaries are assumed by the head entity in the tax-consolidated group and are recognised as amounts payable (receivable) to (from) other entities in the tax-consolidated group in conjunction with any Tax Funding Agreement (TFA) amounts Any difference between these amounts is recognised by the Bank as an equity contribution or distribution from the subsidiary
Any subsequent period amendments to deferred tax assets arising from unused tax losses as a result of a revised assessment of the probability of recoverability is recognised by the head entity only
Nature of tax funding and tax sharing arrangementsThe Bank in conjunction with other members of the tax-consolidated group has entered into a TFA which sets out the funding obligations of members of the tax-consolidated group in respect of tax amounts The TFA requires payments to (from) the head entity equal to the current tax liability (asset) assumed by the head entity and any tax-loss deferred tax asset assumed by the head entity resulting in the Bank recognising an inter-entity payable (receivable) equal in amount to the tax liability (asset) assumed
Contributions to fund the current tax liabilities are payable as per the TFA and reflect the timing of the head entityrsquos obligation to make payments for tax liabilities to the relevant tax authorities
The Bank in conjunction with other members of the tax-consolidated group has also entered into a Tax Sharing Agreement (TSA) The TSA provides for the determination of the allocation of income tax liabilities between the entities should the head entity default on its tax payment obligations No amounts have been recognised in the financial statements in respect of this agreement as payment of any amounts under the TSA is considered remote
23 INCOME TAX EXPENSE AND DEFERRED TAX (CONTINUED)
124 Bank of Queensland Limited and its Controlled Entities
For the year ended 31 August 2021NOTES TO THE FINANCIAL STATEMENTS
Financial Statements 108 | Signed Reports 183 | Shareholding Details 195 | Glossary 201
24 DIVIDENDSBank
2021 2020
Cents per share $m
Cents per share $m
Ordinary shares
Final 2020 dividend paid 25 November 2020 (2019 27 November 2019) 12 55 31 126
Interim 2021 dividend paid 26 May 2021 17 109 - -
164 126
All dividends paid on ordinary shares have been fully franked Since the end of the financial year the Directors have determined the following dividends
Cents per share $m
Final ordinary share dividend 22 141
The final ordinary share dividend will be paid on 18 November 2021 to owners of ordinary shares at the close of business on 29 October 2021 (record date) Shares will be quoted ex-dividend on 28 October 2021
Bank
2021$m
2020$m
30 franking credits available to shareholders of the Bank for subsequent financial years 507 208
The ability to utilise the franking credits is dependent upon there being sufficient available profits to pay dividends The profits accumulated in the profit reserve are available for dividend payments in future years All dividends paid by the Bank since the end of the previous financial year were franked at the tax rate of 30 per cent
The balance of the Bankrsquos dividend franking account at the date of this report after adjusting for franking credits and debits that will arise on payment of income tax and proposed dividends relating to the year ended 31 August 2021 is $446 million calculated at the 30 per cent tax rate (2020 $183 million) It is anticipated based on these franking account balances that the Bank will continue to pay fully franked dividends in the foreseeable future
Dividend reinvestment planThe dividend reinvestment plan (DRP) provides ordinary shareholders with the opportunity to reinvest all or part of their entitlement to a dividend into new ordinary shares
The price for shares issued or transferred under the DRP is the Market Price less such discount (if any) as the directors may determine from time to time and notify to the ASX (rounded to the nearest cent)
Market price is the arithmetic average rounded to four decimal places of the daily volume weighted average price of
bull all shares sold in the ordinary course of trading on the ASX automated trading system and
bull where shares are sold on trading platforms of Australian licensed financial markets operated by persons other than ASX all shares sold in the ordinary course of trading on such of those trading platforms determined by the Board from time to time during the 10 trading day period commencing on the second trading day after the record date in respect of the relevant dividend
The calculation of the daily volume weighted average price shall not include certain transactions as outlined in the DRP terms and conditions If after this calculation there is a residual balance that balance will be carried forward (without interest) and added to the next dividend for the purpose of calculating the number of shares secured under the DRP at that time
Shares issued or transferred under the DRP will be fully-paid and rank equally in all respects with existing shares
The last date for election to participate in the DRP for the 2021 full year dividend is 1 November 2021
1252021 Annual Report
For the year ended 31 August 2021NOTES TO THE FINANCIAL STATEMENTS
Financial Statements 108 | Signed Reports 183 | Shareholding Details 195 | Glossary 201
25 OPERATING SEGMENTS Segment informationThe Group determines and presents operating segments based on the information that is provided internally to the Managing Director amp CEO the Bankrsquos chief operating decision maker
An operating segment is a component of the Group that engages in business activities from which it may earn revenues and incur expenses including revenues and expenses that relate to transactions with any of the Grouprsquos other components All operating segmentsrsquo operating results are regularly reviewed by the Grouprsquos Managing Director amp CEO to make decisions about resources to be allocated to the segment and assess its performance and for which discrete financial information is available
Segment results that are reported to the Managing Director amp CEO include items directly attributable to a segment as well as those that can be allocated on a reasonable basis
The Grouprsquos operating segments comprise the following
Retail Banking - retail banking solutions to customers managed through our Owner-managed and Corporate branch network third party intermediaries Virgin Money distribution channels and ME Bank (refer to Note 55)
BOQ Business - includes the BOQ branded commercial lending activity BOQ Finance and BOQ Specialist businesses The division provides tailored business banking solutions including commercial lending equipment finance and leasing cashflow finance foreign exchange interest rate hedging transaction banking and deposit solutions for commercial customers and
Other - Treasury St Andrewrsquos Insurance and Group Head Office
Management monitors the operating results of its business units separately for the purpose of making decisions about resource allocation and performance assessment Segment performance is evaluated based on operating profit or loss which in certain respects is measured differently from operating profit or loss in the consolidated financial statements Income taxes are managed within the individual operating segments and thus disclosed this way
Transfer prices between operating segments are on an armrsquos length basis reflecting the Bankrsquos external cost of funds in a manner similar to transactions with third parties
Major customersNo revenue from transactions with a single external customer or counter party amounted to 10 per cent or more of the Grouprsquos total revenue in 2021 or 2020
Geographic informationWhile the Group does have some operations in New Zealand the business segments operate principally in Australia
GoodwillFor goodwill allocation between segments refer to Note 41
PresentationThe following table presents income profit and certain asset and liability information regarding the Grouprsquos operating segments
Inter-segment revenue and expenses and transfer pricing adjustments are reflected in the performance of each operating segment
All inter-segment profits are eliminated on consolidation
126 Bank of Queensland Limited and its Controlled Entities
For the year ended 31 August 2021NOTES TO THE FINANCIAL STATEMENTS
Financial Statements 108 | Signed Reports 183 | Shareholding Details 195 | Glossary 201
25 OPERATING SEGMENTS (CONTINUED)Retail Banking BOQ Business Other Segment Total
2021 (1)
$m2020 (2)
$m2021
$m2020
$m2021
$m2020
$m2021
$m2020
$m
INCOME
Net interest income (3) 570 437 555 543 3 6 1128 986
Non-interest income 74 74 48 40 8 14 130 128
Total income 644 511 603 583 11 20 1258 1114
Operating expenses (407) (335) (262) (258) (15) (19) (684) (612)
Underlying profit (loss) 237 176 341 325 (4) 1 574 502
Loan impairment gain (loss) 21 (56) - (119) - - 21 (175)
Cash profit (loss) before tax 258 120 341 206 (4) 1 595 327
Income tax (expense) benefit (80) (37) (106) (64) 3 (1) (183) (102)
Segment cash profit (loss) after tax (4) 178 83 235 142 (1) - 412 225
STATUTORY BASIS ADJUSTMENTS
Amortisation of acquisition fair value adjustments - - - - (3) (4) (3) (4)
Hedge ineffectiveness - - - - (3) (10) (3) (10)
Transaction costs (5) - - - - (19) - (19) -
Integration costs (5) - - - - (9) - (9) -
Intangible asset review and restructure (6) - - - - (3) (80) (3) (80)
Regulatory compliance - - - - - (5) - (5)
Employee pay and entitlements review - - - - (6) (8) (6) (8)
Other legacy items - - - - - (3) - (3)
Statutory net profit (loss) after tax 178 83 235 142 (44) (110) 369 115
INCLUDED IN THE RESULTS
Depreciation and amortisation (54) (67) (22) (45) (8) (3) (84) (115)
Total assets 54077 26058 23913 22920 13442 7794 91432 56772
Total liabilities 37046 17156 10838 9780 37351 25605 85235 52541
(1) The August 2021 financial results includes the ME Bank contribution from 1 July 2021 until 31 August 2021(2) VMA operating costs have been restated from non-interest income and included in operating expenses per ASX announcement on 30 September 2021(3) Interest income and interest expenses are disclosed in this note on a net interest income basis This is in line with the information provided internally to the Managing
Director amp CEO(4) This excludes a number of items that introduce volatility and or one-off distortions of the Grouprsquos performance(5) Integration and transaction costs from ME Bank acquisition completed on 1 July 2021 (6) The August 2021 financial results include a non-recurring adjustment due to a change in the ME Bank minimum threshold for the capitalisation of intangible assets to align
with BOQ
1272021 Annual Report
For the year ended 31 August 2021NOTES TO THE FINANCIAL STATEMENTS
Financial Statements 108 | Signed Reports 183 | Shareholding Details 195 | Glossary 201
26 EARNINGS PER SHAREBasic earnings per share (EPS) is calculated by dividing the relevant earnings attributable to ordinary shareholders by the average weighted number of shares on issue Diluted EPS takes into account the dilutive effect of all outstanding share rights vesting as ordinary shares
Consolidated
2021$m
2020$m
EARNINGS RECONCILIATION
Profit for the year 369 115
Returns to other equity instruments (1) (1) -
Profit available for ordinary shareholders 368 115
Basic earnings
Effect of Wholesale Capital Notes - 4
Effect of Capital Notes 9 11
Effect of Capital Notes 2 5 -
Diluted earnings 382 130
Weighted average number of shares used as the denominator 2021 Number 2020 Number (2)
Number for basic earnings per share
Ordinary shares 549628512 454599751
Number for diluted earnings per share
Ordinary shares 549628512 454599751
Effect of award rights 3248973 1909302
Premium priced options (3) - -
Effect of Wholesale Capital Notes - 18456165
Effect of Capital Notes 37717103 58658037
Effect of Capital Notes 2 21033327 -
611627915 533623255
EARNINGS PER SHARE
Basic earnings per share - Ordinary shares (cents) 670 254
Diluted earnings per share - Ordinary shares (cents) 626 244
(1) Other equity instruments assumed on the acquisition of ME Bank Refer to Note 310(B) for further information (2) The basic and diluted earnings per share for August 2020 have been adjusted for the effects of the Grouprsquos capital raise that occurred in March 2021(3) During the year ended 31 August 2021 the Group granted 8033732 premium priced options to eligible employees The options were anti-dilutive during the period and
therefore have not impacted the diluted weighted average number of shares (WANOS) during the period
128 Bank of Queensland Limited and its Controlled Entities
For the year ended 31 August 2021NOTES TO THE FINANCIAL STATEMENTS
Financial Statements 108 | Signed Reports 183 | Shareholding Details 195 | Glossary 201
NOTE 3 CAPITAL AND BALANCE SHEET MANAGEMENT 31 CASH AND CASH EQUIVALENTSComponents of cash and cash equivalentsCash and cash equivalents comprise cash at branches cash on deposit and balances with the RBA Cash flows from the following activities are presented on a net basis in the Statements of Cash Flows
bull Sales and purchases of trading securities
bull Customer deposits and withdrawals from deposit accounts and
bull Loan drawdowns and repayments
Consolidated Bank
2021$m
2020$m
2021$m
2020$m
Notes coins and cash at bank 2124 983 1135 465
Remittances in transit 238 270 238 270
Reverse repurchase agreements maturing in less than three months 201 100 - 100
Cash and cash equivalents as presented in the Balance Sheets 2563 1353 1373 835
Cash and cash equivalents included in assets held for sale 4 - - -
Total 2567 1353 1373 835
Notes to the Statements of Cash Flows Reconciliation of profit for the year to net cash provided by operating activities
Profit from ordinary activities after income tax 369 115 264 81
Add (less) non-cash items or items classified as investing financing
Depreciation 39 35 36 35
Amortisation - acquired intangibles 4 5 2 4
Software amortisation and impairment 47 118 36 108
Profit on sale of property plant and equipment (5) (4) - -
Equity settled transactions 8 9 7 8
Salary sacrifice reserve (3) - (3) -
Dividends received from controlled entities - - (4) (4)
Add (less) changes in operating assets and liabilities
(Increase) decrease in due from other financial institutions 119 (152) 118 (158)
(Increase) in financial assets (1120) (120) (292) (120)
(Increase) in loans and advances (3052) (825) (3439) (772)
Increase (decrease) in provision for impairment (58) 136 (35) 89
(Increase) decrease in derivatives (19) 14 (9) 13
(Increase) decrease in deferred tax asset 17 (40) (1) (31)
(Increase) decrease in amounts due to from controlled entities - - 35 (670)
(Increase) decrease in other assets (18) 45 (142) 548
Increase (decrease) in due to other financial institutions (24) 11 (24) 11
Increase in deposits 3982 1278 3733 1302
Increase (decrease) in accounts payable and other liabilities 33 (43) 67 (24)
Increase in current tax liabilities 34 5 26 6
Increase in provisions 5 7 4 13
Increase (decrease) in deferred tax liabilities 23 2 1 (4)
(Decrease) in insurance policy liabilities - (4) - -
Net cash (inflow) outflow from operating activities 381 592 380 435
1292021 Annual Report
For the year ended 31 August 2021NOTES TO THE FINANCIAL STATEMENTS
Financial Statements 108 | Signed Reports 183 | Shareholding Details 195 | Glossary 201
32 FINANCIAL ASSETS AND LIABILITIESFinancial instruments measured at amortised costFinancial assets that are held to collect the contractual cash flows and that contain contractual terms that give rise on specified dates to cash flows that are solely payments of principal and interest are measured at amortised cost In addition most financial liabilities are measured at amortised cost Financial assets or financial liabilities are initially recognised at fair value inclusive of any directly attributable costs They are subsequently measured at each reporting date at amortised cost using the effective interest method
The Bank invests in debt securities at amortised cost that are issued by 100 per cent owned securitisation vehicles within the Consolidated Group The programsrsquo underlying pool of financial instruments are recorded within the Bankrsquos Loans and advances
Also included in this category are loans and advances at amortised cost (refer to Note 33 Loans and advances) and receivables due from other financial institutions recognised and measured at amortised cost
For financial liabilities at amortised cost refer to Note 34 for further information on Deposits and Note 35 for further information on Borrowings
Financial assets measured at fair value through other comprehensive income (FVOCI)Financial assets held in a business model that is achieved by both collecting and selling contractual cash flows that contain contractual terms that give rise on specified dates to cash flows that are solely payments of principal and interest are measured at FVOCI Gains or losses arising from changes in the fair value of these financial instruments are recognised in other comprehensive income Interest income and foreign exchange gains and losses are recognised in profit or loss in the Income Statement as are cumulative gains or losses previously recognised in other comprehensive income upon derecognition of the financial instruments
Equity instruments that are not held for trading are measured at FVOCI where an irrevocable election has been made by management Amounts presented in other comprehensive income are not subsequently transferred to profit or loss but can be reclassified to retained profits Dividends on such investments are recognised in profit or loss unless the dividend clearly represents a recovery of part of the cost of the investment
Financial instruments at fair value through profit or loss (FVTPL)Financial assets that do not meet the criteria to be measured at amortised cost or FVOCI are measured at FVTPL with all changes in fair value recognised in the Income Statement Financial assets in this category are those that are held for trading and have been designated by management upon initial recognition or are mandatorily required to be measured at fair value under AASB 9 Financial Instruments (AASB 9)
Where a financial liability is designated at fair value through profit or loss the movement in fair value is recognised in profit or loss in the Income Statement
Modification of financial instrumentsA financial instrument is modified when its original contractual cash flows are modified A financial instrument that is modified is derecognised if the existing agreement is cancelled and a new agreement is made on substantially different terms or if the existing terms of the financial instrument are substantially modified Where the modification results in derecognition of the original financial instrument a new financial instrument is recorded initially at fair value and the difference is recorded in profit or loss in the Income Statement
When the modification does not result in derecognition the difference between the financial instrumentrsquos original contractual cash flows and the modified cash flows discounted at the original effective interest rate is recognised as a gain or loss in the Income Statement
Reclassification of financial instrumentsThe Group reclassifies financial assets when and only when it changes its business model for managing those assets Reclassified financial assets are subsequently measured based on the new measurement category
The Group does not reclassify financial liabilities
Derecognition of financial instrumentsFinancial assets are derecognised when the contractual rights to receive cash flows from the assets have expired or where the Group has transferred its contractual rights to receive the cash flows of the financial assets or substantially all the risks and rewards of ownership or upon substantial modification
Financial liabilities are derecognised when they are extinguished ie when the obligation is discharged cancelled or expired
130 Bank of Queensland Limited and its Controlled Entities
For the year ended 31 August 2021NOTES TO THE FINANCIAL STATEMENTS
Financial Statements 108 | Signed Reports 183 | Shareholding Details 195 | Glossary 201
32 FINANCIAL ASSETS AND LIABILITIES (CONTINUED)Financial assets recognised and measured at fair value and debt instruments at amortised cost are listed below For other financial assets and liabilities refer to Note 31 for Cash and cash equivalents Note 33 for Loans and advances Note 34 for Deposits Note 35 for Borrowings and Note 38 for Derivative financial instruments and hedge accounting
Consolidated Bank
2021$m
2020$m
2021$m
2020$m
DERIVATIVE FINANCIAL ASSETS
Current 82 19 19 19
Non-current 55 135 67 82
Total derivative financial assets 137 154 86 101
FINANCIAL ASSETS AT FVTPL
Floating rate notes and bonds 664 1829 664 1829
Negotiable certificates of deposit 180 25 180 25
Promissory notes 200 - 200 -
Reverse repurchase agreements 43 - 43 -
Total financial assets at FVTPL 1087 1854 1087 1854
Current 1087 1854 1087 1854
FINANCIAL ASSETS AT FVOCI
Debt instruments 9701 4530 5548 4530
Equity instruments 9 6 6 6
Total financial assets at FVOCI 9710 4536 5554 4536
Current 3232 80 607 80
Non-current 6478 4456 4947 4456
DEBT INSTRUMENTS AT AMORTISED COST
Current - - 168 200
Non-current - - 7531 7462
- - 7699 7662
1312021 Annual Report
For the year ended 31 August 2021NOTES TO THE FINANCIAL STATEMENTS
Financial Statements 108 | Signed Reports 183 | Shareholding Details 195 | Glossary 201
33 LOANS AND ADVANCES
Loans and advances at amortised cost Loans and advances are originated by the Group and are recognised upon cash being advanced to the borrower Loans and advances are initially recognised at fair value plus incremental directly attributable transaction costs They are subsequently measured at each reporting date at amortised cost using the effective interest method The method used to determine the appropriate period to amortise any upfront payments or receipts on origination of loan contracts is the weighted average life (WAL) of the loan category
Finance lease receivablesLoans and advances include finance lease receivables Finance leases are those products where substantially all the risks and rewards of the leased asset have been transferred to the lessee Finance lease receivables are initially recognised at amounts equal to the lower of fair value of the leased asset or the present value of the minimum lease repayments plus the present value of a guaranteed residual value expected to accrue at the end of the lease term Subsequently lease repayments are apportioned between interest income and the reduction of the lease receivable over the term of the lease in order to reflect a constant periodic rate of return on the net investment outstanding in respect of the lease
Consolidated Bank
2021$m
2020 (1)
$m2021
$m2020 (1)
$m
Residential property loans 59053 31155 34101 31155
Personal loans 182 91 95 91
Overdrafts 164 209 164 209
Commercial loans 9900 9449 9715 9271
Credit cards 178 59 57 59
Asset finance and leasing 6347 6172 928 1009
Gross loans and advances 75824 47135 45060 41794
Less
Unearned finance lease income (76) (92) (14) (20)
Specific provision for impairment (107) (94) (83) (68)
Collective provision for impairment (204) (275) (136) (186)
Total loans and advances 75437 46674 44827 41520
(1) Comparative information has been restated To align product definitions across the Group $810 million of BOQ Specialist asset finance products has been reclassified from Commercial loans to Asset finance and leasing $124 million of BOQ Specialist consumer lending products has been reclassified from Personal loans to Commercial loans
(A) Loans and advances - Expected Credit Losses (ECL)In accordance with AASB 9 Financial Instruments the Group utilises a forward-looking ECL approach The ECL allowance is based on the credit losses expected to arise over the next 12 months of the financial asset unless there has been a significant increase in credit risk (SICR) since origination In this case the allowance is based on the ECL for the life of the financial asset The 12 month ECL is the portion of lifetime ECLs resulting from default events on a financial asset that are possible within the 12 months after the reporting date
At the end of each reporting period the Group performs an assessment of whether a financial assetrsquos credit risk has increased significantly since initial recognition This is done by considering the change in the risk of default occurring over the remaining life of the financial asset
132 Bank of Queensland Limited and its Controlled Entities
For the year ended 31 August 2021NOTES TO THE FINANCIAL STATEMENTS
Financial Statements 108 | Signed Reports 183 | Shareholding Details 195 | Glossary 201
33 LOANS AND ADVANCES (CONTINUED)The Group applies a three stage approach to measuring the ECL as described below
bull Stage 1 ndash For financial assets where there has not been a SICR since initial recognition and that are not credit impaired upon origination the portion of the lifetime ECL associated with the probability of default (PD) occurring within the next 12 months is recognised as the 12 month ECL adjusted for forward-looking information Stage 1 includes facilities where the credit risk has improved and the loan has been reclassified from Stage 2 or Stage 3
bull Stage 2 ndash When there has been a SICR the lifetime ECL is determined with reference to the financial assetrsquos lifetime PD and the lifetime losses associated with that PD adjusted for forward-looking information The Group assesses whether there has been a SICR since initial recognition based on qualitative quantitative and reasonable and supportable forward-looking information that includes significant management judgement Use of alternative criteria could result in significant changes to the timing and amount of ECL to be recognised Lifetime ECL considers the expected behaviour of the asset as well as forward looking macro-economic forecasts Stage 2 also includes facilities where the credit risk has improved and the loan has been reclassified from Stage 3
bull Stage 3 - This includes financial assets that are deemed to be credit impaired which generally correspond to the APRA definition of default and include exposures that are at least 90 days past due The provision is also equivalent to the lifetime ECL Financial assets in Stage 3 will have a collective provision determined by the ECL model although some loans are individually covered by a specific provision A specific provision is calculated based on estimated future cash flows discounted to their present value net of any collateral held against that financial asset
bull Purchased or originated credit-impaired (POCI) - POCI assets are financial assets that are purchased or originated as being credit impaired The ECL for POCI assets is measured at an amount equal to the lifetime ECL However the amount recognised as a loss allowance for these assets is not the total amount of lifetime ECLs but instead the changes in lifetime ECLs since initial recognition of the asset
Write-offsFinancial assets are written off either partially or in full against the related provision when the Group concludes that there is no reasonable expectation of recovery and all possible collateral has been realised Recoveries of financial assets previously written off are recognised in profit or loss based on the cash received
Definition of default A default is considered to have occurred when the borrower is unlikely to pay its credit obligations in full without recourse by the Group to the realisation of available security andor the borrower is at least 90 days past due on their credit obligations This definition is in line with the regulatory definition of default and also aligned to the definition used for internal credit risk management purposes across all portfolios
Significant increase in credit riskSICR for financial assets is assessed by comparing the risk of a default occurring over the expected life of a financial asset at the reporting date compared to the corresponding risk of default at origination In determining what constitutes a significant increase in credit risk the Group considers qualitative and quantitative information For the majority of BOQrsquos portfolios SICR is assessed using PD based triggers by comparing the PD at the reporting date to the PD at origination PDrsquos are primarily assigned through either a Customer Risk Rating or statistical models utilising account behaviours For all loan portfolios the primary indicator is in addition to the secondary SICR indicator which is based on 30 days past due arrears information and other qualitative criteria
Calculation of ECLBoth 12 month ECLs and lifetime ECLs are calculated on either an individual basis or a collective basis depending on the nature of the underlying portfolio of financial assets Where ECL is modelled collectively for portfolios of exposures it is modelled primarily as the product of the PD the loss given default (LGD) and the exposure at default (EAD)
These parameters are generally derived from internally developed statistical models combined with historical current and forward- looking information including macro-economic data
bull The 12-month and lifetime PD for accounting purposes represent the estimation of the point-in-time probability of a default over the next 12 months and remaining lifetime of the financial instrument respectively based on conditions existing at the balance sheet date and future economic conditions that affect credit risk
bull The EAD represents the expected exposure at default taking into account the repayment of principal and interest from the balance sheet date to the default event together with any expected drawdown of a facility and
bull The LGD represents the expected loss conditional on default taking into account the mitigating effect of collateral its expected value when realised and the time value of money
Incorporation of forward-looking informationThe credit risk factors described above are point in time estimates based on the probability weighted forward-looking economic scenarios The inclusion of a forward-looking component in the model anticipates changes in the economic outlook and is an important component of the provisioning process The Group considers four forward-looking macro-economic scenarios (base upside downside and severe downside) over the next three years The scenarios are then probability weighted based on the likelihood of the scenario occurring to ensure ECL appropriately captures forward looking effects and considers the range of possible economic outcomes Sensitivity analysis is also performed on each of the macro-economic scenarios and if conditions warrant this could result in a management overlay for economic uncertainty which is included in the ECL
1332021 Annual Report
For the year ended 31 August 2021NOTES TO THE FINANCIAL STATEMENTS
Financial Statements 108 | Signed Reports 183 | Shareholding Details 195 | Glossary 201
33 LOANS AND ADVANCES (CONTINUED)
Incorporation of forward-looking information (Continued)The scenarios including their underlying indicators are developed using a combination of publicly available data and internal forecasts to form the initial baseline The scenarios are refined through consultation with internal specialists and benchmarking to external data from reputable sources which includes forecasts published from a range of market economists and official data sources including major central banks
Economic outlook factors that are taken into consideration include but are not limited to unemployment interest rates gross domestic product commercial and residential property price indexes and require an evaluation of both the current and forecast direction of the macro-economic cycle
Incorporating forward looking information including macro-economic forecasts increases the degree of judgement required to assess how changes in these data points will affect ECLs The methodologies and assumptions including any forecasts of future economic conditions are reviewed regularly
Impact of COVID-19 on ECL In response to the COVID-19 global pandemic BOQ continues to offer support to its customers through a range of industry-wide financial assistance measures including temporary loan repayment deferrals Notwithstanding these measures together with government stimulus there remains significant estimation uncertainty in relation to the measurement of BOQrsquos ECL for loans and advances Although GDP property prices and unemployment have been less severe than anticipated in FY20 there have been further outbreaks of infection and snap lockdowns across a large part of Australia with metropolitan cities experiencing extended lockdown periods The true extent of the level of stress in the economy which could result in credit losses is still highly uncertain
In determining the reported ECL of $311 million the Group has taken into account the facts circumstances and forecasts of future economic conditions and supportable information available at the reporting date Model updates have been implemented in 2H21 which include a complete review of the overlays and adjustments in place as well as updated scenarios and scenario weightings to cater for economic uncertainties Observed credit deterioration and its resultant impact on PD and LGD incorporated in the most recent data set has translated some of the model overlay into the modelled outcome while management overlays have been refined based on industry and occupation data observed during the pandemic
The ECL reflects an unbiased and probability-weighted amount determined by the evaluation of a range of possible forward looking economic outcomes rather than being based on a best or worst case scenario The macro-economic outlook as reflected in the base case scenario has improved since FY20 including lower unemployment and improved property prices The Group has introduced a new Upside scenario reflecting low unemployment and strong growth due to extensive fiscal and monetary support However the potential for further downside risk remains including economic deterioration from additional lockdowns the reduction of government support and vaccine rollout delays The probability weighting across each scenario has therefore been updated per the table below utilising the most up to date macro-economic information available as at reporting date
Upside Base Downside Severe
2021 2020 2021 2020 2021 2020 2021 2020
Weighting 50 - 425 750 300 200 225 50
The general shape of the economic recovery varies within each scenario The table below provides a summary of macro-economic assumptions used in the Base and Downside scenarios as at 31 August 2021
Base Downside
Macro-economic assumption2021
()2022
()2023
()2021
()2022
()2023
()
GDP 375 475 275 (025) 275 200
Unemployment rate 500 450 425 675 675 650
Residential property prices 1700 750 400 675 (200) (025)
Commercial property prices 325 (025) 075 100 (375) (275)
Sensitivity of provisions for impairmentThe ECL reflects an unbiased and probability-weighted amount across a range of macro-economic scenarios as described above The following table compares the reported ECL to approximate levels of ECL under the Base and Downside scenarios assuming a 100 per cent weighting was applied to each scenario with all other assumptions held constant
Consolidated $m
Bank $m
Reported probability weighted ECL 311 219
100 base case 289 199
100 downside 331 234
134 Bank of Queensland Limited and its Controlled Entities
For the year ended 31 August 2021NOTES TO THE FINANCIAL STATEMENTS
Financial Statements 108 | Signed Reports 183 | Shareholding Details 195 | Glossary 201
33 LOANS AND ADVANCES (CONTINUED)
GovernanceThe Executive Credit Committee has the delegation for reviewing and approving the methodology including any judgements and assumptions Where applicable management adjustments or overlays may be made to account for situations where known or expected risks and information have not been considered in the modelling process The Grouprsquos provision for impairment on loans and advances and key areas of judgement are reported to the Grouprsquos Audit Committee and Board at each reporting period
The following table discloses the reconciliation of the ECL model of the Group for the year ended 31 August 2021
Collective Provision
CONSOLIDATED
Stage 1 ndash 12 month ECL
$m
Stage 2 ndash Lifetime ECL
$m
Stage 3 ndash Lifetime ECL
$m
Stage 3 ndash Specific
provision$m
Total $m
Balance as at 1 September 2020 95 115 65 94 369
Transfers during the year to
Stage 1 19 (10) (1) (8) -
Stage 2 (5) 10 (2) (3) -
Stage 3 (1) (5) 3 3 -
Newincreased provisions 36 31 53 55 175
Write-back of provisions no longer required (56) (91) (52) (1) (200)
Amounts written off previously provided for - - - (29) (29)
Unwind discount - - - (4) (4)
Balance as at 31 August 2021 88 50 66 107 311
The table below discloses the effect of movements in the gross carrying value of loans and advances in the different stages of the ECL model of the Group during the year ended 31 August 2021
CONSOLIDATED
Stage 1 ndash 12 month ECL
$m
Stage 2 ndash Lifetime ECL
$m
Stage 3 ndash Lifetime ECL
$m
Stage 3 ndash Specific
provision$m
Stage 3 - POCI Loans
$mTotal (1)
$m
Gross carrying amount as at 1 September 2020 42831 3605 408 199 - 47043
Transfers during the year to
Stage 1 1307 (1282) (23) (2) - -
Stage 2 (2373) 2436 (35) (28) - -
Stage 3 (235) (182) 321 96 - -
New loans and advances originated or purchased (2) 40232 342 7 8 286 40875
Loans and advances derecognised or repaid during the year including write-offs (11074) (909) (135) (52) - (12170)
Balance as at 31 August 2021 70688 4010 543 221 286 75748
Provision for impairment (88) (50) (66) (107) - (311)
Net carrying amount as at 31 August 2021 70600 3960 477 114 286 75437
(1) The amounts presented above are inclusive of unearned finance lease income (2) $25159 million of new loans and advances originated relates to ME Bank acquisition
1352021 Annual Report
For the year ended 31 August 2021NOTES TO THE FINANCIAL STATEMENTS
Financial Statements 108 | Signed Reports 183 | Shareholding Details 195 | Glossary 201
33 LOANS AND ADVANCES (CONTINUED)The following table discloses the reconciliation of the ECL model of the Group for the year ended 31 August 2020
Collective Provision
CONSOLIDATED
Stage 1 ndash 12 month ECL
$m
Stage 2 ndash Lifetime ECL
$m
Stage 3 ndash Lifetime ECL
$m
Stage 3 ndash Specific
provision$m
Total $m
Balance as at 1 September 2019 81 44 23 85 233
Transfers during the year to
Stage 1 8 (7) (1) - -
Stage 2 (3) 4 (1) - -
Stage 3 (1) (5) 2 4 -
Newincreased provisions 47 94 50 39 230
Write-back of provisions no longer required (37) (15) (8) 3 (57)
Amounts written off previously provided for - - - (32) (32)
Unwind discount - - - (5) (5)
Balance as at 31 August 2020 95 115 65 94 369
The table below discloses the effect of movements in the gross carrying value of loans and advances in the different stages of the ECL model of the Group during the year ended 31 August 2020
CONSOLIDATED
Stage 1 ndash 12 month ECL
$m
Stage 2 ndash Lifetime ECL
$m
Stage 3 ndash Lifetime ECL
$m
Stage 3 ndash Specific
provision$m
Total (1)
$m
Gross carrying amount as at 1 September 2019 43233 2425 351 207 46216
Transfers during the year to
Stage 1 682 (666) (15) (1) -
Stage 2 (2278) 2304 (25) (1) -
Stage 3 (156) (89) 195 50 -
New loans and advances originated or purchased 11641 319 34 1 11995
Loans and advances derecognised or repaid during the year including write-offs (10291) (688) (132) (57) (11168)
Balance as at 31 August 2020 42831 3605 408 199 47043
Provision for impairment (95) (115) (65) (94) (369)
Net carrying amount as at 31 August 2020 42736 3490 343 105 46674
(1) The amounts presented above are inclusive of unearned finance lease income
136 Bank of Queensland Limited and its Controlled Entities
For the year ended 31 August 2021NOTES TO THE FINANCIAL STATEMENTS
Financial Statements 108 | Signed Reports 183 | Shareholding Details 195 | Glossary 201
33 LOANS AND ADVANCES (CONTINUED)The following table discloses the reconciliation of the ECL model of the Bank for the year ended 31 August 2021
Collective Provision
BANK
Stage 1 ndash 12 month ECL
$m
Stage 2 ndash Lifetime ECL
$m
Stage 3 ndash Lifetime ECL
$m
Stage 3 ndash Specific
provision$m
Total $m
Balance as at 1 September 2020 57 78 51 68 254
Transfers during the year to
Stage 1 5 (4) (1) - -
Stage 2 (3) 7 (1) (3) -
Stage 3 (1) (3) 2 2 -
Newincreased provisions 18 25 35 40 118
Write-back of provisions no longer required (25) (64) (40) (8) (137)
Amounts written off previously provided for - - - (13) (13)
Unwind discount - - - (3) (3)
Balance as at 31 August 2021 51 39 46 83 219
The table below discloses the effect of movements in the gross carrying value of loans and advances in the different stages of the ECL model of the Bank during the year ended 31 August 2021
BANK
Stage 1 ndash 12 month ECL
$m
Stage 2 ndash Lifetime ECL
$m
Stage 3 ndash Lifetime ECL
$m
Stage 3 ndash Specific
provision$m
Total (1)
$m
Gross carrying amount as at 1 September 2020 38270 2934 399 171 41774
Transfers during the year to
Stage 1 997 (973) (22) (2) -
Stage 2 (2133) 2195 (34) (28) -
Stage 3 (203) (168) 289 82 -
New loans and advances originated or purchased 13008 263 14 4 13289
Loans and advances derecognised or repaid during the year including write-offs (9203) (634) (147) (33) (10017)
Balance as at 31 August 2021 40736 3617 499 194 45046
Provision for impairment (51) (39) (46) (83) (219)
Net carrying amount as at 31 August 2021 40685 3578 453 111 44827
(1) The amounts presented above are inclusive of unearned finance lease income
1372021 Annual Report
For the year ended 31 August 2021NOTES TO THE FINANCIAL STATEMENTS
Financial Statements 108 | Signed Reports 183 | Shareholding Details 195 | Glossary 201
33 LOANS AND ADVANCES (CONTINUED)The following table discloses the reconciliation of the ECL model of the Bank for the year ended 31 August 2020
Collective Provision
BANK
Stage 1 ndash 12 month ECL
$m
Stage 2 ndash Lifetime ECL
$m
Stage 3 ndash Lifetime ECL
$m
Stage 3 ndash Specific
provision$m
Total $m
Balance as at 1 September 2019 47 33 19 65 164
Transfers during the year to
Stage 1 4 (4) - - -
Stage 2 (1) 2 (1) - -
Stage 3 - (4) 2 2 -
Newincreased provisions 26 63 37 26 152
Write-back of provisions no longer required (19) (12) (6) (2) (39)
Amounts written off previously provided for - - - (19) (19)
Unwind discount - - - (4) (4)
Balance as at 31 August 2020 57 78 51 68 254
The table below discloses the effect of movements in the gross carrying value of loans and advances in the different stages of the ECL model of the Bank during the year ended 31 August 2020
BANK
Stage 1 ndash 12 month ECL
$m
Stage 2 ndash Lifetime ECL
$m
Stage 3 ndash Lifetime ECL
$m
Stage 3 ndash Specific
provision$m
Total (1)
$m
Gross carrying amount as at 1 September 2019 38266 2212 341 181 41000
Transfers during the year to
Stage 1 640 (625) (14) (1) -
Stage 2 (1677) 1703 (25) (1) -
Stage 3 (140) (82) 190 32 -
New loans and advances originated or purchased 9450 305 32 - 9787
Loans and advances derecognised or repaid during the year including write-offs (8269) (579) (125) (40) (9013)
Balance as at 31 August 2020 38270 2934 399 171 41774
Provision for impairment (57) (78) (51) (68) (254)
Net carrying amount as at 31 August 2020 38213 2856 348 103 41520
(1) The amounts presented above are inclusive of unearned finance lease income
138 Bank of Queensland Limited and its Controlled Entities
For the year ended 31 August 2021NOTES TO THE FINANCIAL STATEMENTS
Financial Statements 108 | Signed Reports 183 | Shareholding Details 195 | Glossary 201
33 LOANS AND ADVANCES (CONTINUED)The table below discloses the breakdown of impairment expense on loans and advances
Consolidated Bank
2021$m
2020$m
2021$m
2020$m
(Decrease) increase in collective provision for impairment (71) 127 (50) 87
Increase in specific provision for impairment 20 14 21 7
Bad debts written off net of recoveries 30 34 16 22
Impairment (gain) loss on loans and advances (21) 175 (13) 116
(B) Lease receivablesAsset finance and leasing include the following finance lease receivables for leases where the Group is the lessor
Consolidated Bank
2021$m
2020$m
2021$m
2020$m
Gross investment in finance lease receivables
Less than one year 334 335 14 20
Between one and five years 611 696 108 142
More than five years 34 58 31 37
979 1089 153 199
Unearned finance lease income (76) (92) (14) (20)
Net investment in finance leases 903 997 139 179
The net investment in finance leases
Less than one year 303 300 15 20
Between one and five years 570 645 97 128
More than five years 30 52 27 31
Net investment in finance leases 903 997 139 179
1392021 Annual Report
For the year ended 31 August 2021NOTES TO THE FINANCIAL STATEMENTS
Financial Statements 108 | Signed Reports 183 | Shareholding Details 195 | Glossary 201
33 LOANS AND ADVANCES (CONTINUED)(C) Transfer of financial assets
Securitisation programThrough its REDS Securitisation (RMBS Trusts) REDS EHP Securitisation (REDS EHP Trusts) Impala and SMHL Securitisation (SMHL Trusts) programs the Group packages loans and advances through a series of securitisation vehicles from which debt securities are issued to investors The Group is entitled to any residual income from the vehicles after all payments to investors and costs of the programs have been met The securitised loans and advances are included in Loans and advances and the securitisation liabilities are included in Borrowings on the Grouprsquos Balance Sheet The note holders have recourse only to the loan pool of assets Refer to Note 59 (A)(ii) for further information
Covered bond programThe Bank issues covered bonds for funding and liquidity purposes The bonds are issued to external investors and are secured against a pool of the Bankrsquos housing loans Housing loans are assigned to a bankruptcy remote structured entity to provide security for all obligations payable on the covered bonds issued by the Bank The covered bond holders have dual recourse to the Bank and the cover pool of assets The Bank is required to maintain the cover pool at a level sufficient to cover the obligations of the bonds The Bank is entitled to any residual income of the covered bond structured entity after all payments due to the covered bond holders and any costs related to the program have been met The housing loans are included in Loans and advances and the covered bonds issued are included in Borrowings on the Bankrsquos Balance Sheet Refer to Note 59 (A)(iii) for further information
The following table sets out the transferred financial assets and associated liabilities of the securitisation and covered bond programs that did not qualify for derecognition under AASB 9 and typically result in the transferred assets continuing to be recognised in full
Consolidated Bank
2021$m
2020$m
2021$m
2020$m
TRANSFERRED FINANCIAL ASSETS
Securitisation - Loans and advances 6952 3430 9115 10169
Covered bonds - Loans and advances 3078 2961 3078 2961
10030 6391 12193 13130
ASSOCIATED FINANCIAL LIABILITIES
Securitisation liabilities - external investors 7653 3432 - -
Covered bonds - external investors 2362 2371 2362 2371
Amounts due to controlled entities - - 9324 10189
10015 5803 11686 12560
FOR THOSE LIABILITIES THAT HAVE RECOURSE ONLY TO TRANSFERRED ASSETS (1)
Fair value of transferred assets 10042 6408 12202 13166
Fair value of associated liabilities (10015) (5803) (11686) (12560)
Net position 27 605 516 606
(1) The fair values of transferred assets and liabilities that reprice within 6 months are assumed to equate to the amortised cost All other fair values are calculated using a discounted cash flow model
140 Bank of Queensland Limited and its Controlled Entities
For the year ended 31 August 2021NOTES TO THE FINANCIAL STATEMENTS
Financial Statements 108 | Signed Reports 183 | Shareholding Details 195 | Glossary 201
34 DEPOSITSDeposits are initially recognised at fair value net of any directly attributable transaction costs Subsequent to initial measurement they are measured at amortised cost using the effective interest method
Consolidated Bank
2021$m
2020$m
2021$m
2020$m
Deposits at call 34732 19773 23502 19971
Term deposits 26427 16810 16744 16829
Certificates of deposit 4743 3010 3323 3010
Total deposits 65902 39593 43569 39810
CONCENTRATION OF DEPOSITS
Customer deposits 56469 34762 38180 34960
Wholesale deposits 9433 4831 5389 4850
65902 39593 43569 39810
1412021 Annual Report
For the year ended 31 August 2021NOTES TO THE FINANCIAL STATEMENTS
Financial Statements 108 | Signed Reports 183 | Shareholding Details 195 | Glossary 201
35 BORROWINGS Borrowings are initially recognised at fair value net of any directly attributable transaction costs Subsequent to initial measurement they are measured at amortised cost using the effective interest method
The Group recorded the following movements on borrowings
CONSOLIDATED
Securitisation liabilities (1)
$m
Covered bonds
liabilities
(2)
$m
EMTN program
$m
Term funding
facility (3)
$m
Subordinated notes
$m
Senior unsecured
notes$m
Capital Notes (4)
$mTotal
$m
YEAR ENDED 31 AUGUST 2021
Balance at beginning of year 3429 2367 194 820 350 3833 346 11339
Acquisition of ME Bank 4558 - - 872 - 403 - 5833
Proceeds from issues new funding 1134 - - 1334 250 650 260 3628
Repayments (1476) - (112) - (150) (1325) - (3063)
Deferred establishment costs (2) - - - (1) (1) (5) (9)
Amortisation of deferred costs (5) 2 1 - - - 1 1 5
Foreign exchange translation (5) - (9) (1) - - - - (10)
Balance at end of year 7645 2359 81 3026 449 3561 602 17723
CONSOLIDATED
Securitisation liabilities (1)
$m
Covered bonds
liabilities
(2)
$m
EMTN program
$m
Term funding
facility (3)
$m
Subordinated notes
$m
Senior unsecured
notes$m
Capital Notes (4)
$mTotal
$m
YEAR ENDED 31 AUGUST 2020
Balance at beginning of year 4617 1649 263 - 349 4613 495 11986
Proceeds from issues new funding 378 750 - 820 - 635 - 2583
Repayments (1568) - (60) - - (1415) (150) (3193)
Deferred establishment costs (1) (2) - - - (1) - (4)
Amortisation of deferred costs (5) 3 1 - - 1 1 1 7
Foreign exchange translation (5) - (31) (9) - - - - (40)
Balance at end of year 3429 2367 194 820 350 3833 346 11339
(1) Securitisation liabilities are secured by a floating charge over securitised assets for amounts owing to note holders and any other secured creditors of the securitisation vehicles(2) Covered bonds liabilities are secured by a charge over a pool of loans and advances and guaranteed by the covered bond guarantor(3) The TFF provides funding at a fixed interest rate of 25 basis points for a maximum of 3 years and is accounted for as borrowings From 4 November 2020 the interest rate
of new borrowings was lowered to 10 basis points The funding is a below market interest loan from a Government entity and accordingly classified as a Government Grant The Group reflects a net interest expense in the Income Statement There are no terms and conditions associated with the TFF other than pledging eligible collateral that meet the RBArsquos eligibility criteria At 31 August 2021 the Group has pledged $37 billion of self-securitised residential mortgage-backed securities as collateral
(4) Capital Notes On 28 December 2017 the Bank issued 3500000 Capital Notes at a price of $100 per note Capital Notes are perpetual and convertible notes issued by BOQ with preferred
discretionary non-cumulative distributions They are not guaranteed or secured As at 31 August 2021 3500000 Capital Notes were outstanding Capital Notes must convert into ordinary shares on 15 August 2026 if certain mandatory conversion conditions are satisfied unless they are converted or redeemed
earlier Where the mandatory conversion conditions are satisfied a holder will receive a number of ordinary shares per Capital Note based on the volume weighted average price of ordinary shares during a specified period The Capital Notes must also convert to ordinary shares of the Bank with the occurrence of a loss absorption event or an acquisition event BOQ may elect to convert redeem or resell Capital Notes on 15 August 2024 or following a regulatory or tax event BOQ may also elect to convert all Capital Notes following a potential acquisition event These options are subject to APRArsquos prior written approval and certain conditions being satisfied In a winding up of the Bank Capital Notes will rank for payment of capital ahead of ordinary shares equally with Capital Notes 2 and other equal ranking instruments but behind the claims of all senior ranking creditors including depositors and unsubordinated and subordinated creditors
Capital Notes 2 On 30 November 2020 the Bank issued 2600000 Capital Notes 2 at a price of $100 per note Capital Notes 2 are perpetual and convertible notes issued by BOQ with
preferred discretionary non-cumulative distributions They are not guaranteed or secured As at 31 August 2021 2600000 Capital Notes 2 were outstanding Capital Notes 2 must convert into ordinary shares on 15 May 2029 if certain mandatory conversion conditions are satisfied unless they are converted or redeemed earlier Where the mandatory conversion conditions are satisfied a holder will receive a number of ordinary shares per Capital Note 2 based on the volume weighted average price of ordinary shares during a specified period Capital Notes 2 must also convert to ordinary shares of the Bank with the occurrence of a loss absorption event or an acquisition event BOQ may elect to convert redeem or resell Capital Notes 2 on 14 May 2027 or following a regulatory or tax event BOQ may also elect to convert all Capital Notes 2 following a potential acquisition event These options are subject to APRArsquos prior written approval and certain conditions being satisfied In a winding up of the Bank Capital Notes 2 will rank for payment of capital ahead of ordinary shares equally with Capital Notes (issued 28 December 2017) and other equal ranking instruments but behind the claims of all senior ranking creditors including depositors and unsubordinated and subordinated creditors
(5) Amortisation of deferred costs and foreign exchange translation are non-cash movements Foreign exchange translation movements are 100 per cent hedged
142 Bank of Queensland Limited and its Controlled Entities
For the year ended 31 August 2021NOTES TO THE FINANCIAL STATEMENTS
Financial Statements 108 | Signed Reports 183 | Shareholding Details 195 | Glossary 201
35 BORROWINGS (CONTINUED)The Bank recorded the following movements on borrowings
BANK
Covered bonds
liabilities (1)
$m
EMTN program
$m
Term funding
facility (2)
$m
Subordinated notes
$m
Senior unsecured
notes $m
Capital Notes (3)
$mTotal
$m
YEAR ENDED 31 AUGUST 2021
Balance at beginning of year 2371 194 820 350 3833 346 7914
Proceeds from issues new funding - - 1334 250 - 260 1844
Repayments - (112) - (150) (675) - (937)
Deferred establishment costs - - - (1) (1) (6) (8)
Amortisation of deferred costs (4) - - - - 1 2 3
Foreign exchange translation (4) (9) (1) - - - - (10)
Balance at end of year 2362 81 2154 449 3158 602 8806
BANK
Covered bonds
liabilities (1)
$m
EMTN program
$m
Term funding
facility (2)
$m
Subordinated notes
$m
Senior unsecured
notes $m
Capital Notes (3)
$mTotal
$m
YEAR ENDED 31 AUGUST 2020
Balance at beginning of year 1652 263 - 349 4613 495 7372
Proceeds from issues 750 - 820 - 635 - 2205
Repayments - (60) - - (1415) (150) (1625)
Deferred establishment costs - - - - (1) - (1)
Amortisation of deferred costs (4) - - - 1 1 1 3
Foreign exchange translation (4) (31) (9) - - - - (40)
Balance at end of year 2371 194 820 350 3833 346 7914
(1) Covered bonds liabilities are secured by a charge over a pool of loans and advances and guaranteed by the covered bond guarantor(2) The TFF provides funding at a fixed interest rate of 25 basis points for a maximum of 3 years and is accounted for as borrowings From 4 November 2020 the interest rate
of new borrowings was lowered to 10 basis points The funding is a below market interest loan from a Government entity and accordingly classified as a Government Grant The Bank reflects a net interest expense in the Income Statement There are no terms and conditions associated with the TFF other than pledging eligible collateral that meet the RBAs eligibility criteria At 31 August 2021 the Bank has pledged $27 billion of self-securitised residential mortgage-backed securities as collateral
(3) Capital Notes On 28 December 2017 the Bank issued 3500000 Capital Notes at a price of $100 per note Capital Notes are perpetual and convertible notes issued by BOQ with
preferred discretionary non-cumulative distributions They are not guaranteed or secured As at 31 August 2021 3500000 Capital Notes were outstanding Capital Notes must convert into ordinary shares on 15 August 2026 if certain mandatory conversion conditions are satisfied unless they are converted or redeemed earlier Where the mandatory conversion conditions are satisfied a holder will receive a number of ordinary shares per Capital Note based on the value weighted average price of ordinary shares during a specified period The Capital Notes must also convert to ordinary shares of the Bank with the occurrence of a loss absorption event or an acquisition event BOQ may elect to convert redeem or resell Capital Notes on 15 August 2024 or following a regulatory or tax event BOQ may also elect to convert all Capital Notes following a potential acquisition event These options are subject to APRArsquos prior written approval and certain conditions being satisfied In a winding up of the Bank Capital Notes will rank for payment of capital ahead of ordinary shares equally with CPS WCN and other equal ranking instruments but behind the claims of all senior ranking creditors including depositors and unsubordinated and subordinated creditors
Capital Notes 2 On 30 November 2020 the Bank issued 2600000 Capital Notes 2 at a price of $100 per note Capital Notes 2 are perpetual and convertible notes issued by BOQ with
preferred discretionary non-cumulative distributions They are not guaranteed or secured As at 31 August 2021 2600000 Capital Notes 2 were outstanding Capital Notes 2 must convert into ordinary shares on 15 May 2029 if certain mandatory conversion conditions are satisfied unless they are converted or redeemed earlier Where the mandatory conversion conditions are satisfied a holder will receive a number of ordinary shares per Capital Note 2 based on the volume weighted average price of ordinary shares during a specified period Capital Notes 2 must also convert to ordinary shares of the Bank with the occurrence of a loss absorption event or an acquisition event BOQ may elect to convert redeem or resell Capital Notes 2 on 14 May 2027 or following a regulatory or tax event BOQ may also elect to convert all Capital Notes 2 following a potential acquisition event These options are subject to APRArsquos prior written approval and certain conditions being satisfied In a winding up of the Bank Capital Notes 2 will rank for payment of capital ahead of ordinary shares equally with Capital Notes (issued 28 December 2017) and other equal ranking instruments but behind the claims of all senior ranking creditors including depositors and unsubordinated and subordinated creditors
(4) Amortisation of deferred costs and foreign exchange translation are non-cash movements Foreign exchange translation movements are 100 per cent hedged
1432021 Annual Report
For the year ended 31 August 2021NOTES TO THE FINANCIAL STATEMENTS
Financial Statements 108 | Signed Reports 183 | Shareholding Details 195 | Glossary 201
36 RISK MANAGEMENT The Group adopts a ldquomanaged riskrdquo approach to its banking and insurance activities in which the articulation of a risk aware culture is prevalent throughout the Grouprsquos credit market liquidity insurance operational risk and compliance policies and procedures The Board has adopted policies in relation to the assessment management and monitoring of these risks and ownership of the frameworks within which these risks are managed reside with the Chief Risk Officer
The Chief Risk Officer contributes towards the achievement of the Grouprsquos corporate objectives through the operationalisation and progressive development of the Grouprsquos risk management function The continued improvement of the Grouprsquos risk management function focuses on a number of key areas with particular emphasis on
1 the efficiency and effectiveness of the Grouprsquos credit market liquidity operational risk and compliance management process controls and policies to support the Bankrsquos customer proposition in line with its risk appetite
2 providing management and the Board with risk reporting that contributes to the further development of sound corporate governance standards
3 maintaining regulatory compliance in line with regulatorsrsquo expectations and
4 contributing to the Group achieving risk based performance management
Group Risk is an independent function and is responsible for providing the framework policies and procedures needed for managing credit liquidity market operational risk and compliance throughout the Group Policies are set in line with the governing strategy and risk guidelines set by the Board
MonitoringThe Grouprsquos enterprise risk management framework incorporates active management and monitoring of a range of risks including (but not limited to)
1 Market
2 Credit and
3 Liquidity
(A) Market riskMarket risk is the risk that movements in market rates and prices will result in profits or losses to the Group The objective of market risk management is to manage and control market risk and to minimise its impact on the Group
(i) Interest rate risk managementThe operations of the Group are subject to the risk of interest rate fluctuations as a result of mismatches in the timing of the repricing of interest rates on the Grouprsquos assets and liabilities
The figures in the table below indicate the potential increase (decrease) in net interest income for an ensuing 12 month period of a one per cent parallel shock increase to the yield curve
CONSOLIDATED2021
$m2020
$m
Exposure at the end of the year 23 2
Average monthly exposure during the year 6 (2)
High month exposure during the year 23 7
Low month exposure during the year (6) (13)
(ii) Foreign exchange riskIt is the Bankrsquos policy not to carry material foreign exchange rate exposures net of associated hedging instruments in the banking book At balance date there are no net material foreign exchange rate exposures in the banking book
The Bank uses cross currency swaps and forward foreign exchange contracts to hedge its exchange rate exposures arising from borrowing off-shore in foreign currencies The Bank uses forward foreign exchange contracts to hedge potential exchange rate exposures created by customer-originated foreign currency transactions
The Bankrsquos investment in its New Zealand subsidiary is hedged by forward foreign exchange contracts which mitigate the currency risk arising from the subsidiaryrsquos net assets
144 Bank of Queensland Limited and its Controlled Entities
For the year ended 31 August 2021NOTES TO THE FINANCIAL STATEMENTS
Financial Statements 108 | Signed Reports 183 | Shareholding Details 195 | Glossary 201
36 RISK MANAGEMENT (CONTINUED)(A) Market risk (continued)
(iii) Traded market riskMarket risks attributable to trading activities are primarily measured using a historical simulation Value-at-Risk (VaR) model based on historical data VaR is a statistical technique used to quantify the potential loss in earnings from adverse market movements and is calculated over a one-day time horizon to a 99 per cent confidence level using two-years of historical data As an additional overlay to VaR the individual market risks of interest rate foreign exchange credit and equity are managed using a framework that includes stress testing scenario analysis sensitivity analysis and stop losses Risks are monitored and measured against limits delegated by the Asset-Liability Committee (ALCO) and approved by the Boardrsquos Risk Committee
The portfolio (interest rate foreign exchange credit and equity) VaR for the Bankrsquos trading portfolio for the year was as follows
Trading VaR2021
$m2020
$m
Average 045 064
Maximum 113 125
Minimum 020 019
(B) Credit risk Credit risk arises in the business from lending activities the provision of guarantees including letters of credit and commitments to lend investment in bonds and notes financial market transactions and other associated activities Credit risk is the potential loss arising from the possibility that customers or counterparties fail to meet contractual payment obligations to the Group as they fall due
The Board has implemented a structured framework of systems and controls to monitor and manage credit risk comprising
bull documented credit risk management principles which are disseminated to all staff involved with the lending process
bull documented policies
bull a process for approving risk based on tiered delegated approval authorities whereby the largest exposures are assessed by the Executive Credit Committee consisting of senior executives and senior risk managers chaired by the Chief Risk Officer
bull risk grading the Bankrsquos commercial exposures based on items inclusive of financial performance and stability organisational structure industry segment and security support Exposures within this segment of the portfolio are generally subject to annual review which may include reassessment of the assigned risk grade
bull an automated scorecard approval model for the Bankrsquos retail portfolio inclusive of home loans home equity lines of credit and personal loans This model is supported by experienced risk assessment managers and
bull a series of management reports detailing industry concentrations counterparty concentrations loan grades and security strength ratings
The Group uses derivative financial instruments to hedge its exposure to foreign exchange and interest rate risks arising from operating financing and investing activities In accordance with its treasury risk policies the Group can hold derivative financial instruments for trading purposes Credit risk on derivative contracts used for these purposes is minimised as counterparties are recognised financial intermediaries with acceptable credit ratings determined by a recognised rating agency
(i) Maximum exposure to credit riskThe amounts disclosed are the maximum exposure to credit risk before taking account of any collateral held or other credit enhancements For financial assets recognised on the Balance Sheet the exposure to credit risk equals their carrying amount For customer commitments the maximum exposure to credit risk is the full amount of the committed facilities as at reporting date
1452021 Annual Report
For the year ended 31 August 2021NOTES TO THE FINANCIAL STATEMENTS
Financial Statements 108 | Signed Reports 183 | Shareholding Details 195 | Glossary 201
36 RISK MANAGEMENT (CONTINUED)(B) Credit risk (continued)
(i) Maximum exposure to credit risk (continued)The carrying amount of financial assets represents the maximum credit exposure The maximum exposure to credit risk at the reporting date was
2021 2020
CONSOLIDATED Stage 1
$mStage 2
$mStage 3
$mTotal
$mTotal
$m
Cash and cash equivalents 2563 - - 2563 1353
Due from other financial institutions 827 - - 827 860
Other financial assets (including accrued interest) 10847 - - 10847 6444
Derivative financial instruments 137 - - 137 154
Financial assets other than loans and advances 14374 - - 14374 8811
Gross loans and advances 70688 4010 1050 75748 47135
Total financial assets 85062 4010 1050 90122 55946
Customer commitments (1) 5344 - - 5344 1926
Total potential exposure to credit risk 90406 4010 1050 95466 57872
2021 2020
BANKStage 1
$mStage 2
$mStage 3
$mTotal
$mTotal
$m
Cash and cash equivalents 1373 - - 1373 835
Due from other financial institutions 708 - - 708 826
Other financial assets (including accrued interest) 14385 - - 14385 14101
Derivative financial instruments 86 - - 86 101
Financial assets other than loans and advances 16552 - - 16552 15863
Gross loans and advances 40736 3617 693 45046 41794
Total financial assets 57288 3617 693 61598 57657
Customer commitments (1) 1541 - - 1541 1128
Total potential exposure to credit risk 58829 3617 693 63139 58785
(1) Refer to Note 52 for details of customer commitments
146 Bank of Queensland Limited and its Controlled Entities
For the year ended 31 August 2021NOTES TO THE FINANCIAL STATEMENTS
Financial Statements 108 | Signed Reports 183 | Shareholding Details 195 | Glossary 201
36 RISK MANAGEMENT (CONTINUED)(B) Credit risk (continued)
(i) Maximum exposure to credit risk (continued)The distribution of financial assets by credit quality at the reporting date was
Consolidated Bank
2021 $m
2020 $m
2021 $m
2020 $m
Neither past due or impaired
Gross loans and advances 72849 45479 43131 40269
Stage 1 69361 42288 40053 37716
Stage 2 3276 3065 2924 2423
Stage 3 212 126 154 130
Financial assets other than loans and advances 14374 8811 16552 15863
Stage 1 14374 8811 16552 15863
Stage 2 - - - -
Stage 3 - - - -
Past due but not impaired
Gross loans and advances 2656 1461 1735 1364
Stage 1 1327 635 683 574
Stage 2 734 540 693 511
Stage 3 595 286 359 279
Impaired
Gross loans and advances 243 195 180 161
Stage 1 - - - -
Stage 2 - - - -
Stage 3 243 195 180 161
Total financial assets 90122 55946 61598 57657
There is no individual exposure included in impaired assets which exceeds five per cent of shareholdersrsquo equity (2020 nil)
The Group holds collateral against loans and advances to customers in the form of mortgage interest over property other registered securities over assets and guarantees and mortgage insurance To mitigate credit risk the Group can take possession of or appoint receivers and managersadministrators to the collateral held against the loans and advances as a result of customer default To ensure reduced exposure to losses in such scenarios the collateral held by the Group is then realised in accordance with legal and regulatory requirements whilst also taking into consideration the individual circumstances of each matter
Estimates of fair value are based on the value of collateral assessed at the time of borrowing or for commercial exposures updated values as periodically obtained in accordance with the Group policy and regulatory requirements When a loan is individually assessed as impaired the value of collateral held is updated regularly to assess any specific provisioning requirements An estimate of the collateral held against past due but not impaired and impaired loans and advances at amortised cost is outlined below
Consolidated Bank
2021 $m
2020 $m
2021 $m
2020 $m
Held against past due but not impaired assets 7387 4204 5983 2721
Stage 1 3796 2724 2823 1276
Stage 2 2118 1002 2078 973
Stage 3 1473 478 1082 472
Held against impaired assets 212 141 141 121
Stage 1 - - - -
Stage 2 - - - -
Stage 3 212 141 141 121
1472021 Annual Report
For the year ended 31 August 2021NOTES TO THE FINANCIAL STATEMENTS
Financial Statements 108 | Signed Reports 183 | Shareholding Details 195 | Glossary 201
36 RISK MANAGEMENT (CONTINUED)(B) Credit risk (continued)
(ii) Credit qualityThe credit quality categories of financial assets have been determined based on Standard amp Poorrsquos credit ratings APRA risk weightings and the Bankrsquos standard risk grading The categories are classified as below
bull High grade - generally corresponds to Standard amp Poorrsquos credit ratings AAA+ to BBB-
bull Satisfactory - generally corresponds to Standard amp Poorrsquos credit rating BB+ to B
bull Weak - generally corresponds to Standard amp Poorrsquos credit ratings up to B and
bull Unrated - Loans and advances which have been classified as unrated are not secured however these are not deemed to be weak
The table below presents an analysis of the credit quality of financial assets
Consolidated
2021 $m
2020 $m
Gross loans amp advances Gross loans amp advances
Retail Commercial
Gross loans amp
advances
Other financial
assets Retail Commercial
Gross loans amp
advances
Other financial
assets
High Grade 50580 4625 55205 14365 25752 4320 30072 8805
Stage 1 48145 4505 52650 14365 24606 3964 28570 8805
Stage 2 2094 84 2178 - 1070 330 1400 -
Stage 3 341 36 377 - 76 26 102 -
Satisfactory 7731 9447 17178 - 5065 8831 13896 -
Stage 1 7221 8635 15856 - 4840 7935 12775 -
Stage 2 330 730 1060 - 199 855 1054 -
Stage 3 180 82 262 - 26 41 67 -
Weak 946 2036 2982 9 612 2365 2977 6
Stage 1 659 1140 1799 9 353 1035 1388 6
Stage 2 105 667 772 - 106 1045 1151 -
Stage 3 182 229 411 - 153 285 438 -
Unrated 155 228 383 - - 190 190 -
Stage 1 155 228 383 - - 190 190 -
Stage 2 - - - - - - - -
Stage 3 - - - - - - - -
59412 16336 75748 14374 31429 15706 47135 8811
148 Bank of Queensland Limited and its Controlled Entities
For the year ended 31 August 2021NOTES TO THE FINANCIAL STATEMENTS
Financial Statements 108 | Signed Reports 183 | Shareholding Details 195 | Glossary 201
36 RISK MANAGEMENT (CONTINUED)(B) Credit risk (continued)
(ii) Credit quality (continued)
Bank
2021 $m
2020 $m
Gross loans amp advances Gross loans amp advances
Retail Commercial
Gross loans amp
advances
Other financial
assets Retail Commercial
Gross loans amp
advances
Other financial
assets
High Grade 30739 4087 34826 15449 25752 3770 29522 15017
Stage 1 28478 4003 32481 15449 24606 3415 28021 15017
Stage 2 2094 51 2145 - 1070 329 1399 -
Stage 3 167 33 200 - 76 26 102 -
Satisfactory 2622 5967 8589 - 5065 5797 10862 32
Stage 1 2223 5318 7541 - 4840 4953 9793 32
Stage 2 330 588 918 - 199 799 998 -
Stage 3 69 61 130 - 26 45 71 -
Weak 857 740 1597 6 612 798 1410 6
Stage 1 571 109 680 6 353 123 476 6
Stage 2 105 449 554 - 106 431 537 -
Stage 3 181 182 363 - 153 244 397 -
Unrated 34 - 34 1097 - - - 808
Stage 1 34 - 34 1097 - - - 808
Stage 2 - - - - - - - -
Stage 3 - - - - - - - -
34252 10794 45046 16552 31429 10365 41794 15863
(iii) Loans and advances which were past due but not impaired Loans which are 90 or more days past due are not classified as impaired assets where the estimated net realisable value of the security is sufficient to cover the repayment of all principal and interest amounts due
Consolidated Bank
2021 $m
2020 $m
2021 $m
2020 $m
Less than 30 days - Retail 1184 392 635 392
- Commercial 711 503 618 436
30 to 89 days - Retail 349 86 105 86
- Commercial 90 47 66 27
90 days or more - Retail 213 305 212 305
- Commercial 109 129 99 118
2656 1462 1735 1364
1492021 Annual Report
For the year ended 31 August 2021NOTES TO THE FINANCIAL STATEMENTS
Financial Statements 108 | Signed Reports 183 | Shareholding Details 195 | Glossary 201
36 RISK MANAGEMENT (CONTINUED)(B) Credit risk (continued)
(iv) Concentration of exposure for gross loans and advancesConcentration of credit risk exists when a number of counterparties are engaged in similar activities operate in the same geographical areas or industry sectors and have similar economic characteristics so that their ability to meet contractual obligations is similarly affected by changes in economic political or other conditions The Group monitors concentrations of credit risk by geographical location for loans and advances An analysis of these concentrations of credit risk at the reporting date is shown below
Consolidated Bank
Geographical concentration of credit risk for loans and advances (before provisions and unearned income)
2021 $m
2020 $m
2021 $m
2020 $m
Queensland 24258 19633 18697 17793
New South Wales 23058 14543 15076 13205
Victoria 14924 6915 5951 5721
Northern Territory 449 253 237 234
Australian Capital Territory 1877 340 329 314
Western Australia 7477 3959 3735 3610
South Australia 2226 866 808 703
Tasmania 1170 234 227 214
International (New Zealand) 385 392 - -
75824 47135 45060 41794
150 Bank of Queensland Limited and its Controlled Entities
For the year ended 31 August 2021NOTES TO THE FINANCIAL STATEMENTS
Financial Statements 108 | Signed Reports 183 | Shareholding Details 195 | Glossary 201
36 RISK MANAGEMENT (CONTINUED)(C) Liquidity riskLiquidity risk arises from the possibility that the Group is unable to meet its financial obligations as they fall due Liquidity risk is managed through a series of detailed policies This includes the management of cash flow mismatches the maintenance of a stable core retail deposits base the diversification of the funding base and the retention of adequate levels of high quality liquid assets
The Group manages liquidity risk by maintaining sufficient cash balances and liquid assets continuously monitoring forecast and actual cash flows matching maturity profiles of financial assets and liabilities and monitoring liquidity scenario analyses
CONSOLIDATED 2021
Carrying amount
$mAt Call
$m
3 months or less
$m
3 to 12 months
$m
1 to 5 years
$m
Over 5 years
$m
Policy holder
$m
Total contractual
cash flows $m
FINANCIAL LIABILITIES
Due to other financial institutions 273 273 - - - - - 273
Deposits 65902 34732 16974 13346 988 - - 66040
Derivative financial instruments (1) 28 - 5 13 11 - - 29
Accounts payable and other liabilities 575 - 384 27 114 50 - 575
Securitisation liabilities (2) 7645 - 1702 1234 2807 2258 - 8001
Borrowings (3) 10078 - 622 1807 7620 265 - 10314
Liabilities held for sale 17 - - - - - 17 17
Total financial liabilities 84518 35005 19687 16427 11540 2573 17 85249
DERIVATIVE FINANCIAL INSTRUMENTS (HEDGING RELATIONSHIP)
Contractual amounts payable - 880 1196 1913 168 - 4157
Contractual amounts receivable - (809) (1079) (1574) (131) - (3593)
519 - 71 117 339 37 - 564
OFF BALANCE SHEET POSITIONS
Guarantees indemnities and letters of credit - 259 - - - - - 259
Customer funding commitments - 5085 - - - - - 5085
- 5344 - - - - - 5344
(1) Derivative financial instruments other than those designated in hedge relationships(2) Repayment of securitisation bonds is forecast based on the expected repayment profile of the underlying assets of the Trusts(3) Borrowings include the $3 billion TFF
1512021 Annual Report
For the year ended 31 August 2021NOTES TO THE FINANCIAL STATEMENTS
Financial Statements 108 | Signed Reports 183 | Shareholding Details 195 | Glossary 201
36 RISK MANAGEMENT (CONTINUED)(C) Liquidity risk (continued)
CONSOLIDATED 2020
Carrying amount
$mAt Call
$m
3 months or less
$m
3 to 12 months
$m
1 to 5 years
$m
Over 5 years
$m
Policy holder
$m
Total contractual
cash flows $m
FINANCIAL LIABILITIES
Due to other financial institutions 296 296 - - - - - 296
Deposits 39593 19773 11778 7264 943 - - 39758
Derivative financial instruments (1) 52 - 10 25 17 - - 52
Accounts payable and other liabilities 458 - 310 28 98 29 - 465
Securitisation liabilities (2) 3429 - 255 766 1973 551 - 3545
Borrowings (3) 7910 - 647 1016 6461 - - 8124
Insurance policy liabilities 5 - - - - - 5 5
Total financial liabilities 51743 20069 13000 9099 9492 580 5 52245
DERIVATIVE FINANCIAL INSTRUMENTS (HEDGING RELATIONSHIP)
Contractual amounts payable - 775 415 2433 139 - 3762
Contractual amounts receivable - (703) (260) (2041) (66) - (3070)
643 - 72 155 392 73 - 692
OFF BALANCE SHEET POSITIONS
Guarantees indemnities and letters of credit - 267 - - - - - 267
Customer funding commitments - 1659 - - - - - 1659
- 1926 - - - - - 1926
(1) Derivative financial instruments other than those designated in hedge relationships(2) Repayment of securitisation bonds is forecast based on the expected repayment profile of the underlying assets of the Trusts(3) Borrowings include the $08 billion TFF
152 Bank of Queensland Limited and its Controlled Entities
For the year ended 31 August 2021NOTES TO THE FINANCIAL STATEMENTS
Financial Statements 108 | Signed Reports 183 | Shareholding Details 195 | Glossary 201
36 RISK MANAGEMENT (CONTINUED)(C) Liquidity risk (continued)
BANK 2021
Carrying amount
$mAt Call
$m
3 months or less
$m
3 to 12 months
$m
1 to 5 years
$m
Over 5 years
$m
Total contractual
cash flows $m
FINANCIAL LIABILITIES
Due to other financial institutions 273 273 - - - - 273
Deposits 43569 23502 10971 8369 806 - 43648
Derivative financial instruments (1) 28 - 5 13 11 - 29
Accounts payable and other liabilities 360 - 212 28 98 29 367
Borrowings (2) 8806 - 621 1404 6745 265 9035
Amounts due to controlled entities 6241 6241 - - - - 6241
Total financial liabilities 59277 30016 11809 9814 7660 294 59593
Derivative financial instruments (hedging relationship)
Contractual amounts payable - 877 451 1095 168 2591
Contractual amounts receivable - (822) (299) (796) (131) (2048)
537 - 55 152 299 37 543
OFF BALANCE SHEET POSITIONS
Guarantees indemnities and letters of credit - 259 - - - - 259
Customer funding commitments - 1282 - - - - 1282
- 1541 - - - - 1541
BANK 2020
Carrying amount
$mAt Call
$m
3 months or less
$m
3 to 12 months
$m
1 to 5 years
$m
Over 5 years
$m
Total contractual
cash flows $m
FINANCIAL LIABILITIES
Due to other financial institutions 296 296 - - - - 296
Deposits 39810 19971 11797 7264 943 - 39975
Derivative financial instruments (1) 52 - 10 25 17 - 52
Accounts payable and other liabilities 385 - 237 28 98 29 392
Borrowings (3) 7914 - 647 1016 6461 - 8124
Amounts due to controlled entities 6707 6707 - - - - 6707
Total financial liabilities 55164 26974 12691 8333 7519 29 55546
DERIVATIVE FINANCIAL INSTRUMENTS (HEDGING RELATIONSHIP)
Contractual amounts payable - 775 411 848 139 2173
Contractual amounts receivable - (712) (273) (429) (66) (1480)
692 - 63 138 419 73 693
OFF BALANCE SHEET POSITIONS
Guarantees indemnities and letters of credit - 267 - - - - 267
Customer funding commitments - 861 - - - - 861
- 1128 - - - - 1128
(1) Derivative financial instruments other than those designated in hedge relationships (2) Borrowings include the $2 billion TFF(3) Borrowings include the $08 billion TFF
1532021 Annual Report
For the year ended 31 August 2021NOTES TO THE FINANCIAL STATEMENTS
Financial Statements 108 | Signed Reports 183 | Shareholding Details 195 | Glossary 201
37 FAIR VALUE OF FINANCIAL INSTRUMENTS(A) Fair value of financial instrumentsThe financial assets and liabilities listed below are recognised and measured at fair value and therefore their carrying value equates to their fair value
bull Derivatives
bull Financial instruments designated at FVTPL and
bull Financial instruments designated at FVOCI
The fair value estimates for instruments carried at amortised cost materially equate to their carrying value and are based on the following methodologies and assumptions
Cash and cash equivalents due from and to other financial institutions accounts payable and other liabilitiesThe fair value approximates to their carrying value as they are short term in nature or are receivable or payable on demand
Loans and advancesLoans and advances are net of specific and collective provisions for impairment and unearned income The fair values of loans and advances that reprice within six months of year ending 31 August 2021 are assumed to equate to the carrying value The fair values of all other loans and advances are calculated using discounted cash flow models based on the maturity of the loans and advances
The discount rates applied are based on the current interest rates at the reporting date for similar types of loans and advances if the loans and advances were performing at the reporting date The differences between estimated fair values and carrying values reflect changes in interest rates and creditworthiness of borrowers since loan or advance origination
Deposits The fair value of non-interest bearing at call and variable rate deposits and fixed rate deposits repricing within six months is the carrying value The fair value of other term deposits is calculated using discounted cash flow models based on the deposit type and its related maturity
Borrowings The fair values are calculated based on a discounted cash flow model using a yield curve appropriate to the remaining maturity of the instruments
154 Bank of Queensland Limited and its Controlled Entities
For the year ended 31 August 2021NOTES TO THE FINANCIAL STATEMENTS
Financial Statements 108 | Signed Reports 183 | Shareholding Details 195 | Glossary 201
37 FAIR VALUE OF FINANCIAL INSTRUMENTS (CONTINUED)(B) Fair value hierarchyThe Group measures fair values using the following fair value hierarchy and valuation techniques which reflect the significance of the inputs used in making the measurements
bull Level 1 This category includes assets and liabilities for which the valuation is determined from inputs based on unadjusted quoted market prices in active markets for identical instruments
bull Level 2 This category includes assets and liabilities for which the valuation is determined from inputs other than quoted prices included within level 1 which are observable either directly or indirectly This includes the use of discounted cash flow analysis option pricing models and other market accepted valuation models and
bull Level 3 This category includes assets and liabilities for which the valuation includes inputs that are not based on observable market data This includes equity instruments where there are no quoted market prices
The fair value hierarchy classification of instruments held at amortised cost
bull Debt instruments at amortised cost ndash Level 2
bull Loans and advances - Level 3
bull Deposits and borrowings - Level 2
There was no movement between levels during the year
The table below analyses financial instruments carried at fair value by valuation method
2021
CONSOLIDATED Level 1
$mLevel 2
$mLevel 3
$mTotal
$m
Financial instruments measured at fair value
Derivative financial assets - 137 - 137
Financial assets at FVTPL 43 1044 - 1087
Debt instruments at FVOCI 6309 3392 - 9701
Equity instruments at FVOCI - - 9 9
6352 4573 9 10934
Derivative financial liabilities - (653) - (653)
6352 3920 9 10281
2020
CONSOLIDATED Level 1
$mLevel 2
$mLevel 3
$mTotal
$m
Financial instruments measured at fair value
Derivative financial assets - 154 - 154
Financial assets at FVTPL - 1854 - 1854
Debt instruments at FVOCI 4125 405 - 4530
Equity instruments at FVOCI - - 6 6
4125 2413 6 6544
Derivative financial liabilities - (803) - (803)
4125 1610 6 5741
1552021 Annual Report
For the year ended 31 August 2021NOTES TO THE FINANCIAL STATEMENTS
Financial Statements 108 | Signed Reports 183 | Shareholding Details 195 | Glossary 201
37 FINANCIAL INSTRUMENTS (CONTINUED)(B) Fair value hierarchy (continued)
2021
BANKLevel 1
$mLevel 2
$mLevel 3
$mTotal
$m
Financial instruments measured at fair value
Derivative financial assets - 86 - 86
Financial assets at FVTPL 43 1044 - 1087
Debt instruments at FVOCI 5061 487 - 5548
Equity instruments at FVOCI - - 6 6
5104 1617 6 6727
Derivative financial liabilities - (620) - (620)
5104 997 6 6107
2020
BANKLevel 1
$mLevel 2
$mLevel 3
$mTotal
$m
Financial instruments measured at fair value
Derivative financial assets - 101 - 101
Financial assets at FVTPL - 1854 - 1854
Debt instruments at FVOCI 4125 405 - 4530
Equity instruments at FVOCI - - 6 6
4125 2360 6 6491
Derivative financial liabilities - (799) - (799)
4125 1561 6 5692
156 Bank of Queensland Limited and its Controlled Entities
For the year ended 31 August 2021NOTES TO THE FINANCIAL STATEMENTS
Financial Statements 108 | Signed Reports 183 | Shareholding Details 195 | Glossary 201
38 DERIVATIVE FINANCIAL INSTRUMENTS AND HEDGE ACCOUNTING(A) Fair value of derivativesThe following tables summarise the notional and fair value of the Grouprsquos and Bankrsquos commitments to derivative financial instruments at reporting date Fair value in relation to derivative financial instruments is estimated using net present value techniques The tables below set out the fair values of the derivative financial instruments
Consolidated
2021 2020
Notional Amount Fair Value
Notional Amount Fair Value
$m Asset
$mLiability
$m $m Asset
$mLiability
$m
DERIVATIVES AT FAIR VALUE THROUGH PROFIT OR LOSS
Interest rate swaps 10232 30 (27) 13118 44 (50)
Foreign exchange forwards 51 1 (1) 93 2 (2)
Futures 57 - - 281 - -
10340 31 (28) 13492 46 (52)
DERIVATIVES HELD AS CASH FLOW HEDGES
Interest rate swaps 29971 23 (103) 15503 26 (147)
Cross currency swaps 2185 70 (22) 1997 78 (8)
Foreign exchange forwards 755 11 (4) 731 4 (23)
32911 104 (129) 18231 108 (178)
DERIVATIVES DESIGNATED AS FAIR VALUE HEDGES
Interest rate swaps 4491 2 (496) 3597 - (573)
DERIVATIVES DESIGNATED AS NET INVESTMENT HEDGES
Foreign exchange forwards 27 - - 25 - -
47769 137 (653) 35345 154 (803)
1572021 Annual Report
For the year ended 31 August 2021NOTES TO THE FINANCIAL STATEMENTS
Financial Statements 108 | Signed Reports 183 | Shareholding Details 195 | Glossary 201
38 DERIVATIVE FINANCIAL INSTRUMENTS AND HEDGE ACCOUNTING (CONTINUED)(A) Fair value of derivatives (continued)
Bank
2021 2020
Notional Amount Fair Value
Notional Amount Fair Value
$m Asset
$mLiability
$m $m Asset
$mLiability
$m
DERIVATIVES AT FAIR VALUE THROUGH PROFIT OR LOSS
Interest rate swaps 8032 30 (27) 13118 44 (50)
Foreign exchange forwards 77 1 (1) 118 2 (2)
Futures 57 - - 281 - -
8166 31 (28) 13517 46 (52)
DERIVATIVES HELD AS CASH FLOW HEDGES
Interest rate swaps 22415 35 (82) 16171 42 (147)
Cross currency swaps 631 7 (10) 443 9 (4)
Foreign exchange forwards 755 11 (4) 731 4 (23)
23801 53 (96) 17345 55 (174)
DERIVATIVES DESIGNATED AS FAIR VALUE HEDGES
Interest rate swaps 4491 2 (496) 3597 - (573)
36458 86 (620) 34459 101 (799)
(B) Hedging strategyThe Group and Bank used derivative financial instruments for both hedging and trading purposes in the current year and prior year Refer to Note 36 (A) for an explanation of the Grouprsquos and Bankrsquos risk management framework The Group uses derivative financial instruments to hedge its exposure to foreign exchange and interest rate risks arising from operating financing and investing activities
The Grouprsquos hedging strategy is to protect net interest income from variability in interest rates in Australian dollars This requires the Group to enter into interest rate swaps allowing for the reduction in interest rate risk
Foreign currency exposures are swapped to Australian dollars using cross currency interest rate swaps These cross currency swaps will be matched to the underlying interest rate exposure of fixed or floating respectively
The majority of exposures are managed under the above strategy Where a risk is within agreed limits the Group may decide not to apply hedge accounting to that risk Instead the Group will manage its exposure under broader risk management processes
(C) Accounting for derivativesIn accordance with its treasury risk policies the Group can hold derivative financial instruments for trading purposes Derivatives that do not qualify for hedge accounting are accounted for as trading instruments
Derivative financial instruments are initially measured at fair value Subsequent to initial recognition gains or losses on derivatives are recognised in the Income Statement unless they are entered into for hedging purposes
The fair value of interest rate swaps is the estimated amount that the Group would receive or pay to terminate the swap at the reporting date taking into account current interest rates and current creditworthiness of the swap counterparties
The fair value of forward exchange contracts is their quoted market price at the reporting date being the present value of the quoted forward price The fair value of futures contracts is their quoted market price
158 Bank of Queensland Limited and its Controlled Entities
For the year ended 31 August 2021NOTES TO THE FINANCIAL STATEMENTS
Financial Statements 108 | Signed Reports 183 | Shareholding Details 195 | Glossary 201
38 DERIVATIVE FINANCIAL INSTRUMENTS AND HEDGE ACCOUNTING (CONTINUED)(C) Accounting for derivatives (continued)The following table shows the maturity profile of hedging derivatives based on their notional amounts
2021 2020
CONSOLIDATED
0 to 12 months
$m
1 to 5 years
$m
Over 5 years
$mTotal
$m
0 to 12 months
$m
1 to 5 years
$m
Over 5 years
$mTotal
$m
Interest rate swaps 22725 19819 2150 44694 19734 10490 1994 32218
Foreign exchange forwards 833 - - 833 849 - - 849
Futures 57 - - 57 281 - - 281
Cross currency swaps 831 1314 40 2185 154 1842 1 1997
(D) Hedging relationships
Cash flow hedges Where a derivative financial instrument is designated as a hedge of the variability of the cash flows of a recognised asset or liability or a highly probable forecasted transaction the effective part of any gain or loss on the derivative financial instrument is recognised directly in other comprehensive income and accumulated in reserves in equity The ineffective portion of any gain or loss is recognised immediately in profit or loss in the Income Statement If a hedge of a forecast transaction subsequently results in the recognition of a financial asset or a financial liability then the associated gains and losses previously recognised directly in other comprehensive income are reclassified to profit or loss in the Income Statement in the same period or periods in which the asset acquired or liability assumed affects the Income Statement (ie when interest income or expense is recognised)
When a hedging instrument expires or is sold terminated or exercised or the Group revokes designation of the hedge relationship and the hedged forecast transaction is still expected to occur the cumulative gain or loss at that point remains in other comprehensive income and is recognised in profit or loss in the Income Statement when the transaction occurs If the hedged transaction is no longer expected to take place then the cumulative unrealised gain or loss is recognised immediately in profit or loss in the Income Statement
Net investment hedge Hedges of net investments in foreign operations are accounted for similarly to cash flow hedges Any foreign currency gain or loss on the hedging instrument relating to the effective portion of the hedge is recognised in other comprehensive income To the extent the hedge is ineffective a portion is recognised immediately in the Income Statement within other income or other expenses
1592021 Annual Report
For the year ended 31 August 2021NOTES TO THE FINANCIAL STATEMENTS
Financial Statements 108 | Signed Reports 183 | Shareholding Details 195 | Glossary 201
38 DERIVATIVE FINANCIAL INSTRUMENTS AND HEDGE ACCOUNTING (CONTINUED)(D) Hedging relationships (continued) The following table shows the executed rates for the most significant hedging instruments that have been designated in cash flow hedges and net investment hedges that are in place at the balance date
Consolidated
Hedging Instruments Currency 2021 2020
Cash flow hedges Interest rate swaps AUD 0010 - 3890 0090 - 4340
Cash flow hedges Cross currency swaps AUDUSD 0761 - 0793 0761 - 0793
AUDEUR 0617 - 0672 0617-0672
NZDAUD 1036 - 1119 1036-1130
Net Investment hedges Foreign exchange forwards AUDNZD 1049 1082
Fair value hedgesFair value hedges are used by the Group to manage exposure to changes in the fair value of an asset Changes in fair values arise from fluctuations in interest rates The Group principally uses interest rate swaps to protect against such fluctuations
Changes in the value of fair value hedges are recognised in the Income Statement together with changes in the fair value of the hedged asset or liability that are attributable to the hedged risk
All gains and losses associated with the ineffective portion of fair value hedge relationships are recognised immediately in the Income Statement
If the hedge relationship no longer meets the criteria for hedge accounting it is discontinued The fair value adjustment to the hedged item is amortised to the Income Statement from the date of discontinuation over the period to maturity of the previously designated hedge relationship using the effective interest method If the hedged item is sold or repaid the unamortised fair value adjustment is recognised immediately in the Income Statement
160 Bank of Queensland Limited and its Controlled Entities
For the year ended 31 August 2021NOTES TO THE FINANCIAL STATEMENTS
Financial Statements 108 | Signed Reports 183 | Shareholding Details 195 | Glossary 201
38 DERIVATIVE FINANCIAL INSTRUMENTS AND HEDGE ACCOUNTING (CONTINUED)(D) Hedging relationships (continued) The following table shows the carrying value of hedged items designated in fair value hedge accounting relationships and the cumulative fair value hedge accounting adjustment that has been recognised as part of that carrying value These balances are being amortised to the Income Statement on an effective yield basis The Group does not hedge its entire exposure to a class of financial instruments nor does it apply hedge accounting in all instances therefore the carrying amounts below will not equal the total carrying amounts disclosed in other notes to these financial statements As noted in the Grouprsquos accounting policies since the hedged item is adjusted only for the hedged risk the hedged itemrsquos carrying value disclosed in the table will not be equivalent to its fair value as disclosed in other notes to these financial statements The accumulated amount of fair value hedge adjustments remaining in the Balance Sheet for hedged items that have ceased to be adjusted for hedging gains and losses is nil (2020 nil) for the Group
Consolidated
2021 2020
Carrying value (1) $m
Fair value hedge adjustments
Debit(Credit) $m
Carrying value (1) $m
Fair value hedge adjustments
Debit(Credit) $m
ASSETS
Debt instruments at FVOCI 5041 (194) 4167 (303)
(1) The carrying amounts in the table above exclude accrued interest from the carrying amount of hedged items
Derivatives that do not qualify for hedge accounting Certain derivative instruments do not qualify for hedge accounting Changes in the fair value of any derivative instrument that does not qualify for hedge accounting are recognised immediately in the Income Statement and are included in other income
(E) Hedge ineffectivenessHedge ineffectiveness in the case of a fair value hedge is the extent to which the changes in the fair value of the hedging instrument differ to that of the hedged item and in the case of cash flow and net investment hedge relationships the extent to which the change in the hedging instrument exceeds that of the hedged item Sources of hedge ineffectiveness primarily arise from basis and timing differences between the hedged items and hedging instruments
The following table contains the hedge ineffectiveness associated with cash flow hedge and fair value hedge relationships during the period as reported in Other operating income in the Income Statement
Consolidated
2021 2020
Gains(losses) on hedge
instruments $m
Gains(losses) on hedge items
$m
Hedge Ineffectiveness
$m
Gains(losses) on hedge
instruments $m
Gains(losses) on hedge items
$m
Hedge Ineffectiveness
$m
INTEREST RATE RISK
Fair value hedges
Interest rate swaps 109 (109) - 6 (7) (1)
Cash flow hedges
Interest rate swaps 70 (67) 3 (1) (6) (7)
INTEREST RATE AND FOREIGN EXCHANGE RISK
Fair value and cash flow hedges
Cross currency swaps (9) 9 - 41 (41) -
1612021 Annual Report
For the year ended 31 August 2021NOTES TO THE FINANCIAL STATEMENTS
Financial Statements 108 | Signed Reports 183 | Shareholding Details 195 | Glossary 201
38 DERIVATIVE FINANCIAL INSTRUMENTS AND HEDGE ACCOUNTING (CONTINUED)(F) Master netting or similar arrangementsThe Group enters into derivative transactions under International Swaps and Derivatives Association (ISDA) master netting agreements Amounts owed by each counter party are aggregated into a single net amount that is payable by one party to another The Group receives and gives collateral in the form of cash in respect of derivatives and such collateral is subject to standard industry terms The Group has not offset these amounts in the Balance Sheet as their ISDA agreements do not meet the criteria to do so The Group has no current legally enforceable right to offset recognised amounts as the right to offset is only enforceable on the occurrence of future events The Group normally settles on a net basis or realises the derivative assets and liabilities simultaneously
The following tables set out the effect of netting arrangements on derivative financial assets and derivative financial liabilities if they were to be applied
2021
CONSOLIDATED
Gross amounts as presented in the Balance
Sheet$m
Net amounts of recognised assets and liabilities available for
offset $m
Calculated Balance
$m
Cash collateral
$m
Net amounts if offsetting applied in
the Balance Sheet $m
Derivative financial assets 137 (51) 86 - 86
Derivative financial liabilities (653) 51 (602) 579 (23)
2020
CONSOLIDATED
Gross amounts as presented in the
Balance Sheet$m
Net amounts of recognised assets and
liabilities available for offset
$m
Calculated Balance
$m
Cash collateral
$m
Net amounts if offsetting applied in
the Balance Sheet $m
Derivative financial assets 154 (48) 106 - 106
Derivative financial liabilities (803) 48 (755) 745 (10)
2021
BANK
Gross amounts as presented in the
Balance Sheet$m
Net amounts of recognised assets and
liabilities available for offset
$m
Calculated Balance
$m
Cash collateral
$m
Net amounts if offsetting applied in
the Balance Sheet $m
Derivative financial assets 86 (51) 35 - 35
Derivative financial liabilities (620) 51 (569) 565 (4)
2020
BANK
Gross amounts as presented in the
Balance Sheet$m
Net amounts of recognised assets and
liabilities available for offset
$m
Calculated Balance
$m
Cash collateral
$m
Net amounts if offsetting applied in
the Balance Sheet $m
Derivative financial assets 101 (48) 53 - 53
Derivative financial liabilities (799) 48 (751) 745 (6)
162 Bank of Queensland Limited and its Controlled Entities
For the year ended 31 August 2021NOTES TO THE FINANCIAL STATEMENTS
Financial Statements 108 | Signed Reports 183 | Shareholding Details 195 | Glossary 201
39 CAPITAL MANAGEMENTThe Bank and Grouprsquos capital management strategy aims to ensure adequate capital levels are maintained to protect deposit holders The Bankrsquos capital is measured and managed in line with Prudential Standards issued by APRA The capital management plan is updated annually and submitted to the Board for approval The approval process is designed to ensure the plan is consistent with the overall business plan and for managing capital levels on an ongoing basis
BOQ intends to operate above the CET1 capital target range of between 90 per cent and 95 per cent until the final impacts of APRArsquos changes to risk weighted assets and capital calibration are understood At 980 per cent BOQ is operating above the top end of the target range and this includes the impact of the acquisition of ME Bank completed on 1 July 2021
QUALIFYING CAPITAL FOR LEVEL 2 ENTITIES (1)2021
$m2020
$m
Common Equity Tier 1 Capital
Paid-up ordinary share capital 5213 3871
Reserves 346 134
Retained profits including current year profits 277 163
Total Common Equity Tier 1 Capital 5836 4168
Regulatory adjustments
Goodwill and intangibles (1180) (908)
Deferred expenditure (311) (187)
Other deductions (11) 16
Total regulatory adjustments (1502) (1079)
Net Common Equity Tier 1 Capital 4334 3089
Additional Tier 1 Capital 610 350
Net Tier 1 Capital 4944 3439
Tier 2 Capital
Tier 2 Capital 450 350
General reserve for credit losses 178 230
Net Tier 2 Capital 628 580
Capital base 5572 4019
Risk Weighted Assets 44229 31576
Common Equity Tier 1 Capital 980 978
Net Tier 1 Capital ratio 1118 1089
Total Capital Adequacy Ratio 1260 1273
(1) APRA Prudential Standard APS 001 Definitions defines Level 2 as the Bank and all of its subsidiary entities other than non-consolidated subsidiaries The non-consolidated subsidiaries excluded from Level 2 regulatory measurements at 31 August 2021 arebull Bank of Queensland Limited Employee Share Plans Trustbull Home Credit Management Pty Ltdbull St Andrewrsquos Australia Services Pty Ltdbull St Andrewrsquos Life Insurance Pty Ltdbull St Andrewrsquos Insurance (Australia) Pty Ltdbull Series 2012-1E REDS Trustbull Series 2013-1 REDS Trustbull Series 2015-1 REDS Trustbull Series 2017-1 REDS Trust bull Series 2018-1 REDS Trust bull Series 2019-1 REDS Trustbull SMHL Series Securitisation Fund 2015-1bull SMHL Series Securitisation Fund 2016-1bull SMHL Series Securitisation Fund 2017-1bull SMHL Series Securitisation Fund 2018-2bull SMHL Series Securitisation Fund 2019-1bull SMHL Series Private Placement Trust 2019-1bull SMHL Series Private Placement 2019-2 andbull SMHL Securitisation Trust 2020-1
1632021 Annual Report
For the year ended 31 August 2021NOTES TO THE FINANCIAL STATEMENTS
Financial Statements 108 | Signed Reports 183 | Shareholding Details 195 | Glossary 201
310 CAPITAL AND RESERVES(A) Ordinary shares
Ordinary shares Ordinary shares are classified as equity Incremental costs directly attributable to the issue of ordinary shares and share rights are recognised as a deduction from equity net of any tax effects
Treasury sharesOrdinary shares of the Bank may be purchased from time to time by a controlled entity of the Bank pursuant to the Awards Rights Plan Equity Incentive Plan Restricted Shares Non-Executive Director Fee Sacrifice Rights Plan and the BOQ Employee ThankQ Plan Where these shares remain unvested to employees they are treated as treasury shares and deducted from capital as required by AASB 132 Financial Instruments Presentation No profit or loss is recorded on purchase sale issue or cancellation of these shares
Terms and conditionsHolders of ordinary shares are entitled to receive dividends as determined by the Bank and are entitled to one vote per share at shareholdersrsquo meetings In the event of a winding up of the Bank ordinary shareholders rank after capital note holders and creditors and are fully entitled to any residual proceeds of liquidation
Consolidated Bank
2021 No of shares
2020 No of shares
2021 No of shares
2020 No of shares
MOVEMENTS DURING THE YEAR
Balance at the beginning of the year ndash fully paid 454335413 405784809 454335413 405784809
Dividend reinvestment plan (1) 2386974 3642826 2386974 3642826
Issues of ordinary shares (2) 130000 440000 130000 440000
Institutional share placement (3) 47619048 32133677 47619048 32133677
Institutional entitlement offer (4) 43684531 - 43684531 -
Retail entitlement offer (5) 92733597 - 92733597 -
Share purchase plan (6) - 12334101 - 12334101
Balance at the end of the year ndash fully paid 640889563 454335413 640889563 454335413
Treasury shares (included in ordinary shares above)
Balance at the beginning of the year 633187 644034 - -
Net acquisitions and disposals during the year 495484 (10847) - -
Balance at the end of the year 1128671 633187 - -
(1) 11 per cent of the dividend paid on 26 May 2021 and 13 per cent of the dividend paid on 25 November 2020 were reinvested by shareholders as part of the dividend reinvestment plan 25 per cent of the dividend paid on 27 November 2019 was reinvested by shareholders as part of the dividend reinvestment plan in prior year
(2) On 9 November 2020 130000 ordinary shares were issued at $637 to the trustee of the Bank of Queensland Limited Employee Share Plans Trust to satisfy the issue of shares under the BOQ Employee ThankQ Plan On 29 November 2019 440000 ordinary shares were issued at $833 to the trustee of the Bank of Queensland Limited Employee Share Plans Trust to satisfy the exercise of award rights and issue of shares under the Award Rights Plan and the issue of shares under the BOQ Restricted Share Plan and the BOQ Employee Share Plan
(3) On 23 February 2021 the Bank completed an institutional placement of new fully paid ordinary shares at the offer price of $735 per share The shares were issued on 3 March 2021 On 26 November 2019 the Bank completed an institutional share placement of new fully paid ordinary shares at an issue price of $778 per share The shares were issued on 29 November 2019
(4) On 23 February 2021 the Bank completed an underwritten 1 for 334 accelerated pro-rata non-renounceable institutional entitlement offer at the offer price of $735 per share The shares were issued on 3 March 2021
(5) On 15 March 2021 the Bank completed an underwritten 1 for 334 accelerated pro-rata non-renounceable retail entitlement offer at the offer price of $735 per share The shares were issued on 17 March 2021
(6) On 30 December 2019 the Bank completed the share purchase plan of new fully paid ordinary shares at an issue price of $727 per share The shares were issued on 2 January 2020
164 Bank of Queensland Limited and its Controlled Entities
For the year ended 31 August 2021NOTES TO THE FINANCIAL STATEMENTS
Financial Statements 108 | Signed Reports 183 | Shareholding Details 195 | Glossary 201
310 CAPITAL AND RESERVES (CONTINUED)(B) Other equity instrumentsOther equity instruments of $314 million include Additional Tier 1 (AT1) securities assumed on the acquisition of ME Bank The securities are perpetual non-cumulative subordinated and unsecured notes (AT1 Capital Notes) and are structured to constitute AT1 capital of ME Bank The AT1 Capital Notes were recognised at fair value on acquisition the face value of the AT1 Capital Notes on issue is $300 million at a price of $10000 per note
Earliest redemption date
2021 No of Capital Notes
2020No of Capital Notes
AT1 EQUITY INSTRUMENTS
AT1 Capital Notes 28112022 20000 -
AT1 Capital Notes 5122023 10000 -
Total AT1 equity instruments 30000 -
The principal terms of the AT1 Capital Notes are described below
bull In a winding up of ME Bank if the AT1 Capital Notes have not been written-off on account of a non-viability trigger event they will rank for payment
bull Ahead of common equity
bull Equally without any preference amongst themselves for each series and with the holders of equal ranking instruments and
bull Behind the claims of subordinated tier 2 instruments and the senior creditors of ME Bank
bull AT1 Capital Notes are undated and unless a tax event or regulatory event occurs are only redeemable at the option of ME Bank on or after the fifth anniversary of the date of issue subject to regulatory approval
bull AT1 Capital Notes pay quarterly floating rate non-cumulative distributions The payment of distributions is at the discretion of ME Bank and subject to no payment condition existing at the payment date and
bull Some or all of the AT1 Capital Notes must be written-off if a non-viability trigger event as determined by APRA occurs
(C) Nature and purpose of reserves
Employee benefits reserve The employee benefits reserve is used to record the value of share based payments provided to employees including key management personnel as part of their remuneration Refer to Note 51 for further details of these plans
Equity reserve for credit losses The Bank is required by APRA to maintain a general reserve for credit losses Consistent with the requirements of APRA Prudential Standard APS 220 Credit Quality the equity reserve for credit losses represents the difference between the accounting collective provisions for impairment and the estimate of credit losses across the credit cycle The equity reserve for credit losses and the eligible component of the collective provision for impairment are aggregated for the purpose of satisfying the APRA requirement for a general reserve for credit losses
Profit reserve The profit reserve represents accumulated profits available for distribution as a dividend
Other reserves FVOCI - Changes in the fair value of financial assets classified as debt and equity instruments at FVOCI are recognised in other comprehensive income as described in Note 32 and accumulated in a separate reserve within equity For debt instruments at FVOCI amounts are reclassified to Other operating income in the Income Statement when the associated assets are sold or impaired For equity instruments at FVOCI amounts are not subsequently transferred to the Income Statement when the associated assets are sold or impaired but can be reclassified to retained profits
Cash flow hedge reserve The hedging reserve is used to record gains or losses on a hedging instrument in a cash flow hedge that are recognised in other comprehensive income as described in Note 38 (D)
Share revaluation reserveThe share revaluation reserve represents the gain or loss on revaluation of the shares held within the employee share plan trust The revaluation of treasury shares is netted off in equity
1652021 Annual Report
For the year ended 31 August 2021NOTES TO THE FINANCIAL STATEMENTS
Financial Statements 108 | Signed Reports 183 | Shareholding Details 195 | Glossary 201
NOTE 4 OTHER ASSETS AND LIABILITIES 41 INTANGIBLE ASSETS
CONSOLIDATEDGoodwill
$m
Customer related
intangibles and brands
$m
Computer software
$m
Assets under construction
$mOther
$mTotal
$m
Balance as at 1 September 2019 682 9 115 117 1 924
Opening balance adjustment (1) 3 - - - - 3
Additions - - - 100 2 102
Transfers to asset - - 56 (56) - -
Impairment - - - (39) - (39)
Amortisation charge - (2) (39) - (3) (44)
Accelerated amortisation charge - - (37) (1) - (38)
Balance as at 31 August 2020 685 7 95 121 - 908
Balance as at 1 September 2020 685 7 95 121 - 908
Acquisition of ME Bank 35 57 72 40 - 204
Additions - - 6 113 - 119
Transfers to asset - - 134 (134) - -
Amortisation charge - (4) (43) - - (47)
Accelerated amortisation charge (2) - - (4) - - (4)
Balance as at 31 August 2021 720 60 260 140 - 1180
BANKGoodwill
$m
Customer related
intangibles and brands
$m
Computer software
$m
Assets under construction
$mOther
$mTotal
$m
Balance as at 1 September 2019 619 8 103 117 1 848
Opening balance adjustment (1) 3 - - - - 3
Additions - - - 100 1 101
Transfers to asset - - 56 (56) - -
Impairment - - - (39) - (39)
Amortisation charge - (2) (35) - (2) (39)
Accelerated amortisation charge - - (35) (1) - (36)
Balance as at 31 August 2020 622 6 89 121 - 838
Balance as at 1 September 2020 622 6 89 121 - 838
Additions - - 6 109 - 115
Transfers to asset - - 132 (132) - -
Amortisation charge - (2) (35) - - (37)
Accelerated amortisation charge - - (1) - - (1)
Balance as at 31 August 2021 622 4 191 98 - 915
(1) The opening balance adjustment reflects the recognition of a DTL on the balance of intangible assets acquired as part of historic acquisitions This amount is not allocated to CGUs and the DTL is expected to unwind over 3 years
(2) The August 2021 financial results include a non-recurring adjustment due to a change in the ME Bank minimum threshold for the capitalisation of intangible assets to align with BOQ
166 Bank of Queensland Limited and its Controlled Entities
For the year ended 31 August 2021NOTES TO THE FINANCIAL STATEMENTS
Financial Statements 108 | Signed Reports 183 | Shareholding Details 195 | Glossary 201
41 INTANGIBLE ASSETS (CONTINUED)Recognition and measurementIntangible assets are measured at cost on initial recognition Intangible assets acquired in a business combination are measured at fair value at the date of acquisition
Following initial recognition intangible assets are stated at cost less any accumulated amortisation and any impairment losses Expenditure on internally generated goodwill research costs and brands is recognised in the Income Statement as an expense as incurred
Subsequent expenditure on intangible assets is capitalised only when it increases the future economic benefits embodied in the specific asset to which it relates All other expenditure is expensed as incurred
AmortisationExcept for goodwill amortisation is charged to profit or loss in the Income Statement on a straight-line basis over the estimated useful life of the intangible asset unless the life of the intangible asset is indefinite Where applicable intangible assets are amortised from the date they are available for use The amortisation period and method are reviewed on an annual basis The amortisation rates used in the current and comparative periods are as follows
Years
Computer software 3-10
Customer related intangibles and brands 3-10
Impairment testing of the Cash-Generating Units containing goodwillFor the purpose of the annual impairment test goodwill is allocated to groups of Cash-Generating Units (CGUs) which represent the Controlled Entityrsquos operating segments - Retail Banking and BOQ Business (refer Note 25) The carrying amount of each CGU is compared to its recoverable amount The recoverable amount is based on the CGUrsquos value in use
Value in use is determined by discounting the future cash flows generated from the continued use of the CGU The values assigned to the key assumptions represent managementrsquos assessments of future trends in retail and business banking and are based on both external and internal sources
Below are the key assumptions used in determining value in use
bull Cash flows are materially aligned with the Grouprsquos Strategic Plan as announced to market as part of the Bankrsquos strategic review
bull Determined future lending growth and income growth in line with expected benefits from the Bankrsquos increased capital investment and digital transformation
bull Cost growth assumptions are aligned with the Grouprsquos Strategic plan and aspirations to reduce cost to income targets
bull A terminal growth rate of 3 per cent (2020 25 per cent) was used to extrapolate long-term growth and
bull A post-tax discount rate of 94 per cent (2020 94 per cent) was used
bull Goodwill of $35 million arising on the acquisition of ME Bank is not included for the purpose of the annual impairment testing The goodwill has been assessed by applying the acquisition method in business combination accounting on 1 July 2021 The goodwill recognised of $35 million represents the fair value of expected future synergies arising from the acquisition
The key assumptions described above may change as economic and market conditions change Management has stressed key assumptions to understand key sensitivities and impact to the value in use
1672021 Annual Report
For the year ended 31 August 2021NOTES TO THE FINANCIAL STATEMENTS
Financial Statements 108 | Signed Reports 183 | Shareholding Details 195 | Glossary 201
41 INTANGIBLE ASSETS (CONTINUED)Impairment testing of the cash generating units containing goodwill (continued)The aggregate carrying amounts of goodwill for each CGU are
2021$m
2020 $m
Retail Banking 288 288
BOQ Business 394 394
Total 682 682
The measurement of the CGUrsquos recoverable amounts is most sensitive to a change in net interest income cost of capital and cost to income ratios BOQ has considered reasonably possible changes in key assumptions and the table below provides these assumption changes across the period of assessment that would result in impairment if all other assumptions were held constant
Model Parameter Retail Banking BOQ Business
Change from base case
Cost of capital 06 08
Cost to income 30 40
NIM change (5bps) (11bps)
168 Bank of Queensland Limited and its Controlled Entities
For the year ended 31 August 2021NOTES TO THE FINANCIAL STATEMENTS
Financial Statements 108 | Signed Reports 183 | Shareholding Details 195 | Glossary 201
42 PROVISIONS A provision is recognised in the Balance Sheet when the Group has a present legal or constructive obligation as a result of a past event and it is probable that an outflow of economic benefits will be required to settle the obligation If the effect is material provisions are determined by discounting the expected future cash flows at a pre-tax rate that reflects current market assessments of the time value of money and when appropriate the risks specific to the liability The carrying amounts of the provisions recognised are
Consolidated Bank
2021 $m
2020 $m
2021 $m
2020 $m
Employee benefits (1) 47 23 27 20
Provision for non-lending loss 3 13 3 13
Other (2) 14 11 13 5
Total provisions 64 47 43 38
Pay and entitlements reviewIn 2020 BOQ commenced a review of payments to employees covering Superannuation guarantee compliance and whether correct payments have been made to employees under successive BOQ Enterprise Agreements being 2010 2014 and 2018 During the year BOQ made remediation payments for base wage superannuation and interest for active permanent employees As at 31 August 2021 the remaining provision balance was $11 million The provision balance is based on financial modelling that has reconstructed BOQrsquos payroll obligations covering Enterprise Agreement remediation on-costs and interest and associated professional costs based on managementrsquos assessment of the facts and circumstances existing as at the reporting date It is reasonably possible that the final outcomes may differ to those reported the impact of which will be reflected in future reporting periods
Movements in provisionsMovements in each class of provision during the year other than employee benefits are as follows
Consolidated Bank
2021
Non-lending loss $m
Other $m
Non-lending loss $m
Other $m
Carrying amount at beginning of year 13 11 13 5
Additional provision recognised (3) 1 11 1 14
Amounts utilised during the year (1) (8) (1) (7)
Release of provision (1) (9) (1) (8)
Reclassification from non-lending loss provision (4) (9) 9 (9) 9
Carrying amount at end of year 3 14 3 13
Current 3 14 3 13
Non-current - - - -
(1) Employee benefits provision consists of annual leave (represents present obligations resulting from employeesrsquo services provided up to the reporting date calculated based on remuneration wage and salary rates that the Group expects to pay as at reporting date including related on-costs) and long service leave entitlements for employees (represents the present value of the estimated future cash outflows to be made resulting from employeesrsquo services provided to reporting date) The provision is calculated using expected future increases in wage and salary rates including related on-costs and expected settlement dates based on turnover history and is discounted using the rates attached to Australian 10 year corporate bonds at reporting date which most closely match the terms of maturity of the related liabilities $18 million of employee benefits provision relates to ME Bank acquisition $32 million (2020 $18 million) of this provision balance is classified as current
(2) Other provisions include $11 million in relation to the Grouprsquos employee pay and leave entitlements review and a restructure provision of $2 million(3) $1 million of additional provision recognised in Other relates to ME Bank acquisition(4) During the year the employee pay and leave entitlements review provision has been reclassified from Non-lending loss to Other
1692021 Annual Report
For the year ended 31 August 2021NOTES TO THE FINANCIAL STATEMENTS
Financial Statements 108 | Signed Reports 183 | Shareholding Details 195 | Glossary 201
NOTE 5 OTHER NOTES51 EMPLOYEE BENEFITS (A) Superannuation commitments
Superannuation plan The Group contributes to a number of superannuation plans which comply with the Superannuation Industry (Supervision) Act 1993 Contributions are charged to profit or loss in the Income Statement as they are made
Basis of contributionsThe Group is required to meet the minimum legal obligations under the relevant superannuation guarantee legislation and the industrial instrument provisions
(B) Share based paymentsThe Group currently operates the Equity Incentive Plan (previously the Awards Right Plan) for equity-settled compensation The plan allows the Grouprsquos employees to acquire shares in the Bank The fair value of rights granted is recognised as an employee expense with a corresponding increase to the Employee Benefits Reserve The fair value is measured at grant date and spread over the period during which the employees become unconditionally entitled to the rights The fair value of the rights granted is measured using industry accepted pricing methodologies taking into account the terms and conditions upon which the rights are granted The fair value of the rights is expensed over the vesting period Where rights do not vest due to failure to meet a non-market condition (eg employee service period) the expense is reversed Where rights do not vest due to failure to meet a market condition (eg total shareholder return test) the expense is not reversed
(i) Description of share based paymentsThe Award Rights Plan was first introduced and approved by shareholders on 11 December 2008 with the subsequent changes to the Award Rights Plan approved by shareholders on 30 November 2017 It is an equity based program under which Award Rights were granted as long-term incentives Types of award rights granted to employees under this plan were Deferred Award Rights (DARs) Performance Award Rights (PARs) BOQ Group Transformation Award (BTAs) BOQ Group Transformation Award - Virgin (VTAs) and Restricted Shares
The Award Rights Plan was replaced by the Equity Incentive Plan on 1 September 2020 Types of award rights granted to employees under the new plan are DARs Premium Priced Options Performance Shares and Restricted Shares
No amount is payable by employees for the grant or exercise of the award rights
Equity Incentive PlanEffective 1 September 2020 the Group made changes to the way it delivers variable remuneration including the discontinuation of the PARs plan and the introduction of Premium Priced Options and Performance Shares
Performance Shares Performance Shares are delivered in rights that convert to restricted shares at the end of the financial year based on the Boardrsquos assessment of performance against the Group Scorecard risk and conduct Once converted the restricted shares vest after a further one two and three years
Premium Priced OptionsPremium Priced Options vest in two tranches with 50 per cent vesting at the end of year four and 50 per cent at the end of year five The exercise price is set at 120 per cent of the share price based on a volume weighted average price over the five trading days following the Annual General Meeting (AGM) On exercise the options can be settled in cash or an allocation of shares
DARs There are no market performance hurdles or other performance based vesting conditions for DARs but the holder must remain an employee of the Bank DARs granted in December 2018 and December 2019 were issued under the Award Rights Plan and vest over three years in the ratio of 20 per cent at the end of year one 30 per cent at the end of year two and 50 per cent at the end of year three
In 2021 DARs were issued under the Equity Incentive Plan and the vesting period is dependent on if a person is an Accountable Person under the Banking Executive Accountability Regime (BEAR) DARs issued to Accountable Persons under the BEAR were extended to vest over four years in a ratio of 20 per cent at the end of year one 10 per cent at the end of year two 10 per cent at the end of year three and 60 per cent at the end of year four All other employees are unaffected by this change
DARs may be exercised by the employee once they have vested
Restricted SharesThe Group has used shares with restrictions on disposal as a non-cash share based component of both short term and long term incentive awards On occasion restricted shares are also used as make-good awards
170 Bank of Queensland Limited and its Controlled Entities
For the year ended 31 August 2021NOTES TO THE FINANCIAL STATEMENTS
Financial Statements 108 | Signed Reports 183 | Shareholding Details 195 | Glossary 201
51 EMPLOYEE BENEFITS (CONTINUED) (B) Share based payments (Continued)
Award Rights PlanPARs For PARs granted in December 2018 and December 2019 the vesting framework is based on the relative Total Shareholder Return (rTSR) and relative EPS The rTSR component makes up 80 per cent of the employeersquos PARs and is measured against a peer group over a four year period That peer group consists of companies included in the SampP ASX 200 index excluding selected entities in resources real estate investment trusts telecommunications (offshore headquartered) energy and utilities and such other inclusions and exclusions the Board considers appropriate TSR is a measure of the entire return a shareholder would obtain from holding an entityrsquos securities over a period taking into account factors such as changes in the market value of the securities and dividends paid over the period
The TSR component of the PARs vests in accordance with rTSR performance as follows
rTSR performance
TSR component of PARs vesting
At or above 75th percentile All
50th to 75th percentile Relative proportion between 50 and 100 per cent
Below 50th percentile None
The remaining 20 per cent of PARs vest based on the Bankrsquos EPS performance measured against a financial services peer group over a four year period
The Bankrsquos cash EPS Compound Annual Growth Rate (CAGR) performance PARs vesting
At or above 90th percentile All
60th to 90th percentile Relative proportion between 50 and 100 per cent
Below 60th percentile None
PARs may be exercised by the employee once they have vested
BTAsThe performance hurdles or vesting conditions for BTAs are linked to BOQ Group meeting cash earnings excluding loan impairment expense and income tax targets BTAs vest in two tranches in the ratio of 50 per cent in year one and 50 per cent in year two if BOQ Group meets the respective cash earnings targets There is an opportunity for retest in year two and three There are no market performance hurdles BTAs may be exercised by the employee once they have vested
VTAs The performance hurdles or vesting conditions for VTAs are linked to the delivery of a next generation core banking platform through Virgin Money Australia (Project de Novo) and BOQ Group meeting cash earnings excluding loan impairment expense and income tax targets VTAs vest in two tranches in the ratio of 50 per cent subject to the delivery of Project de Novo and 50 per cent if BOQ Group meet cash earnings targets in year two There is an opportunity for retest in year three There are no market performance hurdles VTAs may be exercised by the employee once they have vested
1712021 Annual Report
For the year ended 31 August 2021NOTES TO THE FINANCIAL STATEMENTS
Financial Statements 108 | Signed Reports 183 | Shareholding Details 195 | Glossary 201
51 EMPLOYEE BENEFITS (CONTINUED) (B) Share based payments (continued)
(ii) Award rights on issueThe number of rights and restricted shares on issue for the Bank is as follows
Deferred Award Rights
Performance Award Rights
Premium Priced Options
BOQ Group transformation
award
BOQ Group transformation award - Virgin
Performance Shares
Restricted Shares
2021 rsquo000
2020 rsquo000
2021 rsquo000
2020 rsquo000
2021 rsquo000
2020 rsquo000
2021 rsquo000
2020 rsquo000
2021 rsquo000
2020 rsquo000
2021 rsquo000
2020 rsquo000
2021 rsquo000
2020 rsquo000
Balance at beginning of the year
1606 1252 1792 1787 - - 431 - 66 - - - 73 202
Granted 1156 837 - 1065 8034 - - 435 - 66 661 - 295 -
Forfeited expired
(170) (139) (593) (1057) - - (63) (4) - - - - (65) -
Exercised (450) (344) (2) (3) - - (120) - (26) - - - (3) (129)
Outstanding at the end of the year
2142 1606 1197 1792 8034 - 248 431 40 66 661 - 300 73
(iii) Measurement of fair valuesThe Premium Priced Options have been valued using a four step methodology that uses a simulation approach to project future share prices and then the Binomial model to value the options on vesting The fair value of PARs has been measured using a Monte Carlo simulation approach
The fair value of DARs BTAs VTAs and Performance Shares have been measured using a formula based approach discounted by the assumed dividend yield
The value of Restricted Shares is equal to the Share Price as at the grant date
The weighted average of the inputs used in the measurement of the long term incentive award rights grants during the year was as follows
Deferred Award Rights
Performance Award Rights
Premium Priced Options
BOQ Group transformation
award
BOQ Group transformation
award- VirginPerformance
SharesRestricted
Shares
2021 2020 2021 2020 2021 2020 2021 2020 2021 2020 2021 2020 2021 2020
Fair value at grant date ($) 697 609 - 361 067 - - 612 - 612 779 - 704 -
Share price at grant date ($) 773 741 - 742 802 - - 741 - 741 798 - 783 -
Expected volatility () 251 180 - 180 250 - - 180 - 180 264 - 256 -
Risk free interest rate () 02 08 - 08 04 - - 08 - 08 02 - 02 -
Dividend yield () 50 88 - 88 50 - - 88 - 88 50 - 50 -
(iv) Salary sacrifice arrangements The Non-Executive Director Fee (NEDs) Sacrifice Rights Plan (NED Plan) allows NEDs to sacrifice a portion of their Board fees to acquire BOQ shares The equity under this plan is not subject to any conditions apart from a disposal restriction for a minimum of three years
(v) Other employee awards
BOQ ThankQ PlanThe ThankQ Plan replaces the previously offered salary sacrifice Employee Share Plan and is a gift of shares up to a maximum of $1000 per eligible employee During the year the Group granted 235498 shares under this plan The shares under this plan are restricted from sale until the earlier of three years or until an employee ceases employment with the Group
172 Bank of Queensland Limited and its Controlled Entities
For the year ended 31 August 2021NOTES TO THE FINANCIAL STATEMENTS
Financial Statements 108 | Signed Reports 183 | Shareholding Details 195 | Glossary 201
52 COMMITMENTSConsolidated Bank
2021 $m
2020 $m
2021 $m
2020 $m
(A) CUSTOMER FUNDING COMMITMENTS
Guarantees indemnities and letters of credit 259 267 259 267
Customer funding commitments 5085 1659 1282 861
5344 1926 1541 1128
In the normal course of business the Group makes commitments to extend credit to its customers Most commitments either expire if not taken up within a specified time or can be cancelled by the Group within one year Credit risk is significantly less than the notional amount and does not crystallise until a commitment is funded Guarantees are provided to third parties on behalf of customers The credit risks of such facilities are similar to the credit risks of loans and advances
The Group has lease commitments of $103 million (2020 nil) which have not been recognised as lease liabilities on the Balance Sheets as the lease commencement dates are after the end of the financial year Expenditure on software assets and other expenditure contracted for but not provided on the Balance Sheets is $34 million (2020 $8 million)
53 CONTINGENT LIABILITIESAs part of the St Andrewrsquos sale agreement BOQ will provide a capped indemnity of $85 million to the buyer Farmcove Investment Holdings for certain pre-completion matters
54 RELATED PARTIES INFORMATION(A) Controlled entitiesDetails of interests in materially controlled entities are set out in Note 55
During the year there have been transactions between the Bank and its controlled entities The Bank conducted normal banking business with its operating controlled entities Amounts owing to or from controlled entities generally attract interest on normal terms and conditions except in respect of Virgin Money (Australia) Pty Limited Virgin Money Financial Services Pty Ltd BOQ Specialist Pty Ltd BOQ Home Pty Limited Home Credit Management Pty Ltd and dormant entities as set out in Note 55(A)
The Bank receives management fees from its operating controlled entities except ME Bank Virgin Money Financial Services Pty Ltd BOQ Specialist Pty Ltd BOQ Home Pty Limited Home Credit Management Pty Ltd and dormant entities as set out in Note 55(A)
The Bank has a related party relationship with equity accounted joint ventures refer to Note 56
(B) Key management personnel compensationKMP have authority and responsibility for planning directing and controlling the activities of the Bank and the Group including Directors and other Senior Executives
KMP compensation included in lsquoadministrative expensesrsquo and lsquoemployee expensesrsquo (refer to Note 22) is as follows
2021 $
2020 $
Short term employee benefits 6667311 5944543
Long term employee benefits 137887 46646
Post employment benefits 264703 267565
Share based employment benefits 3045711 1451477
Termination benefits - 686024
10115612 8396255
Individual Directors and Senior Executives compensation disclosuresInformation regarding individual Directors and Senior Executivesrsquo compensation and some equity instruments disclosures as permitted by Regulation 2M303 of the Corporations Regulations 2001 is provided in the Remuneration Report section of the Directorsrsquo Report
Apart from the details disclosed in the Remuneration Report no Director has entered into a material contract with the Bank since the end of the previous financial year and there were no material contracts involving Directorsrsquo interests existing at year end
1732021 Annual Report
For the year ended 31 August 2021NOTES TO THE FINANCIAL STATEMENTS
Financial Statements 108 | Signed Reports 183 | Shareholding Details 195 | Glossary 201
54 RELATED PARTIES INFORMATION (CONTINUED)(C) Other financial instrument transactions with key management personnel and their related partiesA number of KMP and their close family members hold positions in other entities that result in them having control or significant influence over the financial or operating policies of those entities These entities as well as the KMP and their close family members are related parties to the Group Financial instrument transactions with KMP and their related parties during the financial year arise out of the provision of banking services the acceptance of funds on deposit the granting of loans and other associated financial activities The terms and conditions of the transactions entered into with KMP and their related parties were no more favourable than those available or which might reasonably be expected to be available on similar transactions to non-related entities on an armrsquos length basis No amounts have been written down or recorded as impaired during the year (2020 nil)
The transactions undertaken between the Group and KMP or their related parties up to 31 August 2021 are
Balance as at For the period (1)
1 September 2020
$
31 August 2021
$
Total loan drawdowns (repayments)
$
Total loan overdraft
interest$
Total fees on loans overdraft
$
Term products (loans advances)
KMP 350000 350000 (11508) 11508 -
Other related parties 760430 743279 (52449) 34998 300
Total 1110430 1093279 (63957) 46506 300
Balance as at For the period
1 September 2019
$
31 August 2020
$
Total loan drawdowns (repayments)
$
Total loan overdraft
interest$
Total fees on loans overdraft
$
Term products (loans advances)
KMP 1529029 350000 (16441) 16595 40
Other related parties 186543 760430 731742 25851 175
Total 1715572 1110430 715301 42446 215
(1) Amounts are included only for the period that the Director Executive is classified as a member of the KMP
174 Bank of Queensland Limited and its Controlled Entities
For the year ended 31 August 2021NOTES TO THE FINANCIAL STATEMENTS
Financial Statements 108 | Signed Reports 183 | Shareholding Details 195 | Glossary 201
55 CONTROLLED ENTITIES (A) Particulars in relation to materially controlled entitiesThe Grouprsquos controlled entities at 31 August 2021 are set out below The country of incorporation or registration is also the principal place of business
Place of businesscountry of
incorporationParent entityrsquos
interest Amount of investment Principal activities
Controlled entities2021
2020
2021
$m2020
$m
Alliance Premium Funding Pty Ltd New Zealand 100 100 - - Dormant
Bank of Queensland Limited Employee Share Plans Trust Australia 100 100 - - Trust
BOQ Asset Finance and Leasing Pty Ltd Australia 100 100 - - Asset finance amp leasing
BOQ Covered Bond Trust Australia 100 100 - - Issue of covered bonds
BOQ Credit Pty Limited Australia 100 100 - - Asset finance amp leasing
BOQ Equipment Finance Limited Australia 100 100 15 15 Asset finance amp leasing
BOQF Cashflow Finance Pty Ltd Australia 100 100 - - Professional finance
BOQ Finance (Aust) Limited Australia 100 100 230 230 Asset finance amp leasing
BOQ Finance (NZ) Limited New Zealand 100 100 22 22 Asset finance amp leasing
BOQ Funding Pty Limited Australia 100 100 - - Dormant
BOQ Home Pty Ltd Australia 100 100 157 157 Investment holding entity
BOQ Share Plans Nominee Pty Ltd Australia 100 100 - - Dormant
BOQ Specialist (Aust) Limited Australia 100 100 13 13 Professional finance and asset finance amp leasing
BOQ Specialist Pty Ltd Australia 100 100 - - Professional finance
BQL Management Pty Ltd Australia 100 100 - - Trust management
Home Credit Management Pty Ltd Australia 100 100 - - Investment holding entity
Home Financial Planning Pty Ltd Australia 100 100 - - Dormant
Impala Trust No 2 - Sub-Series 2 Australia 100 100 - - Securitisation
Members Equity Bank Limited Australia 100 - 1388 - Financial services
ME Portfolio Management Limited Australia 100 - - - Dormant
SMHL Series Private Placement 2014-2 Australia 100 - - - Securitisation
SMHL Series Securitisation Fund 2015-1 Australia 100 - - - Securitisation
SMHL Series Securitisation Fund 2016-1 Australia 100 - - - Securitisation
SMHL Series Securitisation Fund 2017-1 Australia 100 - - - Securitisation
SMHL Series Private Placement Trust 2017-2 Australia 100 - - - Securitisation
SMHL Series 2018-1 Fund Australia 100 - - - Securitisation
SMHL Series Securitisation 2018-2 Australia 100 - - - Securitisation
SMHL Series Private Placement Trust 2019-1 Australia 100 - - - Securitisation
SMHL Series Securitisation Fund 2019-1 Australia 100 - - - Securitisation
SMHL Series Private Placement 2019-2 Australia 100 - - - Securitisation
SMHL Securitisation Trust 2020-1 Australia 100 - - - Securitisation
Pioneer Permanent Pty Ltd Australia 100 100 32 32 Dormant
Series 2008-1 REDS Trust Australia 100 100 - - Securitisation
Series 2010-2 REDS Trust Australia - 100 - - Securitisation
Series 2012-1E REDS Trust Australia 100 100 - - Securitisation
1752021 Annual Report
For the year ended 31 August 2021NOTES TO THE FINANCIAL STATEMENTS
Financial Statements 108 | Signed Reports 183 | Shareholding Details 195 | Glossary 201
55 CONTROLLED ENTITIES (CONTINUED)(A) Particulars in relation to materially controlled entities (continued)
Place of businesscountry of
incorporationParent entityrsquos
interest Amount of investment Principal activities
Controlled entities2021
2020
2021
$m2020
$m
Series 2013-1 REDS Trust Australia 100 100 - - Securitisation
Series 2015-1 REDS Trust Australia 100 100 - - Securitisation
Series 2017-1 REDS Trust Australia 100 100 - - Securitisation
Series 2018-1 REDS Trust Australia 100 100 - - Securitisation
Series 2018-1 REDS EHP Trust Australia 100 100 - - Securitisation
Series 2019-1 REDS Trust Australia 100 100 - - Securitisation
Series 2021-1 REDS EHP Trust Australia 100 - - - Securitisation
St Andrewrsquos Australia Services Pty Ltd (1) Australia 100 100 - 30 Insurance holding entity
St Andrewrsquos Insurance (Australia) Pty Ltd Australia 100 100 - - General insurance
St Andrewrsquos Life Insurance Pty Ltd Australia 100 100 - - Life insurance
Statewest Financial Planning Pty Ltd Australia 100 100 - - Dormant
Virgin Money (Australia) Pty Limited Australia 100 100 53 53 Financial services
Virgin Money Financial Services Pty Ltd Australia 100 100 - - Financial services
Virgin Money Home Loans Pty Limited Australia 100 100 - - Dormant
1910 552
(1) The investment in St Andrewrsquos Australia Services Pty Ltd has been classified as held for sale as at 31 August 2021 Refer to note 55(E) for further details
(B) Significant restrictionsIn accordance with APS 222 Associations with related entities the Bank and its subsidiaries that form part of the Extended Licensed Entity have various restrictions This includes not having unlimited exposures to related entities including general guarantees
(C) Acquisition of controlled entities(i) Accounting for business combinations
All business combinations occurring on or after 1 July 2009 are accounted for by applying the acquisition method For every business combination the Group identifies the acquirer which is the combining entity that obtains control of the other combining entities or businesses The Group controls an entity if it is exposed to or has rights to variable returns from its involvement with the entity and has the ability to affect those returns through its power over the investee
The consideration transferred in the acquisition is generally measured at fair value as are the identifiable net assets acquired Any goodwill that arises is tested annually for impairment
Contingent Liabilities A contingent liability of the acquiree is assumed in a business combination only if such a liability represents a present obligation and arises from a past event and its fair value can be measured reliably
Transaction CostsTransaction costs that the Group incurs in connection with a business combination such as a finderrsquos fee legal fees due diligence fees and other professional and consulting fees are expensed as incurred Transaction costs related to the issue of ordinary shares are recognised as a deduction from equity
(ii) Business combinations during the yearOn 1 July 2021 the Group acquired 100 per cent of the shares and voting interests in ME Bank for cash consideration of $1388 billion
ME Bank engages in the provision of banking services including funding management and servicing of residential and consumer lending portfolios and carrying out associated funding activities for off balance sheet portfolios The addition of ME Bank to the BOQ Group will further strengthen the Grouprsquos multi-brand strategy deliver material scale broadly double the size of the Retail bank provide geographic diversification and create a compelling alternative to the big banks
In the period from 1 July 2021 to 31 August 2021 ME Bank contributed revenue of $83 million and profit after tax of $17 million to the Grouprsquos results If the acquisition had occurred on 1 September 2020 BOQ estimates that consolidated revenue would have been $499 million and consolidated profit for the year would have been $111 million which includes amortisation of fair value adjustments between 1 July 2021 to 31 August 2021 Due to the nature of these adjustments the full year impact has not been disclosed as it cannot be reliably measured
BOQ incurred acquisition-related costs of $19 million on legal fees and due diligence costs These costs have been predominantly included in administrative expenses
176 Bank of Queensland Limited and its Controlled Entities
For the year ended 31 August 2021NOTES TO THE FINANCIAL STATEMENTS
Financial Statements 108 | Signed Reports 183 | Shareholding Details 195 | Glossary 201
55 CONTROLLED ENTITIES (CONTINUED)
(ii) Business combinations during the year (continued)The fair values of the identifiable assets and liabilities of ME Bank as at the date of acquisition were
Fair value on acquisition $m
Assets
Cash and cash equivalents 642
Due from other financial institutions 124
Debt instruments at FVOCI 3320
Equity instruments at FVOCI 3
Property plant and equipment 73
Software intangibles 112
Brand intangibles 26
Customer relationship intangibles 31
Loans and advances 25669
Other assets 19
Total Assets 30019
Liabilities
Deposits 22302
Derivatives financial liabilities 26
Accounts payable and other liabilities 161
Provisions 18
Current tax liabilities 9
Borrowings 5833
Deferred tax liabilities 2
Total Liabilities 28351
Net identifiable assets and liabilities 1668
Other equity instruments (315)
Goodwill arising on acquisition 35
Total Purchase consideration transferred 1388
Cash acquired 642
Net cash outflow 746
The goodwill recognised of $35 million represents the fair value of expected future synergies arising from the acquisition
All fair values are disclosed on a provisional basis If new information obtained within one year of the date of acquisition about facts and circumstances that existed at the date of acquisition identifies adjustments to the above amounts or any additional provisions that existed at the date of acquisition then the accounting for the acquisition will be revised
(iii) Entities established during the yearThe following entities were established during the financial year
bull Series 2021-1 REDS EHP Trust was opened on 11 August 2021
(D) Disposal of controlled entitiesThe following entities were closed during the financial year
bull Series 2010-2 REDS Trust was closed on 29 March 2021
1772021 Annual Report
For the year ended 31 August 2021NOTES TO THE FINANCIAL STATEMENTS
Financial Statements 108 | Signed Reports 183 | Shareholding Details 195 | Glossary 201
55 CONTROLLED ENTITIES (CONTINUED)(E) Operations classified as held for saleOn 13 October 2020 the Bank entered into an agreement to sell the Bankrsquos controlled entities - St Andrewrsquos Australia Services Pty Ltd and its subsidiaries St Andrewrsquos Insurance (Australia) Pty Ltd and St Andrewrsquos Life Insurance Pty Ltd (the St Andrewrsquos Insurance Group) for proceeds of approximately $23 million As at the reporting date the St Andrewrsquos Insurance Group remained part of the BOQ Group due to outstanding regulatory approvals
As at 31 August 2021 the Consolidated Entity met the relevant criteria for reporting the St Andrewrsquos Insurance Group as held for sale under AASB 5 Non-current assets held for sale and discontinued operations (AASB 5) However as all of the assets of the disposal group are excluded from the measurement requirements of AASB 5 an impairment loss has not been recognised As such the indicative loss on sale after tax of $24 to $27 million will be reflected upon completion and will be impacted by completion adjustments transaction costs and final taxation impacts
The sale of the St Andrewrsquos Group will impact the operating segment Other
As at 31 August 2021 the Bank had assets held for sale of $30 million which represents the Bankrsquos investment in the St Andrewrsquos Group Financial information in relation to the St Andrewrsquos Group assets and liabilities held for sale for the year to 31 August 2021 is set out below
2021 (1) $m
Cash and cash equivalents 4
Due from other financial institutions - term deposits 33
Assets arising through reinsurance contracts 5
Other assets 1
Total Assets 43
Insurance policy liabilities 7
Other liabilities 10
Total Liabilities 17
Net assets 26
(1) Intragroup balances have been eliminated however will impact on the final loss on sale at completion
178 Bank of Queensland Limited and its Controlled Entities
For the year ended 31 August 2021NOTES TO THE FINANCIAL STATEMENTS
Financial Statements 108 | Signed Reports 183 | Shareholding Details 195 | Glossary 201
56 INVESTMENTS IN JOINT ARRANGEMENTSThe Group holds interests in a number of collectively and individually immaterial joint ventures that are accounted for using the equity method
(A) Accounting for joint arrangements The Grouprsquos investment in joint venture entities is accounted for under the equity method of accounting in the consolidated financial statements Joint ventures are entities in which the Group has joint control over all operational decisions and activities
(B) Details of joint venturesSet out below are the joint ventures of the Group as at 31 August 2021 which in the opinion of the Directors are immaterial to the Group Australia is the place of business and also the country of incorporation for all joint ventures
Ownership Interest Carrying amount
2021 ()
2020 ()
2021 $m
2020 $m
Joint arrangements (1)
Ocean Springs Pty Ltd (Brighton) 931 931 3 6
Dalyellup Beach Pty Ltd (Dalyellup) 1708 1708 7 7
East Busselton Estate Pty Ltd (Provence) 2500 2500 - -
Coastview Nominees Pty Ltd (Margaret River) 581 581 - -
Provence 2 Pty Ltd (Provence 2) 2500 2500 - -
Total equity accounted investments 10 13
(1) The principal activity of the joint venture entities is land subdivision development and sale These investments were acquired as part of the Home Building Society acquisition in 2007
Summary financial information for equity accounted joint ventures adjusted for the share of ownership held by the Group is contained below
2021$m
2020 $m
Profit from continuing operations 1 -
Total comprehensive profit 1 -
1792021 Annual Report
For the year ended 31 August 2021NOTES TO THE FINANCIAL STATEMENTS
Financial Statements 108 | Signed Reports 183 | Shareholding Details 195 | Glossary 201
57 AUDITORrsquoS REMUNERATIONConsolidated Bank
KPMG Australia2021
$0002020$000
2021$000
2020$000
Audit services
- Statutory audits and reviews of the financial reports 2172 1857 1826 1437
- Regulatory audits and reviews as required by regulatory authorities 704 762 611 667
Total audit services 2876 2619 2437 2104
Audit related services
- Other assurance services 373 402 154 143
Total audit related services 373 402 154 143
Non-audit services
- Taxation services 116 122 116 77
- Other 250 192 250 174
Total non-audit services 366 314 366 251
Non-audit services other include trust assurance work coupled with capital raising in connection with the ME Bank acquisition
Details of the amounts paid to other auditor for audit services provided during the year in respect of ME Bank acquisition
Consolidated Bank
Other auditor2021
$0002020$000
2021$000
2020$000
Audit services
- Statutory audits and reviews of the financial reports 202 - - -
Total audit services 202 - - -
58 EVENTS SUBSEQUENT TO BALANCE DATEThe evolution of the COVID-19 pandemic remains uncertain including the duration of the pandemic the severity of the downturn and the speed of the economic recovery BOQ has considered whether events subsequent to the reporting date have confirmed conditions existing as at reporting date and has not identified any COVID-19 related developments which would require adjustments to the amounts or disclosures contained in the consolidated financial statements Future economic conditions may differ to the assumptions and scenarios used in the consolidated financial statements the impact of which will be reflected in future reporting periods
The Directors are not aware of any matters or circumstances that have arisen in the interval between the end of the financial year and the date of this report or any item event or transaction which significantly affects or may significantly affect the operations of the Group in future financial years
180 Bank of Queensland Limited and its Controlled Entities
For the year ended 31 August 2021NOTES TO THE FINANCIAL STATEMENTS
Financial Statements 108 | Signed Reports 183 | Shareholding Details 195 | Glossary 201
59 SIGNIFICANT ACCOUNTING POLICIESThe accounting policies set out below have been applied consistently to all periods presented in the consolidated financial statements and have been applied consistently across the Group
(A) Basis of consolidation
(i) SubsidiariesSubsidiaries are entities controlled by the Bank Control exists when the Bank has the power directly or indirectly to govern the financial and operating policies of an entity so as to benefit from its activities In assessing control potential voting rights that presently are exercisable or convertible are taken into account The financial statements of subsidiaries are included in the consolidated financial statements from the date that control commences until the date that control ceases In the Bankrsquos financial statements investments in subsidiaries are carried at cost
(ii) SecuritisationThe Group conducts a loan securitisation program whereby mortgage loans are packaged and sold to the REDS RMBS Trusts The Group also securitises hire purchase chattel mortgages and finance leases which are packaged and sold to the REDS EHP Trusts Assets securitised to the Impala Trust are financed by the Bank through the BOQ Specialist channel and consist of medical finance equipment The Group acquired SMHL Trusts program as part of ME Bank acquisition on 1 July 2021
The GroupThe Group receives the residual income distributed by the REDS Impala and SMHL Trust (Trusts) after all payments due to investors and associated costs of the program have been met As a result the Group is considered to retain the risks and rewards of the Trusts and they do not meet the derecognition criteria of AASB 9
The Trusts fund their purchase of the loans by issuing floating-rate debt securities The securities are issued by the Trusts These are represented as borrowings of the Group however the Group does not stand behind the capital value or the performance of the securities or the assets of the Trusts The Group does not guarantee the payment of interest or the repayment of principal due on the securities The loans subject to the securitisation program have been pledged as security for the securities issued by the Trusts The Group is not obliged to support any losses that may be suffered by investors and does not intend to provide such support
The Bank provides the securitisation programs with armrsquos length services and facilities including the management and servicing of the leases securitised
The Bank has no right to repurchase any of the securitised assets and no obligation to do so other than in certain circumstances where there is a breach of warranty within 120 days of the sale or when certain criteria are met under the clean up provision per the Trust Deed Supplement
The transferred assets are equitably assigned to the Trusts The investors in the securities issued by the Trusts have full recourse to the assets transferred to the Trusts
Bank Interest rate risk from the Trusts is transferred back to the Bank by way of interest rate and basis swaps Accordingly under AASB 9 the original transfer of the mortgages from the Bank to the Trusts does not meet the derecognition criteria set out in AASB 9 The Bank continues to reflect the securitised loans in their entirety and also recognises a financial liability to the Trusts The interest payable on the intercompany financial asset liability represents the return on an imputed loan between the Bank and the Trusts and is based on the interest income under the mortgages the fees payable by the Trusts and the interest income or expense not separately recognised under the interest rate and basis swaps transactions between the Bank and the Trusts
All transactions between the Bank and the Trusts are eliminated on consolidation
(iii) Covered bond programThe Bank issues covered bonds for funding and liquidity purposes Certain housing loans have been assigned to a bankruptcy remote structured entity to provide security for all obligations payable on the covered bonds issued by the Bank Similar to the securitisation programs the Bank is entitled to any residual income after all payments due to covered bond investors have been met As the Bank retains substantially all of the risks and rewards associated with the housing loans the Bank continues to recognise the housing loans on Balance Sheet Investors have dual recourse to the Bank and the covered pool assets
(iv) Transactions eliminated on consolidationIntra-group balances and any unrealised gains and losses or income and expenses arising from intra-group transactions are eliminated in preparing the consolidated financial statements
Unrealised losses are eliminated in the same way as unrealised gains but only to the extent that there is no evidence of impairment
(B) Foreign currency
(i) Foreign currency transactionsTransactions in foreign currencies are initially translated at the foreign exchange rate ruling at the date of the transaction Subsequently at reporting date monetary assets and liabilities denominated in foreign currencies are translated into Australian dollars at the foreign exchange rate ruling at that date Non-monetary items in a foreign currency that are measured at historical cost remain translated using the original exchange rate at the date of the transaction Foreign exchange differences arising on translation are recognised in profit or loss Where a foreign currency transaction is part of a hedge relationship it is accounted for as above subject to the hedge accounting rules set out in Note 38
(ii) Foreign operationsThe Group carries out its foreign operations in New Zealand through the wholly controlled subsidiary BOQ Finance (NZ) Limited and through the non-incorporated branch of BOQ Equipment Finance Limited
1812021 Annual Report
For the year ended 31 August 2021NOTES TO THE FINANCIAL STATEMENTS
Financial Statements 108 | Signed Reports 183 | Shareholding Details 195 | Glossary 201
59 SIGNIFICANT ACCOUNTING POLICIES (CONTINUED)(C) Operating leases Operating leases in which the Group is the lessor are measured at cost less accumulated depreciation and accumulated impairment losses Depreciation is calculated to write off the cost of operating lease assets less their estimated residual values using the straight-line basis over the term of the lease This is generally recognised in profit or loss Depreciation methods and residual values are reviewed at each reporting date and adjusted if appropriate
(D) Goods and services taxRevenues expenses and assets are recognised net of the amount of goods and services tax (GST) except where the amount of GST incurred is not recoverable from the Australian Taxation Office (ATO) In these circumstances the GST is recognised as part of the cost of acquisition of the asset or as part of the expense
Receivables and payables are stated with the amount of GST included
The net amount of GST recoverable from or payable to the ATO is included as a current asset or current liability in the Balance Sheet
Cash flows are included in the Statements of Cash Flows on a gross basis The GST components of cash flows arising from investing and financing activities which are recoverable from or payable to the ATO are classified as operating cash flows
(E) Property plant and equipment
(i) Recognition and initial measurement Items of property plant and equipment are measured at cost on recognition
(ii) Subsequent costs Subsequent additional costs are only capitalised when it is probable that future economic benefits in excess of the originally assessed performance of the assets will flow to the Group in future years Where these costs represent separate components they are accounted for as separate assets and are separately depreciated over their useful lives Costs that do not meet the criteria for subsequent capitalisation are expensed as incurred
(iii) Subsequent measurement The Group has elected to use the cost model to measure property plant and equipment after recognition The carrying value is the initial cost less accumulated depreciation and any accumulated impairment losses
(iv) DepreciationDepreciation is charged to the profit or loss in the Income Statement on a straight-line basis over the estimated useful lives of each part of an item of property plant and equipment
The estimated useful lives are as follows
Years
IT equipment 3 - 10
Plant furniture and equipment 3 - 20
Leasehold improvements (1) 6 - 12
(1) Or term of lease if less
The useful lives are reassessed annually
(F) Impairment of non-financial assets Non-financial assets other than deferred tax assets are reviewed for impairment whenever events or changes in circumstances indicate that the carrying amount may not be recoverable For goodwill and intangible assets with an indefinite life the recoverable amount is estimated at the same time each year
The Bank conducts an annual internal review of non-financial asset values to assess for any indicators of impairment If any indication of impairment exists an estimate of the assetrsquos recoverable amount is calculated
For the purposes of assessing impairment assets are grouped at the lowest levels for which there are separately identifiable cash inflows that are largely independent of the cash inflows from other assets or groups of assets ndash a CGU
An impairment loss is recognised in profit or loss in the Income Statement for the amount by which the assetrsquos carrying amount exceeds its recoverable amount The recoverable amount of an asset or CGU is the greater of its value in use and its fair value less costs to sell Value in use is based on the estimated future cash flows discounted to their present value using a pre-tax discount rate that reflects current market assessments of the time value of money and the risks specific to the asset or CGU Impairment losses recognised in respect of CGUs are allocated first to reduce the carrying amount of goodwill allocated to the units and then to reduce the carrying amounts of the other assets in the unit on a pro-rata basis
This grouping is subject to an operating segment ceiling test Non-financial assets other than goodwill that suffered impairment are tested for possible reversal of the impairment whenever events or changes in circumstances indicate that the impairment may have reversed An impairment loss in respect of goodwill is not reversed
(i) Calculation of recoverable amountThe recoverable amount of a non-financial asset or CGU is the greater of its fair value less costs to sell and value in use In assessing value in use the estimated future cash flows are discounted to their present value using a pre-tax discount rate that reflects current market assessments of the time value of money and the risks specific to the asset
182 Bank of Queensland Limited and its Controlled Entities
For the year ended 31 August 2021NOTES TO THE FINANCIAL STATEMENTS
Financial Statements 108 | Signed Reports 183 | Shareholding Details 195 | Glossary 201
1 In the opinion of the Directors of Bank of Queensland Limited
(a) the consolidated financial statements and notes and the remuneration report included within the Directorsrsquo Report set out on pages 76 to 182 are in accordance with the Corporations Act 2001 (Cth) including
(i) giving a true and fair view of the financial position of the Bank and Group as at 31 August 2021 and of their performance for the year ended on that date and
(ii) complying with Australian Accounting Standards and the Corporations Regulations 2001 and
(b) there are reasonable grounds to believe that the Bank and Group will be able to pay its debts as and when they become due and payable
2 The Directors have been given the declarations required by section 295A of the Corporations Act 2001 (Cth) from the Managing Director amp CEO and Chief Financial Officer for the financial year ended 31 August 2021
3 The Directors draw attention to section 12 (A) to the financial statements which includes a statement of compliance with International Financial Reporting Standards
Signed in accordance with a resolution of the Directors
DIRECTORSrsquo DECLARATION
George Frazis Managing Director amp CEO 12 October 2021
Patrick Allaway Chairman 12 October 2021
1832021 Annual Report
Financial Statements 108 | Signed Reports 183 | Shareholding Details 195 | Glossary 201
184
KPMG an Australian partnership and a member firm of the KPMG global organisation of independent member firms affiliated with KPMG International Limited a private English company limited by guarantee All rights reserved The KPMG name and logo are trademarks used under license by the independent member firms of the KPMG global organisation Liability limited by a scheme approved under Professional Standards Legislation
Independent Auditorrsquos Report
To the shareholders of Bank of Queensland Limited
Report on the audits of the Financial Reports
Opinions
We have audited the consolidated Financial Report of Bank of Queensland Limited (the Consolidated Entity Financial Report) We have also audited the Financial Report of Bank of Queensland Limited (the Bank Financial Report)
In our opinion each of the accompanying Consolidated Entity Financial Report and Bank Financial Report are in accordance with the Corporations Act 2001 including
bull giving a true and fair view of the Consolidated Entityrsquos and of the Bankrsquos financial position as at 31 August 2021 and of its financial performance for the year ended on that date and
bull complying with Australian Accounting Standards and the Corporations Regulations 2001
The respective Financial Reports of the Consolidated Entity and Bank comprise
bull Balance Sheets as at 31 August 2021
bull Income Statements Statements of Comprehensive Income Statements of Changes in Equity and Statements of Cash Flows for the year then ended
bull Notes including a summary of significant accounting policies and
bull Directorsrsquo Declaration
The Consolidated Entity consists of the Bank of Queensland Limited (the Bank) and the entities it controlled at the year-end or from time to time during the financial year
Basis for opinions
We conducted our audits in accordance with Australian Auditing Standards We believe that the audit evidence we have obtained is sufficient and appropriate to provide a basis for our opinions
Our responsibilities under those standards are further described in the Auditorrsquos responsibilities for the audits of the Financial Reports section of our report
We are independent of the Consolidated Entity and Bank in accordance with the Corporations Act 2001 and the ethical requirements of the Accounting Professional and Ethical Standards Boardrsquos APES 110 Code of Ethics for Professional Accountants (the Code) that are relevant to our audits of the Financial Reports in Australia We have fulfilled our other ethical responsibilities in accordance with the Code
184 Bank of Queensland Limited and its Controlled Entities
INDEPENDENT AUDITORrsquoS REPORT
184
KPMG an Australian partnership and a member firm of the KPMG global organisation of independent member firms affiliated with KPMG International Limited a private English company limited by guarantee All rights reserved The KPMG name and logo are trademarks used under license by the independent member firms of the KPMG global organisation Liability limited by a scheme approved under Professional Standards Legislation
Independent Auditorrsquos Report
To the shareholders of Bank of Queensland Limited
Report on the audits of the Financial Reports
Opinions
We have audited the consolidated Financial Report of Bank of Queensland Limited (the Consolidated Entity Financial Report) We have also audited the Financial Report of Bank of Queensland Limited (the Bank Financial Report)
In our opinion each of the accompanying Consolidated Entity Financial Report and Bank Financial Report are in accordance with the Corporations Act 2001 including
bull giving a true and fair view of the Consolidated Entityrsquos and of the Bankrsquos financial position as at 31 August 2021 and of its financial performance for the year ended on that date and
bull complying with Australian Accounting Standards and the Corporations Regulations 2001
The respective Financial Reports of the Consolidated Entity and Bank comprise
bull Balance Sheets as at 31 August 2021
bull Income Statements Statements of Comprehensive Income Statements of Changes in Equity and Statements of Cash Flows for the year then ended
bull Notes including a summary of significant accounting policies and
bull Directorsrsquo Declaration
The Consolidated Entity consists of the Bank of Queensland Limited (the Bank) and the entities it controlled at the year-end or from time to time during the financial year
Basis for opinions
We conducted our audits in accordance with Australian Auditing Standards We believe that the audit evidence we have obtained is sufficient and appropriate to provide a basis for our opinions
Our responsibilities under those standards are further described in the Auditorrsquos responsibilities for the audits of the Financial Reports section of our report
We are independent of the Consolidated Entity and Bank in accordance with the Corporations Act 2001 and the ethical requirements of the Accounting Professional and Ethical Standards Boardrsquos APES 110 Code of Ethics for Professional Accountants (the Code) that are relevant to our audits of the Financial Reports in Australia We have fulfilled our other ethical responsibilities in accordance with the Code
185
Key Audit Matters
The Key Audit Matters we identified for the Consolidated Entity and Bank are
bull Expected Credit Loss (ECL) for loans and advances at amortised cost
bull Valuation of goodwill
bull Valuation of intangible computer software
bull Valuation of financial instruments at fair value
bull Information technology (IT) systems controls
bull Acquisition of ME Bank
Key Audit Matters are those matters that in our professional judgement were of most significance in our audits of the Financial Reports of the current period
These matters were addressed in the context of our audits of the Financial Reports as a whole and in forming our opinions thereon and we do not provide a separate opinion on these matters
Expected credit loss (ECL) for loans and advances at amortised cost- Consolidated Entity and Bank
Refer to Note 33 to the Financial Reports
The key audit matter How the matter was addressed in our audits
ECL (collective provision for impairment) for loans and advances at amortised cost is a key audit matter due to the significance of loans and advances balances and judgement applied by the Consolidated Entity and Bank in determining the ECL and the resulting judgement required by us in challenging these estimates
The Consolidated Entity and Bank has exercised judgement in developing ECL models incorporating forward-looking information to reflect current and future economic scenarios including the potential economic impact of the COVID-19 pandemic and in determining assumptions such as defining a significant increase in credit risk (SICR)
The Consolidated Entity and Bank measure ECLs on a forward-looking basis reflecting a range of future economic conditions including key forward-looking macroeconomic assumptions such as forecast Real-Gross Domestic Product (GDP) residential and commercial property price index and unemployment rates Given the COVID-19 pandemic and associated economic uncertainty significant judgement was exercised by the Consolidated Entity and Bank with developing the forward -looking macroeconomic assumptions and in the multiple forward-looking
Our procedures for ECL (collective pprroovviissiioonn ffoorr iimmppaaiirrmmeenntt) included
bull Understanding the key controls on the Consolidated Entityrsquos and Bankrsquos estimate of the ECL including
minus review and approval by Management of key forward-looking macroeconomic assumptions used in the model
minus review and approval by Management of key data elements used in the ECL models
minus monitoring mechanisms to identify loans with a SICR or default event and
minus review and approval mechanisms in place to assess the ECL output and out of model adjustments
With the assistance of our credit risk specialists our further procedures included
bull Assessing the appropriateness of the Consolidated Entityrsquos and Bankrsquos provisioning methodology against the requirements of the accounting standards and industry practice including estimates of default on both a 12 month and lifetime basis
bull Testing the completeness and accuracy of relevant data elements used within ECL
184
KPMG an Australian partnership and a member firm of the KPMG global organisation of independent member firms affiliated with KPMG International Limited a private English company limited by guarantee All rights reserved The KPMG name and logo are trademarks used under license by the independent member firms of the KPMG global organisation Liability limited by a scheme approved under Professional Standards Legislation
Independent Auditorrsquos Report
To the shareholders of Bank of Queensland Limited
Report on the audits of the Financial Reports
Opinions
We have audited the consolidated Financial Report of Bank of Queensland Limited (the Consolidated Entity Financial Report) We have also audited the Financial Report of Bank of Queensland Limited (the Bank Financial Report)
In our opinion each of the accompanying Consolidated Entity Financial Report and Bank Financial Report are in accordance with the Corporations Act 2001 including
bull giving a true and fair view of the Consolidated Entityrsquos and of the Bankrsquos financial position as at 31 August 2021 and of its financial performance for the year ended on that date and
bull complying with Australian Accounting Standards and the Corporations Regulations 2001
The respective Financial Reports of the Consolidated Entity and Bank comprise
bull Balance Sheets as at 31 August 2021
bull Income Statements Statements of Comprehensive Income Statements of Changes in Equity and Statements of Cash Flows for the year then ended
bull Notes including a summary of significant accounting policies and
bull Directorsrsquo Declaration
The Consolidated Entity consists of the Bank of Queensland Limited (the Bank) and the entities it controlled at the year-end or from time to time during the financial year
Basis for opinions
We conducted our audits in accordance with Australian Auditing Standards We believe that the audit evidence we have obtained is sufficient and appropriate to provide a basis for our opinions
Our responsibilities under those standards are further described in the Auditorrsquos responsibilities for the audits of the Financial Reports section of our report
We are independent of the Consolidated Entity and Bank in accordance with the Corporations Act 2001 and the ethical requirements of the Accounting Professional and Ethical Standards Boardrsquos APES 110 Code of Ethics for Professional Accountants (the Code) that are relevant to our audits of the Financial Reports in Australia We have fulfilled our other ethical responsibilities in accordance with the Code
1852021 Annual Report
INDEPENDENT AUDITORrsquoS REPORT
186
economic scenarios and probability weighting determined for each of these scenarios
This estimation is inherently challenging and uses complex models based on the Consolidated Entityrsquos and Bankrsquos ability to predict probability of default and loss given default The ECL staging requirements in the models incorporate estimates of default on both a 12 month and lifetime basis
Significant judgement is applied by the Consolidated Entity and Bank in determining the nature and level of out of model adjustments It is the Consolidated Entityrsquos and Bankrsquos policy to use out of model adjustments where the underlying models may not represent emerging risks or trends in the loan portfolios
We applied significant judgement to assess the impact of the forward-looking macroeconomic assumptions and economic scenarios used and the judgemental out of model adjustments applied to the ECL models
For creditndashimpaired loans it is the Consolidated Entityrsquos and Bankrsquos policy to determine specific provision for impairment in addition to the collective provision based on their judgement This focuses on estimating when an impairment event has occurred and the present value of expected future cash flows which have high estimation uncertainty We focused on the high degree of estimation uncertainty related to the business loans as the forecast cash flows are dependent on future and uncertain events for example the timing and proceeds from the future sale of collateral
models for a sample of customers such as checking year end balances to the general ledger and repayment history and risk ratings to source systems
bull Re-performing the ECL calculation for loan portfolios using the Consolidated Entityrsquos and Bankrsquos provisioning methodology and relevant data used within the ECL models as tested above and which incorporated consideration of the impacts of COVID-19 We compared our results to the amount recorded by the Consolidated Entity and Bank
bull Determining key assumptions within the ECL models including SICR and assessed the Consolidated Entityrsquos and Bankrsquos analysis over these assumptions including whether the methodology used in developing the assumption was appropriate and in line with accounting standards requirements
bull Challenged the Consolidated Entityrsquos and Bankrsquos forward-looking information and economic scenarios and their associated probability weighting We compared the Consolidated Entityrsquos and Bankrsquos forecast GDP residential and commercial property price index and unemployment rates to relevant publicly available macro-economic information and the sensitivity of the ECL to changes in such assumptions We focused on ensuring that these key assumptions reflected the impacts of COVID-19
bull Assessing the out of model adjustments applied by the Consolidated Entity and Bank to the ECL estimates We compared the loan portfoliosrsquo underlying performance and characteristics to current market conditions emerging risks and trends using our knowledge of the industry and public views of commentators
Our procedures for specific provision for impairment for credit-impaired loans included
bull Testing key credit risk monitoring controls including controls for loan risk ratings annual assessments of loans and security valuations
bull Performing credit assessment on a sample of loans and advances including business loans for which specific impairment provisions are held with particular focus on the impact of COVID-19 on high-risk industries This included
minus Challenging the Consolidated Entityrsquos and
186 Bank of Queensland Limited and its Controlled Entities
INDEPENDENT AUDITORrsquoS REPORT
186
economic scenarios and probability weighting determined for each of these scenarios
This estimation is inherently challenging and uses complex models based on the Consolidated Entityrsquos and Bankrsquos ability to predict probability of default and loss given default The ECL staging requirements in the models incorporate estimates of default on both a 12 month and lifetime basis
Significant judgement is applied by the Consolidated Entity and Bank in determining the nature and level of out of model adjustments It is the Consolidated Entityrsquos and Bankrsquos policy to use out of model adjustments where the underlying models may not represent emerging risks or trends in the loan portfolios
We applied significant judgement to assess the impact of the forward-looking macroeconomic assumptions and economic scenarios used and the judgemental out of model adjustments applied to the ECL models
For creditndashimpaired loans it is the Consolidated Entityrsquos and Bankrsquos policy to determine specific provision for impairment in addition to the collective provision based on their judgement This focuses on estimating when an impairment event has occurred and the present value of expected future cash flows which have high estimation uncertainty We focused on the high degree of estimation uncertainty related to the business loans as the forecast cash flows are dependent on future and uncertain events for example the timing and proceeds from the future sale of collateral
models for a sample of customers such as checking year end balances to the general ledger and repayment history and risk ratings to source systems
bull Re-performing the ECL calculation for loan portfolios using the Consolidated Entityrsquos and Bankrsquos provisioning methodology and relevant data used within the ECL models as tested above and which incorporated consideration of the impacts of COVID-19 We compared our results to the amount recorded by the Consolidated Entity and Bank
bull Determining key assumptions within the ECL models including SICR and assessed the Consolidated Entityrsquos and Bankrsquos analysis over these assumptions including whether the methodology used in developing the assumption was appropriate and in line with accounting standards requirements
bull Challenged the Consolidated Entityrsquos and Bankrsquos forward-looking information and economic scenarios and their associated probability weighting We compared the Consolidated Entityrsquos and Bankrsquos forecast GDP residential and commercial property price index and unemployment rates to relevant publicly available macro-economic information and the sensitivity of the ECL to changes in such assumptions We focused on ensuring that these key assumptions reflected the impacts of COVID-19
bull Assessing the out of model adjustments applied by the Consolidated Entity and Bank to the ECL estimates We compared the loan portfoliosrsquo underlying performance and characteristics to current market conditions emerging risks and trends using our knowledge of the industry and public views of commentators
Our procedures for specific provision for impairment for credit-impaired loans included
bull Testing key credit risk monitoring controls including controls for loan risk ratings annual assessments of loans and security valuations
bull Performing credit assessment on a sample of loans and advances including business loans for which specific impairment provisions are held with particular focus on the impact of COVID-19 on high-risk industries This included
minus Challenging the Consolidated Entityrsquos and
187
Bankrsquos risk grading of the loans
minus Considering the latest developments in relation to the borrower by inspecting the Consolidated Entityrsquos and Bankrsquos latest loan strategy papers for evidence of occurrence of impairment events and inquiries with Management
minus Examining the forecasts of future cash flows prepared by the Consolidated Entity and Bank including key assumptions and consideration of COVID-19 impacts in relation to the amount and timing of recoveries
bull Checking the collateral valuation and other sources of repayment underlying the Consolidated Entityrsquos and Bankrsquos determination of the impairment to external evidence where available including the Consolidated Entityrsquos and Bankrsquos external valuation expert reports
bull Checking the consistency of methods applied by the Consolidated Entity and Bank in estimating the expected future cash flows including timing from the estimated sale proceeds from the collateral in calculating the recoveries
bull Assessing the appropriateness of the Consolidated Entityrsquos and Bankrsquos disclosures in the financial reports using our understanding obtained from our testing against the requirements of the accounting standards
Valuation of goodwill ndash Consolidated Entity and Bank
Refer to Note 41 to the Financial Reports
The key audit matter How the matter was addressed in our audits
The assessment of the valuation of goodwill is considered a key audit matter due to the significant forward-looking assumptions used in the Consolidated Entityrsquos and Bankrsquos value-in-use (VIU) model
We focused on the significant forward-looking assumptions applied in the VIU model including
bull Forecast operating cash flows forecast growth rates and the terminal growth rates These conditions increase the inherent
Our procedures included
bull Considering the appropriateness of the VIU method applied by the Consolidated Entity and Bank to perform the annual test of goodwill for impairment against the requirements of the accounting standards
bull Assessing the integrity of the VIU model used including the accuracy of the underlying calculations
bull Assessing the historical accuracy of the Consolidated Entityrsquos and Bankrsquos forecast
1872021 Annual Report
INDEPENDENT AUDITORrsquoS REPORT
188
uncertainty of the forecasts the probability of a wider range of possible outcomes and the possibility of goodwill being impaired and
bull Discount rate ndash this is judgemental in nature and varies according to the specific conditions and environment of the relevant cash-generating unit (CGU)
We involved valuation specialists to supplement our senior audit team members in assessing this key audit matter
operating cash flows by comparing to actual past performance to inform our evaluation of forecasts incorporated in the VIU model
bull Challenging the key forecast cash flow assumptions used in the VIU model considering the known and anticipated COVID-19 impacts using our knowledge of the Consolidated Entity and Bank their past performance and our inquiries with Management We also checked the consistency of the key assumptions used in the VIU model to the Consolidated Entityrsquos and Bankrsquos Board approved cash flow forecasts
bull Using our industry knowledge and published studies of industry trends and expectations assessing the Consolidated Entityrsquos and Bankrsquos key assumptions specifically growth rates and terminal growth rates for indicators of bias and inconsistent application
bull Working with our valuation specialists using our knowledge of the Consolidated Entity and Bank and its industry to independently develop a discount rate range considered comparable using publicly available market data for comparable entities adjusted by risk factors specific to the Consolidated Entity and the industry it operates in
bull Performing sensitivity analysis by varying key assumptions in particular discount rates forecast growth rates and terminal growth rates within a reasonably possible range We did this to identify those CGUs at higher risk of impairment and those assumptions at a higher risk of bias or inconsistency in application and to focus our further procedures
bull Assessing the disclosures in the financial report using our understanding of the information obtained from our testing and against the requirements of the accounting standards We focussed on the adequacy of the disclosures where a reasonably possible change in key assumptions could cause the carrying amount of a CGU to exceed its recoverable amount to assess whether additional disclosures may be required
188 Bank of Queensland Limited and its Controlled Entities
INDEPENDENT AUDITORrsquoS REPORT
188
uncertainty of the forecasts the probability of a wider range of possible outcomes and the possibility of goodwill being impaired and
bull Discount rate ndash this is judgemental in nature and varies according to the specific conditions and environment of the relevant cash-generating unit (CGU)
We involved valuation specialists to supplement our senior audit team members in assessing this key audit matter
operating cash flows by comparing to actual past performance to inform our evaluation of forecasts incorporated in the VIU model
bull Challenging the key forecast cash flow assumptions used in the VIU model considering the known and anticipated COVID-19 impacts using our knowledge of the Consolidated Entity and Bank their past performance and our inquiries with Management We also checked the consistency of the key assumptions used in the VIU model to the Consolidated Entityrsquos and Bankrsquos Board approved cash flow forecasts
bull Using our industry knowledge and published studies of industry trends and expectations assessing the Consolidated Entityrsquos and Bankrsquos key assumptions specifically growth rates and terminal growth rates for indicators of bias and inconsistent application
bull Working with our valuation specialists using our knowledge of the Consolidated Entity and Bank and its industry to independently develop a discount rate range considered comparable using publicly available market data for comparable entities adjusted by risk factors specific to the Consolidated Entity and the industry it operates in
bull Performing sensitivity analysis by varying key assumptions in particular discount rates forecast growth rates and terminal growth rates within a reasonably possible range We did this to identify those CGUs at higher risk of impairment and those assumptions at a higher risk of bias or inconsistency in application and to focus our further procedures
bull Assessing the disclosures in the financial report using our understanding of the information obtained from our testing and against the requirements of the accounting standards We focussed on the adequacy of the disclosures where a reasonably possible change in key assumptions could cause the carrying amount of a CGU to exceed its recoverable amount to assess whether additional disclosures may be required
189
Valuation of intangible computer softwarendash Consolidated Entity and Bank
Refer to Note 41 to the Financial Reports
The key audit matter How the matter was addressed in our audits
The assessment of the valuation of intangible computer software is considered a key audit matter due to the significant
bull amount of costs capitalised during the year
bull judgement applied by us to assess the Consolidated Entityrsquos and Bankrsquos determination of
minus capitalised costs ndash the nature and amount of costs to be capitalised in accordance with the requirements of the accounting standards This can be inherently subjective for internally generated computer software projects
minus expected useful life ndash on completion of internally generated computer software the accounting standards require the Consolidated Entity and Bank to estimate the useful life of the computer software and amortise the asset over this period This assessment is based on the intended use of the asset This can be judgemental and dependent upon future events including advances in technology thereby increasing the complexity in estimating useful life
We also focused on the analysis of impairment indicators performed by the Consolidated Entity and Bank
Our procedures included
bull Evaluating the Consolidated Entityrsquos and Bankrsquos intangible computer software capitalisation policy and its application during the year against the capitalisation criteria and guidance in the relevant accounting standards
bull For a sample of internally generated computer software projects currently under development challenging the Consolidated Entityrsquos and Bankrsquos application of the capitalisation policy Specifically we challenged
minus the nature of project costs capitalised by testing a sample of capitalised costs to the project scope of work and underlying invoices and timesheets as well as inquiries with Management and
minus the Consolidated Entityrsquos and Bankrsquos assessment of projects not yet classified as lsquoready for-usersquo for indicators of being in use such as checking the phase of implementation with Project Managers and hence being subject to amortisation
bull For a sample of internally generated computer software classified as lsquoin-usersquo challenging the Consolidated Entityrsquos and Bankrsquos estimated period of economic benefit from the use of the software compared to the original project plan
bull Considering the Consolidated Entityrsquos and Bankrsquos assessment of intangible computer software impairment indicators by using our knowledge of the Consolidated Entity and Bankrsquos broader technology roadmap results of our testing and inquiring with Project Managers
bull Assessing the adequacy of the disclosures associated with impairment testing of intangible computer software in the financial report
1892021 Annual Report
INDEPENDENT AUDITORrsquoS REPORT
190
Valuation of financial instruments at fair value ndash Consolidated Entity and Bank
Refer to Note 37 to the Financial Reports
The key audit matter How the matter was addressed in our audits
The valuation of financial instruments measured at fair value is considered a key audit matter as determining the fair value of financial instruments involves a significant level of judgement by the Consolidated Entity and Bank The level of judgement increases where key inputs to the valuation are not readily available in the market and require additional judgement This increases the risk of error and adds complexity to our audit
We involved valuation specialists to supplement our senior audit team members in assessing this key audit matter
Working with our valuation specialists our procedures included
bull Checking the Consolidated Entityrsquos and the Bankrsquos valuation of a sample of financial instruments (asset and liabilities) by comparing the observable inputs including quoted prices to independently sourced market data
bull Using independent models reperforming the valuation for a sample of derivative assets and liabilities where fair value was determined using observable inputs This included comparing a sample of observable inputs in the Consolidated Entityrsquos and Bankrsquos valuations to independently sourced market data such as interest rates foreign exchange rates and volatilities
bull Where the fair value of derivatives and other financial assets were determined using unobservable inputs (lsquolevel 3rsquo instruments) challenging the Consolidated Entityrsquos and Bankrsquos valuation by testing the key inputs used to comparable data in the market including the use of proxy instruments and available alternatives We also checked the Consolidated Entityrsquos and Bankrsquos valuation methodology to industry practice and the criteria in the accounting standards
bull Assessing the appropriateness of the Consolidated Entityrsquos and Bankrsquos disclosures in the financial reports using our understanding obtained from our testing against the requirements of the accounting standards
190 Bank of Queensland Limited and its Controlled Entities
INDEPENDENT AUDITORrsquoS REPORT
190
Valuation of financial instruments at fair value ndash Consolidated Entity and Bank
Refer to Note 37 to the Financial Reports
The key audit matter How the matter was addressed in our audits
The valuation of financial instruments measured at fair value is considered a key audit matter as determining the fair value of financial instruments involves a significant level of judgement by the Consolidated Entity and Bank The level of judgement increases where key inputs to the valuation are not readily available in the market and require additional judgement This increases the risk of error and adds complexity to our audit
We involved valuation specialists to supplement our senior audit team members in assessing this key audit matter
Working with our valuation specialists our procedures included
bull Checking the Consolidated Entityrsquos and the Bankrsquos valuation of a sample of financial instruments (asset and liabilities) by comparing the observable inputs including quoted prices to independently sourced market data
bull Using independent models reperforming the valuation for a sample of derivative assets and liabilities where fair value was determined using observable inputs This included comparing a sample of observable inputs in the Consolidated Entityrsquos and Bankrsquos valuations to independently sourced market data such as interest rates foreign exchange rates and volatilities
bull Where the fair value of derivatives and other financial assets were determined using unobservable inputs (lsquolevel 3rsquo instruments) challenging the Consolidated Entityrsquos and Bankrsquos valuation by testing the key inputs used to comparable data in the market including the use of proxy instruments and available alternatives We also checked the Consolidated Entityrsquos and Bankrsquos valuation methodology to industry practice and the criteria in the accounting standards
bull Assessing the appropriateness of the Consolidated Entityrsquos and Bankrsquos disclosures in the financial reports using our understanding obtained from our testing against the requirements of the accounting standards
191
Information Technology (IT) systems and controls ndash Consolidated Entity and Bank
Refer to Basis of Preparation in Note 1 to the Financial Reports
The key audit matter How the matter was addressed in our audits
The Consolidated Entityrsquos and Bankrsquos business utilises a number of complex interdependent Information Technology (IT) systems to process and record a high volume of transactions Controls over user access change management program development and other operational controls in IT systems are critical to the recording of financial information and the preparation of financial reports The IT systems and controls as they impact the financial recording and reporting of transactions is a key audit matter and significantly affect our audit approach
Our IT specialists were used throughout the engagement as a core part of our audit team
We tested the general controls over key IT applications (systems) used in processing significant transactions and recording balances in the general ledger We also tested automated controls embedded within these systems Working with our IT specialists our procedures included
bull Testing the governance controls used by the Consolidated Entityrsquos and Bankrsquos IT team to monitor system integrity by checking matters impacting the operational integrity of core systems for escalation and action in accordance with the Consolidated Entityrsquos and Bankrsquos policies
bull Testing the access rights (including privileged users) given to staff by checking them to approved records and inspecting the reports for granting and removal of access rights
bull Testing preventative controls designed to enforce segregation of duties between users within particular IT systems
bull Testing the change management controls related to code development and workflows approval
bull Testing the automated controls principally relating to the automated calculation of certain transactions and the generation of certain reports For a sample of automated calculations we tested the inputs used within the calculations to source data and also tested the accuracy of the calculations
1912021 Annual Report
INDEPENDENT AUDITORrsquoS REPORT
192
Acquisition of ME Bank ndash Consolidated Entity and Bank
Refer to Note 55 (c) to the Financial Reports
The key audit matter How the matter was addressed in our audits
On 1 July 2021 the Bank acquired 100 of ME Bank for a total consideration of $1388 billion The purchase price accounting was provisional at the date of authorisation of the financial report
The accounting for this business combination is a key audit matter due to the
bull Size of the acquisition having a significant impact on the Consolidated Entityrsquos and Bankrsquos financial report and
bull Judgement and complexity relating to the Consolidated Entityrsquos and Bankrsquos determination of the provisional fair value of assets and liabilities acquired in the acquisition requiring significant audit effort These included customer relationships and brand name which are inherently judgemental driving additional audit effort specifically on the key assumptions and methodology used in the valuation of these intangible assets The key assumptions we focussed on in the valuation of intangible assets included forecast earnings discount rates and useful lives
The Consolidated Entity and Bank engaged an external valuation expert to assess the fair value of acquired intangibles such as customer relationships and brand name
We involved corporate finance specialists to supplement our senior audit team members in assessing this key audit matter
Working with our corporate finance specialists our procedures included
bull We evaluated the acquisition accounting by the Consolidated Entity and Bank against the requirements of the accounting standards
bull We read the underlying transaction agreement to understand the terms of the acquisition and nature of the assets and liabilities acquired
bull Considered the scope objectivity and competence of the external valuation expert engaged by the Consolidated Entity and Bank
bull We evaluated the valuation methodology used by the Consolidated Entity and Bank to determine the fair value of assets and liabilities acquired against accounting standard requirements and observed industry practices
bull Examined and assessed the key assumptions in the Consolidated Entityrsquos and Bankrsquos external valuation expert report prepared in relation to the identification and valuation of intangible assets including
1 assessing the useful life of the brand name and customer relationships by using our industry experience and against the accounting standard requirements
2 comparing forecast earnings assumptions to growth rates from comparable company broker estimates and industry growth rates and
3 evaluating the discount rate adopted having regard to the Internal Rate of Return of the acquisition
bull Compared the provisional fair values of the acquired assets and liabilities recognised by the Consolidated Entity and Bank to the audited financial statements of ME Bank and external valuation expert report
bull We recalculated the goodwill balance recognised as a result of the acquisition and compared it to the goodwill amount recorded
192 Bank of Queensland Limited and its Controlled Entities
INDEPENDENT AUDITORrsquoS REPORT
192
Acquisition of ME Bank ndash Consolidated Entity and Bank
Refer to Note 55 (c) to the Financial Reports
The key audit matter How the matter was addressed in our audits
On 1 July 2021 the Bank acquired 100 of ME Bank for a total consideration of $1388 billion The purchase price accounting was provisional at the date of authorisation of the financial report
The accounting for this business combination is a key audit matter due to the
bull Size of the acquisition having a significant impact on the Consolidated Entityrsquos and Bankrsquos financial report and
bull Judgement and complexity relating to the Consolidated Entityrsquos and Bankrsquos determination of the provisional fair value of assets and liabilities acquired in the acquisition requiring significant audit effort These included customer relationships and brand name which are inherently judgemental driving additional audit effort specifically on the key assumptions and methodology used in the valuation of these intangible assets The key assumptions we focussed on in the valuation of intangible assets included forecast earnings discount rates and useful lives
The Consolidated Entity and Bank engaged an external valuation expert to assess the fair value of acquired intangibles such as customer relationships and brand name
We involved corporate finance specialists to supplement our senior audit team members in assessing this key audit matter
Working with our corporate finance specialists our procedures included
bull We evaluated the acquisition accounting by the Consolidated Entity and Bank against the requirements of the accounting standards
bull We read the underlying transaction agreement to understand the terms of the acquisition and nature of the assets and liabilities acquired
bull Considered the scope objectivity and competence of the external valuation expert engaged by the Consolidated Entity and Bank
bull We evaluated the valuation methodology used by the Consolidated Entity and Bank to determine the fair value of assets and liabilities acquired against accounting standard requirements and observed industry practices
bull Examined and assessed the key assumptions in the Consolidated Entityrsquos and Bankrsquos external valuation expert report prepared in relation to the identification and valuation of intangible assets including
1 assessing the useful life of the brand name and customer relationships by using our industry experience and against the accounting standard requirements
2 comparing forecast earnings assumptions to growth rates from comparable company broker estimates and industry growth rates and
3 evaluating the discount rate adopted having regard to the Internal Rate of Return of the acquisition
bull Compared the provisional fair values of the acquired assets and liabilities recognised by the Consolidated Entity and Bank to the audited financial statements of ME Bank and external valuation expert report
bull We recalculated the goodwill balance recognised as a result of the acquisition and compared it to the goodwill amount recorded
193
by the Consolidated Entity and Bank
bull Assessed the adequacy of the disclosures in the financial report using our understanding obtained from our testing and against the requirements of the accounting standards
Other Information
Other Information is financial and non-financial information in Bank of Queensland Limitedrsquos annual reporting which is provided in addition to the Financial Reports and the Auditors Report The Directors are responsible for the Other Information
Our opinions on the Financial Reports do not cover the Other Information and accordingly we do not express an audit opinion or any form of assurance conclusion thereon with the exception of the Remuneration Report and our related assurance opinion
In connection with our audits of the Financial Reports our responsibility is to read the Other Information In doing so we consider whether the Other Information is materially inconsistent with the Financial Reports or our knowledge obtained in the audits or otherwise appears to be materially misstated
We are required to report if we conclude that there is a material misstatement of this Other Information and based on the work we have performed on the Other Information that we obtained prior to the date of this Auditorrsquos Report we have nothing to report
Responsibilities of the Directors for the Financial Reports
The Directors are responsible for
bull preparing the Financial Reports that give a true and fair view in accordance with Australian Accounting Standards and the Corporations Act 2001
bull implementing necessary internal controls to enable the preparation of a Financial Report that gives a true and fair view and is free from material misstatement whether due to fraud or error
bull assessing the Consolidated Entityrsquos and Bankrsquos ability to continue as a going concern and whether the use of the going concern basis of accounting is appropriate This includes disclosing as applicable matters related to going concern and using the going concern basis of accounting unless they either intend to liquidate the Consolidated Entity or Bank or to cease operations or have no realistic alternative but to do so
1932021 Annual Report
INDEPENDENT AUDITORrsquoS REPORT
194
Auditorrsquos responsibilities for the audits of the Financial Reports
Our objective is
bull to obtain reasonable assurance about whether each of the Financial Reports as a whole are free from material misstatement whether due to fraud or error and
bull to issue an Auditorrsquos Report that includes our opinions
Reasonable assurance is a high level of assurance but is not a guarantee that an audit conducted in accordance with Australian Auditing Standards will always detect a material misstatement when it exists
Misstatements can arise from fraud or error They are considered material if individually or in the aggregate they could reasonably be expected to influence the economic decisions of users taken on the basis of the Financial Reports
A further description of our responsibilities for the audits of the Financial Reports is located at the Auditing and Assurance Standards Board website at httpswwwauasbgovauadminfilecontent102c3ar1_2020pdf This description forms part of our Auditorrsquos Report
Report on the Remuneration Report
Opinion
In our opinion the Remuneration Report of Bank of Queensland Limited for the year ended 31 August 2021 complies with Section 300A of the Corporations Act 2001
Directorsrsquo responsibilities
The Directors of the Bank are responsible for the preparation and presentation of the Remuneration Report in accordance with Section 300A of the Corporations Act 2001
Our responsibilities
We have audited the Remuneration Report included in pages 76 to 102 of the Directorsrsquo report for the year ended 31 August 2021
Our responsibility is to express an opinion on the Remuneration Report based on our audit conducted in accordance with Australian Auditing Standards
KPMG Shaun Kendrigan Partner
Sydney 12 October 2021
194 Bank of Queensland Limited and its Controlled Entities
INDEPENDENT AUDITORrsquoS REPORT
1 TWENTY LARGEST ORDINARY SHAREHOLDERSAs at Thursday 23 September 2021 the following shareholding details applied
Number of ordinary shares
HSBC CUSTODY NOMINEES (AUSTRALIA) LIMITED 116895053 1824
CITICORP NOMINEES PTY LIMITED 60259245 940
J P MORGAN NOMINEES AUSTRALIA PTY LIMITED 56077870 875
NATIONAL NOMINEES LIMITED 41450195 647
BNP PARIBAS NOMS PTY LTD 11146804 174
BNP PARIBAS NOMINEES PTY LTD 9076602 142
HSBC CUSTODY NOMINEES (AUSTRALIA) LIMITED 6855102 107
NATIONAL NOMINEES LIMITED 5855700 091
BNP PARIBAS NOMINEES PTY LTD SIX SIS LTD 3709233 058
WASHINGTON H SOUL PATTINSON AND COMPANY LIMITED 3494197 055
CITICORP NOMINEES PTY LIMITED 3324124 052
GOLDEN LINEAGE PTY LTD 3110131 049
NATIONAL NOMINEES LIMITED 2636102 041
CARLTON HOTEL LIMITED 1084037 017
AMP LIFE LIMITED 1066119 017
MR KIE CHIE WONG 992908 015
PACIFIC CUSTODIANS PTY LIMITED 934537 015
THE MANLY HOTELS PTY LIMITED 926301 014
BNP PARIBAS NOMS (NZ) LTD 831885 013
NATIONAL EXCHANGE PTY LTD 760000 012
Total 330486145 5157
The above table includes shareholders that may hold shares for the benefit of third parties
Voting rightsOn a poll every person who is a holder of ordinary shares or a duly appointed representative of a holder of ordinary shares has one vote
194
Auditorrsquos responsibilities for the audits of the Financial Reports
Our objective is
bull to obtain reasonable assurance about whether each of the Financial Reports as a whole are free from material misstatement whether due to fraud or error and
bull to issue an Auditorrsquos Report that includes our opinions
Reasonable assurance is a high level of assurance but is not a guarantee that an audit conducted in accordance with Australian Auditing Standards will always detect a material misstatement when it exists
Misstatements can arise from fraud or error They are considered material if individually or in the aggregate they could reasonably be expected to influence the economic decisions of users taken on the basis of the Financial Reports
A further description of our responsibilities for the audits of the Financial Reports is located at the Auditing and Assurance Standards Board website at httpswwwauasbgovauadminfilecontent102c3ar1_2020pdf This description forms part of our Auditorrsquos Report
Report on the Remuneration Report
Opinion
In our opinion the Remuneration Report of Bank of Queensland Limited for the year ended 31 August 2021 complies with Section 300A of the Corporations Act 2001
Directorsrsquo responsibilities
The Directors of the Bank are responsible for the preparation and presentation of the Remuneration Report in accordance with Section 300A of the Corporations Act 2001
Our responsibilities
We have audited the Remuneration Report included in pages 76 to 102 of the Directorsrsquo report for the year ended 31 August 2021
Our responsibility is to express an opinion on the Remuneration Report based on our audit conducted in accordance with Australian Auditing Standards
KPMG Shaun Kendrigan Partner
Sydney 12 October 2021
1952021 Annual Report
SHAREHOLDING DETAILS
Financial Statements 108 | Signed Reports 183 | Shareholding Details 195 | Glossary 201
2 TWENTY LARGEST CAPITAL NOTE HOLDERSAs at Thursday 23 September 2021 the following holding details applied
Number of capital notes
BNP PARIBAS NOMINEES PTY LTD HUB24 CUSTODIAL SERV LTD 143575 410
CITICORP NOMINEES PTY LIMITED 136325 390
HSBC CUSTODY NOMINEES (AUSTRALIA) LIMITED 117911 337
J P MORGAN NOMINEES AUSTRALIA PTY LIMITED 65465 187
DIOCESE DEVELOPMENT FUND - CATHOLIC DIOCESE OF PARRAMATTA 56238 161
JOHN E GILL TRADING PTY LTD 54593 156
NATIONAL NOMINEES LIMITED 43234 124
MUTUAL TRUST PTY LTD 32812 094
BOND STREET CUSTODIANS LIMITED 32200 092
TRUSTEES OF CHURCH PROPERTY FOR THE DIOCESE OF NEWCASTLE 27499 079
NETWEALTH INVESTMENTS LIMITED 24713 071
BNP PARIBAS NOMINEES PTY LTD 23893 068
BERNE NO 132 NOMINEES PTY LTD 23705 068
FEDERATION UNIVERSITY AUSTRALIA 21935 063
INVIA CUSTODIAN PTY LIMITED 21310 061
HAVENFLASH PTY LTD 21000 060
NAVIGATOR AUSTRALIA LTD 17672 050
BNP PARIBAS NOMINEES PTY LTD 16703 048
NAVIGATOR AUSTRALIA LTD 16629 048
PACIFIC DEVELOPMENT CORPORATION PTY LTD 15500 044
Total 912912 2608
The above table includes shareholders that may hold shares for the benefit of third parties
Voting rightsCapital Notes do not give the holders any voting rights at any general shareholders meetings except in certain circumstances
196 Bank of Queensland Limited and its Controlled Entities
SHAREHOLDING DETAILS
Financial Statements 108 | Signed Reports 183 | Shareholding Details 195 | Glossary 201
3 TWENTY LARGEST CAPITAL NOTE 2 HOLDERSAs at Thursday 23 September 2021 the following holding details applied
Number of capital notes
J P MORGAN NOMINEES AUSTRALIA PTY LIMITED 200845 772
HSBC CUSTODY NOMINEES (AUSTRALIA) LIMITED 119965 461
CITICORP NOMINEES PTY LIMITED 100482 386
MUTUAL TRUST PTY LTD 84905 327
DIMBULU PTY LTD 75000 288
DIOCESE DEVELOPMENT FUND - CATHOLIC DIOCESE OF PARRAMATTA 58000 223
BERNE NO 132 NOMINEES PTY LTD 50400 194
NATIONAL NOMINEES LIMITED 43537 167
BNP PARIBAS NOMINEES PTY LTD HUB24 CUSTODIAL SERV LTD 40713 157
BERNE NO 132 NOMINEES PTY LTD 22700 087
BNP PARIBAS NOMINEES PTY LTD 20539 079
ALWOOD PTY LTD amp ALWOOD PTY LTD 18600 072
NETWEALTH INVESTMENTS LIMITED 14021 054
LEOPOLD STATION PTY LIMITED 13000 050
BNP PARIBAS NOMINEES PTY LTD 12456 048
QM FINANCIAL SERVICES PTY LTD 12000 046
MFIC SECURITIES PTY LTD 12000 046
NAVIGATOR AUSTRALIA LTD 10052 039
SANDHURST TRUSTEES LTD 10000 038
G HARVEY INVESTMENTS PTY LIMITED 10000 038
NETWEALTH INVESTMENTS LIMITED 9004 035
CERTANE CT PTY LTD 8250 032
Total 946469 3640
The above table includes shareholders that may hold shares for the benefit of third parties
Voting rightsCapital Notes 2 do not give the holders any voting rights at any general shareholders meetings except in certain circumstances
1972021 Annual Report
SHAREHOLDING DETAILS
Financial Statements 108 | Signed Reports 183 | Shareholding Details 195 | Glossary 201
4 DISTRIBUTION OF SECURITY HOLDERSDistribution of fully paid ordinary shares as at Thursday 23 September 2021
CategoryNumber of
shareholders of
shareholdersNumber of
shares of issued
capital
1 - 1000 59976 5639 21392483 334
1001 - 5000 31956 3005 78114407 1219
5001 - 10000 8418 792 59874797 934
10001 - 100000 5857 551 122499025 1911
100001 - and over 144 014 359008851 5602
Total 106351 10000 640889563 10000
Less than marketable parcel (1) 3300 310 64328 001
Distribution of Capital Notes as at Thursday 23 September 2021
CategoryNumber of
security holders of
security holdersNumber of
securities of issued
capital
1 - 1000 4750 9149 1522756 4351
1001 - 5000 388 747 754918 2157
5001 - 10000 23 044 160549 459
10001 - 100000 28 054 663966 1897
100001 - and over 3 006 397811 1137
Total 5192 10000 3500000 10000
Less than marketable parcel (2) 23 044 50 -
Distribution of Capital Notes 2 as at Thursday 23 September 2021
CategoryNumber of
security holders of
security holdersNumber of
securities of issued
capital
1 - 1000 2468 8783 894682 3441
1001 - 5000 299 1064 622387 2394
5001 - 10000 25 089 173716 668
10001 - 100000 15 053 487923 1877
100001 - and over 3 011 421292 1620
Total 2810 10000 2600000 10000
Less than marketable parcel (3) 1 004 1 -
SHAREHOLDING DETAILS
(1) Based on a closing price of $911 on 23 September 2021(2) Based on a closing price of $10370 on 23 September 2021(3) Based on a closing price of $10446 on 23 September 2021
198 Bank of Queensland Limited and its Controlled Entities
Financial Statements 108 | Signed Reports 183 | Shareholding Details 195 | Glossary 201
(1) Unquoted securities are issued under the Award Rights Plan and the Equity Incentive Plan(2) Inclusive of shares purchased under the NED Plan
5 PARTLY PAID SHARESThere are no partly paid shares
6 SUBSTANTIAL SHAREHOLDERS The names of substantial shareholders in the Bank per the meaning within the Corporations Act 2001 (Cth) and the number of shares in which each has an interest as disclosed in substantial shareholder notices given to the Bank were
Number of ordinary shares in which interest is held (at date of notification) Date of notification
The Vanguard Group Inc 27345351 27 October 2020
7 SECURITIES EXCHANGE LISTINGThe shares of Bank of Queensland Limited (BOQ) Capital Notes (BOQPE) and Capital Notes 2 (BOQPF) are quoted on the Australian Stock Exchange
Notes issued under BOQrsquos Euro Medium Term Note Programme and covered bonds issued under BOQrsquos Covered Bond Programme may be listed on the London Stock Exchange
8 UNQUOTED SECURITIESAs at 30 September 2021 the following unquoted securities were on issue
Unquoted securities (1)Number of
holders in the planNumber of
unquoted securities
Deferred Award Rights 385 2115375
Performance Award Rights 101 1168938
Premium Priced Options 14 8033732
Performance Shares 12 661135
Transformation Award Rights 44 280721
9 ON MARKET BUY-BACKThere is no current on market buy-back
10 SECURITIES PURCHASED ON MARKET During the year ended 31 August 2021 1184500 shares were purchased on market under the employee incentive scheme (2) The average price per security was $636
11 OTHER INFORMATION BOQ is a publicly listed company limited by shares and is incorporated and domiciled in Australia
SHAREHOLDING DETAILS
1992021 Annual Report
Financial Statements 108 | Signed Reports 183 | Shareholding Details 195 | Glossary 201
SHARE REGISTRYLink Market Services LimitedLevel 21 10 Eagle Street Brisbane Qld 4000
Australia 1800 779 639 International +61 1800 779 639 Email boqlinkmarketservicescomau
linkmarketservicescomau
COMPANY DETAILSBank of Queensland LimitedABN 32 009 656 740 ACN 009 656 740
Registered office Level 6 100 Skyring Terrace Newstead Qld 4006
Telephone +61 7 3212 3333 Investor Relations InvestorRelationsboqcomau
boqcomau twittercomboq facebookcomauBOQOnline
CUSTOMER SERVICEAustralia 1300 55 72 72 International +61 7 3336 2420
Postal address GPO Box 898 Brisbane Qld 4001
SHAREHOLDER INFORMATION
KEY SHAREHOLDER DATESDividend dates for ordinary shares only are
2021
Financial full year end 31 August 2021
Full year results and dividend announcement 13 October 2021
Full year ex-dividend date 28 October 2021
Full year dividend record date 29 October 2021
Full year dividend payment date 18 November 2021
Annual General Meeting 7 December 2021
200 Bank of Queensland Limited and its Controlled Entities
Financial Statements 108 | Signed Reports 183 | Shareholding Details 195 | Glossary 201
TERM DESCRIPTION
APRA Prudential Standard (APS) Prudential standards issued by APRA which are applicable to ADIs
Australian Accounting Standards Board (AASB) The AASB produces a series of technical pronouncements that set out the measurement and recognition requirements when accounting for particular types of transactions and events along with the preparation and presentation requirements of an entityrsquos financial statements
Australian Banking Association (ABA) The trade association for the Australian banking industry
Asset backed securities (ABS) A financial security which is pledged by a pool of assets such as but not limited to loans leases and credit card debt
Australian Finance Industry Association (AFIA) AFIA is the national association for the equipment leasing and financing industry Formerly Australian Equipment Lessors Association
Alternative liquid assets (ALA) Alternative liquid assets are alternative treatments for holdings in the stock of HQLA These treatments are made available in jurisdictions where there is insufficient supply of HQLA1 (or both HQLA1 and HQLA2) in the domestic currency to meet the aggregate demand of banks with significant exposures in the domestic currency in the LCR framework Within Australia a locally-incorporated ADI subject to LCR requirements is able to establish a CLF with the Reserve Bank of Australia sufficient in size to cover any shortfall in Australian dollars between the ADIrsquos holdings of HQLA and net cash outflows
Australian Prudential Regulation Authority (APRA)
APRA is the prudential regulator of the Australian financial services industry APRA is an independent statutory authority that supervises institutions across banking insurance and superannuation and promotes financial system stability in Australia
Australian Securities And Investments Commission (ASIC)
ASIC is Australiarsquos corporate markets and financial services regulator
Australian Securities Exchange (ASX) Australian Securities Exchange or ASX Limited (ABN 98 008 624 691) and the market activities operated by ASX Limited
Authorised deposit-taking institution (ADI) A corporation which is authorised under the Banking Act 1959 and includes banks building societies and credit unions
Available stable funding (ASF) ASF is the portion of capital and liabilities expected to be reliable over the time horizon considered by the NSFR which extends to one year
Average interest earning assets Average balance over the period for a bankrsquos assets that accrue interest income
Bank of Queensland Limited (the Bank or BOQ) The Bank is a for-profit entity primarily involved in providing retail and business banking leasing finance and insurance products to its customers
Banking Relief Package (BRP) A for of Government assistance that gives eligible clients the option of deferring loan repayments for a period of time
Basel II and III A global regulatory framework to improve the regulation supervision and risk management within the banking system developed by the Basel Committee on Banking Supervision
Basis points (bps) One per cent of one per cent (001 per cent)
Banking Executive Accountability Regime (BEAR) The Banking Executive Accountability Regime (BEAR) set out in Part IIAA of the Banking Act 1959 establishes accountability obligations for authorised deposit-taking institutions (ADIs) and their senior executives and directors
Bonus Interest savings Account (BISA) BOQrsquos Bonus Interest Savings Account is a savings account with a variable base interest rate and a bonus interest rate calculated on a tiered basis
BOQ Blue BOQ Blue refers to the original BOQ brand and excludes new brands such as Virgin Money BOQ Specialist and BOQ Finance It is predominantly represented as transactions and products serviced through our branch network business bank relationship managers and financial markets
BOQ Group Transformation Award (BTA) BOQ Group Transformation Award is a type of incentive award granted to select employees BTAs vest subject to the achievement of a core earnings hurdle
Capital Notes (BOQPE) amp Capital Notes 2 (BOQPF)
Capital Notes are perpetual convertible unguaranteed and unsecured notes issued by BOQ with preferred discretionary non-cumulative distributions Capital Notes may convert into common shares in certain circumstances as described in the offer documentation of the notes
Cash earnings Cash Earnings is a non-accounting standards measure commonly used in the banking industry to assist in presenting a clear view of underlying earnings
Committed liquidity facility (CLF) The RBA provides a CLF to certain ADIs as part of Australiarsquos implementation of the Basel III liquidity standards The facility is designed to ensure that participating ADIs have enough access to liquidity to respond to an acute stress scenario as specified under the relevant APS
Common equity tier 1 (CET1) Capital that is recognised as the highest quality component of capital under APS
Common equity tier 1 ratio (CET1 ratio) CET1 capital divided by total RWA calculated in accordance with relevant APS
Consolidated Entity (the Group) BOQ and its subsidiaries
Corporations Act 2001 The Corporations Act 2001 (Cth)
2012021 Annual Report
GLOSSARY
Financial Statements 108 | Signed Reports 183 | Shareholding Details 195 | Glossary 201
TERM DESCRIPTION
Corporation Regulations 2001 The Corporations Regulations 2001 made under the Corporations Act 2001 (Cth)
Cost to income ratio (CTI) Operating expenses divided by net operating income
Covered bond guarantor Perpetual Corporate Trust Limited ABN 99 000 341 533 incorporated with limited liability in the Commonwealth of Australia and having its registered office at Level 18 123 Pitt Street Sydney NSW 2000 as trustee of the BOQ Covered Bond Trust (the Trustee)
Deferred Award Rights (DARs) Deferred Award Rights (DARs) are a type of long-term incentive award rights granted to employees below Senior Executive Level DARs vest subject to service conditions and a risk assessment
Days past due (dpd) A loan or lease payment that has not been made by a customer by the due date
Dividend payout ratio Dividends paid on ordinary shares divided by earnings
Dividend reinvestment plan (DRP) A plan which provides shareholders with the opportunity to convert all or part of their entitlement to a dividend into new shares
Dividend yield Dividend shown as a percentage of the share price
Earnings per share (EPS) Measure of earnings attributed to each equivalent ordinary share over a twelve month period This is calculated by dividing the companyrsquos earnings by the weighted average number of shares on issue in accordance with AASB 133 Earnings per share
Effective tax rate Income tax expense divided by profit before tax
Equipment hire purchase trust (EHP trust) EHP trust under the REDS securitisation program issuing asset backed securities to the term market
Euro Medium Term Note (EMTN) EMTN is an offshore medium term note program
Expected Credit Loss (ECL) Estimated credit losses using a forward looking impairment methodology accounted for in accordance with AASB 9 Financial Instruments
Full time equivalent (FTE) A calculation based on number of hours worked by full and part time employees as part of their normal duties
General reserve for credit losses (GRCL) An additional reserve for future unidentified credit losses in line with APS 220 Credit Risk Management not reflected as part of existing ECL provisions
Gross Domestic Product (GDP) Monetary measure of the market value of all the final goods and services produced in a specific time period
Gross loans and advances (GLA) Gross loans and advances is the principal amount of loans and advances provided gross of provisions and deferred fee income and including any accrued interest
High Quality Liquid Assets (HQLA1) Comprises the Bankrsquos notes and coins and marketable securities representing claims on or guaranteed by the Australian Government or Semi-Government authorities
Impaired assets Exposures that have deteriorated to the point where full collection of principal and interest is in doubt
Interest bearing liabilities The Bankrsquos liabilities that accrue interest expense
International Accounting Standards Board (IASB) Independent private-sector body that develops and approves International Financial Reports Standards
International Financial Reporting Standards (IFRS)
A series of globally accepted accounting standards for accounting for particular types of transactions and events
International Panel on Climate Change (IPCC) IPCC is the United Nations body charged with overseeing climate change and publishing the global climate modelsrsquo (including RCPrsquos)
Issued capital Value of securities allotted in a company to its shareholders
Know Your Client (KYC) Regulatory compliance costs
The KYC guidelines in financial services require professionals to verify the identity suitability and risks involved with maintaining a business relationship The procedures fit within the broader scope of the Bankrsquos anti-money laundering (AML) policy
Line of credit (LOC) A flexible facility that allows a customer to draw down on their approved available credit at any time as long as the customer does not exceed the approved credit limit
Liquid assets All unencumbered RBA repurchase eligible liquid assets including HQLA1 and assets able to be pledged as collateral to the RBA under the CLF
Liquidity Coverage Ratio (LCR) The ratio of HQLA1 that can be converted into cash easily and immediately in private markets to total net cash flows required to meet the Grouprsquos liquidity needs for a 30 day calendar liquidity stress scenario as determined in accordance with APS
Members Equity Bank Limited (ME Bank or ME) ME Bank is a for profit entity that operates in the retail segment of the domestic market offering primarily home loan products and everyday transaction and online savings accounts
Mortgage Net Promoter Score (NPS) The Net Promoter Score is an index that measures the willingness of customers to recommend a companyrsquos products or services to others It is used as a proxy for gauging the customerrsquos overall satisfaction with a companyrsquos product or service and the customerrsquos loyalty to the brand
202 Bank of Queensland Limited and its Controlled Entities
GLOSSARY
Financial Statements 108 | Signed Reports 183 | Shareholding Details 195 | Glossary 201
TERM DESCRIPTION
Net capitalised investment (CAPEX) Net capitalised investment is the amount spent on purchasing or improving capital assets less their cost of the depreciation and amortisation
Net interest margin (NIM) Net interest income divided by average interest-earning assets
Net stable funding ratio (NSFR) The NSFR is defined as the amount of ASF relative to the amount of required stable funding This ratio should be equal to at least 100 on an on-going basis The amount of such stable funding required of a specific institution is a function of the liquidity characteristics and residual maturities of the various assets held by that institution as well as those of its off-balance sheet exposures
Net tangible assets (NTA) Net tangible assets are calculated as the total assets of a company minus any intangible assets such as goodwill less all liabilities and the par value of preferred stock
Non-Executive Director Fee Sacrifice Rights Plan (NED Plan)
The Non-Executive Director Fee (NEDs) Sacrifice Rights Plan (NED Plan) allows NEDs to sacrifice a portion of their Board fees to acquire BOQ shares
Non-interest earning assets The Bankrsquos assets that do not accrue interest income
Novel coronavirus disease (COVID-19) The Novel Coronavirus disease that was declared as a global pandemic on 11 March 2020
Owner-managed Branch (OMB) A branch which is run by a franchisee
Performance Award Rights (PARs) Performance Award Rights (PARs) are a type of long-term incentive award rights which were granted to senior employees including executives until 2019 PARs vest subject to two performance hurdles relative total shareholder return (rTSR) and relative earnings per share (EPS)
REDS Term to describe the BOQ securitisation programmes
Representative Concentration Pathway (RCP) RCP are physical climate scenarios set by the IPCC (with the assistance of the global scientific community)
Required stable funding (RSF) RSF is an input to the calculation of the NSFR for bank prudential management purposes A bankrsquos RSF is calculated from its assets weighted according to their maturity credit quality and liquidity together with an amount in relation to off balance sheet commitments
Reserve Bank of Australia (RBA) Australiarsquos central bank and drives its functions and powers from the Reserve Bank Act 1959
Residential mortgage backed securities (RMBS) BOQrsquos securitisation program which enables the trustee to issue debt securities backed by assets originated by the Group such as mortgages
Return on average equity (ROE) Net profit attributable to the owners of the Bank divided by average ordinary equity
Return on average tangible equity (ROTE) Net profit attributable to the owners of the Bank divided by average ordinary equity less goodwill and identifiable intangible assets
Right-of-use (ROU) asset The right-of-use asset is a lesseersquos right to use an asset over the life of a lease
Risk weighted assets (RWA) A quantitative measure of various risks including credit operational market and securitisation as defined by APS
Significant Increase in Credit Risk (SICR) SICR is a significant change in the estimated risk of default over the remaining expected life of the financial asset SICR is assessed by comparing the risk of a default occurring over the expected life of a financial asset at the reporting date compared to the corresponding risk of default at origination
Small and Medium Enterprises (SME) SME are businesses whose personnel numbers fall below certain limits
Term Funding Facility (TFF) Funding Facility for authorised deposit-taking institutions established by the RBA to support the Australian economy
Total capital adequacy ratio Total capital divided by total RWA calculated in accordance with relevant APS
Total Shareholder Return (TSR) TSR is a measure of the entire return a shareholder would obtain from holding an entityrsquos securities over a period taking into account factors such as changes in the market value of the securities and dividends paid over the period
Treasury shares Shares that the Bank has issued but are held by a trust included within the Bankrsquos consolidated results Treasury shares are not considered shares outstanding and are not included in lsquoper sharersquo calculations
Virgin BOQ Group Transformation Award (VTA) Virgin BOQ Group Transformation Award is a type of incentive award granted to select employees VTAs vest subject to the achievement of two hurdles core earnings and the delivery of the Virgin Money digital bank
Virgin Money Australia (VMA or Virgin Money)
Virgin Money (Australia) Pty Ltd and its subsidiaries The VMA entities are subsidiaries of the Group that engage in the provision of financial services on behalf of business partners including BOQ
Weighted average life (WAL) Is the average length of time for the principal on a loan to be paid in full
Weighted average number of shares (WANOS) Calculated in accordance with AASB 133 Earnings per share
Wholesale Capital Notes (WCN) WCNs are notes that may convert into common shares in certain circumstances as described in the offer documentation of the notes
2032021 Annual Report
GLOSSARY
Financial Statements 108 | Signed Reports 183 | Shareholding Details 195 | Glossary 201
Bank of Queensland LimitedABN 32 009 656 740
- 2021 Reporting Suite

The Charvel property in Theodore Queensland has been in the Hewitt family since 1958 when Alanrsquos parents first purchased the land Since then Alan and his wife Tracey have run the mixed operation of cattle grazing and irrigated cropping with the help of their three sons
After many years with another bank the Hewitts switched to BOQ in 2013 and formed a strong bond with BOQ Agribusiness Manager Ian Mills who has now become part of the furniture It was important to Tracey and Alan that they have a real and honest partnership with their bank and work with people who understand their business and believe in what theyrsquore doing
With over 30 yearsrsquo experience working in agribusiness across Queensland Ian is extremely passionate about the industry and enjoys his frequent visits to the Charvel property Ian plays his part by understanding who the Hewitts are as a family what the farm needs season to season and how it all fits together
BOQ Agribusiness Manager Ian said ldquoItrsquos incredibly important to make that effort to understand the business This is not just a financial transaction at the bank itrsquos about understanding whatrsquos important to them listening where they want to get to and workshopping your ideas together Itrsquos a real partnership and thatrsquos what we work to strive forrdquo
Most recently Ian met with the Hewitts about purchasing more property After discussing their goals and priorities they chose to instead finance a loan for a bulldozer and a renovation project which for the same investment provided a much greater return over time
Tracey was particularly pleased with the time care and thought that went into the decision from Ian and the agribusiness team and felt as though they were part of a real partnership
A TRUE PARTNERSHIP WITH FAMILY RUN BUSINESSES
COVER STORY
ldquo Wersquove been with other banks that make you feel like yoursquore just another asset or liability They like to keep an eye on what yoursquore doing to make sure their money is safe but at BOQ you feel like yoursquore part of a team They keep an eye on what yoursquore doing because they have a genuine interest and want to understand how they can help you betterrdquo
- Tracey Hewitt BOQ agribusiness customer
2 Bank of Queensland Limited and its Controlled Entities
OverviewFY21 Financial Results 4
Chairmanrsquos Review 6
Managing Director and CEOrsquos Message 8
Directorsrsquo Report 12About BOQ 12
Responding to COVID-19 14
Acquisition of ME Bank 15
Value Creation and Strategy 16
Financial Performance 20
Governance and Risk Management 55
Directorsrsquo Details 71
Remuneration Report 76
Lead Auditorrsquos Independence Declaration 105
Financial Report 107Income Statements 108
Statements of Comprehensive Income 109
Balance Sheets 110
Statements of Changes In Equity 111
Statements of Cash Flows 115
Notes to the Financial Statements 116
Other InformationDirectorsrsquo Declaration 183
Independent Auditorrsquos Report to the Members 184
Shareholding Details 195
Shareholder Information 200
Glossary 201
We are always looking for ways to improve our reporting Please send your questions or suggestions to our Investor Relations team at InvestorRelationsboqcomau
CONTENTSABOUT THIS REPORT
Bank of Queensland Limited ABN 32 009 656 740 AFSL No 244616 Level 6 100 Skyring Terrace Newstead QLD 4006
About this report This yearrsquos Annual Report includes details of BOQrsquos purpose and values strategy our value creation story operations audited financial statements and other statutory disclosures The report predominantly focuses on our financial performance with further detail on our non-financial performance measures contained in the 2021 Sustainability Report We are continuing to enhance our reporting to explain to stakeholders how we deliver long-term value
Unless otherwise stated the Annual Report encompasses all BOQ activities for the financial year commenced 1 September 2020 and ended 31 August 2021 All monetary values in this document are presented in Australian dollars which is the Bankrsquos functional currency Our Operating and Financial review is contained in pages 12 - 75 of this report
Other documents in our 2021 reporting suiteBOQ produces a range of reports designed to meet the evolving expectations of a wide number of stakeholders Our 2021 annual reporting suite also includes the following documents
Sustainability ReportOur 2021 Sustainability Report outlines information about our performance against social environmental and economic opportunities and challenges This report is available on the Annual Reports page of our website and is supported by supplementary information available on the Sustainability section of our website
Corporate Governance Statement Our 2021 Corporate Governance Statement discloses how we have complied with the ASX Corporate Governance Councilrsquos Corporate Governance Principles amp Recommendations (4th edition) and is available on the Corporate Governance page of our website
FY21 Investor Materials Our FY21 Investor Materials provide a high level overview of the Grouprsquos performance along with a detailed result analysis and a discussion on the outlook which covers the macro environment and the Grouprsquos high level priorities Investor Materials are available on the Financial Results page of our website
32021 Annual Report
2018 2019 2020 2021
PROFIT RESULTS ($m)
LOAN IMPAIRMENT EXPENSE ($m)
2018 2019 20212020
EARNINGS amp DIVIDENDS (cent per ordinary share)
FY21 CASH EARNINGSafter tax
$412m83 221 51
from FY20
from FY20
from FY20 225
from FY20
STATUTORY NET PROFITafter tax
$369m
CASH BASIC EARNINGS PER ORDINARY SHARE(cent per share)
747cent
DIVIDENDS PER ORDINARY SHARE(cent per share)
39cent
NET INTEREST MARGIN CASH COST TO INCOME RATIO CASH RETURN ON EQUITY
2018 2019 2020 2021
41 69 175 (21)
($21m)Includes $71 million
reduction in the collective provision
372 336 747320 298 225 115 412 369 496
12
770 65915 76
82Up 280bps from FY20
192Up 1bp from FY20
544Down 50bps from FY20
Cash Earnings after Tax Cash Basic Earnings per Ordinary ShareStatutory Net Profit after Tax Dividends per Ordinary Share
39
FY21 FINANCIAL RESULTS
4 Bank of Queensland Limited and its Controlled Entities
$ millions (unless otherwise stated)2021
$m2020
$m2019
$m2018
$m2017
$m
FINANCIAL PERFORMANCE(1)
Net interest income 1128 986 961 965 926
Non interest income(2) 130 128 144 160 190
Total income(2) 1258 1114 1105 1125 1116
Operating expenses(2) (684) (612) (571) (542) (528)
Underlying profit before tax(3) 574 502 534 583 588
Loan impairment expense 21 (175) (69) (41) (48)
Cash earnings before tax 595 327 465 542 540
Cash earnings after tax 412 225 320 372 378
Statutory net profit after tax 369 115 298 336 352
FINANCIAL POSITION
Gross loans and advances(4) 75748 47043 46216 45279 43817
Total assets 91432 56772 55597 52980 51658
Customer deposits 56469 34762 32428 31325 30190
Total liabilities 85235 52541 51738 49124 47869
Total equity 6197 4231 3859 3856 3788
SHAREHOLDER PERFORMANCE
Market capitalisation at balance date 6063 2785 3721 4565 4932
Share price at balance date ($) 946 613 917 1149 1259
Cash basic earnings per share (cents)(5) 747 496 770 915 944
Cash diluted earnings per share (cents)(5) 695 451 719 867 910
Fully franked dividend per ordinary share (cents) 39 12 65 76 76
Fully franked special dividend per ordinary share (cents) - - - - 8
Cash dividend payout ratio to ordinary shareholders 61 24 82 81 78
CASH EARNINGS RATIOS
Net interest margin(6) 192 191 193 198 187
Cost-to-income ratio(2) 544 549 517 482 473
Return on average ordinary equity 82 54 83 99 104
CAPITAL ADEQUACY
Common Equity Tier 1 ratio 980 978 904 931 939
Total Capital Adequacy ratio 1260 1273 1240 1276 1237
(1) All amounts disclosed are on cash basis except statutory net profit after tax(2) Virgin Money Australia (VMA) operating costs have been restated from non-interest income and included in operating expenses per ASX announcement on
30 September 2021(3) Underlying profit before tax is profit before impairment on loans and advances significant items and tax(4) Before specific and collective provisions(5) Comparatives for basic and diluted earnings per share have been adjusted for the effects of the Grouprsquos capital raise in March 2021(6) 2021 2020 2019 and 2018 Net Interest Margin (NIM) is net of offset accounts
5 YEAR FINANCIAL SUMMARY
52021 Annual Report
CHAIRMANrsquoS REVIEW
Dear Fellow Shareholders
I am delighted to be able to report a strong financial and operating performance for BOQ in FY21
BOQ has delivered both statutory and cash earnings growth of 221 per cent and 83 per cent respectively We have achieved statutory net profit after tax of $369 million and cash earnings after tax of $412 million
Key highlights of our transformation progress this year include our strong financial results achieving above system mortgage growth whilst maintaining prudent risk settings strengthening our team with improved leadership and execution capability further embedding our values driven performance culture improving loan approval times for our customers delivering phase 1 of our digital first strategy and the successful acquisition of Members Equity Bank Limited (ME Bank or ME)
The value accretive acquisition of ME Bank is strategically aligned and is expected to deliver material scale and synergies a diversified customer footprint and rebalanced revenue channels with improved return on equity The ME Bank integration is on track and is a key strategic deliverable over the next 12 months
We are making material progress in delivering our growth strategy to uplift our financial and customer performance and build a scalable multi-brand digital-first bold challenger bank with a personal touch
These pleasing results underscore our continuous improvement journey and high ambition to delight our customers be a great place to work and to grow shareholder value
CustomersContinuing to improve the customer experience and delight our customers every day is at the heart of our strategic transformation
During FY21 we enhanced the digital bank proposition for Virgin Money Australia customers by offering transaction and saving account services for the first time This was built on a digital platform that we will extend to form the foundation for the Retail Bank delivering improved digital customer offerings and experiences for all the BOQ Group brands
We will continue to work closely with our customers the government and regulators to ensure we maintain support for customers facing hardship or requiring help resulting from the COVID-19 pandemic
Shareholders amp Capital ManagementThe transformative acquisition of ME Bank and our improved performance this financial year have enhanced shareholder value
We recognise the importance of dividends to our shareholders and the Board has determined to pay a final fully franked dividend of 22 cents per share bringing the FY21 dividend to 39 cents per share Barring unforeseen circumstances we are targeting a dividend payout ratio between 60 per cent and 75 per cent of cash earnings going forward We believe this payout ratio enables BOQ to balance an attractive annual distribution to shareholders against the capital needed to support our business transformation growth and the resilience of the bank
We remain committed to prudent balance sheet and capital management Our CET1 ratio at financial year end was 980 per cent During this higher risk period we intend to retain our CET1 ratio above the top end of our target range of 90 - 95 per cent(1)
We funded the ME Bank acquisition via a $135 billion capital raising and we thank shareholders for their support Due to unforeseen extensive delays in Australia Post some of our retail shareholders missed the cut-off date for acceptance of the rights issue offer We sincerely apologise to those shareholders that were unable to participate
The capital raising timeline and structure was determined based on the material size of the capital raising as a per cent of our market capitalisation and the need to present an attractive fully underwritten bid to provide certainty of funding and price in a competitive tender process We believe the accelerated timeline and non-renounceable structure were critical to BOQ Group achieving a timely underwritten capital raising winning the bid minimising the dilution impact of the capital raising and providing the opportunity to create value for all of our shareholders
People amp CultureEmbedding a performance driven culture through empowering our people and holding them to account to deliver against our key performance indicators is core to our strategic transformation We are encouraging our people to speak up question the status quo and experiment to achieve improved outcomes
Reliability transparency and trust are at the core of everything we do Living our purpose and values drive excellent conduct and better customer and community outcomes
Keeping our people safe and informed and maintaining continuity of our operations have been key priorities during the pandemic We have adopted an agile approach to working that includes a hybrid model of returning to the office when health directions permit along with remote flexible working Our branches remained open throughout the various pandemic restrictions and we are proud of the dedication shown by our people who continue to attend our workplaces to support our customers
We recognise that quality people and strong leadership will drive our success We continue to enhance and develop the calibre of the leadership team and our people building a diverse team with strong execution capability
(1) BOQ intends to operate above the management target range of 90 - 95 per cent in FY22 until the final impacts of APRArsquos changes to RWAs and capital calibration are understood Refer to page 54 in the ME Bank acquisition investor presentation for further detail
6 Bank of Queensland Limited and its Controlled Entities
Building a sustainable businessBOQ remains committed to building a sustainable business and recognises our social responsibility to deliver improved outcomes for all stakeholders and the environment We continue our journey to being a more sustainable organisation by achieving carbon neutral certification during FY21
Board renewalThe BOQ Board embarked on a period of renewal and continuous improvement in late 2019 to enhance our diversity future fit skills mix and intellectual curiosity Effective from the 2021 AGM the Board renewal program will be complete The size of the Board will have reduced from 11 to 8 Directors (7 non-executive)
I welcome Mickie Rosen and Deborah Kiers who joined the Board in 2021 and look forward to the considerable contribution they will bring across their combined skills of digital transformation consumer experiences organisational design people amp culture strategy and ME Bank Heritage
I would like to take this opportunity to thank Kathleen Bailey-Lord who retired from the Board in 2021 for her contribution to BOQ
Looking aheadUnder the strong leadership of George Frazis our Managing Director amp CEO and the Executive Committee we have good momentum in the business and are well positioned to continue to progress our transformation journey We are 18 months into this journey and have a lot more to do to meet our ambitious aspirations for BOQ to create long term value for our customers shareholders and our people
Our operating environment remains uncertain with the ongoing pandemic high asset prices and increased leverage at a low point in the interest rate cycle We will continue to support our customers with flexible policies and relief packages manage prudent risk settings in this higher risk environment and refine our strategy where appropriate
With the increased vaccine rollout across Australia we are cautiously optimistic about the future We encourage all of our stakeholders to get vaccinated to support their well-being and the lifting of lockdown restrictions enabling the re-opening of Australia
I express my deepest thanks to my colleagues on the Board our CEO the Executive Committee and all our employees for their material contribution to BOQ
Thank you to our customers and shareholders for your ongoing support of BOQ
ldquo Continuing to improve the customer experience and delight our customers every day is at the heart of our strategic transformationrdquo
Patrick Allaway Chairman
72021 Annual Report
Dear Shareholder
This year we have seen economic conditions improve compared to the previous year due to the commencement of the vaccine rollout and related consumer and business optimism However recent lockdowns and restrictions have reminded us that COVID-19 and the associated economic consequences remain present I believe the saying is ldquotough times donrsquot last tough people dordquo and that has never been more true of our people and our customers who have shown resilience and optimism despite the challenges
As stewards of a business with a long heritage my team and I have continued to focus on delivering our strategy to enhance the experience for our customers stakeholders and people
Customers and CommunityBOQrsquos strong balance sheet and the commitment of our people allows us to support customers in hardship as well as contribute to meaningful community initiatives In the past 12 months BOQ supported hundreds of customers in hardship with personal and business loan deferrals and in August we simplified our systems and removed dishonour fees for overdrawn accounts We have maintained our retail and business Net Promoter Score ranking of 3rd during FY21 by delivering a superior customer experience
We recognise the role BOQ plays in the communities in which it operates We continued our support of Aboriginal and Torres Strait Islander peoples through our work with the STARS and Clontarf Foundations that provide education and development of life skills for these communities We also continued our relationship with our community partner Orange Sky during the year to provide laundry and shower vans for people in need
Progress against strategyOur experienced executive team continues to deliver against the strategy outlined to the market in February 2020 The ME Bank acquisition underscores our growth agenda by significantly expanding our Retail bank and allowing the Group to diversify its revenue profile and geographic presence
Significant progress has been made against the transformation roadmap with a key achievement being the launch of savings and transactions accounts for Virgin Money entrenching its credentials as a digital bank Another important step on our digital roadmap was the upgrade and integration of our card management system This has allowed us to put both BOQ and VMA cards on the same platform which enables improved digital banking app capability This has also delivered the choice and convenience customers have been requesting as the new digital wallet capability now allows them to link their cards to Apple Pay Samsung Pay and Google Pay
MANAGING DIRECTOR AND CEOrsquoS MESSAGE
ldquo I believe the saying is ldquotough times donrsquot last tough people dordquo and that has never been more true of our people and our customersrdquo
8 Bank of Queensland Limited and its Controlled Entities
The second phase of the Virgin Money Digital bank to include home loans and additional deposit products is well progressed and the scalability of the API based digital platform allows this technology to be leveraged as a strategic Group platform with the build of a BOQ Digital Bank substantially underway
The multi-year roadmap incorporates the ME Bank integration to ultimately deliver a common cloud based Retail platform for all BOQ brands
Work continues on enhancing our lending process from front to back with the Small Business Enablement program underway identifying efficiencies Other key investment includes the build of the Intelligent Data Platform foundations to enable Open Banking capabilities and a program to enhance the user experience for our people
We have delivered a further $30 million in productivity savings across the Bank in FY21 in addition to the $30 million delivered in FY20 These savings have enabled us to invest in new digital risk and regulatory programs
The sale of St Andrewrsquos is expected to be completed in 1H22 enabling BOQ to simplify its business model and focus on niche customer segments
PeopleThe Executive Team and I are united in our commitment to making BOQ Group a great place to work and pleasingly our engagement score increased five per cent in FY21 compared to last yearrsquos score
We have built a strong leadership team with the addition of Martine Jager as our Group Executive Retail Banking and CEO ME Bank Danielle Keighery as the Chief Customer Officer and Nicholas Allton in the role of Group General Counsel and Company Secretary We have recently announced the appointment of Chris Screen to the role of Group Executive Business Banking and we will welcome David Watts as BOQrsquos Group Chief Risk Officer in early 2022
During the year we welcomed a large number of new employees to the Group through the acquisition of ME Bank This team enhances our presence in Victoria and we believe our aligned customer-focused cultures will see a successful integration of ME Bank into the BOQ Group while continuing to maintain a differentiated proposition through the ME brand
We continued to focus on the wellbeing of our people during the year and to manage for impacts from COVID-19 we implemented flexible policies for non-front line workers and ensured eligible employees could take advantage of special leave for vaccinations I am proud of our people and the key role they continue to play in supporting customers I thank them for their dedication and acknowledge their hard work over the course of another trying year
PerformanceThe execution of our strategy throughout FY21 has driven our strong business performance for the year
Total income increased by 13 per cent as we continued to grow our balance sheet above system while preserving our margins Our expenses grew 12 per cent during the year as we supported volume growth while investing for the future
Impairment expenses decreased during FY21 as we reduced the collective provision in light of changes to the economic environment and expected future loan losses Maintaining a strong balance sheet continues to be important for BOQ and our capital remains comfortably above APRArsquos benchmark with a CET1 ratio of 980 per cent
Overall our improvement in statutory NPAT of 221 per cent to $369 million reflects the improved business performance operating conditions and a customer focused culture
Having completed the acquisition of ME Bank on 1 July 2021 our integration program has shown solid progress with early momentum and focus resulting in the acceleration of synergies and the development of a clear integration roadmap
The futureEven as our future feels uncertain because of the ongoing impact from the pandemic Irsquove never felt more optimistic about the ability of our people and customers to pull through to better times As the vaccine rollout gathers pace and policy settings encourage economic stability and growth Irsquom hopeful our customers stakeholders and people will join our business in returning to a more stable operating environment
Looking ahead I am very excited about the future The integration of ME Bank is underway and we have a clear strategic roadmap which we are executing against We are committed to repaying the support of our shareholders by delivering sustainable profitable returns
I believe we have the right people in place to execute on our strategy to transform BOQ into a digital bank with a personal touch to create a compelling proposition for our shareholders customers people and the community
George Frazis Managing Director and CEO
92021 Annual Report
2021 DIRECTORSrsquo REPORT
BOQ HAS A SIGNIFICANT PRESENCE AROUND AUSTRALIA
Customers in every State and Territory
$565bnCustomer deposits
163Branches
15mCustomers
$757bnGross loans
and advances
BOQ is one of Australiarsquos leading regional banks having served customers for 147 years
During BOQrsquos long history it has evolved from a Queensland focused retail branch-based bank to a national diversified financial services business with a focus on niche commercial lending segments highly specialised bankers and branches run by small business owners who are deeply anchored in their communities In FY21 BOQ has been further strengthened and diversified through the acquisition of ME Bank
We provide a range of products to support the financial needs of our customers and pride ourselves on building long term customer relationships that are digitally enabled with a personal touch
Purpose and Values
Our purpose is to create prosperity for our customers shareholders and people through empathy integrity and by making a difference
Our values are contained within the purpose statement ensuring our people are clear on the key values to which BOQ subscribes
Our purpose and values communicate a simple and clear message for our people We are committed to ensuring our purpose and values are reflected in everything we do ndash from the development of our strategy to our everyday interactions with our customers and communities
We recognise we have more to do to ensure all our interactions and decisions have empathy at the core and this is an aspirational target for BOQ
bull We take pride in doing whatrsquos right speaking up and we do what we say we will do
bull We establish high and clear standards and hold ourselves and others accountable
bull We have the courage to raise and own mistakes and empower others to do the same
Integrity
bull We are bold and take reasonable risks to create prosperity
bull We focus on delivering outcomes for our customers and improving the way things are done
bull We achieve together and celebrate the positive impact we create
Making a difference
bull We seek to understand and feel what others are experiencing then we take action to help them We are curious and interested in other perspectives
bull We ask great questions to understand where our customers and colleagues are coming from
bull We use our insights to create great experiences by showing care providing and receiving feedback building trust and taking action
Empathy
ABOUT BOQ
12 Bank of Queensland Limited and its Controlled Entities
About BOQ 12 | Responding to COVID-19 14 | Acquisition of ME Bank 15 | Value Creation and Strategy 16
Distinctive brands serving attractive niche customer segments
Over time BOQ has successfully acquired a portfolio of brands which form the basis of our multi-brand strategy These different and complementary business lines provide us with a competitive advantage due to our specialised knowledge in these niche segments
Retail Banking
BOQ BusinessBOQ Business is a relationship led business with specialist bankers providing client solutions across Small Business Agribusiness Corporate Banking Property Finance Healthcare amp Retirement and Tourism Leisure amp Hospitality BOQ Business also works closely with the Owner Manager network to support commercial customers who value a more intimate business banking relationship with passionate industry experts
FinanceBOQ Finance is a wholly owned subsidiary of BOQ Group Limited specialising in asset finance and leasing solutions
BOQ Finance is a mid-market financier providing deep industry and product skills to its partner base BOQ Finance has been operating in the Australian and New Zealand markets for more than 45 years
BOQ SpecialistBOQ Specialist delivers distinctive banking solutions to niche market segments including medical dental and veterinary professionals BOQ acquired the business (previously Investec Professional Finance) from Investec Bank (Australia) Limited in 2014 BOQ Specialist operates as a niche brand within BOQrsquos Business Bank
BOQ Business
BOQrsquos business lines are supported by a number of Group functions including Group Customer Technology Risk Finance Transformation amp Operations Legal and our People amp Culture teams These key functions support our bank by managing our operations property strategy finance treasury technology architecture infrastructure amp operations risk compliance legal human resources and corporate affairs
Group Functions
Commercial lending deposits financial markets and insurance
Asset finance and leasing Lending deposits credit cards and leasing for medical and professional services
ABOUT BOQ
Retail and SME lending deposits credit cards and insurance
BOQBOQ is the Retail banking arm of the BOQ Group and is comprised of 163 branches across Australia offering a range of banking products Our 103 Owner-Managed Branches (OMB) are run by local Owner-Managers who understand the importance of delivering high quality customer service and are deeply committed to the communities in which they operate
Digital home loans deposits credit cards insurance and superannuation
VMAVMA is a digital first retail financial services company which provides a wide range of financial products that are easy to understand and is a compelling alternative to the big banks BOQ acquired VMA in 2013 and it operates as a standalone brand within the BOQ Group
Home loans personal loans deposits and credit cards
ME BankME Bank is a branchless retail bank which provides a wide range of banking products to customers through mobile bankers direct channels and brokers ME Bank was acquired by BOQ in July 2021 and operates as a distinct brand within the BOQ Group
132021 Annual Report
Financial Performance 20 | Governance and Risk Management 55 | Directorsrsquo Details 71
Employee supportThe health and wellbeing of our people has remained a key focus throughout FY21 We have built upon lessons from 2020 to ensure the health wellbeing and safety of our people is protected and our actions have been continually updated based on guidance from State and Federal authorities and the World Health Organisation We are supportive of the National Cabinet reopening plan and vaccination program and have provided our people with paid vaccination leave
Banking is an essential service and accordingly we have kept our branch network open throughout this period as well as maintaining our other operations
Managing our credit riskBuilding upon the processes implemented in 2020 BOQ is continuing to monitor the credit quality of the portfolio to assess economic impacts due to COVID-19 particularly in light of the recent spike in cases causing the reintroduction of more severe restrictions and lockdowns
BOQ has a number of credit models designed to assist in measuring the credit risk in the portfolio based on changing economic and environmental conditions
Customer SupportWhile the first banking relief package came to an end on 31 March 2021 our Retail and Business Bankers and BOQ Specialist relationship managers continue to work very closely with their customers to understand their needs during this time and to support them in the ever changing COVID-19 environment This includes re-introducing a relief package in July 2021 to support customers impacted by an extended period of lockdown
Support for Personal CustomersTo help customers experiencing difficulty BOQrsquos Customer Assistance Team provides access to a range of support measures including
bull The ability to defer mortgage andor loan repayments or make interest only repayments for a short period
bull Special arrangements in relation to arrearsbull Early access to Term Deposit funds with wavier of
redemption feebull Waiver of other fees and charges related to non-paymentIn addition BOQ has supported retail customers to manage their cash flow needs through offering competitive home loan and deposit products with flexible features such as interest only offset and redraw facilities
Support for Business CustomersAustralian businesses have also been under pressure from restrictions and lockdowns and we continue to offer financial assistance to our Business Banking customers which include
bull Small business customers are able to defer repayments for up to 3 months with loan terms extended accordingly
bull Eligible customers are able to receive refunds of merchant terminal rental fees for up to 3 months
bull Eligible customers do have early access to Term Deposit and Farm Management Deposit funds and a waiver of redemption fee for up to 3 months
We note that further deferrals or restructuring for businesses facing extended disruption may not be in their best interest In these circumstances BOQ works closely with our customers to find a responsible solution
RESPONDING TO COVID-19The COVID-19 pandemic has had ongoing impacts for our customers and people throughout FY21 and we remain committed to supporting them through these challenging times We recognise our responsibility to maintain confidence in the economy and our role is to ensure the systems and processes we have in place underpin the resilience of the business and our people which in turn supports customers
Business resilienceBOQ Group continues to develop scenario models to identify potential risks to our business under a range of different economic outcomes The application of these models ensures BOQ is able to respond quickly to either the economy showing signs of recovery as shown in the first half of 2021 or the reintroduction of restrictions and lockdowns as we are currently experiencing in some parts of Australia
Our strong levels of capital and liquidity positions us well for any potential scenario and we continue to refine our risk models as additional economic data becomes available
About BOQ 12 | Responding to COVID-19 14 | Acquisition of ME Bank 15 | Value Creation and Strategy 16
14 Bank of Queensland Limited and its Controlled Entities
At BOQ we have a strong history of servicing our customers with a focus on niche segments through our owner managers and specialised bankers We have evolved from a Queensland focused retail branch-based bank to a national diversified financial services business through our multi-brand strategy building relationships with the communities we support In February 2021 we announced the exciting acquisition of ME Bank adding a strong complementary customer focused brand
Strategic rationaleThe ME Bank Acquisition is expected to deliver strategic and financial benefits to the BOQ Group
bull significantly enhanced scale broadly doubling the retail bank and providing geographic loan portfolio and revenue diversification
bull strong complementary trusted brands with shared customer-centric cultures and differentiated customer segments
bull a clear pathway to a scaled common cloud based digital retail bank technology platform
bull attractive financial outcomes including improved returns on equity and earnings per share whilst also maintaining a strong balance sheet
IntegrationPlanning for the integration commenced soon after we announced the intended acquisition of ME Bank in February 2021
In order to deliver the strategic and financial benefits of the acquisition BOQ has developed an Integration program with Board and Executive sponsorship and established an Integration Management Office (IMO) to manage the overall program The IMO has introduced strong governance across the program developing risk management frameworks and program management capabilities to support the delivery work streams
Prior to completion there was good engagement between the BOQ and ME Bank teams which enabled a day 1 readiness program to be built and successfully executed Post completion the integration program has been able to deliver a number of quick wins as well as develop detailed integration plans and validate the due diligence assumptions The integration plan and associated technology roadmap ensures there is a clear pathway to deliver on BOQrsquos strategic ambitions
Further information on ME Bank and the integration is available in the FY21 Sustainability report pages 28 - 29
ACQUISITION OF ME BANK
About ME BankME Bank is a branchless retail bank which provides a wide range of banking products to customers through mobile bankers direct channels and brokers ME Bank was acquired by BOQ in July 2021 and operates as a distinct brand within the BOQ Group
CUSTOMER NUMBERS
CUSTOMER DEPOSITS
EMPLOYEES (1)
GROSS LOANS AND ADVANCES
~580k$18bn
~1100$25bn
ldquo The acquisition of ME Bank was a defining moment for BOQ delivering on our transformation strategy and benefitting our customers shareholders and people The addition of ME Bank delivers material scale broadly doubles our Retail Bank and provides geographic diversificationrdquo- BOQ Managing Director and CEO George Frazis
(1) Excludes contingent workers
Financial Performance 20 | Governance and Risk Management 55 | Directorsrsquo Details 71
152021 Annual Report
Our em
pathetic
culture sets us apart
Distinctive brands serving
attractive niche customer segmentsDigital bank of the futurewith a personal touch
Simple and intuitive business
with strong execution capability
Stron
g fin
anci
al a
nd ri
sk p
ositi
on
with
att
ract
ive
retu
rns
CUSTOMER
COMMUNITY
PEOPLE ENVIRONMENT amp
CLIMATE CHANGE
FINANCE
TECH
NOLO
GY amp
DA
TA C
APAB
ILIT
IES
bull Quality custom
er relationships
bull Custom
ers
bull Relationships with local communities
bull Owner manager branches
bull Employees bull Diversity and Inclusion bull Capabilities and skills
bull Organisational culture and values
bull Impact on the natural environment
both directly and through the use
of products
bull Shareholders
debt invest
ors
bull Pool o
f funds a
vailable
bull E
cien
t and
e
ectiv
e us
e of
dig
ital
capa
bilit
ies
to d
eliv
er b
anki
ng s
ervi
ces
We provide a range of financial services to
meet the needs of our custom
ers
We are focused on supporting individuals and small
and family business customers in our niche segments We aim to provide exceptional customer experiences
and believe in fair outcomes for customers
We invest in our people to build a diverse and inclusive workforce with key
competencies to execute our strategy
We c
ontr
ibut
e to
the
wel
lbei
ng o
f the
com
mun
ities
in w
hich
we
oper
ate
OPERATING ENVIRONMENT
Improving
credit growth
environment
Changing
customer
needsIncreasedregulatoryamp compliance requirements
Environment
amp climate
Macro-
economic amp
demographic
tre
ndsD
igit
al a
nd
tech
nolo
gy
adva
ncem
ents
BOQ VALUE DRIVER INPUTS
ACTIVITIESOUR BUSINESS
OUTPUTSBOQ
BOQrsquoS FIVE STRATEGIC PRIORIT
IES
Retail and SME lending deposits credit cards and insurance
Digital home loans deposits credit cards insurance and superannuation
BOQ VALUE
bull Build trusted customer relationships with a personalised touch
bull Achieve fairer customer outcomes bull Support individuals and businesses to achieve
their financial goals
bull Experienced bankers anchored in the community
bull Increase access to financial services and ongoing support
bull Improve financial literacy and wellbeing of the community
bull A resilient adaptable empowered diverse and inclusive workforce with a strong sense of purpose and ethics
bull Increase skills and capabilities of our peoplebull BOQ is seen as an employer of choice
CUSTOMER PEOPLE FINANCE TECHNOLOGY ampDATA CAPABILITIES
ENVIRONMENT amp CLIMATE CHANGECOMMUNITY
HOW WE CREATE VALUE
bull Build trusted customer relationships with a personalised touch
bull Achieve fairer customer outcomes bull Support individuals and businesses to achieve
their financial goals
bull Experienced bankers anchored in the community
bull Increase access to financial services and ongoing support
bull Improve financial literacy and wellbeing of the community
bull A resilient adaptable empowered diverse and inclusive workforce with a strong sense of purpose and ethics
bull Increase skills and capabilities of our peoplebull BOQ is seen as an employer of choice
Home loans personal loans deposits and credit cards
View our Sustainability Report
Further information on our strategic priorities is contained on pages 18 - 19
boqcomau2021 View our Sustainability Report boqcomau2021 View our Sustainability Report boqcomau2021
16 Bank of Queensland Limited and its Controlled Entities
About BOQ 12 | Responding to COVID-19 14 | Acquisition of ME Bank 15 | Value Creation and Strategy 16
Our em
pathetic
culture sets us apart
Distinctive brands serving
attractive niche customer segmentsDigital bank of the futurewith a personal touch
Simple and intuitive business
with strong execution capability
Stron
g fin
anci
al a
nd ri
sk p
ositi
on
with
att
ract
ive
retu
rns
CUSTOMER
COMMUNITY
PEOPLE ENVIRONMENT amp
CLIMATE CHANGE
FINANCE
TECH
NOLO
GY amp
DA
TA C
APAB
ILIT
IES
bull Quality custom
er relationships
bull Custom
ers
bull Relationships with local communities
bull Owner manager branches
bull Employees bull Diversity and Inclusion bull Capabilities and skills
bull Organisational culture and values
bull Impact on the natural environment
both directly and through the use
of products
bull Shareholders
debt invest
ors
bull Pool o
f funds a
vailable
bull E
cien
t and
e
ectiv
e us
e of
dig
ital
capa
bilit
ies
to d
eliv
er b
anki
ng s
ervi
ces
We provide a range of financial services to
meet the needs of our custom
ers
We are focused on supporting individuals and small
and family business customers in our niche segments We aim to provide exceptional customer experiences
and believe in fair outcomes for customers
We invest in our people to build a diverse and inclusive workforce with key
competencies to execute our strategy
We c
ontr
ibut
e to
the
wel
lbei
ng o
f the
com
mun
ities
in w
hich
we
oper
ate
OPERATING ENVIRONMENT
Improving
credit growth
environment
Changing
customer
needsIncreasedregulatoryamp compliance requirements
Environment
amp climate
Macro-
economic amp
demographic
tre
ndsD
igit
al a
nd
tech
nolo
gy
adva
ncem
ents
BOQ VALUE DRIVER INPUTS
ACTIVITIESOUR BUSINESS
OUTPUTSBOQ
BOQrsquoS FIVE STRATEGIC PRIORIT
IES
At the core of how we create long term value for our stakeholders is our purpose led culture and the execution of our strategy This is underpinned by our value drivers and the associated business activities which we undertake with the aim of delivering a set of key outcomes for our stakeholders
Commercial lending deposits financial markets insurance
Lending deposits credit cards insurance for doctors and dentists
DRIVER OUTCOMES
CUSTOMER PEOPLE FINANCE TECHNOLOGY ampDATA CAPABILITIES
ENVIRONMENT amp CLIMATE CHANGECOMMUNITY
bull Accountability of BOQrsquos impact on the environmentbull Attract customers employees and shareholders
whose values and banking choices are aligned to BOQrsquos environmental goals
bull Contribute to Australiarsquos transition to a lower carbon economy
bull Returns to shareholders and capital reinvested for future growth
bull Trusted to deliver sustainable returnsbull Increased market share in niche segments
bull Improve customer experience through flexible and resilient digital infrastructure
bull Data insights driving customer relationships and experience
bull Increase business efficienciesbull Data security governance and privacy
Asset Finance Cashflow and Structured Finance solutions
Pages 61 ndash 69 Financial Performance pages 20 - 54
This report includes details on how we are managing the key risks associated
with our value drivers on pages 55-70 to achieve strong financial returns
Further information on management of the non-financial risks is contained
within the FY21 Sustainability Report and Corporate Governance Statement
View our Sustainability Report boqcomau2021
172021 Annual Report
Financial Performance 20 | Governance and Risk Management 55 | Directorsrsquo Details 71
Developing and executing against our strategy
Our strategy aims to deliver an exceptional customer experience through digital channels and specialised bankers to create long term shareholder valueThe strategy was informed by our key differentiators unique brands with proud history an innovative digital offering and loyalty programme deeply anchored in local communities with a strong customer focus and highly specialised industry expertise
We continue to work toward a distinctive approach for our customers and people a comprehensive digital transformation and a focus on delivering sustainable profitable growth and attractive returns
Our strategy is built on five clear strategic priorities focused on our customers people and shareholders We have set ourselves bold targets and have made good progress towards these in FY21
OUR STRATEGIC PRIORITIES AND VALUE DRIVERS
bull Clear Purpose amp Valuesbull BOQ Retail NPS ranked 3rd at +23 (up 6ppt from FY20 and ranking
remains consistent) (2)
bull VMA NPS 14th at -16 (up 4ppt from -20 in FY20) (3)
bull ME Bank NPS ranked equal 7th at +17 (down from +23 in FY20) (2)
bull BOQ Mortgage NPS ranked equal 4th at +4 (from 5th in FY20) (2)
bull Ongoing support of customers and people impacted by COVID-19bull Executive team in place and deliveringbull Employee engagement score 64 (up from 59 in FY20)bull BOQ was awarded the WGEA Employer of Choice for
Gender Equality citation
EMPATHETIC CULTURE bull Top 3 NPS for personal and
SME customersbull Employee engagement from
56 to top quartile
bull Customer base of 15m customersbull Home lending growth of c$29bn (17x system)bull Business lending and Asset finance growth of c$600m
(08x system) (4)
bull All Owner Managers on new franchise agreementbull Expanded strategic 3rd party distribution partnerships with
quality aggregators
bull Grow customer base to c15m customers
bull Growing above system from FY20 optimising revenue and return
bull Ongoing Risk Weighted Assets (RWA) optimisation
DISTINCTIVE BRANDS
bull Products for sale reduced by from 202 to 127 since FY19bull During August we reached time to conditional yes held of 1 day
for Proprietary and 3 days for our Broker channel even as volume growth occurred (5)
bull Year 2 productivity benefits of $30m delivered in FY21 bringing the total to $60m
bull Lifting our capability to improve delivery
bull Productivity benefits of c$90m annualised run rate from FY23 containing expense growth to lt10 pa in FY21 and FY22
bull Halve the products for salebull Within 1-day time to conditional
approval for home lending
SIMPLE amp INTUITIVE
bull VMA phase 1 launched in March 2021bull Second phase of VMA digital bank incorporating home loans
and term deposits underwaybull BOQ retail digital bank Phase 1 well progressedbull Implemented new Card Management System providing
customers instant card issuance digital wallet capability amp self service convenience
bull FX digital platform and currency exchange
bull Deliver a new Digital Bankbull Transition customers from
old to new cloud based core services platform
DIGITAL BANK
Our strategic priorities Target (1) Progress
Value driver
bull Positive jaws of 2 delivered in FY21bull Deposit to Loan ratio increased to 75bull Ongoing enhancements in risk-based pricing and margin
managementbull Governance risk and compliance tool implemented
bull Positive jaws in FY21 expanding in FY22
bull Strong risk and compliance outcomes
bull Maintain group deposit-to-loan ratio of ge70
bull Capital investment of c$100m pa FY20-FY22
STRONG FINANCIAL amp
RISK POSITION
(1) Targets set prior to the inclusion to ME Bank(2) RFi XPRT Report August 2021(3) DBM Atlas Report August 2021 NPS refers to Any Financial Relationship (AFR) and businesses under $40 million turnover(4) Reflects the APRA definition of lending and will therefore not directly correlate to the balance sheet growth Adjustments made to include BOQ Finance non-Authorised
deposit-taking institution (ADI) balances in overall growth result(5) Time to conditional yes varies during the year based on volumes and customer mix
18 Bank of Queensland Limited and its Controlled Entities
About BOQ 12 | Responding to COVID-19 14 | Acquisition of ME Bank 15 | Value Creation and Strategy 16
Technology amp data capabilities
Alignment of our value drivers and strategic priorities In developing our strategy we have considered our core value drivers to ensure alignment of our strategic initiatives and performance metrics to these desired outcomes The table below provides further detail on each of BOQrsquos value drivers and the key strategic initiatives which have been developed with the aim of delivering the value driver outcomes
BOQ recognises the importance of contributing to the wellbeing of the wider community Led by the owner managers who are experienced bankers anchored in their local community BOQ has established good relationships with the communities in which it operates We aim to ensure ongoing access to financial services and support and improve the financial literacy and wellbeing of the community
Community
bull Enhancing our community partnerships model to support vulnerable Australians
bull Leveraging the owner manager model to build deep relationships through experienced bankers anchored in the local community
bull Building a distinctive purpose led culture with empathy at the heart
Customers and quality relationships sit at the heart of BOQ We create value by providing a range of financial services to meet the needs of our customers We aim to provide exceptional customer experiences and believe in fair outcomes We aim to support individuals and businesses to achieve their financial goals
Customer
bull Building a distinctive purpose-led culture with empathy at the heart to guide fairer decisions for our customers
bull Deepening our niche segment strategy leveraging experienced specialist bankers supported by high quality credit officers
bull Seizing the potential of the OMB model to drive relationships within communities
bull Streamlining our product set operations and processes to create superior customer experiences
Our employees are key to the success of our business We value diversity and inclusion and rely on their capabilities and skills to deliver value for stakeholders Grounded in our organisational culture and values we seek to build a resilient adaptable diverse and empowered workforce with a strong sense of purpose and ethics so that BOQ is viewed as an employer of choice
People
bull Embed our purpose-led empathetic culturebull Creation of exceptional employee experiencesbull Grow talent and capability
BOQrsquos equity and debt investors provide us with an important source of funds which are utilised through our business activities with the aim of creating value for our stakeholders Investors expect generated capital to be reinvested to fund future growth and are seeking sustainable returns on their investment Further details on BOQrsquos financial performance can be found on pages 20 - 54
Finance
bull Maintain group deposit-to-loan ratio of gt70 per centbull Ongoing RWA optimisationbull Streamline and simplify the business to deliver
productivity benefits
Continued investment in technology and data capabilities is essential to delivering an enhanced customer experience providing tailored products and service for customers and simplifying how we do business Stakeholder expectations are changing rapidly and the ability to harness insights to tailor our offering will create significant value for stakeholders while ensuring strong controls of data security governance and privacy are in place
bull Deliver the next phase of the VMA digital bank and the BOQ and ME Bank migration
bull Build an intelligent data platformbull Transition customers from old to new cloud based core
services platform
Climate change is a risk to BOQ and to the Australian economy society and environment Banks play a central role in supporting customers through the transition to a lower carbon economy Taking accountability of BOQrsquos impact on the environment will attract customers employees and shareholders whose values are aligned to BOQrsquos environmental goals Further details on BOQrsquos response to climate change can be found on pages 61 - 69
Environment amp climate change
bull Reduce BOQrsquos carbon footprint with a goal of 100 per cent renewable energy by FY25
bull Support customers to transition to a lower carbon economy
bull Achieving carbon neutral certification from FY21
192021 Annual Report
Financial Performance 20 | Governance and Risk Management 55 | Directorsrsquo Details 71
Transaction costs
Integration costs
1 FINANCIAL HIGHLIGHTS11 RECONCILIATION OF STATUTORY PROFIT TO CASH EARNINGSReported results and pro forma resultsBOQ acquired 100 per cent of ME Bank on 1 July 2021 The 2021 reported result includes ME Bank for the period since ownership Comparatives have not been restated other than in the Pro Forma result included in section 44 Pro Forma Results
In order to preserve transparency where practical the Financial Performance Report will separately present the full year results including ME Bankrsquos contribution to the income statement The reported result and commentary focusses on BOQrsquos year-end performance to enable a direct comparison of the underlying performance of the Bank excluding ME Bank In order to enhance the understanding and comparability of financial information between periods figures and commentary disclosed in the Financial Performance Report exclude ME Bank unless stated otherwise
In the financial tables throughout the Financial Performance Report lsquoLargersquo indicates that the absolute percentage change in the balance was greater than 200 per cent or 200 basis points lsquoLargersquo also indicates the result was a gain or positive in one period and a loss or negative in another
Note on statutory profit and cash earningsStatutory profit is prepared in accordance with the Corporations Act 2001 and the Australian Accounting Standards which comply with International Financial Reporting Standards (IFRS) Cash earnings is a non-accounting standards measure commonly used in the banking industry to assist in presenting a clear view of the Bankrsquos underlying earnings
Figures disclosed in this report are on a cash earnings basis unless stated as being on a statutory profit basis The non-statutory measures have not been subject to an independent audit or review
Cash earnings excludes a number of items that introduce volatility or one off distortions of the current period performance and allows for a more effective comparison of performance across reporting periods The exclusions relate to
bull Transaction costs ndash costs associated with the acquisition of ME Bank
bull Integration costs ndash costs associated with the restructure and integration of ME Bank
bull Employee pay and entitlements review - costs associated with the remediation of employee pay and entitlements
bull Hedge ineffectiveness - this represents earnings volatility from hedges that are not fully effective and create a timing difference in reported profit These hedges remain economically effective
bull Amortisation of acquisition fair value adjustments - this arises from the acquisition of subsidiaries and
bull Intangible asset review ndash a non-recurring adjustment due to a change in the ME Bank minimum threshold for the capitalisation of intangible assets to align with BOQ
Reconciliation of statutory net profit to cash earnings after tax ($m)
Hedge ineffectiveness
Employee pay and
entitlements review
ME Bank
Amortisation of acquisition
fair value adjustments
Intangible asset review
352
17
Statutory net profit after tax Incl ME Bank
369389
23
Cash earnings after tax
Incl ME Bank
412
19
9
36
33
7
21
2
20 Bank of Queensland Limited and its Controlled Entities
For the year ended 31 August 2021FINANCIAL PERFORMANCE
About BOQ 12 | Responding to COVID-19 14 | Acquisition of ME Bank 15 | Value Creation and Strategy 16
11 RECONCILIATION OF STATUTORY PROFIT TO CASH EARNINGS (CONTINUED)
(a) Reconciliation of Cash Earnings to Statutory Net Profit after tax
BOQ Year End Performance BOQ Half Year PerformanceYear End Incl ME
($ million) Aug-21 Aug-20Aug-21
vs Aug-20 Aug-21 Feb-21Aug-21
vs Feb-21 Aug-21
Cash earnings after tax 389 225 73 224 165 36 412
Amortisation of acquisition fair value adjustments (2) (4) (50) (1) (1) - (3)
Hedge ineffectiveness (3) (10) (70) (2) (1) 100 (3)
Transaction costs (19) - 100 (16) (3) Large (19)
Integration costs (7) - 100 (7) - 100 (9)
Intangible asset review and restructure - (80) (100) - - - (3)
Regulatory compliance - (5) (100) - - - -
Employee pay and entitlements review (6) (8) (25) - (6) (100) (6)
Other legacy items - (3) (100) - - - -
Statutory net profit after tax 352 115 Large 198 154 29 369
(b) Non-Cash Earnings Reconciling items
($ million)
Cash earnings
Aug-21
Amortisation of acquisition
fair value adjustments
Hedge ineffectiveness
Transaction costs
Integration costs
Employee pay and
entitlements review
Intangible asset
review
Statutory net profit
Aug-21
Net interest Income 1050 - - - - - - 1050
Non-Interest Income 125 - (5) - - - - 120
Total income 1175 - (5) - - - - 1170
Operating expenses (633) (3) - (20) (12) (10) - (678)
Underlying profit 542 (3) (5) (20) (12) (10) - 492
Loan impairment expense 20 - - - - - 20
Profit before tax 562 (3) (5) (20) (12) (10) - 512
Income tax expense (173) 1 2 1 5 4 - (160)
BOQ Profit after tax 389 (2) (3) (19) (7) (6) - 352
ME Bank Profit after tax 23 (1) - - (2) - (3) 17
Profit after tax 412 (3) (3) (19) (9) (6) (3) 369
212021 Annual Report
For the year ended 31 August 2021FINANCIAL PERFORMANCE
Financial Performance 20 | Governance and Risk Management 55 | Directorsrsquo Details 71
12 FINANCIAL SUMMARY
(1) Based on the Australian Prudential Regulation Authority guidance issued on 7 April 2020 BOQ determined to defer the decision on payment of an interim dividend Refer to BOQ Australian Securities Exchange (ASX) Release ldquoBOQ FY20 Interim Dividend Deferralrdquo 8 April 2020
(2) The basic and diluted earnings per share for 1H21 2H20 and 1H20 have been adjusted per ASX announcement on 20 April 2021(3) NIM including the two month impact of ME Bank is 190 per cent in 2H21 and 192 per cent in FY21(4) VMA operating costs have been restated from non-interest income and included in operating expenses per ASX announcement on 30 September 2021
Down 160bps (Excl ME)
Up 540bps
78 75
2H19 1H202H19 1H20
525 550 549 545
34
78
10
2H20 1H21 2H212H20 1H21 2H21
Cash cost to income (CTI) () (4) Cash return on average equity (ROE) ()
88533
Statutory net profit after tax ($m)Cash earnings after tax ($m)
Up 203 (Excl Me)Up 800 (Excl ME)
Up 29
2H19 1H202H19 1H20
14293
22
154198
17
2H20 1H21 2H21
153 15174
165224
23
2H20 1H21 2H21
Up 2bps
31
1722
6
6
2H19 1H20
904 991
2H19 1H20
DEFERRED
2H20 1H21 2H21
978 1003 980
2H20 1H21 2H21
Dividends per ordinary share (cents) (1)Common equity tier 1 (CET1) ()
ME Bank
Up 146
Up 3bps (Excl ME)
192 189366 343
2H19 1H20 2H19 1H20
192 195 195
158
355
2H20 1H21 2H21 2H20 1H21 2H21
Cash net interest margin (NIM) () (3)Cash basic earnings per share (EPS) (cents) (2)
388
22 Bank of Queensland Limited and its Controlled Entities
For the year ended 31 August 2021FINANCIAL PERFORMANCE
About BOQ 12 | Responding to COVID-19 14 | Acquisition of ME Bank 15 | Value Creation and Strategy 16
12 FINANCIAL SUMMARY (CONTINUED)
CASH EARNINGS AFTER TAX (1)
$389mIncrease of 73 per cent on FY20 driven by income growth and lower impairment provisions
CASH NET INTEREST MARGIN (1)
195Increase of four basis points on FY20 Flat NIM since 1H21 with funding cost benefits offsetting competition price pressures
CASH OPERATING EXPENSES (1)
$633mIncrease of three per cent on FY20 driven by investments in strategic technology projects and supporting business growth
LOAN IMPAIRMENT EXPENSE (1)
($20m)Includes a $69 million reduction in the collective provision
CET1
980Increase of two basis points on FY20 driven by cash earnings offset by high risk weighted asset (RWA) growth dividends and investment
CASH ROE
82Increase of 280 basis points on FY20 driven by higher earnings
BOQrsquos cash earnings after tax for FY21 was $389 million 73 per cent higher than the FY20 result Statutory net profit after tax was $352 million a 206 per cent increase on FY20 The increase in earnings was the result of a credit to loan impairment expense and increased net interest income partly offset by higher operating expenses
The Bank acquired 100 per cent of ME Bank on 1 July 2021 ME Bankrsquos cash earnings after tax for the two months since acquisition was $23 million Statutory net profit after tax was $17 million
Net interest incomeNet interest income of $1050 million increased by $64 million or six per cent on FY20 This was driven by four per cent growth in average interest earning assets and a four basis point increase in net interest margin to 195 per cent
Gross loans and advances growth of eight per cent was primarily driven by home lending which achieved growth of nine per cent This reflected continued strong new business volumes The commercial lending portfolio grew four per cent with growth across all business areas
NIM increased four basis points on FY20 This was primarily driven by lower funding costs due to the benefit of deposit repricing and improved mix together with lower hedging costs These were partially offset by competition in the market and the ongoing impact of a low interest rate environment on the returns on capital and the low cost deposit portfolio
Non-interest incomeNon-interest income of $125 million decreased by $3 million or two per cent on FY20 This was driven by lower insurance income with the material closure of St Andrewrsquos to new business in FY20 lower trading income and lower VMA card and insurance income that continued to be adversely impacted by the effect of COVID-19 on the travel industry
These were partly offset by income from a new card services arrangement with a third party supplier the reinstatement of some fees paused during COVID-19 and higher financial markets customer transactions
Operating expensesTotal operating expenses of $633 million increased by $21 million or three per cent on FY20 This increase was primarily driven by an investment in employees to deliver strategic priorities including the build out of the new Digital Bank and other technology projects and to support volume growth
The focus on growth and cost discipline has resulted in positive Jaws of two per cent and a reduction in the cost to income (CTI) ratio of 100 basis points on FY20
Loan impairment expenseLoan impairment expense was a credit of $20 million and compares to an expense of $175 million in FY20 This credit was driven by a reduction in the collective provision in FY21 of $69 million primarily due to an improved economic outlook and improvements in data quality relating to collateral In FY20 a collective provision overlay of $133 million was recorded for the potential impacts of COVID-19
Specific provision expense of $49 million increased by $2 million or four per cent on FY20 This was driven by one large facility in Retail and the impact of lockdowns on some niche medical practices in Asset finance partly offset by a write back of one large Agribusiness exposure that returned to performing
Capital managementCapital management BOQ CET1 ratio of 980 per cent is 23 basis points lower than 1H21 This was driven by strong growth in risk weighted assets and continued capital investment in the digital transformation The acquisition of ME Bank was fully capital funded with no impact on CET1
Shareholder returnsBOQ has determined to pay an ordinary dividend of 22 cents per share for 2H21 That takes the FY21 dividend to 39 cents per share which is 61 per cent of FY21 cash earnings The Board has committed to a target dividend payout ratio of 60-75 per cent of full year cash earnings
(1) Metrics relate to BOQ only and do not include ME Bank
232021 Annual Report
For the year ended 31 August 2021FINANCIAL PERFORMANCE
Financial Performance 20 | Governance and Risk Management 55 | Directorsrsquo Details 71
12 FINANCIAL SUMMARY (CONTINUED)
Acquisition of ME Bank
Acquisition overview and AccountingBOQ acquired 100 per cent of the share capital of ME Bank on 1 July 2021 ME Bank operates in the retail segment of the domestic market offering primarily home loan products and everyday transaction and online savings accounts The acquisition provides BOQ with significantly enhanced scale and portfolio mix broadly doubling the Retail bank GLAs and providing geographical and customer segment diversification BOQ and ME Bank have strong complementary challenger brands with a shared customer centric culture It also provides an opportunity to accelerate BOQrsquos digital strategy providing a clear pathway to a cloud based common digital Retail bank core banking platform
The fair values of the ME assets and liabilities acquired have been determined on a provisional basis with resulting goodwill of $35 million as outlined below
($ million) Aug-21
ME Bank book value of assets acquired 1646
Fair value adjustments
Loans and advances 16
Deposits and other borrowings (5)
Intangibles
Brand 26
Customer relationships 31
Total Intangibles 57
Deferred tax liabilities (46)
Total fair value adjustments of net assets acquired 22
Net identifiable assets and liabilities 1668
Other equity instruments (1) (315)
Provisional goodwill arising on acquisition 35
Total purchase consideration transferred 1388
(1) Other equity instruments of $315 million include Additional Tier 1 (AT1) securities assumed on the acquisition of ME Bank
The intangibles are expected to amortise over a period of between 6 and 10 years Similar to previous acquisitions this amortisation will be treated as a statutory adjustment and not included in cash earnings Further details of the acquisition are disclosed in Note 55 (ii) Business combinations during the year
Integration progressThe integration of ME Bank is well progressed In order to reduce risk a phased approach to integration was developed Following the pre-completion phase and successful completion of the transaction on 1 July 2021 a 90 day sprint was undertaken to ensure a strong start to the integration program and to build momentum During this period a number of key integration milestones have been achieved
bull Ensuring continuity of operations for our customers
bull Validation of integration hypotheses and development of detailed work stream integration plans finalised
bull BOQ Group operating model refreshed and communicated
bull Consolidated leadership team in place with clear accountabilities
bull Strategic sourcing consolidation commenced
bull Refinement of the BOQ Group Technology roadmap and
bull Clear pathway to ME Bank ADI license handback determined expected to occur in early calendar 2022
The scale phase of the integration program will include
bull Consolidation of ME Bank and BOQ on to a single ADI which is critical to delivery of a number of synergies
bull Execution of the technology roadmap alongside the broader transformation program and
bull Consolidation of shared service functions supply chain and property activities
24 Bank of Queensland Limited and its Controlled Entities
For the year ended 31 August 2021FINANCIAL PERFORMANCE
About BOQ 12 | Responding to COVID-19 14 | Acquisition of ME Bank 15 | Value Creation and Strategy 16
12 FINANCIAL SUMMARY (CONTINUED)
Acquisition of ME Bank (continued)
Integration expenses and synergiesIntegration expenditure is expected to range between $130 million and $140 million (pre-tax) with the majority to be incurred in the first two years Due to the size and non-recurring nature of these costs they will be treated as a statutory adjustment and not included in cash earnings
The amount of integration expenditure for the two months to 31 August 2021 including ME Bank was $13 million (pre-tax) Further integration costs of between $70 million and $80 million (pre-tax) are expected to be incurred in FY22
The acquisition is expected to realise significant pre-tax cost synergies with further potential upside from revenue benefits funding savings and investment net capitalised investment (CAPEX) synergies
The cost synergies are primarily expected to be derived from having complementary businesses alignment of operating models and technology roadmaps and consolidation of supply chains and shared services functions Approximately 60 per cent of the synergies are expected to be delivered through operating model changes with the balance from reduced project expenditure supply chain and other synergies
The fast start to the integration program has accelerated the delivery of these synergies with accelerated cost synergies of $30 to $34 million expected to be delivered in FY22 The remainder of the $70 to $80 million of cost synergies is expected to be delivered in FY23 with potential upside for additional synergies in FY24 following completion of the technology integration initiatives
Other benefits expected to be derived in FY22 from the acquisition include
bull CAPEX expenditure benefits of circa $15 million from the consolidated investment roadmap
bull further NIM benefits from wholesale and retail deposits and
bull non-interest income benefits
252021 Annual Report
For the year ended 31 August 2021FINANCIAL PERFORMANCE
Financial Performance 20 | Governance and Risk Management 55 | Directorsrsquo Details 71
2 GROUP PERFORMANCE ANALYSIS21 INCOME STATEMENT AND KEY METRICS
Year End Performance Half Year PerformanceYear End Incl ME
($ million) Aug-21 Aug-20Aug-21
vs Aug-20 Aug-21 Feb-21Aug-21 vs
Feb-21 Aug-21
Net interest income 1050 986 6 538 512 5 1128
Non-interest income (1)(2) 125 128 (2) 59 66 (11) 130
Total income (2) 1175 1114 5 597 578 3 1258
Operating expenses (1)(2) (633) (612) 3 (318) (315) 1 (684)
Underlying profit (2) 542 502 8 279 263 6 574
Loan impairment expense 20 (175) Large 44 (24) Large 21
Profit before tax (2) 562 327 72 323 239 35 595
Income tax expense (2) (173) (102) 70 (99) (74) 34 (183)
Cash earnings after tax 389 225 73 224 165 36 412
Statutory net profit after tax (2) 352 115 Large 198 154 29 369
Year End Performance Half Year Performance
Key Metrics Aug-21 Aug-20Aug-21
vs Aug-20 Aug-21 Feb-21Aug-21
vs Feb-21
SHAREHOLDER RETURNS (3)
Share price ($) 946 613 54 946 879 8
Market capitalisation (4) ($ million) 6063 2785 118 6063 4004 51
Dividends per ordinary share (fully franked) (5) (cents) 39 12 Large 22 17 29
CASH EARNINGS BASIS (3)
Basic earnings per share (EPS) (5)(6) (cents) 747 496 51 388 355 9
Diluted EPS (5)(6) (cents) 695 451 54 362 328 10
Dividend payout ratio () 606 242 Large 571 659 Large
STATUTORY BASIS (3)
Basic EPS (6) (cents) 670 254 164 340 329 3
Diluted EPS (6) (cents) 626 244 157 318 305 4
Dividend payout ratio () 677 474 Large 656 706 Large
(1) VMA operating costs have been restated from non-interest income and included in operating expenses per ASX announcement on 30 September 2021(2) Refer to Section 11 Reconciliation of statutory net profit to cash earnings after tax for a reconciliation of cash earnings to statutory net profit after tax(3) All metrics relate to BOQ including ME Bank(4) Includes $135 billion capital raise announced 22 February 2021 for ME Bank acquisition(5) The basic and diluted earnings per share for all prior periods have been adjusted per ASX announcement on 20 April 2021(6) The sum of 1H21 and 2H21 EPS does not equal FY21 due to the impact of the capital raising and the uneven distribution of cash earnings after tax across the two halves
of the year
26 Bank of Queensland Limited and its Controlled Entities
For the year ended 31 August 2021FINANCIAL PERFORMANCE
About BOQ 12 | Responding to COVID-19 14 | Acquisition of ME Bank 15 | Value Creation and Strategy 16
21 INCOME STATEMENT AND KEY METRICS (CONTINUED)
Year End Performance Half Year PerformanceYear End Incl ME
Key Metrics Aug-21 Aug-20Aug-21
vs Aug-20 Aug-21 Feb-21Aug-21
vs Feb-21 Aug-21
PROFITABILITY AND EFFICIENCY MEASURES
CASH EARNINGS BASIS
Net profit after tax ($ million) 389 225 73 224 165 36 412
Underlying profit (1) ($ million) 542 502 8 279 263 6 574
NIM(2) () 195 191 4bps 195 195 - 192
Cost to income ratio (CTI) (3) () 539 549 (100bps) 533 545 (120bps) 544
Loan Impairment expense to GLA (bps) (4) 37 (41bps) (17) 10 (27bps) (3)
Return on average equity (ROE) (4) () 82 54 Large 88 78 100bps 82
Return on average tangible equity (ROTE) (4)(5) () 102 69 Large 109 99 100bps 102
STATUTORY BASIS
Net profit after tax ($ million) 352 115 Large 198 154 29 369
Underlying profit (1) ($ million) 492 348 41 245 247 (1) 517
NIM(2) () 195 191 4bps 195 195 - 192
CTI () 579 684 Large 587 572 150bps 587
Loan impairment expense to GLA (bps) (4) 37 (41bps) (17) 10 (27bps) (3)
ROE (4) () 74 28 Large 78 72 60bps 74
ROTE (4)(5) () 92 36 Large 96 92 40bps 92
ASSET QUALITY
30 days past due (dpd) arrears (6) ($ million) 516 567 (9) 516 575 (10) 941
90dpd arrears (6) ($ million) 321 433 (26) 321 381 (16) 593
Impaired assets ($ million) 209 195 7 209 194 8 243
Specific provisions to impaired assets () 51 48 Large 51 53 (200bps) 44
Total provision and general reserve for credit losses (GRCL) coverage GLA (6) (bps) 76 98 (22bps) 76 95 (19bps) 63
CAPITAL (7)
CET1 ratio () 980 978 2bps 980 1003 (23bps) 980
Total capital adequacy ratio () 1260 1273 (13bps) 1260 1383 (123bps) 1260
Risk weighted assets ($ million) 44229 31576 40 44229 32126 38 44229
(1) Profit before loan impairment expense and tax(2) NIM is calculated net of offset accounts(3) VMA operating costs have been restated from non-interest income and included in operating expenses per ASX announcement on 30 September 2021(4) Metrics relate to BOQ Including ME Bank(5) Based on after tax earnings applied to average shareholdersrsquo equity (excluding shares and treasury shares) less goodwill and identifiable intangible assets (customer related
intangiblesbrands and computer software)(6) Excludes the impact of fair value adjustments on the acquisition of ME Bank Arrears have been presented on an unadjusted basis(7) All capital measures are as at 31 August 2021 and include ME Bank impacts
272021 Annual Report
For the year ended 31 August 2021FINANCIAL PERFORMANCE
Financial Performance 20 | Governance and Risk Management 55 | Directorsrsquo Details 71
22 NET INTEREST INCOME
Year End Performance Half Year PerformanceYear End Incl ME
$ million Aug-21 Aug-20Aug-21
vs Aug-20 Aug-21 Feb-21Aug-21
vs Feb-21 Aug-21
Net Interest Income 1050 986 6 538 512 5 1128
Average interest earning assets 53810 51763 4 54667 52952 3 58656
NIM 195 191 4bps 195 195 - 192
Net interest income increased by $64 million or six per cent on FY20 driven by four per cent growth in average interest earnings assets and a four basis points increase in NIM
2H21 net interest income also increased $26 million or five per cent on 1H21 driven by three per cent growth in average interest earnings assets and three extra days which added $9 million NIM was flat in 2H21 as the benefits from deposit repricing and lower wholesale funding costs were offset by the ongoing impact of competition for new housing on front book rates retention discounting and a switch from variable to fixed rate lending The low interest rate environment continued to adversely impact returns on capital and the low cost deposit portfolio
ME Bank net interest income in the two months since acquisition of $78 million was earned on $285 billion of average interest earning assets This includes an effective interest adjustment of $5 million following a fair value adjustment to the loan portfolio on acquisition This results in a Group NIM for FY21 including ME of 192 per cent (2H21 of 190 per cent)
Net interest margin - February 2021 to August 2021
NIM in 2H21 was in line with the prior half at 195 per cent The key drivers of the movement are set out below
Asset pricing and mix Reduced margin by 10 basis points on 1H21 This was driven by continued competition for new housing and commercial lending through lower front book rates retention discounting and customers switching from variable to lower margin fixed rate loans
Funding costs and mix Improved margin by 13 basis points This was primarily driven by active repricing of at-call retail and Treasury term deposits and money market portfolios as well as an improvement in portfolio mix as at-call growth continued while more expensive term deposit funding was run-off Margin also benefitted from a reduction in wholesale funding costs including a one basis point benefit from utilisation of the Term Funding Facility (TFF)
Hedging costs No change as cash-bills spreads were steady at an average of one basis point
Capital and low cost deposits Reduced margin by two basis points as the low market rate environment continued to impact on returns from the $46 billion replicating portfolio (covering BOQrsquos capital and invested low cost deposits) uninvested capital and low cost deposits
Liquidity and other Reduced margin by one basis point due to lower wholesale asset spreads higher amortisation of acquisition costs and owner manager commissions due to higher asset growth and the conversion of branches from corporate to owner-manager Liquidity levels had minimal impact on NIM during the half
2H21 Excl ME Bank
036 (1)
195
231
ME Bank 2H21 Incl ME Bank
032 (1)
190
222
1H21
035 (1)
195
230
Asset pricing and mix
(010)
Funding costs and mix
013
Hedging costs
000 (001) (005)
Capital and low cost deposits
(002)
Liquidity and other
(1) Third party costs largely represent commissions to owner-managers and brokers
ME Bank NIM Third party costs (1)
28 Bank of Queensland Limited and its Controlled Entities
For the year ended 31 August 2021FINANCIAL PERFORMANCE
About BOQ 12 | Responding to COVID-19 14 | Acquisition of ME Bank 15 | Value Creation and Strategy 16
23 NON-INTEREST INCOME
Year End Performance Half Year PerformanceYear End Incl ME
$ million Aug-21 Aug-20Aug-21 vs
Aug-20 Aug-21 Feb-21Aug-21 vs
Feb-21 Aug-21
Banking Income 69 69 - 34 35 (3) 72
Insurance Income 7 11 (36) 3 4 (25) 7
Other Income (1)(2) 48 43 12 23 25 (8) 50
Trading income 1 5 (80) (1) 2 (150) 1
Total non-interest income (1)(2) 125 128 (2) 59 66 (11) 130
(1) VMA operating costs have been restated from non-interest income and included in operating expenses per ASX announcement on 30 September 2021(2) Refer to Section 11 (B) Non-cash earnings reconciling items for a reconciliation of cash non-interest income to statutory non-interest income
Non-interest income of $125 million decreased by $3 million or two per cent on FY20 driven by lower insurance and trading income
Banking income was in line with FY20 and decreased $1 million or three per cent on 1H21 This reflects the ongoing shift in consumer preference to low or no fee products and a reduction in dishonour and overdrawn account fees This was partly offset by increased merchant terminal income from small business customers Financial Markets customer transactions and the reinstatement of some fees that were paused during COVID-19 in FY20
Other income increased $5 million or 12 per cent on FY20 The increase was mainly due to income from a new card services arrangement with a third party supplier including a one-off benefit in 1H21 of $3 million This was partly offset by lower VMA card and insurance income that continued to be adversely impacted by the effect of COVID-19 on the travel industry
Trading income of $1 million decreased by $4 million or 80 per cent on FY20 as a lack of volatility and lower interest rate environment reduced trading income opportunities together with reduced market exposures and widening in credit spreads in 2H21
Insurance income is discussed in detail in Section 24 below
ME Bank non-interest income in the two months since acquisition of $5 million primarily comprised banking fee income in relation to lending and in the cards portfolio
24 INSURANCE OVERVIEWYear End Performance Half Year Performance
$ million Aug-21 Aug-20Aug-21 vs
Aug-20 Aug-21 Feb-21Aug-21 vs
Feb-21
Gross written premium (net of refunds) 46 49 (6) 23 23 -
Net earned premium 42 50 (16) 21 21 -
Underwriting result 6 9 (33) 2 4 (50)
Other insurance income - 1 (100) - - -
Total income 6 10 (40) 2 4 (50)
Consolidation adjustment 1 1 - 1 - -
Group insurance result 7 11 (36) 3 4 (25)
St Andrewrsquos contributed $7 million to non-interest income in FY21 a decrease of $4 million or 36 per cent on FY20 This reflects the decision to materially close to new business in FY20
Gross written premium (net of refunds) declined $3 million on FY20 The underwriting result was also $3 million lower compared to the prior year with reduced net earned premium partly offset by reduced commission and acquisition costs Other insurance income was impacted by reduced yields on term deposits and no account management service fees which ceased in 1H20 With the exception of term deposit yields which are market driven these trends are consistent with the decision to close to new business
The sale of St Andrewrsquos is subject to regulatory approval and is expected to complete in 1H22
292021 Annual Report
For the year ended 31 August 2021FINANCIAL PERFORMANCE
Financial Performance 20 | Governance and Risk Management 55 | Directorsrsquo Details 71
25 OPERATING EXPENSES
Year End Performance Half Year PerformanceYear End Incl ME
$ million Aug-21 Aug-20Aug-21 vs
Aug-20 Aug-21 Feb-21Aug-21 vs
Feb-21 Aug-21
Salaries and on costs (1) 305 274 11 152 153 (1) 329
Employee share programs and other 14 14 - 7 7 - 14
EMPLOYEE EXPENSES (1) 319 288 11 159 160 (1) 343
Data processing (1) 117 118 (1) 58 59 (2) 120
Amortisation - intangible assets 39 39 - 22 17 29 43
Depreciation - fixed assets 1 1 - 1 - 100 1
TECHNOLOGY EXPENSES (1) 157 158 (1) 81 76 7 164
Marketing (1) 32 28 14 20 12 67 34
Commission to owner-managed branches (OMB) 4 5 (20) 2 2 - 4
Communications print and stationery 19 20 (5) 9 10 (10) 23
Processing costs 14 13 8 7 7 - 14
Other (1) 18 29 (38) 7 11 (36) 25
OPERATIONAL EXPENSES (1) 87 95 (8) 45 42 7 100
Depreciation - right-of-use assets amp lease expenses 28 27 4 14 14 - 30
Depreciation - fixed assets 9 10 (10) 4 5 (20) 9
Other 3 2 50 2 1 100 3
OCCUPANCY EXPENSES 40 39 3 20 20 - 42
Professional fees 17 21 (19) 7 10 (30) 21
Directors fees 2 2 - 1 1 - 2
Other 11 9 22 5 6 (17) 12
ADMINISTRATION EXPENSES 30 32 (6) 13 17 (24) 35
Total operating expenses (1)(2) 633 612 3 318 315 1 684
CTI (1) 539 549 (100bps) 533 545 (120bps) 544
Number of employees (FTE) (1) 2218 2052 8 2218 2176 2 3319
(1) VMA operating costs have been restated from non-interest income and included in operating expenses per ASX announcement on 30 September 2021 FTE has also been restated
(2) Refer to Section 11 (B) Non-cash earnings reconciling items for a reconciliation of cash operating expenses to statutory operating expenses
SummaryTotal operating expenses of $633 million increased by $21 million or three per cent on FY20 This increase was primarily driven by an investment in employees to deliver strategic priorities including the build out of the new Digital Bank and to support volume growth particularly in the areas of operations product and marketing
Employee expensesEmployee expenses of $319 million increased by $31 million or 11 per cent on FY20 This was driven by an increase of eight per cent in full time equivalent staff
The staff increases were primarily due to continued investment in strategic technology projects including the build out of the new Digital Bank additional resources to support volume growth to provide support to customers impacted by COVID-19 and for risk and compliance activities including financial crime It also reflects higher annual leave expense impacted by continued lockdowns These were partly offset by the full year benefits from restructures in the prior year
Technology expensesTechnology expenses of $157 million decreased by $1 million or one per cent on FY20 The decrease was mainly driven by costs incurred in the prior year on risk and regulatory projects one-off costs for the transition of data centres and productivity initiatives including supply chain management These were partly offset by additional costs associated with the new Digital Bank and higher storage and support costs driven by business volumes
Amortisation expense of $39 million was in line with FY20 Projects that became fully amortised were replaced by newly amortising assets with the newly amortising assets including Phase 1 of the new Digital Bank being more weighted to 2H21
30 Bank of Queensland Limited and its Controlled Entities
For the year ended 31 August 2021FINANCIAL PERFORMANCE
About BOQ 12 | Responding to COVID-19 14 | Acquisition of ME Bank 15 | Value Creation and Strategy 16
25 OPERATING EXPENSES (CONTINUED)Operational expensesOperational expenses of $87 million decreased by $8 million or eight per cent on FY20 The primary drivers were lower discretionary expenditure including travel and entertainment lower non-lending losses and lower consumable costs associated with COVID-19 These were partly offset by higher marketing spend on the launch of the new Digital Bank and to drive increased lending volumes
Administration expensesAdministration expenses of $30 million decreased by $2 million or six per cent on FY20 driven by lower external legal costs partly offset by an increase in group insurance costs
ME Bank expensesME Bank operating expenses in the two months since acquisition of $51 million are primarily driven by employee expenses in relation to MErsquos 1101 FTE
26 CAPITALISED INVESTMENT EXPENDITUREBOQrsquos comprehensive digital transformation continues with Phase 1 of building a next generation core platform through VMA delivered and providing an enhanced experience for customers using our transaction accounts savings accounts and credit cards Leveraging this foundational work to ensure a similar experience is delivered to new BOQ Retail deposit customers is well progressed Investment continues in the digital capability of VMA and BOQ Retail Transformation with an expanded offering to Term Deposit and Lending customers currently in development
In addition to these customer focused initiatives we have completed key foundational components of Open Banking and are well progressed in our planning and development of key workplace tools that will assist in delivering a productive and engaged workforce ME Bank will continue with its development of innovative consumer deposit and lending solutions whilst we look to leverage synergies and capability across our complete digital transformation program
Subject to the intangible asset review in 1H22 the carrying value of intangible assets is expected to increase further in FY22 with continued investment in the digital capability of VMA digital transformation of Retail banking (ME Bank and BOQ) Open Banking and BOQrsquos Enterprise Data Management Platform These foundational investments align to BOQrsquos digital transformation strategy and will provide our customers with better access to our products and services through easy to use digital experiences that are focused on their needs
Carrying value of IT intangible assets ($m)
Feb 20
94
129
223
Aug 20
95
121
216
Feb 21
105
131
236
Aug 21
193
97
110
400
ME Bank Intangibles
Assets under construction
Software intangible assets
312021 Annual Report
For the year ended 31 August 2021FINANCIAL PERFORMANCE
Financial Performance 20 | Governance and Risk Management 55 | Directorsrsquo Details 71
27 LENDINGGross loans and advances of $506 billion grew by $36 billion or eight per cent on FY20 This was primarily achieved through above system growth in home lending with BOQ Blue BOQ Specialist and VMA all contributing strong lending volumes Commercial lending growth recovered in 2H21 at seven per cent with all business units reflecting growth
As at Incl ME
$ million Aug-21 Feb-21 Aug-20 Aug-21
vs Feb-21 (1) Aug-21
vs Aug-20 Aug-21
Housing lending 32433 30187 28891 15 12 53146
Housing Lending - APS 120 qualifying securitisation (2) 1668 1965 2264 (30) (26) 5907
34101 32152 31155 12 9 59053
Commercial lending (3) 9879 9531 9479 7 4 9879
Asset finance 6457 6278 6259 6 3 6457
Consumer (3) 152 147 150 7 1 359
Gross loans and advances (4) 50589 48108 47043 10 8 75748
Provisions for impairment (313) (374) (369) (33) (15) (311)
Net loans and advances 50276 47734 46674 11 8 75437
(1) Growth rates have been annualised(2) Securitised loans subject to capital relief under APRA Prudential Standard APS 120 Securitisation (APS 120)(3) BOQ Specialist consumer products have been reclassified to commercial lending to align product definitions All periods reflect this restatement and are presented on a
like-for-like basis(4) Gross loans and advances aligns to the Financial Statement Note 33 Loans and Advances Gross loans and advances after deducting Unearned finance lease income
32 Bank of Queensland Limited and its Controlled Entities
For the year ended 31 August 2021FINANCIAL PERFORMANCE
About BOQ 12 | Responding to COVID-19 14 | Acquisition of ME Bank 15 | Value Creation and Strategy 16
27 LENDING (CONTINUED)
Growth in housing lending ($m)
Housing (Excl ME Bank)The housing portfolio grew by $29 billion or nine per cent on FY20 representing 17x system growth Positive growth was achieved across all three channels for the first time since FY15 as momentum steadily accelerated over the financial year
Settlement volumes increased 55 per cent on FY20 a function of strong application flow in a buoyant property market and improved conversion rates 1H21 growth was largely driven by owner occupied loans weighted towards fixed rate lending 2H21 growth was characterised by growth across investor and owner occupied loans resulting in an improved margin outcome The turnaround in performance was driven by embedding the Retail Banking strategy which included mortgage process simplification improved retail banking and lending capability an uplift in customer experience and quality third party broker relationships The mortgage net promoter score (NPS) has also improved from -2 in August 2020 to +4 in August 2021
The BOQ Blue portfolio grew by $14 billion a turnaround of $21 billion from the previous year and the first positive full year result since FY15 This strong result was underpinned by a back-to-growth performance delivered out of the branch network and a doubling of Broker originated settlements
The Broker channel grew by $11 billion or 36 per cent on FY20 This result was achieved by a focus on building and growing quality new and existing third party partnerships competitive pricing and consistent credit decisions Broker and customer experience have improved due to the release of new broker enabled technologies and the delivery of consistent process efficiencies reflected in an improved NPS result Focus remains on continually improving mortgage processes
The BOQ branch portfolio also reflected a turnaround in its performance of $11 billion as it delivered positive growth of $04 billion the first full year of growth since FY14 The corporate and owner-manager network both contributed to the improved performance with a combined uplift in settlement volumes of 55 per cent
The VMA mortgage portfolio continued to deliver strong growth in FY21 The portfolio grew by $10 billion or 32 per cent on FY20 taking the portfolio to over $43 billion The VMA brand is a globally recognised brand which tends to attract a more tech-savvy customer base and contributes to the Bankrsquos geographical diversification by targeting metropolitan-based customers across Australia
BOQ Specialist home lending portfolio grew by $05 billion or nine per cent on FY20 Settlement volumes increased in the second half and the focus returned to new business as clientsrsquo exited COVID-19 relief and returned to normal payment cycles BOQ Specialist continues to deliver above system growth by building relationships with health professionals in the early stages of their careers and providing a superior service and modern digital banking solutions creating future opportunities for BOQ Specialist to meet the commercial lending needs of these medical dental veterinary and accounting professionals
Housing (Incl ME Bank) The consolidated housing portfolio grew by $24 billion or four per cent on FY20 ME Bank housing portfolio contracted $05 billion in the two months since acquisition largely due to softer application flow in the preceding quarter which has since improved and an increase in runoff
Integration activities and mortgage process simplification work is well underway with the objective of returning the ME housing portfolio to growth in a sustainable way
FY21
95 GROWTH17X SYSTEM (1)
1040
476
1430
(484)
2946 (Excl ME)
FY20
17 GROWTH09X SYSTEM (1)
714
508
(714)
508
(1) Source represents latest available APRA Monthly Banking Statistics as at August 2021 Reflects the APRA definition of lending and therefore will not directly correlate to the balance sheet growth
(2) BOQ Blue includes housing in both the Retail Bank and BOQ Business primarily from the branch network and broker channels
ME Bank
VMA Home Loans
BOQ Specialist
BOQ Blue (2)
332021 Annual Report
For the year ended 31 August 2021FINANCIAL PERFORMANCE
Financial Performance 20 | Governance and Risk Management 55 | Directorsrsquo Details 71
The commercial lending portfolio grew by $04 billion in FY21 representing growth of four per cent on FY20 or 08x system growth BOQ Commercial lending includes both corporate and small business lending while BOQ Specialist has commercial lending and Asset finance products and BOQ Finance has asset finance products
BOQ commercial lending grew by $02 billion or four per cent and was mainly driven by growth in the corporate lending portfolio across construction agribusiness and property segments The small business lending portfolio contributed over $50 million of growth driven by more simplified credit assessments automation in the application process and was supported by several small business strategic initiatives This result reverses over five years of contraction in this portfolio and was underpinned by the deeper relationships established through the COVID-19 support offered to clients The small business strategy continues to focus on improving branch capability risk policy product features and business lending process transformation to further grow our portfolio in this segment
The BOQ Specialist commercial lending portfolio grew by $02 billion or seven per cent due to a strong second half The growth was mainly achieved in corporate healthcare and small business lending as the brand offers bespoke solutions to medical dental and veterinary professionals Corporate Healthcare lending also grew as customer relationships are built from graduation through to retirement increasing the diversity of both the home lending and business lending portfolios
The Asset finance portfolio grew by $02 billion or three per cent on FY20 compared to negative system growth The growth was driven by continued momentum in the Equipment Finance portfolio which grew by $02 billion The main growth industries in FY21 were transport agriculture and healthcare This growth was partly offset by a contraction in BOQ Specialist asset financing in particular in the dentistry industry where fewer new practices were established
27 LENDING (CONTINUED)Growth in commercial lending ($m)
Growth in Asset finance lending ($m)
FY20
237
106
343
38 GROWTHPOSITIVE SYSTEM (1)(3)
FY21
249
151
400
42 GROWTH08X SYSTEM (1)
FY20
02 GROWTHPOSITIVE SYSTEM (2)(3)
FY21
198
32 GROWTHPOSITIVE SYSTEM (2)
(1) Commercial system growth represents latest available APRA Monthly Banking Statistics as at August 2021 Reflects the APRA definition of lending adjusted for intra period reclassifications and growth in the BOQ Finance non-ADI Asset finance business ldquoPositive systemrdquo represents a growth better than system whereas ldquoNegative systemrdquo represents growth worse than system
(2) Asset finance system growth represents latest available Australian Finance Industry Association (AFIA) system growth statistics as at July 2021
(3) FY20 commercial lending growth increased from 34 per cent to 38 per cent due to the following restatements(a) Commercial lending growth increased by $13 million to align product
definitions where BOQ Specialist working capital products have been reclassified from consumer to commercial lending and
(b) BOQ Specialist Asset finance products were reclassified from commercial lending to Asset finance This decreased commercial lending growth and increased Asset finance growth by $7 million
BOQ Specialist
BOQ Blue
15
273
(75)
BOQ Finance
BOQ Specialist
78
34 Bank of Queensland Limited and its Controlled Entities
For the year ended 31 August 2021FINANCIAL PERFORMANCE
About BOQ 12 | Responding to COVID-19 14 | Acquisition of ME Bank 15 | Value Creation and Strategy 16
28 CUSTOMER DEPOSITSAs at Incl ME
$ million Aug-21 Feb-21 Aug-20 Aug-21
vs Feb-21 (1) Aug-21
vs Aug-20 Aug-21
Term deposits 14678 14240 15013 6 (2) 21991
Savings and investment accounts 15643 14411 13337 17 17 24293
Transaction accounts 4409 4020 3596 19 23 5377
Sub-total 34730 32671 31946 13 9 51661
Mortgage offsets (2) 3302 3152 2816 10 17 4808
Customer deposits 38032 35823 34762 12 9 56469
Deposit to loan ratio 75 74 74 1 1 75
(1) Growth rates have been annualised (2) Mortgage offset balances are netted against home loans for the purposes of customer interest payments
Customer depositsCustomer deposits grew by $33 billion or nine per cent on FY20 consistent with the Bankrsquos strategy to increase stable sources of funding while also reflecting ongoing high levels of liquidity in the market
The Retail Bank remains the primary source of customer deposits with the majority generated through the branch network The majority of inflows in FY21 have been in transaction savings and investment accounts partially reducing reliance on term deposits as the customer deposits mix rebalanced
The Bank has continued to maintain a strong liquidity position As growth in customer deposits was slightly above lending growth the deposit to loan ratio increased by one per cent on FY20 to 75 per cent
Term depositsTerm deposits decreased by $03 billion or two per cent on FY20 This was due to pricing actions to manage liquidity and reduce the cost of funds in the low rate environment and changes in customer preferences towards call accounts As a result term deposits have reduced from 43 per cent of the total portfolio in August 2020 to 39 per cent in August 2021
Savings and investment accountsSavings and investment accounts grew by $23 billion or 17 per cent on FY20 with both retail and commercial accounts growing strongly
The Bonus Interest Savings Account (BISA) achieved growth of over 30 per cent in FY21 and 17 per cent (annualised) in 2H21 and accounted for the majority of the growth in retail products across both periods The growth is attributed to the highly accessible and flexible product offering competitive rates during FY21
Transaction accounts and mortgage offsetsTransaction accounts and mortgage offsets grew by $08 billion and $05 billion on FY20 respectively The growth in transaction accounts reflected COVID-19 government stimulus payments to both small businesses and individuals and the impact of lockdowns in reducing living costs including travel and entertainment Higher offset balances also reflected the growth in home lending
ME Bank customer depositsME Bank customer deposits contributed $184 billion to Group deposits at August 2021 resulting in a combined deposit to loan ratio of 75 per cent The customer deposit products are similar to BOQ and the mix is comparable with term deposits representing 40 per cent of the total portfolio Savings and Investment accounts achieved the highest growth at over 30 per cent since August 2020 partly offset by a decrease in term deposits of three per cent
352021 Annual Report
For the year ended 31 August 2021FINANCIAL PERFORMANCE
Financial Performance 20 | Governance and Risk Management 55 | Directorsrsquo Details 71
3 BUSINESS SETTINGS31 ASSET QUALITY
Full Year Performance Half Year PerformanceYear End Incl ME
Aug-21 Aug-20Aug-21
vs Aug-20 Aug-21 Feb-21Aug-21
vs Feb-21 Aug-21
Loan impairment expense ($ million) (20) 175 Large (44) 24 Large (21)
Loan impairment expense GLA (bps) (4) 37 (41bps) (17) 10 (27bps) (3)
Impaired assets ($ million) 209 195 7 209 194 8 243
30dpd arrears (1) ($ million) 516 567 (9) 516 575 (10) 941
90dpd arrears (1) ($ million) 321 433 (26) 321 381 (16) 593
90dpd arrears GLA (1) (bps) 63 92 (29bps) 63 79 (16bps) 78
Total provision and GRCL GLA (1)(2) (bps) 76 98 (22bps) 76 95 (19bps) 63
(1) Excludes the impact of the fair value adjustments on acquisition of ME Bank Arrears have been presented on an unadjusted basis(2) GRCL gross of tax effect
BOQrsquos loan impairment expense was a credit of $20 million in FY21 which was driven by a reduction in the collective provision in FY21 of $69 million This was primarily due to an improved economic outlook with a further reduction from improvements in data quality relating to collateral This has resulted in a 22 basis points decrease in the BOQrsquos total provision and GRCL coverage which is 76 basis points of GLAs The total provision and GRCL coverage of 63 basis points inclusive of ME Bank is 13 basis points lower than FY20 due to a different product mix
Impaired assets of $209 million increased by $14 million or seven per cent on FY20 This was primarily driven by the impairment of one large facility with the underlying loan portfolio remaining strong
Arrears in the 30 day and 90 day categories improved compared to both FY20 and 1H21 The 90 days arrears ratio to GLAs reduced by 29 basis points to 63 basis points This was primarily driven by the Retail portfolio which has benefitted from record low interest rates increased household deposits house price growth and improved economic conditions
Loan impairment expenseFull Year Performance Half Year Performance Year End Incl ME
Aug-21 Aug-20 Aug-21 Feb-21 Aug-21
Expense($m)
ExpenseGLA (bps)
Expense($m) (1)(2)
ExpenseGLA
(bps) (1)(2)Expense
($m)
ExpenseGLA
(bps) (3)Expense($m) (1)(2)
ExpenseGLA
(bps) (1)(2)(3)Expense
($m)
ExpenseGLA (bps)
Retail lending (12) (4) 61 19 (2) (1) (8) (4) (13) (2)
Commercial lending (9) (9) 57 60 (26) (52) 17 36 (9) (9)
Asset finance 1 2 57 91 (16) (49) 15 48 1 2
Total loan impairment expense (20) (4) 175 37 (44) (17) 24 10 (21) (3)
(1) BOQ Specialist Asset finance products were reclassified from Commercial lending to Asset finance Prior periods have been restated(2) BOQ Specialist consumer products have been reclassified to commercial lending to align product definitions All periods reflect this restatement and are presented on
a like-for-like basis(3) Metrics have been annualised
The loan impairment expense was a credit of $20 million in FY21 compared to an expense of $175 million in FY20 FY20 included a $133 million collective provision overlay for the potential impacts of COVID-19 FY21 included a $69 million reduction in the collective provision due to an improved economic outlook and improvements in data quality relating to collateral This was partly offset by an increase in specific provision expense from $47 million in FY20 to $49 million in FY21 driven by a provision for one large facility in Retail and the impact of lockdowns on a small number of niche medical practices in Asset finance
Retail loan impairment expense was a credit of $12 million in FY21 This was driven by a reduction in the collective provision in FY21 of $32 million due to an improved economic outlook notably for the housing market driven by a rebound in expectations for residential house prices Underlying specific provisioning activity was largely consistent with FY20 but specific provision expense increased in FY21 driven by a provision for one large facility
Commercial loan impairment expense was a credit of $9 million in FY21 This was driven by a reduction in the collective provision in FY21 of $22 million due to improvements in data quality relating to collateral as well as an improved economic outlook Specific provisioning was also lower than FY20 driven by a write back of one large Agribusiness exposure that returned to performing following strong crop harvests due to improved weather conditions Underlying specific provisioning activity remained subdued reflecting improved economic conditions and government stimulus
Asset finance loan impairment expense of $1 million for FY21 was driven by a reduction in the collective provision in FY21 of $15 million due to an improved economic outlook This was partly offset by an increase in specific provision expense as lockdowns impacted a small number of niche medical practices
36 Bank of Queensland Limited and its Controlled Entities
For the year ended 31 August 2021FINANCIAL PERFORMANCE
About BOQ 12 | Responding to COVID-19 14 | Acquisition of ME Bank 15 | Value Creation and Strategy 16
31 ASSET QUALITY (CONTINUED)Impaired assets
As at Incl ME
$ million Aug-21 Feb-21 Aug-20Aug-21
vs Feb-21Aug-21
vs Aug-20 Aug-21
Retail lending 94 84 70 12 34 128
Commercial lending (1) 77 78 86 (1) (10) 77
Asset finance (1) 38 32 39 19 (3) 38
Total impaired assets 209 194 195 8 7 243
Impaired assets GLA 41bps 40bps 41bps 1bp - 32bps
(1) BOQ Specialist Asset finance products were reclassified from Commercial lending to Asset finance Prior periods have been restated
BOQ impaired assets of $209 million increased by $15 million or eight per cent on 1H21 This was primarily driven by an impairment of one large facility in the Retail portfolio
Retail impaired assets increased by $10 million or 12 per cent on 1H21 driven by one new impaired facility for $12 million Excluding this impaired assets decreased in 2H21 as increasing house prices supported low specific provisioning activity
Commercial impaired assets decreased by $1 million or one per cent on 1H21 This was due to low specific provisioning activity 1H21 was impacted by one large Agribusiness exposure of $28 million returning to performing which was partially offset by the impacts of COVID-19 and the initial lockdowns 2H21 reflected low specific provisioning activity as economic conditions improved
Asset finance impaired assets increased by $6 million or 19 per cent on 1H21 but decreased $1 million or three per cent on FY20 1H21 was impacted by one large facility of $4 million exiting the Group Impairment of medical equipment and fixtures and fittings among General Practitioners contributed over $3 million towards the increase in 2H21
The Group holds three exposures with impaired balances greater than $5 million for a combined total of $27 million This increase from $15 million at February 2021 was due to a new $12 million impaired balance for one large facility in the Retail portfolio This was however a decrease from $54 million at August 2020 as the Group returned a $28 million Agribusiness facility to performing in 1H21 following strong crop harvests due to improved weather conditions The Group now holds one exposure with an impaired balance greater than $10 million
ME Bank impaired assets of $34 million represent 14 basis points of GLAs reflecting a portfolio that is 99 per cent housing
The following chart outlines the movements in impaired assets since August 2020
Impaired assets ($m)
195
Aug 20
194
Feb 21
209
24334
Aug 21 Excl ME Bank
Aug 21 Incl ME Bank
7
New impaired
61
Realisations
(62)
New impaired
52
86
70
39
78
84
32
77
94
38
34
77
94
38
3426
2510
(34)
(11)(17)
1128
13
(12)(18)
(7)
Realisations
(37)
ME Bank
ME Bank Commercial Retail Asset finance
372021 Annual Report
For the year ended 31 August 2021FINANCIAL PERFORMANCE
Financial Performance 20 | Governance and Risk Management 55 | Directorsrsquo Details 71
31 ASSET QUALITY (CONTINUED)Provision coverage
As at Incl ME
$ million Aug-21 Feb-21 Aug-20Aug-21
vs Feb-21 Aug-21
vs Aug-20 Aug-21
Specific provision 107 103 94 4 14 107
Collective provision (CP) 206 271 275 (24) (25) 204
Total provisions 313 374 369 (16) (15) 311
GRCL ($ million) 52 58 64 (10) (19) 52
Specific provisions to impaired assets (1) 51 53 48 200bps Large 47
Total provisions and GRCL coverage impaired assets (1)(2) 185 236 236 Large Large 198
CP and GRCL Total RWA (bps) (1)(2) 63bps 111bps 116bps 47bps (53bps) 84bps
Total provisions and GRCL coverage GLA (1)(2) 76bps 95bps 98bps 19bps (22bps) 63bps
(1) Excludes the impact of the fair value adjustments on acquisition of ME Bank(2) GRCL gross of tax effect
BOQ provisions of $313 million decreased by $56 million or 15 per cent from FY20 This was driven by a decrease in the collective provision partly offset by an increase in specific provisions
Specific provisions of $107 million increased by $13 million or 14 per cent from FY20 This has increased the coverage of impaired assets from 48 per cent to 51 per cent This increase was primarily driven by the Retail and Asset finance portfolios The increase in the Retail portfolio was driven by one large facility partly offset by low specific provisioning activity supported by the low interest rate environment and buoyant house prices The Asset finance portfolio increased $6 million driven by a small number of niche medical practices within the BOQ Specialist portfolio The Commercial portfolio decreased as an Agribusiness facility returned to performing
The collective provision of $206 million decreased $69 million or 25 per cent from FY20 This included a $75 million release in the third quarter due to an improved economic outlook and improvements in data quality relating to collateral Economic model assumptions and management overlays are prudently managed to ensure sufficient provisions are held due to the ongoing uncertainty from COVID-19
As a result of the decrease in the collective provision and growth in GLAs total provisions and GRCL coverage of 76 basis points decreased by 22 basis points from FY20
The following chart outlines the movements in specific provisions since August 2020
Specific provisions ($m)
Aug 21
94
Aug 20
38
25
31
103
Feb 21
46
32
25
107
42
33
32
New Specific
32
13
118
Realisations
(23)
(5)(4)
(14)
New Specific
31
510
16
(9)(9)(9)
Realisations
(27)
Commercial Retail Asset finance
38 Bank of Queensland Limited and its Controlled Entities
For the year ended 31 August 2021FINANCIAL PERFORMANCE
About BOQ 12 | Responding to COVID-19 14 | Acquisition of ME Bank 15 | Value Creation and Strategy 16
31 ASSET QUALITY (CONTINUED)Arrears
Portfolio Balance
($m)Year End Incl ME
Key Metrics BOQ Group Aug-21 Feb-21 Aug-20Aug-21
vs Feb-21Aug-21
vs Aug-20 Aug-21
Total lending - portfolio balance ($ million) 50589 48108 47043 5 8 75748
30 days past due ($ million) (1) 516 575 567 (10) (9) 941
90 days past due ($ million) (1) 321 381 433 (16) (26) 593
Proportion of portfolio
30 days past due GLAs (1) 102 120 121 (18bps) (19bps) 124
90 days past due GLAs (1) 063 079 092 (16bps) (29bps) 078
By portfolio
30 days past due GLAs (Retail Excl ME Bank) 34253 094 125 125 (31bps) (31bps) 094
90 days past due GLAs (Retail Excl ME Bank) 064 088 097 (24bps) (33bps) 064
30 days past due GLAs (ME Bank) (1) 25232 - - - - - 168
90 days past due GLAs (ME Bank) (1) - - - - - 108
30 days past due GLAs (Commercial) 9879 152 148 153 4bps (1bp) 152
90 days past due GLAs (Commercial) 093 091 125 2bps (32bps) 093
30 days past due GLAs (Asset finance) 6457 069 048 050 21bps 19bps 069
90 days past due GLAs (Asset finance) 020 015 017 5bps 3bps 020
(1) Excludes the impact of the fair value adjustments on the acquisition of ME Bank Arrears have been presented on an unadjusted basis
Retail arrearsRetail arrears decreased in both the 30 day and 90 day categories since 1H21 and FY20 Banking Relief Package (BRP) and government stimulus has provided support for customers experiencing difficulty and has allowed repayments to resume in a timely manner Record low interest rates strong house prices and improved economic conditions have further supported the decrease in arrears
Commercial arrearsCommercial arrears increased by four basis points in the 30 day category and by two basis points in the 90 day category since 1H21 The increase in commercial arrears since 1H21 is in line with expectations as COVID-19 imposed lockdowns have reduced trading and a pause has been placed on collection activity in lockdown affected areas
Arrears in the 90 day category have decreased by 32 basis points since FY20 with improvements across the whole portfolio as customers returned to performing from banking relief and collection activity on late stage arrears recommenced following an extended moratorium in FY20
Asset finance arrearsAsset finance arrears increased by 21 basis points in the 30 day category and by five basis points in the 90 day category since 1H21 While arrears have been largely stable during most of the year the increase reflects the negative impact of recent lockdowns on the arrears position as well as the pause placed on collection activity in lockdown effected areas The increase was mainly in customers in NSW and those in health care industries within the BOQ Specialist portfolio
COVID-19 Banking relief packageFrom July 2021 the Bank reinstated a number of support measures to retail and business customers impacted by COVID-19 as part of Banking Relief support initiatives Utilisation of this latest assistance at less than one per cent of GLAs is considerably lower than during the initial BRP phase at more than 15 per cent of GLAs
In line with APRArsquos regulatory approach loans deferred as part of the COVID-19 Banking Relief support measures are not included in arrears where the loans were otherwise performing
ME Bank arrearsOver 50 per cent of ME Bank arrears are supported by Lenders Mortgage Insurance The higher level of ME arrears also reflects changes to collection practices to provide increased support to customers impacted by lockdown
392021 Annual Report
For the year ended 31 August 2021FINANCIAL PERFORMANCE
Financial Performance 20 | Governance and Risk Management 55 | Directorsrsquo Details 71
32 FUNDING AND LIQUIDITYBOQrsquos liquidity and funding risk appetite strategy is designed to ensure that the Bank has the ability to meet its financial obligations as they fall due under all market conditions Management of liquidity risk at BOQ is focused on developing a stable customer deposit base maintaining access to diversified wholesale funding markets and disciplined management of maturity profiles BOQ regularly stress tests itrsquos liquidity risk profile to identify vulnerabilities under a diverse range of market scenarios
As at 31 August BOQ (including ME Bank) had utilised its full Term Funding Facility allowance of $3 billion which is comprised of an initial allowance ($18 billion) supplementary allowance ($11 billion) and additional allowance ($01 billion) The Term Funding Facility was made available to ADIrsquos as part of a package of measures to support the Australian economy by providing three-year funding through repurchase transactions at the official cash rate target
Liquidity Coverage Ratio (LCR)APRA requires ADIs to maintain a minimum LCR of 100 per cent BOQ manages its LCR on a daily basis and actively maintains a buffer above the regulatory minimum in line with BOQrsquos prescribed risk appetite and policy settings
BOQrsquos Level 2 LCR (including ME Bank) at 31 August 2021 was 149 per cent which was 33 per cent lower than 1H21 ME Bankrsquos LCR was 169 per cent at 31 August 2021 The average Level 2 LCR since the settlement of ME Bank on 1 July 2021 was 151 per cent
The decrease in LCR was primarily due to negative impacts from
1 A $500 million reduction in the 2021 committed liquidity facility (CLF) due to a decline in CLF available to the banking system
2 A reduction in the available CLF due to the final drawing of the TFF
3 An increase to net cash outflows relating to increased retail at-call deposits and
4 The normalisation of contractual inflows following the settlement of BOQrsquos equity raising for the ME Bank acquisition
These were partly offset by a higher balance of HQLA1 and uplift from ME Bankrsquos strong liquidity position
LCR waterfall 28 February 2021 - 31 August 2021
Aug 21
1492
Feb 21
1824
HQLA1
379 (133)
Internal RMBS
(144)
Other ALA
Customer deposits
(36)
(148)
Wholesale funding
(345)
Other cash outflows
ME Bank
95
ME Bank
(1) Alternative liquid assets (ALA) qualifying as collateral for the CLF excluding internal residential mortgage backed securities (RMBS) within the CLF limit
LCR - August 2021 (149)
$92 BILLION
$66 BILLION
Liquid assets
OTHER ALA (1)
ME BANK
HIGH QUALITY LIQUID ASSETS
(HQLA)
INTERNAL RMBS
$144 BILLION
$97 BILLION
Net cash outflows
CUSTOMER DEPOSITS
OTHER
ME BANK
WHOLESALE FUNDING
40 Bank of Queensland Limited and its Controlled Entities
For the year ended 31 August 2021FINANCIAL PERFORMANCE
About BOQ 12 | Responding to COVID-19 14 | Acquisition of ME Bank 15 | Value Creation and Strategy 16
NSFR waterfall 28 February 2021 - 31 August 2021
Liquid assetsBOQ maintains a portfolio of high quality diversified liquid assets to facilitate balance sheet liquidity and meet internal and regulatory requirements Liquid assets are comprised of HQLA1 (cash Australian Semi-Government and Commonwealth Government securities) and alternative liquid assets covered under the CLF provided by the RBA CLF assets include senior unsecured bank debt covered bonds asset backed securities (ABS) and RMBS that are eligible for repurchase with the RBA
BOQ was granted a $29 billion CLF commencing on 1 April 2021 APRA has confirmed that the CLF allowance for the banking system will be reduced to zero by the end of 2022 which is in response to the increase in HQLA available to the banking system to meet LCR requirements
32 FUNDING AND LIQUIDITY (CONTINUED)
Aug 21
1222
Feb 21
1179
Capital
10
46
Customer deposits
28
Wholesale funding amp
other liabilities
Liquid assets
04
Residential mortgages
le 35
(49)
Other loans
(06)
Other assets
(27)
ME Bank
37
Net stable funding ratio (NSFR)The NSFR encourages ADIs to fund their lending activities with more stable sources of funding thereby promoting greater balance sheet resilience
BOQ manages its NSFR on a daily basis and actively maintains a buffer above the regulatory minimum in line with BOQrsquos prescribed risk appetite and policy settings
BOQrsquos Level 2 NSFR (including ME Bank) at 31 August 2021 was 122 per cent and ME Bankrsquos NSFR was 132 per cent For BOQ this represents an increase of four per cent over 1H21 which is largely reflective of the benefit received from ME Bankrsquos funding profile Retail customer deposit growth has been particularly strong over the half but the benefit to the NSFR has been offset by loan growth
ME Bank
NSFR - August 2021 (122)
$441 BILLION $372
BILLION
Available stable funding
$627 BILLION
CUSTOMER DEPOSITS
WHOLESALE FUNDING amp OTHER LIABILITIES
ME BANK
CAPITAL
$513 BILLION
Required stable funding
LIQUIDS amp OTHER ASSETS
OTHER LOANS
ME BANK
RESIDENTIAL MORTGAGES le 35
RISK WEIGHT
412021 Annual Report
For the year ended 31 August 2021FINANCIAL PERFORMANCE
Financial Performance 20 | Governance and Risk Management 55 | Directorsrsquo Details 71
32 FUNDING AND LIQUIDITY (CONTINUED)FundingBOQrsquos funding strategy and risk appetite reflects the Grouprsquos business strategy adjusted for the current economic environment Funding is managed to allow for various scenarios that may impact BOQrsquos funding position
Wholesale fundingBOQ focuses on three main strategic elements in delivering its wholesale funding objectives - capacity growth resilience and diversity - while minimising the cost of funds and maintaining its ability to take advantage of opportunities in the most appropriate markets BOQ continues to optimise the mix of wholesale and retail funding whilst also increasing stable sources of funding
In FY21 BOQrsquos continued focus on growing customer deposits through a variety of channels has seen strong growth of $33 billion As a result loan growth was fully funded by stable funding sources and the deposit to loan ratio increased from 74 per cent at 1H21 to 75 per cent at FY21 (excluding ME Bank) The remaining retail funding gap was funded through drawing down the TFF as well as accessing wholesale funding markets including both in secured and unsecured formats
(1) The classification of customer deposits is defined as all deposits excluding those from financial institutions as defined under APS 210 Liquidity(2) Foreign currency balances have been translated at end of day spot rates(3) ME Bank Funding mix of $283 billion includes $184 billion customer deposits $59 billion long term wholesale and $40 billion short term wholesale(4) ME Bank long term wholesale funding of $59 billion includes $46 billion securitisation $09 billion TFF and $04 billion senior unsecured debt
Funding mix ($billion) (1)
Long term wholesale ($billion) (1)
Aug 20
347(68)
48 (10)
113 (22)
508
Aug 20
113
07
34
40
24
08
Feb 21
108
10
29
34
23
12
Aug 21
177
10
30
32
24
22
59
Feb 21
358 (69)
52 (10)
108 (21)
518
Aug 21
380 (46)
54 (6)
118 (14)
283 (34)
835
Customer deposits (1)
Short term wholesale
Long term wholesale (2) Additional tier 1 notes subordinated debt
Senior unsecured Securitisation
Covered bond TFF
ME Bank (3) ME Bank (4)
$552 BILLION
$118 BILLION
42 Bank of Queensland Limited and its Controlled Entities
For the year ended 31 August 2021FINANCIAL PERFORMANCE
About BOQ 12 | Responding to COVID-19 14 | Acquisition of ME Bank 15 | Value Creation and Strategy 16
32 FUNDING AND LIQUIDITY (CONTINUED)Term funding issuance BOQ accessed term funding markets in FY21 using a range of long term wholesale products The intention was to refinance existing maturities as well as fund loan growth complementing the drawdown of the TFF and the inflow of customer deposits This included the $260 million Capital Notes 2 (Additional Tier 1 Capital) issuance (BOQPF) a $250 million Subordinated Debt (Tier 2 Capital) and a $650 million Senior Unsecured debt issuance Both of these replaced the $150 million Subordinated Debt call and the $600 million Senior Unsecured maturity in May 2021 BOQ also issued approximately $784 million Asset Backed Securitisation under the REDS EHP programme having last accessed this market in 2018
The diverse range of term funding products utilised in FY21 highlights the range of unsecured and secured debt programmes available to BOQ This provides funding diversification benefits and also enables BOQ to fund future asset growth and manage term maturity towers over the next five years including refinancing the TFF
33 CAPITAL MANAGEMENT Capital adequacy
As at
$ million Aug-21 Feb-21 Aug-20Aug-21
vs Feb-21Aug-21
vs Aug-20
CET1 4334 3221 3089 35 40
Additional tier 1 capital 610 610 350 - 74
Total tier 2 628 613 580 2 8
Total capital base 5572 4444 4019 25 39
Total RWA 44229 32126 31576 38 40
CET1 ratio 980 1003 978 (23bps) 2bps
Total capital adequacy ratio 1260 1383 1273 (123bps) (13bps)
Major maturities ($m) (1)(2)(3)(4)
(1) Any transaction issued in a currency other than AUD is shown in the applicable AUD equivalent hedged amount(2) Senior unsecured maturities greater than or equal to $50 million shown excludes private placements(3) Redemption of subordinated debt notes and additional tier 1 notes at the scheduled call date is at either BOQrsquos or ME Bankrsquos option (as applicable) and is subject to obtaining
prior written approval from APRA(4) Halves are reflected in line with the Bankrsquos financial reporting year
600
H1
600 650
H1
667
H1
600
H1 H1
900
744
H2
150
811
350
H2
750
H2 H2
2022 2023 2024 2025 2026
H2
1245
1112
200
Additional tier 1 Domestic senior Covered bondSubordinated debt TFF
200250
100
432021 Annual Report
For the year ended 31 August 2021FINANCIAL PERFORMANCE
Financial Performance 20 | Governance and Risk Management 55 | Directorsrsquo Details 71
34 TAX EXPENSEBOQ including ME Bank tax expense arising on cash earnings for FY21 amounted to $183 million This represented an effective tax rate of 308 per cent which is above the corporate tax rate of 30 per cent primarily due to the non-deductibility of interest payable on Capital Notes issued in FY18 and FY21
33 CAPITAL MANAGEMENT (CONTINUED)The Grouprsquos CET1 ratio decreased by 23 basis points during 2H21 from 1003 per cent to 980 per cent
The ME Bank acquisition was funded by proceeds from the capital raising This increased CET1 by 412 basis points which was fully offset by ME Banksrsquo risk weighted assets CET1 deductions and other CET1 deductions arising from Purchase Price Allocation (PPA)
Cash NPAT including ME Bank generated 49 basis points of capital with an additional 7 basis points contribution from the collective provision release in the half This was partly offset by RWA growth of 31 basis points and increased loan origination costs of six basis points driven by above system GLA growth
The normalisation of the dividend (net of the Dividend Reinvestment Plan (DRP)) reduced CET1 by 22 basis points CAPEX is in line with the strategic roadmap net of amortisation and utilised 12 basis points of capital Run-off in capital relief securitised housing loans increased risk weighted assets and reduced CET1 by two basis points Other items utilised six basis points of capital and included statutory adjustments net of reserves and deferred tax movements
Total capital adequacy ratio decreased by 13 basis points to 1260 per cent in FY21 This was primarily due to a lower Tier 2 ratio as ME Bank was lower than BOQ in this tier on a relative basis which was partially offset by an increase in subordinated debt issuance
2H21
980
1H21
1003
Securitisation impact
(006)
(006)
Other items
2H21 cash earnings
after tax
049
Collective provision
release
Dividend net of DRP
007
(012)
RWA growth
(031)
Loan origination
costs
(022)
Net CAPEX
(002)
2H21 CET1 Walk
Underlying capital utilisation of -3bps
44 Bank of Queensland Limited and its Controlled Entities
For the year ended 31 August 2021FINANCIAL PERFORMANCE
About BOQ 12 | Responding to COVID-19 14 | Acquisition of ME Bank 15 | Value Creation and Strategy 16
4 DIVISIONAL PERFORMANCE41 RETAIL INCOME STATEMENT KEY METRICS AND FINANCIAL PERFORMANCE REVIEWOverviewThe Retail Bank meets the financial needs and services of personal customers The division supports customers through owner-managed and corporate branch networks third party intermediaries VMA distribution channels more than 1300 ATMrsquos an Australian based customer call centre digital services and mobile mortgage specialists BOQ acquired 100 per cent of the share capital of ME Bank on 1 July 2021 ME Bank operates in the retail segment of the domestic market primarily offering home loan products everyday transaction and online savings accounts
Year End Performance Half Year PerformanceYear End Incl ME
$ million Aug-21 Aug-20Aug-21 vs
Aug-20 Aug-21 Feb-21Aug-21 vs
Feb-21 Aug-21
Net interest income 492 437 13 256 236 8 570
Non-interest income (1) 69 74 (7) 33 36 (8) 74
Total income 561 511 10 289 272 6 644
Operating expenses (356) (335) 6 (180) (176) 2 (407)
Underlying profit 205 176 16 109 96 14 237
Loan impairment expense 20 (56) Large 14 6 133 21
Profit before tax 225 120 88 123 102 21 258
Income tax expense (70) (37) 89 (38) (32) 19 (80)
Cash earnings after tax 155 83 87 85 70 21 178
KEY METRICS Year End Performance Half Year PerformanceYear End Incl ME
Aug-21 Aug-20Aug-21
vs Aug-20 Aug-21 Feb-21Aug-21
vs Feb-21 Aug-21
PERFORMANCE INDICATORS
CTI (1) () 635 656 Large 623 647 Large 632
Net interest income average GLA (2) () 201 187 14bps 205 200 5bps 193
ASSET QUALITY
90dpd arrears ($ million) 204 294 (31) 204 274 (26) 205
Impaired assets ($ million) 86 66 30 86 78 10 120
Loan impairment expense GLA (bps) (7) 22 (29bps) (10) (5) (5bps) (3)
BALANCE SHEET
GLA ($ million) 27724 25253 10 27724 26055 6 52883
Housing ($ million) 27674 25195 10 27674 25990 6 52626
Other retail ($ million) 50 58 (14) 50 65 (23) 257
Average Credit RWA ($ million) 9934 8720 14 9934 9158 8 11245
Customer deposits (3) ($ million) 18609 17210 8 18609 17424 7 37046
Term deposits ($ million) 4706 5647 (17) 4706 4833 (3) 12019
Mortgage offsets ($ million) 2183 1801 21 2183 2030 8 3689
Savings amp investment ($ million) 9197 7784 18 9197 8398 10 17847
Transaction accounts ($ million) 2523 1978 28 2523 2163 17 3491
Deposit to loan ratio () 67 68 (100bps) 67 67 - 70
(1) VMA operating costs have been restated from non-interest income and included in operating expenses per ASX announcement on 30 September 2021(2) Calculated on a cash earnings basis and net of offset accounts (3) Treasury managed deposits are included in the Bankrsquos Other operating segment
452021 Annual Report
For the year ended 31 August 2021FINANCIAL PERFORMANCE
Financial Performance 20 | Governance and Risk Management 55 | Directorsrsquo Details 71
41 RETAIL INCOME STATEMENT KEY METRICS AND FINANCIAL PERFORMANCE REVIEW (CONTINUED)Business reviewThe Retail Bank remains focussed on executing its strategic initiatives and is committed to supporting our customers in the current environment Strong growth in cash earnings has been driven by lower loan impairments improved lending margins and above system lending growth The housing momentum generated at the end of 2H20 has translated into positive lending growth across all core channels in FY21 The BOQ Blue brand has achieved positive growth for the first time since FY15 as settlements increased 72 per cent on FY20 The successful turnaround in the BOQ Blue brand is attributed to improvements which have been delivered over the past two years including the home buying transformation program an experienced retail leadership team quality third party relationships and a focus on expanding and enabling our unique and strategically important owner-managed network
The BOQ branch network consists of 103 owner-managed and 53 corporate branches supported by seven transaction centres The first Business Relationship Centre a lower cost branch model focussed on lending and deposit acquisition was opened in November 2020 in New Farm Queensland Expanding and leveraging the unique owner-manager model anchored in the communities we serve remains a strategic focus The branch network has delivered a turnaround in performance by reporting positive housing growth the first time since FY14 Settlement volumes increased 55 per cent on FY20 whilst run-off has been managed through proactive retention initiatives
The broker channel recorded home lending growth of $11 billion representing growth of 36 per cent on FY20 This was driven by building new and existing quality third party relationships focussed customer retention and simplified end-to-end mortgage processes Whilst further improvement are a continued focus specifically processing times the improvements delivered to date have enabled the settlement of more than double the volume of broker originated loans Customer experience has improved through the delivery of new broker enabled technologies
The VMA brand is a globally recognised brand which appeals to a more tech savvy customer base and continues to contribute to the Bankrsquos geographical diversification by targeting metropolitan-based customers across Australia VMA has a proven track record in executing on strong customer value led propositions This is evidenced by a home loan portfolio which has grown to more than $43 billion since the mid-2016 launch The business has been impacted by subdued credit card performance due to the portfolio being largely linked to frequent flyer cards The reduction in non-interest income from FY20 was more than offset by a strong uplift in interest revenue generated from VMArsquos home loan business VMA has launched its Digital Bank offering representing the largest production deployment in the Grouprsquos history The Digital Bank launched with transaction savings and an integrated credit card and loyalty offering Leveraging this foundational work to ensure a similar customer experience is delivered to new BOQ Retail deposit customers is scheduled to be delivered in 1H22 Work on Phase 2 for VMA and BOQ Retail Transformation continues with an expanded offering to term deposits and lending customers on track to deliver in 2022
ME Bank acquisitionDuring FY21 BOQ acquired 100 per cent of the share capital of ME Bank The ME Bank brand is a strong complementary brand with a shared customer centric culture which is recognised nationally with a notable Victorian emphasis The target customer base is slightly more digitally aware and therefore not reliant on face-to-face support The ME Bank brand has a housing portfolio of $250 billion which is supported by a broker channel and propriety network of mobile bankers
The housing portfolio decreased by $05 billion in the two months since acquisition This decline was in line with recent historical trends and reflected softer application flow in the preceding quarter which has since improved and an increase in run-off ME Bank contributed to the Grouprsquos funding with customer deposits in excess of $184 billion
Integration activities and mortgage process simplification work is well underway with the objective of returning the ME housing portfolio to growth in a sustainable way
Financial performance review Retail Bank cash earnings after tax increased $72 million or 87 per cent on FY20 Improved margins lending growth and lower collective provisioning were partially offset by the increased investment in the VMA digital transformation
ME Bank contributed $23 million to the divisionrsquos cash earnings after tax for the two months since acquisition
Net interest incomeNet interest income increased $55 million or 13 per cent on FY20 This was driven by margin improvement and strong lending balance growth
Housing margins improved due to lower funding and hedging costs and repricing Front-to-back book and retention discounting impacts continued due to ongoing competition in the market
Deposit margins decreased due to a lower interest rate environment impacting transaction and saving deposit account margins Strong transaction and savings balances growth a function of high levels of liquidity in the market has continued throughout FY21 resulting in total deposit growth of $14 billion or eight per cent Term deposits decreased $09 billion or 17 per cent to $47 billion in FY21 as the customer deposits mix rebalanced
Third party cost increases were driven by higher payments to owner-managers and brokers relative to FY20 as a result of higher growth whilst the increased settlement volumes have resulted in higher amortised acquisition costs
Non-interest incomeNon-interest income decreased by $5 million or seven per cent on FY20 as COVID-19 continued to impact several transaction fee categories notably those related to travel whilst an ongoing shift in customer preference to lower or no fee product also continued to impact fee revenue Lower VMA card and insurance revenue continued to be adversely impacted by the effect of COVID-19 on the travel industry These were partly offset by income from a new card services arrangement with a third party supplier
Operating expensesOperating expenses increased $21 million or six per cent on FY20 This was largely driven by an investment in employees to deliver strategic priorities including the VMA digital transformation and to support volume growth particularly in the areas of operations product marketing
Loan impairment expenseLoan impairment expense was a credit of $20 million in FY21 compared to an expense of $56 million in FY20 This was primarily driven by a reduction in the collective provision in FY21 of $37 million which reflected an improved economic outlook In FY20 a collective provision overlay of $44 million was recorded for the potential impacts of COVID-19
46 Bank of Queensland Limited and its Controlled Entities
For the year ended 31 August 2021FINANCIAL PERFORMANCE
About BOQ 12 | Responding to COVID-19 14 | Acquisition of ME Bank 15 | Value Creation and Strategy 16
42 BOQ BUSINESS INCOME STATEMENT KEY METRICS AND FINANCIAL PERFORMANCE REVIEWOverviewBOQ Business includes BOQ branded commercial lending BOQ Finance BOQ Specialist and financial markets The division provides tailored business banking solutions including commercial lending equipment finance and leasing cashflow finance foreign exchange hedging and international transfers interest rate hedging transaction banking and deposit solutions for business customers The division also provides home loans and consumer banking for BOQ Specialist customers
Year End Performance Half Year Performance
$ million Aug-21 Aug-20Aug-21 vs
Aug-20 Aug-21 Feb-21Aug-21 vs
Feb-21
Net interest income 555 543 2 285 270 6
Non-interest income 48 40 20 23 25 (8)
Total income 603 583 3 308 295 4
Operating expenses (262) (258) 2 (130) (132) (2)
Underlying profit 341 325 5 178 163 9
Loan impairment expense - (119) Large 30 (30) Large
Profit before tax 341 206 66 208 133 56
Income tax expense (106) (64) 66 (65) (41) 59
Cash earnings after tax 235 142 65 143 92 55
KEY METRICS Year End Performance Half Year Performance
Aug-21 Aug-20Aug-21
vs Aug-20 Aug-21 Feb-21Aug-21
vs Feb-21
PERFORMANCE INDICATORS
CTI () 434 443 (90bps) 422 447 Large
Net interest income average GLA (1) () 264 259 5bps 267 260 7bps
ASSET QUALITY
90dpd arrears ($ million) 118 139 (15) 118 107 10
Impaired assets ($ million) 123 129 (5) 123 115 7
Loan impairment expense GLA (bps) - 55 (55bps) (26) 27 (53bps)
BALANCE SHEET
GLA ($ million) 22865 21790 5 22865 22053 4
Housing ($ million) 6427 5960 8 6427 6162 4
Commercial and other ($ million) 9981 9571 4 9981 9613 4
Asset finance ($ million) 6457 6259 3 6457 6278 3
Average Credit RWA ($ million) 18147 17736 2 18147 17553 3
Customer deposits (2) ($ million) 10838 9726 11 10838 10339 5
Term deposits ($ million) 1393 1543 (10) 1393 1349 3
Mortgage offsets ($ million) 1119 1015 10 1119 1122 -
Savings amp investment ($ million) 6443 5550 16 6443 6011 7
Transaction accounts ($ million) 1883 1618 16 1883 1857 1
Deposit to loan ratio () 47 45 200bps 47 47 -
(1) Calculated on a cash earnings basis and net of offset accounts (2) Treasury managed deposits are included in the Bankrsquos Other operating segment
472021 Annual Report
For the year ended 31 August 2021FINANCIAL PERFORMANCE
Financial Performance 20 | Governance and Risk Management 55 | Directorsrsquo Details 71
42 BOQ BUSINESS INCOME STATEMENT KEY METRICS AND FINANCIAL PERFORMANCE REVIEW (CONTINUED)Business reviewBOQ Business has continued to support its large and small customers during the current difficult economic climate through ongoing lending and specific COVID-19 relief where required
The business continued to execute on its niche segment strategy of providing a tailored relationship offering to customers and achieving total asset growth of $11 billion or five per cent on FY20 This was matched by strong deposit growth of $11 billion or 11 per cent over FY21 largely in the transaction and savings account products
BOQ commercial growth of $04 billion or 08x system Other banking solutions such as merchant facilities and foreign exchange contributed to the diversification of the portfolio and stronger non-interest income
The small business strategy remains a key focus and improvements to the lending offering have been made to policy product and process This has resulted in growth of $52 million in the BOQ small business portfolio and the first year of growth in this portfolio since 2012 Both retention and new business volumes improved through the branch broker and direct business banker channels
BOQ Specialist commercial lending portfolio grew by $02 billion or seven per cent on FY20 whilst asset financing in this channel contracted Home lending grew by $05 billion or nine per cent with a strong second half as confidence returned to the sector The mortgage offering provides a pipeline of customers with potential commercial lending needs in the future
Improvements were made to online banking in BOQ Specialist that continued to drive deposit growth in transaction and savings accounts BOQ Specialist focuses on clearly defined niches and has developed deep client relationships offering tailored consumer and commercial products and services to assist professionals
BOQ Finance grew its $55 billion asset finance portfolio by $03 billion or five per cent due to record settlement volumes in Equipment finance and strong structured finance growth Key industry growth continues to be in the transport agriculture and construction industries This was partly offset by a decline in the BOQ Specialist Asset finance book of $75 million which was driven by lower levels of investment from dentistry and medical practices
Financial performance reviewBOQ Business cash earnings after tax increased by $93 million or 65 per cent on FY20 This result was driven by both improved underlying profit and favourable loan impairment expense due to a reduction in the collective provision
Net interest incomeNet interest income increased $12 million or two per cent on FY20 This was driven by margin improvement in the business lending and asset finance portfolios
Asset margins improved due to lower funding and hedging costs and whilst maintaining pricing Income growth from assets was impacted as the lending growth occurred late in the year
Deposit margins decreased due to a lower interest rate environment impacting transaction and saving deposit account margins Strong deposit growth has continued throughout FY21 reflecting the higher liquidity in the market and government stimulus for small business Total deposit growth of $11 billion or 11 per cent was driven by growth in transaction and savings accounts partly offset by a decrease in term deposits as the customer deposits mix rebalanced
Non-interest incomeNon-interest income increased by $8 million or 20 per cent on FY20 The increase was mainly driven by higher merchant terminal revenue from small business customers financial markets customer transactions the reinstatement of some fees paused during COVID-19 and income from a new card services arrangement with a third party supplier
Operating expensesOperating expenses increased by $4 million or two per cent on FY20 This was driven by investment in small business initiatives banker capability and regulatory and technology projects This is targeting an improved customer experience and efficiency in the operational aspects of lending fulfilment
The increase also reflected additional staff to support customers impacted by COVID-19 and increasing Know Your Customer (KYC) regulatory compliance costs This was partly offset by lower discretionary spend particularly travel and entertainment
Loan impairment expenseLoan impairment expense decreased by $119 million on FY20 This was primarily driven by a reduction in the collective provision in FY21 of $32 million due to improvements in data quality relating to collateral as well as an improved economic outlook In FY20 a collective provision overlay of $89 million was recorded for the potential impacts of COVID-19
Specific provisions were largely unchanged on FY20 as activity remained subdued reflecting improved economic conditions and government stimulus A write back of one large commercial Agribusiness exposure that returned to performing following strong crop harvests due to improved weather conditions was offset by an increase in specific provision expense in Asset finance as lockdowns impacted some niche medical practices
48 Bank of Queensland Limited and its Controlled Entities
For the year ended 31 August 2021FINANCIAL PERFORMANCE
About BOQ 12 | Responding to COVID-19 14 | Acquisition of ME Bank 15 | Value Creation and Strategy 16
43 OTHER SEGMENT INCOME STATEMENT AND FINANCIAL PERFORMANCE REVIEW OverviewThe Other segment includes Treasury St Andrewrsquos Insurance and Group head office
Year End Performance Half Year Performance
$ million Aug-21 Aug-20Aug-21 vs
Aug-20 Aug-21 Feb-21Aug-21 vs
Feb-21
Net interest income (expense) 3 6 (50) (3) 6 (150)
Non-interest income 8 14 (43) 3 5 (40)
Total income 11 20 (45) - 11 (100)
Operating expenses (15) (19) (21) (8) (7) 14
Underlying profit (loss) (4) 1 Large (8) 4 Large
Loan impairment expense - - (100) - - (100)
Profit (loss) before tax (4) 1 Large (8) 4 Large
Income tax (expense) benefit 3 (1) Large 4 (1) Large
Cash profit (loss) after tax (1) - 100 (4) 3 Large
Financial performance reviewCash earnings after tax was a loss of $1 million in FY21 compared to $nil for FY20
Net interest income (expense)Net interest income decreased by $3 million or 50 per cent on FY20 This primarily reflected lower income from Treasuryrsquos hedging of interest rate risk partly offset by higher home loan break cost income
Non-interest incomeNon-interest income comprises St Andrewrsquos insurance revenue and Treasury trading income Non-interest income decreased by $6 million or 43 per cent on FY20 This was mainly driven by lower insurance income following a decision in FY20 by St Andrewrsquos to materially close to new business It also reflects lower Treasury trading income as a lack of volatility and lower interest rate environment reduced trading income opportunities together with reduced market exposures and widening in credit spreads in 2H21
Operating expensesOperating expenses decreased by $4 million or 21 per cent on FY20 This primarily reflected a decrease in St Andrewrsquos expenses following its closure to new business in FY20
492021 Annual Report
For the year ended 31 August 2021FINANCIAL PERFORMANCE
Financial Performance 20 | Governance and Risk Management 55 | Directorsrsquo Details 71
44 PRO FORMA RESULTS The following Pro Forma results are designed to facilitate a meaningful understanding of the combined Grouprsquos performance for FY20 and FY21 and to form a basis for the outlook for FY22
They have been prepared on the basis that ME Bank was included for the full twelve months of FY20 and FY21 They reflect a number of adjustments to both BOQ and ME Bank in order to make the results more indicative of future performance including
bull Alignment of ME Bank to BOQrsquos August year end
bull Alignment of ME Bank to BOQrsquos presentation of net interest income non-interest income and operating expenses and
bull Removal of St Andrewrsquos insurance
The Pro Forma results for the years ended 31 August 2020 and 2021 are outlined below
Pro Forma Year Ended Performance Aug-21 vs Aug-20
$ million
BOQ Adjusted (1)
Aug-20
ME Bank
AdjustedAug-20
BOQ Group
Pro FormaAug-20
BOQ Adjusted (1)
Aug-21
ME Bank
Adjusted (2)
Aug-21
BOQ Group
Pro FormaAug-21
BOQ Adjusted (1)
ME Bank
Adjusted
BOQ Group
Pro Forma
Net interest income 986 470 1456 1050 489 1539 6 4 6
Non-interest income 117 16 133 118 16 134 1 - 1
Total income 1103 486 1589 1168 505 1673 6 4 5
Operating expenses (603) (283) (886) (626) (307) (933) 4 8 5
Underlying profit 500 203 703 542 198 740 8 (2) 5
Loan impairment expense (175) (60) (235) 20 9 29 Large Large Large
Profit before tax 325 143 468 562 207 769 73 45 64
Income tax expense (101) (42) (143) (173) (64) (237) (71) (52) (66)
Cash earnings after tax 224 101 325 389 143 532 74 42 64
Statutory net profit after tax (3) 114 87 201 352 111 463 Large 28 130
KEY METRICS Aug-20 Aug-20 Aug-20 Aug-21 Aug-21 Aug-21 Aug-21 vs Aug-20
Profitability and efficiency measures
NIM () 191 159 179 195 170 186 4bps 11bps 7bps
CTI () 547 582 558 536 608 558 (110bps) Large -
LIE to GLA (bps) 37 22 32 (4) (4) (4) (41bps) (26bps) (36bps)
(1) BOQ result has been adjusted as follows (a) VMA operating costs have been restated from non-interest income and included in operating expenses per ASX announcement on 30 September 2021(b) St Andrewrsquos income as disclosed in note 24 and operating expenses and non-interest income of $7 million in FY21 and operating expenses of $9 million and non-interest
income of $11 million in FY20 have been removed to reflect the planned divestment in 1H22(2) Includes the amortisation of fair value adjustments on acquisition including an effective interest adjustment following a fair value adjustment to the loan portfolio on
acquisition of ME Bank(3) ME statutory adjustments for FY21 include transaction costs ($23 million) hedge ineffectiveness intangible asset review integration costs and amortisation of acquisition
fair value adjustments
50 Bank of Queensland Limited and its Controlled Entities
For the year ended 31 August 2021FINANCIAL PERFORMANCE
About BOQ 12 | Responding to COVID-19 14 | Acquisition of ME Bank 15 | Value Creation and Strategy 16
45 OUTLOOK Despite the uncertain environment we are cautiously optimistic that Australia remains well placed for economic recovery characterised by further house price rises and solid growth in consumer spending and business investment
There may still be uncertainty associated with COVID-19 for at least the next year We expect that fiscal and monetary policy will continue to underpin the economic recovery Over the next year we will continue to maintain a prudent approach to provisioning given the ongoing impact of lockdowns
512021 Annual Report
For the year ended 31 August 2021FINANCIAL PERFORMANCE
Financial Performance 20 | Governance and Risk Management 55 | Directorsrsquo Details 71
5 APPENDIX51 CASH EPS CALCULATIONS
Year End Performance Half Year Performance
Aug-21 Aug-20 (1)Aug-21
vs Aug-20 Aug-21 (2) Feb-21 (1)(2)Aug-21
vs Feb-21
Reconciliation of cash earnings for EPS
Cash earnings after tax ($ million) 412 225 83 247 165 50
Returns to other equity instruments (3) ($ million) (1) - (100) (1) - (100)
Cash earnings available for ordinary shareholders ($ million) 411 225 83 246 165 49
Effect of Wholesale Capital Notes ($ million) - 4 (100) - - -
Effect of Capital Notes 1 ($ million) 9 11 (18) 5 5 -
Effect of Capital Notes 2 ($ million) 5 - 100 4 2 100
Cash diluted earnings available for ordinary shareholders ($ million) 425 240 77 255 172 48
Weighted average number of shares (WANOS)
Basic WANOS - Ordinary shares (million) 550 455 21 630 468 35
Effect of award rights (million) 3 2 50 3 3 -
Effect of Wholesale Capital Notes (million) - 18 (100) - - -
Effect of Capital Notes 1 (million) 38 59 (36) 38 40 (5)
Effect of Capital Notes 2 (million) 21 - 100 28 15 87
Diluted WANOS for cash earnings EPS (4) (million) 612 534 15 699 526 33
Earnings per share
Basic EPS - Ordinary shares (cents) 747 496 51 388 355 9
Diluted EPS - Ordinary shares (cents) 695 451 54 362 328 10
(1) The basic and diluted earnings per share for August 2020 and February 2021 have been adjusted per ASX announcement on 20 April 2021 (2) The sum of 1H21 and 2H21 EPS and cash earning adjustments do not equal FY21 due to the impact of the capital raising and the uneven distribution of cash earnings after tax
across the two halves of the year(3) Other equity instruments assumed on the acquisition ME Bank Refer to Note 310(B) in the Financial Statements(4) During the year ended 31 August 2021 the Group granted 8033732 premium priced options to eligible employees The options were anti-dilutive during the period and
therefore have not impacted the diluted WANOS during the period
52 Bank of Queensland Limited and its Controlled Entities
For the year ended 31 August 2021FINANCIAL PERFORMANCE
About BOQ 12 | Responding to COVID-19 14 | Acquisition of ME Bank 15 | Value Creation and Strategy 16
52 AVERAGE BALANCE SHEET AND MARGIN ANALYSIS FY21 (1) FY20 (2)
Average balance
$mInterest
$m
Average rate
Average balance
$mInterest
$m
Average rate
INTEREST EARNING ASSETS
Loans amp advances (3) 45241 1430 316 44375 1656 373
Investments amp other securities 8569 28 033 7388 59 080
Total interest earning assets 53810 1458 271 51763 1715 331
Non-interest earning assets
Property plant amp equipment 134 157
Other assets 1679 1696
Provision for impairment (355) (257)
Total non-interest earning assets 1458 1596
Total assets 55268 53359
INTEREST BEARING LIABILITIES
Retail deposits 33185 202 061 30378 397 131
Wholesale deposits amp borrowings (4) 15964 206 129 17603 332 189
Total interest bearing liabilities 49149 408 083 47981 729 152
Non-interest bearing liabilities 1178 1240
Total liabilities 50327 49221
Shareholdersrsquo funds 4941 4138
Total liabilities amp shareholdersrsquo funds 55268 53359
INTEREST MARGIN amp INTEREST SPREAD
Interest earning assets 53810 1458 271 51763 1715 331
Interest bearing liabilities 49149 408 083 47981 729 152
Net interest spread 188 179
Benefit of free funds 007 012
NIM - on average interest earning assets 53810 1050 195 51763 986 191
(1) Relates to BOQ only(2) Comparative periods have been restated to conform to presentation in the current period Derivatives have been reallocated to better match their association to assets
or liabilities(3) Net of average mortgage offset balances(4) Includes hedging costs execution costs and dealer fees
532021 Annual Report
For the year ended 31 August 2021FINANCIAL PERFORMANCE
Financial Performance 20 | Governance and Risk Management 55 | Directorsrsquo Details 71
52 AVERAGE BALANCE SHEET AND MARGIN ANALYSIS (CONTINUED) 2H21 (1) 1H21 (2)
Average balance
$mInterest
$m
Average rate
Average balance
$mInterest
$m
Average rate
INTEREST EARNING ASSETS
Loans amp advances (3) 45970 706 305 44511 724 328
Investments amp other securities 8697 14 032 8441 14 033
Total interest earning assets 54667 720 261 52952 738 281
Non-interest earning assets
Property plant amp equipment 126 144
Other assets 1732 1626
Provision for impairment (350) (360)
Total non-interest earning assets 1508 1410
Total assets 56175 54362
INTEREST BEARING LIABILITIES
Retail deposits 33851 85 050 32518 117 073
Wholesale deposits amp borrowings (4) 15643 97 123 16285 109 135
Total interest bearing liabilities 49494 182 073 48803 226 093
Non-interest bearing liabilities 1126 1231
Total liabilities 50620 50034
Shareholdersrsquo funds 5555 4328
Total liabilities amp shareholdersrsquo funds 56175 54362
INTEREST MARGIN amp INTEREST SPREAD
Interest earning assets 54667 720 261 52952 738 281
Interest bearing liabilities 49494 182 073 48803 226 093
Net interest spread 188 188
Benefit of free funds 007 007
NIM - on average interest earning assets 54667 538 195 52952 512 195
(1) Relates to BOQ only(2) Comparative periods have been restated to conform to presentation in the current period Derivatives have been reallocated to better match their association to assets
or liabilities(3) Net of average mortgage offset balances(4) Includes hedging costs execution costs and dealer fees
54 Bank of Queensland Limited and its Controlled Entities
For the year ended 31 August 2021FINANCIAL PERFORMANCE
About BOQ 12 | Responding to COVID-19 14 | Acquisition of ME Bank 15 | Value Creation and Strategy 16
Managing our risk landscape BOQrsquos approach to the effective and prudent management of key risks is at the forefront of our business strategy Key risks are identified and managed as part of a Group Risk Management Framework that includes the Board approved Business Plans Risk Management Strategy and Risk Appetite Statement followed by the capital and funding plans
A cornerstone of the enterprise-wide strategy is the annual Board Strategic Review which provides a forward outlook taking into consideration various factors
bull Macroeconomic and financial services outlook
bull Internal environmental and competitive assessment
bull Group strategic risk and financial objectives
bull Group strategy statement
bull Financial forecast
bull System growth assumptions and relative returns of business lines (Banking)
bull Key strategic initiatives
bull Strategic goals and targets
bull Material strategy execution risks and proposed mitigating actions
Another cornerstone of the enterprise-wide strategy is the Group Risk Appetite Statement which covers the principal sources of risk and is cascaded to businesses as part of the business unit planning process qualitatively (through risk policies standards and operating procedures) and quantitatively (through risk limits settings and decision authorities)
The below diagram illustrates the governance framework for managing BOQrsquos key risks and how they are identified measured monitored and reported from Management up to the Board
Bank of Queensland Board
Executive Committee
(ExCo)
Executive Risk Committee
Executive Credit
Committee
Asset amp Liability
Committee
Risk Committee
Strategic Risk Non-Financial RisksFinancial Risks
Sustainability amp Climate
Change Risk
Insurance Risk
Credit Risk
Market Risk
Liquidity amp Funding Risk
Compliance Conduct amp Regulatory
Risk
Operational Risk
Reputational Risk
GOVERNANCE AND RISK MANAGEMENT
Financial Performance 20 | Governance and Risk Management 55 | Directorsrsquo Details 71
552021 Annual Report
BOQrsquos operations and performance are impacted by strategic risks financial risks and non-financial risks Key risks are identified and managed as part of BOQrsquos risk management framework The below table outlines the key risks impacting the business and how BOQ manages these
Risk Description Management of Risk Value Drivers
Compliance conduct amp regulatory engagement risk
The risk of failure to comply with any regulatory obligations including data privacy breaches the risk of inadequate response to regulatory change not acting in accordance with customersrsquo best interests not designing and distributing products and services to customers in an adequate accurate and proper manner not acting in accordance with BOQrsquos values and Code of Conduct not acting in accordance with Workplace Health and Safety laws not complying with Environmental laws Failure to adhere to the requirements of BOQrsquos Financial Crime Compliance Framework which includes BOQs Anti-Money Laundering and Counter-Terrorism Financing Program - Parts A and B Anti-Bribery and Corruption and Sanctions Evasion
BOQ has a Compliance Management Framework and underlying standards and procedures that outline how compliance risks are identified and managed within risk appetite and tolerance to meet regulatory requirements This is supported by a Privacy Management and Financial Crime Compliance Framework to manage the risk of money laundering and terrorism financing and other financial crime risks and a Conduct Risk Standard that outlines the approach to establishing and maintaining a strong ethical culture via embedded principles and policies Regulatory obligations are mapped to controls and captured in the Governance Risk and Compliance (GRC) tool to allow early identification of potential obligation breaches via incident management assurance and issue management Incident management also includes ensuring timely and appropriate notifications to regulators Regulatory change is managed through a Regulatory Change Roadmap
Customer
Finance
Credit riskThe risk that a debtor or transactional counterparty will default andor fail to meet their contractual obligations and includes the risk of loss of value of assets due to deterioration in credit quality and credit concentration risk This risk primarily arises from BOQrsquos lending activities and the holding of various financial instruments for investment or liquidity purposes
Risk management practices in place to support effective credit risk management include the establishment and ongoing maintenance of a limits monitoring and management framework BOQrsquos Credit Risk Management Principles provide core standards for the provision of credit for all customers The credit risk management principles express the expectations of the Board for both the analytical and behavioural aspects of granting of credit to customers BOQ maintains a suite of credit policies to address the range of lending products provided to customers and to satisfy the Board level requirements expressed in the Credit Risk Management Principles and Risk Appetite Statement
Customer
Finance
Environment amp climate change
Liquidity and funding risk
The risk that BOQ cannot meet or generate sufficient cash resources to meet its payment obligations in full as they fall due or can only do so at materially disadvantageous terms
BOQ maintains a diverse and stable pool of potential funding sources The Bank maintains adequate liquidity buffers and short-term funding capacity to withstand periods of disruption in long-term wholesale funding markets BOQ adopts a robust limit framework including stress testing and scenario analysis that enables risk based decisioning ensuring the business remains within risk appetite
Finance
Operational risk The risk of loss resulting from inadequate or failed internal processes people and systems andor from external events As such operational risk captures business continuity plans crisis management process systems and operations risk people related risks health and safety related risks information technology information security and data risks
BOQ has an Operational Risk Management Framework and underlying standards and procedures that outlines how operational risks are identified and managed within risk appetite and tolerance to meet regulatory customer operational and strategic requirements This includes mechanisms to undertake risk-reward business decisions taking into account operational risk exposures and the control environment These risks are managed through our GRC tool
Customer
People
Environment amp climate change
Finance
Insurance riskInsurance risk arises from the ownership and operation of insurance companies Insurance Risk can be broadly defined as an unexpected economic gain or loss relating to movements in claim costs This includes the risk that inadequate or inappropriate product design (including pricing) underwriting claims management and reinsurance management will expose the business to financial loss and the consequent inability to meet its liabilities
St Andrewrsquos manages insurance risk through the Reinsurance Management Strategy Claims Management Policy and the Risk Appetite Statement The divestment of St Andrewrsquos will significantly reduce the exposure BOQ has toward insurance and therefore the necessity to have this as a material risk class
Finance
Contagion riskThe primary sources of market contagion risk relate to correlated concentrations balance sheet contagion and severe market liquidity events Internal contagion risk is the risk that problems arising in BOQrsquos subsidiaries may compromise the financial and operational position of the BOQ Group
BOQrsquos credit portfolio limit framework and risk appetite measures enable effective management of market contagion risk BOQ applies common risk management practices across all Group subsidiaries The performance of subsidiaries is subject to ongoing review and oversight with senior management representation on subsidiary management committees and boards
Finance
Reputation riskThe risk to earnings and capital arising from negative public opinion resulting from the loss of reputation public trust or standing and is considered to be a risk derived from business activities and is considered in conjunction with the underlying risks resulting from those activities
BOQ has relevant risk management frameworks for the management of the underlying risks which can have an impact on reputation risk as outlined in this section Supporting this are conduct and reputational risk frameworks outlining the approach to establishing and maintaining a strong ethical culture via embedded principles and policies throughout the Group to support the management of reputation risk
Customer
Finance
Strategic risk Strategic Risk is the risk that might arise from the pursuit of a business model or strategy that is not viable
Business strategy development incorporates risk management practices to ensure any potential changes in the level of risk including new risks are continuously considered when making strategic decisions Key strategic risks are subject to ongoing review and analysis with monthly reporting provided to management and the Board including performance against strategic growth targets
Finance
Technology amp data capabilities
Sustainability and climate change risk
More detail on climate change risk can be found on pages 61 - 69 Refer to page 62 for full details on how we are managing sustainability risk and climate change
Community
Environment amp climate change
GOVERNANCE AND RISK MANAGEMENT
About BOQ 12 | Responding to COVID-19 14 | Acquisition of ME Bank 15 | Value Creation and Strategy 16
56 Bank of Queensland Limited and its Controlled Entities
Risk Description Management of Risk Value Drivers
Compliance conduct amp regulatory engagement risk
The risk of failure to comply with any regulatory obligations including data privacy breaches the risk of inadequate response to regulatory change not acting in accordance with customersrsquo best interests not designing and distributing products and services to customers in an adequate accurate and proper manner not acting in accordance with BOQrsquos values and Code of Conduct not acting in accordance with Workplace Health and Safety laws not complying with Environmental laws Failure to adhere to the requirements of BOQrsquos Financial Crime Compliance Framework which includes BOQs Anti-Money Laundering and Counter-Terrorism Financing Program - Parts A and B Anti-Bribery and Corruption and Sanctions Evasion
BOQ has a Compliance Management Framework and underlying standards and procedures that outline how compliance risks are identified and managed within risk appetite and tolerance to meet regulatory requirements This is supported by a Privacy Management and Financial Crime Compliance Framework to manage the risk of money laundering and terrorism financing and other financial crime risks and a Conduct Risk Standard that outlines the approach to establishing and maintaining a strong ethical culture via embedded principles and policies Regulatory obligations are mapped to controls and captured in the Governance Risk and Compliance (GRC) tool to allow early identification of potential obligation breaches via incident management assurance and issue management Incident management also includes ensuring timely and appropriate notifications to regulators Regulatory change is managed through a Regulatory Change Roadmap
Customer
Finance
Credit riskThe risk that a debtor or transactional counterparty will default andor fail to meet their contractual obligations and includes the risk of loss of value of assets due to deterioration in credit quality and credit concentration risk This risk primarily arises from BOQrsquos lending activities and the holding of various financial instruments for investment or liquidity purposes
Risk management practices in place to support effective credit risk management include the establishment and ongoing maintenance of a limits monitoring and management framework BOQrsquos Credit Risk Management Principles provide core standards for the provision of credit for all customers The credit risk management principles express the expectations of the Board for both the analytical and behavioural aspects of granting of credit to customers BOQ maintains a suite of credit policies to address the range of lending products provided to customers and to satisfy the Board level requirements expressed in the Credit Risk Management Principles and Risk Appetite Statement
Customer
Finance
Environment amp climate change
Liquidity and funding risk
The risk that BOQ cannot meet or generate sufficient cash resources to meet its payment obligations in full as they fall due or can only do so at materially disadvantageous terms
BOQ maintains a diverse and stable pool of potential funding sources The Bank maintains adequate liquidity buffers and short-term funding capacity to withstand periods of disruption in long-term wholesale funding markets BOQ adopts a robust limit framework including stress testing and scenario analysis that enables risk based decisioning ensuring the business remains within risk appetite
Finance
Operational risk The risk of loss resulting from inadequate or failed internal processes people and systems andor from external events As such operational risk captures business continuity plans crisis management process systems and operations risk people related risks health and safety related risks information technology information security and data risks
BOQ has an Operational Risk Management Framework and underlying standards and procedures that outlines how operational risks are identified and managed within risk appetite and tolerance to meet regulatory customer operational and strategic requirements This includes mechanisms to undertake risk-reward business decisions taking into account operational risk exposures and the control environment These risks are managed through our GRC tool
Customer
People
Environment amp climate change
Finance
Insurance riskInsurance risk arises from the ownership and operation of insurance companies Insurance Risk can be broadly defined as an unexpected economic gain or loss relating to movements in claim costs This includes the risk that inadequate or inappropriate product design (including pricing) underwriting claims management and reinsurance management will expose the business to financial loss and the consequent inability to meet its liabilities
St Andrewrsquos manages insurance risk through the Reinsurance Management Strategy Claims Management Policy and the Risk Appetite Statement The divestment of St Andrewrsquos will significantly reduce the exposure BOQ has toward insurance and therefore the necessity to have this as a material risk class
Finance
Contagion riskThe primary sources of market contagion risk relate to correlated concentrations balance sheet contagion and severe market liquidity events Internal contagion risk is the risk that problems arising in BOQrsquos subsidiaries may compromise the financial and operational position of the BOQ Group
BOQrsquos credit portfolio limit framework and risk appetite measures enable effective management of market contagion risk BOQ applies common risk management practices across all Group subsidiaries The performance of subsidiaries is subject to ongoing review and oversight with senior management representation on subsidiary management committees and boards
Finance
Reputation riskThe risk to earnings and capital arising from negative public opinion resulting from the loss of reputation public trust or standing and is considered to be a risk derived from business activities and is considered in conjunction with the underlying risks resulting from those activities
BOQ has relevant risk management frameworks for the management of the underlying risks which can have an impact on reputation risk as outlined in this section Supporting this are conduct and reputational risk frameworks outlining the approach to establishing and maintaining a strong ethical culture via embedded principles and policies throughout the Group to support the management of reputation risk
Customer
Finance
Strategic risk Strategic Risk is the risk that might arise from the pursuit of a business model or strategy that is not viable
Business strategy development incorporates risk management practices to ensure any potential changes in the level of risk including new risks are continuously considered when making strategic decisions Key strategic risks are subject to ongoing review and analysis with monthly reporting provided to management and the Board including performance against strategic growth targets
Finance
Technology amp data capabilities
Sustainability and climate change risk
More detail on climate change risk can be found on pages 61 - 69 Refer to page 62 for full details on how we are managing sustainability risk and climate change
Community
Environment amp climate change
GOVERNANCE AND RISK MANAGEMENT
Financial Performance 20 | Governance and Risk Management 55 | Directorsrsquo Details 71
572021 Annual Report
The financial services industry continues to receive significant focus from the Federal Government regulators investors and consumers A summary of the key areas of reform and areas of increased risk focus are outlined below
Regulatory developmentsPolicy and Priorities Following a suspension in March 2020 later in the year APRA recommenced its planned policy and supervision agenda to prioritise activities that responded to the impacts of COVID-19
In February 2021 APRA released its policy and supervision activities across 202122 A key focus was on enhancing the resilience and crisis readiness of Australiarsquos financial system Achieved by working closely with peer regulators to support the recovery from the impacts of COVID-19 through delivery of efficient proportionate regulation that facilitates a resilient competitive and innovative financial sector
For the remainder of 2021 APRArsquos policy priorities will centre on completing key reforms to strengthen financial resilience Of relevance to BOQ these include
bull Completing the bank capital reforms with three final standards for capital adequacy to be released in November 2021 and to apply from January 2023
bull Consulting on reforms to the insurance capital framework to reflect changes in the accounting standard AASB17
bull Consulting on new standards for financial contingency planning and resolution to be released in November 2021 for an extended consultation
In addition APRA advised it also plans to release final guidance on managing the financial risks of climate change in addition to an Information Paper setting out APRArsquos framework for the use of macro-prudential policy tools
APRA also noted that several other policy releases originally scheduled for this 2021 have been deferred to 2022 including standards for operational resilience remuneration disclosure requirements interest rate risk in the banking book and offshore reinsurance
ASIC released an interim one year corporate plan refreshing its strategic priorities in response to the impact of COVID-19 The priorities for 2020ndash21 are
bull Protecting consumers from harm at a time of heightened vulnerability
bull Maintaining financial system resilience and integritybull Supporting Australian businesses to respond to the effects of
the COVID-19 pandemicbull Continuing to identify disrupt and deter the most harmful
conduct including through enforcement action bull Continuing to build our organisational capability in
challenging times
Capital ManagementAPRA provided guidance to all ADIs and Insurers on capital management to ensure entities can fulfil their role in supporting the economy which included
bull Regular stress testing to assess financial resilience in a range of scenarios including severe but plausible downturn conditions
bull Assurance on the capacity to continue to lend and underwrite insurance with the use of capital buffers to absorb the impacts of stress if needed
bull A rigorous approach to recovery planning to ensure readiness to initiate contingency measures and respond to conditions if required
bull Caution in capital distributions with an ongoing measured approach to dividends in this heightened risk environment
ConductRoyal Commission into Misconduct in the Banking Superannuation and Financial Services Industry (Royal Commission)On 12 November 2020 the Financial Sector Reform (Hayne Royal Commission Response) Bill 2020 was introduced into the House of Representatives implementing 21 of the 76 recommendations from the Royal Commission
The package of reforms implements a significant number of the Royal Commission recommendations and the additional commitments made by the Government to improve consumer protections and strengthen regulators This includes addressing conflicts between the interests of financial institutions and their customers ensuring customers are treated fairly in dealings with the financial sector and ensuring regulators have the powers and resources needed to be effective in their enforcement and supervision role
The Bill was passed on 10 December 2020
While the reforms apply across all financial services including superannuation and insurance and also impact the roles of APRA and ASIC the key impacts for BOQ are as follows
Legislation Start date
Substantial changes to mandatory breach reporting
1 October 2021
Expansion of the anti-hawking rules
5 October 2021
Introduction of a deferred sales model for add-on insurance
5 October 2021
Caps on commissions for add-on insurance
1 January 2021 (but no caps enacted at this stage)
Enforceable code provisions 1 January 2021 (but no codes prescribed as enforceable at this stage)
MANAGING THE EVOLVING RISK ENVIRONMENT
GOVERNANCE AND RISK MANAGEMENT
About BOQ 12 | Responding to COVID-19 14 | Acquisition of ME Bank 15 | Value Creation and Strategy 16
58 Bank of Queensland Limited and its Controlled Entities
Conduct (continued)Risk Governance Self-AssessmentBOQ is committed to continuous improvement in our risk governance practices During the year BOQ continued to advance our risk maturity and capabilities to manage non-financial risks in order to deliver sustainable improvement in risk management practices including enhancements to our key risk frameworks mechanisms to monitor maturity and risk appetite
Financial Accountability RegimeOn 16 July 2021 the Federal Treasury released exposure draft legislation to implement further recommendations of the Banking Superannuation and Financial Services Royal Commission including the Financial Accountability Regime (FAR) that will replace the current Banking Executive Accountability Regime (BEAR) applicable to ADIs
FAR imposes a strengthened responsibility and accountability framework within financial institutions absorbs the BEAR requirements and makes a number of changes including
bull Extension of the regime beyond the banking industry to include insurance and superannuation sectors
bull Introduction of new responsibilities including product dispute resolution customer remediation and breach reporting which will be allocated to senior executives
bull ASIC will join APRA as a co-regulator
Timeliness for implementation of the FAR forms part of the current consultation which BOQ continues to actively engage in and is committed to comply with the requirements of FAR
Regulatory oversight amp changeDesign and Distribution ObligationsThe Treasury Laws Amendment (Design and Distribution Obligations and Product Intervention Powers) Act 2019 (DDO) is an end-to-end approach to manage design and distribution of products DDO places responsibility on financial firms to ensure that products are designed and distributed to the appropriate class of customer This will be achieved by defining who the target market is for each product and then taking measures to ensure that only customers who fall within that target market are issued with that product (Target Market Definitions) The obligations will apply to all products within BOQ with the exception of business credit The DDO are broken into two separate categories lsquodesign obligationsrsquo and lsquodistribution obligationsrsquo The lsquodesign obligationsrsquo will belong to the product issuer and the lsquodistribution obligationsrsquo will belong to the product lsquodistributorrsquo In many cases BOQ will act as both product issuer and distributor In other cases broker and white label partners will be the distributors
DDO was implemented by the BOQ group prior to the 5 October 2021 deadline BOQ already has processes in place for managing the life cycle of its products which will be updated to include the new requirements introduced by DDO
New Regulatory Guide 271 ndash Internal Dispute ResolutionOn 30 July 2020 ASIC released the Regulatory Guide (RG) 271 on Internal Dispute Resolution (IDR) which seeks to raise the IDR standards across the financial sector The new RG makes parts of the IDR standards and requirements enforceable which will require an increased focus on complaints handling across the industry
The changes that will likely have the greatest operational impact include
bull The updated requirement to acknowledge complaints within 24 hours of receiving it
bull The new 30-day resolution timeframe for standard complaints reduced from 45 days
bull The heightened focus and new requirements for the early identification and investigation of systemic issues
bull The need to ensure that all the social media platforms owned or controlled by a firm will be monitored for complaint identification
The new RG comes into effect on 5 October 2021 the same go-live date as the DDO regime The effective and appropriate management of complaints continues to be a focus for BOQ and a regulatory change group will work towards effective implementation of this new RG
Consumer Data Right Bill (CDR) and Open BankingCDR is designed to give customers more control over their banking data and improve customersrsquo ability to compare and switch between products and services The Government has committed to implementing CDR in the banking energy and telecommunications sector For the banking sector this is referred to as ldquoOpen Bankingrdquo and is the first sector to apply the CDR
At BOQ the sharing of consumer reference data was due to take place by 1 July 2021 BOQ did not meet compliance by 1 July 2021 and has a rectification schedule in place to commence sharing consumer reference data later this year and to ensure compliance with the CDR regime more broadly
MANAGING THE EVOLVING RISK ENVIRONMENT (CONTINUED)
GOVERNANCE AND RISK MANAGEMENT
Financial Performance 20 | Governance and Risk Management 55 | Directorsrsquo Details 71
592021 Annual Report
Hawking of Financial ProductsThe new anti-hawking rules came into effect on 5 October 2021 and they expand the current anti-hawking regime applicable to general insurance by making it apply to all financial products (as defined in the Corporations Act) sold to a retail customer Credit products are not in-scope under the new rules
Broadly speaking the legislation prohibits an offer to issue or sell a financial product to a retail customer or invite the customer to ask for a product unless the contact occurs following a positive express request from the customer The prohibition applies to real-time contact which the customer does not expressly and positively request for example contact in-person in online chats and by phone The regime is not intended to apply to emails or other written correspondence where the customer is not expected to respond immediately Once the customer has made such a request regarding a financial product there is a period of 6 weeks in which to discuss the product and make an offer to the customer before the customer consentrequest is deemed expired
BOQ had a project team working to ensure compliance with the new hawking regime BOQ has provided training to employees to ensure compliance with the new rules and implemented a refreshed approach to providing insurance products to ensure only positive express requests from the customer are actioned
Breach ReportingThe legislation relating to breach reporting represents a substantial overhaul of the mandatory breach reporting regime
From 1 October 2021 BOQ has to report
a) Every breach of a civil penalty provision eg this would include every breach of the requirement to act efficiently honestly and fairly ndash no materiality threshold
b) Every breach of the misleading and deceptive conduct provisions ndash no materiality threshold
c) Every breach of a criminal penalty provisiond) Every breach that may result in material loss or damage to a
persons to whom BOQ provides financial servicese) Every investigation into a potentially reportable matter that
runs beyond 30 days including where the matter is deemed non-reportable after investigation
The breaches must be reported 30 calendar days from when BOQ knew or should have known about the issue
In addition there is what is being referred to as the ldquodobbing obligationsrdquo where BOQ has a duty to lodge a report with ASIC where there are reasonable ground to believe there is reportable conduct by a mortgage broker or financial advisor (in relation to complex financial products sold to retail customers)
BOQ had a project team working to ensure compliance with the new breach reporting regime BOQ has provided training to employees to ensure compliance with the new rules and implemented a refreshed approach including GRC Tool enhancements to breach reporting to ensure the regulatory requirements are achieved
Financial crimeAnti-Money Laundering and Counter Terrorism Financing ComplianceRecognising that banks play a vital role in preventing and detecting financial crime to protect Australiarsquos financial system from criminal exploitation BOQ continues to build its financial crime capability through technology people partnerships and a strong Anti-Money Laundering (AML)Counter Terrorism Financing (CTF) framework
BOQ continues to engage with Australian Transaction Reports and Analysis Centre (AUSTRAC) in relation to BOQrsquos AML CTF program and continues to enhance and strengthen its AMLCTF systems and controls following the closure of the findings by AUSTRAC post their onsite review in 2018 The deployment of a new platform for AMLCTF controls has enhanced BOQrsquos capability to prevent detect and mitigate financial crime risks across BOQ
Credit riskResponse to COVID-19BOQ worked swiftly and decisively with the Australian Banking Association (ABA) the Federal Government and regulators to establish the Banking Relief Package program for customers impacted by COVID-19 BOQ deployed 70 highly skilled individuals into the Customer Assistance Team dedicated to assisting customers impacted by COVID-19
Building upon the processes implemented in 2020 BOQ continues to monitor the credit quality of the portfolio to assess economic impacts due to COVID-19 particularly in light of the recent spike in cases causing the reintroduction of more severe restrictions and lockdowns BOQ has a number of credit models designed to assist in measuring the credit risk in the portfolio based on changing economic and environmental conditions
Further information on BOQrsquos response to COVID-19 can be found on page 14
MANAGING THE EVOLVING RISK ENVIRONMENT (CONTINUED)
GOVERNANCE AND RISK MANAGEMENT
About BOQ 12 | Responding to COVID-19 14 | Acquisition of ME Bank 15 | Value Creation and Strategy 16
60 Bank of Queensland Limited and its Controlled Entities
BOQ AND CLIMATE CHANGEClimate change is visibly impacting our customers our people our suppliers and society more broadly
We acknowledge these impacts and take action managing our climate related risks through scenario analysis consideration of outcomes into risk management and resilience activities reducing our footprint by becoming a carbon neutral organisation and tracking the impact of our lending activities
This year we elevated our climate scenario analysis that informs the resilience of our strategy by engaging with climate scientists and other relevant experts
Going forward we will continue to evolve our assessment of climate risks and its impact on our business This evolution includes further integration of the outcomes of stress testing and scenario analysis into BOQrsquos strategic response to climate related risks and opportunities and the activities needed to support our customers through the transition to a low carbon economy
We also see opportunity to influence the transition to a resilient low carbon economy by engaging with our customers and suppliers consistent with our purpose to create prosperity for our customers shareholders and people through empathy integrity and by making a difference
Climate risk positionBOQ accepts climate change is the product of human influence and supports the transition to a net zero carbon economy in alignment with the Paris Agreement to keep global warming well-below 2 degrees Celsius and striving to limit warming to 15 degrees Celsius The recent Intergovernmental Panel on Climate Change (IPCC) report reinforces the urgency for both governments and corporates to accelerate action to tackle climate change as warming caused by greenhouse gas emissions is increasing the rate of unprecedented disruption in every region across the world The impacts of climate change are increasingly shaping investment flows policy and consumer behaviour
Financial regulators including ASIC and APRA through their recent draft prudential guidance have continued to highlight climate-related risks as a potential source of financial risk to the future stability and resilience of the financial system As a distributor of capital we play a role in supporting the transition to a lower carbon economy through our direct consumption of resources and through our financing activities We are committed to advocating for and integrating strong climate change action into all facets of our organisation
GOVERNANCE AND RISK MANAGEMENT
Financial Performance 20 | Governance and Risk Management 55 | Directorsrsquo Details 71
612021 Annual Report
GovernanceThe Board and Risk Committee directly oversees BOQrsquos climate-related risks opportunities and strategies and are responsible for reviewing and approving respective climate-related objectives performance goals and targets Progress on climate change commitments and targets are reviewed by the Board on a quarterly basis through our Sustainability Balanced Scorecard Updates to policy regulatory and liability responses to climate change are reported to the Board and the Risk Committee on a regular basis as needed
The Board delegates the day to day management of environmental and social risks and opportunities including climate change to the Executive Team The Executive Team are accountable for BOQrsquos actions and commitments to embed climate change into BOQrsquos business strategy and risk management
The Sustainability Working Group (SWG) supports executive management with the development and implementation of climate initiatives and reporting requirements The SWG is made up of senior representatives across the Group who are involved in the day to day management of climate change and other sustainability matters SWG members are responsible for ensuring the leadership teams across the bank remain informed on climate related issues and our progress on climate change commitments and targets
Risk management Our processes for identifying and assessing climate-related risks are integrated into multi-disciplinary company-wide risk management activities with a focus on material credit and operational risks
We have updated our Risk Management Strategy (RMS) and Risk Appetite Statement (RAS) to specifically address climate and sustainability risk These policies set out the Boardrsquos expectations regarding the degree of risk that BOQ is prepared to accept The RMS and RAS are updated annually informed by workshops to validate and prioritise our approach to climate change risks This process is supported by scenario analysis and external climate consultants and scientists
Scenario analysis is used to inform potential future exposure to material climate risks and opportunities across business units and locations This provides insight into where climate change mitigation and adaptation could be incorporated into our strategy to support our customers as well as to capture commercial opportunities and ensure our business operations are resilient
The management of climate change is embedded in our business through credit policies overseen by the Executive Credit Committee such as the Ecological Care and Sustainability Lending Policy to assess potential environmental implications to credit risk Credit risk operational activities are assessed at a portfolio level as well as at an individual credit exposure level on a case-by-case basis Property valuations take into account factors such as flooding and environmental risk including insurance impacts in estimating the value of properties which BOQ uses as a basis for determining an appropriate level of lending to be extended relative to that property value The climate scenario analysis is undertaken at the portfolio level
We are also continually monitoring trends concerns publications and actions that emerge from regulators and investors through structured engagement and industry forums
This allows BOQ to keep abreast of changes to climate-related risks including compliance with any legislative or regulatory obligations We are continuing to evolve how we assess climate risk and its impact on our business which will include the development of a Climate Change Risk Management Framework
BOQ AND CLIMATE CHANGE (CONTINUED)
Board
Risk Committee
Executive Team
Sustainability Working Group
The board is responsible for oversight of the Grouprsquos approach to and management of climate change
Oversight of management of climate-related risks
Ultimately responsible for embedding climate change into the Grouprsquos risk management and business strategy
Supports Executive Team with development and implementation of climate initiatives
and reporting requirements
GOVERNANCE AND RISK MANAGEMENT
About BOQ 12 | Responding to COVID-19 14 | Acquisition of ME Bank 15 | Value Creation and Strategy 16
62 Bank of Queensland Limited and its Controlled Entities
Strategy BOQ is committed to supporting Australia and our customers to transition to a low carbon and climate-resilient economy Our approach to climate change is informed by prioritised risks and opportunities This has led to an initial set of commitments covering BOQrsquos operations and includes achieving carbon neutrality and sourcing 100 per cent renewable energy
This year we have increased the sophistication of our climate scenario analysis by engaging with climate scientists and relevant experts to better understand the potential financial-related impacts of key risks and opportunities delivering on our prior year commitment
With a focus on credit liquidity market and operational risks we have prioritised the below climate risks and opportunities over the short term (0-5 years) medium term (10 years) and long term (20+ years) informing areas required for further climate scenario analysis
BOQ AND CLIMATE CHANGE (CONTINUED)
Climate Risks (R) Opportunities (O) Timeframe Potential impacts on BOQ customers and BOQ
Physical
Acute
bull Decline in value of assets due to impact bull Rise in insurance premiums or inability to obtain insurancebull Business disruption bull Devaluation of collateral bull Increased expenses bull Reduced profitability bull Increased arrears hardship and impairments
R amp OExtreme weather events including flooding associated with extreme rain cyclones storms and bushfires
Short to long term
Chronic
RLong-term weather changes such as rising temperatures sea level rise and drought
Long term
Transition
Policy
R Government climate policies (eg carbon taxes and cross border tariffs)
Short to medium term
bull Reduced market competitiveness bull Increased operating costs complexity bull Increased credit risk
R Increased climate regulation for financial institutions Short term bull Enhanced reporting and compliance obligations
Technology
R amp OTransition to renewable energy lower emissions technology and electrification
Short to medium term
bull Increased decreased costs bull Increased decreased profitability bull Obsolete assetsbull Increased decreased credit risk
Market
R Disruption of carbon intensive industries and associated value chains
Short to medium term
bull Obsolete assets bull Devaluation of collateral bull Increased arrears hardship and impairments
O Growth of low carbon sectors Short to long term bull Increased profitabilitybull Reduced carbon intensity of loan book
R amp O Shift in demand for services and products
Short to medium term
bull Increase decrease of customers and income bull Increased costs complexity from new products
Reputation
R amp O Increased climate risk focus from investors
Short to medium term bull Increased decreased cost of capital
R amp O Alignment with customer and employee values on climate change
Short to medium term
bull Higher productivity increased ability to retain and attract talent bull Increase decrease of customers and income
Liability
RIncreased stakeholder activism litigation against organisations demonstrating insufficient climate action
Short to medium term
bull Business disruption increased costs bull Director liability bull Reputational damage
GOVERNANCE AND RISK MANAGEMENT
Financial Performance 20 | Governance and Risk Management 55 | Directorsrsquo Details 71
632021 Annual Report
Climate scenario analysisIn FY21 we expanded our scenario analyses of climate risks to include physical risks from climate extremes to BOQrsquos residential lending portfolios across (including ME Bank) and the BOQ Business property and construction portfolios
We also enhanced our transition risk analysis of commercial lending and asset finance and leasing across BOQ BOQ Finance and BOQ Specialist to assess risks and opportunities from disruption of carbon intensive sectors and growth of low carbon sectors
The scenario analysis evaluated the impact of both physical and transition risk to BOQ in line with the latest industry guidance and best practice utilising reference scenarios sourced from global sources including
bull IPCC to describe plausible physical climate futures resulting from global Representative Concentration Pathway (RCPs) andbull Network for Greening the Financial System (NGFS) transition pathway scenarios to assess the impact of climate-related transition risks
Physical Risk Transition Risk amp Opportunities
Climate Extremes Growth of low carbon sectors or disruption of carbon intensive sectors
Businesses and portfolios
Residential portfolio across all BOQ brands
BOQB property and construction portfolio
Commercial lending and asset finance and leasing across BOQ BOQF and BOQS
Risks Assessed Extreme heat
Extreme rain
Very high fire days
Cyclones and east coast lows
Extreme sea level events
Chronic temperature and sea level rise
Change in exposure to transition risk estimated as the additional costs upon a sector as a result of its direct and indirect emissions from a carbon price under the relevant scenario
Approach BOQrsquos portfolio was mapped on a postcode scale nationally(1) These locations were overlayed with multi-model averaged future climate change projections from publicly available regional (5 km scale) and global (~100 km scale) climate model datasets and peer reviewed literature
Using downscaled Australian-level data from global NGFS models in addition to Australian statistics regarding emissions and industry value added Calculated the change in sectoral emissions and additional costs upon a sector as a result of its direct and indirect emissions from a carbon price(2) under different scenarios BOQrsquos financial sectoral exposure is overlaid to infer the implications for the bank The composition of sectoral exposure was held constant for the purposes of the analysis
Timeframe 2030 2050 2030 2040 2050
Reference scenarios
Strong climate action (RCP45)
No global climate action (RCP85)
NGFS
Orderly - Below 2degC ndash (2degC aligned) - Net Zero 2050 - (15degC aligned)
Disorderly - Delayed Transition - (2degC aligned) - Divergent Net Zero - (15degC aligned)
Metrics considered
Number of days over 35degC annually
1-in-20yr wettest day rainfall
Number of days annually where the Forest Fire Danger Index exceeds 25 (very high rating)
Cyclone intensity frequency and land rainfall rate
1-in-100yr Extreme sea level events
Industry value added
Sectoral emissions
Carbon price
(1) Assessment includes 85 of BOQrsquos total credit risk (2) Scenario analysis process uses a carbon price as a representation of a suite of policies and regulations which may or may not be purely financial
BOQ AND CLIMATE CHANGE (CONTINUED)
GOVERNANCE AND RISK MANAGEMENT
About BOQ 12 | Responding to COVID-19 14 | Acquisition of ME Bank 15 | Value Creation and Strategy 16
64 Bank of Queensland Limited and its Controlled Entities
Climate scenario analysis (continued)Physical risk scenario analysis insightsProlonged exposure to hotter temperatures and extreme temperature events such as widespread drought and heatwaves extreme rainfall events and rising sea levels can damage property and reduce health and liveability Severe weather and long-term changing weather patterns may reduce collateral values thereby increasing credit risk via a higher loss given default or result in loss of asset values and increase volatility Moreover macroeconomic shocks may increase liquidity risk It is expected there will be future changes in physical climate hazards (extreme rain heat fire and sea level events) across BOQrsquos residential and construction portfolio assets
Figure 1 shows the concentration of assessed collateral by postcode The highest concentration of collateral is located on the north to south-east QLD coast central and south-east NSW coast and metropolitan Victoria While the ME Bank has diversified the geographic spread of BOQ all states in the portfolio are at risk to increasing frequency of one or more climate hazards
BOQ AND CLIMATE CHANGE (CONTINUED)
Figure 1 Concentration of BOQrsquos Portfolio
Low High
QLD - 33
NSW - 25
ACT - 4
VIC - 22
TAS - 2
SA - 3
WA - 11
NT - 1
GOVERNANCE AND RISK MANAGEMENT
Financial Performance 20 | Governance and Risk Management 55 | Directorsrsquo Details 71
652021 Annual Report
Climate scenario analysis (continued)Physical risk scenario analysis insights (continued)Scenario analysis found increases in extreme rain are likely to be experienced across Australia Changes are non-uniformly distributed across time and spatially Figure 2 shows the projected future change in the intensity of the 1-in-20 year extreme rainfall across BOQrsquos portfolio under a strong climate action (RCP45) and no global climate action (RCP85) scenario
By 2030 under RCP85 the annual average temperature in Australia is projected to increase by 06-13degC above the mean temperature and extreme heat risk similarly increases Extreme heat conditions can disrupt construction labour and change soil structure The scenario analysis found that the BOQB property and construction portfolio is projected to experience at least 7 additional hot days over 25degC annually across inland NT SA WA NSW and QLD portfolios
A warmer and drier climate provides favourable conditions for increases in bushfire risk Models project that under RCP85 in 2030 the majority of the NT SA and WA portfolios will experience at least an additional 6 days of very high fire danger (Figure 3)
Our strategy and risk management framework has controls in place to ensure we appropriately manage physical risks An important mechanism in ensuring our exposure to physical climate risk remains low is our customers maintaining insurance protection in accordance with their lending contracts
In the longer term insurance affordability or inability to insure will need to be tracked in addition to enhanced consideration of potential flood and other hazards at loan origination
Figure 3 Future change in very high fire days annually compared to (1986-2005)
0 Days gt 30 Days
2030 2050RCP45
2030 2050RCP85
Figure 2 Future change in the 1-in-20yr extreme rainfall in 2030 compared to (1986-2005)
30mm decrease
100mm increase
2030 2050RCP45
2030 2050RCP85
BOQ AND CLIMATE CHANGE (CONTINUED)
GOVERNANCE AND RISK MANAGEMENT
About BOQ 12 | Responding to COVID-19 14 | Acquisition of ME Bank 15 | Value Creation and Strategy 16
66 Bank of Queensland Limited and its Controlled Entities
Climate scenario analysis (continued)Transition risk scenario analysis insightsSome sectors are likely to face significant challenges because of their current high emissions intensity and the rapid rate of decarbonisation needed under low emissions scenarios BOQrsquos lending portfolio has no exposure to fossil fuel power generation and minimal direct exposure to fossil fuels extraction
BOQrsquos business lending portfolios have minimal exposure to sectors with greater than 50 per cent of exposure to transition risk under the most ambitious disorderly decarbonisation scenario
Sectors contributing to the provision of clean energy are expected to thrive under the scenarios Opportunity sectors exist in industries aligned with BOQrsquos portfolio including agri-tech bioenergy critical minerals and carbon forestry
More than 70 per cent of BOQrsquos business lending portfolio is exposed to sectors with a minimal impact (lt10 per cent of sectoral exposure) from the additional costs expected to be incurred during a transition to net zero emissions under both orderly and disorderly 15˚C and 20˚C scenarios at 2030 2040 and 2050
Industries including agriculture non-metallic mineral product manufacturing and waste collection and disposal services are likely to face transition challenges despite their products remaining in demand BOQrsquos behavioural loan term for these sectors is generally short providing an opportunity to re-assess and support our customerrsquos transition at renewal points
Future scenario analysis The results from our scenario analysis work inform where to best prioritise mitigation and adaptation options whilst simultaneously harnessing the opportunities identified The focus of our scenario analysis will evolve as our understanding of the impact of climate risks and opportunities on ourselves and our customers matures
Climate risk scenario analysis and climate vulnerability analysis is a developing area and BOQrsquos approach will evolve and mature over time
Areas for further refinement include enhancing our understanding of the interaction between physical climate risks property damage and the resilience of construction and insurance including underinsurance and noninsurance and subsequent impacts on credit stress testing
We also see opportunity to continue to collaborate with broader industry groups to ensure the best outcomes for our customers and communities
BOQ AND CLIMATE CHANGE (CONTINUED)BOQ AND CLIMATE CHANGE (CONTINUED)
BOQrsquoS BUSINESS LENDING (1) PORTFOLIO EXPOSURE TO TRANSITION RISK UNDER AN ORDERLY 2degC SCENARIO
Sectors Current Portfolio Sector Exposure due to transition to low carbon economy under orderly 2ordmC Scenario
$m 2030 2040 2050
Professional Services and Real Estate 4850 31 0 0 0
Accommodation and Health Services 3617 23 1 1 1
Construction 2003 13 1 1 1
Agriculture 1232 8 25 25 23
Manufacturing and Mining 779 5 5 5 4
Transport 843 5 4 4 4
Other 2509 16 1 1 1
Total 15833 100
(1) Includes commercial and asset financing from BOQB BOQS and BOQF
The table above shows sectors exposure due to the transition to a low carbon economy under an orderly 2˚C scenario and our proportionate credit exposures in our business lending portfolio Under an orderly 2˚C scenario BOQrsquos portfolio has low exposure to high emitting sectors The projected risk identified may not necessarily be realised for all customers within the sector Customer level impacts will likely be realised based on unique exposures from geography asset type diversity and operations of business models therein
GOVERNANCE AND RISK MANAGEMENT
Financial Performance 20 | Governance and Risk Management 55 | Directorsrsquo Details 71
672021 Annual Report
Healthcare
Agriculture
Other
Residential MortgagesProfessional Services
Manufacturing amp Mining
Property amp ConstructionHospitality and Accommodation
Transport
BOQ Group Lending
of emissions by sector (1)
2714
5
9
4
27
4
8
3
Targets amp Metrics Industry exposuresThe table below outlines the proportionate credit exposures of lending activities
The acquisition of ME Bank has significantly shifted proportional exposures to residential lending This shift highlights the need for continued enhancement of data and risk management processes to help pinpoint risks and impacts such as improving our geo-locational data mapping to better understand potential physical impacts and increasing our understanding of which mortgage customers may be exposed to high risk industries
Financed emissionsBOQ recognises that measuring financed emissions is an important consideration in managing climate related risks and opportunities
In FY21 the carbon intensity of the loan (3) book was 025kg of CO2-e per $1 loaned a reduction of 19 per cent(4) largely driven by the shift in portfolio mix from the increase in residential exposures resulting from the integration of ME Bank and improvements in the method to estimate residential lending emissions
Residential and commercial property makes up 86 per cent of our credit risk exposure and comprises 54 per cent of the carbon emissions from our lending portfolio as at August 2021
BOQ AND CLIMATE CHANGE (CONTINUED)
Credit Risk FY21 FY20
Sector $m of Total Exposure $m
of Total Exposure
Residential Mortgages 59053 785 31155 669
Property amp Construction 5627 75 5046 108
Healthcare 3017 40 3305 71
Professional Services 1453 19 1272 27
Agriculture 1232 16 1105 24
Transportation 843 11 750 16
Manufacturing amp Mining 779 10 788 17
Hospitality amp Accommodation 622 08 618 13
Other 2598 35 2522 54
Total (1) 75244 1000 46560 1000
Per Balance Sheet (2) 75748 47043
(1) Due to rounding numbers presented may not add up to the totals provided(2) This includes unearned income reallocated in Credit Risk and the balance of credit cards overdrafts and personal loans(3) Financed emissions calculations include estimates greenhouse gas emissions associated with residential mortgages commercial loans and asset financing(4) The FY20 carbon intensity of the loan book has been revised to 031 kg of CO2-e per $1 loaned
GOVERNANCE AND RISK MANAGEMENT
About BOQ 12 | Responding to COVID-19 14 | Acquisition of ME Bank 15 | Value Creation and Strategy 16
68 Bank of Queensland Limited and its Controlled Entities
Targets amp Metrics (continued) Operational Greenhouse Gas FootprintIn FY21 we have met our ambition to be carbon neutral across our operations By becoming a carbon neutral organisation we have achieved a balance between the greenhouse gas emissions associated with running our business and the emission reduction activities we support
We have looked to reduce emissions associated with fuel and electricity consumption and emissions in the BOQ supply chain including embodied emissions from data centres IT software and hardware office equipment furniture legal amp insurance and consultants supporting BOQ strategy and head office operations The reduction in greenhouse gas emissions between FY20 and FY21 has been largely driven by a combination of transient COVID-19 related savings (lowering consumption of electricity and reducing staff commuting) and lower indirect supply chain related emissions
BOQ will reduce operational emissions through our commitment to purchase 100 per cent of our operational electricity from renewable sources by 2025 exploration of low emissions fleet options and implementation of a Supplier Code of Conduct that allows for climate engagement While we work towards minimising our footprint BOQ supports accredited projects that reduce emissions and produce verified offsets More details of the offsets our use of offsets can be found in our FY21 Sustainability Report on page 20
Greenhouse gas emissions (tCO2-e) (1) FY21 FY20 Change
Scope 1 248 252 (2)
Scope 2 4521 5007 (10)
Scope 3 29702 36944 (20)
Total 34470 42203 (18)
Climate related targetsBOQ is committed to cease funding equipment directly involved in the extraction of fossil fuels by 2024 As at 31 August 2021 our exposure to this industry was $127 million representing 001 per cent of lending
In FY21 we have taken action by becoming a carbon neutral organisation and joining the Australia Government Climate Active certification programme The BOQ certification includes operations and supply chain contribution from BOQ Retail (including branches) Virgin Money Australia BOQ Business and BOQ Finance and BOQ Specialist ME Bank has a separate Climate Active certification The BOQ and ME Bank certifications will be integrated in 2022
We are well progressed with our commitment to source 100 per cent of our operational electricity from renewable sources by 2025 The Sustainability Working Group has endorsed the Renewable Energy Strategy and by the end of FY22 BOQ intends to operate its major Brisbane Sydney and Melbourne support centres on renewable electricity
BOQ AND CLIMATE CHANGE (CONTINUED)
(1) Emissions estimates are calculated in accordance with the GHG Protocol using the factors consistent with Climate Active carbon neutral program Emission estimates exclude ME Bank BOQ and ME Bank emission estimates will be integrated in 2022
Scope 1 includes direct emissions from transport fleet Scope 2 includes electricity purchased Scope 3 includes purchased goods and services capital goods fuel and energy-related emissions from fuel extraction waste generated in operations business travel employee commuting and working from home Due to rounding numbers presented may not add up to the totals provided
GOVERNANCE AND RISK MANAGEMENT
Financial Performance 20 | Governance and Risk Management 55 | Directorsrsquo Details 71
692021 Annual Report
OUR APPROACH TO CORPORATE GOVERNANCEBOQ continues to focus on enhancing our governance and risk management practices to meet the expectations of our stakeholders Further details on our Corporate Governance policies and practices are set out in our Corporate Governance Statement which has been prepared in accordance with the ASX Corporate Governance Councilrsquos Corporate Governance Principles amp Recommendations (4th edition) The FY21 Corporate Governance Statement can be viewed at boqcomau2021
Corporate governance frameworkBOQrsquos Board is responsible for setting the strategy and risk appetite of the Bank and for leading the culture and values for our people The Corporate Governance framework sets out how the Board delegates to Management and provides oversight and governance of key decisions
Board Reserved Powers and Delegation of Authority Policy
Chief Executive Officer
BOQ Board
Shareholders
Group Executive Committee
Investment Committee
Audit Committee
Nomination amp Governance Committee
Risk Committee
People Culture amp
Remuneration Committee
Transformation amp Technology Committee
(Previously known as Information Technology
Committee)
Leadership amp talentbull Focused on an uplift in leadership amp talent
to drive our successbull Oversight of programs to enhance
the calibre of the leadership team and our people including development and retention
6
1 Customer experience oversightbull Continue to improve the
customer experience and delight our customers every day
bull Focus on the customer voice in all Board decisions
2 Strategybull Ensuring a clear strategy is in place with
disciplined executionbull Successful ME Bank acquisition
strategically alignedbull Reimagining our long term vision and new
options for growth
3 Culturebull Cultural transformation underway with
purpose and values of empathy integrity and making a difference being embedded
bull Improving employee engagement empowerment and accountability
4 Building a Sustainable business bull Achieved carbon neutral certificationbull Key sustainability targets incorporated
in risk management framework
5 Digital transformationbull Commitment to a three-year technology
uplift program (supported by the November ndash December 2019 capital raise)
bull Focus on (1) the modernisation of infrastructure (2) moving to a cloud based digital banking platform and (3) automating processes
bull By FY23 we aim to have implemented c$90 million of productivity benefits
7 Business Performance Oversightbull Continuous improvement in our financial
performance growing EPS and ROEbull Delivering against our
transformation programbull Pathway to delivering a scalable operating
model lowering our cost to income ratio
8 Financial amp non-financial risk oversightbull Strengthening amp embedding our risk culturebull Management of the business within our
risk framework with optimal growthbull Regulatory compliance
9 Capital managementbull Prudent capital management to protect
deposit holders debt security holders and shareholder interests
bull ME Bank acquisition successfully funded via a $135 billion capital raising
10 Future-Fit Boardbull Board composition reviewed with Board
renewal program to be complete by the 2021 AGM
bull Board refresh focused on building a diverse and contemporary Board with the appropriate mix of skills high emotional intelligence and intellectual curiosity
bull Strong presence in the business with increased interactions with key stakeholders including our people regulators and investors
Board areas of focusDuring FY21 the Board and its Committees have focused on 10 key strategic governance and oversight activities
GOVERNANCE AND RISK MANAGEMENT
About BOQ 12 | Responding to COVID-19 14 | Acquisition of ME Bank 15 | Value Creation and Strategy 16
70 Bank of Queensland Limited and its Controlled Entities
For the year ended 31 August 2021
BOARD OF DIRECTORS
Patrick Allaway BA LLB
Independent non-executive director since May 2019 Chairman since October 2019 Chair Investment Committee and Nomination amp Governance Committee Member Transformation amp Technology People Culture amp Remuneration Audit and Risk Committees
John Lorimer B Com
Independent non-executive director since January 2016 Member Transformation amp Technology Risk People Culture amp Remuneration Audit and Nomination amp Governance Committees
George Frazis B Eng (Hons) MBA
Managing Director and Chief Executive Officer since September 2019
Independent non-executive director since September 2016 Chair People Culture amp Remuneration Committee Member Audit Risk Transformation amp Technology Investment and Nomination amp Governance Committees
Warwick Negus B Bus M Com SF Fin
Karen Penrose B Com CPA FAICD
Independent non-executive director since November 2015 Chair Audit Committee Member People Culture amp Remuneration Risk Transformation amp Technology Investment and Nomination amp Governance Committees
Bruce Carter B Econ MBA FAICD FICA
Independent non-executive director since February 2014 Chairman Risk Committee Member Audit Transformation amp Technology Investment People Culture amp Remuneration and Nomination amp Governance Committees
Mickie Rosen BA Economics MBA
Independent non-executive director since March 2021 Chair Transformation amp Technology Member Risk People Culture amp Remuneration Audit and Nomination amp Governance Committees
Independent non-executive director since August 2021 Member Transformation amp Technology Risk People Culture amp Remuneration Audit and Nomination amp Governance Committees
Deborah Kiers B Sc (Hons) MPA MAICD
DIRECTORSrsquo DETAILS
Financial Performance 20 | Governance and Risk Management 55 | Directorsrsquo Details 71
712021 Annual Report
For the year ended 31 August 2021
The Directors present their report together with the financial report of Bank of Queensland Limited (the Bank or BOQ) and of the Consolidated Entity (or the Group) being the Bank and its controlled entities for the year ended 31 August 2021 and the independent auditorrsquos report thereon
The Directors of the Bank at any time during or since the end of the financial year are
Name qualifications amp independence status Experience special responsibilities and other Directorships
Patrick AllawayBALLB
Chairman
Mr Allaway was appointed as a Non-Executive Director of the Bank in May 2019 and was appointed Chairman on 18 October 2019
Mr Allaway has extensive senior executive non-executive and corporate advisory experience across the financial services property media and retail sectors
Mr Allawayrsquos executive career was in financial services with Citibank and Swiss Bank Corporation (now UBS) working in Sydney New York Zurich and London Mr Allaway was Managing Director SBC Capital Markets amp Treasury with direct responsibility for a global business
Mr Allaway brings over 30 years of experience in financial services across financial markets capital markets and corporate advisory This included an advisory role in the media sector responding to considerable digital disruption
Mr Allaway has over 15 years Non-Executive Director experience and was formerly a Non-Executive Director of Macquarie Goodman Industrial Trust Metcash Limited Fairfax Media Woolworths South Africa David Jones Country Road Group and Nine Entertainment Co Mr Allaway chaired the Audit amp Risk Committees for Metcash David Jones and Country Road Group
Mr Allaway is currently a Non-Executive Director of Allianz Australia and Dexus Funds Management Limited and a member of the Adobe International Advisory Board He chairs BOQrsquos Investment and Nomination amp Governance Committees and is member of the People Culture amp Remuneration Transformation amp Technology Audit and Risk Committees
George FrazisB Eng (Hons) MBA
Managing Director amp Chief Executive Officer
Mr Frazis joined BOQ as Managing Director and CEO in September 2019 and has over 26 years of corporate experience
Mr Frazis has a long history in Banking and Finance having worked in the industry for the past 17 years Most recently he was Chief Executive of Westpac Grouprsquos Consumer Bank Prior to that Mr Frazis was CEO St George Banking Group and Chief Executive Westpac New Zealand Limited
Mr Frazis has held senior executive roles at National Australia Bank Commonwealth Bank of Australia as well as Air New Zealand He started his career as an officer in the Royal Australian Air Force
DIRECTORSrsquo DETAILS
About BOQ 12 | Responding to COVID-19 14 | Acquisition of ME Bank 15 | Value Creation and Strategy 16
72 Bank of Queensland Limited and its Controlled Entities
For the year ended 31 August 2021
Name qualifications amp independence status Experience special responsibilities and other Directorships
Bruce Carter B Econ MBA FAICD FICA
Non-Executive Independent Director
Mr Carter was appointed a Non-Executive Director of BOQ on 27 February 2014
Mr Carter was a founding Managing Partner of Ferrier Hodgson South Australia a corporate advisory and restructuring business and has worked across a number of industries and sectors in the public and private sectors He has been involved with a number of state government-appointed restructures and reviews including chairing a task force to oversee the governmentrsquos involvement in major resource and mining infrastructure projects Mr Carter had a central role in a number of key government economic papers including the Economic Statement on South Australian Prospects for Growth the Sustainable Budget Commission and the Prime Ministerrsquos 2012 GST Distribution Review
Mr Carter has worked with all the major financial institutions in Australia Before Ferrier Hodgson Mr Carter was at Ernst amp Young for 14 years including four years as Partner in Adelaide During his time at Ernst amp Young he worked across the London Hong Kong Toronto and New York offices Mr Carter is the Chair of the Australian Submarine Corporation Aventus Capital Limited and One Rail Australia Boards and a Non-Executive Director of Crown Resorts Limited AIG Australia Limited and Sage Group Holdings Limited
Mr Carter is Chair of the Risk Committee and a member of the Audit Transformation amp Technology Investment People Culture amp Remuneration and Nomination amp Governance Committees
Deborah KiersBSc (Hons) MPA MAICD
Non-Executive Independent Director
Ms Kiers was appointed as a Non-Executive Director of the Bank on 5 August 2021
Ms Kiers previously acted as a Director of ME Bank since July 2020 and acted as Chair of the ME Bank Boardrsquos People and Culture sub-committee and as a member of the Risk and Compliance Committee
Ms Kiers brings over 30 years of strategic advisory and consulting experience to boards and executive management teams across a wide range of industries including Financial Services Energy and Resources Industrials Property Infrastructure and Regulated Utilities both in Australia and internationally
As Managing Director of JMW Consultants (Asia Pacific) Ms Kiersrsquos support for companies included strategic advice business model transformations MampA integration leadership transition and development for CEOs executive teams and board directors as well as building synergies between culture performance and remuneration strategies
Ms Kiers is currently a Non-Executive Director for IFM Investors and holds the position of Chair of the IFM Board Responsible Investment and Sustainability Committee and is a member of the Board Audit and Risk Committee Ms Kiers is also a Non-Executive Director of the Tiverton Agriculture Impact Fund
Ms Kiers is a member of the Audit Risk Nomination amp Governance People Culture and Remuneration and Transformation amp Technology Committees
John LorimerB Com
Non-Executive Independent Director
Mr Lorimer was appointed a Non-Executive Director of BOQ on 29 January 2016
Mr Lorimer has spent more than 30 years in financial services and held executive roles in Australia Asia and Europe Mr Lorimerrsquos most recent executive roles were in the United Kingdom where he was Group Head of Finance and then Group Head of Regulatory Risk and Compliance for Standard Chartered Bank He also held a number of management positions in the retail bank of Citigroup and served as the Chairman of CAF Bank Limited (a subsidiary of Charities Aid Foundation based in the United Kingdom) In addition Mr Lorimer was a Non-Executive Director of Aberdeen New Dawn Investment Trust plc and International Personal Finance plc
Currently Mr Lorimer is a Non-Executive Director of Bupa Australia Pty Ltd and Bupa Aged Care Holdings Pty Ltd and is Chairman of Bupa (Asia) Ltd
Mr Lorimer a member of BOQrsquos Transformation amp Technology Risk People Culture amp Remuneration Audit and Nomination amp Governance Committees
DIRECTORSrsquo DETAILS
Financial Performance 20 | Governance and Risk Management 55 | Directorsrsquo Details 71
732021 Annual Report
For the year ended 31 August 2021
Name qualifications amp independence status Experience special responsibilities and other Directorships
Warwick NegusB Bus M Com SF Fin
Non-Executive Independent Director
Mr Negus was appointed a Non-Executive Director of BOQ on 22 September 2016
Mr Negus brings more than 30 years of finance industry experience in Asia Europe and Australia His most recent executive roles include Chief Executive Officer of 452 Capital Chief Executive Officer of Colonial First State Global Asset Management and Goldman Sachs Managing Director in Australia London and Singapore He was also a Vice President of Bankers Trust Australia and a Director of the University of NSW (UNSW) Foundation and FINSIA
Mr Negus is Chair of Pengana Capital Group and a Non-Executive Director of Washington H Soul Pattinson amp Co Ltd Dexus Funds Management Limited Virgin Australia Holdings Pty Ltd and Terrace Tower Group He is a member of the Council of UNSW and Chair of UNSW Global Limited
Mr Negus is Chair of the People Culture amp Remuneration Committee and a member of the Audit Risk Transformation amp Technology Investment and Nomination amp Governance Committees
Karen PenroseB Com CPA FAICD
Non-Executive Independent Director
Ms Penrose was appointed a Non-Executive Director of BOQ on 26 November 2015
Ms Penrose is an experienced non-executive director and banker As a banker Ms Penrose has 20 years of experience leading businesses within Commonwealth Bank of Australia and HSBC and over ten years in accounting and finance roles Ms Penrose has particular expertise in the financial services health property resources and energy sectors Ms Penrose is a Non-Executive Director of Vicinity Centres Limited Ramsay Health Care Limited Estia Health Limited and Rugby Australia Limited Ms Penrose was formerly a Non-Executive Director of AWE Limited Spark Infrastructure Group Landcom and Future Generation Global Investment Company Limited She is a member of Chief Executive Women
Ms Penrose is Chair of the Audit Committee and is a member of the People Culture amp Remuneration Risk Transformation amp Technology Investment and Nomination amp Governance Committees
Mickie RosenBA Economics MBA
Non-Executive Independent Director
Ms Rosen was appointed a Non-Executive Director of BOQ on 4 March 2021
Ms Rosen has three decades of strategy operating advisory and board experience across media technology and e-commerce She has built and led global businesses for iconic brands such as Yahoo Fox and Disney as well as early-stage companies including Hulu and Fandango
Ms Rosen is also a Non-Executive Director of Nine Entertainment Co and Ascendant Digital Acquisition Company in the United States Until recently Ms Rosen served on the board of Pandora Media and was the President of Tribune Interactive the digital arm of Tribune Publishing and was concurrently the President of the Los Angeles Times Ms Rosen commenced her career with McKinsey amp Company is based on the West Coast of the United States and holds an MBA from Harvard Business School
Ms Rosen currently chairs the Transformation amp Technology Committee and is a member of the Risk People Culture amp Remuneration Audit and Nomination amp Governance Committees
DIRECTORSrsquo DETAILS
About BOQ 12 | Responding to COVID-19 14 | Acquisition of ME Bank 15 | Value Creation and Strategy 16
74 Bank of Queensland Limited and its Controlled Entities
For the year ended 31 August 2021
Company Secretaries
Fiona DalyLLB LLM AGIA ACG MAICD
Ms Daly joined BOQ in October 2018 and was appointed joint company secretary on 30 April 2019 Ms Daly commenced her career as a corporate lawyer at Phillips Fox (now DLA Piper) before joining Allens Prior to working for BOQ Ms Daly held senior legal and regulatory roles including as senior legal counsel global regulatory affairs manager and joint company secretary at Energy Developments an international energy company
Nicholas AlltonLLB LLM GAICD
Mr Allton joined BOQ as Group General Counsel and Company Secretary on 1 February 2021 Nicholas has more than 27 yearsrsquo experience across Financial Services including 11 years in private practice for top-tier Australian English and US firms Prior to joining BOQ Nicholas held the role of Group General Counsel and Company Secretary at MLC and spent 15 years working across a number of senior roles within the Macquarie Group
Directorsrsquo MeetingsThe number of meetings of the Bankrsquos Directors (including meetings of Committees of Directors) and the number of meetings attended by each Director during the financial year were
Board of Directors
Board of Directors - St Andrews
Risk Committee
Audit Committee
Nomination amp Governance Committee
People Culture amp
Remuneration Committee - BOQ amp St
Andrews
Transformation amp Technology Committee (1)
Investment Committee
Due Diligence
Committee
Tenure as at 31 August
2021
Patrick Allaway 2121 66 88 22 66 55 22 1414 2 years
4 months
George Frazis 2121 2 years
Bruce Carter 2021 66 88 22 66 55 22 1314 7 years
6 months
Deborah Kiers (2) 11 00 11 00 00 11 1 month
John Lorimer 2121 66 88 22 66 55 5 years
7 months
Warwick Negus 2021 66 88 22 66 55 22 1414 4 years 11
months
Karen Penrose 2121 99 66 88 22 66 55 22 1414 5 years 9
months
Mickie Rosen (3) 66 33 44 11 22 33 6 months
Kathleen Bailey-Lord (4)
2020 66 77 22 66 44 2 years 3 months
Michelle Tredenick (5) 66 23 34 11 44 22 9 years 9
months
(1) Information Technology Committee changed its name to Transformation amp Technology Committee effective 26 November 2020(2) Deborah Kiers appointed as a Director on 5 August 2021(3) Mickie Rosen appointed as a Director on 4 March 2021(4) Kathleen Bailey-Lord ceased as a Director on 5 August 2021(5) Michelle Tredenick ceased as a Director on 8 December 2020
DIRECTORSrsquo DETAILS
Financial Performance 20 | Governance and Risk Management 55 | Directorsrsquo Details 71
752021 Annual Report
CONTENTS
78 Section 1 Remuneration Snapshot
80 Section 2 Key Management Personnel (KMP)
81 Section 3 Remuneration Outcomes
88 Section 4 Remuneration Strategy and Structure
90 Section 5 Remuneration Governance
94 Section 6 Non-Executive Director (NED) Remuneration
95 Section 7 Statutory Tables
Dear Shareholder
IntroductionAt BOQ our ambition is to be known as the bold challenger bank with multi-brands that are digitally enabled with a personal touch Achieving this ambition is dependent on the successful delivery of our strategy which is dependent on our people culture and remuneration settings
On behalf of the Board I am delighted to present the Remuneration Report for the period 1 September 2020 to 31 August 2021 (FY21) and share with you our progress and achievements against our people amp culture and organisational strategies
FY21 performance FY21 performance was compelling led by strong financial returns quality above system growth in mortgages good margin management and execution of strategic projects such as the launch of the Virgin Money digital bank These results were achieved whilst also successfully acquiring ME Bank raising capital and undertaking a 90 day sprint to accelerate the integration program for the two organisations
FY21 remuneration changes In last yearrsquos Report we shared a summary of our new Senior Executive Remuneration Framework (the Framework) which took effect on 1 September 2020 The introduction of the Framework which includes fixed reward (FR) and a total variable reward opportunity comprising Performance Shares and Premium Priced Options is focused on alignment with shareholders balanced measures of performance and long term deferral As part of the transition to the new Framework Senior Executives no longer have any cash incentives Instead 100 per cent of their variable at-risk reward which is a fixed percentage of FR is awarded in equity and deferred over multiple years This significantly increases the alignment between the interests of Senior Executives and shareholders
After the 2020 Annual General Meeting (AGM) Senior Executives were awarded grants of Performance Shares and Premium Priced Options
Performance Shares differ from traditional short-term incentives that typically involve a combination of cash and shares and where the outcome varies within a range often dictated by complicated formulae Performance Shares are granted as Rights with each Senior Executive being awarded a fixed percentage of their FR at the beginning of the financial year The Rights convert to Restricted Shares at the completion of the financial year based on an assessment undertaken by the Board Upside is determined by the continued performance of the business throughout the financial year and by share price growth in future years until vesting
Whilst in most years it is expected that management will achieve a conversion of Rights into Restricted Shares the outcome can be varied up or down should exceptional or threshold performance both financial and non-financial dictate
Premium Priced Options have a single performance hurdle - an exercise price that is 120 per cent of the share price after the AGM in December This aligns the interests of Senior Executives with those of Shareholders as participants derive zero value unless the share price at vesting (four and five years from grant) exceeds the exercise price The BOQ share price is determined by financial performance effective risk management and other non-financial factors (including reputation customer growth and future outlook)
FY21 remuneration outcomes Fixed reward for Senior Executives is set based on a combination of the executiversquos experience and capability competitiveness relative to the financial services sector and similarly sized ASX listed companies and internal relativities Ewen Stafford our Chief Financial Officer and Chief Operating Officer was our only Senior Executive to receive a fixed reward increase during FY21
Remuneration outcomes for FY21 reflect a range of relevant factors
bull the Grouprsquos performance in relation to the five strategic priorities in the Group Scorecard and achievement of the Board-approved financial and non-financial measures
bull Senior Executive contribution to the Group Scorecard performance and progress toward the achievement of our strategic priorities
bull explicit consideration of risk events behaviours and outcomes based on input from the Chief Risk Officer and Board Risk Committee
bull the additional demands and expectations of MampA activity alongside the challenges of an ongoing pandemic and
bull the experience of our shareholders during the year in terms of share price and dividends
The Board assessed performance against the Group Scorecard as Exceeds This outcome combined with separate consideration of risk resulted in the 100 per cent conversion of Performance Shares awarded at the start of FY21 to Restricted Shares for all continuing Senior Executives
The Board has considered the feedback provided regarding transparency in relation to the Group Scorecard and greater disclosure of the FY21 Group Scorecard is provided in this Report
For the year ended 31 August 2021REMUNERATION REPORT
Remuneration Snapshot 78 | Key Management Personnel 80 | Remuneration Outcomes 81 | Remuneration Strategy amp Structure 88
76 Bank of Queensland Limited and its Controlled Entities
The performance hurdles for the FY17 long-term incentive (LTI) grant of Performance Award Rights (PARs) were tested in December 2020 Results for both measures relative Total Shareholder Return (rTSR) and relative Earnings per Share (rEPS) were below the minimum performance threshold As a result the FY17 grant of PARs lapsed in full Whilst PARs are no longer offered by the Group awards from FY18 and FY19 remain on-foot to be tested in FY23 and FY24 respectively
To encourage alignment between employees and shareholders and to promote ownership across the employee population BOQ offered a tax-exempt employee gift share plan which we refer to as ThankQ Shares for the first time during FY21 The ThankQ Share Plan was offered to eligible employees who would generally not participate in other forms of equity-based remuneration and saw approximately 1600 employees receive $1000 in BOQ shares At BOQ we have a focus on encouraging employee equity ownership and permanent employees are given the opportunity to become shareholders either through equity-based remuneration or employee share plans
FY22 remunerationAfter two years in the role the fixed reward of our Managing Director amp Chief Executive Officer was benchmarked and increased from $13 million to $15 million effective from 1 September 2021 Two other Senior Executives also received increases in their fixed reward from 1 September 2021 - the Chief Information Officer and Group Executive People amp Culture
The FY22 Group Scorecard continues to focus our Senior Executives on achieving the Grouprsquos strategy and fulfilling our ambition The collective performance of Senior Executives and the conversion of Performance Shares granted in FY22 will be assessed against this
Non-executive Director (NED) fees were increased effective 1 September 2021 this represents the first increase to NED fees since FY14 A reduction to the number of NEDs (from 10 at the beginning of FY20 to 7 effective from the 2021 AGM) ensures that the total fees payable for FY22 will remain within the shareholder approved fee pool of $28 million
ME Bank acquisitionThe acquisition of ME Bank on 1 July 2021 saw the Group welcome around 1200 new team members and expanded our employee ranks to around 3500 Part of the appeal of ME Bank as an investment for the Group was its cultural alignment and we are strengthened by the addition of so many dedicated and customer-centric team members
Our people are responsible for the success to date having delivered consistently through all stages of the MampA process to completion on 1 July 2021 and we are now progressing well on integration Looking ahead the program of work required for successful integration will primarily be completed within 18 months with the balance of the integration activities to be incorporated into the Grouprsquos broader Transformation program at that time
As part of the capital raising for the ME Bank acquisition employee shareholders were offered participation consistent with all other retail shareholders Many employees took up that offer The equity incentive plan rules confer on the Board the power to extend eligibility to participate in an entitlement offer to employees Senior Executives and NEDs who hold Rights to BOQ shares After consideration despite the possible dilution impact on our employee rights holders the Board determined not to extend this eligibility The Board also determined that although the ASX Listing Rules allow us to do so the exercise price on the Premium Priced Options would not be reduced
People amp culture strategyFollowing the FY20 launch of a cultural change program designed to ensure that we have the right organisational conditions to support the delivery of the Group strategy we launched the Achievement Approach in FY21 The Achievement Approach brings together career planning development and performance By focusing on achievement we empower our people to pursue personal and professional success which in turn contributes to our success as a Group
Highlights observed during the FY21 roll-out of the Achievement Approach include a meaningful improvement to the number of our people with documented performance goals in place at the beginning of the performance period (meaning our people commenced FY21 with clarity of priorities and expectations) showcasing the diverse career paths of a broad group of BOQ employees and the roll-out of two signature capability programs Coaching for Achievement and Wellbeing and In the Moment Feedback
Two Pulse surveys were conducted in FY21 and we were pleased to see improvements to employee sentiment in the areas of engagement and culture Further detail is provided in section 34 (Group Scorecard)
As part of our commitment to our customers employees shareholders and community each of our employees was offered two half days of paid leave for the purposes of obtaining full COVID-19 vaccination
Key management personnel changesLyn McGrath former Group Executive Retail Banking retired on 31 January 2021 In April 2021 we welcomed Martine Jager to the role of Group Executive Retail Banking On 30 September 2021 Fiamma Morton ceased as Group Executive Business Banking and Chris Screen was appointed to the role effective 1 October 2021 Adam McAnalen will transition to a new role in the Group when David Watts commences as Group Chief Risk Officer in early 2022
We are confident that our strength at both Senior Executive and Board levels will enable our continued success
ConclusionThe Board remains committed to ensuring that the Grouprsquos people culture and remuneration frameworks and practices further the interests of all stakeholders including customers shareholders regulators and employees This extends to having adequate flexibility to anticipate and respond to labour market trends as we navigate a new normal through COVID-19 recovery It is the Boardrsquos view that the remuneration outcomes for FY21 are appropriate in light of our consistent and positive progress against our five strategic priorities and the environment in which we operate
I welcome any feedback on the remuneration report and look forward to engaging with you again
Warwick Negus Chair People Culture amp Remuneration Committee
For the year ended 31 August 2021REMUNERATION REPORT
Remuneration Governance 90 | Non-Executive Director Remuneration 94 | Statutory Tables 95
772021 Annual Report
Our empathetic culture sets us apart
Distinctive brands serving attractive niche customer segments
Digital Bank of the future with a personal touch
Simple and intuitive business with strong execution capability
Strong financial and risk position with attractive returns
STRATEGIC PRIORITIES
SECTION 1 REMUNERATION SNAPSHOT
Reward sustainable profitable growth as BOQ executes its strategy
Reward our people for delivering exceptional customer experiences
Align our people to long term value creation for our shareholders
Provide exceptional employee experiences including performance and reward to attract and retain a
diversity of high-quality talent
Take into account prudent risk management in accordance with
BOQrsquos risk appetite
Ensure remuneration structures are consistent with our purpose-led culture
clear accountability frameworks and robust risk management framework
REMUNERATION OBJECTIVES
Empathy Integrity Making a difference
OUR PURPOSE AND VALUESCreating prosperity for our customers shareholders and people through
AMBITIONWe will be known as the bold challenger bank with multi-brands that are
digitally enabled with a personal touch
For the year ended 31 August 2021REMUNERATION REPORT
Remuneration Snapshot 78 | Key Management Personnel 80 | Remuneration Outcomes 81 | Remuneration Strategy amp Structure 88
78 Bank of Queensland Limited and its Controlled Entities
SENIOR EXECUTIVE REMUNERATION FRAMEWORK SUMMARYThe Framework is anchored in the remuneration objectives and designed to support the Grouprsquos ambition by facilitating the successful achievement of the strategic priorities in line with our purpose and values
Fixed reward Performance Shares Premium Priced Options
Purpose To attract and retain talent and reflect the individualrsquos skills capabilities and experience
To focus Senior Executives on delivering against the Grouprsquos strategy collaboratively and as a team
To align Senior Executivesrsquo interests with the interests of shareholders to achieve improved outcomes for all stakeholders and grow shareholder value
Delivery Cash Rights that convert to Restricted Shares
Options with a premium exercise price (120 of share price at grant)
Proportion of fixed reward
NA MD amp CEO 88
Other Senior Executives 78
MD amp CEO 58
Other Senior Executives 52
Performance criteria
Satisfactory performance compliance with the terms and conditions of employment including the Code Of Conduct and fulfilment of accountabilities under the Banking Executive Accountability Regime (BEAR)
Performance against the Group Scorecard over the one year performance period (the FY) modified by the Boardrsquos overall assessment of risk performance and behaviours determines the conversion from Rights to Restricted Shares
BOQrsquos share price must exceed the exercise price set for the award and a risk assessment conducted by the Board
Risk NA Risk assessment prior to vesting
Unvested awards are subject to malus
A clawback period of two years applies to each tranche after vesting
Risk assessment prior to vesting
Unvested awards are subject to malus
MD amp CEO Each tranche is subject to dealing restrictions for two years after vesting
Other Senior Executives Each tranche is subject to the dealing restrictions for one year after vesting
For all participants a clawback period of two years applies to each tranche after vesting
Vesting profile NA 33 in December 2022 33 in December 2023 and 34 in December 2024 (ie after two three and four years)
50 in December 2024 and 50 in December 2025 (ie after four and five years)
For the year ended 31 August 2021REMUNERATION REPORT
Remuneration Governance 90 | Non-Executive Director Remuneration 94 | Statutory Tables 95
792021 Annual Report
SECTION 2 KEY MANAGEMENT PERSONNELThis section identifies Directors and Senior Executives who are KMP and sets out the changes that have occurred within this cohort during FY21 and up until the date of this Report
TABLE 1 - EXECUTIVE amp NON-EXECUTIVE DIRECTORS
Current Directors
Patrick Allaway Chair (Non-executive)
Bruce Carter Non-executive Director
George Frazis Managing Director amp Chief Executive Officer
Deborah Kiers Non-executive Director (from 5 August 2021)
John Lorimer Non-executive Director
Warwick Negus Non-executive Director
Karen Penrose Non-executive Director
Mickie Rosen Non-executive Director (from 4 March 2021)
Former Directors
Kathleen Bailey-Lord Non-executive Director (ceased 5 August 2021)
Michelle Tredenick Non-executive Director (ceased 8 December 2020)
TABLE 2 - OTHER SENIOR EXECUTIVES
Current Senior Executives
Debra Eckersley Group Executive People and Culture
Martine Jager Group Executive Retail Banking (from 27 April 2021)
Adam McAnalen Chief Risk Officer
Fiamma Morton Group Executive Business Banking
Craig Ryman Chief Information Officer
Ewen Stafford Chief Financial Officer and Chief Operating Officer
Former Senior Executives
Lyn McGrath Group Executive Retail Banking (ceased 31 January 2021)
The following changes are effective during FY22
1 Fiamma Morton ceased as Group Executive Business Banking on 30 September 2021
2 Chris Screen was appointed Group Executive Business Banking on 1 October 2021
3 Adam McAnalen will transition to a new role in the Group when David Watts commences as Group Chief Risk Officer in early 2022
For the year ended 31 August 2021REMUNERATION REPORT
Remuneration Summary 78 | Key Management Personnel 80 | Remuneration Outcomes 81 | Remuneration Strategy amp Structure 88
80 Bank of Queensland Limited and its Controlled Entities
SECTION 3 REMUNERATION OUTCOMES This section details remuneration outcomes for Senior Executives during the FY21 year
31 REMUNERATION MIXFigure 1 illustrates the mix of Fixed Reward Performance Shares and Premium Priced Options awarded to Senior Executives in FY21
32 FIXED REWARDEwen Stafford the Chief Financial Officer amp Chief Operating Officer was awarded a fixed reward increase during FY21 The increase of 14 per cent took effect 1 June 2021 and took into account Mr Staffordrsquos contribution to Group his capability and market-competitive fixed reward levels for comparable roles in the financial services sector and similarly sized ASX listed companies
Fixed remuneration at 1 September 2020 informed the face value of annual awards of Performance Shares and Premium Priced Options
George Frazis the MD amp CEO Debra Eckersley Group Executive People amp Culture and Craig Ryman Chief Information Officer were awarded fixed reward increases for FY22 effective 1 September 2021 The average increase awarded for FY22 was 12 per cent
33 LINKING PERFORMANCE amp REWARD OUTCOMESThe Grouprsquos financial performance is summarised in Table 3 together with its relationship to the aggregate value of Performance Shares granted and converted or for one former Senior Executive STI awarded in relation to FY21 and for prior years the amount of STI paid
TABLE 3 - GROUP PERFORMANCE
5 Year Company Performance FY21 (1) FY20 FY19 FY18 FY17
Statutory net profit(loss) after tax ($m) 369 115 298 336 352
Cash net profit after tax (2) ($m) 412 225 320 372 378
Cash basic earnings per share (2)(3) (cents) 747 496 795 947 976
Cash cost to income ratio (2) () 544 549 510 475 466
Share price at balance sheet date ($) 946 613 917 1149 1259
Total shareholder return () 6375 (298) (139) (27) 265
Value of dividends paid ($m) 164 126 288 341 308
Senior Executive Performance Shares converted STI awarded (4) ($m) 379 178 - 273 402
(1) All results are inclusive of ME Bank(2) Non-statutory measures are not subject to audit(3) The basic and diluted earnings per share for all prior periods have been adjusted per ASX announcement on 20 April 2021(4) Performance Shares are converted based on the Boardrsquos assessment of the Group Scorecard and other considerations
Managing Director amp CEO 406 356 238
Senior Executives 435 339 226
Fixed Reward Performance Shares
Figure 1 - Remuneration Mix (at Target level)
Premium Priced Options
For the year ended 31 August 2021REMUNERATION REPORT
Remuneration Governance 90 | Non-Executive Director Remuneration 94 | Statutory Tables 95
812021 Annual Report
33 LINKING PERFORMANCE amp REWARD OUTCOMESFigure 2 compares the total Performance Shares converted based on FY21 Group Scorecard results and STI awarded for one former Senior Executive and STI awarded to Senior Executives from FY17 to FY20 with BOQrsquos Cash NPAT over the past 5 years
Figure 2 FY21 Performance Shares converted STI awarded vs 5 year NPAT
(1) FY21 includes pro-rated STI award for Lyn McGrath former Group Executive Retail Banking All current executives participated in Performance Shares
34 GROUP SCORECARDAt the commencement of FY21 the Group Scorecard was approved by the Board The Group Scorecard is based on the priorities that underpin the five-year strategy announced by the MD amp CEO in 2020
The Group Scorecard articulates the areas of focus that support the achievement of the strategy and sets the tone for how achievement is measured throughout the performance period for Senior Executives and all other employees of the Group It connects the Grouprsquos vision with tangible outcomes that contain an appropriate degree of stretch
The Boardrsquos assessment of achievement against the Group Scorecard together with holistic consideration of risk performance or any other matters considered relevant by the Board determine the conversion of Performance Shares
For FY21 the overall outcome against the Group Scorecard is Exceeds This is based on achievement of the targets against each measure modified by the Boardrsquos separate and explicit consideration of risk and any other relevant considerations
Figure 3 details the FY21 Group Scorecard including strategic priorities and weightings set by the Board together with FY21 outcomes
Figure 3 Assessment of FY21 Group Scorecard
Strategic Priority Weighting FY21 assessment
Our empathetic culture sets us apartDelighting our Customers - Net Promoter Score
bull Consumer NPS ranked 3rd
bull Business Bank SME NPS ranked 3rd
Engagement culture and leadership compared to prior year
bull Engagement score increased by 5 points
bull Culture score increased by 10 points
bull I feel safe to speak up score increased by 13 points
bull Senior Women in Leadership improved by 4 points
bull Overall Women in Leadership regressed by 1 point
10
Distinctive brands serving attractive niche customer segmentsDemonstrated by above-system growth in mortgages and business lending
bull Mortgage growth of 17x system
bull Business lending growth of 08x system
10
$m$m
Cash NPAT
Performance Shares converted STI awarded
FY20 FY21 (1)FY19FY18FY17
350
400
300
250
200
150
100
50
0
30
45
25
40
20
35
15
10
05
00
Achieving
Achieving
For the year ended 31 August 2021REMUNERATION REPORT
Remuneration Snapshot 81 | Key Management Personnel 80 | Remuneration Outcomes 81 | Remuneration Strategy amp Structure 88
82 Bank of Queensland Limited and its Controlled Entities
Strategic Priority Weighting FY21 assessment
Digital bank of the future with a personal touchDelivery of Virgin Money Australia and BOQ Retail digital banks
bull Virgin Money Australia Phase 1 completed and launched and Phase 2 now in build and delivery
bull Strong progress on BOQ Retail Phase 1
bull Phases 1 and 2 of a new Card Management System delivered
10
Simple and intuitive business with strong execution capabilityProductivity benefits containing expense growth
bull $30m productivity benefits
bull Expense growth of 3
bull JAWS 2
Product simplification and improved efficiency and customer experience
bull 15 of products were closed for sale during FY21 with a 26 reduction to the product register
bull During August we reached time to conditional yes of 1 day for Proprietary and 3 days for our Broker channel even as volume growth occurred (1)
Project delivery and execution
bull 20+ strategic projects delivered with strong benefits realisation
10
Strong risk positionStrengthen the bank through CET1 ratio and deposit growth
bull CET1 ratio 98
bull Deposit to Loan Ratio 75
Strong risk and compliance outcomes
bull Delivery of key regulatory compliance projects including AML and prudential reporting
bull A strengthened AMLCTF program
bull Embedding the 3 lines of defence model
10
Strong financial position with attractive returnsProfitable and sustainable growth in Cash Earnings and Earnings per Share strong return on equity and organic capital growth
bull Cash earnings $389m (excluding ME Bank) 73 growth
bull Earnings per Share 747c up 51 (including ME Bank)
bull Return on Equity 82 up 280bps (including ME Bank)
bull Organic Capital Generation 93bps (including ME Bank)
50
Overall including consideration of risk
(1) Time to conditional yes varies during the year based on volumes and customer mix
34 GROUP SCORECARD (CONTINUED)
Achieving
Exceeds
Exceeds
Exceeds
Exceeds
1 532 4
Underachieving Threshold Achieving Exceeds Exceptional
Rating scale
For the year ended 31 August 2021REMUNERATION REPORT
Remuneration Governance 90 | Non-Executive Director Remuneration 94 | Statutory Tables 95
832021 Annual Report
35 GRANT AND CONVERSION OF PERFORMANCE SHARESPerformance Shares were granted to Senior Executives in FY21 Performance Shares are intended to drive collaboration and encourage Senior Executives to achieve strong business outcomes as a team The Board undertakes a holistic assessment of performance against the Group Scorecard and other factors including a risk assessment to determine the proportion of Performance Shares that convert on completion of the performance period Whilst in most years it is expected that management will achieve a conversion of awarded Rights into Restricted Shares the outcome can be varied up or down at the Boardrsquos discretion should exceptional or threshold performance both financial and non-financial dictate
The face value of the MD amp CEOrsquos allocation was 88 per cent of fixed reward for other Senior Executives the face value of their allocation was 78 per cent of fixed reward Annual grants were made on 6 January 2021 Martine Jagerrsquos award was granted on 9 June 2021
The MD amp CEOrsquos grant of Performance Shares was approved by shareholders at the 2020 AGM
The number of Performance Shares allocated as part of the annual grant was determined using the face value of the award divided by the Volume Weighted Average Price (VWAP) of BOQ shares over the five trading days immediately following the 2020 AGM Intra-year awards for Senior Executives who join part way through the performance period are based on the VWAP over the five trading days immediately preceding their date of commencement with BOQ
Based on the Boardrsquos assessment of the Group Scorecard and consideration of risk for all continuing Senior Executives 100 per cent of Performance Shares granted in FY21 converted on completion of the one year performance period (1 September 2020 to 31 August 2021) Post-conversion the Restricted Shares will vest over three years subject to service conditions a pre-vesting assessment by the Board and all other original terms including malus
Performance Shares that converted to Restricted Shares will vest in three tranches 33 per cent in December 2022 33 per cent in December 2023 and 34 per cent in December 2024 subject to the Boardrsquos assessment of risk prior to each vesting date Each tranche is subject to a clawback period of two years from the vesting date
Table 4 details the grants and conversion of FY21 Performance Shares
TABLE 4 - PERFORMANCE SHARES GRANTED AND CONVERTED
Name Position Title
Fixed reward at time of
grant
Performance Shares as
of FR
Face value of Performance Shares award VWAP
Performance Shares
granted
of Performance
Shares converted
Performance Shares lapsed
George Frazis
Managing Director amp Chief Executive Officer
$1300000 88 $1140000 $77781 146566 100 -
Debra Eckersley
Group Executive People amp Culture $560000 78 $436800 $77781 56158 100 -
Martine Jager (1) Group Executive Retail Banking $685000 78 $185907 $90718 20493 100 -
Adam McAnalen Chief Risk Officer $675000 78 $526500 $77781 67691 100 -
Fiamma Morton (2)
Group Executive Business Banking $700000 78 $546000 $77781 70198 65 24568
Craig Ryman
Chief Information Officer $700000 78 $546000 $77781 70198 100 -
Ewen Stafford
Chief Financial Officer amp Chief Operating Officer
$700000 78 $546000 $77781 70198 100 -
(1) Martine Jager commenced as a KMP on 27 April 2021 therefore her award for FY21 has been pro-rated(2) The portion of Performance Shares that converted for Fiamma Morton will remain on foot to vest in accordance with the original terms of the Award
For the year ended 31 August 2021REMUNERATION REPORT
Remuneration Snapshot 81 | Key Management Personnel 80 | Remuneration Outcomes 81 | Remuneration Strategy amp Structure 88
84 Bank of Queensland Limited and its Controlled Entities
36 LTI VESTED DURING FY21PARs granted in 2017 were tested in December 2020 consistent with plan terms This grant was subject to two performance hurdles being rTSR (with an 80 per cent weighting) and rEPS (with a 20 per cent weighting) None of the PARs granted in 2017 vested in FY21
The statutory tables in Section 7 set out the detail of LTI awards forfeited by individual qualifying Senior Executives The results of the testing are presented in Table 5 below
TABLE 5 - LTI VESTING OUTCOMES - FY17 GRANT
Grant Date Performance Period Vesting Hurdle Performance Outcome
13122017 12 October 2017 to 13 October 2020
TSR ranking of at least 50th percentile BOQ TSR achieved ranking of 19th percentile resulting in 0 of the TSR tranche vesting
Relative EPS ranking of at least 60th percentile BOQ EPS achieved a ranking of 45th percentile resulting in 0 of the EPS tranche vesting
Figure 4 Percentage of LTI vesting of the last five years
37 PREMIUM PRICED OPTIONS GRANTEDPremium Priced Options were granted to Senior Executives in FY21 As approved by shareholders at the 2020 AGM the face value of the MD amp CEOrsquos allocation was 58 per cent of fixed reward For other Senior Executives the face value of their allocation was 52 per cent of fixed reward Annual grants were made on 6 January 2021 Martine Jagerrsquos award was granted on 9 June 2021
To determine the number of Premium Priced Options each Senior Executive was allocated the face value of their award was divided by the option value as determined by the Board For the annual grant the Board determined that the value of a Premium Priced Option was six per cent of the VWAP over the five trading days immediately following the 2020 AGM The Exercise Price was set at 120 per cent of the same VWAP
Intra-year awards for Senior Executives who join part way through the performance period were determined using the same methodology to derive a value that is based on the VWAP of BOQ shares over the five trading days immediately preceding their date of commencement with BOQ This approach is adopted so that the Exercise Price for intra-year awards remains consistent with the Exercise Price for annual grants
For Ms Jagerrsquos award the value of an option was nine per cent of the VWAP over the five trading days immediately preceding her commencement
70
60
50
40
30
20
10
0
FY17 FY18 FY19 FY20 FY21
65
55
16
0 0
BOQ no longer offers PARs
For the year ended 31 August 2021REMUNERATION REPORT
Remuneration Governance 90 | Non-Executive Director Remuneration 94 | Statutory Tables 95
852021 Annual Report
37 PREMIUM PRICED OPTIONS GRANTED (CONTINUED)Table 6 details the Premium Priced Options awarded to participants in FY21
TABLE 6 - PREMIUM PRICED OPTIONS GRANTED
Name Position Title
Fixed reward at time of
grantOptions of fixed reward
Options grant at Face Value VWAP
Options value
FY21 Options granted
Exercise price
George Frazis
Managing Director amp Chief Executive Officer
$1300000 58 $760000 $77781 $04667 1628456 $93337
Debra Eckersley
Group Executive People amp Culture $560000 52 $291200 $77781 $04667 623956 $93337
Martine Jager (1) Group Executive Retail Banking $685000 52 $123938 $90718 $08165 151792 $93337
Adam McAnalen Chief Risk Officer $675000 52 $351000 $77781 $04667 752090 $93337
Fiamma Morton (2) Group Executive Business Banking $700000 52 $364000 $77781 $04667 779945 $93337
Craig Ryman
Chief Information Officer $700000 52 $364000 $77781 $04667 779945 $93337
Ewen Stafford
Chief Financial Officer amp Chief Operating Officer
$700000 52 $364000 $77781 $04667 779945 $93337
(1) Martine Jager commenced as a KMP on 27 April 2021 therefore her award for FY21 has been pro-rated(2) Fiamma Mortonrsquos Premium Priced Options will be pro-rated to her cessation date with the pro-rated portion to remain on foot to vest in accordance with the original terms
of the Award
Participants derive value from Premium Priced Options only if the Exercise Price is exceeded at the relevant vesting date Premium Priced Options vest four and five years after grant
38 SENIOR EXECUTIVE TOTAL REWARD OUTCOMES FOR FY21 (NON-STATUTORY DISCLOSURE)This section provides a summary of the total benefit earned by Senior Executives with respect to performance over FY21 As in previous years this non-statutory table shows the Senior Executivesrsquo actual remuneration in respect of FY21
Table 7 includes a breakdown of the following components of Senior Executive remuneration
bull FY21 fixed reward (including base salary and employer superannuation contributions)bull the value of non-monetary and other short-term benefits provided in FY21 andbull the value of any variable remuneration which vested lapsed or was forfeited during FY21
For the year ended 31 August 2021REMUNERATION REPORT
Remuneration Snapshot 81 | Key Management Personnel 80 | Remuneration Outcomes 81 | Remuneration Strategy amp Structure 88
86 Bank of Queensland Limited and its Controlled Entities
38
SENI
OR E
XECU
TIVE
TOT
AL R
EWAR
D OU
TCOM
ES F
OR F
Y21 (
NON-
STAT
UTOR
Y DI
SCLO
SURE
)(CON
TINU
ED)
TAB
LE 7
- N
ON
-STA
TUTO
RY D
ISC
LOSU
RE
Cur
rent
Posi
tion
Tit
leYe
arFi
xed
Rem
uner
atio
n (1)
STI c
ash (2
)Va
lue
of
Ben
efit
s (3)
Valu
e of
D
efer
red
Equi
ty
Vest
ed in
Pe
riod (4
)Te
rmin
atio
n B
enef
its
Valu
e of
LTI
Ve
sted
in
Perio
d (5)
Tota
l Rew
ard
Valu
e (6)
Prio
r Yea
rsrsquo
Equi
ty
Forf
eite
d
Laps
ed (7
)
Geo
rge
Fraz
isM
anag
ing
Dire
ctor
amp
Chi
ef E
xecu
tive
Off
icer
2021
129
521
2 -
1116
83
-
--
140
689
5 -
2020
128
07
89
- 5
928
9 -
-
- 1
340
078
-
Deb
ra E
cker
sley
Gro
up E
xecu
tive
Peo
ple
amp C
ultu
re20
21 5
580
47
- -
-
-
- 5
580
47
-
2020
541
914
-
-
-
--
541
914
-
Mar
tine
Jag
er (8
)G
roup
Exe
cuti
ve R
etai
l Ban
king
2021
237
141
-2
971
-
--
240
112
-
Ada
m M
cAna
len
Chi
ef R
isk
Off
icer
2021
672
60
6 -
65
27
22
823
--
70
195
6 (6
794
3)
2020
640
639
-
60
40
276
62
--
674
341
(8
323
5)
Fiam
ma
Mor
ton
Gro
up E
xecu
tive
Bus
ines
s B
anki
ng20
21 6
975
11
- 15
840
-
-
- 7
133
51
-
2020
169
551
- 2
237
-
--
1717
88
-
Cra
ig R
yman
Chi
ef In
form
atio
n O
ffic
er20
21 6
975
11
- 15
840
-
-
- 7
133
51
-
2020
911
87
- 2
08
3 -
--
93
270
-
Ewen
Sta
ffor
dC
hief
Fin
anci
al O
ffic
er
amp C
hief
Ope
rati
ng O
ffic
er20
21 7
216
49
- 4
70
04
-
--
768
653
-
2020
564
762
-
32
119
--
- 5
968
81
-
Form
er-
--
-
Lyn
McG
rath
(9)
Gro
up E
xecu
tive
Ret
ail B
anki
ng20
21 3
2614
9 50
00
0 8
729
3
18
35
--
416
713
(965
573
)
2020
627
70
7 -
20
823
7
458
3 -
- 7
2311
3 -
(1)
Bas
e sa
lary
and
sup
eran
nuat
ion
mak
e up
a S
enio
r Exe
cuti
versquos
fix
ed re
mun
erat
ion
incl
udin
g an
nual
leav
e pa
id d
urin
g th
e ye
ar F
or d
epar
ting
KM
P th
is in
clud
es a
ny le
ave
that
is p
aid
out u
pon
term
inat
ion
of e
mpl
oym
ent
w
hich
is n
ot in
clud
ed in
Sta
tuto
ry T
able
13 in
sec
tion
7
(2)
Pro-
rate
d FY
21 S
TI fo
r Lyn
McG
rath
for
mer
Gro
up E
xecu
tive
Ret
ail B
anki
ng i
n re
spec
t of t
he p
erio
d 1 S
epte
mbe
r 20
20 -
31 J
anua
ry 2
021
in
FY20
all
KMP
STI w
as a
war
ded
in R
estr
icte
d Sh
ares
(3)
Val
ue o
f ben
efit
s in
clud
es b
oth
non-
mon
etar
y an
d ot
her s
hort
-ter
m b
enef
its
and
rela
tes
to b
enef
its
(and
ass
ocia
ted
FBT)
suc
h as
car
par
king
acc
omm
odat
ion
or re
loca
tion
and
tra
vel
(4)
The
valu
e of
all d
efer
red
cash
and
or e
quit
y aw
ards
(usi
ng th
e cl
osin
g sh
are
pric
e on
the
vest
ing
date
) tha
t ves
ted
durin
g th
e pe
riod
It e
xclu
des
defe
rred
equ
ity
awar
ds g
rant
ed in
pre
viou
s ye
ars
that
did
not
ves
t dur
ing
the
perio
d(5
) Th
is re
late
s to
PA
Rs
that
ves
ted
duri
ng t
he p
erio
d (u
sing
the
clo
sing
sha
re p
rice
on
the
vest
ing
date
) (6
) Th
is is
the
tot
al d
olla
r val
ue o
f fix
ed re
mun
erat
ion
Val
ue o
f Ben
efit
s V
alue
of D
efer
red
Equi
ty V
este
d in
Per
iod
Ter
min
atio
n B
enef
its
and
Val
ue o
f LTI
Ves
ted
in P
erio
d(7
) Th
is re
late
s to
PA
Rs
that
laps
ed d
urin
g th
e ye
ar a
s a
resu
lt o
f hur
dles
not
bei
ng m
et a
ndo
r as
a re
sult
of c
easi
ng e
mpl
oym
ent (
clos
ing
shar
e pr
ice
on la
pse
date
)(8
) M
arti
ne J
ager
com
men
ced
as G
roup
Exe
cuti
ve R
etai
l on
27
Apr
il 20
21
(9)
Lyn
McG
rath
reti
red
and
ceas
ed a
s G
roup
Exe
cuti
ve R
etai
l Ban
king
on
31 J
anua
ry 2
021
FY2
1 STI
aw
ard
is in
clus
ive
of s
uper
annu
atio
n an
d pr
o-ra
ted
for 5
mon
ths
The
STI
aw
arde
d w
as 2
5 pe
r cen
t of p
ro-r
ated
tar
get S
TI
and
14 p
er c
ent o
f pro
-rat
ed m
axim
um S
TI 8
6 pe
r cen
t of p
ro-r
ated
max
imum
STI
was
forf
eite
d L
yn e
lect
ed t
o fo
rfei
t her
20
18 P
AR
s a
pro
-rat
a po
rtio
n of
her
20
19 P
AR
s re
mai
ns o
n fo
ot t
o ve
st in
the
nor
mal
cou
rse
su
bjec
t to
the
orig
inal
ter
ms
and
cond
itio
ns o
f the
aw
ard
For the year ended 31 August 2021REMUNERATION REPORT
Remuneration Governance 90 | Non-Executive Director Remuneration 94 | Statutory Tables 95
872021 Annual Report
SECTION 4 REMUNERATION STRATEGY AND STRUCTUREThis sections outlines the Grouprsquos remuneration strategy and the structure of senior executive remuneration
41 STRATEGYThe Grouprsquos remuneration objectives articulate the remuneration strategy and apply at all levels throughout the organisation These are to
bull reward sustainable profitable growth as BOQ executes its strategybull reward our people for delivering exceptional customer experiencesbull align our people to long-term value creation for our shareholdersbull provide exceptional employee experiences including performance and reward to attract and retain a diversity of high-quality talentbull ensure remuneration structures are consistent with our purpose-led culture clear accountability frameworks and robust risk
management framework andbull take into account prudent risk management in accordance with BOQrsquos risk appetite
42 STRUCTURESenior Executivesrsquo remuneration is structured in accordance with the Framework that was introduced on 1 September 2020 The particular objectives of the Framework are to
bull increase alignment with shareholder interests by delivering a sizeable proportion of total remuneration in equity bull encourage long-term performance with an appropriate focus on financial and non-financial metrics bull focus senior executives on improving absolute shareholder returnsbull provide a simple and transparent executive remuneration framework andbull attract and retain executive talent
The features of the Framework are outlined in Table 8
TABLE 8 - THE SENIOR EXECUTIVE REMUNERATION FRAMEWORK
Fixed reward Performance Shares Premium Priced Options
Purpose To attract and retain talent and reflect the individualrsquos skills capabilities and experience
To focus Senior Executives on delivering against the Grouprsquos strategy collaboratively and as a team
To align Senior Executivesrsquo interests with the interests of shareholders to achieve improved outcomes for all stakeholders and grow shareholder value
Delivery Cash Rights that convert to Restricted Shares
Options with a premium exercise price (120 of share price at grant)
Opportunity Based on capability experience and complexity of role
MD amp CEO 88 of FR
Other Senior Executives 78 of FR
MD amp CEO 58 of FR
Other Senior Executives 52 of FR
Eligibility NA At least three monthsrsquo active employment during the performance period
At least three monthsrsquo active employment during the performance period
Allocated Value Fixed reward levels are informed by benchmarking comparable roles in financial services andor similarly sized ASX listed companies
The face value of the Senior Executiversquos opportunity is divided by the VWAP of BOQ shares
For the annual grant the VWAP is calculated over the 5 trading days immediately following the AGM
For Senior Executives who join part-way through the performance period the VWAP is calculated over the 5 trading days immediately preceding their commencement date
The face value of each Senior Executiversquos opportunity is divided by the value of an option which was calculated by applying the Board approved valuation percentage of 6 to the VWAP calculated over the 5 trading days immediately following the AGM
For Senior Executives who join part-way through the performance period a percentage of the VWAP as determined by the Board calculated over the 5 trading days immediately preceding their commencement date
For the year ended 31 August 2021REMUNERATION REPORT
Remuneration Snapshot 81 | Key Management Personnel 80 | Remuneration Outcomes 81 | Remuneration Strategy amp Structure 88
88 Bank of Queensland Limited and its Controlled Entities
Fixed reward Performance Shares Premium Priced Options
Performance criteria
Satisfactory performance compliance with the terms and conditions of employment including the Code Of Conduct and fulfilment of accountabilities under the Banking Executive Accountability Regime (BEAR)
Performance against the Group Scorecard over the one year performance period (the FY) modified by the Boardrsquos overall assessment of risk and performance determines the conversion from Rights to Restricted Shares
BOQrsquos share price must exceed the exercise price set for the award and a risk assessment conducted by the Board
The exercise price is set at 120 of the VWAP
Risk NA Risk assessment prior to vesting
Unvested awards are subject to malus
A clawback period of two years applies to each tranche after vesting
Risk assessment prior to vesting
Unvested awards are subject to malus
MD amp CEO Each tranche is subject to dealing restrictions for two years after vesting
Other Senior Executives Each tranche is subject to the dealing restrictions for one year after vesting
For all participants a clawback period of two years applies to each tranche after vesting
Vesting profile NA 33 in December 2022 33 in December 2023 and 34 in December 2024 (ie after two three and four years)
50 in December 2024 and 50 in December 2025 (ie after four and five years)
43 DELIVERY AND REALISATION TIMEFRAMESFigure 5 illustrates the delivery profile of the different components of Senior Executivesrsquo remuneration for FY21
Figure 5 Delivery and realisation timeframes MD amp CEO
Fixed Reward Cash
Performance Shares
Premium Priced Options
FY21 FY22 FY23 FY24 FY25 FY26 FY27 FY28
Other Senior Executives
Fixed Reward Cash
Performance Shares
Premium Priced Options
FY21 FY22 FY23 FY24 FY25 FY26 FY27 FY28
42 STRUCTURE (CONTINUED)
Grant Convert Vest Restrictions lifted Clawback period
For the year ended 31 August 2021REMUNERATION REPORT
Remuneration Governance 90 | Non-Executive Director Remuneration 94 | Statutory Tables 95
892021 Annual Report
SECTION 5 REMUNERATION GOVERNANCE51 GROUP REMUNERATION POLICYThe Group Remuneration Policy (the Policy) sets out the governance structure for oversight of BOQrsquos remuneration frameworks and practices and the minimum expectations for their implementation Specifically the Policy requires that the Grouprsquos performance and remuneration frameworks
bull align the design and management of remuneration with mdash BOQrsquos strategic customer and financial objectives and mdash prudent risk-taking incorporating adjustments to reflect
bull the outcomes of business activities bull the risks related to those activities taking account where relevant the cost of the associated capital and bull the time necessary for the outcomes of those business activities to be reliably measured and
bull encourage behaviours that mdash are consistent with BOQrsquos purpose and values mdash align with and reward the delivery of superior customer outcomes mdash support BOQrsquos Risk Management Framework (RMF) prudent risk-taking and long-term financial success mdash prevent matters that may negatively impact prudential standing or reputation and mdash comply with all relevant jurisdictional legislative and regulatory requirements
52 ROLES AND RESPONSIBILITIES
521 The BoardThe Board is responsible for determining BOQrsquos Remuneration Policy and through the People Culture and Remuneration Committee (PCRC) focuses on strategic human resources and remuneration
The Board must at least annually review and approve
bull the Policybull individual remuneration arrangements including but not limited to fixed remuneration levels variable reward targets and outcomes
make-good awards retention awards and other benefits of significant value for those employees designated as Accountable Persons and Responsible Persons
bull collectively remuneration structures for other cohorts specified by APRA andbull all equity plans including the terms and conditions under which grants are offered
522 The People Culture amp Remuneration CommitteeIn accordance with its Charter the PCRC will
bull review and make recommendations to the Board on the performance objectives and individual remuneration arrangements for the MD amp CEO at least annually
bull make recommendations to the Board on individual remuneration arrangements for Accountable Persons and Responsible Persons including Senior Executives at least annually as part of the remuneration review and as otherwise required (eg on appointment for out-of-cycle awards and on separation if outside of policy)
bull make recommendations to the Board on collective remuneration arrangements for other cohorts specified by APRAbull at least annually review the Policy and where necessary recommend amendments to the Board The review must include an
assessment of the Policyrsquos mdash effectiveness and compliance with prudential standards and any other relevant legal regulatory andor governance requirements
including an assessment of underlying procedures controls and oversight mdash effectiveness in supporting BOQrsquos purpose strategy and objectives including to identify material deviations from the intent of the
Policy and unreasonable or undesirable outcomes that flow from existing arrangements mdash effectiveness in protecting the interests of customers and quality outcomes for customers mdash alignment with shareholder interests and mdash alignment with BOQrsquos RMF and the protection of BOQrsquos long-term financial soundness
All members of the PCRC are also members of the Board Audit Committee and the Board Risk Committee This construct supports the alignment of audit risk and reward matters and facilitates the effective sharing of information between the various committees
Where appropriate the Board Audit Committee and Board Risk Committee make recommendations to the PCRC to inform its decision-making in relation to performance and reward matters This includes input from the Board Risk Committee as it relates to setting objectives for and assessing the performance of the Chief Risk Officer
The PCRC may seek advice from external advisers to assist with the execution of its responsibilities
For the year ended 31 August 2021REMUNERATION REPORT
Remuneration Snapshot 78 | Key Management Personnel 80 | Remuneration Outcomes 81 | Remuneration Strategy amp Structure 88
90 Bank of Queensland Limited and its Controlled Entities
53 BOARD DISCRETIONSenior Executivesrsquo remuneration is determined by the remuneration strategy Policy and the Framework Remuneration outcomes are determined in accordance with relevant performance measures plan design and the Equity Incentive Plan (EIP) rules
The PCRC and Board recognise that there are a range of factors which are specific to current and future years and these may be taken into account when considering the overall remuneration outcomes for each year To account for those factors the PCRC and Board may make discretionary adjustments to remuneration outcomes for Senior Executives and those employees classified as Accountable Persons andor Responsible Persons These discretionary adjustments may impact an individualrsquos remuneration positively or negatively In accordance with this principle remuneration outcomes have been adjusted both positively and negatively in prior years
The criteria used by the PCRC and the Board to recommend and approve discretionary adjustments respectively include
bull factors either not known or not relevant at the beginning of a performance period or financial year which can impact performance positively or negatively during the course of that performance period or financial year
bull the degree of stretch implicit in the performance measures and targets and the environment and market context in which the targets were set
bull whether the operating environment during the performance period or financial year was materially different than forecastbull comparison of the Grouprsquos performance relative to its competitors bull the emergence of any major positive or negative risk or reputational issues bull the quality of financial results as shown by their composition and consistency bull whether leadership behaviours consistent with the Grouprsquos Code of Conduct and values have been regularly demonstrated throughout
the performance period or financial year andbull any other matters that the PCRC and Board deem to be relevant and which are not outlined above
54 RISK ADJUSTMENTThe Chief Risk Officer presents a report to the PCRC on a biannual basis This report which is also reviewed by the Chair of the Board Risk Committee covers significant and thematic risk events and is used by the PCRC to inform variable reward decisions including the granting of equity to Senior Executives and other employees and the Boardrsquos assessment of risk prior to vesting of equity awards The findings of the CROrsquos Report are typically discussed at a closed PCRC session which also provides the Chair of the Board Risk Committee an opportunity to provide input
The PCRC and Board have at their disposal three avenues for making risk adjustments to remuneration These include
bull in-period adjustment where all or a portion of potential variable reward may be reduced including to zerobull malus where the Board may determine that all or a portion of any unvested award will be lapsed or forfeited andbull clawback where subject to legal limitations the Board may seek to recover all or a portion of an award that has been paid andor vested
Circumstances in which the PCRC may recommend and the Board may approve to invoke in-period adjustment malus andor clawback provisions include where in the opinion of the Board a Senior Executive or other individual has
bull engaged in serious misconduct or a breach of their employment obligations (including fraud dishonesty gross negligence recklessness or wilful indifference)
bull failed to meet BOQrsquos conduct and behavioural standards including a determination that a former employee engaged in conduct that would be considered failure of the conduct and behavioural standards if still employed
bull contributed to a material misstatement in or omission from BOQrsquos financial statements or a misstatement of a performance condition applicable to a variable remuneration plan
bull acted or failed to act in a way that contributed to material reputational damage to BOQ orbull received a variable reward where all or part of the initial award was not justified having regard to the circumstances or information
which has come to light after an award was made
For the year ended 31 August 2021REMUNERATION REPORT
Remuneration Governance 90 | Non-Executive Director Remuneration 94 | Statutory Tables 95
912021 Annual Report
55 CESSATION OF EMPLOYMENT AND CHANGE OF CONTROLThe treatment of future awards and unvested deferred awards depends on the circumstances under which employment ceases Generally
bull in the event of summary dismissal or resignation Senior Executives are not eligible to be awarded any further grants of Performance Shares or Premium Priced Options and any unvested equity will be lapsed or forfeited (as relevant to the particular award andor instrument)
bull in particular circumstances referred to as Qualifying Reasons or where minimum service requirements have been met (as approved by the Board) it may be possible and permitted for a Senior Executiversquos unvested equity to remain on foot Qualifying Reasons include redundancy retirement death mutual agreement for cessation and total and permanent disablement
bull where a Senior Executive ceases employment for a Qualifying Reason but is subsequently employed by a competitor of BOQ within six months of ceasing any unvested equity will be lapsed or forfeited (as relevant to the particular award andor instrument) as though they had resigned unless the Board consents otherwise
bull The Policy and various plan documentation also sets out the relevant treatment on change of control
Generally speaking in relation to awards granted up to and including FY21 where an employee separates for a Qualifying Reason or due to a Change of Control event unvested awards will be pro-rated to cessation date and remain on foot to vest in the normal course subject to the original terms and conditions unless the Board determines otherwise
56 MINIMUM SHAREHOLDING REQUIREMENTSNEDs are required to hold shares equal in value to one times their base fee within three years of their appointment to the Board
There are no minimum shareholding requirements for Senior Executives However the prevalence of equity and the long-dated vesting timeframes that underpin the Framework ensures that all Senior Executives will have at a minimum equity interests reflecting at least one times their fixed remuneration once they have been awarded an annual grant of Performance Shares and Premium Priced Options
57 SECURITIES TRADING POLICYThe Grouprsquos Securities Trading Policy regulates dealings by Directors employees and contractors in BOQ securities Under the policy Prescribed Persons (those employees with the authority responsibility participatory role in or knowledge of the planning directing or controlling of the activities of the Group) are prohibited from dealing in BOQ securities during certain blackout periods including
bull the period commencing 1 March and ending at the close of trading on the ASX one day after the announcement of BOQrsquos half year results
bull the period commencing 1 September and ending at the close of trading on the ASX one day after the announcement of BOQrsquos full year results or
bull any other period nominated from time to time by the Chair MD amp CEO or Chief Financial Officer of BOQ
If a Director employee or contractor has inside information about the BOQ Group they must not deal in BOQ securities at any time including outside of a blackout period
58 USE OF REMUNERATION CONSULTANTSWhere necessary the Board seeks advice from independent experts and advisors including remuneration consultants The remuneration consultants are engaged by the Chair of the PCRC in order to ensure upon engagement that the appropriate level of independence exists from Management Reports provided by independent consultants are submitted directly to the Chair of the PCRC Where the consultantrsquos engagement requires a recommendation the recommendation is provided to and discussed directly with the PCRC Chair in accordance with the requirements of the Corporations Act
During FY21 the PCRC did not engage independent advisors to provide remuneration recommendations
For the year ended 31 August 2021REMUNERATION REPORT
Remuneration Snapshot 78 | Key Management Personnel 80 | Remuneration Outcomes 81 | Remuneration Strategy amp Structure 88
92 Bank of Queensland Limited and its Controlled Entities
59 EXECUTIVE CONTRACTSThe remuneration and terms of Senior Executivesrsquo employment are formalised in their Executive Services Agreement (ESA) Each ESA provides for the payment of fixed and performance-based variable remuneration superannuation and other benefits such as statutory leave entitlements The employment terms of each ESA is summarised in Table 9
TABLE 9 - SENIOR EXECUTIVE CONTRACT TERMS
Position TitleNotice Period by Executive
Employer Notice Period Termination Payments (includes Notice Periods)
Current Senior Executives
George Frazis Managing Director amp Chief Executive Officer 6 months 9 months 9 monthsrsquo fixed remuneration in lieu of notice
Debra Eckersley Group Executive People amp Culture 6 months 6 months 6 monthsrsquo fixed remuneration in lieu of notice
Martine Jager Group Executive Retail Banking 6 months 6 months 6 monthsrsquo fixed remuneration in lieu of notice
Adam McAnalen Chief Risk Officer 6 months 6 months 6 monthsrsquo fixed remuneration in lieu of notice
Fiamma Morton Group Executive Business Banking 6 months 6 months 6 monthsrsquo fixed remuneration in lieu of notice
Craig Ryman Chief Information Officer 6 months 6 months 6 monthsrsquo fixed remuneration in lieu of notice
Ewen Stafford Chief Financial Officer amp Chief Operating Officer 6 months 6 months 6 monthsrsquo fixed remuneration in lieu of notice
Former Senior Executives
Lyn McGrath Group Executive Retail Banking 3 months 3 months 3 monthsrsquo fixed remuneration in lieu of notice
For the year ended 31 August 2021REMUNERATION REPORT
Remuneration Governance 90 | Non-Executive Director Remuneration 94 | Statutory Tables 95
932021 Annual Report
SECTION 6 NON-EXECUTIVE DIRECTOR REMUNERATION61 FEE POOLNED fees are determined within an aggregate fee pool limit The pool currently stands at $2800000 inclusive of superannuation and was approved by shareholders on 30 November 2016 The fee pool allows the Board flexibility with changes to its size and composition The Board will not be seeking an increase to the fee pool at the 2021 AGM
62 REMUNERATION FRAMEWORKNED fees are set to attract and retain individuals of appropriate calibre to the Board and Committees Fees are reviewed annually by the PCRC having regard for the external market of similarly sized and comparably complex organisations
The Board Chairrsquos fee is determined independently from the fees of other Directors and is also based on the external market The Chair is not present at any discussions relating to the determination of his own remuneration
In order to maintain independence and impartiality NEDs to do not receive any performance-based remuneration including share options or rights subject to a performance condition in addition to their prescribed fees NEDs are not provided with retirement benefits apart from statutory superannuation
The BOQ Constitution allows the Company to pay Directors additional remuneration for extra or special services performed
63 BOARD COMMITTEESFrom 1 September 2020 all NEDs serve on the Board Audit Nomination amp Governance People Culture amp Remuneration Risk and Transformation amp Technology (previously Information Technology until 26 November 2020) Committees
64 ME BANKBOQ NEDs became Directors of the ME Bank Limited Board on 1 July 2021 All NEDs assumed equivalent roles with ME Bank Limited for example Patrick Allaway is the Chair of the ME Bank Board and all other NEDs are members
In accordance with APRA regulation the Board of ME Bank Limited is required to maintain its own Board Audit and Board Risk Committees Karen Penrose serves as the Chair of the ME Bank Board Audit Committee and Bruce Carter serves as the Chair of the ME Bank Board Risk Committee All other NEDs are members of both committees
No additional fees are payable for chairmanship or membership of the ME Bank Board or its Board committees
65 NED FEE STRUCTURETo reflect the revised committee composition and to provide fairness and simplicity on 1 September 2020 BOQ moved to a flat fee structure inclusive of superannuation which is payable up to the maximum contributions base The only instances where additional committee fees are payable are in relation to the Due Diligence Committee and the Investment Committee which are paid on a per-meeting basis
During FY21 the Board approved an additional fee for three NEDs resulting from additional work undertaken in relation to the ME Bank acquisition
A benchmarking exercise was undertaken during FY21 and consequently the Board approved an increase to NED fees for FY22 effective 1 September 2021
For the year ended 31 August 2021REMUNERATION REPORT
Remuneration Snapshot 78 | Key Management Personnel 80 | Remuneration Outcomes 81 | Remuneration Strategy amp Structure 88
94 Bank of Queensland Limited and its Controlled Entities
65 NED FEE STRUCTURE (CONTINUED)The FY21 and FY22 fee structures are set out in Table 10
TABLE 10 - FY21 AND FY22 NED FEES (INCLUSIVE OF SUPERANNUATION)
FY21 (01092020 - 31082021) FY22 (01092021 - 31082022)
ChairCommittee Chair (1)
$
DirectorsCommittee
Members$
ChairCommittee Chair
$
DirectorsCommittee
Members$
Annual Fees
Base fees 420000 165000 500000 185000
Committee fees(2) 30000 80000 50000 80000
St Andrewrsquos Board(3) - 50000 - 50000
Per meeting Fees
Investment Committee 2500 1750 2500 1750
Due Diligence Committee 2500 1750 2500 1750
One-off fees
ME Bank acquisition(4) 50000 25000 na na
(1) The Chair receives no additional remuneration for involvement with Committees(2) A flat fee applies for the following Committees Audit Nomination amp Governance People Culture amp Remuneration Risk and Transformation amp Technology(3) Karen Penrose is also a member of the St Andrewrsquos Board of Directors(4) The Board approved payment of an additional one-off fee of $50000 to Patrick Allaway the Chair and $25000 each to NEDs Karen Penrose and Warwick Negus due to their
involvement in the due diligence phase of the ME Bank acquisition For Ms Penrose and Mr Negus this fee was paid instead of their per-meeting Due Diligence Committee fees
66 NED FEE SACRIFICE RIGHTS PLANAt the beginning of FY21 as in prior years offers were made under the NED Fee Sacrifice Rights Plan Five NEDs elected to participate in the Plan the details of which are provided in Table 11
TABLE 11 - TERMS OF THE NED FEE SACRIFICE RIGHTS PLAN
Purpose The Planrsquos purpose is to provide an opportunity for NEDs to increase their shareholding in a tax effective manner The Plan meets regulatory and tax requirements
Value At the beginning of the participation period NEDs can nominate a percentage of their pre-tax fees (up to 100) to receive in Rights to shares in BOQ
Vesting PeriodRights vest and convert to shares following the completion of the participation period For FY21 the participation period was the twelve months from 1 September 2020 to 31 August 2021 The rights do not have any performance conditions in order to preserve the NEDsrsquo independence
Disposal Restrictions Shares received on exercise will be subject to a disposal restriction of at least three years or longer as nominated by the Director (up to 15 years from grant date)
Cessation of DirectorshipIf a participant ceases to be a NED prior to the Rights vesting they will retain a pro-rata number of Rights based on the period they were a NED If directorship ceases during the restriction period any disposal restrictions on the shares will be lifted subject to a minimum trading restriction of 12 months
SECTION 7 STATUTORY TABLES71 STATUTORY DISCLOSURESThe following tables include details of the nature and amount as required by the Corporations Act 2001 (Cth) of each major element of the remuneration of each Director and Senior Executive of the Group calculated in accordance with accounting standards
For the year ended 31 August 2021REMUNERATION REPORT
Remuneration Governance 90 | Non-Executive Director Remuneration 94 | Statutory Tables 95
952021 Annual Report
71
STAT
UTOR
Y DI
SCLO
SURE
S (C
ONTI
NUED
)
TAB
LE 12
- D
IREC
TORS
rsquo REM
UN
ERAT
ION
Det
ails
of t
he n
atur
e an
d am
ount
of e
ach
maj
or e
lem
ent o
f the
rem
uner
atio
n of
eac
h D
irect
or o
f the
Gro
up a
re a
s ou
tline
d in
the
tabl
e be
low
Shor
t-Te
rm
Long
-Ter
m
Shar
e B
ased
Pay
men
ts
Sala
ry
and
fees
(1) $
Non
-m
onet
ary
bene
fits
(2) $
Oth
er
shor
t ter
m
bene
fits
(3) $
Tota
l sh
ort t
erm
be
nefi
ts $
Post
em
ploy
men
t (4) $
Oth
er
long
term
(5) $
Term
inat
ion
Ben
efit
sRi
ghts
(6) $
Shar
es
and
unit
s(7) $
Tota
l $
Prop
ortio
n of
re
mun
erat
ion
perf
orm
ance
re
late
d
Valu
e of
rig
hts a
s pr
opor
tion
of
rem
uner
atio
n
Exec
utiv
e D
irec
tor
Geo
rge
Fraz
is20
211
262
032
158
4095
843
137
371
522
163
445
75-
545
249
219
375
220
50
7735
25
2020
124
782
315
840
434
491
3071
1226
426
375
5-
982
7721
937
516
549
4519
6
Non
-Exe
cuti
ve D
irec
tors
- C
urre
nt (8
)
Patr
ick
Alla
way
Patr
ick
Alla
way
2021
361
724
--
361
724
242
81
--
-8
399
547
00
00
--
2020
293
201
--
293
201
219
90-
--
787
5639
394
7-
-
Bru
ce C
arte
r20
2123
90
6-
-23
90
62
125
--
274
998
301
029
--
2020
115
--
115
--
--
266
00
326
611
8 -
-
Deb
orah
Kie
rs(9
)20
2115
186
--
1518
61
519
--
--
167
05
--
John
Lor
imer
2021
223
575
--
223
575
214
25-
--
-24
50
00
--
2020
197
540
-
-19
754
0
187
66-
--
-21
630
6 -
-
War
wic
k N
egus
2021
392
75-
-39
275
147
7-
-27
499
831
575
0-
-
2020
222
59-
-22
259
--
--
208
050
230
30
9-
-
Kare
n Pe
nros
e20
2131
543
131
543
123
113
324
9437
10
38-
-
2020
263
566
--
263
566
212
72
--
-25
60
031
04
38-
-
Mic
kie
Ros
en (1
0)20
2111
177
1-
-11
177
110
566
--
--
122
337
--
Non
-Exe
cuti
ve D
irec
tors
- F
orm
er (8
)
Kath
leen
Bai
ley-
Lor
d (11)
20
2116
30
16-
-16
30
1619
935
--
-45
373
228
324
--
2020
1371
46-
-13
7146
129
14
--
-60
773
210
833
--
Mic
helle
Tre
deni
ck (1
2)20
2169
150
--
6915
05
895
--
--
750
45-
-
2020
235
00
0
--
235
00
020
898
--
--
255
898
--
(1)
For G
eorg
e Fr
azis
sal
ary
and
fees
refe
rs t
o fi
xed
rem
uner
atio
n in
clud
ing
annu
al le
ave
accr
ued
or u
tilis
ed d
urin
g th
e fi
nanc
ial y
ear
(2)
Non
-mon
etar
y be
nefi
ts re
late
to
com
pany
-fun
ded
bene
fits
suc
h ca
r par
king
acc
omm
odat
ion
and
trav
el
(3)
Oth
er s
hort
ter
m b
enef
its
rela
tes
to a
ccom
mod
atio
n al
low
ance
(4
) Po
st-e
mpl
oym
ent i
nclu
des
supe
rann
uati
on b
enef
its
(5)
Com
pris
es lo
ng s
ervi
ce le
ave
accr
ued
or u
tilis
ed d
urin
g th
e fi
nanc
ial y
ear
(6)
The
fair
valu
e of
the
rig
hts
is c
alcu
late
d at
the
dat
e of
gra
nt u
sing
an
indu
stry
acc
epte
d op
tion
pri
cing
mod
el a
nd
allo
cate
d to
eac
h re
port
ing
peri
od e
venl
y ov
er t
he p
erio
d fr
om g
rant
dat
e to
ves
ting
dat
e
(7)
Repr
esen
ts t
he v
alue
of r
estr
icte
d sh
ares
aw
arde
d th
roug
h de
ferr
ed S
TI p
aym
ents
or N
on-E
xecu
tive
Dire
ctor
Fee
Sa
crif
ice
Righ
ts P
lan
(8)
The
Ban
k ha
s al
so p
aid
insu
ranc
e pr
emiu
ms
in re
spec
t of D
irect
orrsquos
and
Offi
cers
rsquo Lia
bilit
y In
sura
nce
whi
ch is
not
re
flec
ted
in t
he a
bove
tab
le a
s th
ere
is n
o ap
prop
riat
e ba
sis
for a
lloca
tion
(9
) C
omm
ence
d as
KM
P on
5 A
ugus
t 20
21
(10)
Com
men
ced
as K
MP
on 4
Mar
ch 2
021
(1
1) C
ease
d as
KM
P on
5 A
ugus
t 20
21
(12)
Cea
sed
as K
MP
on 8
Dec
embe
r 20
20
For the year ended 31 August 2021REMUNERATION REPORT
Remuneration Snapshot 78 | Key Management Personnel 80 | Remuneration Outcomes 81 | Remuneration Strategy amp Structure 88
96 Bank of Queensland Limited and its Controlled Entities
71
STAT
UTOR
Y DI
SCLO
SURE
S (C
ONTI
NUED
)
TAB
LE 13
- S
ENIO
R EX
ECU
TIV
E R
EMU
NER
ATIO
ND
etai
ls o
f the
nat
ure
and
amou
nt o
f eac
h m
ajor
ele
men
t of t
he re
mun
erat
ion
of e
ach
Seni
or E
xecu
tive
of t
he G
roup
are
as
outli
ned
in th
e ta
ble
belo
w
Shor
t-Te
rm
Long
-Ter
m
Shar
e B
ased
Pay
men
ts
Sala
ry
and
fees
(1) $
STI a
t ri
sk(2
) $
Non
-m
onet
ary
bene
fits
(3) $
Oth
er
shor
t ter
m
bene
fits
(4) $
Tota
l sh
ort t
erm
be
nefi
ts $
Post
em
ploy
men
t (5) $
Oth
er
long
ter
m(6
) $Te
rmin
atio
n B
enef
its
Righ
ts(7
) $
Shar
es
and
unit
s(8) $
Tota
l $
Prop
orti
on o
f re
mun
erat
ion
perf
orm
ance
re
late
d
Val
ue o
f ri
ghts
as
prop
orti
on o
f re
mun
erat
ion
Exec
utiv
es -
Cur
rent
Deb
ra E
cker
sley
2021
549
832
--
549
832
2216
326
215
-27
560
694
50
096
83
1638
28
2020
518
88
5 -
-
51
88
85
2117
62
796
-10
472
994
50
074
20
86
27
14
Mar
tine
Jag
er(8
)20
2124
366
42
971
-24
663
511
316
438
1-
209
06
-28
323
87
7
Ada
m M
cAna
len
2021
682
993
533
211
9568
952
022
163
78
13-
274
244
113
906
110
764
633
25
2020
6316
04
512
0
920
637
644
21
176
340
28-
102
315
113
906
909
069
17
11
Fiam
ma
Mor
ton
2021
662
212
158
40-
678
052
2216
315
530
-19
313
229
531
938
40
824
21
2020
173
850
2
237
-
176
087
83
8949
1-
-29
531
214
498
14
-
Cra
ig R
yman
2021
703
652
158
40-
719
492
2216
314
30
9-
193
132
153
5696
445
222
20
2020
926
06
20
83
-94
689
5
424
265
--
153
5611
573
413
-
Ewen
Sta
ffor
d20
2170
328
947
00
4-
750
293
2216
325
064
-26
771
710
621
511
714
5232
23
2020
548
421
3211
9-
580
540
2117
6 16
23-
525
1610
621
576
20
7021
7
Exec
utiv
es -
For
mer
Lyn
McG
rath
(9)
2021
278
00
950
00
08
729
-33
673
810
073
--
(114
860
)99
844
331
795
11
(35
)
2020
612
922
208
23
-63
374
521
176
368
8-
118
08
111
48
44
891
534
26
13
(1)
Sala
ry a
nd fe
es re
fers
to
fixe
d re
mun
erat
ion
incl
udin
g an
nual
leav
e ac
crue
d or
uti
lised
dur
ing
the
fina
ncia
l yea
r(2
) Pr
o-ra
ted
FY21
STI
for L
yn M
cGra
th f
orm
er G
roup
Exe
cuti
ve R
etai
l Ban
king
in
resp
ect o
f the
per
iod
1 Sep
tem
ber 2
020
- 3
1 Jan
uary
20
21 i
n FY
20 a
ll KM
P ST
I was
aw
arde
d in
Res
tric
ted
Shar
es(3
) C
ompa
ny-f
unde
d be
nefi
ts (a
nd a
ssoc
iate
d FB
T) s
uch
as c
ar p
arki
ng a
ccom
mod
atio
n or
relo
cati
on a
nd t
rave
l(4
) B
enef
its
such
as
allo
wan
ces
(5)
Post
-em
ploy
men
t inc
lude
s su
pera
nnua
tion
ben
efit
s(6
) C
ompr
ises
long
ser
vice
leav
e ac
crue
d or
uti
lised
dur
ing
the
fina
ncia
l yea
r (7
) Th
e fa
ir va
lue
of t
he r
ight
s is
cal
cula
ted
at t
he d
ate
of g
rant
usi
ng a
n in
dust
ry a
ccep
ted
opti
on p
rici
ng m
odel
and
allo
cate
d to
eac
h re
port
ing
peri
od e
venl
y ov
er t
he p
erio
d fr
om g
rant
dat
e to
ves
ting
dat
e(8
) Re
pres
ents
the
val
ue o
f res
tric
ted
shar
es a
war
ded
thro
ugh
defe
rred
STI
pay
men
ts o
r in
lieu
of fo
rgon
e in
cent
ives
(9
) M
arti
ne J
ager
com
men
ced
as G
roup
Exe
cuti
ve R
etai
l Ban
king
on
27 A
pril
2021
(1
0) L
yn M
cGra
th re
tire
d an
d ce
ased
as
Gro
up E
xecu
tive
Ret
ail B
anki
ng o
n 31
Jan
uary
20
21 F
Y21 S
TI a
war
d is
incl
usiv
e of
sup
eran
nuat
ion
and
was
pro
-rat
ed fo
r 5 m
onth
s T
he S
TI a
war
ded
was
25
per c
ent o
f pro
-rat
ed t
arge
t STI
and
14 p
er c
ent o
f pr
o-ra
ted
max
imum
STI
86
per c
ent o
f pro
-rat
ed m
axim
um S
TI w
as fo
rfei
ted
Lyn
ele
cted
to
forf
eit h
er 2
018
PA
Rs
a p
ro-r
ata
port
ion
of h
er 2
019
PA
Rs
rem
ains
on
foot
to
vest
in t
he n
orm
al c
ours
e s
ubje
ct t
o th
e or
igin
al t
erm
s an
d co
ndit
ions
of
the
awar
d
For the year ended 31 August 2021REMUNERATION REPORT
Remuneration Governance 90 | Non-Executive Director Remuneration 94 | Statutory Tables 95
972021 Annual Report
72 EQUITY HELD BY SENIOR EXECUTIVES
TABLE 14 - MOVEMENT IN EQUITY AWARDS HELD BY SENIOR EXECUTIVES DURING THE FINANCIAL YEAR 2021
Movements during the 2021 Financial Year
Senior (1) Executive Type
Grant Date
Share Price at
Grant Date (2)
$
Balance at 1 Sep
2020 Granted (3) Exercised Lapsed
Balance at 31 Aug
2021 (3)(4)
Vested during
the Year (5)
()
Current
George Frazis 2019 PARs 19122019 736 143215 - - - 143215 -
2021 Performance Shares 6012021 770 - 146566 - - 146566 -
2021 Premium Priced Options 6012021 770 - 1628456 - - 1628546 -
Restricted Shares 6012021 770 - 85443 - - 85443 -
Debra Eckersley 2018 PARs 11122018 974 49450 - - - 49450 -
2019 PARs 19122019 736 57397 - - 57397 -
2021 Performance Shares 6012021 770 - 56158 - - 56158 -
2021 Premium Priced Options 6012021 770 - 623956 - - 623956 -
Restricted Shares 6012021 770 - 36807 - - 36807 -
Martine Jager 2021 Performance Shares 30062021 911 - 20493 - - 20493 -
2021 Premium Priced Options 30062021 911 - 151792 - - 151792 -
Adam McAnalen 2017 PARs 13122017 1271 7634 - - 7634 - -
2017 DARs 13122017 1271 1909 - 1909 - - 50
2018 PARs 11122018 974 10361 - - - 10361 -
2018 DARs 11122018 974 3014 - 1130 - 1884 30
2019 PARs 19122019 736 65597 - - - 65597 -
2021 Performance Shares 6012021 770 - 67691 - - 67691 -
2021 Premium Priced Options 6012021 770 - 752090 - - 752090 -
Restricted Shares 6012021 770 - 44365 - - 44365 -
Fiamma Morton 2021 Performance Shares 6012021 770 - 70198 - - 70198 -
2021 Premium Priced Options 6012021 770 - 779945 - - 779945 -
Restricted Shares 6012021 770 - 11502 - - 11502 -
Craig Ryman 2021 Performance Shares 6012021 770 - 70198 - - 70198 -
2021 Premium Priced Options 6012021 770 - 779945 - - 779945 -
Restricted Shares 6012021 770 - 5981 - - 5981 -
Ewen Stafford 2019 PARs 19122019 736 76529 - - - 76529 -
2021 Performance Shares 6012021 770 - 70198 - - 70198 -
2021 Premium Priced Options 6012021 770 - 779945 - - 779945 -
Restricted Shares 6012021 770 - 41369 - - 41369 -
Former
Lyn McGrath 2018 PARs 11122018 974 59811 - - 59811 - -
Restricted Shares 11122018 974 8478 - 4239 - 4239 30
2019 PARs 10022020 736 68877 - - 50038 18839 -
Restricted Shares 6012021 770 - 34506 - - 34506 -
(1) Senior Executives with nil shareholding movements while KMP have been excluded from the table above (2) Restricted shares granted on 6 January 2021 are valued as at the FY20 STI allocation date rather than the grant date(3) This represents the maximum number of equity awards that may vest to each Executive(4) Balance amounts as at 31 August 2021 are unvested and not yet exercisable(5) Percentage of initial grant
For the year ended 31 August 2021REMUNERATION REPORT
Remuneration Snapshot 78 | Key Management Personnel 80 | Remuneration Outcomes 81 | Remuneration Strategy amp Structure 88
98 Bank of Queensland Limited and its Controlled Entities
72 EQUITY HELD BY SENIOR EXECUTIVES (CONTINUED)
TABLE 15 - VALUE OF EQUITY AWARDS HELD BY SENIOR EXECUTIVES DURING THE FINANCIAL YEAR 2021
Senior Executive Grant Grant Date
Fair Value per equity
award at Grant Date (1)
$
Value at Grant Date (2)
$ Exercise Date
Share Price at Exercise
Date (3) $
Value at Exercise
Date (4)
$
Expiry Lapsing
Date
Current
George Frazis 2019 PARs 19122019 361 517006 - - - 191220262021 Performance Shares 6012021 749 1097779 - - - -
2021 Premium Priced Options 6012021 057 928220 - - - 8122027
Restricted Shares 6012021 685 585285 - - - -
Debra Eckersley 2018 PARs 11122018 491 242800 - - - 11122025
2019 PARs 19122019 361 207203 - - - 191220262021 Performance Shares 6012021 749 420623 - - - -
2021 Premium Priced Options 6012021 056 349415 - - - 8122026
Restricted Shares 6012021 685 252128 - - - -
Martine Jager 2021 Performance Shares 30062021 886 181568 - - - -
2021 Premium Priced Options 30062021 099 150274 - - - 29062026
Adam McAnalen 2016 DARs 23122016 1145 41529 19122017 1266 9179 2312202113122018 956 10401 2312202123122019 735 13333 23122021
2017 PARs 13122017 714 54507 - - - 080320212017 DARs 13122017 1105 42178 13122018 956 7294 13122022
09122019 745 8530 1312202214122020 760 14508 13122022
2018 PARs 11122018 491 50873 - - - 111220252018 DARs 11122018 821 30935 09122019 745 5617 11122025
14122020 760 8588 111220252019 PARs 19122019 361 236805 - - - 191220262021 Performance Shares 6012021 749 507006 - - - -
2021 Premium Priced Options 6012021 056 421170 - - - 8122026
Restricted Shares 6012021 685 303900 - - - -
Fiamma Morton 2021 Performance Shares 6012021 749 525783 - - - -
2021 Premium Priced Options 6012021 056 436769 - - - 8122026
Restricted Shares 6012021 685 78789 - - - -
Craig Ryman 2021 Performance Shares 6012021 749 525783 - - - -
2021 Premium Priced Options 6012021 056 436769 - - - 8122026
Restricted Shares 6012021 685 40970 - - - -
(1) Restricted shares granted on 6 January 2021 are valued as at the FY20 STI allocation date rather than the grant date(2) Represents equity awards held at 1 September 2020 or granted during FY21(3) Closing share price on exercise date of rights that have a nil exercise price(4) Closing share price on exercise date multiplied by the number of rights exercised during the year
For the year ended 31 August 2021REMUNERATION REPORT
Remuneration Governance 90 | Non-Executive Director Remuneration 94 | Statutory Tables 95
992021 Annual Report
72 EQUITY HELD BY SENIOR EXECUTIVES (CONTINUED)
TABLE 15 - VALUE OF RIGHTS HELD BY SENIOR EXECUTIVES DURING THE FINANCIAL YEAR 2021 (CONTINUED)
Senior Executive Grant Grant Date
Fair Value per Right at
Grant Date (1) $
Value at Grant Date (2)
$ Exercise Date
Share Price at Exercise
Date (3) $
Value at Exercise
Date (4)
$
Expiry Lapsing
Date
Current (continued)
Ewen Stafford 2019 PARs 19122019 361 276270 - - - 19122026
2021 Performance Shares 6012021 749 525783 - - - -
2021 Premium Priced Options 6012021 056 436769 - - - 8122026
Restricted Shares 6012021 685 283378 - - - -
Former
Lyn McGrath Restricted Shares 17102018 1091 611702 30042019 889 348746 -
15082019 885 108244 -
11122019 727 33500 -
2018 PARs 11122018 491 293672 - - - 25022021
Restricted Shares 11122018 1062 150050 11122019 727 41083 -
7122020 765 32428 -
2019 PARs 10022020 361 248646 (5) - - - 19122026
Restricted Shares 6012021 685 236366 - - - -
(1) Restricted shares granted on 6 January 2021 are valued as at the FY20 STI allocation date rather than the grant date(2) Represents equity awards held at 1 September 2020 or granted during FY21(3) Closing share price on exercise date of rights that have a nil exercise price(4) Closing share price on exercise date multiplied by the number of rights exercised during the year(5) 18839 with a fair value of $68009 PARs remain as at 31 August 2021
For the year ended 31 August 2021REMUNERATION REPORT
Remuneration Snapshot 78 | Key Management Personnel 80 | Remuneration Outcomes 81 | Remuneration Strategy amp Structure 88
100 Bank of Queensland Limited and its Controlled Entities
73 OTHER EQUITY INSTRUMENTS - HOLDINGS AND MOVEMENTSThe number of other equity instruments held directly indirectly or beneficially by each Director Senior Executive or related party is set out in Table 16 All shares were acquired by NEDs under normal terms and conditions or through the NED Fee Sacrifice Rights Plan
TABLE 16 - NUMBER OF OTHER EQUITY INSTRUMENTS HELD DIRECTLY INDIRECTLY OR BENEFICIALLY
Ordinary shares (1)
Held at 1 September
2020Purchases
(Sales)
Rights granted under NED Fee
Sacrifice Rights Plan
Received on Exercise of
Rights Vesting of Restricted
Shares
Held at 31 August
2021
Directors - Current
Patrick Allaway 142737 42737 12268 - 197742
Bruce Carter 75620 22642 40165 - 138427
George Frazis 50000 40552 - - 90552
John Lorimer 21128 6326 - - 27454
Warwick Negus 51872 15531 40165 - 107568
Karen Penrose 19828 5937 4746 - 30511
Director - Former
Kathleen Bailey-Lord 13903 4163 6627 - na
Michelle Tredenick 19762 - - - na
Executives - Current
Debra Eckersley - 14879 - - 14879
Adam McAnalen 43614 36791 - 3039 83444
Executives - Former
Lyn McGrath 61719 - - 4239 na
(1) Directors and Senior executives with nil shareholding balances as at 31 August 2021 have been excluded from the table above
For the year ended 31 August 2021REMUNERATION REPORT
Remuneration Governance 90 | Non-Executive Director Remuneration 94 | Statutory Tables 95
1012021 Annual Report
74 TRANSACTIONS WITH KEY MANAGEMENT PERSONNEL (DIRECTORS amp SENIOR EXECUTIVES)
Loan transactionsLoans to KMP and their related parties (including close family members and entities over which the KMP andor their close family members have control joint control or significant influence) are provided in the ordinary course of business Normal commercial terms and conditions are applied to all loans Any discounts provided to KMP are the same as those available to all employees of the Group There have been no write-downs or amounts recorded as provisions during FY21
Details of loans held by KMP and their related parties during FY21 where the individualrsquos aggregate loan balance exceeded $100000 at any time in this period are as follows
TABLE 17 - INDIVIDUAL LOAN TRANSACTIONS WITH KMP (OVER $100000)
Balance at 1 September 2020
$
Interest charged during the year
$
Balance at 31 August 2021
$
Highest balance during the year
$
Executives
Debra Eckersley 350000 11508 350000 351046
Other Related Parties
George Frazis related parties 760430 34998 743279 763433
Details regarding the aggregate value of loans made guaranteed or secured by any entity in the Group to all Senior Executives and their related parties and the number of individuals in each group are as follows
TABLE 18 - AGGREGATED LOAN TRANSACTIONS WITH KMP
Balance at 1 September 2020
$
Interest charged during the year
$
Balance at 31 August 2021
$
Number in group at 31 August 2021
Executives 350000 11508 350000 1
Other Related Parties 760430 34998 743279 1
For the year ended 31 August 2021REMUNERATION REPORT
Remuneration Governance 90 | Non-Executive Director Remuneration 94 | Statutory Tables 95
102 Bank of Queensland Limited and its Controlled Entities
Indemnification of officersThe Bankrsquos Constitution supported by a Deed of Indemnity Insurance and Access provides an indemnity in favour of all directors and officers of the Bank against liabilities incurred by them in the capacity as officer to the maximum extent permitted by law
Insurance of officers Since the end of the previous financial year the Bank has paid insurance premiums in respect of a Directorsrsquo and Officersrsquo liability insurance contract The contract insures each person who is or has been a director or officer (as defined in the relevant policy) of the Bank against certain liabilities arising in the course of their duties to the Bank and its subsidiaries as defined in the relevant policy The Directors have not included details of the nature of the liabilities covered or the amount of the premium paid in respect of the insurance contract as such disclosure is prohibited under the terms of the contract
Directorsrsquo interestsDirectorsrsquo interests as at the date of this report were as follows
Ordinary shares
Patrick Allaway 197742
George Frazis 90552
Bruce Carter 138427
John Lorimer 27454
Warwick Negus 107568
Karen Penrose 30511
Deborah Kiers (1) -
Mickie Rosen (2) -
(1) Deborah Kiers was appointed as a Director of the Board on 5 August 2021(2) Mickie Rosen was appointed as a Director of the Board on 4 March 2021
Audit and non-audit servicesDuring the year KPMG the Bankrsquos auditor has performed certain other services in addition to their statutory duties The Board has considered the non-audit services provided during the year by the auditor are compatible with and did not compromise the auditorrsquos independence requirements of the Corporations Act 2001 (Cth) for the following reasons
bull all non-audit services were subject to the corporate governance procedures adopted by the Bank and have been reviewed by the Audit Committee to ensure they do not impact the integrity and objectivity of the auditor and
bull the non-audit services provided do not undermine the general principles relating to auditorrsquos independence as set out in APES 110 Code of Ethics for Professional Accountants as they did not involve reviewing or auditing the auditorrsquos own work acting in a management or decision making capacity for the Bank or acting as an advocate for the Bank or jointly sharing risks and rewards
Details of the amounts paid to the auditor of the Bank KPMG and its related practices for audit and non-audit services provided during the year are set out below and in Note 57 Auditor Remuneration
Consolidated Bank
KPMG Australia2021
$0002020$000
2021$000
2020$000
Audit services
- Statutory audits and reviews of the financial reports 2172 1857 1826 1437
- Regulatory audits and reviews as required by regulatory authorities 704 762 611 667
Total audit services 2876 2619 2437 2104
Audit related services
- Other assurance services 373 402 154 143
Total audit related services 373 402 154 143
Non-audit services
- Taxation services 116 122 116 77
- Other 250 192 250 174
Total non-audit services 366 314 366 251
Details of the amounts paid to other auditor for audit services provided during the year in respect of Members Equity Bank Limited (ME Bank) acquisition are set out below and in Note 57 Auditor Remuneration
Consolidated Bank
Other auditor2021
$0002020$000
2021$000
2020$000
Audit services
- Statutory audits and reviews of the financial reports 202 - - -
Total audit services 202 - - -
1032021 Annual Report
For the year ended 31 August 2021DIRECTORSrsquo REPORT
Lead auditorrsquos independence declarationThe lead auditorrsquos independence declaration is set out on page 105 and forms part of the Directorsrsquo report for the year ended 31 August 2021
Director and management changesDirector changes during the year
bull On 8 December 2020 Michelle Tredenick retired as Director of the Board
bull Mickie Rosen was appointed as a Director of the Board on 4 March 2021
bull Deborah Kiers was appointed as a Director of the Board on 5 August 2021
bull On 5 August 2021 Kathleen Bailey-Lord retired as Director of the Board
Management changes during the year
bull On 31 January 2021 Lyn McGrath retired as Group Executive Retail Banking
bull On 27 April 2021 Martine Jager commenced as Group Executive Retail Banking
bull On 30 September 2021 Fiamma Morton retired as Group Executive Business Banking
bull Chris Screen commenced as Group Executive Business Banking on 1 October 2021
bull Adam McAnalen will transition to a new role in the Group when David Watts commences as Group Chief Risk Officer in early 2022
Management attestationThe Board has been provided with a joint written statement from the Grouprsquos Managing Director amp CEO and Chief Financial Officer amp Chief Operating Officer confirming that in their opinion the financial records of the Bank and the Group have been properly maintained and the accompanying financial statements and notes are in accordance with the Corporations Act 2001 (Cth) and comply with accounting standards and present a true and fair view in all material respects of the Bankrsquos and Grouprsquos financial position and performance as at and for the year ended 31 August 2021
The Directorsrsquo Declaration can be found on page 183 of the financial statements
Environmental regulationThe Grouprsquos operations are not subject to any significant environmental regulations under either Commonwealth or State legislation The Board confirms that the Group is not aware of any breach of environmental requirements
Subsequent eventsDividends have been determined after 31 August 2021 The financial effect of the dividends has not been brought to account in the financial statements for the year ended 31 August 2021 Further details with respect to the dividend amounts per share payment date and dividend reinvestment plan can be obtained from Note 24 Dividends of the consolidated financial statements
The evolution of the COVID-19 pandemic remains uncertain including the duration of the pandemic the severity of the downturn and the speed of the economic recovery BOQ has considered whether events subsequent to the reporting date have confirmed conditions existing as at reporting date and has not identified any COVID-19 related developments which would require adjustments to the amounts or disclosures contained in the consolidated financial statements Future economic conditions may differ to the assumptions and scenarios used in the consolidated financial statements the impact of which will be reflected in future reporting periods
No matters or circumstances have arisen since the end of the financial year and up until the date of this report which significantly affect the operations of the Bank the results of those operations or the state of affairs of the Bank in subsequent years
RoundingIn accordance with applicable financial reporting regulations and current industry practices amounts in this report have been rounded to the nearest one million dollars unless otherwise stated Any discrepancies between total and sums of components in tables contained in this report are due to rounding
Operating and Financial ReviewOur Operating and Financial Review is contained in pages 12 ndash 75 of this report
Signed in accordance with a resolution of the Directors
George Frazis Managing Director amp CEO 12 October 2021
Patrick Allaway Chairman 12 October 2021
104 Bank of Queensland Limited and its Controlled Entities
For the year ended 31 August 2021DIRECTORSrsquo REPORT
105 KPMG an Australian partnership and a member firm of the KPMG global organisation of independent member firms
affiliated with KPMG International Limited a private English company limited by guarantee All rights reserved The KPMG name and logo are trademarks used under license by the independent member firms of the KPMG global organisation Liability limited by a scheme approved under Professional Standards Legislation
Lead Auditorrsquos Independence Declaration under
Section 307C of the Corporations Act 2001
To the Directors of Bank of Queensland Limited
I declare that to the best of my knowledge and belief in relation to the audit of Bank of Queensland Limited for the financial year ended 31 August 2021 there have been
i no contraventions of the auditor independence requirements as set out in the Corporations Act 2001 in relation to the audit and
ii no contraventions of any applicable code of professional conduct in relation to the audit
KPM_INI_01
KPMG Shaun Kendrigan Partner Sydney 12 October 2021
LEAD AUDITORrsquoS INDEPENDENCE DECLARATION UNDER SECTION 307C OF THE CORPORATIONS ACT 2001
105 KPMG an Australian partnership and a member firm of the KPMG global organisation of independent member firms
affiliated with KPMG International Limited a private English company limited by guarantee All rights reserved The KPMG name and logo are trademarks used under license by the independent member firms of the KPMG global organisation Liability limited by a scheme approved under Professional Standards Legislation
Lead Auditorrsquos Independence Declaration under
Section 307C of the Corporations Act 2001
To the Directors of Bank of Queensland Limited
I declare that to the best of my knowledge and belief in relation to the audit of Bank of Queensland Limited for the financial year ended 31 August 2021 there have been
i no contraventions of the auditor independence requirements as set out in the Corporations Act 2001 in relation to the audit and
ii no contraventions of any applicable code of professional conduct in relation to the audit
KPM_INI_01
KPMG Shaun Kendrigan Partner Sydney 12 October 2021
1052021 Annual Report
2021 FINANCIAL STATEMENTS
Consolidated Bank
Note2021
$m2020
$m2021
$m2020
$m
Interest income
Effective interest income 21 1576 1676 1367 1597
Other 21 112 120 117 134
Interest expense 21 (560) (810) (705) (1008)
Net interest income 21 1128 986 779 723
Other operating income 21 118 103 228 220
Net banking operating income 1246 1089 1007 943
Net insurance operating income 21 7 11 - -
Total operating income before impairment and operating expenses 21 1253 1100 1007 943
Expenses 22 (736) (752) (641) (705)
Impairment gain (loss) on loans and advances 33 21 (175) 13 (116)
Profit before income tax 538 173 379 122
Income tax expense 23 (169) (58) (115) (41)
Profit for the year 369 115 264 81
Profit attributable to
Equity holders of the parent 368 115 264 81
Other equity instruments holders 1 - - -
Profit for the year 369 115 264 81
Earnings per share (EPS) (1)
Basic EPS - Ordinary shares (cents) 26 670 254
Diluted EPS - Ordinary shares (cents) 26 626 244
(1) The basic and diluted earnings per share for August 2020 have been adjusted for the effects of the Grouprsquos capital raise that occurred in March 2021 The basic and diluted earnings per share for August 2021 have been adjusted for the effects of other equity instruments assumed on ME Bank acquisition (refer Note 310(B))
The Income Statements should be read in conjunction with the accompanying notes
108 Bank of Queensland Limited and its Controlled Entities
For the year ended 31 August 2021INCOME STATEMENTS
Financial Statements 108 | Signed Reports 183 | Shareholding Details 195 | Glossary 201
Consolidated Bank
2021$m
2020 $m
2021 $m
2020 $m
Profit for the year 369 115 264 81
Other comprehensive income net of income tax
Items that may be reclassified subsequently to profit or loss
Cash flow hedges
Net movement taken to equity 53 3 53 4
Net movement transferred to profit or loss 19 20 19 20
Debt instruments at fair value through other comprehensive income (FVOCI)
Net change in fair value 35 - 35 -
Net movement transferred to profit or loss (12) (12) (12) (12)
Other comprehensive income net of income tax 95 11 95 12
Total comprehensive income for the year 464 126 359 93
Total comprehensive income attributable to
Equity holders of the parent 463 126 359 93
Other equity instruments holders 1 - - -
Total comprehensive income for the year 464 126 359 93
The Statements of Comprehensive Income should be read in conjunction with the accompanying notes
1092021 Annual Report
For the year ended 31 August 2021STATEMENTS OF COMPREHENSIVE INCOMESTATEMENTS OF COMPREHENSIVE INCOME
Financial Statements 108 | Signed Reports 183 | Shareholding Details 195 | Glossary 201
Consolidated Bank
Note2021
$m2020
$m2021
$m2020
$m
ASSETS
Cash and cash equivalents 31 2563 1353 1373 835
Due from other financial institutions 827 860 708 826
Derivative financial assets 38 137 154 86 101
Financial assets at fair value through profit or loss (FVTPL) 32 1087 1854 1087 1854
Debt instruments at FVOCI 32 9701 4530 5548 4530
Equity instruments at FVOCI 32 9 6 6 6
Debt instruments at amortised cost 32 - - 7699 7662
Loans and advances 33 75437 46674 44827 41520
Other assets 190 148 1154 1031
Current tax assets - 2 - 2
Property plant and equipment 198 148 120 142
Assets held for sale 55 43 - 30 -
Shares in controlled entities 55 - - 1910 552
Deferred tax assets 23 50 122 85 113
Intangible assets 41 1180 908 915 838
Investments in joint arrangements and associates 56 10 13 - -
Total assets 91432 56772 65548 60012
LIABILITIES
Due to other financial institutions - accounts payable at call 273 296 273 296
Deposits 34 65902 39593 43569 39810
Derivative financial liabilities 38 653 803 620 799
Accounts payable and other liabilities 575 458 360 385
Current tax liabilities 28 - 24 -
Liabilities held for sale 55 17 - - -
Provisions 42 64 47 43 38
Amounts due to controlled entities - - 6241 6707
Insurance policy liabilities - 5 - -
Borrowings 35 17723 11339 8806 7914
Total liabilities 85235 52541 59936 55949
Net assets 6197 4231 5612 4063
EQUITY
Issued capital 5213 3869 5224 3875
Other equity instruments 310 314 - - -
Reserves 376 184 383 194
Retained profits 294 178 5 (6)
Total equity 6197 4231 5612 4063
The Balance Sheets should be read in conjunction with the accompanying notes
110 Bank of Queensland Limited and its Controlled Entities
As at 31 August 2021BALANCE SHEETSBALANCE SHEETS
Financial Statements 108 | Signed Reports 183 | Shareholding Details 195 | Glossary 201
CONSOLIDATED
Issued capital
$m
Other equity
instruments $m
Employee benefits reserve
$m
Share Revaluation
Reserve $m
Equity reserve
for credit losses
$m
Cash flow hedge
reserve $m
FVOCI reserve
$m
Profit reserve
$m
Retained profits
$m
Total equity
$m
YEAR ENDED 31 AUGUST 2021
Balance as at 1 September 2020 3869 - 30 - 63 (142) 33 200 178 4231
Acquisition of ME Bank - 315 - - - - - - - 315
Total comprehensive income for the year
Profit for the year - - - - - - - - 369 369
Transfers to profit reserve - - - - - - - 264 (264) -
Other comprehensive income net of income tax
Cash flow hedges
Net movement to equity - - - - - 53 - - - 53
Net movement transferred to profit or loss - - - - - 19 - - - 19
Debt instruments at FVOCI
Net change in fair value - - - - - - 35 - - 35
Net movement transferred to profit or loss - - - - - - (12) - - (12)
Transfer to equity reserve for credit losses - - - - (11) - - - 11 -
Total other comprehensive income (expense) - - - - (11) 72 23 - 11 95
Total comprehensive income (expense) for the year - - - - (11) 72 23 264 116 464
Transactions with owners recorded directly in equity contributions by and distributions to owners
Institutional share placement (1) 350 - - - - - - - - 350
Institutional entitlement offer (2) 321 - - - - - - - - 321
Retail entitlement offer (3) 681 - - - - - - - - 681
Issues of ordinary shares (4) 1 - - - - - - - - 1
Dividend reinvestment plan 19 - - - - - - - - 19
Dividends to shareholders - - - - - - - (164) - (164)
Cost of capital issuance (23) - - - - - - - - (23)
Equity settled transactions - - 5 - - - - - - 5
Treasury shares (5) (5) - - 3 - - - - - (2)
Other equity instruments distributions paid - (1) - - - - - - - (1)
Total contributions by and distributions to owners 1344 (1) 5 3 - - - (164) - 1187
Balance at the end of the year 5213 314 35 3 52 (70) 56 300 294 6197
(1) On 23 February 2021 the Bank completed an institutional placement of new fully paid ordinary shares at the offer price of $735 per share The shares were issued on 3 March 2021(2) On 23 February 2021 the Bank completed an underwritten 1 for 334 accelerated pro-rata non-renounceable institutional entitlement offer at the offer price of $735 per
share The shares were issued on 3 March 2021(3) On 15 March 2021 the Bank completed an underwritten 1 for 334 accelerated pro-rata non-renounceable retail entitlement offer at the offer price of $735 per share The
shares were issued on 17 March 2021(4) On 9 November 2020 130000 ordinary shares were issued at $637 to the trustee of the Bank of Queensland Limited Employee Share Plans Trust to satisfy the issue of
shares under the BOQ Employee ThankQ Plan(5) Treasury shares represents the value of shares held by a subsidiary that the Bank is required to include in the Consolidated Entityrsquos financial statements The revaluation of
treasury shares is netted off in equity
The Statements of Changes in Equity should be read in conjunction with the accompanying notes
1112021 Annual Report
For the year ended 31 August 2021STATEMENTS OF CHANGES IN EQUITYSTATEMENTS OF CHANGES IN EQUITY
Financial Statements 108 | Signed Reports 183 | Shareholding Details 195 | Glossary 201
CONSOLIDATED
Issued capital
$m
Employee benefits reserve
$m
Equity reserve
for credit losses
$m
Cash flow
hedge reserve
$m
FVOCI reserve
$m
Profit reserve
$m
Retained profits
$m
Total equity
$m
YEAR ENDED 31 AUGUST 2020
Balance at beginning of the year 3497 26 62 (165) 45 245 149 3859
Change on adoption of new accounting standards (1) - - - - - - (4) (4)
Restated balance at beginning of the year 3497 26 62 (165) 45 245 145 3855
Total comprehensive income for the year
Profit for the year - - - - - - 115 115
Transfers to profit reserve - - - - - 81 (81) -
Other comprehensive income net of income tax
Cash flow hedges
Net movement to equity - - - 3 - - - 3
Net movement transferred to profit or loss - - - 20 - - - 20
Debt instruments at FVOCI
Net change in fair value - - - - - - - -
Net movement transferred to profit or loss - - - - (12) - - (12)
Equity instruments at FVOCI
Net change in fair value - - - - - - - -
Transfer to equity reserve for credit losses - - 1 - - - (1) -
Total other comprehensive income (expense) - - 1 23 (12) - (1) 11
Total comprehensive income (expense) for the year - - 1 23 (12) 81 33 126
Transactions with owners recorded directly in equity contributions by and distributions to owners
Institutional share placement (2) 250 - - - - - - 250
Dividend reinvestment plan 31 - - - - - - 31
Dividends to shareholders - - - - - (126) - (126)
Issues of ordinary shares (3) 4 - - - - - - 4
Cost of capital issue (3) - - - - - - (3)
Share purchase plan (4) 90 - - - - - - 90
Equity settled transactions - 4 - - - - - 4
Total contributions by and distributions to owners 372 4 - - - (126) - 250
Balance at the end of the year 3869 30 63 (142) 33 200 178 4231
(1) The August 2020 financial results reflect the adoption of AASB 16 on 1 September 2019 (2) On 26 November 2019 the Bank completed a capital raising by way of institutional share placement of new fully paid ordinary shares at an issue price of $778 per share The
shares were issued on 29 November 2019(3) On 29 November 2019 440000 ordinary shares were issued at $833 to the trustee of the Bank of Queensland Limited Employee Share Plans Trust to satisfy the exercise of
award rights and issue of shares under the Award Rights Plans and the issue of shares under the BOQ Restricted Share Plan and the BOQ Employee Share Plan(4) On 30 December 2019 the Bank completed the share purchase plan of new fully paid ordinary shares at an issue price of $727 per share The shares were issued on 2 January 2020
The Statements of Changes in Equity should be read in conjunction with the accompanying notes
112 Bank of Queensland Limited and its Controlled Entities
For the year ended 31 August 2021STATEMENTS OF CHANGES IN EQUITY
Financial Statements 108 | Signed Reports 183 | Shareholding Details 195 | Glossary 201
BANK
Issued capital
$m
Employee benefits reserve
$m
Equity reserve
for credit losses
$m
Cash flow
hedge reserve
$m
FVOCI reserve
$m
Profit reserve
$m
Retained profits
$m
Total equity
$m
YEAR ENDED 31 AUGUST 2021
Balance as at 1 September 2020 3875 30 64 (133) 33 200 (6) 4063
Total comprehensive income for the year
Profit for the year - - - - - - 264 264
Transfers to profit reserve - - - - - 264 (264) -
Other comprehensive income net of income tax
Cash flow hedges
Net movement to equity - - - 53 - - - 53
Net movement transferred to profit or loss - - - 19 - - - 19
Debt instruments at FVOCI
Net change in fair value - - - - 35 - - 35
Net movement transferred to profit or loss - - - - (12) - - (12)
Transfer to equity reserve for credit losses - - (11) - - - 11 -
Total other comprehensive income (expense) - - (11) 72 23 - 11 95
Total comprehensive income (expense) for the year - - (11) 72 23 264 11 359
Transactions with owners recorded directly in equity contributions by and distributions to owners
Institutional share placement (1) 350 - - - - - - 350
Institutional entitlement offer (2) 321 - - - - - - 321
Retail entitlement offer (3) 681 - - - - - - 681
Issues of ordinary shares (4) 1 - - - - - - 1
Dividend reinvestment plan 19 - - - - - - 19
Dividends to shareholders - - - - - (164) - (164)
Cost of capital issue (23) - - - - - - (23)
Equity settled transactions - 5 - - - - - 5
Total contributions by and distributions to owners 1349 5 - - - (164) - 1190
Balance at the end of the year 5224 35 53 (61) 56 300 5 5612
(1) On 23 February 2021 the Bank completed an institutional placement offer at the offer price of $735 per share The shares were issued on 3 March 2021(2) On 23 February 2021 the Bank completed an underwritten 1 for 334 accelerated pro-rata non-renounceable institutional entitlement offer at the offer price of $735 per
share The shares were issued on 3 March 2021(3) On 15 March 2021 the Bank completed an underwritten 1 for 334 accelerated pro-rata non-renounceable retail entitlement offer at the offer price of $735 per share The
shares were issued on 17 March 2021(4) On 9 November 2020 130000 ordinary shares were issued at $637 to the trustee of the Bank of Queensland Limited Employee Share Plans Trust to satisfy the issue of
shares under the BOQ Employee ThankQ Plan
The Statements of Changes in Equity should be read in conjunction with the accompanying notes
1132021 Annual Report
For the year ended 31 August 2021STATEMENTS OF CHANGES IN EQUITY
Financial Statements 108 | Signed Reports 183 | Shareholding Details 195 | Glossary 201
BANK
Issued capital
$m
Employee benefits reserve
$m
Equity reserve
for credit losses
$m
Cash flow
hedge reserve
$m
FVOCI reserve
$m
Profit reserve
$m
Retained profits
$m
Total equity
$m
YEAR ENDED 31 AUGUST 2020
Balance at beginning of the year 3503 26 63 (157) 45 245 (1) 3724
Change on adoption of new accounting standards (1) - - - - - - (4) (4)
Restated balance at beginning of the year 3503 26 63 (157) 45 245 (5) 3720
Total comprehensive income for the year
Profit for the year - - - - - - 81 81
Transfers to profit reserve - - - - - 81 (81) -
Other comprehensive income net of income tax
Cash flow hedges
Net movement to equity - - - 4 - - - 4
Net movement transferred to profit or loss - - - 20 - - - 20
Debt instruments at FVOCI
Net change in fair value - - - - - - - -
Net movement transferred to profit or loss - - - - (12) - - (12)
Equity instruments at FVOCI
Net change in fair value - - - - - - - -
Transfer to equity reserve for credit losses - - 1 - - - (1) -
Total other comprehensive income (expense) - - 1 24 (12) - (1) 12
Total comprehensive income (expense) for the year - - 1 24 (12) 81 (1) 93
Transactions with owners recorded directly in equity contributions by and distributions to owners
Institutional share placement (2) 250 - - - - - - 250
Dividend reinvestment plan 31 - - - - - - 31
Dividends to shareholders - - - - - (126) - (126)
Issues of ordinary shares (3) 4 - - - - - - 4
Cost of capital issue (3) - - - - - - (3)
Share purchase plan (4) 90 - - - - - - 90
Equity settled transactions - 4 - - - - - 4
Total contributions by and distributions to owners 372 4 - - - (126) - 250
Balance at the end of the year 3875 30 64 (133) 33 200 (6) 4063
(1) The August 2020 financial results reflect the adoption of AASB 16 on 1 September 2019 (2) On 26 November 2019 the Bank completed a capital raising by way of institutional share placement of new fully paid ordinary shares at an issue price of $778 per share
The shares were issued on 29 November 2019(3) On 29 November 2019 440000 ordinary shares were issued at $833 to the trustee of the Bank of Queensland Limited Employee Share Plans Trust to satisfy the exercise
of award rights and issue of shares under the Award Rights Plans and the issue of shares under the BOQ Restricted Share Plan and the BOQ Employee Share Plan(4) On 30 December 2019 the Bank completed the share purchase plan of new fully paid ordinary shares at an issue price of $727 per share
The shares were issued on 2 January 2020
The Statements of Changes in Equity should be read in conjunction with the accompanying notes
114 Bank of Queensland Limited and its Controlled Entities
For the year ended 31 August 2021STATEMENTS OF CHANGES IN EQUITY
Financial Statements 108 | Signed Reports 183 | Shareholding Details 195 | Glossary 201
Consolidated Bank
Note2021
$m2020
$m2021
$m2020
$m
CASH FLOWS FROM OPERATING ACTIVITIES
Interest received 1663 1694 1387 1537
Fees and other income received 127 125 205 206
Interest paid (569) (733) (712) (925)
Cash paid to suppliers and employees (622) (577) (531) (508)
Income tax paid (100) (89) (91) (87)
499 420 258 223
Increase (decrease) in operating assets
Loans and advances at amortised cost (3070) (874) (3443) (809)
Other financial assets (1001) (272) (173) (309)
Increase in operating liabilities
Deposits 3953 1318 3738 1330
Net cash inflow (outflow) from operating activities 31 381 592 380 435
CASH FLOWS FROM INVESTING ACTIVITIES
Acquisition of ME Bank net of cash acquired 55 (746) - (1388) -
Payments for property plant and equipment (9) (9) (9) (9)
Proceeds from sale of property plant and equipment 6 6 - 1
Payments for intangible assets 41 (119) (102) (115) (101)
Proceeds (payments) for investments in joint arrangements 2 - - -
Dividends received from controlled entities - - 4 4
Net cash inflow (outflow) from investing activities (866) (105) (1508) (105)
CASH FLOWS FROM FINANCING ACTIVITIES
Proceeds from borrowings 35 3628 2583 1844 2205
Repayments of borrowings 35 (3063) (3193) (937) (1625)
Net movement in other financing activities - - (378) (962)
Proceeds for issue of ordinary shares 1329 336 1329 336
Payments for treasury shares (7) (1) (7) (1)
Other equity instruments distribution paid (1) - - -
Dividends paid (145) (95) (145) (95)
Payment of lease liabilities (42) (38) (40) (38)
Net cash inflow (outflow) from financing activities 1699 (408) 1666 (180)
Net increase (decrease) in cash and cash equivalents 1214 79 538 150
Cash and cash equivalents at beginning of year 1353 1274 835 685
Cash and cash equivalents at end of year 31 2567 1353 1373 835
Cash and cash equivalents included in assets held for sale 55 (4) - - -
Cash and cash equivalents as presented in the Balance Sheets 2563 1353 1373 835
The Statements of Cash Flows should be read in conjunction with the accompanying notes
1152021 Annual Report
For the year ended 31 August 2021STATEMENTS OF CASH FLOWS
Financial Statements 108 | Signed Reports 183 | Shareholding Details 195 | Glossary 201
Page
Note 1 Basis of preparation 117
11 Reporting entity 117
12 Basis of preparation 117
13 Use of estimates and judgements 117
14 COVID-19 financial reporting considerations 118
15 New Australian accounting standards 119
Note 2 Financial performance 120
21 Operating income 120
22 Expenses 121
23 Income tax expense and deferred tax 122
24 Dividends 125
25 Operating segments 126
26 Earnings per share 128
Note 3 Capital and balance sheet management 129
31 Cash and cash equivalents 129
32 Financial assets and liabilities 130
33 Loans and advances 132
34 Deposits 141
35 Borrowings 142
36 Risk management 144
37 Fair value of financial instruments 154
38 Derivative financial instruments and hedge accounting 157
39 Capital management 163
310 Capital and reserves 164
Note 4 Other assets and liabilities 166
41 Intangible assets 166
42 Provisions 169
Note 5 Other notes 170
51 Employee benefits 170
52 Commitments 173
53 Contingent liabilities 173
54 Related parties information 173
55 Controlled entities 175
56 Investments in joint arrangements and associates 179
57 Auditorrsquos remuneration 180
58 Events subsequent to balance date 180
59 Significant accounting policies 181
116 Bank of Queensland Limited and its Controlled Entities
For the year ended 31 August 2021NOTES TO THE FINANCIAL STATEMENTS
Financial Statements 108 | Signed Reports 183 | Shareholding Details 195 | Glossary 201
NOTE 1 BASIS OF PREPARATION11 REPORTING ENTITYThe Bank of Queensland Limited (the Bank or BOQ) is a for-profit company domiciled in Australia Its registered office is Level 6 100 Skyring Terrace Newstead QLD 4006
The consolidated financial statements of the Bank for the financial year ended 31 August 2021 comprise the Consolidated Entity (or the Group) being the Bank and its controlled entities and the Consolidated Entityrsquos interest in equity accounting investments The principal activity of the Group is the provision of financial services to the community
12 BASIS OF PREPARATION(A) Statement of complianceThese general purpose financial statements have been prepared in accordance with Australian Accounting Standards and interpretations issued by the Australian Accounting Standards Board (AASB) and the Corporations Act 2001 (Cth) The consolidated financial statements and notes thereto also comply with International Financial Reporting Standards (IFRS) as issued by the International Accounting Standards Board (IASB) The consolidated financial statements were authorised for issue by the Directors on 12 October 2021
(B) Basis of measurementThe consolidated financial statements are prepared on a historical cost basis with the exception of the following assets and liabilities which are stated at their fair value
bull Derivative financial instruments
bull Financial instruments at FVTPL and
bull Financial instruments at FVOCI
(C) Functional and presentation currencyThe consolidated financial statements are presented in Australian dollars which is the Bankrsquos functional currency
(D) RoundingThe Group is of a kind referred to in ASIC Corporations Instrument 2016191 dated 24 March 2016 and in accordance with that instrument amounts in the consolidated financial statements have been rounded to the nearest million dollars unless otherwise stated
13 USE OF ESTIMATES AND JUDGEMENTS The preparation of a financial report in conformity with Australian Accounting Standards requires management to make judgements estimates and assumptions that affect the application of accounting policies and reported amounts of assets liabilities income and expenses These estimates and associated assumptions are based on historical experience and various other factors that are believed to be reasonable under the circumstances the results of which form the basis of making the judgements about carrying values of assets and liabilities that are not readily apparent from other sources Actual results may differ from these estimates These accounting policies have been consistently applied throughout the Group
The estimates and underlying assumptions are reviewed on an ongoing basis Revisions to accounting estimates are recognised in the period in which the estimates are revised if the revision only affects that period or in the period of the revision and future periods if the revision affects both current and future periods
Information about significant areas of estimation uncertainty and critical judgements in applying accounting policies that have the most significant effect on the amounts recognised in the financial statements are described below
bull Loans and advances - Expected credit losses (ECL) - Note 33
bull Financial instruments ndash Notes 32 and 37
bull Carrying value of goodwill and other intangible assets ndashNote 41
bull Provisions - Note 42 and
bull Business combinations - Note 55
1172021 Annual Report
For the year ended 31 August 2021NOTES TO THE FINANCIAL STATEMENTS
Financial Statements 108 | Signed Reports 183 | Shareholding Details 195 | Glossary 201
14 COVID-19 FINANCIAL REPORTING CONSIDERATIONSBackgroundThe COVID-19 pandemic together with measures implemented to contain the virus continues to create uncertainty for the Australian economy Although Gross Domestic Product (GDP) property prices and unemployment have been less severe than anticipated in FY20 we have seen on-going COVID-19 lockdowns across several states To mitigate the economic impact of the COVID-19 pandemic the Australian Banking Association (ABA) Council proposed that the banking industry offer further relief packages to small businesses and home loan customers that have been significantly impacted by current or recent lockdowns BOQ continues to support customers by offering Business Banking repayment deferrals Everyday Banking support and Home Loan support as proposed by the ABA
The Group continues to carefully consider the impact of COVID-19 in preparing its financial statements for the year ended 31 August 2021 including the increased estimation uncertainty associated with
bull Disruption to businesses as a result of continuing lockdowns
bull The extent and duration of the expected economic downturn including forecasts for growth unemployment and property prices and
bull The effect of government incentives and banking relief packages to support businesses and consumers through this economic downturn
The key impacts on the consolidated financial statements including the use of critical estimates and judgements are as follows
Provisions for impairmentIn assessing forecast conditions the Group has incorporated the effects of COVID-19 and government support measures based on reasonable and supportable information at the reporting date Model updates including a complete review of the overlays and adjustments in place as well as updated scenarios and scenario weightings to cater for economic uncertainties have been implemented in 2H21 Forward looking adjustments have been determined based on a probability weighted range of plausible economic and industry stress scenarios taking into account the mitigating impacts of government and industry assistance packages including loan repayment deferrals As the economy showed signs of a rebound and the economic outlook improved since the outbreak of COVID-19 this allowed for the release of some provisions raised in prior periods while maintaining a prudent provision coverage to cater for the ongoing uncertainty of the pandemic In line with guidance from APRA the Group has not treated the period of repayment deferrals offered as support for affected customers as a period of arrears nor an automatic significant increase in credit risk Refer to Note 33
GoodwillThe Group tested goodwill for impairment updating the assumptions and cash flow forecasts where necessary to reflect the potential impact of COVID-19 No impairments were required to be recognised for goodwill held across the Group as at 31 August 2021 Management judgement is required to determine the assumptions underpinning value-in-use calculations and changes in these key assumptions could have an adverse impact on the carrying value of goodwill Refer to Note 41
Hedge AccountingThe Group has considered the continued impact of COVID-19 on its existing hedges and whether they continue to meet the criteria for Hedge Accounting Hedged future cash flows including forecast rollovers of variable rate assets and liabilities remain highly probable Refer to Note 38
BorrowingsThe Term Funding Facility (TFF) was announced by the Reserve Bank of Australia (RBA) in March 2020 to provide three-year funding to ADIs as part of a package of measures to support the Australian economy The facility initially provided three-year funding to ADIs through repurchase transactions at a fixed pricing of 025 per cent per annum From 4 November 2020 the interest rate on new drawings was lowered to 01 per cent per annum As at 31 August 2021 $3 billion of the group facility has been drawn
The TFF is accounted for as borrowings with the securities pledged as collateral There are no substantive conditions attached to the ongoing use of the TFF and it is not linked to the provision of specific loans to customers However as the funding is in effect a below market interest loan from a Government entity the loan is classified as a Government Grant under AASB 120 Accounting for Government grants and Disclosure of Government Assistance Grants related to income can be deducted in reporting the related expense and as such the net interest expense will reflect the TFF reduced cost of borrowing Refer to Note 35
118 Bank of Queensland Limited and its Controlled Entities
For the year ended 31 August 2021NOTES TO THE FINANCIAL STATEMENTS
Financial Statements 108 | Signed Reports 183 | Shareholding Details 195 | Glossary 201
14 COVID-19 FINANCIAL REPORTING CONSIDERATIONS (CONTINUED)
Events subsequent to reporting dateThe evolution of the COVID-19 pandemic remains uncertain including the duration of the pandemic the severity of the downturn and the speed of the economic recovery BOQ has considered whether events subsequent to the reporting date have confirmed conditions existing as at reporting date and has not identified any COVID-19 related developments which would require adjustments to the amounts or disclosures contained in the consolidated financial statements Future economic conditions may differ to the assumptions and scenarios used in the consolidated financial statements the impact of which will be reflected in future reporting periods
15 NEW AUSTRALIAN ACCOUNTING STANDARDS
International Financial Reporting Standards Interpretations Committee final agenda decisions not yet adopted
In April 2021 the IFRS Interpretations Committee (IFRIC) published its second agenda decision in relation to Software as a Service (SaaS) cloud computing arrangements The decision discusses whether configuration or customisation expenditure relating to SaaS arrangements is able to be recognised as an intangible asset and if not over what time period the expenditure is expensed Specifically IFRIC stated that in most instances configuration and customisation costs incurred in implementing SaaS solutions will be treated as an operating expense
The Grouprsquos accounting policy has historically been to capitalise costs related to SaaS arrangements as intangible assets The adoption of the IFRIC decision could result in a reclassification of these intangible assets to either a prepaid asset on the Balance Sheet or recognition as an expense in the Income Statement impacting both the current and prior periods presented For ME Bank assets the adoption could result in an adjustment to the fair value of assets acquired and a corresponding increase to goodwill as part of the Grouprsquos acquisition accounting (refer Note 55 (C))
The Group has over 110 software assets and 40 software assets under construction (AUC) Both the scale and complexity of assessing such a large number of complex projects is such that BOQ has been unable to adopt this IFRIC agenda decision in advance of the year-end reporting date As such the existing policy of capitalising configuration and customisation costs continues to apply as at 31 August 2021
The complexity of the assessment also means that the impact of the IFRIC decision cannot be reasonably estimated at the reporting date At 31 August 2021 software assets with net book value of $188 million were subject to the detailed assessment BOQ will adopt the IFRIC decision in the HY2022 Consolidated Interim Report and restate prior period comparatives
1192021 Annual Report
For the year ended 31 August 2021NOTES TO THE FINANCIAL STATEMENTS
Financial Statements 108 | Signed Reports 183 | Shareholding Details 195 | Glossary 201
NOTE 2 FINANCIAL PERFORMANCE 21 OPERATING INCOME
Consolidated Bank
2021 $m
2020 $m
2021 $m
2020 $m
INTEREST INCOME
Effective interest income 1576 1676 1367 1597
Other Securities at fair value 112 120 117 134
Total interest income 1688 1796 1484 1731
INTEREST EXPENSE
Retail deposits (206) (388) (192) (388)
Wholesale deposits and borrowings (351) (419) (510) (617)
Lease liabilities (3) (3) (3) (3)
Total interest expense (560) (810) (705) (1008)
Net interest income 1128 986 779 723
INCOME FROM OPERATING ACTIVITIES
Customer fees and charges (1) 62 61 62 63
Share of fee revenue paid to owner-managed branches (6) (6) (6) (6)
Commissions 31 34 12 12
Foreign exchange income ndash customer based 13 11 13 12
Net profit (loss) on sale of property plant and equipment 5 4 - -
Net (loss) income from financial instruments and derivatives at fair value (4) (10) (5) (9)
Securitisation income - - 111 119
Dividend income - - 4 4
Management fees ndash controlled entities - - 29 21
Other income 17 9 8 4
Other operating income 118 103 228 220
INCOME FROM INSURANCE ACTIVITIES
Premiums from insurance contracts 42 50 - -
Investment revenue - 1 - -
Claims and policyholder liability expense from insurance contracts (35) (40) - -
Net insurance operating income 7 11 - -
Total operating income 1253 1100 1007 943
(1) Customer charges on lending banking and leasing products
Interest income and expenseInterest income and expense for all interest bearing financial instruments is recognised in the profit or loss using the effective interest rates of the financial assets or financial liabilities to which they relate
Interest income on finance lease receivables is recognised progressively over the life of the lease reflecting a constant periodic rate of return on the net investment
Other operating incomeOther operating income and expenses that are considered an integral part of the effective interest rate on a financial instrument are included in the measurement of the effective interest rate
Non-yield related application and activation lending fee revenue is recognised over the contract period in line with the performance obligation delivered to the customers Customer service fees that represent the recoupment of the costs of providing the service are recognised when the service is provided Commissions are recognised as income when performance obligations in respect of those commissions have been satisfied
Dividends are recognised when control of a right to receive consideration is established
120 Bank of Queensland Limited and its Controlled Entities
For the year ended 31 August 2021NOTES TO THE FINANCIAL STATEMENTS
Financial Statements 108 | Signed Reports 183 | Shareholding Details 195 | Glossary 201
22 EXPENSESConsolidated Bank
Note2021
$m2020
$m2021
$m2020
$m
OPERATING EXPENSES
Advertising 33 28 19 16
Commissions to owner-managed branches 4 5 4 4
Communications and postage 20 17 16 17
Printing and stationery 4 3 3 3
Processing costs 14 13 14 13
Impairment - 41 - 41
Other 36 43 32 48
111 150 88 142
ADMINISTRATIVE EXPENSES
Professional fees 38 24 32 21
Directorsrsquo fees 2 2 2 2
Other 17 9 23 15
57 35 57 38
IT EXPENSES
Data processing 121 126 112 120
Amortisation ndash computer software 41 47 77 36 71
Depreciation ndash IT equipment 1 1 1 1
169 204 149 192
OCCUPANCY EXPENSES
Depreciation - ROU assets and lease expenses 29 28 26 26
Depreciation ndash property plant and equipment 9 10 9 10
Other 3 2 3 2
41 40 38 38
EMPLOYEE EXPENSES
Salaries wages and superannuation contributions 313 289 272 265
Payroll tax 16 14 14 12
Equity settled transactions 8 9 7 8
Other 17 6 14 6
354 318 307 291
OTHER
Amortisation ndash acquired intangibles 41 4 5 2 4
4 5 2 4
Total expenses 736 752 641 705
1212021 Annual Report
For the year ended 31 August 2021NOTES TO THE FINANCIAL STATEMENTS
Financial Statements 108 | Signed Reports 183 | Shareholding Details 195 | Glossary 201
23 INCOME TAX EXPENSE AND DEFERRED TAXIncome tax expenseThe major components of income tax expense along with a reconciliation between pre-tax profit and tax expense are detailed below
Consolidated Bank
2021 $m
2020 $m
2021 $m
2020 $m
CURRENT TAX EXPENSE
Current year 123 103 113 83
Adjustments for prior years (2) (8) (7) (6)
121 95 106 77
DEFERRED TAX EXPENSE
Origination and reversal of temporary differences 48 (37) 9 (36)
Total income tax expense 169 58 115 41
DEFERRED TAX RECOGNISED IN EQUITY
Cash flow hedge reserve 20 6 19 7
Retained profits - (2) - (2)
Other 10 (4) 10 (4)
30 - 29 1
Numerical reconciliations between tax expense and pre-tax profit
Profit before tax 538 173 379 122
Income tax using the domestic corporate tax rate of 30 (2020 30) 161 52 114 37
Increase in income tax expense due to
Non-deductible expenses 10 7 9 6
Decrease in income tax expense due to
Other (1) (2) (1) (8) (2)
Income tax expense on pre-tax net profit 169 58 115 41
(1) In the Bank this includes a prior period adjustment and the impact of dividends received from subsidiary members in the tax consolidated group which are both eliminated at a group level
122 Bank of Queensland Limited and its Controlled Entities
For the year ended 31 August 2021NOTES TO THE FINANCIAL STATEMENTS
Financial Statements 108 | Signed Reports 183 | Shareholding Details 195 | Glossary 201
23 INCOME TAX EXPENSE AND DEFERRED TAX (CONTINUED)Recognised deferred tax assets and liabilitiesDeferred tax assets and liabilities are attributable to the following
Assets Liabilities Net
CONSOLIDATED2021
$m2020
$m2021
$m2020
$m2021
$m2020
$m
Accruals 4 3 - - 4 3
Capitalised expenditure - - (5) (6) (5) (6)
Provisions for impairment 119 111 - - 119 111
Other provisions 30 16 - - 30 16
Equity reserves 6 36 - - 6 36
ROU Asset and Lease Liability 41 47 (32) (38) 9 9
Lease financing relating to lessor activities - - (87) (45) (87) (45)
Intangibles 4 - (18) (2) (14) (2)
Consolidation - Taxation of Financial Arrangements (TOFA) (1) - - (22) - (22) -
Other 13 2 (3) (2) 10 -
Total tax assets (liabilities) (2) 217 215 (167) (93) 50 122
BANK
Accruals 3 2 - - 3 2
Capitalised expenditure - - (1) (2) (1) (2)
Provisions for impairment 66 76 - - 66 76
Other provisions 19 14 - - 19 14
Equity reserves 2 31 - - 2 31
ROU Asset and Lease Liability 41 47 (32) (38) 9 9
Lease financing relating to lessor activities - - (18) (18) (18) (18)
Other 8 2 (3) (1) 5 1
Total tax assets (liabilities) 139 172 (54) (59) 85 113
Unrecognised deferred tax assets Deferred tax assets have not been brought to account for the following items as realisation of the benefit is not regarded as probable
2021$m
2020$m
Gross income tax losses (3) 23 24
Gross capital gains tax losses 50 50
(1) The provisional business combination balances relating to the acquisition of ME Bank include a transitional deferred tax liability that will unwind equally across the current and next three years
(2) The St Andrewrsquos Group is classified as held for sale at the reporting date of 31 August 2021 refer to Note 55(E) for further information Net deferred tax assets of $1 million have been reclassified as held for sale The above table excludes these net deferred tax assets
(3) Income tax losses are subject to utilisation over an expected 15-20 year period
1232021 Annual Report
For the year ended 31 August 2021NOTES TO THE FINANCIAL STATEMENTS
Financial Statements 108 | Signed Reports 183 | Shareholding Details 195 | Glossary 201
Accounting for income taxIncome tax expense comprises current and deferred tax Income tax is recognised in profit or loss in the Income Statement except to the extent that it relates to items recognised directly in equity or other comprehensive income
Current tax is the expected tax payable receivable on the taxable income loss for the year and any adjustment to the tax payable receivable in respect of previous years It is measured using tax rates enacted or substantially enacted at the reporting date
Deferred tax is recognised in respect of temporary differences between the carrying amounts of assets and liabilities for financial reporting purposes and the amounts used for taxation purposes
Deferred tax assets are recognised for unused tax losses and deductible temporary differences to the extent that it is probable that future taxable profits will be available against which they can be utilised Deferred tax assets are reviewed at each reporting date and are reduced to the extent that it is no longer probable that the related tax benefit will be realised
Deferred tax is measured at the tax rates that are expected to be applied to temporary differences when they reverse using tax rates enacted or substantially enacted at the reporting date The measurement of deferred tax reflects the tax consequences that would follow the manner in which the Group expects at the reporting date to recover or settle the carrying amount of its assets and liabilities
Tax consolidationThe Bank is the head entity in the tax-consolidated group comprising all the Australian wholly-owned subsidiaries The implementation date for the tax-consolidated group was 1 September 2003
Current tax expense (income) deferred tax liabilities and deferred tax assets arising from temporary differences of the members of the tax-consolidated group are recognised in the separate financial statements of the members of the tax-consolidated group using a lsquogroup allocationrsquo approach by reference to the carrying amounts in the separate financial statements of each entity and the tax values applying under tax consolidation
Any current tax liabilities (or assets) and deferred tax assets arising from unused tax losses of the subsidiaries are assumed by the head entity in the tax-consolidated group and are recognised as amounts payable (receivable) to (from) other entities in the tax-consolidated group in conjunction with any Tax Funding Agreement (TFA) amounts Any difference between these amounts is recognised by the Bank as an equity contribution or distribution from the subsidiary
Any subsequent period amendments to deferred tax assets arising from unused tax losses as a result of a revised assessment of the probability of recoverability is recognised by the head entity only
Nature of tax funding and tax sharing arrangementsThe Bank in conjunction with other members of the tax-consolidated group has entered into a TFA which sets out the funding obligations of members of the tax-consolidated group in respect of tax amounts The TFA requires payments to (from) the head entity equal to the current tax liability (asset) assumed by the head entity and any tax-loss deferred tax asset assumed by the head entity resulting in the Bank recognising an inter-entity payable (receivable) equal in amount to the tax liability (asset) assumed
Contributions to fund the current tax liabilities are payable as per the TFA and reflect the timing of the head entityrsquos obligation to make payments for tax liabilities to the relevant tax authorities
The Bank in conjunction with other members of the tax-consolidated group has also entered into a Tax Sharing Agreement (TSA) The TSA provides for the determination of the allocation of income tax liabilities between the entities should the head entity default on its tax payment obligations No amounts have been recognised in the financial statements in respect of this agreement as payment of any amounts under the TSA is considered remote
23 INCOME TAX EXPENSE AND DEFERRED TAX (CONTINUED)
124 Bank of Queensland Limited and its Controlled Entities
For the year ended 31 August 2021NOTES TO THE FINANCIAL STATEMENTS
Financial Statements 108 | Signed Reports 183 | Shareholding Details 195 | Glossary 201
24 DIVIDENDSBank
2021 2020
Cents per share $m
Cents per share $m
Ordinary shares
Final 2020 dividend paid 25 November 2020 (2019 27 November 2019) 12 55 31 126
Interim 2021 dividend paid 26 May 2021 17 109 - -
164 126
All dividends paid on ordinary shares have been fully franked Since the end of the financial year the Directors have determined the following dividends
Cents per share $m
Final ordinary share dividend 22 141
The final ordinary share dividend will be paid on 18 November 2021 to owners of ordinary shares at the close of business on 29 October 2021 (record date) Shares will be quoted ex-dividend on 28 October 2021
Bank
2021$m
2020$m
30 franking credits available to shareholders of the Bank for subsequent financial years 507 208
The ability to utilise the franking credits is dependent upon there being sufficient available profits to pay dividends The profits accumulated in the profit reserve are available for dividend payments in future years All dividends paid by the Bank since the end of the previous financial year were franked at the tax rate of 30 per cent
The balance of the Bankrsquos dividend franking account at the date of this report after adjusting for franking credits and debits that will arise on payment of income tax and proposed dividends relating to the year ended 31 August 2021 is $446 million calculated at the 30 per cent tax rate (2020 $183 million) It is anticipated based on these franking account balances that the Bank will continue to pay fully franked dividends in the foreseeable future
Dividend reinvestment planThe dividend reinvestment plan (DRP) provides ordinary shareholders with the opportunity to reinvest all or part of their entitlement to a dividend into new ordinary shares
The price for shares issued or transferred under the DRP is the Market Price less such discount (if any) as the directors may determine from time to time and notify to the ASX (rounded to the nearest cent)
Market price is the arithmetic average rounded to four decimal places of the daily volume weighted average price of
bull all shares sold in the ordinary course of trading on the ASX automated trading system and
bull where shares are sold on trading platforms of Australian licensed financial markets operated by persons other than ASX all shares sold in the ordinary course of trading on such of those trading platforms determined by the Board from time to time during the 10 trading day period commencing on the second trading day after the record date in respect of the relevant dividend
The calculation of the daily volume weighted average price shall not include certain transactions as outlined in the DRP terms and conditions If after this calculation there is a residual balance that balance will be carried forward (without interest) and added to the next dividend for the purpose of calculating the number of shares secured under the DRP at that time
Shares issued or transferred under the DRP will be fully-paid and rank equally in all respects with existing shares
The last date for election to participate in the DRP for the 2021 full year dividend is 1 November 2021
1252021 Annual Report
For the year ended 31 August 2021NOTES TO THE FINANCIAL STATEMENTS
Financial Statements 108 | Signed Reports 183 | Shareholding Details 195 | Glossary 201
25 OPERATING SEGMENTS Segment informationThe Group determines and presents operating segments based on the information that is provided internally to the Managing Director amp CEO the Bankrsquos chief operating decision maker
An operating segment is a component of the Group that engages in business activities from which it may earn revenues and incur expenses including revenues and expenses that relate to transactions with any of the Grouprsquos other components All operating segmentsrsquo operating results are regularly reviewed by the Grouprsquos Managing Director amp CEO to make decisions about resources to be allocated to the segment and assess its performance and for which discrete financial information is available
Segment results that are reported to the Managing Director amp CEO include items directly attributable to a segment as well as those that can be allocated on a reasonable basis
The Grouprsquos operating segments comprise the following
Retail Banking - retail banking solutions to customers managed through our Owner-managed and Corporate branch network third party intermediaries Virgin Money distribution channels and ME Bank (refer to Note 55)
BOQ Business - includes the BOQ branded commercial lending activity BOQ Finance and BOQ Specialist businesses The division provides tailored business banking solutions including commercial lending equipment finance and leasing cashflow finance foreign exchange interest rate hedging transaction banking and deposit solutions for commercial customers and
Other - Treasury St Andrewrsquos Insurance and Group Head Office
Management monitors the operating results of its business units separately for the purpose of making decisions about resource allocation and performance assessment Segment performance is evaluated based on operating profit or loss which in certain respects is measured differently from operating profit or loss in the consolidated financial statements Income taxes are managed within the individual operating segments and thus disclosed this way
Transfer prices between operating segments are on an armrsquos length basis reflecting the Bankrsquos external cost of funds in a manner similar to transactions with third parties
Major customersNo revenue from transactions with a single external customer or counter party amounted to 10 per cent or more of the Grouprsquos total revenue in 2021 or 2020
Geographic informationWhile the Group does have some operations in New Zealand the business segments operate principally in Australia
GoodwillFor goodwill allocation between segments refer to Note 41
PresentationThe following table presents income profit and certain asset and liability information regarding the Grouprsquos operating segments
Inter-segment revenue and expenses and transfer pricing adjustments are reflected in the performance of each operating segment
All inter-segment profits are eliminated on consolidation
126 Bank of Queensland Limited and its Controlled Entities
For the year ended 31 August 2021NOTES TO THE FINANCIAL STATEMENTS
Financial Statements 108 | Signed Reports 183 | Shareholding Details 195 | Glossary 201
25 OPERATING SEGMENTS (CONTINUED)Retail Banking BOQ Business Other Segment Total
2021 (1)
$m2020 (2)
$m2021
$m2020
$m2021
$m2020
$m2021
$m2020
$m
INCOME
Net interest income (3) 570 437 555 543 3 6 1128 986
Non-interest income 74 74 48 40 8 14 130 128
Total income 644 511 603 583 11 20 1258 1114
Operating expenses (407) (335) (262) (258) (15) (19) (684) (612)
Underlying profit (loss) 237 176 341 325 (4) 1 574 502
Loan impairment gain (loss) 21 (56) - (119) - - 21 (175)
Cash profit (loss) before tax 258 120 341 206 (4) 1 595 327
Income tax (expense) benefit (80) (37) (106) (64) 3 (1) (183) (102)
Segment cash profit (loss) after tax (4) 178 83 235 142 (1) - 412 225
STATUTORY BASIS ADJUSTMENTS
Amortisation of acquisition fair value adjustments - - - - (3) (4) (3) (4)
Hedge ineffectiveness - - - - (3) (10) (3) (10)
Transaction costs (5) - - - - (19) - (19) -
Integration costs (5) - - - - (9) - (9) -
Intangible asset review and restructure (6) - - - - (3) (80) (3) (80)
Regulatory compliance - - - - - (5) - (5)
Employee pay and entitlements review - - - - (6) (8) (6) (8)
Other legacy items - - - - - (3) - (3)
Statutory net profit (loss) after tax 178 83 235 142 (44) (110) 369 115
INCLUDED IN THE RESULTS
Depreciation and amortisation (54) (67) (22) (45) (8) (3) (84) (115)
Total assets 54077 26058 23913 22920 13442 7794 91432 56772
Total liabilities 37046 17156 10838 9780 37351 25605 85235 52541
(1) The August 2021 financial results includes the ME Bank contribution from 1 July 2021 until 31 August 2021(2) VMA operating costs have been restated from non-interest income and included in operating expenses per ASX announcement on 30 September 2021(3) Interest income and interest expenses are disclosed in this note on a net interest income basis This is in line with the information provided internally to the Managing
Director amp CEO(4) This excludes a number of items that introduce volatility and or one-off distortions of the Grouprsquos performance(5) Integration and transaction costs from ME Bank acquisition completed on 1 July 2021 (6) The August 2021 financial results include a non-recurring adjustment due to a change in the ME Bank minimum threshold for the capitalisation of intangible assets to align
with BOQ
1272021 Annual Report
For the year ended 31 August 2021NOTES TO THE FINANCIAL STATEMENTS
Financial Statements 108 | Signed Reports 183 | Shareholding Details 195 | Glossary 201
26 EARNINGS PER SHAREBasic earnings per share (EPS) is calculated by dividing the relevant earnings attributable to ordinary shareholders by the average weighted number of shares on issue Diluted EPS takes into account the dilutive effect of all outstanding share rights vesting as ordinary shares
Consolidated
2021$m
2020$m
EARNINGS RECONCILIATION
Profit for the year 369 115
Returns to other equity instruments (1) (1) -
Profit available for ordinary shareholders 368 115
Basic earnings
Effect of Wholesale Capital Notes - 4
Effect of Capital Notes 9 11
Effect of Capital Notes 2 5 -
Diluted earnings 382 130
Weighted average number of shares used as the denominator 2021 Number 2020 Number (2)
Number for basic earnings per share
Ordinary shares 549628512 454599751
Number for diluted earnings per share
Ordinary shares 549628512 454599751
Effect of award rights 3248973 1909302
Premium priced options (3) - -
Effect of Wholesale Capital Notes - 18456165
Effect of Capital Notes 37717103 58658037
Effect of Capital Notes 2 21033327 -
611627915 533623255
EARNINGS PER SHARE
Basic earnings per share - Ordinary shares (cents) 670 254
Diluted earnings per share - Ordinary shares (cents) 626 244
(1) Other equity instruments assumed on the acquisition of ME Bank Refer to Note 310(B) for further information (2) The basic and diluted earnings per share for August 2020 have been adjusted for the effects of the Grouprsquos capital raise that occurred in March 2021(3) During the year ended 31 August 2021 the Group granted 8033732 premium priced options to eligible employees The options were anti-dilutive during the period and
therefore have not impacted the diluted weighted average number of shares (WANOS) during the period
128 Bank of Queensland Limited and its Controlled Entities
For the year ended 31 August 2021NOTES TO THE FINANCIAL STATEMENTS
Financial Statements 108 | Signed Reports 183 | Shareholding Details 195 | Glossary 201
NOTE 3 CAPITAL AND BALANCE SHEET MANAGEMENT 31 CASH AND CASH EQUIVALENTSComponents of cash and cash equivalentsCash and cash equivalents comprise cash at branches cash on deposit and balances with the RBA Cash flows from the following activities are presented on a net basis in the Statements of Cash Flows
bull Sales and purchases of trading securities
bull Customer deposits and withdrawals from deposit accounts and
bull Loan drawdowns and repayments
Consolidated Bank
2021$m
2020$m
2021$m
2020$m
Notes coins and cash at bank 2124 983 1135 465
Remittances in transit 238 270 238 270
Reverse repurchase agreements maturing in less than three months 201 100 - 100
Cash and cash equivalents as presented in the Balance Sheets 2563 1353 1373 835
Cash and cash equivalents included in assets held for sale 4 - - -
Total 2567 1353 1373 835
Notes to the Statements of Cash Flows Reconciliation of profit for the year to net cash provided by operating activities
Profit from ordinary activities after income tax 369 115 264 81
Add (less) non-cash items or items classified as investing financing
Depreciation 39 35 36 35
Amortisation - acquired intangibles 4 5 2 4
Software amortisation and impairment 47 118 36 108
Profit on sale of property plant and equipment (5) (4) - -
Equity settled transactions 8 9 7 8
Salary sacrifice reserve (3) - (3) -
Dividends received from controlled entities - - (4) (4)
Add (less) changes in operating assets and liabilities
(Increase) decrease in due from other financial institutions 119 (152) 118 (158)
(Increase) in financial assets (1120) (120) (292) (120)
(Increase) in loans and advances (3052) (825) (3439) (772)
Increase (decrease) in provision for impairment (58) 136 (35) 89
(Increase) decrease in derivatives (19) 14 (9) 13
(Increase) decrease in deferred tax asset 17 (40) (1) (31)
(Increase) decrease in amounts due to from controlled entities - - 35 (670)
(Increase) decrease in other assets (18) 45 (142) 548
Increase (decrease) in due to other financial institutions (24) 11 (24) 11
Increase in deposits 3982 1278 3733 1302
Increase (decrease) in accounts payable and other liabilities 33 (43) 67 (24)
Increase in current tax liabilities 34 5 26 6
Increase in provisions 5 7 4 13
Increase (decrease) in deferred tax liabilities 23 2 1 (4)
(Decrease) in insurance policy liabilities - (4) - -
Net cash (inflow) outflow from operating activities 381 592 380 435
1292021 Annual Report
For the year ended 31 August 2021NOTES TO THE FINANCIAL STATEMENTS
Financial Statements 108 | Signed Reports 183 | Shareholding Details 195 | Glossary 201
32 FINANCIAL ASSETS AND LIABILITIESFinancial instruments measured at amortised costFinancial assets that are held to collect the contractual cash flows and that contain contractual terms that give rise on specified dates to cash flows that are solely payments of principal and interest are measured at amortised cost In addition most financial liabilities are measured at amortised cost Financial assets or financial liabilities are initially recognised at fair value inclusive of any directly attributable costs They are subsequently measured at each reporting date at amortised cost using the effective interest method
The Bank invests in debt securities at amortised cost that are issued by 100 per cent owned securitisation vehicles within the Consolidated Group The programsrsquo underlying pool of financial instruments are recorded within the Bankrsquos Loans and advances
Also included in this category are loans and advances at amortised cost (refer to Note 33 Loans and advances) and receivables due from other financial institutions recognised and measured at amortised cost
For financial liabilities at amortised cost refer to Note 34 for further information on Deposits and Note 35 for further information on Borrowings
Financial assets measured at fair value through other comprehensive income (FVOCI)Financial assets held in a business model that is achieved by both collecting and selling contractual cash flows that contain contractual terms that give rise on specified dates to cash flows that are solely payments of principal and interest are measured at FVOCI Gains or losses arising from changes in the fair value of these financial instruments are recognised in other comprehensive income Interest income and foreign exchange gains and losses are recognised in profit or loss in the Income Statement as are cumulative gains or losses previously recognised in other comprehensive income upon derecognition of the financial instruments
Equity instruments that are not held for trading are measured at FVOCI where an irrevocable election has been made by management Amounts presented in other comprehensive income are not subsequently transferred to profit or loss but can be reclassified to retained profits Dividends on such investments are recognised in profit or loss unless the dividend clearly represents a recovery of part of the cost of the investment
Financial instruments at fair value through profit or loss (FVTPL)Financial assets that do not meet the criteria to be measured at amortised cost or FVOCI are measured at FVTPL with all changes in fair value recognised in the Income Statement Financial assets in this category are those that are held for trading and have been designated by management upon initial recognition or are mandatorily required to be measured at fair value under AASB 9 Financial Instruments (AASB 9)
Where a financial liability is designated at fair value through profit or loss the movement in fair value is recognised in profit or loss in the Income Statement
Modification of financial instrumentsA financial instrument is modified when its original contractual cash flows are modified A financial instrument that is modified is derecognised if the existing agreement is cancelled and a new agreement is made on substantially different terms or if the existing terms of the financial instrument are substantially modified Where the modification results in derecognition of the original financial instrument a new financial instrument is recorded initially at fair value and the difference is recorded in profit or loss in the Income Statement
When the modification does not result in derecognition the difference between the financial instrumentrsquos original contractual cash flows and the modified cash flows discounted at the original effective interest rate is recognised as a gain or loss in the Income Statement
Reclassification of financial instrumentsThe Group reclassifies financial assets when and only when it changes its business model for managing those assets Reclassified financial assets are subsequently measured based on the new measurement category
The Group does not reclassify financial liabilities
Derecognition of financial instrumentsFinancial assets are derecognised when the contractual rights to receive cash flows from the assets have expired or where the Group has transferred its contractual rights to receive the cash flows of the financial assets or substantially all the risks and rewards of ownership or upon substantial modification
Financial liabilities are derecognised when they are extinguished ie when the obligation is discharged cancelled or expired
130 Bank of Queensland Limited and its Controlled Entities
For the year ended 31 August 2021NOTES TO THE FINANCIAL STATEMENTS
Financial Statements 108 | Signed Reports 183 | Shareholding Details 195 | Glossary 201
32 FINANCIAL ASSETS AND LIABILITIES (CONTINUED)Financial assets recognised and measured at fair value and debt instruments at amortised cost are listed below For other financial assets and liabilities refer to Note 31 for Cash and cash equivalents Note 33 for Loans and advances Note 34 for Deposits Note 35 for Borrowings and Note 38 for Derivative financial instruments and hedge accounting
Consolidated Bank
2021$m
2020$m
2021$m
2020$m
DERIVATIVE FINANCIAL ASSETS
Current 82 19 19 19
Non-current 55 135 67 82
Total derivative financial assets 137 154 86 101
FINANCIAL ASSETS AT FVTPL
Floating rate notes and bonds 664 1829 664 1829
Negotiable certificates of deposit 180 25 180 25
Promissory notes 200 - 200 -
Reverse repurchase agreements 43 - 43 -
Total financial assets at FVTPL 1087 1854 1087 1854
Current 1087 1854 1087 1854
FINANCIAL ASSETS AT FVOCI
Debt instruments 9701 4530 5548 4530
Equity instruments 9 6 6 6
Total financial assets at FVOCI 9710 4536 5554 4536
Current 3232 80 607 80
Non-current 6478 4456 4947 4456
DEBT INSTRUMENTS AT AMORTISED COST
Current - - 168 200
Non-current - - 7531 7462
- - 7699 7662
1312021 Annual Report
For the year ended 31 August 2021NOTES TO THE FINANCIAL STATEMENTS
Financial Statements 108 | Signed Reports 183 | Shareholding Details 195 | Glossary 201
33 LOANS AND ADVANCES
Loans and advances at amortised cost Loans and advances are originated by the Group and are recognised upon cash being advanced to the borrower Loans and advances are initially recognised at fair value plus incremental directly attributable transaction costs They are subsequently measured at each reporting date at amortised cost using the effective interest method The method used to determine the appropriate period to amortise any upfront payments or receipts on origination of loan contracts is the weighted average life (WAL) of the loan category
Finance lease receivablesLoans and advances include finance lease receivables Finance leases are those products where substantially all the risks and rewards of the leased asset have been transferred to the lessee Finance lease receivables are initially recognised at amounts equal to the lower of fair value of the leased asset or the present value of the minimum lease repayments plus the present value of a guaranteed residual value expected to accrue at the end of the lease term Subsequently lease repayments are apportioned between interest income and the reduction of the lease receivable over the term of the lease in order to reflect a constant periodic rate of return on the net investment outstanding in respect of the lease
Consolidated Bank
2021$m
2020 (1)
$m2021
$m2020 (1)
$m
Residential property loans 59053 31155 34101 31155
Personal loans 182 91 95 91
Overdrafts 164 209 164 209
Commercial loans 9900 9449 9715 9271
Credit cards 178 59 57 59
Asset finance and leasing 6347 6172 928 1009
Gross loans and advances 75824 47135 45060 41794
Less
Unearned finance lease income (76) (92) (14) (20)
Specific provision for impairment (107) (94) (83) (68)
Collective provision for impairment (204) (275) (136) (186)
Total loans and advances 75437 46674 44827 41520
(1) Comparative information has been restated To align product definitions across the Group $810 million of BOQ Specialist asset finance products has been reclassified from Commercial loans to Asset finance and leasing $124 million of BOQ Specialist consumer lending products has been reclassified from Personal loans to Commercial loans
(A) Loans and advances - Expected Credit Losses (ECL)In accordance with AASB 9 Financial Instruments the Group utilises a forward-looking ECL approach The ECL allowance is based on the credit losses expected to arise over the next 12 months of the financial asset unless there has been a significant increase in credit risk (SICR) since origination In this case the allowance is based on the ECL for the life of the financial asset The 12 month ECL is the portion of lifetime ECLs resulting from default events on a financial asset that are possible within the 12 months after the reporting date
At the end of each reporting period the Group performs an assessment of whether a financial assetrsquos credit risk has increased significantly since initial recognition This is done by considering the change in the risk of default occurring over the remaining life of the financial asset
132 Bank of Queensland Limited and its Controlled Entities
For the year ended 31 August 2021NOTES TO THE FINANCIAL STATEMENTS
Financial Statements 108 | Signed Reports 183 | Shareholding Details 195 | Glossary 201
33 LOANS AND ADVANCES (CONTINUED)The Group applies a three stage approach to measuring the ECL as described below
bull Stage 1 ndash For financial assets where there has not been a SICR since initial recognition and that are not credit impaired upon origination the portion of the lifetime ECL associated with the probability of default (PD) occurring within the next 12 months is recognised as the 12 month ECL adjusted for forward-looking information Stage 1 includes facilities where the credit risk has improved and the loan has been reclassified from Stage 2 or Stage 3
bull Stage 2 ndash When there has been a SICR the lifetime ECL is determined with reference to the financial assetrsquos lifetime PD and the lifetime losses associated with that PD adjusted for forward-looking information The Group assesses whether there has been a SICR since initial recognition based on qualitative quantitative and reasonable and supportable forward-looking information that includes significant management judgement Use of alternative criteria could result in significant changes to the timing and amount of ECL to be recognised Lifetime ECL considers the expected behaviour of the asset as well as forward looking macro-economic forecasts Stage 2 also includes facilities where the credit risk has improved and the loan has been reclassified from Stage 3
bull Stage 3 - This includes financial assets that are deemed to be credit impaired which generally correspond to the APRA definition of default and include exposures that are at least 90 days past due The provision is also equivalent to the lifetime ECL Financial assets in Stage 3 will have a collective provision determined by the ECL model although some loans are individually covered by a specific provision A specific provision is calculated based on estimated future cash flows discounted to their present value net of any collateral held against that financial asset
bull Purchased or originated credit-impaired (POCI) - POCI assets are financial assets that are purchased or originated as being credit impaired The ECL for POCI assets is measured at an amount equal to the lifetime ECL However the amount recognised as a loss allowance for these assets is not the total amount of lifetime ECLs but instead the changes in lifetime ECLs since initial recognition of the asset
Write-offsFinancial assets are written off either partially or in full against the related provision when the Group concludes that there is no reasonable expectation of recovery and all possible collateral has been realised Recoveries of financial assets previously written off are recognised in profit or loss based on the cash received
Definition of default A default is considered to have occurred when the borrower is unlikely to pay its credit obligations in full without recourse by the Group to the realisation of available security andor the borrower is at least 90 days past due on their credit obligations This definition is in line with the regulatory definition of default and also aligned to the definition used for internal credit risk management purposes across all portfolios
Significant increase in credit riskSICR for financial assets is assessed by comparing the risk of a default occurring over the expected life of a financial asset at the reporting date compared to the corresponding risk of default at origination In determining what constitutes a significant increase in credit risk the Group considers qualitative and quantitative information For the majority of BOQrsquos portfolios SICR is assessed using PD based triggers by comparing the PD at the reporting date to the PD at origination PDrsquos are primarily assigned through either a Customer Risk Rating or statistical models utilising account behaviours For all loan portfolios the primary indicator is in addition to the secondary SICR indicator which is based on 30 days past due arrears information and other qualitative criteria
Calculation of ECLBoth 12 month ECLs and lifetime ECLs are calculated on either an individual basis or a collective basis depending on the nature of the underlying portfolio of financial assets Where ECL is modelled collectively for portfolios of exposures it is modelled primarily as the product of the PD the loss given default (LGD) and the exposure at default (EAD)
These parameters are generally derived from internally developed statistical models combined with historical current and forward- looking information including macro-economic data
bull The 12-month and lifetime PD for accounting purposes represent the estimation of the point-in-time probability of a default over the next 12 months and remaining lifetime of the financial instrument respectively based on conditions existing at the balance sheet date and future economic conditions that affect credit risk
bull The EAD represents the expected exposure at default taking into account the repayment of principal and interest from the balance sheet date to the default event together with any expected drawdown of a facility and
bull The LGD represents the expected loss conditional on default taking into account the mitigating effect of collateral its expected value when realised and the time value of money
Incorporation of forward-looking informationThe credit risk factors described above are point in time estimates based on the probability weighted forward-looking economic scenarios The inclusion of a forward-looking component in the model anticipates changes in the economic outlook and is an important component of the provisioning process The Group considers four forward-looking macro-economic scenarios (base upside downside and severe downside) over the next three years The scenarios are then probability weighted based on the likelihood of the scenario occurring to ensure ECL appropriately captures forward looking effects and considers the range of possible economic outcomes Sensitivity analysis is also performed on each of the macro-economic scenarios and if conditions warrant this could result in a management overlay for economic uncertainty which is included in the ECL
1332021 Annual Report
For the year ended 31 August 2021NOTES TO THE FINANCIAL STATEMENTS
Financial Statements 108 | Signed Reports 183 | Shareholding Details 195 | Glossary 201
33 LOANS AND ADVANCES (CONTINUED)
Incorporation of forward-looking information (Continued)The scenarios including their underlying indicators are developed using a combination of publicly available data and internal forecasts to form the initial baseline The scenarios are refined through consultation with internal specialists and benchmarking to external data from reputable sources which includes forecasts published from a range of market economists and official data sources including major central banks
Economic outlook factors that are taken into consideration include but are not limited to unemployment interest rates gross domestic product commercial and residential property price indexes and require an evaluation of both the current and forecast direction of the macro-economic cycle
Incorporating forward looking information including macro-economic forecasts increases the degree of judgement required to assess how changes in these data points will affect ECLs The methodologies and assumptions including any forecasts of future economic conditions are reviewed regularly
Impact of COVID-19 on ECL In response to the COVID-19 global pandemic BOQ continues to offer support to its customers through a range of industry-wide financial assistance measures including temporary loan repayment deferrals Notwithstanding these measures together with government stimulus there remains significant estimation uncertainty in relation to the measurement of BOQrsquos ECL for loans and advances Although GDP property prices and unemployment have been less severe than anticipated in FY20 there have been further outbreaks of infection and snap lockdowns across a large part of Australia with metropolitan cities experiencing extended lockdown periods The true extent of the level of stress in the economy which could result in credit losses is still highly uncertain
In determining the reported ECL of $311 million the Group has taken into account the facts circumstances and forecasts of future economic conditions and supportable information available at the reporting date Model updates have been implemented in 2H21 which include a complete review of the overlays and adjustments in place as well as updated scenarios and scenario weightings to cater for economic uncertainties Observed credit deterioration and its resultant impact on PD and LGD incorporated in the most recent data set has translated some of the model overlay into the modelled outcome while management overlays have been refined based on industry and occupation data observed during the pandemic
The ECL reflects an unbiased and probability-weighted amount determined by the evaluation of a range of possible forward looking economic outcomes rather than being based on a best or worst case scenario The macro-economic outlook as reflected in the base case scenario has improved since FY20 including lower unemployment and improved property prices The Group has introduced a new Upside scenario reflecting low unemployment and strong growth due to extensive fiscal and monetary support However the potential for further downside risk remains including economic deterioration from additional lockdowns the reduction of government support and vaccine rollout delays The probability weighting across each scenario has therefore been updated per the table below utilising the most up to date macro-economic information available as at reporting date
Upside Base Downside Severe
2021 2020 2021 2020 2021 2020 2021 2020
Weighting 50 - 425 750 300 200 225 50
The general shape of the economic recovery varies within each scenario The table below provides a summary of macro-economic assumptions used in the Base and Downside scenarios as at 31 August 2021
Base Downside
Macro-economic assumption2021
()2022
()2023
()2021
()2022
()2023
()
GDP 375 475 275 (025) 275 200
Unemployment rate 500 450 425 675 675 650
Residential property prices 1700 750 400 675 (200) (025)
Commercial property prices 325 (025) 075 100 (375) (275)
Sensitivity of provisions for impairmentThe ECL reflects an unbiased and probability-weighted amount across a range of macro-economic scenarios as described above The following table compares the reported ECL to approximate levels of ECL under the Base and Downside scenarios assuming a 100 per cent weighting was applied to each scenario with all other assumptions held constant
Consolidated $m
Bank $m
Reported probability weighted ECL 311 219
100 base case 289 199
100 downside 331 234
134 Bank of Queensland Limited and its Controlled Entities
For the year ended 31 August 2021NOTES TO THE FINANCIAL STATEMENTS
Financial Statements 108 | Signed Reports 183 | Shareholding Details 195 | Glossary 201
33 LOANS AND ADVANCES (CONTINUED)
GovernanceThe Executive Credit Committee has the delegation for reviewing and approving the methodology including any judgements and assumptions Where applicable management adjustments or overlays may be made to account for situations where known or expected risks and information have not been considered in the modelling process The Grouprsquos provision for impairment on loans and advances and key areas of judgement are reported to the Grouprsquos Audit Committee and Board at each reporting period
The following table discloses the reconciliation of the ECL model of the Group for the year ended 31 August 2021
Collective Provision
CONSOLIDATED
Stage 1 ndash 12 month ECL
$m
Stage 2 ndash Lifetime ECL
$m
Stage 3 ndash Lifetime ECL
$m
Stage 3 ndash Specific
provision$m
Total $m
Balance as at 1 September 2020 95 115 65 94 369
Transfers during the year to
Stage 1 19 (10) (1) (8) -
Stage 2 (5) 10 (2) (3) -
Stage 3 (1) (5) 3 3 -
Newincreased provisions 36 31 53 55 175
Write-back of provisions no longer required (56) (91) (52) (1) (200)
Amounts written off previously provided for - - - (29) (29)
Unwind discount - - - (4) (4)
Balance as at 31 August 2021 88 50 66 107 311
The table below discloses the effect of movements in the gross carrying value of loans and advances in the different stages of the ECL model of the Group during the year ended 31 August 2021
CONSOLIDATED
Stage 1 ndash 12 month ECL
$m
Stage 2 ndash Lifetime ECL
$m
Stage 3 ndash Lifetime ECL
$m
Stage 3 ndash Specific
provision$m
Stage 3 - POCI Loans
$mTotal (1)
$m
Gross carrying amount as at 1 September 2020 42831 3605 408 199 - 47043
Transfers during the year to
Stage 1 1307 (1282) (23) (2) - -
Stage 2 (2373) 2436 (35) (28) - -
Stage 3 (235) (182) 321 96 - -
New loans and advances originated or purchased (2) 40232 342 7 8 286 40875
Loans and advances derecognised or repaid during the year including write-offs (11074) (909) (135) (52) - (12170)
Balance as at 31 August 2021 70688 4010 543 221 286 75748
Provision for impairment (88) (50) (66) (107) - (311)
Net carrying amount as at 31 August 2021 70600 3960 477 114 286 75437
(1) The amounts presented above are inclusive of unearned finance lease income (2) $25159 million of new loans and advances originated relates to ME Bank acquisition
1352021 Annual Report
For the year ended 31 August 2021NOTES TO THE FINANCIAL STATEMENTS
Financial Statements 108 | Signed Reports 183 | Shareholding Details 195 | Glossary 201
33 LOANS AND ADVANCES (CONTINUED)The following table discloses the reconciliation of the ECL model of the Group for the year ended 31 August 2020
Collective Provision
CONSOLIDATED
Stage 1 ndash 12 month ECL
$m
Stage 2 ndash Lifetime ECL
$m
Stage 3 ndash Lifetime ECL
$m
Stage 3 ndash Specific
provision$m
Total $m
Balance as at 1 September 2019 81 44 23 85 233
Transfers during the year to
Stage 1 8 (7) (1) - -
Stage 2 (3) 4 (1) - -
Stage 3 (1) (5) 2 4 -
Newincreased provisions 47 94 50 39 230
Write-back of provisions no longer required (37) (15) (8) 3 (57)
Amounts written off previously provided for - - - (32) (32)
Unwind discount - - - (5) (5)
Balance as at 31 August 2020 95 115 65 94 369
The table below discloses the effect of movements in the gross carrying value of loans and advances in the different stages of the ECL model of the Group during the year ended 31 August 2020
CONSOLIDATED
Stage 1 ndash 12 month ECL
$m
Stage 2 ndash Lifetime ECL
$m
Stage 3 ndash Lifetime ECL
$m
Stage 3 ndash Specific
provision$m
Total (1)
$m
Gross carrying amount as at 1 September 2019 43233 2425 351 207 46216
Transfers during the year to
Stage 1 682 (666) (15) (1) -
Stage 2 (2278) 2304 (25) (1) -
Stage 3 (156) (89) 195 50 -
New loans and advances originated or purchased 11641 319 34 1 11995
Loans and advances derecognised or repaid during the year including write-offs (10291) (688) (132) (57) (11168)
Balance as at 31 August 2020 42831 3605 408 199 47043
Provision for impairment (95) (115) (65) (94) (369)
Net carrying amount as at 31 August 2020 42736 3490 343 105 46674
(1) The amounts presented above are inclusive of unearned finance lease income
136 Bank of Queensland Limited and its Controlled Entities
For the year ended 31 August 2021NOTES TO THE FINANCIAL STATEMENTS
Financial Statements 108 | Signed Reports 183 | Shareholding Details 195 | Glossary 201
33 LOANS AND ADVANCES (CONTINUED)The following table discloses the reconciliation of the ECL model of the Bank for the year ended 31 August 2021
Collective Provision
BANK
Stage 1 ndash 12 month ECL
$m
Stage 2 ndash Lifetime ECL
$m
Stage 3 ndash Lifetime ECL
$m
Stage 3 ndash Specific
provision$m
Total $m
Balance as at 1 September 2020 57 78 51 68 254
Transfers during the year to
Stage 1 5 (4) (1) - -
Stage 2 (3) 7 (1) (3) -
Stage 3 (1) (3) 2 2 -
Newincreased provisions 18 25 35 40 118
Write-back of provisions no longer required (25) (64) (40) (8) (137)
Amounts written off previously provided for - - - (13) (13)
Unwind discount - - - (3) (3)
Balance as at 31 August 2021 51 39 46 83 219
The table below discloses the effect of movements in the gross carrying value of loans and advances in the different stages of the ECL model of the Bank during the year ended 31 August 2021
BANK
Stage 1 ndash 12 month ECL
$m
Stage 2 ndash Lifetime ECL
$m
Stage 3 ndash Lifetime ECL
$m
Stage 3 ndash Specific
provision$m
Total (1)
$m
Gross carrying amount as at 1 September 2020 38270 2934 399 171 41774
Transfers during the year to
Stage 1 997 (973) (22) (2) -
Stage 2 (2133) 2195 (34) (28) -
Stage 3 (203) (168) 289 82 -
New loans and advances originated or purchased 13008 263 14 4 13289
Loans and advances derecognised or repaid during the year including write-offs (9203) (634) (147) (33) (10017)
Balance as at 31 August 2021 40736 3617 499 194 45046
Provision for impairment (51) (39) (46) (83) (219)
Net carrying amount as at 31 August 2021 40685 3578 453 111 44827
(1) The amounts presented above are inclusive of unearned finance lease income
1372021 Annual Report
For the year ended 31 August 2021NOTES TO THE FINANCIAL STATEMENTS
Financial Statements 108 | Signed Reports 183 | Shareholding Details 195 | Glossary 201
33 LOANS AND ADVANCES (CONTINUED)The following table discloses the reconciliation of the ECL model of the Bank for the year ended 31 August 2020
Collective Provision
BANK
Stage 1 ndash 12 month ECL
$m
Stage 2 ndash Lifetime ECL
$m
Stage 3 ndash Lifetime ECL
$m
Stage 3 ndash Specific
provision$m
Total $m
Balance as at 1 September 2019 47 33 19 65 164
Transfers during the year to
Stage 1 4 (4) - - -
Stage 2 (1) 2 (1) - -
Stage 3 - (4) 2 2 -
Newincreased provisions 26 63 37 26 152
Write-back of provisions no longer required (19) (12) (6) (2) (39)
Amounts written off previously provided for - - - (19) (19)
Unwind discount - - - (4) (4)
Balance as at 31 August 2020 57 78 51 68 254
The table below discloses the effect of movements in the gross carrying value of loans and advances in the different stages of the ECL model of the Bank during the year ended 31 August 2020
BANK
Stage 1 ndash 12 month ECL
$m
Stage 2 ndash Lifetime ECL
$m
Stage 3 ndash Lifetime ECL
$m
Stage 3 ndash Specific
provision$m
Total (1)
$m
Gross carrying amount as at 1 September 2019 38266 2212 341 181 41000
Transfers during the year to
Stage 1 640 (625) (14) (1) -
Stage 2 (1677) 1703 (25) (1) -
Stage 3 (140) (82) 190 32 -
New loans and advances originated or purchased 9450 305 32 - 9787
Loans and advances derecognised or repaid during the year including write-offs (8269) (579) (125) (40) (9013)
Balance as at 31 August 2020 38270 2934 399 171 41774
Provision for impairment (57) (78) (51) (68) (254)
Net carrying amount as at 31 August 2020 38213 2856 348 103 41520
(1) The amounts presented above are inclusive of unearned finance lease income
138 Bank of Queensland Limited and its Controlled Entities
For the year ended 31 August 2021NOTES TO THE FINANCIAL STATEMENTS
Financial Statements 108 | Signed Reports 183 | Shareholding Details 195 | Glossary 201
33 LOANS AND ADVANCES (CONTINUED)The table below discloses the breakdown of impairment expense on loans and advances
Consolidated Bank
2021$m
2020$m
2021$m
2020$m
(Decrease) increase in collective provision for impairment (71) 127 (50) 87
Increase in specific provision for impairment 20 14 21 7
Bad debts written off net of recoveries 30 34 16 22
Impairment (gain) loss on loans and advances (21) 175 (13) 116
(B) Lease receivablesAsset finance and leasing include the following finance lease receivables for leases where the Group is the lessor
Consolidated Bank
2021$m
2020$m
2021$m
2020$m
Gross investment in finance lease receivables
Less than one year 334 335 14 20
Between one and five years 611 696 108 142
More than five years 34 58 31 37
979 1089 153 199
Unearned finance lease income (76) (92) (14) (20)
Net investment in finance leases 903 997 139 179
The net investment in finance leases
Less than one year 303 300 15 20
Between one and five years 570 645 97 128
More than five years 30 52 27 31
Net investment in finance leases 903 997 139 179
1392021 Annual Report
For the year ended 31 August 2021NOTES TO THE FINANCIAL STATEMENTS
Financial Statements 108 | Signed Reports 183 | Shareholding Details 195 | Glossary 201
33 LOANS AND ADVANCES (CONTINUED)(C) Transfer of financial assets
Securitisation programThrough its REDS Securitisation (RMBS Trusts) REDS EHP Securitisation (REDS EHP Trusts) Impala and SMHL Securitisation (SMHL Trusts) programs the Group packages loans and advances through a series of securitisation vehicles from which debt securities are issued to investors The Group is entitled to any residual income from the vehicles after all payments to investors and costs of the programs have been met The securitised loans and advances are included in Loans and advances and the securitisation liabilities are included in Borrowings on the Grouprsquos Balance Sheet The note holders have recourse only to the loan pool of assets Refer to Note 59 (A)(ii) for further information
Covered bond programThe Bank issues covered bonds for funding and liquidity purposes The bonds are issued to external investors and are secured against a pool of the Bankrsquos housing loans Housing loans are assigned to a bankruptcy remote structured entity to provide security for all obligations payable on the covered bonds issued by the Bank The covered bond holders have dual recourse to the Bank and the cover pool of assets The Bank is required to maintain the cover pool at a level sufficient to cover the obligations of the bonds The Bank is entitled to any residual income of the covered bond structured entity after all payments due to the covered bond holders and any costs related to the program have been met The housing loans are included in Loans and advances and the covered bonds issued are included in Borrowings on the Bankrsquos Balance Sheet Refer to Note 59 (A)(iii) for further information
The following table sets out the transferred financial assets and associated liabilities of the securitisation and covered bond programs that did not qualify for derecognition under AASB 9 and typically result in the transferred assets continuing to be recognised in full
Consolidated Bank
2021$m
2020$m
2021$m
2020$m
TRANSFERRED FINANCIAL ASSETS
Securitisation - Loans and advances 6952 3430 9115 10169
Covered bonds - Loans and advances 3078 2961 3078 2961
10030 6391 12193 13130
ASSOCIATED FINANCIAL LIABILITIES
Securitisation liabilities - external investors 7653 3432 - -
Covered bonds - external investors 2362 2371 2362 2371
Amounts due to controlled entities - - 9324 10189
10015 5803 11686 12560
FOR THOSE LIABILITIES THAT HAVE RECOURSE ONLY TO TRANSFERRED ASSETS (1)
Fair value of transferred assets 10042 6408 12202 13166
Fair value of associated liabilities (10015) (5803) (11686) (12560)
Net position 27 605 516 606
(1) The fair values of transferred assets and liabilities that reprice within 6 months are assumed to equate to the amortised cost All other fair values are calculated using a discounted cash flow model
140 Bank of Queensland Limited and its Controlled Entities
For the year ended 31 August 2021NOTES TO THE FINANCIAL STATEMENTS
Financial Statements 108 | Signed Reports 183 | Shareholding Details 195 | Glossary 201
34 DEPOSITSDeposits are initially recognised at fair value net of any directly attributable transaction costs Subsequent to initial measurement they are measured at amortised cost using the effective interest method
Consolidated Bank
2021$m
2020$m
2021$m
2020$m
Deposits at call 34732 19773 23502 19971
Term deposits 26427 16810 16744 16829
Certificates of deposit 4743 3010 3323 3010
Total deposits 65902 39593 43569 39810
CONCENTRATION OF DEPOSITS
Customer deposits 56469 34762 38180 34960
Wholesale deposits 9433 4831 5389 4850
65902 39593 43569 39810
1412021 Annual Report
For the year ended 31 August 2021NOTES TO THE FINANCIAL STATEMENTS
Financial Statements 108 | Signed Reports 183 | Shareholding Details 195 | Glossary 201
35 BORROWINGS Borrowings are initially recognised at fair value net of any directly attributable transaction costs Subsequent to initial measurement they are measured at amortised cost using the effective interest method
The Group recorded the following movements on borrowings
CONSOLIDATED
Securitisation liabilities (1)
$m
Covered bonds
liabilities
(2)
$m
EMTN program
$m
Term funding
facility (3)
$m
Subordinated notes
$m
Senior unsecured
notes$m
Capital Notes (4)
$mTotal
$m
YEAR ENDED 31 AUGUST 2021
Balance at beginning of year 3429 2367 194 820 350 3833 346 11339
Acquisition of ME Bank 4558 - - 872 - 403 - 5833
Proceeds from issues new funding 1134 - - 1334 250 650 260 3628
Repayments (1476) - (112) - (150) (1325) - (3063)
Deferred establishment costs (2) - - - (1) (1) (5) (9)
Amortisation of deferred costs (5) 2 1 - - - 1 1 5
Foreign exchange translation (5) - (9) (1) - - - - (10)
Balance at end of year 7645 2359 81 3026 449 3561 602 17723
CONSOLIDATED
Securitisation liabilities (1)
$m
Covered bonds
liabilities
(2)
$m
EMTN program
$m
Term funding
facility (3)
$m
Subordinated notes
$m
Senior unsecured
notes$m
Capital Notes (4)
$mTotal
$m
YEAR ENDED 31 AUGUST 2020
Balance at beginning of year 4617 1649 263 - 349 4613 495 11986
Proceeds from issues new funding 378 750 - 820 - 635 - 2583
Repayments (1568) - (60) - - (1415) (150) (3193)
Deferred establishment costs (1) (2) - - - (1) - (4)
Amortisation of deferred costs (5) 3 1 - - 1 1 1 7
Foreign exchange translation (5) - (31) (9) - - - - (40)
Balance at end of year 3429 2367 194 820 350 3833 346 11339
(1) Securitisation liabilities are secured by a floating charge over securitised assets for amounts owing to note holders and any other secured creditors of the securitisation vehicles(2) Covered bonds liabilities are secured by a charge over a pool of loans and advances and guaranteed by the covered bond guarantor(3) The TFF provides funding at a fixed interest rate of 25 basis points for a maximum of 3 years and is accounted for as borrowings From 4 November 2020 the interest rate
of new borrowings was lowered to 10 basis points The funding is a below market interest loan from a Government entity and accordingly classified as a Government Grant The Group reflects a net interest expense in the Income Statement There are no terms and conditions associated with the TFF other than pledging eligible collateral that meet the RBArsquos eligibility criteria At 31 August 2021 the Group has pledged $37 billion of self-securitised residential mortgage-backed securities as collateral
(4) Capital Notes On 28 December 2017 the Bank issued 3500000 Capital Notes at a price of $100 per note Capital Notes are perpetual and convertible notes issued by BOQ with preferred
discretionary non-cumulative distributions They are not guaranteed or secured As at 31 August 2021 3500000 Capital Notes were outstanding Capital Notes must convert into ordinary shares on 15 August 2026 if certain mandatory conversion conditions are satisfied unless they are converted or redeemed
earlier Where the mandatory conversion conditions are satisfied a holder will receive a number of ordinary shares per Capital Note based on the volume weighted average price of ordinary shares during a specified period The Capital Notes must also convert to ordinary shares of the Bank with the occurrence of a loss absorption event or an acquisition event BOQ may elect to convert redeem or resell Capital Notes on 15 August 2024 or following a regulatory or tax event BOQ may also elect to convert all Capital Notes following a potential acquisition event These options are subject to APRArsquos prior written approval and certain conditions being satisfied In a winding up of the Bank Capital Notes will rank for payment of capital ahead of ordinary shares equally with Capital Notes 2 and other equal ranking instruments but behind the claims of all senior ranking creditors including depositors and unsubordinated and subordinated creditors
Capital Notes 2 On 30 November 2020 the Bank issued 2600000 Capital Notes 2 at a price of $100 per note Capital Notes 2 are perpetual and convertible notes issued by BOQ with
preferred discretionary non-cumulative distributions They are not guaranteed or secured As at 31 August 2021 2600000 Capital Notes 2 were outstanding Capital Notes 2 must convert into ordinary shares on 15 May 2029 if certain mandatory conversion conditions are satisfied unless they are converted or redeemed earlier Where the mandatory conversion conditions are satisfied a holder will receive a number of ordinary shares per Capital Note 2 based on the volume weighted average price of ordinary shares during a specified period Capital Notes 2 must also convert to ordinary shares of the Bank with the occurrence of a loss absorption event or an acquisition event BOQ may elect to convert redeem or resell Capital Notes 2 on 14 May 2027 or following a regulatory or tax event BOQ may also elect to convert all Capital Notes 2 following a potential acquisition event These options are subject to APRArsquos prior written approval and certain conditions being satisfied In a winding up of the Bank Capital Notes 2 will rank for payment of capital ahead of ordinary shares equally with Capital Notes (issued 28 December 2017) and other equal ranking instruments but behind the claims of all senior ranking creditors including depositors and unsubordinated and subordinated creditors
(5) Amortisation of deferred costs and foreign exchange translation are non-cash movements Foreign exchange translation movements are 100 per cent hedged
142 Bank of Queensland Limited and its Controlled Entities
For the year ended 31 August 2021NOTES TO THE FINANCIAL STATEMENTS
Financial Statements 108 | Signed Reports 183 | Shareholding Details 195 | Glossary 201
35 BORROWINGS (CONTINUED)The Bank recorded the following movements on borrowings
BANK
Covered bonds
liabilities (1)
$m
EMTN program
$m
Term funding
facility (2)
$m
Subordinated notes
$m
Senior unsecured
notes $m
Capital Notes (3)
$mTotal
$m
YEAR ENDED 31 AUGUST 2021
Balance at beginning of year 2371 194 820 350 3833 346 7914
Proceeds from issues new funding - - 1334 250 - 260 1844
Repayments - (112) - (150) (675) - (937)
Deferred establishment costs - - - (1) (1) (6) (8)
Amortisation of deferred costs (4) - - - - 1 2 3
Foreign exchange translation (4) (9) (1) - - - - (10)
Balance at end of year 2362 81 2154 449 3158 602 8806
BANK
Covered bonds
liabilities (1)
$m
EMTN program
$m
Term funding
facility (2)
$m
Subordinated notes
$m
Senior unsecured
notes $m
Capital Notes (3)
$mTotal
$m
YEAR ENDED 31 AUGUST 2020
Balance at beginning of year 1652 263 - 349 4613 495 7372
Proceeds from issues 750 - 820 - 635 - 2205
Repayments - (60) - - (1415) (150) (1625)
Deferred establishment costs - - - - (1) - (1)
Amortisation of deferred costs (4) - - - 1 1 1 3
Foreign exchange translation (4) (31) (9) - - - - (40)
Balance at end of year 2371 194 820 350 3833 346 7914
(1) Covered bonds liabilities are secured by a charge over a pool of loans and advances and guaranteed by the covered bond guarantor(2) The TFF provides funding at a fixed interest rate of 25 basis points for a maximum of 3 years and is accounted for as borrowings From 4 November 2020 the interest rate
of new borrowings was lowered to 10 basis points The funding is a below market interest loan from a Government entity and accordingly classified as a Government Grant The Bank reflects a net interest expense in the Income Statement There are no terms and conditions associated with the TFF other than pledging eligible collateral that meet the RBAs eligibility criteria At 31 August 2021 the Bank has pledged $27 billion of self-securitised residential mortgage-backed securities as collateral
(3) Capital Notes On 28 December 2017 the Bank issued 3500000 Capital Notes at a price of $100 per note Capital Notes are perpetual and convertible notes issued by BOQ with
preferred discretionary non-cumulative distributions They are not guaranteed or secured As at 31 August 2021 3500000 Capital Notes were outstanding Capital Notes must convert into ordinary shares on 15 August 2026 if certain mandatory conversion conditions are satisfied unless they are converted or redeemed earlier Where the mandatory conversion conditions are satisfied a holder will receive a number of ordinary shares per Capital Note based on the value weighted average price of ordinary shares during a specified period The Capital Notes must also convert to ordinary shares of the Bank with the occurrence of a loss absorption event or an acquisition event BOQ may elect to convert redeem or resell Capital Notes on 15 August 2024 or following a regulatory or tax event BOQ may also elect to convert all Capital Notes following a potential acquisition event These options are subject to APRArsquos prior written approval and certain conditions being satisfied In a winding up of the Bank Capital Notes will rank for payment of capital ahead of ordinary shares equally with CPS WCN and other equal ranking instruments but behind the claims of all senior ranking creditors including depositors and unsubordinated and subordinated creditors
Capital Notes 2 On 30 November 2020 the Bank issued 2600000 Capital Notes 2 at a price of $100 per note Capital Notes 2 are perpetual and convertible notes issued by BOQ with
preferred discretionary non-cumulative distributions They are not guaranteed or secured As at 31 August 2021 2600000 Capital Notes 2 were outstanding Capital Notes 2 must convert into ordinary shares on 15 May 2029 if certain mandatory conversion conditions are satisfied unless they are converted or redeemed earlier Where the mandatory conversion conditions are satisfied a holder will receive a number of ordinary shares per Capital Note 2 based on the volume weighted average price of ordinary shares during a specified period Capital Notes 2 must also convert to ordinary shares of the Bank with the occurrence of a loss absorption event or an acquisition event BOQ may elect to convert redeem or resell Capital Notes 2 on 14 May 2027 or following a regulatory or tax event BOQ may also elect to convert all Capital Notes 2 following a potential acquisition event These options are subject to APRArsquos prior written approval and certain conditions being satisfied In a winding up of the Bank Capital Notes 2 will rank for payment of capital ahead of ordinary shares equally with Capital Notes (issued 28 December 2017) and other equal ranking instruments but behind the claims of all senior ranking creditors including depositors and unsubordinated and subordinated creditors
(4) Amortisation of deferred costs and foreign exchange translation are non-cash movements Foreign exchange translation movements are 100 per cent hedged
1432021 Annual Report
For the year ended 31 August 2021NOTES TO THE FINANCIAL STATEMENTS
Financial Statements 108 | Signed Reports 183 | Shareholding Details 195 | Glossary 201
36 RISK MANAGEMENT The Group adopts a ldquomanaged riskrdquo approach to its banking and insurance activities in which the articulation of a risk aware culture is prevalent throughout the Grouprsquos credit market liquidity insurance operational risk and compliance policies and procedures The Board has adopted policies in relation to the assessment management and monitoring of these risks and ownership of the frameworks within which these risks are managed reside with the Chief Risk Officer
The Chief Risk Officer contributes towards the achievement of the Grouprsquos corporate objectives through the operationalisation and progressive development of the Grouprsquos risk management function The continued improvement of the Grouprsquos risk management function focuses on a number of key areas with particular emphasis on
1 the efficiency and effectiveness of the Grouprsquos credit market liquidity operational risk and compliance management process controls and policies to support the Bankrsquos customer proposition in line with its risk appetite
2 providing management and the Board with risk reporting that contributes to the further development of sound corporate governance standards
3 maintaining regulatory compliance in line with regulatorsrsquo expectations and
4 contributing to the Group achieving risk based performance management
Group Risk is an independent function and is responsible for providing the framework policies and procedures needed for managing credit liquidity market operational risk and compliance throughout the Group Policies are set in line with the governing strategy and risk guidelines set by the Board
MonitoringThe Grouprsquos enterprise risk management framework incorporates active management and monitoring of a range of risks including (but not limited to)
1 Market
2 Credit and
3 Liquidity
(A) Market riskMarket risk is the risk that movements in market rates and prices will result in profits or losses to the Group The objective of market risk management is to manage and control market risk and to minimise its impact on the Group
(i) Interest rate risk managementThe operations of the Group are subject to the risk of interest rate fluctuations as a result of mismatches in the timing of the repricing of interest rates on the Grouprsquos assets and liabilities
The figures in the table below indicate the potential increase (decrease) in net interest income for an ensuing 12 month period of a one per cent parallel shock increase to the yield curve
CONSOLIDATED2021
$m2020
$m
Exposure at the end of the year 23 2
Average monthly exposure during the year 6 (2)
High month exposure during the year 23 7
Low month exposure during the year (6) (13)
(ii) Foreign exchange riskIt is the Bankrsquos policy not to carry material foreign exchange rate exposures net of associated hedging instruments in the banking book At balance date there are no net material foreign exchange rate exposures in the banking book
The Bank uses cross currency swaps and forward foreign exchange contracts to hedge its exchange rate exposures arising from borrowing off-shore in foreign currencies The Bank uses forward foreign exchange contracts to hedge potential exchange rate exposures created by customer-originated foreign currency transactions
The Bankrsquos investment in its New Zealand subsidiary is hedged by forward foreign exchange contracts which mitigate the currency risk arising from the subsidiaryrsquos net assets
144 Bank of Queensland Limited and its Controlled Entities
For the year ended 31 August 2021NOTES TO THE FINANCIAL STATEMENTS
Financial Statements 108 | Signed Reports 183 | Shareholding Details 195 | Glossary 201
36 RISK MANAGEMENT (CONTINUED)(A) Market risk (continued)
(iii) Traded market riskMarket risks attributable to trading activities are primarily measured using a historical simulation Value-at-Risk (VaR) model based on historical data VaR is a statistical technique used to quantify the potential loss in earnings from adverse market movements and is calculated over a one-day time horizon to a 99 per cent confidence level using two-years of historical data As an additional overlay to VaR the individual market risks of interest rate foreign exchange credit and equity are managed using a framework that includes stress testing scenario analysis sensitivity analysis and stop losses Risks are monitored and measured against limits delegated by the Asset-Liability Committee (ALCO) and approved by the Boardrsquos Risk Committee
The portfolio (interest rate foreign exchange credit and equity) VaR for the Bankrsquos trading portfolio for the year was as follows
Trading VaR2021
$m2020
$m
Average 045 064
Maximum 113 125
Minimum 020 019
(B) Credit risk Credit risk arises in the business from lending activities the provision of guarantees including letters of credit and commitments to lend investment in bonds and notes financial market transactions and other associated activities Credit risk is the potential loss arising from the possibility that customers or counterparties fail to meet contractual payment obligations to the Group as they fall due
The Board has implemented a structured framework of systems and controls to monitor and manage credit risk comprising
bull documented credit risk management principles which are disseminated to all staff involved with the lending process
bull documented policies
bull a process for approving risk based on tiered delegated approval authorities whereby the largest exposures are assessed by the Executive Credit Committee consisting of senior executives and senior risk managers chaired by the Chief Risk Officer
bull risk grading the Bankrsquos commercial exposures based on items inclusive of financial performance and stability organisational structure industry segment and security support Exposures within this segment of the portfolio are generally subject to annual review which may include reassessment of the assigned risk grade
bull an automated scorecard approval model for the Bankrsquos retail portfolio inclusive of home loans home equity lines of credit and personal loans This model is supported by experienced risk assessment managers and
bull a series of management reports detailing industry concentrations counterparty concentrations loan grades and security strength ratings
The Group uses derivative financial instruments to hedge its exposure to foreign exchange and interest rate risks arising from operating financing and investing activities In accordance with its treasury risk policies the Group can hold derivative financial instruments for trading purposes Credit risk on derivative contracts used for these purposes is minimised as counterparties are recognised financial intermediaries with acceptable credit ratings determined by a recognised rating agency
(i) Maximum exposure to credit riskThe amounts disclosed are the maximum exposure to credit risk before taking account of any collateral held or other credit enhancements For financial assets recognised on the Balance Sheet the exposure to credit risk equals their carrying amount For customer commitments the maximum exposure to credit risk is the full amount of the committed facilities as at reporting date
1452021 Annual Report
For the year ended 31 August 2021NOTES TO THE FINANCIAL STATEMENTS
Financial Statements 108 | Signed Reports 183 | Shareholding Details 195 | Glossary 201
36 RISK MANAGEMENT (CONTINUED)(B) Credit risk (continued)
(i) Maximum exposure to credit risk (continued)The carrying amount of financial assets represents the maximum credit exposure The maximum exposure to credit risk at the reporting date was
2021 2020
CONSOLIDATED Stage 1
$mStage 2
$mStage 3
$mTotal
$mTotal
$m
Cash and cash equivalents 2563 - - 2563 1353
Due from other financial institutions 827 - - 827 860
Other financial assets (including accrued interest) 10847 - - 10847 6444
Derivative financial instruments 137 - - 137 154
Financial assets other than loans and advances 14374 - - 14374 8811
Gross loans and advances 70688 4010 1050 75748 47135
Total financial assets 85062 4010 1050 90122 55946
Customer commitments (1) 5344 - - 5344 1926
Total potential exposure to credit risk 90406 4010 1050 95466 57872
2021 2020
BANKStage 1
$mStage 2
$mStage 3
$mTotal
$mTotal
$m
Cash and cash equivalents 1373 - - 1373 835
Due from other financial institutions 708 - - 708 826
Other financial assets (including accrued interest) 14385 - - 14385 14101
Derivative financial instruments 86 - - 86 101
Financial assets other than loans and advances 16552 - - 16552 15863
Gross loans and advances 40736 3617 693 45046 41794
Total financial assets 57288 3617 693 61598 57657
Customer commitments (1) 1541 - - 1541 1128
Total potential exposure to credit risk 58829 3617 693 63139 58785
(1) Refer to Note 52 for details of customer commitments
146 Bank of Queensland Limited and its Controlled Entities
For the year ended 31 August 2021NOTES TO THE FINANCIAL STATEMENTS
Financial Statements 108 | Signed Reports 183 | Shareholding Details 195 | Glossary 201
36 RISK MANAGEMENT (CONTINUED)(B) Credit risk (continued)
(i) Maximum exposure to credit risk (continued)The distribution of financial assets by credit quality at the reporting date was
Consolidated Bank
2021 $m
2020 $m
2021 $m
2020 $m
Neither past due or impaired
Gross loans and advances 72849 45479 43131 40269
Stage 1 69361 42288 40053 37716
Stage 2 3276 3065 2924 2423
Stage 3 212 126 154 130
Financial assets other than loans and advances 14374 8811 16552 15863
Stage 1 14374 8811 16552 15863
Stage 2 - - - -
Stage 3 - - - -
Past due but not impaired
Gross loans and advances 2656 1461 1735 1364
Stage 1 1327 635 683 574
Stage 2 734 540 693 511
Stage 3 595 286 359 279
Impaired
Gross loans and advances 243 195 180 161
Stage 1 - - - -
Stage 2 - - - -
Stage 3 243 195 180 161
Total financial assets 90122 55946 61598 57657
There is no individual exposure included in impaired assets which exceeds five per cent of shareholdersrsquo equity (2020 nil)
The Group holds collateral against loans and advances to customers in the form of mortgage interest over property other registered securities over assets and guarantees and mortgage insurance To mitigate credit risk the Group can take possession of or appoint receivers and managersadministrators to the collateral held against the loans and advances as a result of customer default To ensure reduced exposure to losses in such scenarios the collateral held by the Group is then realised in accordance with legal and regulatory requirements whilst also taking into consideration the individual circumstances of each matter
Estimates of fair value are based on the value of collateral assessed at the time of borrowing or for commercial exposures updated values as periodically obtained in accordance with the Group policy and regulatory requirements When a loan is individually assessed as impaired the value of collateral held is updated regularly to assess any specific provisioning requirements An estimate of the collateral held against past due but not impaired and impaired loans and advances at amortised cost is outlined below
Consolidated Bank
2021 $m
2020 $m
2021 $m
2020 $m
Held against past due but not impaired assets 7387 4204 5983 2721
Stage 1 3796 2724 2823 1276
Stage 2 2118 1002 2078 973
Stage 3 1473 478 1082 472
Held against impaired assets 212 141 141 121
Stage 1 - - - -
Stage 2 - - - -
Stage 3 212 141 141 121
1472021 Annual Report
For the year ended 31 August 2021NOTES TO THE FINANCIAL STATEMENTS
Financial Statements 108 | Signed Reports 183 | Shareholding Details 195 | Glossary 201
36 RISK MANAGEMENT (CONTINUED)(B) Credit risk (continued)
(ii) Credit qualityThe credit quality categories of financial assets have been determined based on Standard amp Poorrsquos credit ratings APRA risk weightings and the Bankrsquos standard risk grading The categories are classified as below
bull High grade - generally corresponds to Standard amp Poorrsquos credit ratings AAA+ to BBB-
bull Satisfactory - generally corresponds to Standard amp Poorrsquos credit rating BB+ to B
bull Weak - generally corresponds to Standard amp Poorrsquos credit ratings up to B and
bull Unrated - Loans and advances which have been classified as unrated are not secured however these are not deemed to be weak
The table below presents an analysis of the credit quality of financial assets
Consolidated
2021 $m
2020 $m
Gross loans amp advances Gross loans amp advances
Retail Commercial
Gross loans amp
advances
Other financial
assets Retail Commercial
Gross loans amp
advances
Other financial
assets
High Grade 50580 4625 55205 14365 25752 4320 30072 8805
Stage 1 48145 4505 52650 14365 24606 3964 28570 8805
Stage 2 2094 84 2178 - 1070 330 1400 -
Stage 3 341 36 377 - 76 26 102 -
Satisfactory 7731 9447 17178 - 5065 8831 13896 -
Stage 1 7221 8635 15856 - 4840 7935 12775 -
Stage 2 330 730 1060 - 199 855 1054 -
Stage 3 180 82 262 - 26 41 67 -
Weak 946 2036 2982 9 612 2365 2977 6
Stage 1 659 1140 1799 9 353 1035 1388 6
Stage 2 105 667 772 - 106 1045 1151 -
Stage 3 182 229 411 - 153 285 438 -
Unrated 155 228 383 - - 190 190 -
Stage 1 155 228 383 - - 190 190 -
Stage 2 - - - - - - - -
Stage 3 - - - - - - - -
59412 16336 75748 14374 31429 15706 47135 8811
148 Bank of Queensland Limited and its Controlled Entities
For the year ended 31 August 2021NOTES TO THE FINANCIAL STATEMENTS
Financial Statements 108 | Signed Reports 183 | Shareholding Details 195 | Glossary 201
36 RISK MANAGEMENT (CONTINUED)(B) Credit risk (continued)
(ii) Credit quality (continued)
Bank
2021 $m
2020 $m
Gross loans amp advances Gross loans amp advances
Retail Commercial
Gross loans amp
advances
Other financial
assets Retail Commercial
Gross loans amp
advances
Other financial
assets
High Grade 30739 4087 34826 15449 25752 3770 29522 15017
Stage 1 28478 4003 32481 15449 24606 3415 28021 15017
Stage 2 2094 51 2145 - 1070 329 1399 -
Stage 3 167 33 200 - 76 26 102 -
Satisfactory 2622 5967 8589 - 5065 5797 10862 32
Stage 1 2223 5318 7541 - 4840 4953 9793 32
Stage 2 330 588 918 - 199 799 998 -
Stage 3 69 61 130 - 26 45 71 -
Weak 857 740 1597 6 612 798 1410 6
Stage 1 571 109 680 6 353 123 476 6
Stage 2 105 449 554 - 106 431 537 -
Stage 3 181 182 363 - 153 244 397 -
Unrated 34 - 34 1097 - - - 808
Stage 1 34 - 34 1097 - - - 808
Stage 2 - - - - - - - -
Stage 3 - - - - - - - -
34252 10794 45046 16552 31429 10365 41794 15863
(iii) Loans and advances which were past due but not impaired Loans which are 90 or more days past due are not classified as impaired assets where the estimated net realisable value of the security is sufficient to cover the repayment of all principal and interest amounts due
Consolidated Bank
2021 $m
2020 $m
2021 $m
2020 $m
Less than 30 days - Retail 1184 392 635 392
- Commercial 711 503 618 436
30 to 89 days - Retail 349 86 105 86
- Commercial 90 47 66 27
90 days or more - Retail 213 305 212 305
- Commercial 109 129 99 118
2656 1462 1735 1364
1492021 Annual Report
For the year ended 31 August 2021NOTES TO THE FINANCIAL STATEMENTS
Financial Statements 108 | Signed Reports 183 | Shareholding Details 195 | Glossary 201
36 RISK MANAGEMENT (CONTINUED)(B) Credit risk (continued)
(iv) Concentration of exposure for gross loans and advancesConcentration of credit risk exists when a number of counterparties are engaged in similar activities operate in the same geographical areas or industry sectors and have similar economic characteristics so that their ability to meet contractual obligations is similarly affected by changes in economic political or other conditions The Group monitors concentrations of credit risk by geographical location for loans and advances An analysis of these concentrations of credit risk at the reporting date is shown below
Consolidated Bank
Geographical concentration of credit risk for loans and advances (before provisions and unearned income)
2021 $m
2020 $m
2021 $m
2020 $m
Queensland 24258 19633 18697 17793
New South Wales 23058 14543 15076 13205
Victoria 14924 6915 5951 5721
Northern Territory 449 253 237 234
Australian Capital Territory 1877 340 329 314
Western Australia 7477 3959 3735 3610
South Australia 2226 866 808 703
Tasmania 1170 234 227 214
International (New Zealand) 385 392 - -
75824 47135 45060 41794
150 Bank of Queensland Limited and its Controlled Entities
For the year ended 31 August 2021NOTES TO THE FINANCIAL STATEMENTS
Financial Statements 108 | Signed Reports 183 | Shareholding Details 195 | Glossary 201
36 RISK MANAGEMENT (CONTINUED)(C) Liquidity riskLiquidity risk arises from the possibility that the Group is unable to meet its financial obligations as they fall due Liquidity risk is managed through a series of detailed policies This includes the management of cash flow mismatches the maintenance of a stable core retail deposits base the diversification of the funding base and the retention of adequate levels of high quality liquid assets
The Group manages liquidity risk by maintaining sufficient cash balances and liquid assets continuously monitoring forecast and actual cash flows matching maturity profiles of financial assets and liabilities and monitoring liquidity scenario analyses
CONSOLIDATED 2021
Carrying amount
$mAt Call
$m
3 months or less
$m
3 to 12 months
$m
1 to 5 years
$m
Over 5 years
$m
Policy holder
$m
Total contractual
cash flows $m
FINANCIAL LIABILITIES
Due to other financial institutions 273 273 - - - - - 273
Deposits 65902 34732 16974 13346 988 - - 66040
Derivative financial instruments (1) 28 - 5 13 11 - - 29
Accounts payable and other liabilities 575 - 384 27 114 50 - 575
Securitisation liabilities (2) 7645 - 1702 1234 2807 2258 - 8001
Borrowings (3) 10078 - 622 1807 7620 265 - 10314
Liabilities held for sale 17 - - - - - 17 17
Total financial liabilities 84518 35005 19687 16427 11540 2573 17 85249
DERIVATIVE FINANCIAL INSTRUMENTS (HEDGING RELATIONSHIP)
Contractual amounts payable - 880 1196 1913 168 - 4157
Contractual amounts receivable - (809) (1079) (1574) (131) - (3593)
519 - 71 117 339 37 - 564
OFF BALANCE SHEET POSITIONS
Guarantees indemnities and letters of credit - 259 - - - - - 259
Customer funding commitments - 5085 - - - - - 5085
- 5344 - - - - - 5344
(1) Derivative financial instruments other than those designated in hedge relationships(2) Repayment of securitisation bonds is forecast based on the expected repayment profile of the underlying assets of the Trusts(3) Borrowings include the $3 billion TFF
1512021 Annual Report
For the year ended 31 August 2021NOTES TO THE FINANCIAL STATEMENTS
Financial Statements 108 | Signed Reports 183 | Shareholding Details 195 | Glossary 201
36 RISK MANAGEMENT (CONTINUED)(C) Liquidity risk (continued)
CONSOLIDATED 2020
Carrying amount
$mAt Call
$m
3 months or less
$m
3 to 12 months
$m
1 to 5 years
$m
Over 5 years
$m
Policy holder
$m
Total contractual
cash flows $m
FINANCIAL LIABILITIES
Due to other financial institutions 296 296 - - - - - 296
Deposits 39593 19773 11778 7264 943 - - 39758
Derivative financial instruments (1) 52 - 10 25 17 - - 52
Accounts payable and other liabilities 458 - 310 28 98 29 - 465
Securitisation liabilities (2) 3429 - 255 766 1973 551 - 3545
Borrowings (3) 7910 - 647 1016 6461 - - 8124
Insurance policy liabilities 5 - - - - - 5 5
Total financial liabilities 51743 20069 13000 9099 9492 580 5 52245
DERIVATIVE FINANCIAL INSTRUMENTS (HEDGING RELATIONSHIP)
Contractual amounts payable - 775 415 2433 139 - 3762
Contractual amounts receivable - (703) (260) (2041) (66) - (3070)
643 - 72 155 392 73 - 692
OFF BALANCE SHEET POSITIONS
Guarantees indemnities and letters of credit - 267 - - - - - 267
Customer funding commitments - 1659 - - - - - 1659
- 1926 - - - - - 1926
(1) Derivative financial instruments other than those designated in hedge relationships(2) Repayment of securitisation bonds is forecast based on the expected repayment profile of the underlying assets of the Trusts(3) Borrowings include the $08 billion TFF
152 Bank of Queensland Limited and its Controlled Entities
For the year ended 31 August 2021NOTES TO THE FINANCIAL STATEMENTS
Financial Statements 108 | Signed Reports 183 | Shareholding Details 195 | Glossary 201
36 RISK MANAGEMENT (CONTINUED)(C) Liquidity risk (continued)
BANK 2021
Carrying amount
$mAt Call
$m
3 months or less
$m
3 to 12 months
$m
1 to 5 years
$m
Over 5 years
$m
Total contractual
cash flows $m
FINANCIAL LIABILITIES
Due to other financial institutions 273 273 - - - - 273
Deposits 43569 23502 10971 8369 806 - 43648
Derivative financial instruments (1) 28 - 5 13 11 - 29
Accounts payable and other liabilities 360 - 212 28 98 29 367
Borrowings (2) 8806 - 621 1404 6745 265 9035
Amounts due to controlled entities 6241 6241 - - - - 6241
Total financial liabilities 59277 30016 11809 9814 7660 294 59593
Derivative financial instruments (hedging relationship)
Contractual amounts payable - 877 451 1095 168 2591
Contractual amounts receivable - (822) (299) (796) (131) (2048)
537 - 55 152 299 37 543
OFF BALANCE SHEET POSITIONS
Guarantees indemnities and letters of credit - 259 - - - - 259
Customer funding commitments - 1282 - - - - 1282
- 1541 - - - - 1541
BANK 2020
Carrying amount
$mAt Call
$m
3 months or less
$m
3 to 12 months
$m
1 to 5 years
$m
Over 5 years
$m
Total contractual
cash flows $m
FINANCIAL LIABILITIES
Due to other financial institutions 296 296 - - - - 296
Deposits 39810 19971 11797 7264 943 - 39975
Derivative financial instruments (1) 52 - 10 25 17 - 52
Accounts payable and other liabilities 385 - 237 28 98 29 392
Borrowings (3) 7914 - 647 1016 6461 - 8124
Amounts due to controlled entities 6707 6707 - - - - 6707
Total financial liabilities 55164 26974 12691 8333 7519 29 55546
DERIVATIVE FINANCIAL INSTRUMENTS (HEDGING RELATIONSHIP)
Contractual amounts payable - 775 411 848 139 2173
Contractual amounts receivable - (712) (273) (429) (66) (1480)
692 - 63 138 419 73 693
OFF BALANCE SHEET POSITIONS
Guarantees indemnities and letters of credit - 267 - - - - 267
Customer funding commitments - 861 - - - - 861
- 1128 - - - - 1128
(1) Derivative financial instruments other than those designated in hedge relationships (2) Borrowings include the $2 billion TFF(3) Borrowings include the $08 billion TFF
1532021 Annual Report
For the year ended 31 August 2021NOTES TO THE FINANCIAL STATEMENTS
Financial Statements 108 | Signed Reports 183 | Shareholding Details 195 | Glossary 201
37 FAIR VALUE OF FINANCIAL INSTRUMENTS(A) Fair value of financial instrumentsThe financial assets and liabilities listed below are recognised and measured at fair value and therefore their carrying value equates to their fair value
bull Derivatives
bull Financial instruments designated at FVTPL and
bull Financial instruments designated at FVOCI
The fair value estimates for instruments carried at amortised cost materially equate to their carrying value and are based on the following methodologies and assumptions
Cash and cash equivalents due from and to other financial institutions accounts payable and other liabilitiesThe fair value approximates to their carrying value as they are short term in nature or are receivable or payable on demand
Loans and advancesLoans and advances are net of specific and collective provisions for impairment and unearned income The fair values of loans and advances that reprice within six months of year ending 31 August 2021 are assumed to equate to the carrying value The fair values of all other loans and advances are calculated using discounted cash flow models based on the maturity of the loans and advances
The discount rates applied are based on the current interest rates at the reporting date for similar types of loans and advances if the loans and advances were performing at the reporting date The differences between estimated fair values and carrying values reflect changes in interest rates and creditworthiness of borrowers since loan or advance origination
Deposits The fair value of non-interest bearing at call and variable rate deposits and fixed rate deposits repricing within six months is the carrying value The fair value of other term deposits is calculated using discounted cash flow models based on the deposit type and its related maturity
Borrowings The fair values are calculated based on a discounted cash flow model using a yield curve appropriate to the remaining maturity of the instruments
154 Bank of Queensland Limited and its Controlled Entities
For the year ended 31 August 2021NOTES TO THE FINANCIAL STATEMENTS
Financial Statements 108 | Signed Reports 183 | Shareholding Details 195 | Glossary 201
37 FAIR VALUE OF FINANCIAL INSTRUMENTS (CONTINUED)(B) Fair value hierarchyThe Group measures fair values using the following fair value hierarchy and valuation techniques which reflect the significance of the inputs used in making the measurements
bull Level 1 This category includes assets and liabilities for which the valuation is determined from inputs based on unadjusted quoted market prices in active markets for identical instruments
bull Level 2 This category includes assets and liabilities for which the valuation is determined from inputs other than quoted prices included within level 1 which are observable either directly or indirectly This includes the use of discounted cash flow analysis option pricing models and other market accepted valuation models and
bull Level 3 This category includes assets and liabilities for which the valuation includes inputs that are not based on observable market data This includes equity instruments where there are no quoted market prices
The fair value hierarchy classification of instruments held at amortised cost
bull Debt instruments at amortised cost ndash Level 2
bull Loans and advances - Level 3
bull Deposits and borrowings - Level 2
There was no movement between levels during the year
The table below analyses financial instruments carried at fair value by valuation method
2021
CONSOLIDATED Level 1
$mLevel 2
$mLevel 3
$mTotal
$m
Financial instruments measured at fair value
Derivative financial assets - 137 - 137
Financial assets at FVTPL 43 1044 - 1087
Debt instruments at FVOCI 6309 3392 - 9701
Equity instruments at FVOCI - - 9 9
6352 4573 9 10934
Derivative financial liabilities - (653) - (653)
6352 3920 9 10281
2020
CONSOLIDATED Level 1
$mLevel 2
$mLevel 3
$mTotal
$m
Financial instruments measured at fair value
Derivative financial assets - 154 - 154
Financial assets at FVTPL - 1854 - 1854
Debt instruments at FVOCI 4125 405 - 4530
Equity instruments at FVOCI - - 6 6
4125 2413 6 6544
Derivative financial liabilities - (803) - (803)
4125 1610 6 5741
1552021 Annual Report
For the year ended 31 August 2021NOTES TO THE FINANCIAL STATEMENTS
Financial Statements 108 | Signed Reports 183 | Shareholding Details 195 | Glossary 201
37 FINANCIAL INSTRUMENTS (CONTINUED)(B) Fair value hierarchy (continued)
2021
BANKLevel 1
$mLevel 2
$mLevel 3
$mTotal
$m
Financial instruments measured at fair value
Derivative financial assets - 86 - 86
Financial assets at FVTPL 43 1044 - 1087
Debt instruments at FVOCI 5061 487 - 5548
Equity instruments at FVOCI - - 6 6
5104 1617 6 6727
Derivative financial liabilities - (620) - (620)
5104 997 6 6107
2020
BANKLevel 1
$mLevel 2
$mLevel 3
$mTotal
$m
Financial instruments measured at fair value
Derivative financial assets - 101 - 101
Financial assets at FVTPL - 1854 - 1854
Debt instruments at FVOCI 4125 405 - 4530
Equity instruments at FVOCI - - 6 6
4125 2360 6 6491
Derivative financial liabilities - (799) - (799)
4125 1561 6 5692
156 Bank of Queensland Limited and its Controlled Entities
For the year ended 31 August 2021NOTES TO THE FINANCIAL STATEMENTS
Financial Statements 108 | Signed Reports 183 | Shareholding Details 195 | Glossary 201
38 DERIVATIVE FINANCIAL INSTRUMENTS AND HEDGE ACCOUNTING(A) Fair value of derivativesThe following tables summarise the notional and fair value of the Grouprsquos and Bankrsquos commitments to derivative financial instruments at reporting date Fair value in relation to derivative financial instruments is estimated using net present value techniques The tables below set out the fair values of the derivative financial instruments
Consolidated
2021 2020
Notional Amount Fair Value
Notional Amount Fair Value
$m Asset
$mLiability
$m $m Asset
$mLiability
$m
DERIVATIVES AT FAIR VALUE THROUGH PROFIT OR LOSS
Interest rate swaps 10232 30 (27) 13118 44 (50)
Foreign exchange forwards 51 1 (1) 93 2 (2)
Futures 57 - - 281 - -
10340 31 (28) 13492 46 (52)
DERIVATIVES HELD AS CASH FLOW HEDGES
Interest rate swaps 29971 23 (103) 15503 26 (147)
Cross currency swaps 2185 70 (22) 1997 78 (8)
Foreign exchange forwards 755 11 (4) 731 4 (23)
32911 104 (129) 18231 108 (178)
DERIVATIVES DESIGNATED AS FAIR VALUE HEDGES
Interest rate swaps 4491 2 (496) 3597 - (573)
DERIVATIVES DESIGNATED AS NET INVESTMENT HEDGES
Foreign exchange forwards 27 - - 25 - -
47769 137 (653) 35345 154 (803)
1572021 Annual Report
For the year ended 31 August 2021NOTES TO THE FINANCIAL STATEMENTS
Financial Statements 108 | Signed Reports 183 | Shareholding Details 195 | Glossary 201
38 DERIVATIVE FINANCIAL INSTRUMENTS AND HEDGE ACCOUNTING (CONTINUED)(A) Fair value of derivatives (continued)
Bank
2021 2020
Notional Amount Fair Value
Notional Amount Fair Value
$m Asset
$mLiability
$m $m Asset
$mLiability
$m
DERIVATIVES AT FAIR VALUE THROUGH PROFIT OR LOSS
Interest rate swaps 8032 30 (27) 13118 44 (50)
Foreign exchange forwards 77 1 (1) 118 2 (2)
Futures 57 - - 281 - -
8166 31 (28) 13517 46 (52)
DERIVATIVES HELD AS CASH FLOW HEDGES
Interest rate swaps 22415 35 (82) 16171 42 (147)
Cross currency swaps 631 7 (10) 443 9 (4)
Foreign exchange forwards 755 11 (4) 731 4 (23)
23801 53 (96) 17345 55 (174)
DERIVATIVES DESIGNATED AS FAIR VALUE HEDGES
Interest rate swaps 4491 2 (496) 3597 - (573)
36458 86 (620) 34459 101 (799)
(B) Hedging strategyThe Group and Bank used derivative financial instruments for both hedging and trading purposes in the current year and prior year Refer to Note 36 (A) for an explanation of the Grouprsquos and Bankrsquos risk management framework The Group uses derivative financial instruments to hedge its exposure to foreign exchange and interest rate risks arising from operating financing and investing activities
The Grouprsquos hedging strategy is to protect net interest income from variability in interest rates in Australian dollars This requires the Group to enter into interest rate swaps allowing for the reduction in interest rate risk
Foreign currency exposures are swapped to Australian dollars using cross currency interest rate swaps These cross currency swaps will be matched to the underlying interest rate exposure of fixed or floating respectively
The majority of exposures are managed under the above strategy Where a risk is within agreed limits the Group may decide not to apply hedge accounting to that risk Instead the Group will manage its exposure under broader risk management processes
(C) Accounting for derivativesIn accordance with its treasury risk policies the Group can hold derivative financial instruments for trading purposes Derivatives that do not qualify for hedge accounting are accounted for as trading instruments
Derivative financial instruments are initially measured at fair value Subsequent to initial recognition gains or losses on derivatives are recognised in the Income Statement unless they are entered into for hedging purposes
The fair value of interest rate swaps is the estimated amount that the Group would receive or pay to terminate the swap at the reporting date taking into account current interest rates and current creditworthiness of the swap counterparties
The fair value of forward exchange contracts is their quoted market price at the reporting date being the present value of the quoted forward price The fair value of futures contracts is their quoted market price
158 Bank of Queensland Limited and its Controlled Entities
For the year ended 31 August 2021NOTES TO THE FINANCIAL STATEMENTS
Financial Statements 108 | Signed Reports 183 | Shareholding Details 195 | Glossary 201
38 DERIVATIVE FINANCIAL INSTRUMENTS AND HEDGE ACCOUNTING (CONTINUED)(C) Accounting for derivatives (continued)The following table shows the maturity profile of hedging derivatives based on their notional amounts
2021 2020
CONSOLIDATED
0 to 12 months
$m
1 to 5 years
$m
Over 5 years
$mTotal
$m
0 to 12 months
$m
1 to 5 years
$m
Over 5 years
$mTotal
$m
Interest rate swaps 22725 19819 2150 44694 19734 10490 1994 32218
Foreign exchange forwards 833 - - 833 849 - - 849
Futures 57 - - 57 281 - - 281
Cross currency swaps 831 1314 40 2185 154 1842 1 1997
(D) Hedging relationships
Cash flow hedges Where a derivative financial instrument is designated as a hedge of the variability of the cash flows of a recognised asset or liability or a highly probable forecasted transaction the effective part of any gain or loss on the derivative financial instrument is recognised directly in other comprehensive income and accumulated in reserves in equity The ineffective portion of any gain or loss is recognised immediately in profit or loss in the Income Statement If a hedge of a forecast transaction subsequently results in the recognition of a financial asset or a financial liability then the associated gains and losses previously recognised directly in other comprehensive income are reclassified to profit or loss in the Income Statement in the same period or periods in which the asset acquired or liability assumed affects the Income Statement (ie when interest income or expense is recognised)
When a hedging instrument expires or is sold terminated or exercised or the Group revokes designation of the hedge relationship and the hedged forecast transaction is still expected to occur the cumulative gain or loss at that point remains in other comprehensive income and is recognised in profit or loss in the Income Statement when the transaction occurs If the hedged transaction is no longer expected to take place then the cumulative unrealised gain or loss is recognised immediately in profit or loss in the Income Statement
Net investment hedge Hedges of net investments in foreign operations are accounted for similarly to cash flow hedges Any foreign currency gain or loss on the hedging instrument relating to the effective portion of the hedge is recognised in other comprehensive income To the extent the hedge is ineffective a portion is recognised immediately in the Income Statement within other income or other expenses
1592021 Annual Report
For the year ended 31 August 2021NOTES TO THE FINANCIAL STATEMENTS
Financial Statements 108 | Signed Reports 183 | Shareholding Details 195 | Glossary 201
38 DERIVATIVE FINANCIAL INSTRUMENTS AND HEDGE ACCOUNTING (CONTINUED)(D) Hedging relationships (continued) The following table shows the executed rates for the most significant hedging instruments that have been designated in cash flow hedges and net investment hedges that are in place at the balance date
Consolidated
Hedging Instruments Currency 2021 2020
Cash flow hedges Interest rate swaps AUD 0010 - 3890 0090 - 4340
Cash flow hedges Cross currency swaps AUDUSD 0761 - 0793 0761 - 0793
AUDEUR 0617 - 0672 0617-0672
NZDAUD 1036 - 1119 1036-1130
Net Investment hedges Foreign exchange forwards AUDNZD 1049 1082
Fair value hedgesFair value hedges are used by the Group to manage exposure to changes in the fair value of an asset Changes in fair values arise from fluctuations in interest rates The Group principally uses interest rate swaps to protect against such fluctuations
Changes in the value of fair value hedges are recognised in the Income Statement together with changes in the fair value of the hedged asset or liability that are attributable to the hedged risk
All gains and losses associated with the ineffective portion of fair value hedge relationships are recognised immediately in the Income Statement
If the hedge relationship no longer meets the criteria for hedge accounting it is discontinued The fair value adjustment to the hedged item is amortised to the Income Statement from the date of discontinuation over the period to maturity of the previously designated hedge relationship using the effective interest method If the hedged item is sold or repaid the unamortised fair value adjustment is recognised immediately in the Income Statement
160 Bank of Queensland Limited and its Controlled Entities
For the year ended 31 August 2021NOTES TO THE FINANCIAL STATEMENTS
Financial Statements 108 | Signed Reports 183 | Shareholding Details 195 | Glossary 201
38 DERIVATIVE FINANCIAL INSTRUMENTS AND HEDGE ACCOUNTING (CONTINUED)(D) Hedging relationships (continued) The following table shows the carrying value of hedged items designated in fair value hedge accounting relationships and the cumulative fair value hedge accounting adjustment that has been recognised as part of that carrying value These balances are being amortised to the Income Statement on an effective yield basis The Group does not hedge its entire exposure to a class of financial instruments nor does it apply hedge accounting in all instances therefore the carrying amounts below will not equal the total carrying amounts disclosed in other notes to these financial statements As noted in the Grouprsquos accounting policies since the hedged item is adjusted only for the hedged risk the hedged itemrsquos carrying value disclosed in the table will not be equivalent to its fair value as disclosed in other notes to these financial statements The accumulated amount of fair value hedge adjustments remaining in the Balance Sheet for hedged items that have ceased to be adjusted for hedging gains and losses is nil (2020 nil) for the Group
Consolidated
2021 2020
Carrying value (1) $m
Fair value hedge adjustments
Debit(Credit) $m
Carrying value (1) $m
Fair value hedge adjustments
Debit(Credit) $m
ASSETS
Debt instruments at FVOCI 5041 (194) 4167 (303)
(1) The carrying amounts in the table above exclude accrued interest from the carrying amount of hedged items
Derivatives that do not qualify for hedge accounting Certain derivative instruments do not qualify for hedge accounting Changes in the fair value of any derivative instrument that does not qualify for hedge accounting are recognised immediately in the Income Statement and are included in other income
(E) Hedge ineffectivenessHedge ineffectiveness in the case of a fair value hedge is the extent to which the changes in the fair value of the hedging instrument differ to that of the hedged item and in the case of cash flow and net investment hedge relationships the extent to which the change in the hedging instrument exceeds that of the hedged item Sources of hedge ineffectiveness primarily arise from basis and timing differences between the hedged items and hedging instruments
The following table contains the hedge ineffectiveness associated with cash flow hedge and fair value hedge relationships during the period as reported in Other operating income in the Income Statement
Consolidated
2021 2020
Gains(losses) on hedge
instruments $m
Gains(losses) on hedge items
$m
Hedge Ineffectiveness
$m
Gains(losses) on hedge
instruments $m
Gains(losses) on hedge items
$m
Hedge Ineffectiveness
$m
INTEREST RATE RISK
Fair value hedges
Interest rate swaps 109 (109) - 6 (7) (1)
Cash flow hedges
Interest rate swaps 70 (67) 3 (1) (6) (7)
INTEREST RATE AND FOREIGN EXCHANGE RISK
Fair value and cash flow hedges
Cross currency swaps (9) 9 - 41 (41) -
1612021 Annual Report
For the year ended 31 August 2021NOTES TO THE FINANCIAL STATEMENTS
Financial Statements 108 | Signed Reports 183 | Shareholding Details 195 | Glossary 201
38 DERIVATIVE FINANCIAL INSTRUMENTS AND HEDGE ACCOUNTING (CONTINUED)(F) Master netting or similar arrangementsThe Group enters into derivative transactions under International Swaps and Derivatives Association (ISDA) master netting agreements Amounts owed by each counter party are aggregated into a single net amount that is payable by one party to another The Group receives and gives collateral in the form of cash in respect of derivatives and such collateral is subject to standard industry terms The Group has not offset these amounts in the Balance Sheet as their ISDA agreements do not meet the criteria to do so The Group has no current legally enforceable right to offset recognised amounts as the right to offset is only enforceable on the occurrence of future events The Group normally settles on a net basis or realises the derivative assets and liabilities simultaneously
The following tables set out the effect of netting arrangements on derivative financial assets and derivative financial liabilities if they were to be applied
2021
CONSOLIDATED
Gross amounts as presented in the Balance
Sheet$m
Net amounts of recognised assets and liabilities available for
offset $m
Calculated Balance
$m
Cash collateral
$m
Net amounts if offsetting applied in
the Balance Sheet $m
Derivative financial assets 137 (51) 86 - 86
Derivative financial liabilities (653) 51 (602) 579 (23)
2020
CONSOLIDATED
Gross amounts as presented in the
Balance Sheet$m
Net amounts of recognised assets and
liabilities available for offset
$m
Calculated Balance
$m
Cash collateral
$m
Net amounts if offsetting applied in
the Balance Sheet $m
Derivative financial assets 154 (48) 106 - 106
Derivative financial liabilities (803) 48 (755) 745 (10)
2021
BANK
Gross amounts as presented in the
Balance Sheet$m
Net amounts of recognised assets and
liabilities available for offset
$m
Calculated Balance
$m
Cash collateral
$m
Net amounts if offsetting applied in
the Balance Sheet $m
Derivative financial assets 86 (51) 35 - 35
Derivative financial liabilities (620) 51 (569) 565 (4)
2020
BANK
Gross amounts as presented in the
Balance Sheet$m
Net amounts of recognised assets and
liabilities available for offset
$m
Calculated Balance
$m
Cash collateral
$m
Net amounts if offsetting applied in
the Balance Sheet $m
Derivative financial assets 101 (48) 53 - 53
Derivative financial liabilities (799) 48 (751) 745 (6)
162 Bank of Queensland Limited and its Controlled Entities
For the year ended 31 August 2021NOTES TO THE FINANCIAL STATEMENTS
Financial Statements 108 | Signed Reports 183 | Shareholding Details 195 | Glossary 201
39 CAPITAL MANAGEMENTThe Bank and Grouprsquos capital management strategy aims to ensure adequate capital levels are maintained to protect deposit holders The Bankrsquos capital is measured and managed in line with Prudential Standards issued by APRA The capital management plan is updated annually and submitted to the Board for approval The approval process is designed to ensure the plan is consistent with the overall business plan and for managing capital levels on an ongoing basis
BOQ intends to operate above the CET1 capital target range of between 90 per cent and 95 per cent until the final impacts of APRArsquos changes to risk weighted assets and capital calibration are understood At 980 per cent BOQ is operating above the top end of the target range and this includes the impact of the acquisition of ME Bank completed on 1 July 2021
QUALIFYING CAPITAL FOR LEVEL 2 ENTITIES (1)2021
$m2020
$m
Common Equity Tier 1 Capital
Paid-up ordinary share capital 5213 3871
Reserves 346 134
Retained profits including current year profits 277 163
Total Common Equity Tier 1 Capital 5836 4168
Regulatory adjustments
Goodwill and intangibles (1180) (908)
Deferred expenditure (311) (187)
Other deductions (11) 16
Total regulatory adjustments (1502) (1079)
Net Common Equity Tier 1 Capital 4334 3089
Additional Tier 1 Capital 610 350
Net Tier 1 Capital 4944 3439
Tier 2 Capital
Tier 2 Capital 450 350
General reserve for credit losses 178 230
Net Tier 2 Capital 628 580
Capital base 5572 4019
Risk Weighted Assets 44229 31576
Common Equity Tier 1 Capital 980 978
Net Tier 1 Capital ratio 1118 1089
Total Capital Adequacy Ratio 1260 1273
(1) APRA Prudential Standard APS 001 Definitions defines Level 2 as the Bank and all of its subsidiary entities other than non-consolidated subsidiaries The non-consolidated subsidiaries excluded from Level 2 regulatory measurements at 31 August 2021 arebull Bank of Queensland Limited Employee Share Plans Trustbull Home Credit Management Pty Ltdbull St Andrewrsquos Australia Services Pty Ltdbull St Andrewrsquos Life Insurance Pty Ltdbull St Andrewrsquos Insurance (Australia) Pty Ltdbull Series 2012-1E REDS Trustbull Series 2013-1 REDS Trustbull Series 2015-1 REDS Trustbull Series 2017-1 REDS Trust bull Series 2018-1 REDS Trust bull Series 2019-1 REDS Trustbull SMHL Series Securitisation Fund 2015-1bull SMHL Series Securitisation Fund 2016-1bull SMHL Series Securitisation Fund 2017-1bull SMHL Series Securitisation Fund 2018-2bull SMHL Series Securitisation Fund 2019-1bull SMHL Series Private Placement Trust 2019-1bull SMHL Series Private Placement 2019-2 andbull SMHL Securitisation Trust 2020-1
1632021 Annual Report
For the year ended 31 August 2021NOTES TO THE FINANCIAL STATEMENTS
Financial Statements 108 | Signed Reports 183 | Shareholding Details 195 | Glossary 201
310 CAPITAL AND RESERVES(A) Ordinary shares
Ordinary shares Ordinary shares are classified as equity Incremental costs directly attributable to the issue of ordinary shares and share rights are recognised as a deduction from equity net of any tax effects
Treasury sharesOrdinary shares of the Bank may be purchased from time to time by a controlled entity of the Bank pursuant to the Awards Rights Plan Equity Incentive Plan Restricted Shares Non-Executive Director Fee Sacrifice Rights Plan and the BOQ Employee ThankQ Plan Where these shares remain unvested to employees they are treated as treasury shares and deducted from capital as required by AASB 132 Financial Instruments Presentation No profit or loss is recorded on purchase sale issue or cancellation of these shares
Terms and conditionsHolders of ordinary shares are entitled to receive dividends as determined by the Bank and are entitled to one vote per share at shareholdersrsquo meetings In the event of a winding up of the Bank ordinary shareholders rank after capital note holders and creditors and are fully entitled to any residual proceeds of liquidation
Consolidated Bank
2021 No of shares
2020 No of shares
2021 No of shares
2020 No of shares
MOVEMENTS DURING THE YEAR
Balance at the beginning of the year ndash fully paid 454335413 405784809 454335413 405784809
Dividend reinvestment plan (1) 2386974 3642826 2386974 3642826
Issues of ordinary shares (2) 130000 440000 130000 440000
Institutional share placement (3) 47619048 32133677 47619048 32133677
Institutional entitlement offer (4) 43684531 - 43684531 -
Retail entitlement offer (5) 92733597 - 92733597 -
Share purchase plan (6) - 12334101 - 12334101
Balance at the end of the year ndash fully paid 640889563 454335413 640889563 454335413
Treasury shares (included in ordinary shares above)
Balance at the beginning of the year 633187 644034 - -
Net acquisitions and disposals during the year 495484 (10847) - -
Balance at the end of the year 1128671 633187 - -
(1) 11 per cent of the dividend paid on 26 May 2021 and 13 per cent of the dividend paid on 25 November 2020 were reinvested by shareholders as part of the dividend reinvestment plan 25 per cent of the dividend paid on 27 November 2019 was reinvested by shareholders as part of the dividend reinvestment plan in prior year
(2) On 9 November 2020 130000 ordinary shares were issued at $637 to the trustee of the Bank of Queensland Limited Employee Share Plans Trust to satisfy the issue of shares under the BOQ Employee ThankQ Plan On 29 November 2019 440000 ordinary shares were issued at $833 to the trustee of the Bank of Queensland Limited Employee Share Plans Trust to satisfy the exercise of award rights and issue of shares under the Award Rights Plan and the issue of shares under the BOQ Restricted Share Plan and the BOQ Employee Share Plan
(3) On 23 February 2021 the Bank completed an institutional placement of new fully paid ordinary shares at the offer price of $735 per share The shares were issued on 3 March 2021 On 26 November 2019 the Bank completed an institutional share placement of new fully paid ordinary shares at an issue price of $778 per share The shares were issued on 29 November 2019
(4) On 23 February 2021 the Bank completed an underwritten 1 for 334 accelerated pro-rata non-renounceable institutional entitlement offer at the offer price of $735 per share The shares were issued on 3 March 2021
(5) On 15 March 2021 the Bank completed an underwritten 1 for 334 accelerated pro-rata non-renounceable retail entitlement offer at the offer price of $735 per share The shares were issued on 17 March 2021
(6) On 30 December 2019 the Bank completed the share purchase plan of new fully paid ordinary shares at an issue price of $727 per share The shares were issued on 2 January 2020
164 Bank of Queensland Limited and its Controlled Entities
For the year ended 31 August 2021NOTES TO THE FINANCIAL STATEMENTS
Financial Statements 108 | Signed Reports 183 | Shareholding Details 195 | Glossary 201
310 CAPITAL AND RESERVES (CONTINUED)(B) Other equity instrumentsOther equity instruments of $314 million include Additional Tier 1 (AT1) securities assumed on the acquisition of ME Bank The securities are perpetual non-cumulative subordinated and unsecured notes (AT1 Capital Notes) and are structured to constitute AT1 capital of ME Bank The AT1 Capital Notes were recognised at fair value on acquisition the face value of the AT1 Capital Notes on issue is $300 million at a price of $10000 per note
Earliest redemption date
2021 No of Capital Notes
2020No of Capital Notes
AT1 EQUITY INSTRUMENTS
AT1 Capital Notes 28112022 20000 -
AT1 Capital Notes 5122023 10000 -
Total AT1 equity instruments 30000 -
The principal terms of the AT1 Capital Notes are described below
bull In a winding up of ME Bank if the AT1 Capital Notes have not been written-off on account of a non-viability trigger event they will rank for payment
bull Ahead of common equity
bull Equally without any preference amongst themselves for each series and with the holders of equal ranking instruments and
bull Behind the claims of subordinated tier 2 instruments and the senior creditors of ME Bank
bull AT1 Capital Notes are undated and unless a tax event or regulatory event occurs are only redeemable at the option of ME Bank on or after the fifth anniversary of the date of issue subject to regulatory approval
bull AT1 Capital Notes pay quarterly floating rate non-cumulative distributions The payment of distributions is at the discretion of ME Bank and subject to no payment condition existing at the payment date and
bull Some or all of the AT1 Capital Notes must be written-off if a non-viability trigger event as determined by APRA occurs
(C) Nature and purpose of reserves
Employee benefits reserve The employee benefits reserve is used to record the value of share based payments provided to employees including key management personnel as part of their remuneration Refer to Note 51 for further details of these plans
Equity reserve for credit losses The Bank is required by APRA to maintain a general reserve for credit losses Consistent with the requirements of APRA Prudential Standard APS 220 Credit Quality the equity reserve for credit losses represents the difference between the accounting collective provisions for impairment and the estimate of credit losses across the credit cycle The equity reserve for credit losses and the eligible component of the collective provision for impairment are aggregated for the purpose of satisfying the APRA requirement for a general reserve for credit losses
Profit reserve The profit reserve represents accumulated profits available for distribution as a dividend
Other reserves FVOCI - Changes in the fair value of financial assets classified as debt and equity instruments at FVOCI are recognised in other comprehensive income as described in Note 32 and accumulated in a separate reserve within equity For debt instruments at FVOCI amounts are reclassified to Other operating income in the Income Statement when the associated assets are sold or impaired For equity instruments at FVOCI amounts are not subsequently transferred to the Income Statement when the associated assets are sold or impaired but can be reclassified to retained profits
Cash flow hedge reserve The hedging reserve is used to record gains or losses on a hedging instrument in a cash flow hedge that are recognised in other comprehensive income as described in Note 38 (D)
Share revaluation reserveThe share revaluation reserve represents the gain or loss on revaluation of the shares held within the employee share plan trust The revaluation of treasury shares is netted off in equity
1652021 Annual Report
For the year ended 31 August 2021NOTES TO THE FINANCIAL STATEMENTS
Financial Statements 108 | Signed Reports 183 | Shareholding Details 195 | Glossary 201
NOTE 4 OTHER ASSETS AND LIABILITIES 41 INTANGIBLE ASSETS
CONSOLIDATEDGoodwill
$m
Customer related
intangibles and brands
$m
Computer software
$m
Assets under construction
$mOther
$mTotal
$m
Balance as at 1 September 2019 682 9 115 117 1 924
Opening balance adjustment (1) 3 - - - - 3
Additions - - - 100 2 102
Transfers to asset - - 56 (56) - -
Impairment - - - (39) - (39)
Amortisation charge - (2) (39) - (3) (44)
Accelerated amortisation charge - - (37) (1) - (38)
Balance as at 31 August 2020 685 7 95 121 - 908
Balance as at 1 September 2020 685 7 95 121 - 908
Acquisition of ME Bank 35 57 72 40 - 204
Additions - - 6 113 - 119
Transfers to asset - - 134 (134) - -
Amortisation charge - (4) (43) - - (47)
Accelerated amortisation charge (2) - - (4) - - (4)
Balance as at 31 August 2021 720 60 260 140 - 1180
BANKGoodwill
$m
Customer related
intangibles and brands
$m
Computer software
$m
Assets under construction
$mOther
$mTotal
$m
Balance as at 1 September 2019 619 8 103 117 1 848
Opening balance adjustment (1) 3 - - - - 3
Additions - - - 100 1 101
Transfers to asset - - 56 (56) - -
Impairment - - - (39) - (39)
Amortisation charge - (2) (35) - (2) (39)
Accelerated amortisation charge - - (35) (1) - (36)
Balance as at 31 August 2020 622 6 89 121 - 838
Balance as at 1 September 2020 622 6 89 121 - 838
Additions - - 6 109 - 115
Transfers to asset - - 132 (132) - -
Amortisation charge - (2) (35) - - (37)
Accelerated amortisation charge - - (1) - - (1)
Balance as at 31 August 2021 622 4 191 98 - 915
(1) The opening balance adjustment reflects the recognition of a DTL on the balance of intangible assets acquired as part of historic acquisitions This amount is not allocated to CGUs and the DTL is expected to unwind over 3 years
(2) The August 2021 financial results include a non-recurring adjustment due to a change in the ME Bank minimum threshold for the capitalisation of intangible assets to align with BOQ
166 Bank of Queensland Limited and its Controlled Entities
For the year ended 31 August 2021NOTES TO THE FINANCIAL STATEMENTS
Financial Statements 108 | Signed Reports 183 | Shareholding Details 195 | Glossary 201
41 INTANGIBLE ASSETS (CONTINUED)Recognition and measurementIntangible assets are measured at cost on initial recognition Intangible assets acquired in a business combination are measured at fair value at the date of acquisition
Following initial recognition intangible assets are stated at cost less any accumulated amortisation and any impairment losses Expenditure on internally generated goodwill research costs and brands is recognised in the Income Statement as an expense as incurred
Subsequent expenditure on intangible assets is capitalised only when it increases the future economic benefits embodied in the specific asset to which it relates All other expenditure is expensed as incurred
AmortisationExcept for goodwill amortisation is charged to profit or loss in the Income Statement on a straight-line basis over the estimated useful life of the intangible asset unless the life of the intangible asset is indefinite Where applicable intangible assets are amortised from the date they are available for use The amortisation period and method are reviewed on an annual basis The amortisation rates used in the current and comparative periods are as follows
Years
Computer software 3-10
Customer related intangibles and brands 3-10
Impairment testing of the Cash-Generating Units containing goodwillFor the purpose of the annual impairment test goodwill is allocated to groups of Cash-Generating Units (CGUs) which represent the Controlled Entityrsquos operating segments - Retail Banking and BOQ Business (refer Note 25) The carrying amount of each CGU is compared to its recoverable amount The recoverable amount is based on the CGUrsquos value in use
Value in use is determined by discounting the future cash flows generated from the continued use of the CGU The values assigned to the key assumptions represent managementrsquos assessments of future trends in retail and business banking and are based on both external and internal sources
Below are the key assumptions used in determining value in use
bull Cash flows are materially aligned with the Grouprsquos Strategic Plan as announced to market as part of the Bankrsquos strategic review
bull Determined future lending growth and income growth in line with expected benefits from the Bankrsquos increased capital investment and digital transformation
bull Cost growth assumptions are aligned with the Grouprsquos Strategic plan and aspirations to reduce cost to income targets
bull A terminal growth rate of 3 per cent (2020 25 per cent) was used to extrapolate long-term growth and
bull A post-tax discount rate of 94 per cent (2020 94 per cent) was used
bull Goodwill of $35 million arising on the acquisition of ME Bank is not included for the purpose of the annual impairment testing The goodwill has been assessed by applying the acquisition method in business combination accounting on 1 July 2021 The goodwill recognised of $35 million represents the fair value of expected future synergies arising from the acquisition
The key assumptions described above may change as economic and market conditions change Management has stressed key assumptions to understand key sensitivities and impact to the value in use
1672021 Annual Report
For the year ended 31 August 2021NOTES TO THE FINANCIAL STATEMENTS
Financial Statements 108 | Signed Reports 183 | Shareholding Details 195 | Glossary 201
41 INTANGIBLE ASSETS (CONTINUED)Impairment testing of the cash generating units containing goodwill (continued)The aggregate carrying amounts of goodwill for each CGU are
2021$m
2020 $m
Retail Banking 288 288
BOQ Business 394 394
Total 682 682
The measurement of the CGUrsquos recoverable amounts is most sensitive to a change in net interest income cost of capital and cost to income ratios BOQ has considered reasonably possible changes in key assumptions and the table below provides these assumption changes across the period of assessment that would result in impairment if all other assumptions were held constant
Model Parameter Retail Banking BOQ Business
Change from base case
Cost of capital 06 08
Cost to income 30 40
NIM change (5bps) (11bps)
168 Bank of Queensland Limited and its Controlled Entities
For the year ended 31 August 2021NOTES TO THE FINANCIAL STATEMENTS
Financial Statements 108 | Signed Reports 183 | Shareholding Details 195 | Glossary 201
42 PROVISIONS A provision is recognised in the Balance Sheet when the Group has a present legal or constructive obligation as a result of a past event and it is probable that an outflow of economic benefits will be required to settle the obligation If the effect is material provisions are determined by discounting the expected future cash flows at a pre-tax rate that reflects current market assessments of the time value of money and when appropriate the risks specific to the liability The carrying amounts of the provisions recognised are
Consolidated Bank
2021 $m
2020 $m
2021 $m
2020 $m
Employee benefits (1) 47 23 27 20
Provision for non-lending loss 3 13 3 13
Other (2) 14 11 13 5
Total provisions 64 47 43 38
Pay and entitlements reviewIn 2020 BOQ commenced a review of payments to employees covering Superannuation guarantee compliance and whether correct payments have been made to employees under successive BOQ Enterprise Agreements being 2010 2014 and 2018 During the year BOQ made remediation payments for base wage superannuation and interest for active permanent employees As at 31 August 2021 the remaining provision balance was $11 million The provision balance is based on financial modelling that has reconstructed BOQrsquos payroll obligations covering Enterprise Agreement remediation on-costs and interest and associated professional costs based on managementrsquos assessment of the facts and circumstances existing as at the reporting date It is reasonably possible that the final outcomes may differ to those reported the impact of which will be reflected in future reporting periods
Movements in provisionsMovements in each class of provision during the year other than employee benefits are as follows
Consolidated Bank
2021
Non-lending loss $m
Other $m
Non-lending loss $m
Other $m
Carrying amount at beginning of year 13 11 13 5
Additional provision recognised (3) 1 11 1 14
Amounts utilised during the year (1) (8) (1) (7)
Release of provision (1) (9) (1) (8)
Reclassification from non-lending loss provision (4) (9) 9 (9) 9
Carrying amount at end of year 3 14 3 13
Current 3 14 3 13
Non-current - - - -
(1) Employee benefits provision consists of annual leave (represents present obligations resulting from employeesrsquo services provided up to the reporting date calculated based on remuneration wage and salary rates that the Group expects to pay as at reporting date including related on-costs) and long service leave entitlements for employees (represents the present value of the estimated future cash outflows to be made resulting from employeesrsquo services provided to reporting date) The provision is calculated using expected future increases in wage and salary rates including related on-costs and expected settlement dates based on turnover history and is discounted using the rates attached to Australian 10 year corporate bonds at reporting date which most closely match the terms of maturity of the related liabilities $18 million of employee benefits provision relates to ME Bank acquisition $32 million (2020 $18 million) of this provision balance is classified as current
(2) Other provisions include $11 million in relation to the Grouprsquos employee pay and leave entitlements review and a restructure provision of $2 million(3) $1 million of additional provision recognised in Other relates to ME Bank acquisition(4) During the year the employee pay and leave entitlements review provision has been reclassified from Non-lending loss to Other
1692021 Annual Report
For the year ended 31 August 2021NOTES TO THE FINANCIAL STATEMENTS
Financial Statements 108 | Signed Reports 183 | Shareholding Details 195 | Glossary 201
NOTE 5 OTHER NOTES51 EMPLOYEE BENEFITS (A) Superannuation commitments
Superannuation plan The Group contributes to a number of superannuation plans which comply with the Superannuation Industry (Supervision) Act 1993 Contributions are charged to profit or loss in the Income Statement as they are made
Basis of contributionsThe Group is required to meet the minimum legal obligations under the relevant superannuation guarantee legislation and the industrial instrument provisions
(B) Share based paymentsThe Group currently operates the Equity Incentive Plan (previously the Awards Right Plan) for equity-settled compensation The plan allows the Grouprsquos employees to acquire shares in the Bank The fair value of rights granted is recognised as an employee expense with a corresponding increase to the Employee Benefits Reserve The fair value is measured at grant date and spread over the period during which the employees become unconditionally entitled to the rights The fair value of the rights granted is measured using industry accepted pricing methodologies taking into account the terms and conditions upon which the rights are granted The fair value of the rights is expensed over the vesting period Where rights do not vest due to failure to meet a non-market condition (eg employee service period) the expense is reversed Where rights do not vest due to failure to meet a market condition (eg total shareholder return test) the expense is not reversed
(i) Description of share based paymentsThe Award Rights Plan was first introduced and approved by shareholders on 11 December 2008 with the subsequent changes to the Award Rights Plan approved by shareholders on 30 November 2017 It is an equity based program under which Award Rights were granted as long-term incentives Types of award rights granted to employees under this plan were Deferred Award Rights (DARs) Performance Award Rights (PARs) BOQ Group Transformation Award (BTAs) BOQ Group Transformation Award - Virgin (VTAs) and Restricted Shares
The Award Rights Plan was replaced by the Equity Incentive Plan on 1 September 2020 Types of award rights granted to employees under the new plan are DARs Premium Priced Options Performance Shares and Restricted Shares
No amount is payable by employees for the grant or exercise of the award rights
Equity Incentive PlanEffective 1 September 2020 the Group made changes to the way it delivers variable remuneration including the discontinuation of the PARs plan and the introduction of Premium Priced Options and Performance Shares
Performance Shares Performance Shares are delivered in rights that convert to restricted shares at the end of the financial year based on the Boardrsquos assessment of performance against the Group Scorecard risk and conduct Once converted the restricted shares vest after a further one two and three years
Premium Priced OptionsPremium Priced Options vest in two tranches with 50 per cent vesting at the end of year four and 50 per cent at the end of year five The exercise price is set at 120 per cent of the share price based on a volume weighted average price over the five trading days following the Annual General Meeting (AGM) On exercise the options can be settled in cash or an allocation of shares
DARs There are no market performance hurdles or other performance based vesting conditions for DARs but the holder must remain an employee of the Bank DARs granted in December 2018 and December 2019 were issued under the Award Rights Plan and vest over three years in the ratio of 20 per cent at the end of year one 30 per cent at the end of year two and 50 per cent at the end of year three
In 2021 DARs were issued under the Equity Incentive Plan and the vesting period is dependent on if a person is an Accountable Person under the Banking Executive Accountability Regime (BEAR) DARs issued to Accountable Persons under the BEAR were extended to vest over four years in a ratio of 20 per cent at the end of year one 10 per cent at the end of year two 10 per cent at the end of year three and 60 per cent at the end of year four All other employees are unaffected by this change
DARs may be exercised by the employee once they have vested
Restricted SharesThe Group has used shares with restrictions on disposal as a non-cash share based component of both short term and long term incentive awards On occasion restricted shares are also used as make-good awards
170 Bank of Queensland Limited and its Controlled Entities
For the year ended 31 August 2021NOTES TO THE FINANCIAL STATEMENTS
Financial Statements 108 | Signed Reports 183 | Shareholding Details 195 | Glossary 201
51 EMPLOYEE BENEFITS (CONTINUED) (B) Share based payments (Continued)
Award Rights PlanPARs For PARs granted in December 2018 and December 2019 the vesting framework is based on the relative Total Shareholder Return (rTSR) and relative EPS The rTSR component makes up 80 per cent of the employeersquos PARs and is measured against a peer group over a four year period That peer group consists of companies included in the SampP ASX 200 index excluding selected entities in resources real estate investment trusts telecommunications (offshore headquartered) energy and utilities and such other inclusions and exclusions the Board considers appropriate TSR is a measure of the entire return a shareholder would obtain from holding an entityrsquos securities over a period taking into account factors such as changes in the market value of the securities and dividends paid over the period
The TSR component of the PARs vests in accordance with rTSR performance as follows
rTSR performance
TSR component of PARs vesting
At or above 75th percentile All
50th to 75th percentile Relative proportion between 50 and 100 per cent
Below 50th percentile None
The remaining 20 per cent of PARs vest based on the Bankrsquos EPS performance measured against a financial services peer group over a four year period
The Bankrsquos cash EPS Compound Annual Growth Rate (CAGR) performance PARs vesting
At or above 90th percentile All
60th to 90th percentile Relative proportion between 50 and 100 per cent
Below 60th percentile None
PARs may be exercised by the employee once they have vested
BTAsThe performance hurdles or vesting conditions for BTAs are linked to BOQ Group meeting cash earnings excluding loan impairment expense and income tax targets BTAs vest in two tranches in the ratio of 50 per cent in year one and 50 per cent in year two if BOQ Group meets the respective cash earnings targets There is an opportunity for retest in year two and three There are no market performance hurdles BTAs may be exercised by the employee once they have vested
VTAs The performance hurdles or vesting conditions for VTAs are linked to the delivery of a next generation core banking platform through Virgin Money Australia (Project de Novo) and BOQ Group meeting cash earnings excluding loan impairment expense and income tax targets VTAs vest in two tranches in the ratio of 50 per cent subject to the delivery of Project de Novo and 50 per cent if BOQ Group meet cash earnings targets in year two There is an opportunity for retest in year three There are no market performance hurdles VTAs may be exercised by the employee once they have vested
1712021 Annual Report
For the year ended 31 August 2021NOTES TO THE FINANCIAL STATEMENTS
Financial Statements 108 | Signed Reports 183 | Shareholding Details 195 | Glossary 201
51 EMPLOYEE BENEFITS (CONTINUED) (B) Share based payments (continued)
(ii) Award rights on issueThe number of rights and restricted shares on issue for the Bank is as follows
Deferred Award Rights
Performance Award Rights
Premium Priced Options
BOQ Group transformation
award
BOQ Group transformation award - Virgin
Performance Shares
Restricted Shares
2021 rsquo000
2020 rsquo000
2021 rsquo000
2020 rsquo000
2021 rsquo000
2020 rsquo000
2021 rsquo000
2020 rsquo000
2021 rsquo000
2020 rsquo000
2021 rsquo000
2020 rsquo000
2021 rsquo000
2020 rsquo000
Balance at beginning of the year
1606 1252 1792 1787 - - 431 - 66 - - - 73 202
Granted 1156 837 - 1065 8034 - - 435 - 66 661 - 295 -
Forfeited expired
(170) (139) (593) (1057) - - (63) (4) - - - - (65) -
Exercised (450) (344) (2) (3) - - (120) - (26) - - - (3) (129)
Outstanding at the end of the year
2142 1606 1197 1792 8034 - 248 431 40 66 661 - 300 73
(iii) Measurement of fair valuesThe Premium Priced Options have been valued using a four step methodology that uses a simulation approach to project future share prices and then the Binomial model to value the options on vesting The fair value of PARs has been measured using a Monte Carlo simulation approach
The fair value of DARs BTAs VTAs and Performance Shares have been measured using a formula based approach discounted by the assumed dividend yield
The value of Restricted Shares is equal to the Share Price as at the grant date
The weighted average of the inputs used in the measurement of the long term incentive award rights grants during the year was as follows
Deferred Award Rights
Performance Award Rights
Premium Priced Options
BOQ Group transformation
award
BOQ Group transformation
award- VirginPerformance
SharesRestricted
Shares
2021 2020 2021 2020 2021 2020 2021 2020 2021 2020 2021 2020 2021 2020
Fair value at grant date ($) 697 609 - 361 067 - - 612 - 612 779 - 704 -
Share price at grant date ($) 773 741 - 742 802 - - 741 - 741 798 - 783 -
Expected volatility () 251 180 - 180 250 - - 180 - 180 264 - 256 -
Risk free interest rate () 02 08 - 08 04 - - 08 - 08 02 - 02 -
Dividend yield () 50 88 - 88 50 - - 88 - 88 50 - 50 -
(iv) Salary sacrifice arrangements The Non-Executive Director Fee (NEDs) Sacrifice Rights Plan (NED Plan) allows NEDs to sacrifice a portion of their Board fees to acquire BOQ shares The equity under this plan is not subject to any conditions apart from a disposal restriction for a minimum of three years
(v) Other employee awards
BOQ ThankQ PlanThe ThankQ Plan replaces the previously offered salary sacrifice Employee Share Plan and is a gift of shares up to a maximum of $1000 per eligible employee During the year the Group granted 235498 shares under this plan The shares under this plan are restricted from sale until the earlier of three years or until an employee ceases employment with the Group
172 Bank of Queensland Limited and its Controlled Entities
For the year ended 31 August 2021NOTES TO THE FINANCIAL STATEMENTS
Financial Statements 108 | Signed Reports 183 | Shareholding Details 195 | Glossary 201
52 COMMITMENTSConsolidated Bank
2021 $m
2020 $m
2021 $m
2020 $m
(A) CUSTOMER FUNDING COMMITMENTS
Guarantees indemnities and letters of credit 259 267 259 267
Customer funding commitments 5085 1659 1282 861
5344 1926 1541 1128
In the normal course of business the Group makes commitments to extend credit to its customers Most commitments either expire if not taken up within a specified time or can be cancelled by the Group within one year Credit risk is significantly less than the notional amount and does not crystallise until a commitment is funded Guarantees are provided to third parties on behalf of customers The credit risks of such facilities are similar to the credit risks of loans and advances
The Group has lease commitments of $103 million (2020 nil) which have not been recognised as lease liabilities on the Balance Sheets as the lease commencement dates are after the end of the financial year Expenditure on software assets and other expenditure contracted for but not provided on the Balance Sheets is $34 million (2020 $8 million)
53 CONTINGENT LIABILITIESAs part of the St Andrewrsquos sale agreement BOQ will provide a capped indemnity of $85 million to the buyer Farmcove Investment Holdings for certain pre-completion matters
54 RELATED PARTIES INFORMATION(A) Controlled entitiesDetails of interests in materially controlled entities are set out in Note 55
During the year there have been transactions between the Bank and its controlled entities The Bank conducted normal banking business with its operating controlled entities Amounts owing to or from controlled entities generally attract interest on normal terms and conditions except in respect of Virgin Money (Australia) Pty Limited Virgin Money Financial Services Pty Ltd BOQ Specialist Pty Ltd BOQ Home Pty Limited Home Credit Management Pty Ltd and dormant entities as set out in Note 55(A)
The Bank receives management fees from its operating controlled entities except ME Bank Virgin Money Financial Services Pty Ltd BOQ Specialist Pty Ltd BOQ Home Pty Limited Home Credit Management Pty Ltd and dormant entities as set out in Note 55(A)
The Bank has a related party relationship with equity accounted joint ventures refer to Note 56
(B) Key management personnel compensationKMP have authority and responsibility for planning directing and controlling the activities of the Bank and the Group including Directors and other Senior Executives
KMP compensation included in lsquoadministrative expensesrsquo and lsquoemployee expensesrsquo (refer to Note 22) is as follows
2021 $
2020 $
Short term employee benefits 6667311 5944543
Long term employee benefits 137887 46646
Post employment benefits 264703 267565
Share based employment benefits 3045711 1451477
Termination benefits - 686024
10115612 8396255
Individual Directors and Senior Executives compensation disclosuresInformation regarding individual Directors and Senior Executivesrsquo compensation and some equity instruments disclosures as permitted by Regulation 2M303 of the Corporations Regulations 2001 is provided in the Remuneration Report section of the Directorsrsquo Report
Apart from the details disclosed in the Remuneration Report no Director has entered into a material contract with the Bank since the end of the previous financial year and there were no material contracts involving Directorsrsquo interests existing at year end
1732021 Annual Report
For the year ended 31 August 2021NOTES TO THE FINANCIAL STATEMENTS
Financial Statements 108 | Signed Reports 183 | Shareholding Details 195 | Glossary 201
54 RELATED PARTIES INFORMATION (CONTINUED)(C) Other financial instrument transactions with key management personnel and their related partiesA number of KMP and their close family members hold positions in other entities that result in them having control or significant influence over the financial or operating policies of those entities These entities as well as the KMP and their close family members are related parties to the Group Financial instrument transactions with KMP and their related parties during the financial year arise out of the provision of banking services the acceptance of funds on deposit the granting of loans and other associated financial activities The terms and conditions of the transactions entered into with KMP and their related parties were no more favourable than those available or which might reasonably be expected to be available on similar transactions to non-related entities on an armrsquos length basis No amounts have been written down or recorded as impaired during the year (2020 nil)
The transactions undertaken between the Group and KMP or their related parties up to 31 August 2021 are
Balance as at For the period (1)
1 September 2020
$
31 August 2021
$
Total loan drawdowns (repayments)
$
Total loan overdraft
interest$
Total fees on loans overdraft
$
Term products (loans advances)
KMP 350000 350000 (11508) 11508 -
Other related parties 760430 743279 (52449) 34998 300
Total 1110430 1093279 (63957) 46506 300
Balance as at For the period
1 September 2019
$
31 August 2020
$
Total loan drawdowns (repayments)
$
Total loan overdraft
interest$
Total fees on loans overdraft
$
Term products (loans advances)
KMP 1529029 350000 (16441) 16595 40
Other related parties 186543 760430 731742 25851 175
Total 1715572 1110430 715301 42446 215
(1) Amounts are included only for the period that the Director Executive is classified as a member of the KMP
174 Bank of Queensland Limited and its Controlled Entities
For the year ended 31 August 2021NOTES TO THE FINANCIAL STATEMENTS
Financial Statements 108 | Signed Reports 183 | Shareholding Details 195 | Glossary 201
55 CONTROLLED ENTITIES (A) Particulars in relation to materially controlled entitiesThe Grouprsquos controlled entities at 31 August 2021 are set out below The country of incorporation or registration is also the principal place of business
Place of businesscountry of
incorporationParent entityrsquos
interest Amount of investment Principal activities
Controlled entities2021
2020
2021
$m2020
$m
Alliance Premium Funding Pty Ltd New Zealand 100 100 - - Dormant
Bank of Queensland Limited Employee Share Plans Trust Australia 100 100 - - Trust
BOQ Asset Finance and Leasing Pty Ltd Australia 100 100 - - Asset finance amp leasing
BOQ Covered Bond Trust Australia 100 100 - - Issue of covered bonds
BOQ Credit Pty Limited Australia 100 100 - - Asset finance amp leasing
BOQ Equipment Finance Limited Australia 100 100 15 15 Asset finance amp leasing
BOQF Cashflow Finance Pty Ltd Australia 100 100 - - Professional finance
BOQ Finance (Aust) Limited Australia 100 100 230 230 Asset finance amp leasing
BOQ Finance (NZ) Limited New Zealand 100 100 22 22 Asset finance amp leasing
BOQ Funding Pty Limited Australia 100 100 - - Dormant
BOQ Home Pty Ltd Australia 100 100 157 157 Investment holding entity
BOQ Share Plans Nominee Pty Ltd Australia 100 100 - - Dormant
BOQ Specialist (Aust) Limited Australia 100 100 13 13 Professional finance and asset finance amp leasing
BOQ Specialist Pty Ltd Australia 100 100 - - Professional finance
BQL Management Pty Ltd Australia 100 100 - - Trust management
Home Credit Management Pty Ltd Australia 100 100 - - Investment holding entity
Home Financial Planning Pty Ltd Australia 100 100 - - Dormant
Impala Trust No 2 - Sub-Series 2 Australia 100 100 - - Securitisation
Members Equity Bank Limited Australia 100 - 1388 - Financial services
ME Portfolio Management Limited Australia 100 - - - Dormant
SMHL Series Private Placement 2014-2 Australia 100 - - - Securitisation
SMHL Series Securitisation Fund 2015-1 Australia 100 - - - Securitisation
SMHL Series Securitisation Fund 2016-1 Australia 100 - - - Securitisation
SMHL Series Securitisation Fund 2017-1 Australia 100 - - - Securitisation
SMHL Series Private Placement Trust 2017-2 Australia 100 - - - Securitisation
SMHL Series 2018-1 Fund Australia 100 - - - Securitisation
SMHL Series Securitisation 2018-2 Australia 100 - - - Securitisation
SMHL Series Private Placement Trust 2019-1 Australia 100 - - - Securitisation
SMHL Series Securitisation Fund 2019-1 Australia 100 - - - Securitisation
SMHL Series Private Placement 2019-2 Australia 100 - - - Securitisation
SMHL Securitisation Trust 2020-1 Australia 100 - - - Securitisation
Pioneer Permanent Pty Ltd Australia 100 100 32 32 Dormant
Series 2008-1 REDS Trust Australia 100 100 - - Securitisation
Series 2010-2 REDS Trust Australia - 100 - - Securitisation
Series 2012-1E REDS Trust Australia 100 100 - - Securitisation
1752021 Annual Report
For the year ended 31 August 2021NOTES TO THE FINANCIAL STATEMENTS
Financial Statements 108 | Signed Reports 183 | Shareholding Details 195 | Glossary 201
55 CONTROLLED ENTITIES (CONTINUED)(A) Particulars in relation to materially controlled entities (continued)
Place of businesscountry of
incorporationParent entityrsquos
interest Amount of investment Principal activities
Controlled entities2021
2020
2021
$m2020
$m
Series 2013-1 REDS Trust Australia 100 100 - - Securitisation
Series 2015-1 REDS Trust Australia 100 100 - - Securitisation
Series 2017-1 REDS Trust Australia 100 100 - - Securitisation
Series 2018-1 REDS Trust Australia 100 100 - - Securitisation
Series 2018-1 REDS EHP Trust Australia 100 100 - - Securitisation
Series 2019-1 REDS Trust Australia 100 100 - - Securitisation
Series 2021-1 REDS EHP Trust Australia 100 - - - Securitisation
St Andrewrsquos Australia Services Pty Ltd (1) Australia 100 100 - 30 Insurance holding entity
St Andrewrsquos Insurance (Australia) Pty Ltd Australia 100 100 - - General insurance
St Andrewrsquos Life Insurance Pty Ltd Australia 100 100 - - Life insurance
Statewest Financial Planning Pty Ltd Australia 100 100 - - Dormant
Virgin Money (Australia) Pty Limited Australia 100 100 53 53 Financial services
Virgin Money Financial Services Pty Ltd Australia 100 100 - - Financial services
Virgin Money Home Loans Pty Limited Australia 100 100 - - Dormant
1910 552
(1) The investment in St Andrewrsquos Australia Services Pty Ltd has been classified as held for sale as at 31 August 2021 Refer to note 55(E) for further details
(B) Significant restrictionsIn accordance with APS 222 Associations with related entities the Bank and its subsidiaries that form part of the Extended Licensed Entity have various restrictions This includes not having unlimited exposures to related entities including general guarantees
(C) Acquisition of controlled entities(i) Accounting for business combinations
All business combinations occurring on or after 1 July 2009 are accounted for by applying the acquisition method For every business combination the Group identifies the acquirer which is the combining entity that obtains control of the other combining entities or businesses The Group controls an entity if it is exposed to or has rights to variable returns from its involvement with the entity and has the ability to affect those returns through its power over the investee
The consideration transferred in the acquisition is generally measured at fair value as are the identifiable net assets acquired Any goodwill that arises is tested annually for impairment
Contingent Liabilities A contingent liability of the acquiree is assumed in a business combination only if such a liability represents a present obligation and arises from a past event and its fair value can be measured reliably
Transaction CostsTransaction costs that the Group incurs in connection with a business combination such as a finderrsquos fee legal fees due diligence fees and other professional and consulting fees are expensed as incurred Transaction costs related to the issue of ordinary shares are recognised as a deduction from equity
(ii) Business combinations during the yearOn 1 July 2021 the Group acquired 100 per cent of the shares and voting interests in ME Bank for cash consideration of $1388 billion
ME Bank engages in the provision of banking services including funding management and servicing of residential and consumer lending portfolios and carrying out associated funding activities for off balance sheet portfolios The addition of ME Bank to the BOQ Group will further strengthen the Grouprsquos multi-brand strategy deliver material scale broadly double the size of the Retail bank provide geographic diversification and create a compelling alternative to the big banks
In the period from 1 July 2021 to 31 August 2021 ME Bank contributed revenue of $83 million and profit after tax of $17 million to the Grouprsquos results If the acquisition had occurred on 1 September 2020 BOQ estimates that consolidated revenue would have been $499 million and consolidated profit for the year would have been $111 million which includes amortisation of fair value adjustments between 1 July 2021 to 31 August 2021 Due to the nature of these adjustments the full year impact has not been disclosed as it cannot be reliably measured
BOQ incurred acquisition-related costs of $19 million on legal fees and due diligence costs These costs have been predominantly included in administrative expenses
176 Bank of Queensland Limited and its Controlled Entities
For the year ended 31 August 2021NOTES TO THE FINANCIAL STATEMENTS
Financial Statements 108 | Signed Reports 183 | Shareholding Details 195 | Glossary 201
55 CONTROLLED ENTITIES (CONTINUED)
(ii) Business combinations during the year (continued)The fair values of the identifiable assets and liabilities of ME Bank as at the date of acquisition were
Fair value on acquisition $m
Assets
Cash and cash equivalents 642
Due from other financial institutions 124
Debt instruments at FVOCI 3320
Equity instruments at FVOCI 3
Property plant and equipment 73
Software intangibles 112
Brand intangibles 26
Customer relationship intangibles 31
Loans and advances 25669
Other assets 19
Total Assets 30019
Liabilities
Deposits 22302
Derivatives financial liabilities 26
Accounts payable and other liabilities 161
Provisions 18
Current tax liabilities 9
Borrowings 5833
Deferred tax liabilities 2
Total Liabilities 28351
Net identifiable assets and liabilities 1668
Other equity instruments (315)
Goodwill arising on acquisition 35
Total Purchase consideration transferred 1388
Cash acquired 642
Net cash outflow 746
The goodwill recognised of $35 million represents the fair value of expected future synergies arising from the acquisition
All fair values are disclosed on a provisional basis If new information obtained within one year of the date of acquisition about facts and circumstances that existed at the date of acquisition identifies adjustments to the above amounts or any additional provisions that existed at the date of acquisition then the accounting for the acquisition will be revised
(iii) Entities established during the yearThe following entities were established during the financial year
bull Series 2021-1 REDS EHP Trust was opened on 11 August 2021
(D) Disposal of controlled entitiesThe following entities were closed during the financial year
bull Series 2010-2 REDS Trust was closed on 29 March 2021
1772021 Annual Report
For the year ended 31 August 2021NOTES TO THE FINANCIAL STATEMENTS
Financial Statements 108 | Signed Reports 183 | Shareholding Details 195 | Glossary 201
55 CONTROLLED ENTITIES (CONTINUED)(E) Operations classified as held for saleOn 13 October 2020 the Bank entered into an agreement to sell the Bankrsquos controlled entities - St Andrewrsquos Australia Services Pty Ltd and its subsidiaries St Andrewrsquos Insurance (Australia) Pty Ltd and St Andrewrsquos Life Insurance Pty Ltd (the St Andrewrsquos Insurance Group) for proceeds of approximately $23 million As at the reporting date the St Andrewrsquos Insurance Group remained part of the BOQ Group due to outstanding regulatory approvals
As at 31 August 2021 the Consolidated Entity met the relevant criteria for reporting the St Andrewrsquos Insurance Group as held for sale under AASB 5 Non-current assets held for sale and discontinued operations (AASB 5) However as all of the assets of the disposal group are excluded from the measurement requirements of AASB 5 an impairment loss has not been recognised As such the indicative loss on sale after tax of $24 to $27 million will be reflected upon completion and will be impacted by completion adjustments transaction costs and final taxation impacts
The sale of the St Andrewrsquos Group will impact the operating segment Other
As at 31 August 2021 the Bank had assets held for sale of $30 million which represents the Bankrsquos investment in the St Andrewrsquos Group Financial information in relation to the St Andrewrsquos Group assets and liabilities held for sale for the year to 31 August 2021 is set out below
2021 (1) $m
Cash and cash equivalents 4
Due from other financial institutions - term deposits 33
Assets arising through reinsurance contracts 5
Other assets 1
Total Assets 43
Insurance policy liabilities 7
Other liabilities 10
Total Liabilities 17
Net assets 26
(1) Intragroup balances have been eliminated however will impact on the final loss on sale at completion
178 Bank of Queensland Limited and its Controlled Entities
For the year ended 31 August 2021NOTES TO THE FINANCIAL STATEMENTS
Financial Statements 108 | Signed Reports 183 | Shareholding Details 195 | Glossary 201
56 INVESTMENTS IN JOINT ARRANGEMENTSThe Group holds interests in a number of collectively and individually immaterial joint ventures that are accounted for using the equity method
(A) Accounting for joint arrangements The Grouprsquos investment in joint venture entities is accounted for under the equity method of accounting in the consolidated financial statements Joint ventures are entities in which the Group has joint control over all operational decisions and activities
(B) Details of joint venturesSet out below are the joint ventures of the Group as at 31 August 2021 which in the opinion of the Directors are immaterial to the Group Australia is the place of business and also the country of incorporation for all joint ventures
Ownership Interest Carrying amount
2021 ()
2020 ()
2021 $m
2020 $m
Joint arrangements (1)
Ocean Springs Pty Ltd (Brighton) 931 931 3 6
Dalyellup Beach Pty Ltd (Dalyellup) 1708 1708 7 7
East Busselton Estate Pty Ltd (Provence) 2500 2500 - -
Coastview Nominees Pty Ltd (Margaret River) 581 581 - -
Provence 2 Pty Ltd (Provence 2) 2500 2500 - -
Total equity accounted investments 10 13
(1) The principal activity of the joint venture entities is land subdivision development and sale These investments were acquired as part of the Home Building Society acquisition in 2007
Summary financial information for equity accounted joint ventures adjusted for the share of ownership held by the Group is contained below
2021$m
2020 $m
Profit from continuing operations 1 -
Total comprehensive profit 1 -
1792021 Annual Report
For the year ended 31 August 2021NOTES TO THE FINANCIAL STATEMENTS
Financial Statements 108 | Signed Reports 183 | Shareholding Details 195 | Glossary 201
57 AUDITORrsquoS REMUNERATIONConsolidated Bank
KPMG Australia2021
$0002020$000
2021$000
2020$000
Audit services
- Statutory audits and reviews of the financial reports 2172 1857 1826 1437
- Regulatory audits and reviews as required by regulatory authorities 704 762 611 667
Total audit services 2876 2619 2437 2104
Audit related services
- Other assurance services 373 402 154 143
Total audit related services 373 402 154 143
Non-audit services
- Taxation services 116 122 116 77
- Other 250 192 250 174
Total non-audit services 366 314 366 251
Non-audit services other include trust assurance work coupled with capital raising in connection with the ME Bank acquisition
Details of the amounts paid to other auditor for audit services provided during the year in respect of ME Bank acquisition
Consolidated Bank
Other auditor2021
$0002020$000
2021$000
2020$000
Audit services
- Statutory audits and reviews of the financial reports 202 - - -
Total audit services 202 - - -
58 EVENTS SUBSEQUENT TO BALANCE DATEThe evolution of the COVID-19 pandemic remains uncertain including the duration of the pandemic the severity of the downturn and the speed of the economic recovery BOQ has considered whether events subsequent to the reporting date have confirmed conditions existing as at reporting date and has not identified any COVID-19 related developments which would require adjustments to the amounts or disclosures contained in the consolidated financial statements Future economic conditions may differ to the assumptions and scenarios used in the consolidated financial statements the impact of which will be reflected in future reporting periods
The Directors are not aware of any matters or circumstances that have arisen in the interval between the end of the financial year and the date of this report or any item event or transaction which significantly affects or may significantly affect the operations of the Group in future financial years
180 Bank of Queensland Limited and its Controlled Entities
For the year ended 31 August 2021NOTES TO THE FINANCIAL STATEMENTS
Financial Statements 108 | Signed Reports 183 | Shareholding Details 195 | Glossary 201
59 SIGNIFICANT ACCOUNTING POLICIESThe accounting policies set out below have been applied consistently to all periods presented in the consolidated financial statements and have been applied consistently across the Group
(A) Basis of consolidation
(i) SubsidiariesSubsidiaries are entities controlled by the Bank Control exists when the Bank has the power directly or indirectly to govern the financial and operating policies of an entity so as to benefit from its activities In assessing control potential voting rights that presently are exercisable or convertible are taken into account The financial statements of subsidiaries are included in the consolidated financial statements from the date that control commences until the date that control ceases In the Bankrsquos financial statements investments in subsidiaries are carried at cost
(ii) SecuritisationThe Group conducts a loan securitisation program whereby mortgage loans are packaged and sold to the REDS RMBS Trusts The Group also securitises hire purchase chattel mortgages and finance leases which are packaged and sold to the REDS EHP Trusts Assets securitised to the Impala Trust are financed by the Bank through the BOQ Specialist channel and consist of medical finance equipment The Group acquired SMHL Trusts program as part of ME Bank acquisition on 1 July 2021
The GroupThe Group receives the residual income distributed by the REDS Impala and SMHL Trust (Trusts) after all payments due to investors and associated costs of the program have been met As a result the Group is considered to retain the risks and rewards of the Trusts and they do not meet the derecognition criteria of AASB 9
The Trusts fund their purchase of the loans by issuing floating-rate debt securities The securities are issued by the Trusts These are represented as borrowings of the Group however the Group does not stand behind the capital value or the performance of the securities or the assets of the Trusts The Group does not guarantee the payment of interest or the repayment of principal due on the securities The loans subject to the securitisation program have been pledged as security for the securities issued by the Trusts The Group is not obliged to support any losses that may be suffered by investors and does not intend to provide such support
The Bank provides the securitisation programs with armrsquos length services and facilities including the management and servicing of the leases securitised
The Bank has no right to repurchase any of the securitised assets and no obligation to do so other than in certain circumstances where there is a breach of warranty within 120 days of the sale or when certain criteria are met under the clean up provision per the Trust Deed Supplement
The transferred assets are equitably assigned to the Trusts The investors in the securities issued by the Trusts have full recourse to the assets transferred to the Trusts
Bank Interest rate risk from the Trusts is transferred back to the Bank by way of interest rate and basis swaps Accordingly under AASB 9 the original transfer of the mortgages from the Bank to the Trusts does not meet the derecognition criteria set out in AASB 9 The Bank continues to reflect the securitised loans in their entirety and also recognises a financial liability to the Trusts The interest payable on the intercompany financial asset liability represents the return on an imputed loan between the Bank and the Trusts and is based on the interest income under the mortgages the fees payable by the Trusts and the interest income or expense not separately recognised under the interest rate and basis swaps transactions between the Bank and the Trusts
All transactions between the Bank and the Trusts are eliminated on consolidation
(iii) Covered bond programThe Bank issues covered bonds for funding and liquidity purposes Certain housing loans have been assigned to a bankruptcy remote structured entity to provide security for all obligations payable on the covered bonds issued by the Bank Similar to the securitisation programs the Bank is entitled to any residual income after all payments due to covered bond investors have been met As the Bank retains substantially all of the risks and rewards associated with the housing loans the Bank continues to recognise the housing loans on Balance Sheet Investors have dual recourse to the Bank and the covered pool assets
(iv) Transactions eliminated on consolidationIntra-group balances and any unrealised gains and losses or income and expenses arising from intra-group transactions are eliminated in preparing the consolidated financial statements
Unrealised losses are eliminated in the same way as unrealised gains but only to the extent that there is no evidence of impairment
(B) Foreign currency
(i) Foreign currency transactionsTransactions in foreign currencies are initially translated at the foreign exchange rate ruling at the date of the transaction Subsequently at reporting date monetary assets and liabilities denominated in foreign currencies are translated into Australian dollars at the foreign exchange rate ruling at that date Non-monetary items in a foreign currency that are measured at historical cost remain translated using the original exchange rate at the date of the transaction Foreign exchange differences arising on translation are recognised in profit or loss Where a foreign currency transaction is part of a hedge relationship it is accounted for as above subject to the hedge accounting rules set out in Note 38
(ii) Foreign operationsThe Group carries out its foreign operations in New Zealand through the wholly controlled subsidiary BOQ Finance (NZ) Limited and through the non-incorporated branch of BOQ Equipment Finance Limited
1812021 Annual Report
For the year ended 31 August 2021NOTES TO THE FINANCIAL STATEMENTS
Financial Statements 108 | Signed Reports 183 | Shareholding Details 195 | Glossary 201
59 SIGNIFICANT ACCOUNTING POLICIES (CONTINUED)(C) Operating leases Operating leases in which the Group is the lessor are measured at cost less accumulated depreciation and accumulated impairment losses Depreciation is calculated to write off the cost of operating lease assets less their estimated residual values using the straight-line basis over the term of the lease This is generally recognised in profit or loss Depreciation methods and residual values are reviewed at each reporting date and adjusted if appropriate
(D) Goods and services taxRevenues expenses and assets are recognised net of the amount of goods and services tax (GST) except where the amount of GST incurred is not recoverable from the Australian Taxation Office (ATO) In these circumstances the GST is recognised as part of the cost of acquisition of the asset or as part of the expense
Receivables and payables are stated with the amount of GST included
The net amount of GST recoverable from or payable to the ATO is included as a current asset or current liability in the Balance Sheet
Cash flows are included in the Statements of Cash Flows on a gross basis The GST components of cash flows arising from investing and financing activities which are recoverable from or payable to the ATO are classified as operating cash flows
(E) Property plant and equipment
(i) Recognition and initial measurement Items of property plant and equipment are measured at cost on recognition
(ii) Subsequent costs Subsequent additional costs are only capitalised when it is probable that future economic benefits in excess of the originally assessed performance of the assets will flow to the Group in future years Where these costs represent separate components they are accounted for as separate assets and are separately depreciated over their useful lives Costs that do not meet the criteria for subsequent capitalisation are expensed as incurred
(iii) Subsequent measurement The Group has elected to use the cost model to measure property plant and equipment after recognition The carrying value is the initial cost less accumulated depreciation and any accumulated impairment losses
(iv) DepreciationDepreciation is charged to the profit or loss in the Income Statement on a straight-line basis over the estimated useful lives of each part of an item of property plant and equipment
The estimated useful lives are as follows
Years
IT equipment 3 - 10
Plant furniture and equipment 3 - 20
Leasehold improvements (1) 6 - 12
(1) Or term of lease if less
The useful lives are reassessed annually
(F) Impairment of non-financial assets Non-financial assets other than deferred tax assets are reviewed for impairment whenever events or changes in circumstances indicate that the carrying amount may not be recoverable For goodwill and intangible assets with an indefinite life the recoverable amount is estimated at the same time each year
The Bank conducts an annual internal review of non-financial asset values to assess for any indicators of impairment If any indication of impairment exists an estimate of the assetrsquos recoverable amount is calculated
For the purposes of assessing impairment assets are grouped at the lowest levels for which there are separately identifiable cash inflows that are largely independent of the cash inflows from other assets or groups of assets ndash a CGU
An impairment loss is recognised in profit or loss in the Income Statement for the amount by which the assetrsquos carrying amount exceeds its recoverable amount The recoverable amount of an asset or CGU is the greater of its value in use and its fair value less costs to sell Value in use is based on the estimated future cash flows discounted to their present value using a pre-tax discount rate that reflects current market assessments of the time value of money and the risks specific to the asset or CGU Impairment losses recognised in respect of CGUs are allocated first to reduce the carrying amount of goodwill allocated to the units and then to reduce the carrying amounts of the other assets in the unit on a pro-rata basis
This grouping is subject to an operating segment ceiling test Non-financial assets other than goodwill that suffered impairment are tested for possible reversal of the impairment whenever events or changes in circumstances indicate that the impairment may have reversed An impairment loss in respect of goodwill is not reversed
(i) Calculation of recoverable amountThe recoverable amount of a non-financial asset or CGU is the greater of its fair value less costs to sell and value in use In assessing value in use the estimated future cash flows are discounted to their present value using a pre-tax discount rate that reflects current market assessments of the time value of money and the risks specific to the asset
182 Bank of Queensland Limited and its Controlled Entities
For the year ended 31 August 2021NOTES TO THE FINANCIAL STATEMENTS
Financial Statements 108 | Signed Reports 183 | Shareholding Details 195 | Glossary 201
1 In the opinion of the Directors of Bank of Queensland Limited
(a) the consolidated financial statements and notes and the remuneration report included within the Directorsrsquo Report set out on pages 76 to 182 are in accordance with the Corporations Act 2001 (Cth) including
(i) giving a true and fair view of the financial position of the Bank and Group as at 31 August 2021 and of their performance for the year ended on that date and
(ii) complying with Australian Accounting Standards and the Corporations Regulations 2001 and
(b) there are reasonable grounds to believe that the Bank and Group will be able to pay its debts as and when they become due and payable
2 The Directors have been given the declarations required by section 295A of the Corporations Act 2001 (Cth) from the Managing Director amp CEO and Chief Financial Officer for the financial year ended 31 August 2021
3 The Directors draw attention to section 12 (A) to the financial statements which includes a statement of compliance with International Financial Reporting Standards
Signed in accordance with a resolution of the Directors
DIRECTORSrsquo DECLARATION
George Frazis Managing Director amp CEO 12 October 2021
Patrick Allaway Chairman 12 October 2021
1832021 Annual Report
Financial Statements 108 | Signed Reports 183 | Shareholding Details 195 | Glossary 201
184
KPMG an Australian partnership and a member firm of the KPMG global organisation of independent member firms affiliated with KPMG International Limited a private English company limited by guarantee All rights reserved The KPMG name and logo are trademarks used under license by the independent member firms of the KPMG global organisation Liability limited by a scheme approved under Professional Standards Legislation
Independent Auditorrsquos Report
To the shareholders of Bank of Queensland Limited
Report on the audits of the Financial Reports
Opinions
We have audited the consolidated Financial Report of Bank of Queensland Limited (the Consolidated Entity Financial Report) We have also audited the Financial Report of Bank of Queensland Limited (the Bank Financial Report)
In our opinion each of the accompanying Consolidated Entity Financial Report and Bank Financial Report are in accordance with the Corporations Act 2001 including
bull giving a true and fair view of the Consolidated Entityrsquos and of the Bankrsquos financial position as at 31 August 2021 and of its financial performance for the year ended on that date and
bull complying with Australian Accounting Standards and the Corporations Regulations 2001
The respective Financial Reports of the Consolidated Entity and Bank comprise
bull Balance Sheets as at 31 August 2021
bull Income Statements Statements of Comprehensive Income Statements of Changes in Equity and Statements of Cash Flows for the year then ended
bull Notes including a summary of significant accounting policies and
bull Directorsrsquo Declaration
The Consolidated Entity consists of the Bank of Queensland Limited (the Bank) and the entities it controlled at the year-end or from time to time during the financial year
Basis for opinions
We conducted our audits in accordance with Australian Auditing Standards We believe that the audit evidence we have obtained is sufficient and appropriate to provide a basis for our opinions
Our responsibilities under those standards are further described in the Auditorrsquos responsibilities for the audits of the Financial Reports section of our report
We are independent of the Consolidated Entity and Bank in accordance with the Corporations Act 2001 and the ethical requirements of the Accounting Professional and Ethical Standards Boardrsquos APES 110 Code of Ethics for Professional Accountants (the Code) that are relevant to our audits of the Financial Reports in Australia We have fulfilled our other ethical responsibilities in accordance with the Code
184
KPMG an Australian partnership and a member firm of the KPMG global organisation of independent member firms affiliated with KPMG International Limited a private English company limited by guarantee All rights reserved The KPMG name and logo are trademarks used under license by the independent member firms of the KPMG global organisation Liability limited by a scheme approved under Professional Standards Legislation
Independent Auditorrsquos Report
To the shareholders of Bank of Queensland Limited
Report on the audits of the Financial Reports
Opinions
We have audited the consolidated Financial Report of Bank of Queensland Limited (the Consolidated Entity Financial Report) We have also audited the Financial Report of Bank of Queensland Limited (the Bank Financial Report)
In our opinion each of the accompanying Consolidated Entity Financial Report and Bank Financial Report are in accordance with the Corporations Act 2001 including
bull giving a true and fair view of the Consolidated Entityrsquos and of the Bankrsquos financial position as at 31 August 2021 and of its financial performance for the year ended on that date and
bull complying with Australian Accounting Standards and the Corporations Regulations 2001
The respective Financial Reports of the Consolidated Entity and Bank comprise
bull Balance Sheets as at 31 August 2021
bull Income Statements Statements of Comprehensive Income Statements of Changes in Equity and Statements of Cash Flows for the year then ended
bull Notes including a summary of significant accounting policies and
bull Directorsrsquo Declaration
The Consolidated Entity consists of the Bank of Queensland Limited (the Bank) and the entities it controlled at the year-end or from time to time during the financial year
Basis for opinions
We conducted our audits in accordance with Australian Auditing Standards We believe that the audit evidence we have obtained is sufficient and appropriate to provide a basis for our opinions
Our responsibilities under those standards are further described in the Auditorrsquos responsibilities for the audits of the Financial Reports section of our report
We are independent of the Consolidated Entity and Bank in accordance with the Corporations Act 2001 and the ethical requirements of the Accounting Professional and Ethical Standards Boardrsquos APES 110 Code of Ethics for Professional Accountants (the Code) that are relevant to our audits of the Financial Reports in Australia We have fulfilled our other ethical responsibilities in accordance with the Code
184 Bank of Queensland Limited and its Controlled Entities
INDEPENDENT AUDITORrsquoS REPORT
184
KPMG an Australian partnership and a member firm of the KPMG global organisation of independent member firms affiliated with KPMG International Limited a private English company limited by guarantee All rights reserved The KPMG name and logo are trademarks used under license by the independent member firms of the KPMG global organisation Liability limited by a scheme approved under Professional Standards Legislation
Independent Auditorrsquos Report
To the shareholders of Bank of Queensland Limited
Report on the audits of the Financial Reports
Opinions
We have audited the consolidated Financial Report of Bank of Queensland Limited (the Consolidated Entity Financial Report) We have also audited the Financial Report of Bank of Queensland Limited (the Bank Financial Report)
In our opinion each of the accompanying Consolidated Entity Financial Report and Bank Financial Report are in accordance with the Corporations Act 2001 including
bull giving a true and fair view of the Consolidated Entityrsquos and of the Bankrsquos financial position as at 31 August 2021 and of its financial performance for the year ended on that date and
bull complying with Australian Accounting Standards and the Corporations Regulations 2001
The respective Financial Reports of the Consolidated Entity and Bank comprise
bull Balance Sheets as at 31 August 2021
bull Income Statements Statements of Comprehensive Income Statements of Changes in Equity and Statements of Cash Flows for the year then ended
bull Notes including a summary of significant accounting policies and
bull Directorsrsquo Declaration
The Consolidated Entity consists of the Bank of Queensland Limited (the Bank) and the entities it controlled at the year-end or from time to time during the financial year
Basis for opinions
We conducted our audits in accordance with Australian Auditing Standards We believe that the audit evidence we have obtained is sufficient and appropriate to provide a basis for our opinions
Our responsibilities under those standards are further described in the Auditorrsquos responsibilities for the audits of the Financial Reports section of our report
We are independent of the Consolidated Entity and Bank in accordance with the Corporations Act 2001 and the ethical requirements of the Accounting Professional and Ethical Standards Boardrsquos APES 110 Code of Ethics for Professional Accountants (the Code) that are relevant to our audits of the Financial Reports in Australia We have fulfilled our other ethical responsibilities in accordance with the Code
185
Key Audit Matters
The Key Audit Matters we identified for the Consolidated Entity and Bank are
bull Expected Credit Loss (ECL) for loans and advances at amortised cost
bull Valuation of goodwill
bull Valuation of intangible computer software
bull Valuation of financial instruments at fair value
bull Information technology (IT) systems controls
bull Acquisition of ME Bank
Key Audit Matters are those matters that in our professional judgement were of most significance in our audits of the Financial Reports of the current period
These matters were addressed in the context of our audits of the Financial Reports as a whole and in forming our opinions thereon and we do not provide a separate opinion on these matters
Expected credit loss (ECL) for loans and advances at amortised cost- Consolidated Entity and Bank
Refer to Note 33 to the Financial Reports
The key audit matter How the matter was addressed in our audits
ECL (collective provision for impairment) for loans and advances at amortised cost is a key audit matter due to the significance of loans and advances balances and judgement applied by the Consolidated Entity and Bank in determining the ECL and the resulting judgement required by us in challenging these estimates
The Consolidated Entity and Bank has exercised judgement in developing ECL models incorporating forward-looking information to reflect current and future economic scenarios including the potential economic impact of the COVID-19 pandemic and in determining assumptions such as defining a significant increase in credit risk (SICR)
The Consolidated Entity and Bank measure ECLs on a forward-looking basis reflecting a range of future economic conditions including key forward-looking macroeconomic assumptions such as forecast Real-Gross Domestic Product (GDP) residential and commercial property price index and unemployment rates Given the COVID-19 pandemic and associated economic uncertainty significant judgement was exercised by the Consolidated Entity and Bank with developing the forward -looking macroeconomic assumptions and in the multiple forward-looking
Our procedures for ECL (collective pprroovviissiioonn ffoorr iimmppaaiirrmmeenntt) included
bull Understanding the key controls on the Consolidated Entityrsquos and Bankrsquos estimate of the ECL including
minus review and approval by Management of key forward-looking macroeconomic assumptions used in the model
minus review and approval by Management of key data elements used in the ECL models
minus monitoring mechanisms to identify loans with a SICR or default event and
minus review and approval mechanisms in place to assess the ECL output and out of model adjustments
With the assistance of our credit risk specialists our further procedures included
bull Assessing the appropriateness of the Consolidated Entityrsquos and Bankrsquos provisioning methodology against the requirements of the accounting standards and industry practice including estimates of default on both a 12 month and lifetime basis
bull Testing the completeness and accuracy of relevant data elements used within ECL
184
KPMG an Australian partnership and a member firm of the KPMG global organisation of independent member firms affiliated with KPMG International Limited a private English company limited by guarantee All rights reserved The KPMG name and logo are trademarks used under license by the independent member firms of the KPMG global organisation Liability limited by a scheme approved under Professional Standards Legislation
Independent Auditorrsquos Report
To the shareholders of Bank of Queensland Limited
Report on the audits of the Financial Reports
Opinions
We have audited the consolidated Financial Report of Bank of Queensland Limited (the Consolidated Entity Financial Report) We have also audited the Financial Report of Bank of Queensland Limited (the Bank Financial Report)
In our opinion each of the accompanying Consolidated Entity Financial Report and Bank Financial Report are in accordance with the Corporations Act 2001 including
bull giving a true and fair view of the Consolidated Entityrsquos and of the Bankrsquos financial position as at 31 August 2021 and of its financial performance for the year ended on that date and
bull complying with Australian Accounting Standards and the Corporations Regulations 2001
The respective Financial Reports of the Consolidated Entity and Bank comprise
bull Balance Sheets as at 31 August 2021
bull Income Statements Statements of Comprehensive Income Statements of Changes in Equity and Statements of Cash Flows for the year then ended
bull Notes including a summary of significant accounting policies and
bull Directorsrsquo Declaration
The Consolidated Entity consists of the Bank of Queensland Limited (the Bank) and the entities it controlled at the year-end or from time to time during the financial year
Basis for opinions
We conducted our audits in accordance with Australian Auditing Standards We believe that the audit evidence we have obtained is sufficient and appropriate to provide a basis for our opinions
Our responsibilities under those standards are further described in the Auditorrsquos responsibilities for the audits of the Financial Reports section of our report
We are independent of the Consolidated Entity and Bank in accordance with the Corporations Act 2001 and the ethical requirements of the Accounting Professional and Ethical Standards Boardrsquos APES 110 Code of Ethics for Professional Accountants (the Code) that are relevant to our audits of the Financial Reports in Australia We have fulfilled our other ethical responsibilities in accordance with the Code
1852021 Annual Report
INDEPENDENT AUDITORrsquoS REPORT
186
economic scenarios and probability weighting determined for each of these scenarios
This estimation is inherently challenging and uses complex models based on the Consolidated Entityrsquos and Bankrsquos ability to predict probability of default and loss given default The ECL staging requirements in the models incorporate estimates of default on both a 12 month and lifetime basis
Significant judgement is applied by the Consolidated Entity and Bank in determining the nature and level of out of model adjustments It is the Consolidated Entityrsquos and Bankrsquos policy to use out of model adjustments where the underlying models may not represent emerging risks or trends in the loan portfolios
We applied significant judgement to assess the impact of the forward-looking macroeconomic assumptions and economic scenarios used and the judgemental out of model adjustments applied to the ECL models
For creditndashimpaired loans it is the Consolidated Entityrsquos and Bankrsquos policy to determine specific provision for impairment in addition to the collective provision based on their judgement This focuses on estimating when an impairment event has occurred and the present value of expected future cash flows which have high estimation uncertainty We focused on the high degree of estimation uncertainty related to the business loans as the forecast cash flows are dependent on future and uncertain events for example the timing and proceeds from the future sale of collateral
models for a sample of customers such as checking year end balances to the general ledger and repayment history and risk ratings to source systems
bull Re-performing the ECL calculation for loan portfolios using the Consolidated Entityrsquos and Bankrsquos provisioning methodology and relevant data used within the ECL models as tested above and which incorporated consideration of the impacts of COVID-19 We compared our results to the amount recorded by the Consolidated Entity and Bank
bull Determining key assumptions within the ECL models including SICR and assessed the Consolidated Entityrsquos and Bankrsquos analysis over these assumptions including whether the methodology used in developing the assumption was appropriate and in line with accounting standards requirements
bull Challenged the Consolidated Entityrsquos and Bankrsquos forward-looking information and economic scenarios and their associated probability weighting We compared the Consolidated Entityrsquos and Bankrsquos forecast GDP residential and commercial property price index and unemployment rates to relevant publicly available macro-economic information and the sensitivity of the ECL to changes in such assumptions We focused on ensuring that these key assumptions reflected the impacts of COVID-19
bull Assessing the out of model adjustments applied by the Consolidated Entity and Bank to the ECL estimates We compared the loan portfoliosrsquo underlying performance and characteristics to current market conditions emerging risks and trends using our knowledge of the industry and public views of commentators
Our procedures for specific provision for impairment for credit-impaired loans included
bull Testing key credit risk monitoring controls including controls for loan risk ratings annual assessments of loans and security valuations
bull Performing credit assessment on a sample of loans and advances including business loans for which specific impairment provisions are held with particular focus on the impact of COVID-19 on high-risk industries This included
minus Challenging the Consolidated Entityrsquos and
186 Bank of Queensland Limited and its Controlled Entities
INDEPENDENT AUDITORrsquoS REPORT
186
economic scenarios and probability weighting determined for each of these scenarios
This estimation is inherently challenging and uses complex models based on the Consolidated Entityrsquos and Bankrsquos ability to predict probability of default and loss given default The ECL staging requirements in the models incorporate estimates of default on both a 12 month and lifetime basis
Significant judgement is applied by the Consolidated Entity and Bank in determining the nature and level of out of model adjustments It is the Consolidated Entityrsquos and Bankrsquos policy to use out of model adjustments where the underlying models may not represent emerging risks or trends in the loan portfolios
We applied significant judgement to assess the impact of the forward-looking macroeconomic assumptions and economic scenarios used and the judgemental out of model adjustments applied to the ECL models
For creditndashimpaired loans it is the Consolidated Entityrsquos and Bankrsquos policy to determine specific provision for impairment in addition to the collective provision based on their judgement This focuses on estimating when an impairment event has occurred and the present value of expected future cash flows which have high estimation uncertainty We focused on the high degree of estimation uncertainty related to the business loans as the forecast cash flows are dependent on future and uncertain events for example the timing and proceeds from the future sale of collateral
models for a sample of customers such as checking year end balances to the general ledger and repayment history and risk ratings to source systems
bull Re-performing the ECL calculation for loan portfolios using the Consolidated Entityrsquos and Bankrsquos provisioning methodology and relevant data used within the ECL models as tested above and which incorporated consideration of the impacts of COVID-19 We compared our results to the amount recorded by the Consolidated Entity and Bank
bull Determining key assumptions within the ECL models including SICR and assessed the Consolidated Entityrsquos and Bankrsquos analysis over these assumptions including whether the methodology used in developing the assumption was appropriate and in line with accounting standards requirements
bull Challenged the Consolidated Entityrsquos and Bankrsquos forward-looking information and economic scenarios and their associated probability weighting We compared the Consolidated Entityrsquos and Bankrsquos forecast GDP residential and commercial property price index and unemployment rates to relevant publicly available macro-economic information and the sensitivity of the ECL to changes in such assumptions We focused on ensuring that these key assumptions reflected the impacts of COVID-19
bull Assessing the out of model adjustments applied by the Consolidated Entity and Bank to the ECL estimates We compared the loan portfoliosrsquo underlying performance and characteristics to current market conditions emerging risks and trends using our knowledge of the industry and public views of commentators
Our procedures for specific provision for impairment for credit-impaired loans included
bull Testing key credit risk monitoring controls including controls for loan risk ratings annual assessments of loans and security valuations
bull Performing credit assessment on a sample of loans and advances including business loans for which specific impairment provisions are held with particular focus on the impact of COVID-19 on high-risk industries This included
minus Challenging the Consolidated Entityrsquos and
187
Bankrsquos risk grading of the loans
minus Considering the latest developments in relation to the borrower by inspecting the Consolidated Entityrsquos and Bankrsquos latest loan strategy papers for evidence of occurrence of impairment events and inquiries with Management
minus Examining the forecasts of future cash flows prepared by the Consolidated Entity and Bank including key assumptions and consideration of COVID-19 impacts in relation to the amount and timing of recoveries
bull Checking the collateral valuation and other sources of repayment underlying the Consolidated Entityrsquos and Bankrsquos determination of the impairment to external evidence where available including the Consolidated Entityrsquos and Bankrsquos external valuation expert reports
bull Checking the consistency of methods applied by the Consolidated Entity and Bank in estimating the expected future cash flows including timing from the estimated sale proceeds from the collateral in calculating the recoveries
bull Assessing the appropriateness of the Consolidated Entityrsquos and Bankrsquos disclosures in the financial reports using our understanding obtained from our testing against the requirements of the accounting standards
Valuation of goodwill ndash Consolidated Entity and Bank
Refer to Note 41 to the Financial Reports
The key audit matter How the matter was addressed in our audits
The assessment of the valuation of goodwill is considered a key audit matter due to the significant forward-looking assumptions used in the Consolidated Entityrsquos and Bankrsquos value-in-use (VIU) model
We focused on the significant forward-looking assumptions applied in the VIU model including
bull Forecast operating cash flows forecast growth rates and the terminal growth rates These conditions increase the inherent
Our procedures included
bull Considering the appropriateness of the VIU method applied by the Consolidated Entity and Bank to perform the annual test of goodwill for impairment against the requirements of the accounting standards
bull Assessing the integrity of the VIU model used including the accuracy of the underlying calculations
bull Assessing the historical accuracy of the Consolidated Entityrsquos and Bankrsquos forecast
1872021 Annual Report
INDEPENDENT AUDITORrsquoS REPORT
188
uncertainty of the forecasts the probability of a wider range of possible outcomes and the possibility of goodwill being impaired and
bull Discount rate ndash this is judgemental in nature and varies according to the specific conditions and environment of the relevant cash-generating unit (CGU)
We involved valuation specialists to supplement our senior audit team members in assessing this key audit matter
operating cash flows by comparing to actual past performance to inform our evaluation of forecasts incorporated in the VIU model
bull Challenging the key forecast cash flow assumptions used in the VIU model considering the known and anticipated COVID-19 impacts using our knowledge of the Consolidated Entity and Bank their past performance and our inquiries with Management We also checked the consistency of the key assumptions used in the VIU model to the Consolidated Entityrsquos and Bankrsquos Board approved cash flow forecasts
bull Using our industry knowledge and published studies of industry trends and expectations assessing the Consolidated Entityrsquos and Bankrsquos key assumptions specifically growth rates and terminal growth rates for indicators of bias and inconsistent application
bull Working with our valuation specialists using our knowledge of the Consolidated Entity and Bank and its industry to independently develop a discount rate range considered comparable using publicly available market data for comparable entities adjusted by risk factors specific to the Consolidated Entity and the industry it operates in
bull Performing sensitivity analysis by varying key assumptions in particular discount rates forecast growth rates and terminal growth rates within a reasonably possible range We did this to identify those CGUs at higher risk of impairment and those assumptions at a higher risk of bias or inconsistency in application and to focus our further procedures
bull Assessing the disclosures in the financial report using our understanding of the information obtained from our testing and against the requirements of the accounting standards We focussed on the adequacy of the disclosures where a reasonably possible change in key assumptions could cause the carrying amount of a CGU to exceed its recoverable amount to assess whether additional disclosures may be required
188 Bank of Queensland Limited and its Controlled Entities
INDEPENDENT AUDITORrsquoS REPORT
188
uncertainty of the forecasts the probability of a wider range of possible outcomes and the possibility of goodwill being impaired and
bull Discount rate ndash this is judgemental in nature and varies according to the specific conditions and environment of the relevant cash-generating unit (CGU)
We involved valuation specialists to supplement our senior audit team members in assessing this key audit matter
operating cash flows by comparing to actual past performance to inform our evaluation of forecasts incorporated in the VIU model
bull Challenging the key forecast cash flow assumptions used in the VIU model considering the known and anticipated COVID-19 impacts using our knowledge of the Consolidated Entity and Bank their past performance and our inquiries with Management We also checked the consistency of the key assumptions used in the VIU model to the Consolidated Entityrsquos and Bankrsquos Board approved cash flow forecasts
bull Using our industry knowledge and published studies of industry trends and expectations assessing the Consolidated Entityrsquos and Bankrsquos key assumptions specifically growth rates and terminal growth rates for indicators of bias and inconsistent application
bull Working with our valuation specialists using our knowledge of the Consolidated Entity and Bank and its industry to independently develop a discount rate range considered comparable using publicly available market data for comparable entities adjusted by risk factors specific to the Consolidated Entity and the industry it operates in
bull Performing sensitivity analysis by varying key assumptions in particular discount rates forecast growth rates and terminal growth rates within a reasonably possible range We did this to identify those CGUs at higher risk of impairment and those assumptions at a higher risk of bias or inconsistency in application and to focus our further procedures
bull Assessing the disclosures in the financial report using our understanding of the information obtained from our testing and against the requirements of the accounting standards We focussed on the adequacy of the disclosures where a reasonably possible change in key assumptions could cause the carrying amount of a CGU to exceed its recoverable amount to assess whether additional disclosures may be required
189
Valuation of intangible computer softwarendash Consolidated Entity and Bank
Refer to Note 41 to the Financial Reports
The key audit matter How the matter was addressed in our audits
The assessment of the valuation of intangible computer software is considered a key audit matter due to the significant
bull amount of costs capitalised during the year
bull judgement applied by us to assess the Consolidated Entityrsquos and Bankrsquos determination of
minus capitalised costs ndash the nature and amount of costs to be capitalised in accordance with the requirements of the accounting standards This can be inherently subjective for internally generated computer software projects
minus expected useful life ndash on completion of internally generated computer software the accounting standards require the Consolidated Entity and Bank to estimate the useful life of the computer software and amortise the asset over this period This assessment is based on the intended use of the asset This can be judgemental and dependent upon future events including advances in technology thereby increasing the complexity in estimating useful life
We also focused on the analysis of impairment indicators performed by the Consolidated Entity and Bank
Our procedures included
bull Evaluating the Consolidated Entityrsquos and Bankrsquos intangible computer software capitalisation policy and its application during the year against the capitalisation criteria and guidance in the relevant accounting standards
bull For a sample of internally generated computer software projects currently under development challenging the Consolidated Entityrsquos and Bankrsquos application of the capitalisation policy Specifically we challenged
minus the nature of project costs capitalised by testing a sample of capitalised costs to the project scope of work and underlying invoices and timesheets as well as inquiries with Management and
minus the Consolidated Entityrsquos and Bankrsquos assessment of projects not yet classified as lsquoready for-usersquo for indicators of being in use such as checking the phase of implementation with Project Managers and hence being subject to amortisation
bull For a sample of internally generated computer software classified as lsquoin-usersquo challenging the Consolidated Entityrsquos and Bankrsquos estimated period of economic benefit from the use of the software compared to the original project plan
bull Considering the Consolidated Entityrsquos and Bankrsquos assessment of intangible computer software impairment indicators by using our knowledge of the Consolidated Entity and Bankrsquos broader technology roadmap results of our testing and inquiring with Project Managers
bull Assessing the adequacy of the disclosures associated with impairment testing of intangible computer software in the financial report
1892021 Annual Report
INDEPENDENT AUDITORrsquoS REPORT
190
Valuation of financial instruments at fair value ndash Consolidated Entity and Bank
Refer to Note 37 to the Financial Reports
The key audit matter How the matter was addressed in our audits
The valuation of financial instruments measured at fair value is considered a key audit matter as determining the fair value of financial instruments involves a significant level of judgement by the Consolidated Entity and Bank The level of judgement increases where key inputs to the valuation are not readily available in the market and require additional judgement This increases the risk of error and adds complexity to our audit
We involved valuation specialists to supplement our senior audit team members in assessing this key audit matter
Working with our valuation specialists our procedures included
bull Checking the Consolidated Entityrsquos and the Bankrsquos valuation of a sample of financial instruments (asset and liabilities) by comparing the observable inputs including quoted prices to independently sourced market data
bull Using independent models reperforming the valuation for a sample of derivative assets and liabilities where fair value was determined using observable inputs This included comparing a sample of observable inputs in the Consolidated Entityrsquos and Bankrsquos valuations to independently sourced market data such as interest rates foreign exchange rates and volatilities
bull Where the fair value of derivatives and other financial assets were determined using unobservable inputs (lsquolevel 3rsquo instruments) challenging the Consolidated Entityrsquos and Bankrsquos valuation by testing the key inputs used to comparable data in the market including the use of proxy instruments and available alternatives We also checked the Consolidated Entityrsquos and Bankrsquos valuation methodology to industry practice and the criteria in the accounting standards
bull Assessing the appropriateness of the Consolidated Entityrsquos and Bankrsquos disclosures in the financial reports using our understanding obtained from our testing against the requirements of the accounting standards
190 Bank of Queensland Limited and its Controlled Entities
INDEPENDENT AUDITORrsquoS REPORT
190
Valuation of financial instruments at fair value ndash Consolidated Entity and Bank
Refer to Note 37 to the Financial Reports
The key audit matter How the matter was addressed in our audits
The valuation of financial instruments measured at fair value is considered a key audit matter as determining the fair value of financial instruments involves a significant level of judgement by the Consolidated Entity and Bank The level of judgement increases where key inputs to the valuation are not readily available in the market and require additional judgement This increases the risk of error and adds complexity to our audit
We involved valuation specialists to supplement our senior audit team members in assessing this key audit matter
Working with our valuation specialists our procedures included
bull Checking the Consolidated Entityrsquos and the Bankrsquos valuation of a sample of financial instruments (asset and liabilities) by comparing the observable inputs including quoted prices to independently sourced market data
bull Using independent models reperforming the valuation for a sample of derivative assets and liabilities where fair value was determined using observable inputs This included comparing a sample of observable inputs in the Consolidated Entityrsquos and Bankrsquos valuations to independently sourced market data such as interest rates foreign exchange rates and volatilities
bull Where the fair value of derivatives and other financial assets were determined using unobservable inputs (lsquolevel 3rsquo instruments) challenging the Consolidated Entityrsquos and Bankrsquos valuation by testing the key inputs used to comparable data in the market including the use of proxy instruments and available alternatives We also checked the Consolidated Entityrsquos and Bankrsquos valuation methodology to industry practice and the criteria in the accounting standards
bull Assessing the appropriateness of the Consolidated Entityrsquos and Bankrsquos disclosures in the financial reports using our understanding obtained from our testing against the requirements of the accounting standards
191
Information Technology (IT) systems and controls ndash Consolidated Entity and Bank
Refer to Basis of Preparation in Note 1 to the Financial Reports
The key audit matter How the matter was addressed in our audits
The Consolidated Entityrsquos and Bankrsquos business utilises a number of complex interdependent Information Technology (IT) systems to process and record a high volume of transactions Controls over user access change management program development and other operational controls in IT systems are critical to the recording of financial information and the preparation of financial reports The IT systems and controls as they impact the financial recording and reporting of transactions is a key audit matter and significantly affect our audit approach
Our IT specialists were used throughout the engagement as a core part of our audit team
We tested the general controls over key IT applications (systems) used in processing significant transactions and recording balances in the general ledger We also tested automated controls embedded within these systems Working with our IT specialists our procedures included
bull Testing the governance controls used by the Consolidated Entityrsquos and Bankrsquos IT team to monitor system integrity by checking matters impacting the operational integrity of core systems for escalation and action in accordance with the Consolidated Entityrsquos and Bankrsquos policies
bull Testing the access rights (including privileged users) given to staff by checking them to approved records and inspecting the reports for granting and removal of access rights
bull Testing preventative controls designed to enforce segregation of duties between users within particular IT systems
bull Testing the change management controls related to code development and workflows approval
bull Testing the automated controls principally relating to the automated calculation of certain transactions and the generation of certain reports For a sample of automated calculations we tested the inputs used within the calculations to source data and also tested the accuracy of the calculations
1912021 Annual Report
INDEPENDENT AUDITORrsquoS REPORT
192
Acquisition of ME Bank ndash Consolidated Entity and Bank
Refer to Note 55 (c) to the Financial Reports
The key audit matter How the matter was addressed in our audits
On 1 July 2021 the Bank acquired 100 of ME Bank for a total consideration of $1388 billion The purchase price accounting was provisional at the date of authorisation of the financial report
The accounting for this business combination is a key audit matter due to the
bull Size of the acquisition having a significant impact on the Consolidated Entityrsquos and Bankrsquos financial report and
bull Judgement and complexity relating to the Consolidated Entityrsquos and Bankrsquos determination of the provisional fair value of assets and liabilities acquired in the acquisition requiring significant audit effort These included customer relationships and brand name which are inherently judgemental driving additional audit effort specifically on the key assumptions and methodology used in the valuation of these intangible assets The key assumptions we focussed on in the valuation of intangible assets included forecast earnings discount rates and useful lives
The Consolidated Entity and Bank engaged an external valuation expert to assess the fair value of acquired intangibles such as customer relationships and brand name
We involved corporate finance specialists to supplement our senior audit team members in assessing this key audit matter
Working with our corporate finance specialists our procedures included
bull We evaluated the acquisition accounting by the Consolidated Entity and Bank against the requirements of the accounting standards
bull We read the underlying transaction agreement to understand the terms of the acquisition and nature of the assets and liabilities acquired
bull Considered the scope objectivity and competence of the external valuation expert engaged by the Consolidated Entity and Bank
bull We evaluated the valuation methodology used by the Consolidated Entity and Bank to determine the fair value of assets and liabilities acquired against accounting standard requirements and observed industry practices
bull Examined and assessed the key assumptions in the Consolidated Entityrsquos and Bankrsquos external valuation expert report prepared in relation to the identification and valuation of intangible assets including
1 assessing the useful life of the brand name and customer relationships by using our industry experience and against the accounting standard requirements
2 comparing forecast earnings assumptions to growth rates from comparable company broker estimates and industry growth rates and
3 evaluating the discount rate adopted having regard to the Internal Rate of Return of the acquisition
bull Compared the provisional fair values of the acquired assets and liabilities recognised by the Consolidated Entity and Bank to the audited financial statements of ME Bank and external valuation expert report
bull We recalculated the goodwill balance recognised as a result of the acquisition and compared it to the goodwill amount recorded
192 Bank of Queensland Limited and its Controlled Entities
INDEPENDENT AUDITORrsquoS REPORT
192
Acquisition of ME Bank ndash Consolidated Entity and Bank
Refer to Note 55 (c) to the Financial Reports
The key audit matter How the matter was addressed in our audits
On 1 July 2021 the Bank acquired 100 of ME Bank for a total consideration of $1388 billion The purchase price accounting was provisional at the date of authorisation of the financial report
The accounting for this business combination is a key audit matter due to the
bull Size of the acquisition having a significant impact on the Consolidated Entityrsquos and Bankrsquos financial report and
bull Judgement and complexity relating to the Consolidated Entityrsquos and Bankrsquos determination of the provisional fair value of assets and liabilities acquired in the acquisition requiring significant audit effort These included customer relationships and brand name which are inherently judgemental driving additional audit effort specifically on the key assumptions and methodology used in the valuation of these intangible assets The key assumptions we focussed on in the valuation of intangible assets included forecast earnings discount rates and useful lives
The Consolidated Entity and Bank engaged an external valuation expert to assess the fair value of acquired intangibles such as customer relationships and brand name
We involved corporate finance specialists to supplement our senior audit team members in assessing this key audit matter
Working with our corporate finance specialists our procedures included
bull We evaluated the acquisition accounting by the Consolidated Entity and Bank against the requirements of the accounting standards
bull We read the underlying transaction agreement to understand the terms of the acquisition and nature of the assets and liabilities acquired
bull Considered the scope objectivity and competence of the external valuation expert engaged by the Consolidated Entity and Bank
bull We evaluated the valuation methodology used by the Consolidated Entity and Bank to determine the fair value of assets and liabilities acquired against accounting standard requirements and observed industry practices
bull Examined and assessed the key assumptions in the Consolidated Entityrsquos and Bankrsquos external valuation expert report prepared in relation to the identification and valuation of intangible assets including
1 assessing the useful life of the brand name and customer relationships by using our industry experience and against the accounting standard requirements
2 comparing forecast earnings assumptions to growth rates from comparable company broker estimates and industry growth rates and
3 evaluating the discount rate adopted having regard to the Internal Rate of Return of the acquisition
bull Compared the provisional fair values of the acquired assets and liabilities recognised by the Consolidated Entity and Bank to the audited financial statements of ME Bank and external valuation expert report
bull We recalculated the goodwill balance recognised as a result of the acquisition and compared it to the goodwill amount recorded
193
by the Consolidated Entity and Bank
bull Assessed the adequacy of the disclosures in the financial report using our understanding obtained from our testing and against the requirements of the accounting standards
Other Information
Other Information is financial and non-financial information in Bank of Queensland Limitedrsquos annual reporting which is provided in addition to the Financial Reports and the Auditors Report The Directors are responsible for the Other Information
Our opinions on the Financial Reports do not cover the Other Information and accordingly we do not express an audit opinion or any form of assurance conclusion thereon with the exception of the Remuneration Report and our related assurance opinion
In connection with our audits of the Financial Reports our responsibility is to read the Other Information In doing so we consider whether the Other Information is materially inconsistent with the Financial Reports or our knowledge obtained in the audits or otherwise appears to be materially misstated
We are required to report if we conclude that there is a material misstatement of this Other Information and based on the work we have performed on the Other Information that we obtained prior to the date of this Auditorrsquos Report we have nothing to report
Responsibilities of the Directors for the Financial Reports
The Directors are responsible for
bull preparing the Financial Reports that give a true and fair view in accordance with Australian Accounting Standards and the Corporations Act 2001
bull implementing necessary internal controls to enable the preparation of a Financial Report that gives a true and fair view and is free from material misstatement whether due to fraud or error
bull assessing the Consolidated Entityrsquos and Bankrsquos ability to continue as a going concern and whether the use of the going concern basis of accounting is appropriate This includes disclosing as applicable matters related to going concern and using the going concern basis of accounting unless they either intend to liquidate the Consolidated Entity or Bank or to cease operations or have no realistic alternative but to do so
1932021 Annual Report
INDEPENDENT AUDITORrsquoS REPORT
194
Auditorrsquos responsibilities for the audits of the Financial Reports
Our objective is
bull to obtain reasonable assurance about whether each of the Financial Reports as a whole are free from material misstatement whether due to fraud or error and
bull to issue an Auditorrsquos Report that includes our opinions
Reasonable assurance is a high level of assurance but is not a guarantee that an audit conducted in accordance with Australian Auditing Standards will always detect a material misstatement when it exists
Misstatements can arise from fraud or error They are considered material if individually or in the aggregate they could reasonably be expected to influence the economic decisions of users taken on the basis of the Financial Reports
A further description of our responsibilities for the audits of the Financial Reports is located at the Auditing and Assurance Standards Board website at httpswwwauasbgovauadminfilecontent102c3ar1_2020pdf This description forms part of our Auditorrsquos Report
Report on the Remuneration Report
Opinion
In our opinion the Remuneration Report of Bank of Queensland Limited for the year ended 31 August 2021 complies with Section 300A of the Corporations Act 2001
Directorsrsquo responsibilities
The Directors of the Bank are responsible for the preparation and presentation of the Remuneration Report in accordance with Section 300A of the Corporations Act 2001
Our responsibilities
We have audited the Remuneration Report included in pages 76 to 102 of the Directorsrsquo report for the year ended 31 August 2021
Our responsibility is to express an opinion on the Remuneration Report based on our audit conducted in accordance with Australian Auditing Standards
KPMG Shaun Kendrigan Partner
Sydney 12 October 2021
194 Bank of Queensland Limited and its Controlled Entities
INDEPENDENT AUDITORrsquoS REPORT
1 TWENTY LARGEST ORDINARY SHAREHOLDERSAs at Thursday 23 September 2021 the following shareholding details applied
Number of ordinary shares
HSBC CUSTODY NOMINEES (AUSTRALIA) LIMITED 116895053 1824
CITICORP NOMINEES PTY LIMITED 60259245 940
J P MORGAN NOMINEES AUSTRALIA PTY LIMITED 56077870 875
NATIONAL NOMINEES LIMITED 41450195 647
BNP PARIBAS NOMS PTY LTD 11146804 174
BNP PARIBAS NOMINEES PTY LTD 9076602 142
HSBC CUSTODY NOMINEES (AUSTRALIA) LIMITED 6855102 107
NATIONAL NOMINEES LIMITED 5855700 091
BNP PARIBAS NOMINEES PTY LTD SIX SIS LTD 3709233 058
WASHINGTON H SOUL PATTINSON AND COMPANY LIMITED 3494197 055
CITICORP NOMINEES PTY LIMITED 3324124 052
GOLDEN LINEAGE PTY LTD 3110131 049
NATIONAL NOMINEES LIMITED 2636102 041
CARLTON HOTEL LIMITED 1084037 017
AMP LIFE LIMITED 1066119 017
MR KIE CHIE WONG 992908 015
PACIFIC CUSTODIANS PTY LIMITED 934537 015
THE MANLY HOTELS PTY LIMITED 926301 014
BNP PARIBAS NOMS (NZ) LTD 831885 013
NATIONAL EXCHANGE PTY LTD 760000 012
Total 330486145 5157
The above table includes shareholders that may hold shares for the benefit of third parties
Voting rightsOn a poll every person who is a holder of ordinary shares or a duly appointed representative of a holder of ordinary shares has one vote
194
Auditorrsquos responsibilities for the audits of the Financial Reports
Our objective is
bull to obtain reasonable assurance about whether each of the Financial Reports as a whole are free from material misstatement whether due to fraud or error and
bull to issue an Auditorrsquos Report that includes our opinions
Reasonable assurance is a high level of assurance but is not a guarantee that an audit conducted in accordance with Australian Auditing Standards will always detect a material misstatement when it exists
Misstatements can arise from fraud or error They are considered material if individually or in the aggregate they could reasonably be expected to influence the economic decisions of users taken on the basis of the Financial Reports
A further description of our responsibilities for the audits of the Financial Reports is located at the Auditing and Assurance Standards Board website at httpswwwauasbgovauadminfilecontent102c3ar1_2020pdf This description forms part of our Auditorrsquos Report
Report on the Remuneration Report
Opinion
In our opinion the Remuneration Report of Bank of Queensland Limited for the year ended 31 August 2021 complies with Section 300A of the Corporations Act 2001
Directorsrsquo responsibilities
The Directors of the Bank are responsible for the preparation and presentation of the Remuneration Report in accordance with Section 300A of the Corporations Act 2001
Our responsibilities
We have audited the Remuneration Report included in pages 76 to 102 of the Directorsrsquo report for the year ended 31 August 2021
Our responsibility is to express an opinion on the Remuneration Report based on our audit conducted in accordance with Australian Auditing Standards
KPMG Shaun Kendrigan Partner
Sydney 12 October 2021
1952021 Annual Report
SHAREHOLDING DETAILS
Financial Statements 108 | Signed Reports 183 | Shareholding Details 195 | Glossary 201
2 TWENTY LARGEST CAPITAL NOTE HOLDERSAs at Thursday 23 September 2021 the following holding details applied
Number of capital notes
BNP PARIBAS NOMINEES PTY LTD HUB24 CUSTODIAL SERV LTD 143575 410
CITICORP NOMINEES PTY LIMITED 136325 390
HSBC CUSTODY NOMINEES (AUSTRALIA) LIMITED 117911 337
J P MORGAN NOMINEES AUSTRALIA PTY LIMITED 65465 187
DIOCESE DEVELOPMENT FUND - CATHOLIC DIOCESE OF PARRAMATTA 56238 161
JOHN E GILL TRADING PTY LTD 54593 156
NATIONAL NOMINEES LIMITED 43234 124
MUTUAL TRUST PTY LTD 32812 094
BOND STREET CUSTODIANS LIMITED 32200 092
TRUSTEES OF CHURCH PROPERTY FOR THE DIOCESE OF NEWCASTLE 27499 079
NETWEALTH INVESTMENTS LIMITED 24713 071
BNP PARIBAS NOMINEES PTY LTD 23893 068
BERNE NO 132 NOMINEES PTY LTD 23705 068
FEDERATION UNIVERSITY AUSTRALIA 21935 063
INVIA CUSTODIAN PTY LIMITED 21310 061
HAVENFLASH PTY LTD 21000 060
NAVIGATOR AUSTRALIA LTD 17672 050
BNP PARIBAS NOMINEES PTY LTD 16703 048
NAVIGATOR AUSTRALIA LTD 16629 048
PACIFIC DEVELOPMENT CORPORATION PTY LTD 15500 044
Total 912912 2608
The above table includes shareholders that may hold shares for the benefit of third parties
Voting rightsCapital Notes do not give the holders any voting rights at any general shareholders meetings except in certain circumstances
196 Bank of Queensland Limited and its Controlled Entities
SHAREHOLDING DETAILS
Financial Statements 108 | Signed Reports 183 | Shareholding Details 195 | Glossary 201
3 TWENTY LARGEST CAPITAL NOTE 2 HOLDERSAs at Thursday 23 September 2021 the following holding details applied
Number of capital notes
J P MORGAN NOMINEES AUSTRALIA PTY LIMITED 200845 772
HSBC CUSTODY NOMINEES (AUSTRALIA) LIMITED 119965 461
CITICORP NOMINEES PTY LIMITED 100482 386
MUTUAL TRUST PTY LTD 84905 327
DIMBULU PTY LTD 75000 288
DIOCESE DEVELOPMENT FUND - CATHOLIC DIOCESE OF PARRAMATTA 58000 223
BERNE NO 132 NOMINEES PTY LTD 50400 194
NATIONAL NOMINEES LIMITED 43537 167
BNP PARIBAS NOMINEES PTY LTD HUB24 CUSTODIAL SERV LTD 40713 157
BERNE NO 132 NOMINEES PTY LTD 22700 087
BNP PARIBAS NOMINEES PTY LTD 20539 079
ALWOOD PTY LTD amp ALWOOD PTY LTD 18600 072
NETWEALTH INVESTMENTS LIMITED 14021 054
LEOPOLD STATION PTY LIMITED 13000 050
BNP PARIBAS NOMINEES PTY LTD 12456 048
QM FINANCIAL SERVICES PTY LTD 12000 046
MFIC SECURITIES PTY LTD 12000 046
NAVIGATOR AUSTRALIA LTD 10052 039
SANDHURST TRUSTEES LTD 10000 038
G HARVEY INVESTMENTS PTY LIMITED 10000 038
NETWEALTH INVESTMENTS LIMITED 9004 035
CERTANE CT PTY LTD 8250 032
Total 946469 3640
The above table includes shareholders that may hold shares for the benefit of third parties
Voting rightsCapital Notes 2 do not give the holders any voting rights at any general shareholders meetings except in certain circumstances
1972021 Annual Report
SHAREHOLDING DETAILS
Financial Statements 108 | Signed Reports 183 | Shareholding Details 195 | Glossary 201
4 DISTRIBUTION OF SECURITY HOLDERSDistribution of fully paid ordinary shares as at Thursday 23 September 2021
CategoryNumber of
shareholders of
shareholdersNumber of
shares of issued
capital
1 - 1000 59976 5639 21392483 334
1001 - 5000 31956 3005 78114407 1219
5001 - 10000 8418 792 59874797 934
10001 - 100000 5857 551 122499025 1911
100001 - and over 144 014 359008851 5602
Total 106351 10000 640889563 10000
Less than marketable parcel (1) 3300 310 64328 001
Distribution of Capital Notes as at Thursday 23 September 2021
CategoryNumber of
security holders of
security holdersNumber of
securities of issued
capital
1 - 1000 4750 9149 1522756 4351
1001 - 5000 388 747 754918 2157
5001 - 10000 23 044 160549 459
10001 - 100000 28 054 663966 1897
100001 - and over 3 006 397811 1137
Total 5192 10000 3500000 10000
Less than marketable parcel (2) 23 044 50 -
Distribution of Capital Notes 2 as at Thursday 23 September 2021
CategoryNumber of
security holders of
security holdersNumber of
securities of issued
capital
1 - 1000 2468 8783 894682 3441
1001 - 5000 299 1064 622387 2394
5001 - 10000 25 089 173716 668
10001 - 100000 15 053 487923 1877
100001 - and over 3 011 421292 1620
Total 2810 10000 2600000 10000
Less than marketable parcel (3) 1 004 1 -
SHAREHOLDING DETAILS
(1) Based on a closing price of $911 on 23 September 2021(2) Based on a closing price of $10370 on 23 September 2021(3) Based on a closing price of $10446 on 23 September 2021
198 Bank of Queensland Limited and its Controlled Entities
Financial Statements 108 | Signed Reports 183 | Shareholding Details 195 | Glossary 201
(1) Unquoted securities are issued under the Award Rights Plan and the Equity Incentive Plan(2) Inclusive of shares purchased under the NED Plan
5 PARTLY PAID SHARESThere are no partly paid shares
6 SUBSTANTIAL SHAREHOLDERS The names of substantial shareholders in the Bank per the meaning within the Corporations Act 2001 (Cth) and the number of shares in which each has an interest as disclosed in substantial shareholder notices given to the Bank were
Number of ordinary shares in which interest is held (at date of notification) Date of notification
The Vanguard Group Inc 27345351 27 October 2020
7 SECURITIES EXCHANGE LISTINGThe shares of Bank of Queensland Limited (BOQ) Capital Notes (BOQPE) and Capital Notes 2 (BOQPF) are quoted on the Australian Stock Exchange
Notes issued under BOQrsquos Euro Medium Term Note Programme and covered bonds issued under BOQrsquos Covered Bond Programme may be listed on the London Stock Exchange
8 UNQUOTED SECURITIESAs at 30 September 2021 the following unquoted securities were on issue
Unquoted securities (1)Number of
holders in the planNumber of
unquoted securities
Deferred Award Rights 385 2115375
Performance Award Rights 101 1168938
Premium Priced Options 14 8033732
Performance Shares 12 661135
Transformation Award Rights 44 280721
9 ON MARKET BUY-BACKThere is no current on market buy-back
10 SECURITIES PURCHASED ON MARKET During the year ended 31 August 2021 1184500 shares were purchased on market under the employee incentive scheme (2) The average price per security was $636
11 OTHER INFORMATION BOQ is a publicly listed company limited by shares and is incorporated and domiciled in Australia
SHAREHOLDING DETAILS
1992021 Annual Report
Financial Statements 108 | Signed Reports 183 | Shareholding Details 195 | Glossary 201
SHARE REGISTRYLink Market Services LimitedLevel 21 10 Eagle Street Brisbane Qld 4000
Australia 1800 779 639 International +61 1800 779 639 Email boqlinkmarketservicescomau
linkmarketservicescomau
COMPANY DETAILSBank of Queensland LimitedABN 32 009 656 740 ACN 009 656 740
Registered office Level 6 100 Skyring Terrace Newstead Qld 4006
Telephone +61 7 3212 3333 Investor Relations InvestorRelationsboqcomau
boqcomau twittercomboq facebookcomauBOQOnline
CUSTOMER SERVICEAustralia 1300 55 72 72 International +61 7 3336 2420
Postal address GPO Box 898 Brisbane Qld 4001
SHAREHOLDER INFORMATION
KEY SHAREHOLDER DATESDividend dates for ordinary shares only are
2021
Financial full year end 31 August 2021
Full year results and dividend announcement 13 October 2021
Full year ex-dividend date 28 October 2021
Full year dividend record date 29 October 2021
Full year dividend payment date 18 November 2021
Annual General Meeting 7 December 2021
200 Bank of Queensland Limited and its Controlled Entities
Financial Statements 108 | Signed Reports 183 | Shareholding Details 195 | Glossary 201
TERM DESCRIPTION
APRA Prudential Standard (APS) Prudential standards issued by APRA which are applicable to ADIs
Australian Accounting Standards Board (AASB) The AASB produces a series of technical pronouncements that set out the measurement and recognition requirements when accounting for particular types of transactions and events along with the preparation and presentation requirements of an entityrsquos financial statements
Australian Banking Association (ABA) The trade association for the Australian banking industry
Asset backed securities (ABS) A financial security which is pledged by a pool of assets such as but not limited to loans leases and credit card debt
Australian Finance Industry Association (AFIA) AFIA is the national association for the equipment leasing and financing industry Formerly Australian Equipment Lessors Association
Alternative liquid assets (ALA) Alternative liquid assets are alternative treatments for holdings in the stock of HQLA These treatments are made available in jurisdictions where there is insufficient supply of HQLA1 (or both HQLA1 and HQLA2) in the domestic currency to meet the aggregate demand of banks with significant exposures in the domestic currency in the LCR framework Within Australia a locally-incorporated ADI subject to LCR requirements is able to establish a CLF with the Reserve Bank of Australia sufficient in size to cover any shortfall in Australian dollars between the ADIrsquos holdings of HQLA and net cash outflows
Australian Prudential Regulation Authority (APRA)
APRA is the prudential regulator of the Australian financial services industry APRA is an independent statutory authority that supervises institutions across banking insurance and superannuation and promotes financial system stability in Australia
Australian Securities And Investments Commission (ASIC)
ASIC is Australiarsquos corporate markets and financial services regulator
Australian Securities Exchange (ASX) Australian Securities Exchange or ASX Limited (ABN 98 008 624 691) and the market activities operated by ASX Limited
Authorised deposit-taking institution (ADI) A corporation which is authorised under the Banking Act 1959 and includes banks building societies and credit unions
Available stable funding (ASF) ASF is the portion of capital and liabilities expected to be reliable over the time horizon considered by the NSFR which extends to one year
Average interest earning assets Average balance over the period for a bankrsquos assets that accrue interest income
Bank of Queensland Limited (the Bank or BOQ) The Bank is a for-profit entity primarily involved in providing retail and business banking leasing finance and insurance products to its customers
Banking Relief Package (BRP) A for of Government assistance that gives eligible clients the option of deferring loan repayments for a period of time
Basel II and III A global regulatory framework to improve the regulation supervision and risk management within the banking system developed by the Basel Committee on Banking Supervision
Basis points (bps) One per cent of one per cent (001 per cent)
Banking Executive Accountability Regime (BEAR) The Banking Executive Accountability Regime (BEAR) set out in Part IIAA of the Banking Act 1959 establishes accountability obligations for authorised deposit-taking institutions (ADIs) and their senior executives and directors
Bonus Interest savings Account (BISA) BOQrsquos Bonus Interest Savings Account is a savings account with a variable base interest rate and a bonus interest rate calculated on a tiered basis
BOQ Blue BOQ Blue refers to the original BOQ brand and excludes new brands such as Virgin Money BOQ Specialist and BOQ Finance It is predominantly represented as transactions and products serviced through our branch network business bank relationship managers and financial markets
BOQ Group Transformation Award (BTA) BOQ Group Transformation Award is a type of incentive award granted to select employees BTAs vest subject to the achievement of a core earnings hurdle
Capital Notes (BOQPE) amp Capital Notes 2 (BOQPF)
Capital Notes are perpetual convertible unguaranteed and unsecured notes issued by BOQ with preferred discretionary non-cumulative distributions Capital Notes may convert into common shares in certain circumstances as described in the offer documentation of the notes
Cash earnings Cash Earnings is a non-accounting standards measure commonly used in the banking industry to assist in presenting a clear view of underlying earnings
Committed liquidity facility (CLF) The RBA provides a CLF to certain ADIs as part of Australiarsquos implementation of the Basel III liquidity standards The facility is designed to ensure that participating ADIs have enough access to liquidity to respond to an acute stress scenario as specified under the relevant APS
Common equity tier 1 (CET1) Capital that is recognised as the highest quality component of capital under APS
Common equity tier 1 ratio (CET1 ratio) CET1 capital divided by total RWA calculated in accordance with relevant APS
Consolidated Entity (the Group) BOQ and its subsidiaries
Corporations Act 2001 The Corporations Act 2001 (Cth)
2012021 Annual Report
GLOSSARY
Financial Statements 108 | Signed Reports 183 | Shareholding Details 195 | Glossary 201
TERM DESCRIPTION
Corporation Regulations 2001 The Corporations Regulations 2001 made under the Corporations Act 2001 (Cth)
Cost to income ratio (CTI) Operating expenses divided by net operating income
Covered bond guarantor Perpetual Corporate Trust Limited ABN 99 000 341 533 incorporated with limited liability in the Commonwealth of Australia and having its registered office at Level 18 123 Pitt Street Sydney NSW 2000 as trustee of the BOQ Covered Bond Trust (the Trustee)
Deferred Award Rights (DARs) Deferred Award Rights (DARs) are a type of long-term incentive award rights granted to employees below Senior Executive Level DARs vest subject to service conditions and a risk assessment
Days past due (dpd) A loan or lease payment that has not been made by a customer by the due date
Dividend payout ratio Dividends paid on ordinary shares divided by earnings
Dividend reinvestment plan (DRP) A plan which provides shareholders with the opportunity to convert all or part of their entitlement to a dividend into new shares
Dividend yield Dividend shown as a percentage of the share price
Earnings per share (EPS) Measure of earnings attributed to each equivalent ordinary share over a twelve month period This is calculated by dividing the companyrsquos earnings by the weighted average number of shares on issue in accordance with AASB 133 Earnings per share
Effective tax rate Income tax expense divided by profit before tax
Equipment hire purchase trust (EHP trust) EHP trust under the REDS securitisation program issuing asset backed securities to the term market
Euro Medium Term Note (EMTN) EMTN is an offshore medium term note program
Expected Credit Loss (ECL) Estimated credit losses using a forward looking impairment methodology accounted for in accordance with AASB 9 Financial Instruments
Full time equivalent (FTE) A calculation based on number of hours worked by full and part time employees as part of their normal duties
General reserve for credit losses (GRCL) An additional reserve for future unidentified credit losses in line with APS 220 Credit Risk Management not reflected as part of existing ECL provisions
Gross Domestic Product (GDP) Monetary measure of the market value of all the final goods and services produced in a specific time period
Gross loans and advances (GLA) Gross loans and advances is the principal amount of loans and advances provided gross of provisions and deferred fee income and including any accrued interest
High Quality Liquid Assets (HQLA1) Comprises the Bankrsquos notes and coins and marketable securities representing claims on or guaranteed by the Australian Government or Semi-Government authorities
Impaired assets Exposures that have deteriorated to the point where full collection of principal and interest is in doubt
Interest bearing liabilities The Bankrsquos liabilities that accrue interest expense
International Accounting Standards Board (IASB) Independent private-sector body that develops and approves International Financial Reports Standards
International Financial Reporting Standards (IFRS)
A series of globally accepted accounting standards for accounting for particular types of transactions and events
International Panel on Climate Change (IPCC) IPCC is the United Nations body charged with overseeing climate change and publishing the global climate modelsrsquo (including RCPrsquos)
Issued capital Value of securities allotted in a company to its shareholders
Know Your Client (KYC) Regulatory compliance costs
The KYC guidelines in financial services require professionals to verify the identity suitability and risks involved with maintaining a business relationship The procedures fit within the broader scope of the Bankrsquos anti-money laundering (AML) policy
Line of credit (LOC) A flexible facility that allows a customer to draw down on their approved available credit at any time as long as the customer does not exceed the approved credit limit
Liquid assets All unencumbered RBA repurchase eligible liquid assets including HQLA1 and assets able to be pledged as collateral to the RBA under the CLF
Liquidity Coverage Ratio (LCR) The ratio of HQLA1 that can be converted into cash easily and immediately in private markets to total net cash flows required to meet the Grouprsquos liquidity needs for a 30 day calendar liquidity stress scenario as determined in accordance with APS
Members Equity Bank Limited (ME Bank or ME) ME Bank is a for profit entity that operates in the retail segment of the domestic market offering primarily home loan products and everyday transaction and online savings accounts
Mortgage Net Promoter Score (NPS) The Net Promoter Score is an index that measures the willingness of customers to recommend a companyrsquos products or services to others It is used as a proxy for gauging the customerrsquos overall satisfaction with a companyrsquos product or service and the customerrsquos loyalty to the brand
202 Bank of Queensland Limited and its Controlled Entities
GLOSSARY
Financial Statements 108 | Signed Reports 183 | Shareholding Details 195 | Glossary 201
TERM DESCRIPTION
Net capitalised investment (CAPEX) Net capitalised investment is the amount spent on purchasing or improving capital assets less their cost of the depreciation and amortisation
Net interest margin (NIM) Net interest income divided by average interest-earning assets
Net stable funding ratio (NSFR) The NSFR is defined as the amount of ASF relative to the amount of required stable funding This ratio should be equal to at least 100 on an on-going basis The amount of such stable funding required of a specific institution is a function of the liquidity characteristics and residual maturities of the various assets held by that institution as well as those of its off-balance sheet exposures
Net tangible assets (NTA) Net tangible assets are calculated as the total assets of a company minus any intangible assets such as goodwill less all liabilities and the par value of preferred stock
Non-Executive Director Fee Sacrifice Rights Plan (NED Plan)
The Non-Executive Director Fee (NEDs) Sacrifice Rights Plan (NED Plan) allows NEDs to sacrifice a portion of their Board fees to acquire BOQ shares
Non-interest earning assets The Bankrsquos assets that do not accrue interest income
Novel coronavirus disease (COVID-19) The Novel Coronavirus disease that was declared as a global pandemic on 11 March 2020
Owner-managed Branch (OMB) A branch which is run by a franchisee
Performance Award Rights (PARs) Performance Award Rights (PARs) are a type of long-term incentive award rights which were granted to senior employees including executives until 2019 PARs vest subject to two performance hurdles relative total shareholder return (rTSR) and relative earnings per share (EPS)
REDS Term to describe the BOQ securitisation programmes
Representative Concentration Pathway (RCP) RCP are physical climate scenarios set by the IPCC (with the assistance of the global scientific community)
Required stable funding (RSF) RSF is an input to the calculation of the NSFR for bank prudential management purposes A bankrsquos RSF is calculated from its assets weighted according to their maturity credit quality and liquidity together with an amount in relation to off balance sheet commitments
Reserve Bank of Australia (RBA) Australiarsquos central bank and drives its functions and powers from the Reserve Bank Act 1959
Residential mortgage backed securities (RMBS) BOQrsquos securitisation program which enables the trustee to issue debt securities backed by assets originated by the Group such as mortgages
Return on average equity (ROE) Net profit attributable to the owners of the Bank divided by average ordinary equity
Return on average tangible equity (ROTE) Net profit attributable to the owners of the Bank divided by average ordinary equity less goodwill and identifiable intangible assets
Right-of-use (ROU) asset The right-of-use asset is a lesseersquos right to use an asset over the life of a lease
Risk weighted assets (RWA) A quantitative measure of various risks including credit operational market and securitisation as defined by APS
Significant Increase in Credit Risk (SICR) SICR is a significant change in the estimated risk of default over the remaining expected life of the financial asset SICR is assessed by comparing the risk of a default occurring over the expected life of a financial asset at the reporting date compared to the corresponding risk of default at origination
Small and Medium Enterprises (SME) SME are businesses whose personnel numbers fall below certain limits
Term Funding Facility (TFF) Funding Facility for authorised deposit-taking institutions established by the RBA to support the Australian economy
Total capital adequacy ratio Total capital divided by total RWA calculated in accordance with relevant APS
Total Shareholder Return (TSR) TSR is a measure of the entire return a shareholder would obtain from holding an entityrsquos securities over a period taking into account factors such as changes in the market value of the securities and dividends paid over the period
Treasury shares Shares that the Bank has issued but are held by a trust included within the Bankrsquos consolidated results Treasury shares are not considered shares outstanding and are not included in lsquoper sharersquo calculations
Virgin BOQ Group Transformation Award (VTA) Virgin BOQ Group Transformation Award is a type of incentive award granted to select employees VTAs vest subject to the achievement of two hurdles core earnings and the delivery of the Virgin Money digital bank
Virgin Money Australia (VMA or Virgin Money)
Virgin Money (Australia) Pty Ltd and its subsidiaries The VMA entities are subsidiaries of the Group that engage in the provision of financial services on behalf of business partners including BOQ
Weighted average life (WAL) Is the average length of time for the principal on a loan to be paid in full
Weighted average number of shares (WANOS) Calculated in accordance with AASB 133 Earnings per share
Wholesale Capital Notes (WCN) WCNs are notes that may convert into common shares in certain circumstances as described in the offer documentation of the notes
2032021 Annual Report
GLOSSARY
Financial Statements 108 | Signed Reports 183 | Shareholding Details 195 | Glossary 201
Bank of Queensland LimitedABN 32 009 656 740
- 2021 Reporting Suite