2021 3q presentation material
TRANSCRIPT

© 2021 Renesas Electronics Corporation. All rights reserved.
3Q 2021PRESENTATION
RENESAS ELECTRONICS CORPORATION OCTOBER 28, 2021

© 2021 Renesas Electronics Corporation. All rights reserved. Page 2
NON-GAAP BASIS INFORMATION
In this section, Renesas Electronics Group (hereinafter “the Group”) applies Non-GAAPfinancial measures (hereinafter “Non-GAAP basis”) used for management’s decisionmaking. The Group defines the Non-GAAP consolidated financial results as financialaccounting figures (hereinafter “GAAP; IFRS based”) excluding or adjusting non-recurring and other items following a certain set of rules. The Group believes Non-GAAPoperating profit is useful information to understand its recurring operating performance.
The Group reports its forecasts for the next quarter as a range. The forecast for the full year is calculated by adding the forecast as a range of the three months ending December 31, 2021 to the results of the nine months ended September 30, 2021.
© 2021 Renesas Electronics Corporation. All rights reserved. Page 3
DISCLAIMER Adoption of IFRS: With the outlook that the Group will continue to expand globally and to provide financial figures that can be
compared on a global scale, the Group discloses its consolidated financial statements in accordance with the International Financial Reporting Standards (“IFRS”) starting from the annual securities report for FY2018/12.
Presentation of financial forecasts: Starting from the consolidated forecasts for the three months ended March 31, 2019, the Group presents its financial forecasts as a range. In order to provide useful information to better understand the Group’s constant business results, figures such as gross margin and operating margin will be presented in the non-GAAP format, which excludes or adjusts the non-recurring items related to acquisitions and other adjustments removed as non-recurring expenses or income. However, the figure provided as revenue is based on IFRS and does not include non-GAAP adjustments. The gross margin and operating margin forecasts are given assuming the midpoint in the sales revenue forecast.
Segment disclosure: Although the Group designs and manufactures semiconductors, the financial figures disclosed have been reformed to two segments: “Automotive Business” and “Industrial/Infrastructure/IoT Business” since 3Q FY2019/12 in order to moreappropriately disclose financial figures.
Cost segment reclassification: Following the acquisition of IDT and the absorption type merger of IDT with Renesas Electronics America Inc., since January 1, 2020, the Group has begun the integration of business processes and IT systems, etc. as part of the “One Renesas” promotion. With these processes as a momentum, expense classifications have been revised in order to appropriately display the Group’s financial status and business performance. Changes in classifications have been applied retroactively; therefore, the consolidated financial results of the year ended December 31, 2019 have been reclassified.

© 2021 Renesas Electronics Corporation. All rights reserved. Page 4
(B yen)
2020 2021
3Q(Jul-Sep)
9 months(Jan-Sep)
2Q(Apr-Jun)
3Q(Jul-Sep)Forecast
3Q(Jul-Sep)
ActualYoY QoQ
Change from
Jul 29 FCT*2
9 months(Jan-Sep)
ActualYoY
Change from
Jul 29 FCT*2
Revenue 178.7 524.1 217.9 240.0(±4.0) 258.4 +44.6% +18.6% +7.7% 680.0 +29.7% +2.8%
Gross Margin 47.5% 47.4% 52.0% 53.0% 55.2% +7.7pts +3.2pts +2.2pts 52.7% +5.2pts +0.9pt
Operating Profit/loss (Margin)
36.5(20.4%)
100.4(19.2%)
61.4(28.2%)
69.6(29.0%)
83.9(32.5%)
+47.4(+12.0pts)
+22.5(+4.3pts)
+14.3(+3.5pts)
197.9(29.1%)
+97.5(+9.9pts)
+14.3(+1.3pts)
Profit/loss Attributable to Owners of Parent 33.6 87.2 45.8 - 62.9 +29.3 +17.1 - 141.3 +54.1 -
EBITDA*3 57.3 165.8 80.6 - 103.6 +46.4 +23.1 - 256.0 +90.2 -
1 US$= 107 yen 108 yen 109 yen 109 yen 110 yen 3 yendepreciation
1 yendepreciation
1 yendepreciation 108 yen 0 yen
appreciation0 yen
depreciation
1 Euro= 123 yen 121 yen 131 yen 130 yen 131 yen 8 yendepreciation
0 yenappreciation
1 yendepreciation 129 yen 9 yen
depreciation0 yen
depreciation
3Q 2021 FINANCIAL SNAPSHOT NON-GAAP*1
YoY and QoQ revenue as well as the changes from FCTs of the revenue are rounded off to one decimal place.
*1: Non-GAAP figures are calculated by removing or adjusting non-recurring items and other adjustments from GAAP (IFRS based) figures following a certain set of rules. The Group believes non-GAAP measures provide useful information in understanding and evaluating the Group’s constant business results, and therefore results are provided in non-GAAP base. This adjustment and exclusion include the amortization of intangible assets recognized from acquisitions, other PPA(purchase price allocation) adjustments relating to acquisitions, stock-based compensation, as well as other non-recurring expenses and income the Group believes to be applicable. However, the figure provided as revenue is based on IFRS and does not include non-GAAP adjustments
*2: Each figure represents comparisons with the midpoint in the sales revenue forecast range*3: Operating Profit + Depreciation and amortization
© 2021 Renesas Electronics Corporation. All rights reserved. Page 5
(B yen)
2020 2021
3Q(Jul-Sep)
9 months(Jan-Sep)
2Q(Apr-Jun)
3Q(Jul-Sep)Forecast
3Q(Jul-Sep)
ActualYoY QoQ
Change from
Jul 29 FCT*2
9 months(Jan-Sep)
ActualYoY
Change from
Jul 29 FCT*2
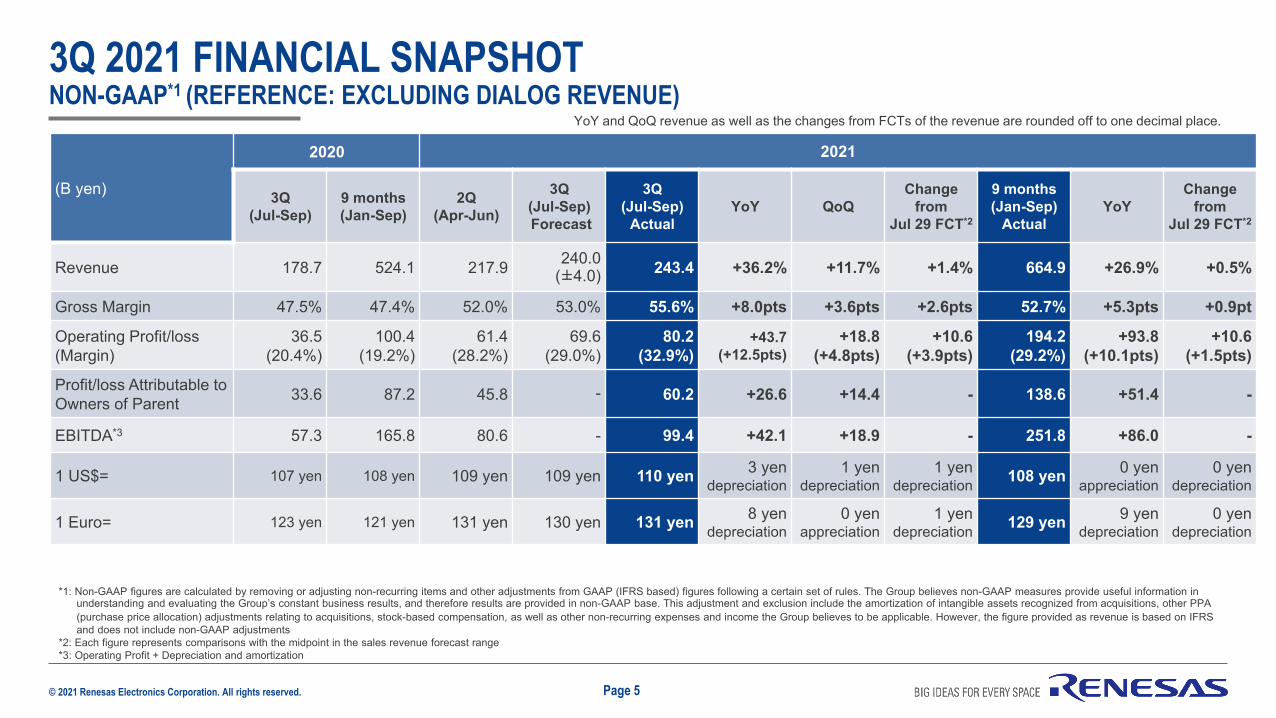
Revenue 178.7 524.1 217.9 240.0(±4.0) 243.4 +36.2% +11.7% +1.4% 664.9 +26.9% +0.5%
Gross Margin 47.5% 47.4% 52.0% 53.0% 55.6% +8.0pts +3.6pts +2.6pts 52.7% +5.3pts +0.9pt
Operating Profit/loss (Margin)
36.5(20.4%)
100.4(19.2%)
61.4(28.2%)
69.6(29.0%)
80.2(32.9%)
+43.7(+12.5pts)
+18.8(+4.8pts)
+10.6(+3.9pts)
194.2(29.2%)
+93.8(+10.1pts)
+10.6(+1.5pts)
Profit/loss Attributable to Owners of Parent 33.6 87.2 45.8 - 60.2 +26.6 +14.4 - 138.6 +51.4 -
EBITDA*3 57.3 165.8 80.6 - 99.4 +42.1 +18.9 - 251.8 +86.0 -
1 US$= 107 yen 108 yen 109 yen 109 yen 110 yen 3 yendepreciation
1 yendepreciation
1 yendepreciation 108 yen 0 yen
appreciation0 yen
depreciation
1 Euro= 123 yen 121 yen 131 yen 130 yen 131 yen 8 yendepreciation
0 yenappreciation
1 yendepreciation 129 yen 9 yen
depreciation0 yen
depreciation
3Q 2021 FINANCIAL SNAPSHOT NON-GAAP*1 (REFERENCE: EXCLUDING DIALOG REVENUE)
YoY and QoQ revenue as well as the changes from FCTs of the revenue are rounded off to one decimal place.
*1: Non-GAAP figures are calculated by removing or adjusting non-recurring items and other adjustments from GAAP (IFRS based) figures following a certain set of rules. The Group believes non-GAAP measures provide useful information in understanding and evaluating the Group’s constant business results, and therefore results are provided in non-GAAP base. This adjustment and exclusion include the amortization of intangible assets recognized from acquisitions, other PPA(purchase price allocation) adjustments relating to acquisitions, stock-based compensation, as well as other non-recurring expenses and income the Group believes to be applicable. However, the figure provided as revenue is based on IFRS and does not include non-GAAP adjustments
*2: Each figure represents comparisons with the midpoint in the sales revenue forecast range*3: Operating Profit + Depreciation and amortization

© 2021 Renesas Electronics Corporation. All rights reserved. Page 6
63.393.5 85.9 87.0 82.6 91.6 96.7 92.8 96.6 106.9
132.6
82.7
94.5 93.1 100.8 93.5 72.6 79.6 95.3 103.2106.1
121.3
4.2
4.6 4.4 4.22.6
2.52.5
3.53.8
4.9
4.5
0
50
100
150
200
250
1Q 2Q 3Q 4Q 1Q 2Q 3Q 4Q 1Q 2Q 3Q
(B yen)
191.6203.7
258.4
217.9
QUARTERLY REVENUE *1 TRENDS
*1: The figure provided as revenue is based on IFRS and does not include non-GAAP adjustments
Industrial, Infrastructure, IoTYoY: +37.2%QoQ: +24.1%
AutomotiveYoY: +52.5%QoQ: +14.3%
150.3
192.6 183.4 192.0178.7
166.7178.7
Automotive Industrial/Infrastructure/IoT Others
2019 2020 2021
RevenueYoY: +44.6% QoQ: +18.6%

© 2021 Renesas Electronics Corporation. All rights reserved. Page 7
3Q 2021 REVENUE AND GROSS/OPERATING MARGIN NON-GAAP*1
*1: Non-GAAP figures are calculated by removing or adjusting non-recurring items and other adjustments from GAAP (IFRS based) figures following a certain set of rules. The Group believes non-GAAP measures provide useful information in understanding and evaluating the Group’s constant business results, and therefore results are provided in non-GAAP base. This adjustment and exclusion include the amortization of intangible assets recognized from acquisitions, other PPA(purchase price allocation) adjustments relating to acquisitions, stock-based compensation, as well as other non-recurring expenses and income the Group believes to be applicable. However, the figure provided as revenue is based on IFRS and does not include non-GAAP adjustments
2Q 2021Actual
(Apr-Jun 2021)
3Q 2021Forecast
(Jul-Sep 2021)
3Q 2021Actual
(Jul-Sep 2021)
Revenue217.9 B yen 240.0 B yen
(±4.0 B yen) 258.4 B yen
Gross Margin52.0% 53.0% 55.2%
OperatingMargin 28.2% 29.0% 32.5%
vs FCST: +2.2ptsQoQ: +3.2pts
vs FCST : +3.5ptsQoQ: +4.3pts
vs FCST: +7.7%QoQ: +18.6%
Operating Margin vs FCTS + 3.5pts
Operating Margin QoQ +4.3pts
RevenueGross Margin
Currency ImpactProduct MixProduction RecoveryProduction Costs, etc.
Operating Expenses
RevenueGross Margin
Currency ImpactProduct MixProduction RecoveryProduction Costs, etc.
Operating Expenses
Excl. Dialog: 243.4 B yen
Excl. Dialog: 55.6%
Excl. Dialog: 32.9%

© 2021 Renesas Electronics Corporation. All rights reserved. Page 8
IN-HOUSE INVENTORY (FINANCIAL ACCOUNTING BASIS) AND DOI*1
*1: DOI: Days of Inventory = Inventory valuation balance at the end of the quarter / cost of sales of the quarter (Non-GAAP) × 90. However, Dialog’s quarterly cost of sales for 3Q 2021 is calculated by multiplying Dialog’s September costs by 3
0
50
100
150
0
25
50
75
100
1Q 2Q 3Q 4Q 1Q 2Q 3Q 4Q 1Q 2Q 3Q0
50
100
150
0
25
50
75
100
1Q 2Q 3Q 4Q 1Q 2Q 3Q 4Q 1Q 2Q 3Q
Automotive Industrial/Infrastructure/IoTInventory(B yen)
DOI(Days)
Inventory(B yen)
DOI(Days)
Company Total
0
50
100
150
0
50
100
150
200
1Q 2Q 3Q 4Q 1Q 2Q 3Q 4Q 1Q 2Q 3Q
Inventory(B yen)
DOI(Days)
DOI
Finished Goods
Work-In-Process
Raw Materials
2019 2020 2021 2019 2020 2021 2019 2020 2021
Dialog
Target DOI

© 2021 Renesas Electronics Corporation. All rights reserved. Page 9
SALES CHANNEL INVENTORY*1 (MANAGEMENT ACCOUNTING BASIS) AND WOI*2
0.0
6.0
12.0
18.0
0
50
100
150
1Q 2Q 3Q 4Q 1Q 2Q 3Q 4Q 1Q 2Q 3Q0.0
6.0
12.0
18.0
0
50
100
150
1Q 2Q 3Q 4Q 1Q 2Q 3Q 4Q 1Q 2Q 3Q
*1: Channel Inventory: Total inventory amount for Tokuyakutens for Japanese customers and overseas distributors (including former Intersil and former IDT products) Excludes Dialog inventory *2: WOI: Weeks of Inventory = Channel inventory at the end of the quarter / (cost of channel sales in the quarter / 13 weeks). It should be noted that from the inventory management perspective, to calculate appropriate WOI,
Inventory Balance where certain Long-Term Inventory (EOL, e-commerce inventory, etc.) is subtracted from Channel Inventory*3: Liquid Inventory: Channel Inventory – Long-Term Inventory, etc. *4: Long-Term Inventory: Inventory with unique holding periods (EOL products, e-commerce inventory etc.)
Automotive Industrial/Infrastructure/IoTInventory(B yen)
WOI(Weeks)
Inventory(B yen)
WOI(Weeks)
0.0
3.0
6.0
9.0
12.0
0
50
100
150
200
1Q 2Q 3Q 4Q 1Q 2Q 3Q 4Q 1Q 2Q 3Q
Company TotalInventory(B yen)
WOI(Weeks)
WOI
Long-Term Inventory, etc.*4
Liquid Inventory*3
2019 2020 2021 2019 2020 2021 2019 2020 2021
Target WOI

© 2021 Renesas Electronics Corporation. All rights reserved. Page 10
2Q 3Q 2Q 3Q
INVENTORY ANALYSIS
• Start of consolidation
• Advanced purchase order
• Increased demand • Naka factory
production recovery • WIP increase due to
production constraints
• Increase due to logistics stagnation
• Decreased EOL
In-house Inventory Sales Channel Inventory3Q 4Q Outlook 3Q 4Q Outlook
• Seasonality
• Advanced purchase order
• Anticipation of production risks
• Anticipation of logistics risks
• Increased demand (MCU, SoC, MID, etc.)
• Change in distribution (Direct Channel)
• Postponed shipment (Analog)
• Mismatch of product mix (PC, etc.)
• Decreasedproduction by OEMs
• Postponed shipment
• Production recovery by OEMs
• WOI decreasesFinished
Goods
Work-In
-Process(WIP)
RawMaterials
Automotive
IndustrialInfrastructure
IoT
Dialog
• Continuous increase in demand
• WOI decreases
*Excluding Dialog inventory

© 2021 Renesas Electronics Corporation. All rights reserved. Page 11
0%
20%
40%
60%
80%
100%
1Q 2Q 3Q 4Q 1Q 2Q 3Q 4Q 1Q 2Q 3Q
Total 6-inch line 8-inch line 12-inch line
QUARTERLY TRENDS IN FRONT-END UTILIZATION RATE*1WAFER INPUT BASIS
2019 2020 2021
*1 The total unitization rate as of 1QFY21 is calculated by excluding the utilization rate of the Shiga factory, which is to be consolidated

© 2021 Renesas Electronics Corporation. All rights reserved. Page 12
NON-GAAP*1 EBITDA*2*3 AND GAAP CASH FLOWSGAAP Cash Flows
*1: Non-GAAP figures are calculated by removing or adjusting non-recurring items and other adjustments from GAAP (IFRS based) figures following a certain set of rules. The Group believes non-GAAP measures provide useful information in understanding and evaluating the Group’s constant business results, and therefore results are provided in non-GAAP base. This adjustment and exclusion include the amortization of intangible assets recognized from acquisitions, other PPA(purchase price allocation) adjustments relating to acquisitions, stock-based compensation, as well as other non-recurring expenses and income the Group believes to be applicable
*2: Following the acquisition of IDT and the absorption type merger of IDT with Renesas Electronics America Inc., since January 1, 2020, the Group has begun the integration of business processes and IT systems, etc. as part of the “One Renesas” promotion. With these processes as a momentum, expense classifications have been revised in order to appropriately display the Group’s financial status and business performance. Changes in classifications have been applied retroactively; therefore, the consolidated financial results of the year ended December 31, 2019, have been reclassified
*3: Operating profit + Depreciation and amortization *4: Cash flows from operating activities + Cash flows from investing activities*5: Acquisition-related payments of IDT *6: Acquisition-related payments of Dialog
20.7
54.447.8
79.2
28.7
47.9
64.9
82.4
47.3
73.4 75.6
-16.3 -16.2 -11.8 -12.1 -10.1 -9.7 -10.3 -10.1 -6.1 -10.8 -15.5
4.4
38.2
35.9
67.1
18.7
38.2
54.6
72.3
41.262.5
60.0
-45
-30
-15
0
15
30
45
60
75
1Q 2Q 3Q 4Q 1Q 2Q 3Q 4Q 1Q 2Q 3Q
Cash flows from operating activitiesCash flows from investing activitiesFree cash flows
Amount excluding 685.8 billion yen of acquisition-related cost*5
Non-GAAP EBITDA
2019FCF145.6 B yen
(B yen)
2020 FCF183.7 B yen32.2
53.0 51.7 56.0 57.650.8
57.3 57.5
71.880.6
103.6
0%
10%
20%
30%
40%
50%
0
20
40
60
80
100
120
1Q 2Q 3Q 4Q 1Q 2Q 3Q 4Q 1Q 2Q 3Q
EBITDAEBITDA margin
2019192.9 B yen
2020223.2 B yen
(B yen)*4
2019 2020 2021 2019 2020 2021
1-3Q EBITDA256.0 B yen
1-3Q FCF163.8 B yen
Amount excluding 587.0 billion yen of acquisition-related cost*6

© 2021 Renesas Electronics Corporation. All rights reserved. Page 13
3Q 2021 FINANCIAL RESULTS BY MAIN SEGMENT NON-GAAP*1
*1: Non-GAAP figures are calculated by removing or adjusting non-recurring items and other adjustments from GAAP (IFRS based) figures following a certain set of rules. The Group believes non-GAAP measures provide useful information in understanding and evaluating the Group’s constant business results, and therefore results are provided in non-GAAP base. This adjustment and exclusion include the amortization of intangible assets recognized from acquisitions, other PPA(purchase price allocation) adjustments relating to acquisitions, stock-based compensation, as well as other non-recurring expenses and income the Group believes to be applicable. However, the figure provided as revenue is based on IFRS and does not include non-GAAP adjustments
Automotive Business Industrial/Infrastructure/IoT Business Company Total
Revenue(QoQ)
121.3 B yen(+14.3%)
132.6 B yen(+24.1%)
258.4 B yen(+18.6%)
Gross Margin(QoQ)
49.2%(+5.4pts)
62.1%(+0.4pt)
55.2%(+3.2pts)
Operating Margin(QoQ)
29.2%(+5.6pts)
35.8%(+3.4pts)
32.5%(+4.3pts)

© 2021 Renesas Electronics Corporation. All rights reserved. Page 14
(B yen)
2020 2021
4Q(Oct-Dec)
Full year(Jan-Dec)
3Q(Jul-Sep)
4Q(Oct-Dec)Midpoint Forecast(Range)
YoY QoQFull year(Jan-Dec)Forecast
YoY
Revenue 191.6 715.7 258.4 298.0(±4.0)
+55.5%(±2.1pts)
+15.3%(±1.5pts)
978.0(±4.0)
+36.7%(±0.6pt)
Gross Margin*2 47.0% 47.3% 55.2% 53.0% +6.0pts -2.2pts 52.8% +5.4pts
Operating Profit/loss (Margin)*2
37.2(19.4%)
137.5(19.2%)
83.9(32.5%) 28.0% +8.6pts -4.5pts 28.8% +9.5pts
1 US$ = 105 yen 107 yen 110 yen 111 yen 6 yendepreciation
1 yendepreciation 109 yen 1 yen
depreciation
1 Euro= 124 yen 121 yen 131 yen 130 yen 5 yendepreciation
1 yen appreciation 129 yen 8 yen
depreciation
4Q AND FULL YEAR 2021 FORECASTNON-GAAP*1
Page 14
YoY and QoQ results of the revenue are rounded off to one decimal place.
*1: Non-GAAP figures are calculated by removing or adjusting non-recurring items and other adjustments from GAAP (IFRS based) figures following a certain set of rules. The Group believes non-GAAP measures provide useful information in understanding and evaluating the Group’s constant business results, and therefore results are provided in non-GAAP base. This adjustment and exclusion include the amortization of intangible assets recognized from acquisitions, other PPA(purchase price allocation) adjustments relating to acquisitions, stock-based compensation, as well as other non-recurring expenses and income the Group believes to be applicable
*2: Each figure represents comparisons with the midpoint in the sales revenue forecast range

© 2021 Renesas Electronics Corporation. All rights reserved. Page 15
4Q 2021 REVENUE AND DEMAND FORECASTS
Automotive Business Industrial/Infrastructure/IoT Business Company Total
Revenue(Sell-in)Forecast
QoQ + ++ +15.3%++
YoY ++ ++ +55.5%++
Customer Demand
(Sell-through)Outlook
QoQ ++ ++ ++YoY ++ ++ ++

© 2021 Renesas Electronics Corporation. All rights reserved. Page 16
ORDER SITUATIONOrder Backlog*1*2 (Management Accounting Basis)
0
100
200
300
400
1Q 2Q 3Q 4Q 1Q 2Q 3Q 4Q 1Q 2Q 3Q
0
200
400
600
800
1Q 2Q 3Q 4Q 1Q 2Q 3Q 4Q 1Q 2Q 3Q
(B yen)
(B yen)
2019 | 2020 | 2021
2019 | 2020 | 2021
Automotive
Industrial/Infrastructure/IoT
Company Total
0
200
400
600
800
1,000
1,200
1Q 2Q 3Q 4Q 1Q 2Q 3Q 4Q 1Q 2Q 3Q
(B yen)
Demand Outlook Enhancement
Supply Outlook Enhancement
Advanced POs(through 2022)
BTO
Multi-Sourcing
Advanced POs
Strategic Inventory2019 | 2020 | 2021
*1: Exchange rate based on actual rates *2: Order backlog is calculated by removing the EOL backlog from the total of the quarter PO: Purchase Order, BTO: Build to Order

© 2021 Renesas Electronics Corporation. All rights reserved. Page 17
0
50
100
150
200
250
300
350
400
450
1Q 2Q 3Q 4Q 1Q 2Q 3Q 4Q
Others The largest customer Licensed main PMIC
(REF) DIALOG QUARTERLY REVENUE TRENDS
248
302
386
2020 2021
361
439
366
318
($m)
Forecast

© 2021 Renesas Electronics Corporation. All rights reserved. Page 18
APPENDIX
The figures in this section are mainly based on segment disclosure and GAAP (IFRS) stated on afinancial reporting basis and are provided as additional information.

© 2021 Renesas Electronics Corporation. All rights reserved. Page 19
REVENUE AND GROSS PROFIT BY SEGMENT NON-GAAP*1
*1: Non-GAAP figures are calculated by removing or adjusting non-recurring items and other adjustments from GAAP (IFRS based) figures following a certain set of rules. The Group believes non-GAAP measures provide useful information in understanding and evaluating the Group’s constant business results, and therefore results are provided in non-GAAP base. This adjustment and exclusion include the amortization of intangible assets recognized from acquisitions, other PPA(purchase price allocation) adjustments relating to acquisitions, stock-based compensation, as well as other non-recurring expenses and income the Group believes to be applicable. However, the figure provided as revenue is based on IFRS and does not include non-GAAP adjustments
*2: Adjustments include deductions or adjustments of non-recurring items or other specified adjustments, allocated in the reportable segments
(B yen)2020 2021
1Q(Jan-Mar)
2Q (Apr-Jun)
3Q (Jul-Sep)
4Q (Oct-Dec)
1Q(Jan-Mar)
2Q(Apr-Jun)
3Q(Jul-Sep) YoY QoQ 9 months
(Jan-Sep) YoY
Revenue 178.7 166.7 178.7 191.6 203.7 217.9 258.4 +44.6% +18.6% 680.0 +29.7%
Automotive 93.5 72.6 79.6 95.3 103.2 106.1 121.3 +52.5% +14.3% 330.7 +34.6%
Industrial, Infrastructure,IoT 82.6 91.6 96.7 92.8 96.6 106.9 132.6 +37.2% +24.1% 336.1 +24.1%
Others 2.6 2.5 2.5 3.5 3.8 4.9 4.5 +83.6% -7.7% 13.2 +74.5%
Gross Profit(Margin)
84.5(47.3%)
79.2(47.5%)
84.9(47.5%)
90.1(47.0%)
102.2(50.2%)
113.3(52.0%)
142.7(55.2%)
+57.8(+7.7pts)
+29.4(+3.2pts)
358.2(52.7%)
+109.6(+5.2pts)
Automotive 36.3(38.8%)
26.3(36.2%)
29.7(37.4%)
36.1(37.9%)
43.8(42.4%)
46.5(43.8%)
59.6(49.2%)
+29.9(+11.8pts)
+13.2(+5.4pts)
149.9(45.3%)
+57.5(+7.7pts)
Industrial, Infrastructure,IoT
47.9(58.0%)
52.5(57.3%)
55.0(56.9%)
53.7(57.9%)
57.8(59.8%)
66.0(61.8%)
82.4(62.1%)
+27.4(+5.2pts)
+16.4(+0.4pt)
206.2(61.4%)
+50.8(+4.0pts)
Others 0.3(10.1%)
0.4(15.5%)
0.2(6.6%)
0.3(8.9%)
0.4(10.8%)
0.7(13.7%)
0.6(13.2%)
+0.4(+6.6pts)
-0.1(-0.6pt)
1.7(12.7%)
+0.9(+2.0pts)
Adjustments*2 - - - - 0.2 0.1 0.1 +0.1 -0.0 0.4 +0.4

© 2021 Renesas Electronics Corporation. All rights reserved. Page 20
OPERATING PROFIT AND EBITDA*1 BY SEGMENTNON-GAAP*2
(B yen)2020 2021
1Q(Jan-Mar)
2Q (Apr-Jun)
3Q (Jul-Sep)
4Q (Oct-Dec)
1Q(Jan-Mar)
2Q(Apr-Jun)
3Q(Jul-Sep) YoY QoQ 9 months
(Jan-Sep) YoY
Operating Profit/Loss(Margin)
33.7(18.8%)
30.2(18.1%)
36.5(20.4%)
37.2(19.4%)
52.6(25.8%)
61.4(28.2%)
83.9(32.5%)
+47.4(+12.0pts)
+22.5(+4.3pts)
197.9(29.1%)
+97.5(+9.9pts)
Automotive 14.4(15.4%)
7.9(10.8%)
10.7(13.5%)
15.4(16.2%)
22.8(22.1%)
25.1(23.6%)
35.5(29.2%)
+24.7(+15.8pts)
+10.4(+5.6pts)
83.3(25.2%)
+50.3(+11.8pts)
Industrial, Infrastructure,IoT
19.0(23.0%)
24.2(26.5%)
25.1(26.0%)
21.4(23.0%)
24.9(25.8%)
34.6(32.4%)
47.5(35.8%)
+22.4(+9.8pts)
+12.9(+3.4pts)
107.0(31.8%)
+38.6(+6.6pts)
Others 0.3(11.4%)
0.4(17.7%)
0.1(5.6%)
0.3(8.5%)
0.4(10.8%)
0.7(13.8%)
0.6(13.1%)
+0.5(+7.5pts)
-0.1(-0.6pt)
1.7(12.7%)
+0.8(+1.1pts)
Adjustments*3 - -2.3 0.5 0.1 4.5 1.1 0.3 -0.2 -0.7 5.9 +7.7
EBITDA 57.6 50.8 57.3 57.5 71.8 80.6 103.6 +46.4 +23.1 256.0 +90.2
Automotive 28.2 18.2 21.6 26.5 33.9 36.0 46.3 +24.7 +10.3 116.2 +48.3
Industrial, Infrastructure,IoT 28.9 34.5 35.1 30.5 33.0 42.8 56.4 +21.3 +13.6 132.1 +33.7
Others 0.5 0.4 0.1 0.3 0.4 0.7 0.6 +0.5 -0.1 1.7 +0.6
Adjustments*3 - -2.3 0.5 0.1 4.5 1.1 0.3 -0.2 -0.7 5.9 +7.7
*1: Operating profit + Depreciation and amortization *2: Non-GAAP figures are calculated by removing or adjusting non-recurring items and other adjustments from GAAP (IFRS based) figures following a certain set of rules. The Group believes non-GAAP measures provide useful information in
understanding and evaluating the Group’s constant business results, and therefore results are provided in non-GAAP base. This adjustment and exclusion include the amortization of intangible assets recognized from acquisitions, other PPA(purchase price allocation) adjustments relating to acquisitions, stock-based compensation, as well as other non-recurring expenses and income the Group believes to be applicable
*3: Adjustments include deductions or adjustments of non-recurring items or other specified adjustments, allocated in the reportable segments

© 2021 Renesas Electronics Corporation. All rights reserved. Page 21
STATEMENT OF FINANCIAL POSITIONGAAP
*1: This is comprised of cash on hand, demand deposit, and short-term investments that are readily convertible into cash, bearing low risk of changes in value and are redeemable in three months or less from each acquisition date*2: Borrowings (current and non-current liabilities) + Lease Liabilities (current liabilities) + Lease Liabilities (non-current liabilities) + Bonds *3: Interest-Bearing Liabilities / Equity attributable to owners of parent *4: (Interest-Bearing Liabilities - Cash and Cash Equivalents) / Equity attributable to owners of parent *5: Equity attributable to owners of parent / Total liabilities and equity *6: Interest-Bearing Liabilities / EBITDA (Non-GAAP) *7: (Interest-Bearing Liabilities-Cash and Cash Equivalents) / EBIDTA (Non-GAAP)
(B yen) 20/3 20/6 20/9 20/12 21/3 21/6 21/9
Total Assets 1,657.8 1,634.5 1,620.4 1,609.0 1,688.1 1,942.7 2,328.0Cash and Cash Equivalents*1 136.9 148.5 175.9 219.8 243.6 504.8 223.0Inventories 95.7 101.8 96.9 89.8 86.6 94.4 135.2Goodwill 620.9 614.6 603.6 590.5 631.6 630.9 1,167.7Intangible Assets 430.3 409.8 386.7 364.8 369.7 351.9 379.0
Total Liabilities 1,030.5 1,005.1 988.3 989.3 966.9 966.9 1,280.8Interest-Bearing Liabilities*2 764.2 740.2 717.1 693.7 671.1 647.7 897.6
Total Equity 627.3 629.4 632.2 619.7 721.1 975.8 1,047.1
D/E Ratio (Gross)*3 1.22 1.18 1.14 1.12 0.93 0.67 0.86
D/E Ratio (Net)*4 1.00 0.94 0.86 0.77 0.60 0.15 0.65
Equity Ratio Attributable to Owners of Parent*5 37.7% 38.3% 38.8% 38.3% 42.5% 50.1% 44.8%
Leverage Ratio (Gross)*6 3.5 3.4 3.2 3.1 2.8 2.4 2.9
Leverage Ratio (Net)*7 2.9 2.7 2.4 2.1 1.8 0.5 2.2

© 2021 Renesas Electronics Corporation. All rights reserved. Page 22
GAAP / NON-GAAP RECONCILIATION Non-GAAP Basis: Non-GAAP figures are calculated by adjusting or removing non-recurring items and other adjustments from GAAP figures following a certain set of rules. The
Group believe non-GAAP measures provide useful information in understanding and evaluating the Group’s constant business results, and therefore results are provided in non-GAAP base. This adjustment and exclusion include the amortization of intangible assets recognized from acquisitions, other PPA (purchase price allocation) adjustments relating to acquisitions, stock-based compensation, as well as other non-recurring expenses and income the Group believes to be applicable. However, the figure provided as revenue is based on IFRS and does not include non-GAAP adjustments.
PPA (purchase price allocation) effects include market valuations of inventories and property, plant and equipment, etc.
*1: Cost of goods sold *2: Adjustments to equalize period expenses such as taxes *3: Include non-recurring profit or loss above a certain amount such as acquisition related costs and costs related to offering
(B yen)2020 2021
1Q 2Q 3Q 4Q 1Q 2Q 3QRevenue 178.7 166.7 178.7 191.6 203.7 217.9 258.4Gross Profit (GAAP/ After PPA) 82.3 79.1 84.4 89.9 97.8 104.9 135.0
PPA Effects (Depreciation of Property, Plant and Equipment: COGS*1) +0.6 +0.3 +0.3 +0.3 +0.3 +0.2 +0.2
PPA Effects (Amortization of Intangible Assets: COGS) - - - - - - -PPA Effects (Market Valuation of Inventories: COGS) - - - - - - +3.9PPA Effects (Others: COGS) - - - - - - -Stock-Based Compensation (COGS) +0.3 +0.1 +0.5 +0.3 +0.3 +0.4 +0.3Other Adjustments*2 (COGS) +1.3 -0.4 -0.4 -0.4 +1.2 -0.4 -0.4Other Non-recurring Adjustments*3 (COGS) - +0.1 +0.1 +0.1 +2.7 +8.2 +3.7
Gross Profit (Non-GAAP) 84.5 79.2 84.9 90.1 102.2 113.3 142.7Gross Margin (Non-GAAP) (%) 47.3% 47.5% 47.5% 47.0% 50.2% 52.0% 55.2%

© 2021 Renesas Electronics Corporation. All rights reserved. Page 23
GAAP / NON-GAAP*1 RECONCILIATION
*1: Non-GAAP figures are calculated by removing or adjusting non-recurring items and other adjustments from GAAP (IFRS based) figures following a certain set of rules. The Group believes non-GAAP measures provide useful information in understanding and evaluating the Group’s constant business results, and therefore results are provided in non-GAAP base. This adjustment and exclusion include the amortization of intangible assets recognized from acquisitions, other PPA(purchase price allocation) adjustments relating to acquisitions, stock-based compensation, as well as other non-recurring expenses and income the Group believes to be applicable
*2: PPA (purchase price allocation) effects include market valuations of inventories and property, plant and equipment *3: Selling, general and administrative expenses *4: Research & development expenses *5: Include adjustments to equalize period expenses such as taxes *6: Include non-recurring profit or loss above a certain amount such as acquisition related costs and costs related to offering
(B yen)2020 2021
1Q 2Q 3Q 4Q 1Q 2Q 3QOperating Profit/Loss (GAAP/After PPA) 13.3 17.3 17.2 17.3 30.2 35.5 53.8
Reconciliation in Gross Profit Level +2.2 +0.1 +0.5 +0.2 +4.5 +8.3 +7.7PPA Effects*2 (Amortization of Intangible Assets: SG&A*3) +14.2 +13.2 +13.2 +13.0 +12.9 +13.9 +14.3
PPA Effects (Depreciation of Property, Plant and Equipment: R&D*4) +0.1 +0.1 +0.1 +0.1 +0.0 +0.0 +0.0
PPA Effects (Depreciation of Property, Plant and Equipment: SG&A) +0.0 +0.0 +0.0 +0.0 +0.0 +0.0 +0.0
PPA Effects (Amortization of Intangible Assets, Others: R&D) - - - - - - +0.1PPA Effects (Others: SG&A) - - - - - - +0.0Stock-Based Compensation (R&D) +1.9 +0.9 +2.4 +1.2 +1.2 +1.6 +1.6Stock-Based Compensation (SG&A) +1.7 +0.7 +3.0 +1.4 +1.5 +1.9 +1.6Other Adjustments*5 (R&D) +0.1 -0.0 -0.0 -0.0 +0.1 -0.0 -0.0Other Adjustments*5 (SG&A) -0.4 -0.6 -0.6 +1.5 -0.1 -0.2 -0.2Other Non-Recurring Adjustments*6 (R&D) - +0.0 +0.0 +0.0 +0.0 +0.0 -Other Non-Recurring Adjustments*6 (SG&A, Others) +0.6 -1.5 +0.5 +2.4 +2.2 +0.5 +4.9
Operating Profit/Loss (Non-GAAP) 33.7 30.2 36.5 37.2 52.6 61.4 83.9
Operating Margin (Non-GAAP) (%) 18.8% 18.1% 20.4% 19.4% 25.8% 28.2% 32.5%

© 2021 Renesas Electronics Corporation. All rights reserved. Page 24
(B yen)2020 2021
1Q 2Q 3Q 4Q 1Q 2Q 3Q
Profit/Loss Attributable to Owners of Parent (GAAP/After PPA*2) 11.3 11.9 15.3 7.2 13.7 24.0 37.8
Reconciliations in Operating Profit/Loss Level +20.4 +13.0 +19.2 +19.8 +22.4 +25.9 +30.0
Reconciliations in Net Profit/Loss (Tax Impacts from Non-GAAP Adjustments) -1.7 -1.2 -0.9 -2.8 -3.5 -4.1 -4.9
Profit/loss Attributable to Owners of Parent, etc. (Non-GAAP) 29.9 23.7 33.6 24.2 32.6 45.8 62.9
Non-GAAP EPS*3 (yen) 17.5 13.8 19.5 14.0 18.8 25.9 32.5
GAAP / NON-GAAP*1 RECONCILIATION
*1: Non-GAAP figures are calculated by removing or adjusting non-recurring items and other adjustments from GAAP (IFRS based) figures following a certain set of rules. The Group believes non-GAAP measures provide useful information in understanding and evaluating the Group’s constant business results, and therefore results are provided in non-GAAP base. This adjustment and exclusion include the amortization of intangible assets recognized from acquisitions, other PPA (purchase price allocation) adjustments relating to acquisitions, stock-based compensation, as well as other non-recurring expenses and income the Group believes to be applicable
*2: PPA (purchase price allocation) effects include market valuations of inventories and property, plant and equipment *3: Earnings per share

© 2021 Renesas Electronics Corporation. All rights reserved. Page 25
3Q 2021 FINANCIAL SNAPSHOT GAAP
*1: Operating profit + Depreciation and amortization
(B yen)
2020 2021
3Q(Jul-Sep)
9 months(Jan-Sep)
2Q(Apr-Jun)
3Q(Jul-Sep) YoY QoQ 9 months
(Jan-Sep) YoY
Revenue 178.7 524.1 217.9 258.4 +44.6% +18.6% 680.0 +29.7%
Gross Margin 47.2% 46.9% 48.2% 52.2% +5.0pts +4.1pts 49.7% +2.8pts
Operating Profit/loss(Margin)
17.2(9.7%)
47.8(9.1%)
35.5(16.3%)
53.8(20.8%)
+36.6(+11.2pts)
+18.4(+4.5pts)
119.5(17.6%)
+71.7(+8.4pts)
Profit/loss Attributable to Owners of Parent 15.3 38.5 24.0 37.8 +22.5 +13.8 75.5 +37.0
EBITDA*1 51.8 155.5 68.7 88.2 +36.4 +19.5 219.6 +64.1
1 US$= 107 yen 108 yen 109 yen 110 yen 3 yendepreciation
1 yendepreciation 108 yen 0 yen
appreciation
1 Euro= 123 yen 121 yen 131 yen 131 yen 8 yendepreciation
0 yenappreciation 129 yen 9 yen
depreciation
YoY and QoQ results of the revenue are rounded off to one decimal place.

© 2021 Renesas Electronics Corporation. All rights reserved. Page 26
2.2% 2.5% 2.9% 3.2% 3.5% 2.4% 2.6% 3.8%
13.8%10.3%
8.2%
0.0%
10.0%
20.0%
30.0%
0.0
10.0
20.0
30.0
40.0
1Q 2Q 3Q 4Q 1Q 2Q 3Q 4Q 1Q 2Q 3Q 4QForecast
Capital Masks and Tools Sales Ratio
CAPITAL EXPENDITURES*1*2
*1: The figures are investment decision basis of tangible and intangible assets and do not match the sum listed in the cash flow statement. However, the investment amount for former IDT and Dialog are based on equipment delivery*2: The total amount of the Group’s capital investment, including former IDT investments from 2Q 2019 and Dialog investments from 3Q 2021*3: The fire which occurred at a Renesas subsidiary on March 19, 2021
(B yen)
3.3 4.9 5.3 6.1 6.33.9
4.67.4
28.1
2019 2020 2021
22.5
6.80.8
Fire*3 Recovery Response
11.2
21.2

© 2021 Renesas Electronics Corporation. All rights reserved. Page 27
MAJOR ANNOUNCEMENTS FROM 3Q
Renesas’ R-Car SoCs adopted in Toyota’s next-generation multimedia system for LEXUS NX Unveiled an Automotive Gateway Solution based on new R-Car S4 SoCs and best-in-class
PMICs for next-generation vehicle computers Introduced the industry’s highest performance entry-line RA6EI Group of MCUs Released R-Car Software Development Kit for accelerated deep learning development for
ADAS and automated driving applications Launched 32-Bit RX671 MCUs realizing high performance and power efficiency with HMI
functions for contactless operation Announced more than 35 Winning Combinations featuring both Dialog and Renesas
products Released Quick Connect IoT, a New Modular IoT development platform dramatically
reducing time-to-market and design complexity
New Products and Solutions, Adaptations and Design-ins
Announced completed acquisition of Dialog Semiconductor
Corporate Actions

© 2021 Renesas Electronics Corporation. All rights reserved. Page 28
ACQUISITION OF CELENO
Expand Connectivity Portfolio Build on expanded connectivity portfolio following the Dialog
acquisition with the addition of Celeno’s industry’s smallest Wi-Fi 6/6E chipset offerings
Provide Comprehensive, End-to-End Embedded Solutions for the Fast-Growing Markets Deliver end-to-end connectivity solutions for both client devices and
access points for the fast-growing markets in IoT, Infrastructure, Industrial and automotive applications
Increase Renesas’ engineering and design scale Gain R&D capabilities in Israel and more
Expected Synergies Sales increase by cross-selling and access to the fast-growing markets Cost reduction due to operational efficiency
Business Development and sale of Wi-Fichipsets and other connectivity devices
Financial Results(M$、consolidated)
Revenue
Op. Profit
Net Profit
Overview of Celeno
Closing
TotalTransaction Value
Source of Financing
$ 315M
Cash-on-hand
By the end of calendar year 2021
Acquisition Summary
Rationale
2019
22.7
- 12.8
- 13.3
2020
37.0
- 8.6
- 9.0
© 2021 Renesas Electronics Corporation. All rights reserved.
Renesas.com
(FORWARD-LOOKING STATEMENTS)
The statements in this presentation with respect to the plans, strategies and forecasts of Renesas Electronics and itsconsolidated subsidiaries (collectively “we”) are forward-looking statements involving risks and uncertainties. Such forward looking statements do not represent any guarantee by management of future performance. In many cases, but not all, we use such words as “aim,” “anticipate,” “believe,” “continue,” “endeavor,” “estimate,” “expect,” “initiative,” “intend,” “may,” “plan,” “potential,” “probability,” “project,” “risk,” “seek,” “should,” “strive,” “target,” “will” and similar expressions to identify forward looking statements. You can also identify forward-looking statements by discussions of strategy, plans or intentions. These statements discuss future expectations, identify strategies, contain projections of our results of operations or financialcondition, or state other forward-looking information based on our current expectations, assumptions, estimates andprojections about our business and industry, our future business strategies and the environment in which we will operate inthe future. Known and unknown risks, uncertainties and other factors could cause our actual results, performance orachievements to differ materially from those contained or implied in any forward-looking statement, including, but not limitedto: general economic conditions in our markets, which are primarily Japan, North America, Asia and Europe; demand for, andcompetitive pricing pressure on, our products and services in the marketplace; our ability to continue to win acceptance of itsproducts and services in these highly competitive markets; and movements in currency exchange rates, particularly the ratebetween the yen and the U.S. dollar. Among other factors, a worsening of the world economy, a worsening of financialconditions in the world markets, and a deterioration in the domestic and overseas stock markets, would cause actual resultsto differ from the projected results forecast.
This presentation is based on the economic, regulatory, market and other conditions as in effect on the date hereof. It shouldbe understood that subsequent developments may affect the information contained in this presentation, which neither we norour advisors or representatives are under an obligation to update, revise or affirm.