2020 semi-annual report (unaudited) - ishares
TRANSCRIPT

2020 Semi-Annual Report(Unaudited)
iShares Trust
• iShares India 50 ETF | INDY | NASDAQ
Beginning on January 1, 2021, as permitted by regulations adopted by the Securities and Exchange Commission, paper copies of the
Fund’s shareholder reports will no longer be sent by mail, unless you specifically request paper copies of the reports from your
financial intermediary, such as a broker-dealer or bank. Instead, the reports will be made available on a website, and you will be
notified by mail each time a report is posted and provided with a website link to access the report.
You may elect to receive all future reports in paper free of charge. If you hold accounts through a financial intermediary, you can follow
the instructions included with this disclosure, if applicable, or contact your financial intermediary to request that you continue to
receive paper copies of your shareholder reports. Please note that not all financial intermediaries may offer this service. Your election
to receive reports in paper will apply to all funds held with your financial intermediary.
If you already elected to receive shareholder reports electronically, you will not be affected by this change and you need not take any
action. You may elect to receive electronic delivery of shareholder reports and other communications by contacting your financial
intermediary. Please note that not all financial intermediaries may offer this service.
SEPTEMBER 30, 2020
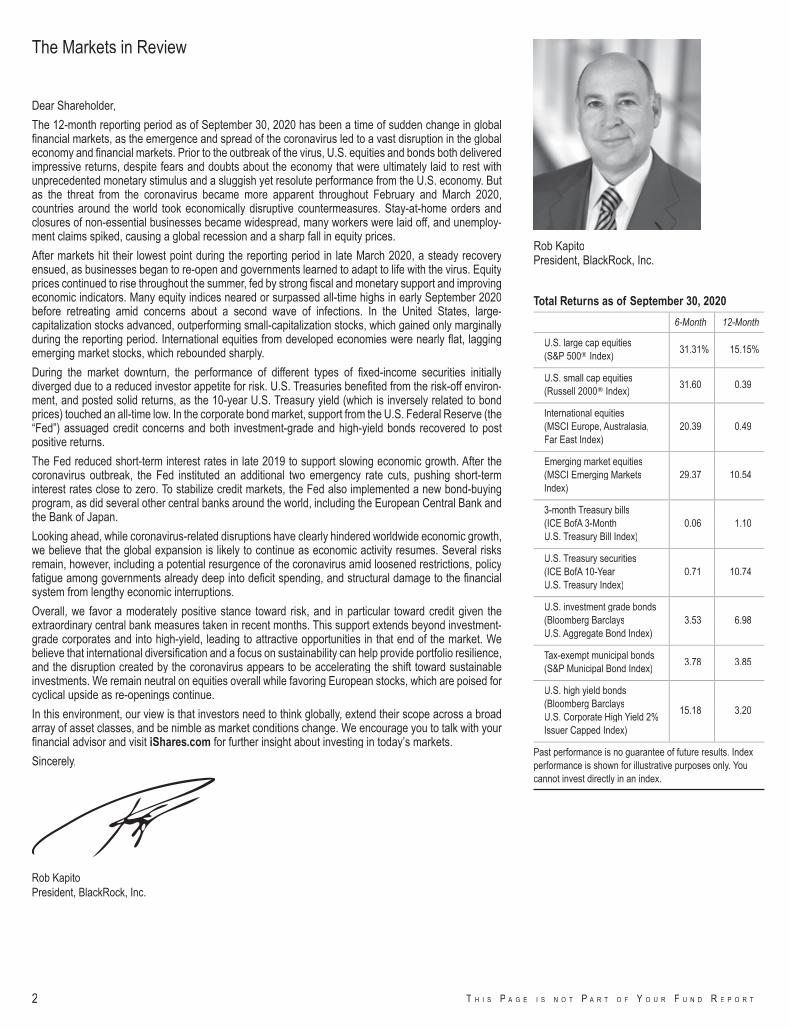
Dear Shareholder,
The 12-month reporting period as of September 30, 2020 has been a time of sudden change in globalfinancial markets, as the emergence and spread of the coronavirus led to a vast disruption in the globaleconomy and financial markets. Prior to the outbreak of the virus, U.S. equities and bonds both deliveredimpressive returns, despite fears and doubts about the economy that were ultimately laid to rest withunprecedented monetary stimulus and a sluggish yet resolute performance from the U.S. economy. Butas the threat from the coronavirus became more apparent throughout February and March 2020,countries around the world took economically disruptive countermeasures. Stay-at-home orders andclosures of non-essential businesses became widespread, many workers were laid off, and unemploy-ment claims spiked, causing a global recession and a sharp fall in equity prices.
After markets hit their lowest point during the reporting period in late March 2020, a steady recoveryensued, as businesses began to re-open and governments learned to adapt to life with the virus. Equityprices continued to rise throughout the summer, fed by strong fiscal and monetary support and improvingeconomic indicators. Many equity indices neared or surpassed all-time highs in early September 2020before retreating amid concerns about a second wave of infections. In the United States, large-capitalization stocks advanced, outperforming small-capitalization stocks, which gained only marginallyduring the reporting period. International equities from developed economies were nearly flat, laggingemerging market stocks, which rebounded sharply.
During the market downturn, the performance of different types of fixed-income securities initiallydiverged due to a reduced investor appetite for risk. U.S. Treasuries benefited from the risk-off environ-ment, and posted solid returns, as the 10-year U.S. Treasury yield (which is inversely related to bondprices) touched an all-time low. In the corporate bond market, support from the U.S. Federal Reserve (the“Fed”) assuaged credit concerns and both investment-grade and high-yield bonds recovered to postpositive returns.
The Fed reduced short-term interest rates in late 2019 to support slowing economic growth. After thecoronavirus outbreak, the Fed instituted an additional two emergency rate cuts, pushing short-terminterest rates close to zero. To stabilize credit markets, the Fed also implemented a new bond-buyingprogram, as did several other central banks around the world, including the European Central Bank andthe Bank of Japan.
Looking ahead, while coronavirus-related disruptions have clearly hindered worldwide economic growth,we believe that the global expansion is likely to continue as economic activity resumes. Several risksremain, however, including a potential resurgence of the coronavirus amid loosened restrictions, policyfatigue among governments already deep into deficit spending, and structural damage to the financialsystem from lengthy economic interruptions.
Overall, we favor a moderately positive stance toward risk, and in particular toward credit given theextraordinary central bank measures taken in recent months. This support extends beyond investment-grade corporates and into high-yield, leading to attractive opportunities in that end of the market. Webelieve that international diversification and a focus on sustainability can help provide portfolio resilience,and the disruption created by the coronavirus appears to be accelerating the shift toward sustainableinvestments. We remain neutral on equities overall while favoring European stocks, which are poised forcyclical upside as re-openings continue.
In this environment, our view is that investors need to think globally, extend their scope across a broadarray of asset classes, and be nimble as market conditions change. We encourage you to talk with yourfinancial advisor and visit iShares.com for further insight about investing in today’s markets.
Sincerely,
Rob KapitoPresident, BlackRock, Inc.
Total Returns as of September 30, 2020
6-Month 12-Month
U.S. large cap equities(S&P 500� Index)
31.31% 15.15%
U.S. small cap equities(Russell 2000� Index)
31.60 0.39
International equities(MSCI Europe, Australasia,Far East Index)
20.39 0.49
Emerging market equities(MSCI Emerging MarketsIndex)
29.37 10.54
3-month Treasury bills(ICE BofA 3-MonthU.S. Treasury Bill Index)
0.06 1.10
U.S. Treasury securities(ICE BofA 10-YearU.S. Treasury Index)
0.71 10.74
U.S. investment grade bonds(Bloomberg BarclaysU.S. Aggregate Bond Index)
3.53 6.98
Tax-exempt municipal bonds(S&P Municipal Bond Index)
3.78 3.85
U.S. high yield bonds(Bloomberg BarclaysU.S. Corporate High Yield 2%Issuer Capped Index)
15.18 3.20
Past performance is no guarantee of future results. Indexperformance is shown for illustrative purposes only. Youcannot invest directly in an index.
The Markets in Review
Rob KapitoPresident, BlackRock, Inc.
2 T H I S P A G E I S N O T P A R T O F Y O U R F U N D R E P O R T
Page
The Markets in Review. . . . . . . . . . . . . . . . . . . . . . . . . . . . . . . . . . . . . . . . . . . . . . . . . . . . . . . . . . . . . . . . . . . . . . . . . . . . . . . . . . . . . . . . . . . . . . . . . . . . . . . . . . . . . . . . . . . . . . . . . . . . . . . . . . . . . . . . . . . . . . . . . . . . . . . 2Fund Summary . . . . . . . . . . . . . . . . . . . . . . . . . . . . . . . . . . . . . . . . . . . . . . . . . . . . . . . . . . . . . . . . . . . . . . . . . . . . . . . . . . . . . . . . . . . . . . . . . . . . . . . . . . . . . . . . . . . . . . . . . . . . . . . . . . . . . . . . . . . . . . . . . . . . . . . . . . . . . . 4About Fund Performance . . . . . . . . . . . . . . . . . . . . . . . . . . . . . . . . . . . . . . . . . . . . . . . . . . . . . . . . . . . . . . . . . . . . . . . . . . . . . . . . . . . . . . . . . . . . . . . . . . . . . . . . . . . . . . . . . . . . . . . . . . . . . . . . . . . . . . . . . . . . . . . . . . . . 5Shareholder Expenses. . . . . . . . . . . . . . . . . . . . . . . . . . . . . . . . . . . . . . . . . . . . . . . . . . . . . . . . . . . . . . . . . . . . . . . . . . . . . . . . . . . . . . . . . . . . . . . . . . . . . . . . . . . . . . . . . . . . . . . . . . . . . . . . . . . . . . . . . . . . . . . . . . . . . . . 5Consolidated Schedule of Investments . . . . . . . . . . . . . . . . . . . . . . . . . . . . . . . . . . . . . . . . . . . . . . . . . . . . . . . . . . . . . . . . . . . . . . . . . . . . . . . . . . . . . . . . . . . . . . . . . . . . . . . . . . . . . . . . . . . . . . . . . . . . . . . . . . . . . . . 6Consolidated Financial Statements
Consolidated Statement of Assets and Liabilities . . . . . . . . . . . . . . . . . . . . . . . . . . . . . . . . . . . . . . . . . . . . . . . . . . . . . . . . . . . . . . . . . . . . . . . . . . . . . . . . . . . . . . . . . . . . . . . . . . . . . . . . . . . . . . . . . . . . . . . . . . . 9Consolidated Statement of Operations . . . . . . . . . . . . . . . . . . . . . . . . . . . . . . . . . . . . . . . . . . . . . . . . . . . . . . . . . . . . . . . . . . . . . . . . . . . . . . . . . . . . . . . . . . . . . . . . . . . . . . . . . . . . . . . . . . . . . . . . . . . . . . . . . . . . . 10Consolidated Statements of Changes in Net Assets. . . . . . . . . . . . . . . . . . . . . . . . . . . . . . . . . . . . . . . . . . . . . . . . . . . . . . . . . . . . . . . . . . . . . . . . . . . . . . . . . . . . . . . . . . . . . . . . . . . . . . . . . . . . . . . . . . . . . . . . . 11
Consolidated Financial Highlights . . . . . . . . . . . . . . . . . . . . . . . . . . . . . . . . . . . . . . . . . . . . . . . . . . . . . . . . . . . . . . . . . . . . . . . . . . . . . . . . . . . . . . . . . . . . . . . . . . . . . . . . . . . . . . . . . . . . . . . . . . . . . . . . . . . . . . . . . . . . 12Notes to Consolidated Financial Statements . . . . . . . . . . . . . . . . . . . . . . . . . . . . . . . . . . . . . . . . . . . . . . . . . . . . . . . . . . . . . . . . . . . . . . . . . . . . . . . . . . . . . . . . . . . . . . . . . . . . . . . . . . . . . . . . . . . . . . . . . . . . . . . . . . 13Board Review and Approval of Investment Advisory Contract . . . . . . . . . . . . . . . . . . . . . . . . . . . . . . . . . . . . . . . . . . . . . . . . . . . . . . . . . . . . . . . . . . . . . . . . . . . . . . . . . . . . . . . . . . . . . . . . . . . . . . . . . . . . . . . . . . 19Supplemental Information . . . . . . . . . . . . . . . . . . . . . . . . . . . . . . . . . . . . . . . . . . . . . . . . . . . . . . . . . . . . . . . . . . . . . . . . . . . . . . . . . . . . . . . . . . . . . . . . . . . . . . . . . . . . . . . . . . . . . . . . . . . . . . . . . . . . . . . . . . . . . . . . . . . . 21General Information . . . . . . . . . . . . . . . . . . . . . . . . . . . . . . . . . . . . . . . . . . . . . . . . . . . . . . . . . . . . . . . . . . . . . . . . . . . . . . . . . . . . . . . . . . . . . . . . . . . . . . . . . . . . . . . . . . . . . . . . . . . . . . . . . . . . . . . . . . . . . . . . . . . . . . . . . 22
Table of Contents

Investment Objective
The iShares India 50 ETF (the “Fund”) seeks to track the investment results of an index composed of 50 of the largest Indian equities, as represented by the Nifty 50 Index(the “Index”). The Fund invests in a representative sample of securities included in the Index that collectively has an investment profile similar to the Index. Due to the useof representative sampling, the Fund may or may not hold all of the securities that are included in the Index.
Performance
Average Annual Total Returns Cumulative Total Returns
6 Months 1 Year 5 Years 10 Years 1 Year 5 Years 10 Years
Fund NAV. . . . . . . . . . . . . . . . . . . . . . . . . . . . . . . . . . . . . . . . . . . . . . . . . . . . . . . . . . . . . . . . . . . . . . . . . . . . . 33.90% (5.41)% 5.03% 1.73% (5.41)% 27.81% 18.74%Fund Market . . . . . . . . . . . . . . . . . . . . . . . . . . . . . . . . . . . . . . . . . . . . . . . . . . . . . . . . . . . . . . . . . . . . . . . . . . 35.78 (4.84) 5.00 1.76 (4.84) 27.64 19.04Index . . . . . . . . . . . . . . . . . . . . . . . . . . . . . . . . . . . . . . . . . . . . . . . . . . . . . . . . . . . . . . . . . . . . . . . . . . . . . . . . . 34.81 (4.88) 6.06 2.53 (4.88) 34.23 28.33
Certain sectors and markets performed exceptionally well based on market conditions during the six months period. Achieving such exceptional returns involves the risk of volatility andinvestors should not expect that such exceptional returns will be repeated.
Index performance through April 2, 2017 is calculated using the INR-USD reference rate as published by the Reserve Bank of India. Index performance beginning on April 3, 2017 iscalculated using FX rates corresponding to World Market Reuters 4:00 P.M. London.
Past performance is no guarantee of future results. Performance results do not reflect the deduction of taxes that a shareholder would pay on fund distributions or on the redemptionor sale of fund shares. See “About Fund Performance” on page 5 for more information.
Expense Example
Actual Hypothetical 5% Return
BeginningAccount Value
(04/01/20)
EndingAccount Value
(09/30/20)
ExpensesPaid Duringthe Period (a)
BeginningAccount Value
(04/01/20)
EndingAccount Value
(09/30/20)
ExpensesPaid Duringthe Period (a)
AnnualizedExpense
Ratio
$ 1,000.00 $ 1,339.00 $ 5.39 $ 1,000.00 $ 1,020.50 $ 4.66 0.92%
(a) Expenses are calculated using the Fund’s annualized expense ratio (as disclosed in the table), multiplied by the average account value for the period, multiplied by the number ofdays in the period (183 days) and divided by the number of days in the year (365 days). Other fees, such as brokerage commissions and other fees to financial intermediaries, maybe paid which are not reflected in the tables and examples above. See “Shareholder Expenses” on page 5 for more information.
Portfolio Information
ALLOCATION BY SECTOR
SectorPercent of
Total Investments(a)
Financials . . . . . . . . . . . . . . . . . . . . . . . . . . . . . . . . . . . . . . . . . . . . . . . . . . 33.0%Energy . . . . . . . . . . . . . . . . . . . . . . . . . . . . . . . . . . . . . . . . . . . . . . . . . . . . . 17.0Information Technology . . . . . . . . . . . . . . . . . . . . . . . . . . . . . . . . . . . . . 16.9Consumer Staples . . . . . . . . . . . . . . . . . . . . . . . . . . . . . . . . . . . . . . . . . . 9.0Consumer Discretionary . . . . . . . . . . . . . . . . . . . . . . . . . . . . . . . . . . . . 6.9Materials . . . . . . . . . . . . . . . . . . . . . . . . . . . . . . . . . . . . . . . . . . . . . . . . . . . 6.2Health Care . . . . . . . . . . . . . . . . . . . . . . . . . . . . . . . . . . . . . . . . . . . . . . . . 4.0Industrials . . . . . . . . . . . . . . . . . . . . . . . . . . . . . . . . . . . . . . . . . . . . . . . . . . 2.8Communication Services. . . . . . . . . . . . . . . . . . . . . . . . . . . . . . . . . . . . 2.1Utilities . . . . . . . . . . . . . . . . . . . . . . . . . . . . . . . . . . . . . . . . . . . . . . . . . . . . . 2.1
TEN LARGEST HOLDINGS
SecurityPercent of
Total Investments(a)
Reliance Industries Ltd. . . . . . . . . . . . . . . . . . . . . . . . . . . . . . . . . . . . . 15.0%HDFC Bank Ltd. . . . . . . . . . . . . . . . . . . . . . . . . . . . . . . . . . . . . . . . . . . . 9.7Infosys Ltd. . . . . . . . . . . . . . . . . . . . . . . . . . . . . . . . . . . . . . . . . . . . . . . . . 7.6Housing Development Finance Corp. Ltd. . . . . . . . . . . . . . . . . . . . 6.5Tata Consultancy Services Ltd. . . . . . . . . . . . . . . . . . . . . . . . . . . . . . 5.4ICICI Bank Ltd. . . . . . . . . . . . . . . . . . . . . . . . . . . . . . . . . . . . . . . . . . . . . 4.6Kotak Mahindra Bank Ltd. . . . . . . . . . . . . . . . . . . . . . . . . . . . . . . . . . . 3.8Hindustan Unilever Ltd. . . . . . . . . . . . . . . . . . . . . . . . . . . . . . . . . . . . . . 3.8ITC Ltd. . . . . . . . . . . . . . . . . . . . . . . . . . . . . . . . . . . . . . . . . . . . . . . . . . . . 3.1Larsen & Toubro Ltd. . . . . . . . . . . . . . . . . . . . . . . . . . . . . . . . . . . . . . . . 2.3
(a) Excludes money market funds.
Fund Summary as of September 30, 2020 iShares� India 50 ETF
F U N D S U M M A R Y 4

Past performance is not an indication of future results. Financial markets have experienced extreme volatility and trading in many instruments has been disrupted. Thesecircumstances may continue for an extended period of time and may continue to affect adversely the value and liquidity of the fund's investments. As a result, currentperformance may be lower or higher than the performance data quoted. Performance data current to the most recent month-end is available at iShares.com. Performanceresults assume reinvestment of all dividends and capital gain distributions and do not reflect the deduction of taxes that a shareholder would pay on fund distributions oron the redemption or sale of fund shares. The investment return and principal value of shares will vary with changes in market conditions. Shares may be worth more orless than their original cost when they are redeemed or sold in the market. Performance for certain funds may reflect a waiver of a portion of investment advisory fees.Without such a waiver, performance would have been lower.
Net asset value or “NAV” is the value of one share of a fund as calculated in accordance with the standard formula for valuing mutual fund shares. The price used to calculatemarket return (“Market Price”) is determined by using the midpoint between the highest bid and the lowest ask on the primary stock exchange on which shares of a fundare listed for trading, as of the time that such fund’s NAV is calculated. Market and NAV returns assume that dividends and capital gain distributions have been reinvestedat Market Price and NAV, respectively.
An index is a statistical composite that tracks a specified financial market or sector. Unlike a fund, an index does not actually hold a portfolio of securities and therefore doesnot incur the expenses incurred by a fund. These expenses negatively impact fund performance. Also, market returns do not include brokerage commissions that may bepayable on secondary market transactions. If brokerage commissions were included, market returns would be lower.
Shareholder Expenses
As a shareholder of your Fund, you incur two types of costs: (1) transaction costs, including brokerage commissions on purchases and sales of fund shares and (2) ongoingcosts, including management fees and other fund expenses. The expense example, which is based on an investment of $1,000 invested at the beginning of the period (orfrom the commencement of operations if less than 6 months) and held through the end of the period, is intended to help you understand your ongoing costs (in dollars andcents) of investing in your Fund and to compare these costs with the ongoing costs of investing in other funds.
Actual Expenses – The table provides information about actual account values and actual expenses. Annualized expense ratios reflect contractual and voluntary feewaivers, if any. To estimate the expenses that you paid on your account over the period, simply divide your account value by $1,000 (for example, an $8,600 account valuedivided by $1,000 = 8.6), then multiply the result by the number under the heading entitled “Expenses Paid During the Period.”
Hypothetical Example for Comparison Purposes – The table also provides information about hypothetical account values and hypothetical expenses based on yourFund’s actual expense ratio and an assumed rate of return of 5% per year before expenses. You may use this information to compare the ongoing costs of investing in yourFund and other funds. To do so, compare this 5% hypothetical example with the 5% hypothetical examples that appear in the shareholder reports of the other funds.
Please note that the expenses shown in the table are meant to highlight your ongoing costs only and do not reflect any transactional costs, such as brokerage commissionsand other fees paid on purchases and sales of fund shares. Therefore, the hypothetical examples are useful in comparing ongoing costs only and will not help you determinethe relative total costs of owning different funds. In addition, if these transactional costs were included, your costs would have been higher.
About Fund Performance
5 2 0 2 0 I S H A R E S S E M I - A N N U A L R E P O R T T O S H A R E H O L D E R S

Security Shares Value
Common StocksAutomobiles — 5.8%Bajaj Auto Ltd. . . . . . . . . . . . . . . . . . . . . . . . . . . . . . . . . . . . . . . . . . . . . 116,007 $ 4,530,059Eicher Motors Ltd. . . . . . . . . . . . . . . . . . . . . . . . . . . . . . . . . . . . . . . . . 124,138 3,706,305Hero MotoCorp Ltd. . . . . . . . . . . . . . . . . . . . . . . . . . . . . . . . . . . . . . . . 115,671 4,934,282Mahindra & Mahindra Ltd. . . . . . . . . . . . . . . . . . . . . . . . . . . . . . . . . . 852,808 7,026,592Maruti Suzuki India Ltd. . . . . . . . . . . . . . . . . . . . . . . . . . . . . . . . . . . . 118,413 10,822,881Tata Motors Ltd.(a) . . . . . . . . . . . . . . . . . . . . . . . . . . . . . . . . . . . . . . . . 1,596,149 2,883,799
33,903,918Banks — 22.3%Axis Bank Ltd.(a) . . . . . . . . . . . . . . . . . . . . . . . . . . . . . . . . . . . . . . . . . . 2,208,209 12,709,622HDFC Bank Ltd.(a) . . . . . . . . . . . . . . . . . . . . . . . . . . . . . . . . . . . . . . . . 3,873,089 56,621,222ICICI Bank Ltd.(a) . . . . . . . . . . . . . . . . . . . . . . . . . . . . . . . . . . . . . . . . . 5,522,454 26,553,138IndusInd Bank Ltd.(a) . . . . . . . . . . . . . . . . . . . . . . . . . . . . . . . . . . . . . . 505,343 3,612,333Kotak Mahindra Bank Ltd.(a) . . . . . . . . . . . . . . . . . . . . . . . . . . . . . . . 1,304,804 22,428,198State Bank of India(a). . . . . . . . . . . . . . . . . . . . . . . . . . . . . . . . . . . . . . 3,418,839 8,591,119Yes Bank Ltd., New(a) . . . . . . . . . . . . . . . . . . . . . . . . . . . . . . . . . . . . . 1,741,097 233,888Yes Bank Ltd.(a) . . . . . . . . . . . . . . . . . . . . . . . . . . . . . . . . . . . . . . . . . . . 46,465 8,282
130,757,802Chemicals — 2.4%Asian Paints Ltd. . . . . . . . . . . . . . . . . . . . . . . . . . . . . . . . . . . . . . . . . . . 401,634 10,813,307UPL Ltd.. . . . . . . . . . . . . . . . . . . . . . . . . . . . . . . . . . . . . . . . . . . . . . . . . . 490,089 3,340,550
14,153,857Construction & Engineering — 2.3%Larsen & Toubro Ltd. . . . . . . . . . . . . . . . . . . . . . . . . . . . . . . . . . . . . . . 1,088,224 13,298,221
Construction Materials — 2.1%Grasim Industries Ltd. . . . . . . . . . . . . . . . . . . . . . . . . . . . . . . . . . . . . . 351,684 3,547,347Shree Cement Ltd. . . . . . . . . . . . . . . . . . . . . . . . . . . . . . . . . . . . . . . . . 11,894 3,265,603UltraTech Cement Ltd. . . . . . . . . . . . . . . . . . . . . . . . . . . . . . . . . . . . . 102,854 5,645,329
12,458,279Consumer Finance — 1.8%Bajaj Finance Ltd.. . . . . . . . . . . . . . . . . . . . . . . . . . . . . . . . . . . . . . . . . 236,211 10,496,630
Electric Utilities — 0.9%Power Grid Corp. of India Ltd. . . . . . . . . . . . . . . . . . . . . . . . . . . . . . 2,283,764 5,028,429
Food Products — 2.1%Britannia Industries Ltd. . . . . . . . . . . . . . . . . . . . . . . . . . . . . . . . . . . . 105,089 5,409,918Nestle India Ltd. . . . . . . . . . . . . . . . . . . . . . . . . . . . . . . . . . . . . . . . . . . 31,784 6,857,663
12,267,581Gas Utilities — 0.3%GAIL India Ltd.. . . . . . . . . . . . . . . . . . . . . . . . . . . . . . . . . . . . . . . . . . . . 1,647,386 1,938,101
Household Products — 3.8%Hindustan Unilever Ltd. . . . . . . . . . . . . . . . . . . . . . . . . . . . . . . . . . . . 795,410 22,297,462
Independent Power and Renewable Electricity Producers — 0.8%NTPC Ltd. . . . . . . . . . . . . . . . . . . . . . . . . . . . . . . . . . . . . . . . . . . . . . . . . 4,319,300 4,982,006
Insurance — 2.3%Bajaj Finserv Ltd. . . . . . . . . . . . . . . . . . . . . . . . . . . . . . . . . . . . . . . . . . 53,877 4,273,612HDFC Life Insurance Co. Ltd.(a)(b) . . . . . . . . . . . . . . . . . . . . . . . . . 701,610 5,319,607SBI Life Insurance Co. Ltd.(a)(b) . . . . . . . . . . . . . . . . . . . . . . . . . . . . 347,464 3,821,492
13,414,711IT Services — 16.8%HCL Technologies Ltd. . . . . . . . . . . . . . . . . . . . . . . . . . . . . . . . . . . . . 967,026 10,637,548Infosys Ltd. . . . . . . . . . . . . . . . . . . . . . . . . . . . . . . . . . . . . . . . . . . . . . . . 3,263,379 44,596,122Tata Consultancy Services Ltd. . . . . . . . . . . . . . . . . . . . . . . . . . . . . 936,023 31,619,004Tech Mahindra Ltd.. . . . . . . . . . . . . . . . . . . . . . . . . . . . . . . . . . . . . . . . 551,011 5,913,025
Security Shares Value
IT Services (continued)Wipro Ltd. . . . . . . . . . . . . . . . . . . . . . . . . . . . . . . . . . . . . . . . . . . . . . . . . 1,323,648 $ 5,625,235
98,390,934Life Sciences Tools & Services — 0.8%Divi's Laboratories Ltd. . . . . . . . . . . . . . . . . . . . . . . . . . . . . . . . . . . . . 113,524 4,689,828
Metals & Mining — 1.6%Hindalco Industries Ltd. . . . . . . . . . . . . . . . . . . . . . . . . . . . . . . . . . . . 1,300,766 3,089,716JSW Steel Ltd.. . . . . . . . . . . . . . . . . . . . . . . . . . . . . . . . . . . . . . . . . . . . 882,921 3,323,818Tata Steel Ltd. . . . . . . . . . . . . . . . . . . . . . . . . . . . . . . . . . . . . . . . . . . . . 669,710 3,265,494
9,679,028Oil, Gas & Consumable Fuels — 16.9%Bharat Petroleum Corp. Ltd. . . . . . . . . . . . . . . . . . . . . . . . . . . . . . . . 715,045 3,421,614Coal India Ltd. . . . . . . . . . . . . . . . . . . . . . . . . . . . . . . . . . . . . . . . . . . . . 1,866,694 2,934,894Indian Oil Corp. Ltd.. . . . . . . . . . . . . . . . . . . . . . . . . . . . . . . . . . . . . . . 2,264,471 2,268,154Oil & Natural Gas Corp. Ltd. . . . . . . . . . . . . . . . . . . . . . . . . . . . . . . . 3,250,195 3,050,637Reliance Industries Ltd. . . . . . . . . . . . . . . . . . . . . . . . . . . . . . . . . . . . 2,880,316 87,227,352
98,902,651Pharmaceuticals — 3.2%Cipla Ltd. . . . . . . . . . . . . . . . . . . . . . . . . . . . . . . . . . . . . . . . . . . . . . . . . . 452,564 4,751,983Dr. Reddy's Laboratories Ltd. . . . . . . . . . . . . . . . . . . . . . . . . . . . . . . 108,127 7,602,890Sun Pharmaceutical Industries Ltd. . . . . . . . . . . . . . . . . . . . . . . . . 961,889 6,524,497
18,879,370Textiles, Apparel & Luxury Goods — 1.0%Titan Co. Ltd. . . . . . . . . . . . . . . . . . . . . . . . . . . . . . . . . . . . . . . . . . . . . . 371,732 6,052,863
Thrifts & Mortgage Finance — 6.4%Housing Development Finance Corp. Ltd. . . . . . . . . . . . . . . . . . . 1,595,846 37,636,918
Tobacco — 3.1%ITC Ltd. . . . . . . . . . . . . . . . . . . . . . . . . . . . . . . . . . . . . . . . . . . . . . . . . . . 7,783,080 18,112,698
Transportation Infrastructure — 0.5%Adani Ports & Special Economic Zone Ltd. . . . . . . . . . . . . . . . . . 651,620 3,018,313
Wireless Telecommunication Services — 2.1%Bharti Airtel Ltd.. . . . . . . . . . . . . . . . . . . . . . . . . . . . . . . . . . . . . . . . . . . 2,138,518 12,201,263
Total Common Stocks — 99.3%(Cost: $343,622,874) . . . . . . . . . . . . . . . . . . . . . . . . . . . . . . . . . . . . . . . . . . . . . . 582,560,863
Short-Term InvestmentsMoney Market Funds — 0.2%BlackRock Cash Funds: Treasury, SL Agency Shares,
0.04%(c)(d) . . . . . . . . . . . . . . . . . . . . . . . . . . . . . . . . . . . . . . . . . . . . . 970,000 970,000
Total Short-Term Investments — 0.2%(Cost: $970,000) . . . . . . . . . . . . . . . . . . . . . . . . . . . . . . . . . . . . . . . . . . . . . . . . . . 970,000
Total Investments in Securities — 99.5%(Cost: $344,592,874) . . . . . . . . . . . . . . . . . . . . . . . . . . . . . . . . . . . . . . . . . . . . . . 583,530,863
Other Assets, Less Liabilities — 0.5% . . . . . . . . . . . . . . . . . . . . . . . . . . . . . . . 2,908,700
Net Assets — 100.0% . . . . . . . . . . . . . . . . . . . . . . . . . . . . . . . . . . . . . . . . . . . . . . . . $ 586,439,563
(a) Non-income producing security.(b) Security exempt from registration pursuant to Rule 144A under the Securities Act of
1933, as amended. These securities may be resold in transactions exempt fromregistration to qualified institutional investors.
(c) Affiliate of the Fund.(d) Annualized 7-day yield as of period-end.
Consolidated Schedule of Investments (unaudited)
September 30, 2020
iShares� India 50 ETF(Percentages shown are based on Net Assets)
S C H E D U L E O F I N V E S T M E N T S 6

Affiliates
Investments in issuers considered to be affiliate(s) of the Fund during the six months ended September 30, 2020, for purposes of Section 2(a)(3) of the Investment CompanyAct of 1940, as amended, were as follows:
Affiliated IssuerValue at
03/31/20Purchases
at CostProceeds
from SalesNet Realized
Gain (Loss)
Change inUnrealized
Appreciation(Depreciation)
Value at09/30/20
SharesHeld at
09/30/20 Income
CapitalGain
Distributionsfrom
UnderlyingFunds
BlackRock Cash Funds: Treasury, SL Agency Shares . . . . . . $1,930,000 $ — $(960,000)(a) $ — $ — $970,000 970,000 $ 714 $ —
(a) Represents net amount purchased (sold).
Futures Contracts
DescriptionNumber ofContracts
ExpirationDate
NotionalAmount
(000)
Value/Unrealized
Appreciation(Depreciation)
Long ContractsMSCI India NTR Index. . . . . . . . . . . . . . . . . . . . . . . . . . . . . . . . . . . . . . . . . . . . . . . . . . . . . . . . . . . . . . . . . . . . . . . . . . . . . . . . . . . . . . . . . . . . . . . 58 12/18/20 $ 3,845 $ (21,882)
Derivative Financial Instruments Categorized by Risk Exposure
As of September 30, 2020, the fair values of derivative financial instruments located in the Consolidated Statement of Assets and Liabilities were as follows:
EquityContracts
Liabilities — Derivative Financial InstrumentsFutures contracts
Unrealized depreciation on futures contracts(a) . . . . . . . . . . . . . . . . . . . . . . . . . . . . . . . . . . . . . . . . . . . . . . . . . . . . . . . . . . . . . . . . . . . . . . . . . . . . . . . . . . . . . . . . . . . . . . . . . . . . . . . . . . . . . . . . . $ 21,882
(a) Net cumulative appreciation (depreciation) on futures contracts are reported in the Consolidated Schedule of Investments. In the Consolidated Statement of Assets and Liabilities,only current day's variation margin is reported in receivables or payables and the net cumulative unrealized appreciation (depreciation) is included in accumulated earnings (loss).
For the six months ended September 30, 2020, the effect of derivative financial instruments in the Consolidated Statement of Operations was as follows:
EquityContracts
Net Realized Gain (Loss) from:Futures contracts . . . . . . . . . . . . . . . . . . . . . . . . . . . . . . . . . . . . . . . . . . . . . . . . . . . . . . . . . . . . . . . . . . . . . . . . . . . . . . . . . . . . . . . . . . . . . . . . . . . . . . . . . . . . . . . . . . . . . . . . . . . . . . . . . . . . . . . . . . . . . . . . $317,894
Net Change in Unrealized Appreciation (Depreciation) on:Futures contracts . . . . . . . . . . . . . . . . . . . . . . . . . . . . . . . . . . . . . . . . . . . . . . . . . . . . . . . . . . . . . . . . . . . . . . . . . . . . . . . . . . . . . . . . . . . . . . . . . . . . . . . . . . . . . . . . . . . . . . . . . . . . . . . . . . . . . . . . . . . . . . . . $ (63,528)
Average Quarterly Balances of Outstanding Derivative Financial Instruments
Futures contracts:Average notional value of contracts — long . . . . . . . . . . . . . . . . . . . . . . . . . . . . . . . . . . . . . . . . . . . . . . . . . . . . . . . . . . . . . . . . . . . . . . . . . . . . . . . . . . . . . . . . . . . . . . . . . . . . . . . . . . . . . . . . $3,405,617
For more information about the Fund’s investment risks regarding derivative financial instruments, refer to the Notes to Consolidated Financial Statements.
Fair Value Measurements
Various inputs are used in determining the fair value of financial instruments. For description of the input levels and information about the Fund's policy regarding valuationof financial instruments, refer to the Notes to Consolidated Financial Statements.
Consolidated Schedule of Investments (unaudited) (continued)
September 30, 2020
iShares� India 50 ETF
7 2 0 2 0 I S H A R E S S E M I - A N N U A L R E P O R T T O S H A R E H O L D E R S
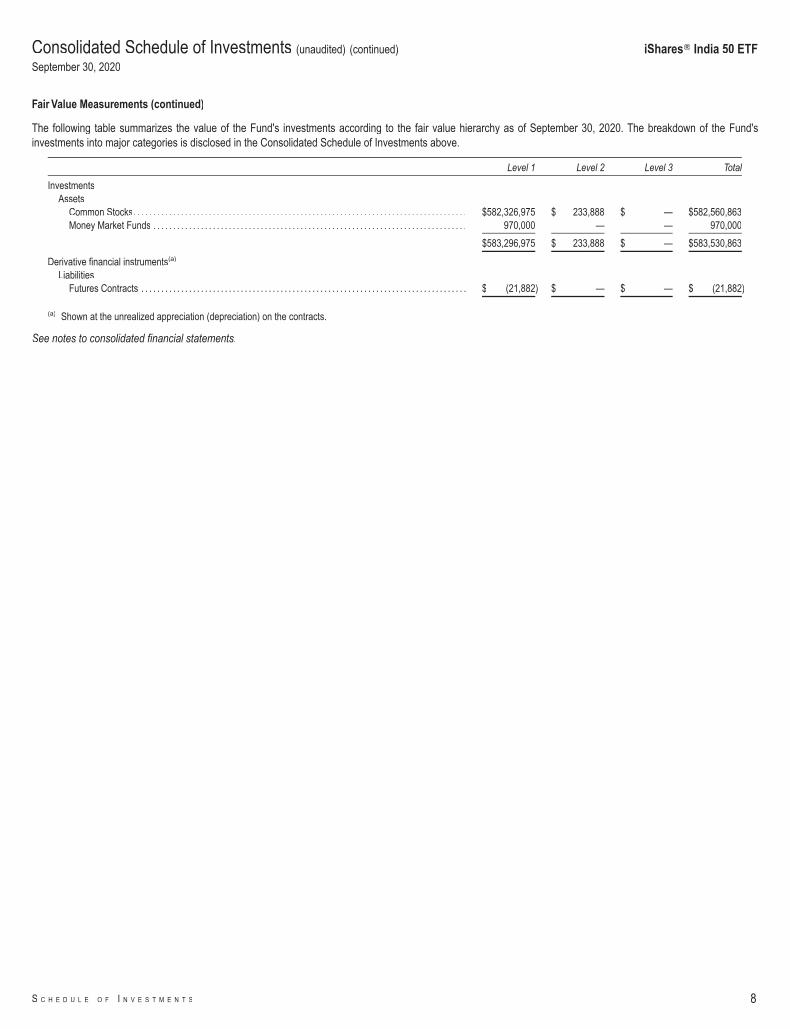
Fair Value Measurements (continued)
The following table summarizes the value of the Fund's investments according to the fair value hierarchy as of September 30, 2020. The breakdown of the Fund'sinvestments into major categories is disclosed in the Consolidated Schedule of Investments above.
Level 1 Level 2 Level 3 Total
InvestmentsAssets
Common Stocks. . . . . . . . . . . . . . . . . . . . . . . . . . . . . . . . . . . . . . . . . . . . . . . . . . . . . . . . . . . . . . . . . . . . . . . . . . . . . . . . . . . . $582,326,975 $ 233,888 $ — $582,560,863Money Market Funds . . . . . . . . . . . . . . . . . . . . . . . . . . . . . . . . . . . . . . . . . . . . . . . . . . . . . . . . . . . . . . . . . . . . . . . . . . . . . . . 970,000 — — 970,000
$583,296,975 $ 233,888 $ — $583,530,863
Derivative financial instruments(a)
LiabilitiesFutures Contracts . . . . . . . . . . . . . . . . . . . . . . . . . . . . . . . . . . . . . . . . . . . . . . . . . . . . . . . . . . . . . . . . . . . . . . . . . . . . . . . . . . $ (21,882) $ — $ — $ (21,882)
(a) Shown at the unrealized appreciation (depreciation) on the contracts.
See notes to consolidated financial statements.
Consolidated Schedule of Investments (unaudited) (continued)
September 30, 2020
iShares� India 50 ETF
S C H E D U L E O F I N V E S T M E N T S 8

iSharesIndia 50 ETF
ASSETSInvestments in securities, at value:
Unaffiliated(a). . . . . . . . . . . . . . . . . . . . . . . . . . . . . . . . . . . . . . . . . . . . . . . . . . . . . . . . . . . . . . . . . . . . . . . . . . . . . . . . . . . . . . . . . . . . . . . . . . . . . . . . . . . . . . . . . . . . . . . . . . . . . . . . . . . . . . . . . . . . . . . . . . . . . $582,560,863Affiliated(b) . . . . . . . . . . . . . . . . . . . . . . . . . . . . . . . . . . . . . . . . . . . . . . . . . . . . . . . . . . . . . . . . . . . . . . . . . . . . . . . . . . . . . . . . . . . . . . . . . . . . . . . . . . . . . . . . . . . . . . . . . . . . . . . . . . . . . . . . . . . . . . . . . . . . . . . 970,000
Cash . . . . . . . . . . . . . . . . . . . . . . . . . . . . . . . . . . . . . . . . . . . . . . . . . . . . . . . . . . . . . . . . . . . . . . . . . . . . . . . . . . . . . . . . . . . . . . . . . . . . . . . . . . . . . . . . . . . . . . . . . . . . . . . . . . . . . . . . . . . . . . . . . . . . . . . . . . . . . . . 6,797Foreign currency, at value(c) . . . . . . . . . . . . . . . . . . . . . . . . . . . . . . . . . . . . . . . . . . . . . . . . . . . . . . . . . . . . . . . . . . . . . . . . . . . . . . . . . . . . . . . . . . . . . . . . . . . . . . . . . . . . . . . . . . . . . . . . . . . . . . . . . . . . . . . . . 6,866,547Cash pledged:
Futures contracts. . . . . . . . . . . . . . . . . . . . . . . . . . . . . . . . . . . . . . . . . . . . . . . . . . . . . . . . . . . . . . . . . . . . . . . . . . . . . . . . . . . . . . . . . . . . . . . . . . . . . . . . . . . . . . . . . . . . . . . . . . . . . . . . . . . . . . . . . . . . . . . . . 137,000Receivables:
Investments sold . . . . . . . . . . . . . . . . . . . . . . . . . . . . . . . . . . . . . . . . . . . . . . . . . . . . . . . . . . . . . . . . . . . . . . . . . . . . . . . . . . . . . . . . . . . . . . . . . . . . . . . . . . . . . . . . . . . . . . . . . . . . . . . . . . . . . . . . . . . . . . . . . 2,991,734Dividends . . . . . . . . . . . . . . . . . . . . . . . . . . . . . . . . . . . . . . . . . . . . . . . . . . . . . . . . . . . . . . . . . . . . . . . . . . . . . . . . . . . . . . . . . . . . . . . . . . . . . . . . . . . . . . . . . . . . . . . . . . . . . . . . . . . . . . . . . . . . . . . . . . . . . . . . 255,108
Total assets. . . . . . . . . . . . . . . . . . . . . . . . . . . . . . . . . . . . . . . . . . . . . . . . . . . . . . . . . . . . . . . . . . . . . . . . . . . . . . . . . . . . . . . . . . . . . . . . . . . . . . . . . . . . . . . . . . . . . . . . . . . . . . . . . . . . . . . . . . . . . . . . . . . . . . . . . 593,788,049
LIABILITIESPayables:
Variation margin on futures contracts . . . . . . . . . . . . . . . . . . . . . . . . . . . . . . . . . . . . . . . . . . . . . . . . . . . . . . . . . . . . . . . . . . . . . . . . . . . . . . . . . . . . . . . . . . . . . . . . . . . . . . . . . . . . . . . . . . . . . . . . . . . . . . 256Capital shares redeemed . . . . . . . . . . . . . . . . . . . . . . . . . . . . . . . . . . . . . . . . . . . . . . . . . . . . . . . . . . . . . . . . . . . . . . . . . . . . . . . . . . . . . . . . . . . . . . . . . . . . . . . . . . . . . . . . . . . . . . . . . . . . . . . . . . . . . . . . . 6,907,029Investment advisory fees . . . . . . . . . . . . . . . . . . . . . . . . . . . . . . . . . . . . . . . . . . . . . . . . . . . . . . . . . . . . . . . . . . . . . . . . . . . . . . . . . . . . . . . . . . . . . . . . . . . . . . . . . . . . . . . . . . . . . . . . . . . . . . . . . . . . . . . . . 441,201
Total liabilities . . . . . . . . . . . . . . . . . . . . . . . . . . . . . . . . . . . . . . . . . . . . . . . . . . . . . . . . . . . . . . . . . . . . . . . . . . . . . . . . . . . . . . . . . . . . . . . . . . . . . . . . . . . . . . . . . . . . . . . . . . . . . . . . . . . . . . . . . . . . . . . . . . . . . . . 7,348,486
NET ASSETS. . . . . . . . . . . . . . . . . . . . . . . . . . . . . . . . . . . . . . . . . . . . . . . . . . . . . . . . . . . . . . . . . . . . . . . . . . . . . . . . . . . . . . . . . . . . . . . . . . . . . . . . . . . . . . . . . . . . . . . . . . . . . . . . . . . . . . . . . . . . . . . . . . . . . . . $586,439,563
NET ASSETS CONSIST OF:Paid-in capital. . . . . . . . . . . . . . . . . . . . . . . . . . . . . . . . . . . . . . . . . . . . . . . . . . . . . . . . . . . . . . . . . . . . . . . . . . . . . . . . . . . . . . . . . . . . . . . . . . . . . . . . . . . . . . . . . . . . . . . . . . . . . . . . . . . . . . . . . . . . . . . . . . . . . . . $455,992,193Accumulated earnings. . . . . . . . . . . . . . . . . . . . . . . . . . . . . . . . . . . . . . . . . . . . . . . . . . . . . . . . . . . . . . . . . . . . . . . . . . . . . . . . . . . . . . . . . . . . . . . . . . . . . . . . . . . . . . . . . . . . . . . . . . . . . . . . . . . . . . . . . . . . . . . 130,447,370
NET ASSETS. . . . . . . . . . . . . . . . . . . . . . . . . . . . . . . . . . . . . . . . . . . . . . . . . . . . . . . . . . . . . . . . . . . . . . . . . . . . . . . . . . . . . . . . . . . . . . . . . . . . . . . . . . . . . . . . . . . . . . . . . . . . . . . . . . . . . . . . . . . . . . . . . . . . . . . $586,439,563
Shares outstanding . . . . . . . . . . . . . . . . . . . . . . . . . . . . . . . . . . . . . . . . . . . . . . . . . . . . . . . . . . . . . . . . . . . . . . . . . . . . . . . . . . . . . . . . . . . . . . . . . . . . . . . . . . . . . . . . . . . . . . . . . . . . . . . . . . . . . . . . . . . . . . . . . 16,950,000
Net asset value . . . . . . . . . . . . . . . . . . . . . . . . . . . . . . . . . . . . . . . . . . . . . . . . . . . . . . . . . . . . . . . . . . . . . . . . . . . . . . . . . . . . . . . . . . . . . . . . . . . . . . . . . . . . . . . . . . . . . . . . . . . . . . . . . . . . . . . . . . . . . . . . . . . . . $ 34.60
Shares authorized . . . . . . . . . . . . . . . . . . . . . . . . . . . . . . . . . . . . . . . . . . . . . . . . . . . . . . . . . . . . . . . . . . . . . . . . . . . . . . . . . . . . . . . . . . . . . . . . . . . . . . . . . . . . . . . . . . . . . . . . . . . . . . . . . . . . . . . . . . . . . . . . . . Unlimited
Par value . . . . . . . . . . . . . . . . . . . . . . . . . . . . . . . . . . . . . . . . . . . . . . . . . . . . . . . . . . . . . . . . . . . . . . . . . . . . . . . . . . . . . . . . . . . . . . . . . . . . . . . . . . . . . . . . . . . . . . . . . . . . . . . . . . . . . . . . . . . . . . . . . . . . . . . . . . . None
(a) Investments, at cost — Unaffiliated. . . . . . . . . . . . . . . . . . . . . . . . . . . . . . . . . . . . . . . . . . . . . . . . . . . . . . . . . . . . . . . . . . . . . . . . . . . . . . . . . . . . . . . . . . . . . . . . . . . . . . . . . . . . . . . . . . . . . . . . . . . . . . . $343,622,874(b) Investments, at cost — Affiliated . . . . . . . . . . . . . . . . . . . . . . . . . . . . . . . . . . . . . . . . . . . . . . . . . . . . . . . . . . . . . . . . . . . . . . . . . . . . . . . . . . . . . . . . . . . . . . . . . . . . . . . . . . . . . . . . . . . . . . . . . . . . . . . . . $ 970,000(c) Foreign currency, at cost. . . . . . . . . . . . . . . . . . . . . . . . . . . . . . . . . . . . . . . . . . . . . . . . . . . . . . . . . . . . . . . . . . . . . . . . . . . . . . . . . . . . . . . . . . . . . . . . . . . . . . . . . . . . . . . . . . . . . . . . . . . . . . . . . . . . . . . . . $ 6,866,547
See notes to consolidated financial statements.
Consolidated Statement of Assets and Liabilities (unaudited)
September 30, 2020
9 2 0 2 0 I S H A R E S S E M I - A N N U A L R E P O R T T O S H A R E H O L D E R S

iSharesIndia 50 ETF
INVESTMENT INCOMEDividends — Unaffiliated. . . . . . . . . . . . . . . . . . . . . . . . . . . . . . . . . . . . . . . . . . . . . . . . . . . . . . . . . . . . . . . . . . . . . . . . . . . . . . . . . . . . . . . . . . . . . . . . . . . . . . . . . . . . . . . . . . . . . . . . . . . . . . . . . . . . . . . . . . . . $ 3,931,660Dividends — Affiliated . . . . . . . . . . . . . . . . . . . . . . . . . . . . . . . . . . . . . . . . . . . . . . . . . . . . . . . . . . . . . . . . . . . . . . . . . . . . . . . . . . . . . . . . . . . . . . . . . . . . . . . . . . . . . . . . . . . . . . . . . . . . . . . . . . . . . . . . . . . . . . 714Foreign taxes withheld. . . . . . . . . . . . . . . . . . . . . . . . . . . . . . . . . . . . . . . . . . . . . . . . . . . . . . . . . . . . . . . . . . . . . . . . . . . . . . . . . . . . . . . . . . . . . . . . . . . . . . . . . . . . . . . . . . . . . . . . . . . . . . . . . . . . . . . . . . . . . . (875,566)
Total investment income. . . . . . . . . . . . . . . . . . . . . . . . . . . . . . . . . . . . . . . . . . . . . . . . . . . . . . . . . . . . . . . . . . . . . . . . . . . . . . . . . . . . . . . . . . . . . . . . . . . . . . . . . . . . . . . . . . . . . . . . . . . . . . . . . . . . . . . . . . . . . . . 3,056,808
EXPENSESInvestment advisory fees . . . . . . . . . . . . . . . . . . . . . . . . . . . . . . . . . . . . . . . . . . . . . . . . . . . . . . . . . . . . . . . . . . . . . . . . . . . . . . . . . . . . . . . . . . . . . . . . . . . . . . . . . . . . . . . . . . . . . . . . . . . . . . . . . . . . . . . . . . . 2,421,195Miscellaneous. . . . . . . . . . . . . . . . . . . . . . . . . . . . . . . . . . . . . . . . . . . . . . . . . . . . . . . . . . . . . . . . . . . . . . . . . . . . . . . . . . . . . . . . . . . . . . . . . . . . . . . . . . . . . . . . . . . . . . . . . . . . . . . . . . . . . . . . . . . . . . . . . . . . . . 264Mauritius income taxes . . . . . . . . . . . . . . . . . . . . . . . . . . . . . . . . . . . . . . . . . . . . . . . . . . . . . . . . . . . . . . . . . . . . . . . . . . . . . . . . . . . . . . . . . . . . . . . . . . . . . . . . . . . . . . . . . . . . . . . . . . . . . . . . . . . . . . . . . . . . . 70,449
Total expenses. . . . . . . . . . . . . . . . . . . . . . . . . . . . . . . . . . . . . . . . . . . . . . . . . . . . . . . . . . . . . . . . . . . . . . . . . . . . . . . . . . . . . . . . . . . . . . . . . . . . . . . . . . . . . . . . . . . . . . . . . . . . . . . . . . . . . . . . . . . . . . . . . . . . . . . . 2,491,908
Net investment income . . . . . . . . . . . . . . . . . . . . . . . . . . . . . . . . . . . . . . . . . . . . . . . . . . . . . . . . . . . . . . . . . . . . . . . . . . . . . . . . . . . . . . . . . . . . . . . . . . . . . . . . . . . . . . . . . . . . . . . . . . . . . . . . . . . . . . . . . . . . . . . . 564,900
REALIZED AND UNREALIZED GAIN (LOSS)Net realized gain (loss) from:
Investments — Unaffiliated. . . . . . . . . . . . . . . . . . . . . . . . . . . . . . . . . . . . . . . . . . . . . . . . . . . . . . . . . . . . . . . . . . . . . . . . . . . . . . . . . . . . . . . . . . . . . . . . . . . . . . . . . . . . . . . . . . . . . . . . . . . . . . . . . . . . . . . 143,951Futures contracts . . . . . . . . . . . . . . . . . . . . . . . . . . . . . . . . . . . . . . . . . . . . . . . . . . . . . . . . . . . . . . . . . . . . . . . . . . . . . . . . . . . . . . . . . . . . . . . . . . . . . . . . . . . . . . . . . . . . . . . . . . . . . . . . . . . . . . . . . . . . . . . . 317,894Foreign currency transactions . . . . . . . . . . . . . . . . . . . . . . . . . . . . . . . . . . . . . . . . . . . . . . . . . . . . . . . . . . . . . . . . . . . . . . . . . . . . . . . . . . . . . . . . . . . . . . . . . . . . . . . . . . . . . . . . . . . . . . . . . . . . . . . . . . . . (153,569)
Net realized gain . . . . . . . . . . . . . . . . . . . . . . . . . . . . . . . . . . . . . . . . . . . . . . . . . . . . . . . . . . . . . . . . . . . . . . . . . . . . . . . . . . . . . . . . . . . . . . . . . . . . . . . . . . . . . . . . . . . . . . . . . . . . . . . . . . . . . . . . . . . . . . . . . . . 308,276
Net change in unrealized appreciation (depreciation) on:Investments — Unaffiliated. . . . . . . . . . . . . . . . . . . . . . . . . . . . . . . . . . . . . . . . . . . . . . . . . . . . . . . . . . . . . . . . . . . . . . . . . . . . . . . . . . . . . . . . . . . . . . . . . . . . . . . . . . . . . . . . . . . . . . . . . . . . . . . . . . . . . . . 150,875,141Futures contracts . . . . . . . . . . . . . . . . . . . . . . . . . . . . . . . . . . . . . . . . . . . . . . . . . . . . . . . . . . . . . . . . . . . . . . . . . . . . . . . . . . . . . . . . . . . . . . . . . . . . . . . . . . . . . . . . . . . . . . . . . . . . . . . . . . . . . . . . . . . . . . . . (63,528)Foreign currency translations. . . . . . . . . . . . . . . . . . . . . . . . . . . . . . . . . . . . . . . . . . . . . . . . . . . . . . . . . . . . . . . . . . . . . . . . . . . . . . . . . . . . . . . . . . . . . . . . . . . . . . . . . . . . . . . . . . . . . . . . . . . . . . . . . . . . . 29,122
Net change in unrealized appreciation (depreciation) . . . . . . . . . . . . . . . . . . . . . . . . . . . . . . . . . . . . . . . . . . . . . . . . . . . . . . . . . . . . . . . . . . . . . . . . . . . . . . . . . . . . . . . . . . . . . . . . . . . . . . . . . . . . . . . . . 150,840,735
Net realized and unrealized gain . . . . . . . . . . . . . . . . . . . . . . . . . . . . . . . . . . . . . . . . . . . . . . . . . . . . . . . . . . . . . . . . . . . . . . . . . . . . . . . . . . . . . . . . . . . . . . . . . . . . . . . . . . . . . . . . . . . . . . . . . . . . . . . . . . . . . . . 151,149,011
NET INCREASE IN NET ASSETS RESULTING FROM OPERATIONS. . . . . . . . . . . . . . . . . . . . . . . . . . . . . . . . . . . . . . . . . . . . . . . . . . . . . . . . . . . . . . . . . . . . . . . . . . . . . . . . . . . . . . . . . . . . . . . . . . . $151,713,911
See notes to consolidated financial statements.
Consolidated Statement of Operations (unaudited)
Six Months Ended September 30, 2020
F I N A N C I A L S T A T E M E N T S 10

iSharesIndia 50 ETF
Six MonthsEnded
09/30/20(unaudited)
Year Ended03/31/20
INCREASE (DECREASE) IN NET ASSETS
OPERATIONSNet investment income . . . . . . . . . . . . . . . . . . . . . . . . . . . . . . . . . . . . . . . . . . . . . . . . . . . . . . . . . . . . . . . . . . . . . . . . . . . . . . . . . . . . . . . . . . . . . . . . . . . . . . . . . . . . . . . . . . . . . . . $ 564,900 $ 3,993,993Net realized gain. . . . . . . . . . . . . . . . . . . . . . . . . . . . . . . . . . . . . . . . . . . . . . . . . . . . . . . . . . . . . . . . . . . . . . . . . . . . . . . . . . . . . . . . . . . . . . . . . . . . . . . . . . . . . . . . . . . . . . . . . . . . . 308,276 22,569,073Net change in unrealized appreciation (depreciation) . . . . . . . . . . . . . . . . . . . . . . . . . . . . . . . . . . . . . . . . . . . . . . . . . . . . . . . . . . . . . . . . . . . . . . . . . . . . . . . . . . . . . . . . . . 150,840,735 (253,043,689)
Net increase (decrease) in net assets resulting from operations . . . . . . . . . . . . . . . . . . . . . . . . . . . . . . . . . . . . . . . . . . . . . . . . . . . . . . . . . . . . . . . . . . . . . . . . . . . . . . . . . . . 151,713,911 (226,480,623)
DISTRIBUTIONS TO SHAREHOLDERS(a)
Decrease in net assets resulting from distributions to shareholders. . . . . . . . . . . . . . . . . . . . . . . . . . . . . . . . . . . . . . . . . . . . . . . . . . . . . . . . . . . . . . . . . . . . . . . . . . . . . . . . (570,042) (5,592,617)
CAPITAL SHARE TRANSACTIONSNet decrease in net assets derived from capital share transactions. . . . . . . . . . . . . . . . . . . . . . . . . . . . . . . . . . . . . . . . . . . . . . . . . . . . . . . . . . . . . . . . . . . . . . . . . . . . . . . . (48,545,037) (112,630,622)
NET ASSETSTotal increase (decrease) in net assets . . . . . . . . . . . . . . . . . . . . . . . . . . . . . . . . . . . . . . . . . . . . . . . . . . . . . . . . . . . . . . . . . . . . . . . . . . . . . . . . . . . . . . . . . . . . . . . . . . . . . . . . . . 102,598,832 (344,703,862)Beginning of period . . . . . . . . . . . . . . . . . . . . . . . . . . . . . . . . . . . . . . . . . . . . . . . . . . . . . . . . . . . . . . . . . . . . . . . . . . . . . . . . . . . . . . . . . . . . . . . . . . . . . . . . . . . . . . . . . . . . . . . . . . . . . 483,840,731 828,544,593
End of period. . . . . . . . . . . . . . . . . . . . . . . . . . . . . . . . . . . . . . . . . . . . . . . . . . . . . . . . . . . . . . . . . . . . . . . . . . . . . . . . . . . . . . . . . . . . . . . . . . . . . . . . . . . . . . . . . . . . . . . . . . . . . . . . . . . $586,439,563 $ 483,840,731
(a) Distributions for annual periods determined in accordance with U.S. federal income tax regulations.
See notes to consolidated financial statements.
Consolidated Statements of Changes in Net Assets
11 2 0 2 0 I S H A R E S S E M I - A N N U A L R E P O R T T O S H A R E H O L D E R S

iShares India 50 ETF
Six Months Ended09/30/20
(unaudited)Year Ended
03/31/20Year Ended
03/31/19Year Ended
03/31/18Year Ended
03/31/17Year Ended
03/31/16
Net asset value, beginning of period . . . . . . . . . . . . . . . . . . . . . . . . . . . . . . . . . . . . . . . . . . . . $ 25.87 $ 37.92 $ 35.00 $ 32.27 $ 26.81 $ 31.06
Net investment income(a) . . . . . . . . . . . . . . . . . . . . . . . . . . . . . . . . . . . . . . . . . . . . . . . . . . . . . . . 0.03 0.19 0.16 0.15 0.12 0.18Net realized and unrealized gain (loss)(b) . . . . . . . . . . . . . . . . . . . . . . . . . . . . . . . . . . . . . . . . 8.73 (12.01) 2.97 2.68 5.47 (4.27)
Net increase (decrease) from investment operations . . . . . . . . . . . . . . . . . . . . . . . . . . . . . . . 8.76 (11.82) 3.13 2.83 5.59 (4.09)
Distributions(c)
From net investment income. . . . . . . . . . . . . . . . . . . . . . . . . . . . . . . . . . . . . . . . . . . . . . . . . . . . (0.03) (0.23) (0.21) (0.10) (0.13) (0.16)
Total distributions . . . . . . . . . . . . . . . . . . . . . . . . . . . . . . . . . . . . . . . . . . . . . . . . . . . . . . . . . . . . . . . . . (0.03) (0.23) (0.21) (0.10) (0.13) (0.16)
Net asset value, end of period . . . . . . . . . . . . . . . . . . . . . . . . . . . . . . . . . . . . . . . . . . . . . . . . . . . $ 34.60 $ 25.87 $ 37.92 $ 35.00 $ 32.27 $ 26.81
Total ReturnBased on net asset value . . . . . . . . . . . . . . . . . . . . . . . . . . . . . . . . . . . . . . . . . . . . . . . . . . . . . . . . . 33.90%(d) (31.41)% 9.04% 8.76% 20.94% (13.22)%
Ratios to Average Net AssetsTotal expenses . . . . . . . . . . . . . . . . . . . . . . . . . . . . . . . . . . . . . . . . . . . . . . . . . . . . . . . . . . . . . . . . . . . 0.92%(e) 0.93% 0.94% 0.92% 0.93% 0.94%
Net investment income. . . . . . . . . . . . . . . . . . . . . . . . . . . . . . . . . . . . . . . . . . . . . . . . . . . . . . . . . . . . 0.21%(e) 0.51% 0.45% 0.42% 0.43% 0.62%
Supplemental DataNet assets, end of period (000) . . . . . . . . . . . . . . . . . . . . . . . . . . . . . . . . . . . . . . . . . . . . . . . . . . . . $586,440 $483,841 $828,545 $1,120,132 $846,994 $714,535
Portfolio turnover rate(f) . . . . . . . . . . . . . . . . . . . . . . . . . . . . . . . . . . . . . . . . . . . . . . . . . . . . . . . . . . . 6%(d) 26% 24% 14% 11% 14%
(a) Based on average shares outstanding.(b) The amounts reported for a share outstanding may not accord with the change in aggregate gains and losses in securities for the fiscal period due to the timing of capital share
transactions in relation to the fluctuating market values of the Fund’s underlying securities.(c) Distributions for annual periods determined in accordance with U.S. federal income tax regulations.(d) Not annualized.(e) Annualized.(f) Portfolio turnover rate excludes in-kind transactions.
See notes to consolidated financial statements.
Consolidated Financial Highlights(For a share outstanding throughout each period)
F I N A N C I A L H I G H L I G H T S 12

1. ORGANIZATION
iShares Trust (the “Trust”) is registered under the Investment Company Act of 1940, as amended (the “1940 Act”), as an open-end management investment company. TheTrust is organized as a Delaware statutory trust and is authorized to have multiple series or portfolios.
These consolidated financial statements relate only to the following fund (the “Fund”):
iShares ETFDiversificationClassification
India 50 . . . . . . . . . . . . . . . . . . . . . . . . . . . . . . . . . . . . . . . . . . . . . . . . . . . . . . . . . . . . . . . . . . . . . . . . . . . . . . . . . . . . . . . . . . . . . . . . . . . . . . . . . . . . . . . . . . . . . . . . . . . . . . . . . . . . . . . . . . . . . . . . . Non-diversified
Basis of Consolidation: The accompanying consolidated financial statements for the Fund includes the accounts of its subsidiary in the Republic of Mauritius, which isa wholly-owned subsidiary (the “Subsidiary”) of the Fund that invests in Indian securities. Through this investment structure, the Fund expects to obtain certain benefitsunder a current tax treaty between Mauritius and India. Intercompany accounts and transactions, if any, have been eliminated.
2. SIGNIFICANT ACCOUNTING POLICIES
The financial statements are prepared in conformity with accounting principles generally accepted in the United States of America (“U.S. GAAP”), which may requiremanagement to make estimates and assumptions that affect the reported amounts of assets and liabilities in the financial statements, disclosure of contingent assets andliabilities at the date of the financial statements and the reported amounts of increases and decreases in net assets from operations during the reporting period. Actualresults could differ from those estimates. The Fund is considered an investment company under U.S. GAAP and follows the accounting and reporting guidance applicableto investment companies. Below is a summary of significant accounting policies:
Investment Transactions and Income Recognition: For financial reporting purposes, investment transactions are recorded on the dates the transactions are executed.Realized gains and losses on investment transactions are determined using the specific identification method. Dividend income and capital gain distributions, if any, arerecorded on the ex-dividend date. Non-cash dividends, if any, are recorded on the ex-dividend date at fair value.
Foreign Currency Translation: The Fund’s books and records are maintained in U.S. dollars. Securities and other assets and liabilities denominated in foreign currenciesare translated into U.S. dollars using exchange rates determined as of the close of trading on the New York Stock Exchange (“NYSE”). Purchases and sales of investmentsare recorded at the rates of exchange prevailing on the respective dates of such transactions. Generally, when the U.S. dollar rises in value against a foreign currency, theinvestments denominated in that currency will lose value; the opposite effect occurs if the U.S. dollar falls in relative value.
The Fund does not isolate the effect of fluctuations in foreign exchange rates from the effect of fluctuations in the market prices of investments for financial reportingpurposes. Accordingly, the effects of changes in exchange rates on investments are not segregated in the statement of operations from the effects of changes in marketprices of those investments, but are included as a component of net realized and unrealized gain (loss) from investments. The Fund reports realized currency gains (losses)on foreign currency related transactions as components of net realized gain (loss) for financial reporting purposes, whereas such components are generally treated asordinary income for U.S. federal income tax purposes.
Foreign Taxes: The Fund may be subject to foreign taxes (a portion of which may be reclaimable) on income, stock dividends, capital gains on investments, or certainforeign currency transactions. All foreign taxes are recorded in accordance with the applicable foreign tax regulations and rates that exist in the foreign jurisdictions in whichthe Fund invests. These foreign taxes, if any, are paid by the Fund and are reflected in its consolidated statement of operations as follows: foreign taxes withheld at sourceare presented as a reduction of income, foreign taxes on securities lending income are presented as a reduction of securities lending income, foreign taxes on stockdividends are presented as “other foreign taxes”, and foreign taxes on capital gains from sales of investments and foreign taxes on foreign currency transactions areincluded in their respective net realized gain (loss) categories. Foreign taxes payable or deferred as of September 30, 2020, if any, are disclosed in the consolidatedstatement of assets and liabilities.
The Fund conducts its investment activities in India through its Subsidiary and expects to obtain benefits under the Double Tax Avoidance Agreement (“DTAA”) betweenIndia and Mauritius. In order to be eligible to claim benefits under the DTAA, the Subsidiary must have commercial substance, on an annual basis, to satisfy certain testsand conditions, including the establishment and maintenance of valid tax residence in Mauritius, have the place of effective management outside of India, and relatedrequirements. The Fund has obtained a current tax residence certificate issued by the Mauritian Revenue Authorities.
Based upon current interpretation and practice of the current tax laws in India and Mauritius and the DTAA, the Subsidiary is subject to tax in Mauritius on its net incomeat the rate of 15%. However, the Subsidiary is entitled to a tax credit equivalent to the higher of the actual foreign tax incurred or 80% of the Mauritius tax on its foreign sourceincome, thus reducing its maximum effective tax rate to 3% up to June 30, 2021. After June 30, 2021, under the new tax regime and subject to meeting the necessarysubstance requirements as required under the Financial Services Act 2007 (as amended by the Finance Act 2018) and such guidelines issued by the FSC, the Subsidiaryis entitled to either (a) a foreign tax credit equivalent to the actual foreign tax suffered on its foreign income against the Subsidiary’s tax liability computed at 15% on suchincome, or (b) a partial exemption of 80% of some of the income derived, including interest income or foreign source dividends. Taxes on income, if any, are paid by theSubsidiary and are disclosed in its consolidated statement of operations. Any dividends paid by the Subsidiary to its Fund are not subject to tax in Mauritius. The Subsidiaryis currently exempt from tax in Mauritius on any gains from the sale of securities.
The DTAA provides that capital gains will be taxable in India with respect to the sale of shares acquired on or after April 1, 2017. Capital gains arising from shares acquiredbefore April 1, 2017, regardless of when they are sold, will continue to be exempt from taxation under the amended DTAA, assuming requirements for eligibility under the
Notes to Consolidated Financial Statements (unaudited)
13 2 0 2 0 I S H A R E S S E M I - A N N U A L R E P O R T T O S H A R E H O L D E R S

DTAA are satisfied. There can be no assurance, however, that the DTAA will remain in effect during the Subsidiary’s existence or that it will continue to enjoy its benefits onthe shares acquired prior to April 1, 2017.
Segregation and Collateralization: In cases where the Fund enters into certain investments (e.g., futures contracts) that would be treated as “senior securities” for 1940Act purposes, the Fund may segregate or designate on its books and records cash or liquid assets having a market value at least equal to the amount of its future obligationsunder such investments. Doing so allows the investment to be excluded from treatment as a “senior security.” Furthermore, if required by an exchange or counterpartyagreement, the Fund may be required to deliver/deposit cash and/or securities to/with an exchange, or broker-dealer or custodian as collateral for certain investments orobligations.
In-kind Redemptions: For financial reporting purposes, in-kind redemptions are treated as sales of securities resulting in realized capital gains or losses to the Fund.Because such gains or losses are not taxable to the Fund and are not distributed to existing Fund shareholders, the gains or losses are reclassified from accumulated netrealized gain (loss) to paid-in capital at the end of the Fund's tax year. These reclassifications have no effect on net assets or net asset value ("NAV") per share.
Distributions: Dividends and distributions paid by the Fund are recorded on the ex-dividend dates. Distributions are determined on a tax basis and may differ from netinvestment income and net realized capital gains for financial reporting purposes. Dividends and distributions are paid in U.S. dollars and cannot be automatically reinvestedin additional shares of the Fund. The character and timing of distributions are determined in accordance with U.S. federal income tax regulations, which may differ from U.S.GAAP.
Indemnifications: In the normal course of business, the Fund enters into contracts that contain a variety of representations that provide general indemnification. The Fund'smaximum exposure under these arrangements is unknown because it involves future potential claims against the Fund, which cannot be predicted with any certainty.
3. INVESTMENT VALUATION AND FAIR VALUE MEASUREMENTS
Investment Valuation Policies: The Fund’s investments are valued at fair value (also referred to as “market value” within the financial statements) each day that the Fund’slisting exchange is open and, for financial reporting purposes, as of the report date. U.S. GAAP defines fair value as the price a fund would receive to sell an asset or payto transfer a liability in an orderly transaction between market participants at the measurement date.A fund determines the fair value of its financial instruments using variousindependent dealers or pricing services under policies approved by the Board of Trustees of the Trust (the “Board”). If a security’s market price is not readily available ordoes not otherwise accurately represent the fair value of the security, the security will be valued in accordance with a policy approved by the Board as reflecting fair value.The BlackRock Global Valuation Methodologies Committee (the “Global Valuation Committee”) is the committee formed by management to develop global pricing policiesand procedures and to oversee the pricing function for all financial instruments.
Fair Value Inputs and Methodologies: The following methods and inputs are used to establish the fair value of the Fund’s assets and liabilities:• Equity investments traded on a recognized securities exchange are valued at that day’s official closing price, as applicable, on the exchange where the stock is
primarily traded. Equity investments traded on a recognized exchange for which there were no sales on that day are valued at the last traded price.• Investments in open-end U.S. mutual funds (including money market funds) are valued at that day’s published NAV.• Futures contracts are valued based on that day’s last reported settlement price on the exchange where the contract is traded.
If events (e.g., a company announcement, market volatility or a natural disaster) occur that are expected to materially affect the value of such investment, or in the eventthat application of these methods of valuation results in a price for an investment that is deemed not to be representative of the market value of such investment, or if a priceis not available, the investment will be valued by the Global Valuation Committee, in accordance with a policy approved by the Board as reflecting fair value (“Fair ValuedInvestments”). The fair valuation approaches that may be used by the Global Valuation Committee include market approach, income approach and the cost approach.Valuation techniques such as discounted cash flow, use of market comparables and matrix pricing are types of valuation approaches and are typically used in determiningfair value. When determining the price for Fair Valued Investments, the Global Valuation Committee, or its delegate, seeks to determine the price that the Fund mightreasonably expect to receive or pay from the current sale or purchase of that asset or liability in an arm’s-length transaction. Fair value determinations shall be based uponall available factors that the Global Valuation Committee, or its delegate, deems relevant and consistent with the principles of fair value measurement. The pricing of all FairValued Investments is subsequently reported to the Board or a committee thereof on a quarterly basis.
Fair value pricing could result in a difference between the prices used to calculate a fund’s NAV and the prices used by the fund’s underlying index, which in turn could resultin a difference between the fund’s performance and the performance of the fund’s underlying index.
Fair Value Hierarchy: Various inputs are used in determining the fair value of financial instruments. These inputs to valuation techniques are categorized into a fair valuehierarchy consisting of three broad levels for financial reporting purposes as follows:
• Level 1 – Unadjusted price quotations in active markets/exchanges for identical assets or liabilities that the Fund has the ability to access;• Level 2 – Other observable inputs (including, but not limited to, quoted prices for similar assets or liabilities in markets that are active, quoted prices for identical or
similar assets or liabilities in markets that are not active, inputs other than quoted prices that are observable for the assets or liabilities (such as interest rates, yieldcurves, volatilities, prepayment speeds, loss severities, credit risks and default rates) or other market-corroborated inputs); and
• Level 3 – Unobservable inputs based on the best information available in the circumstances, to the extent observable inputs are not available, (including the GlobalValuation Committee’s assumptions used in determining the fair value of financial instruments).
The hierarchy gives the highest priority to unadjusted quoted prices in active markets for identical assets or liabilities (Level 1 measurements) and the lowest priority tounobservable inputs (Level 3 measurements). Accordingly, the degree of judgement exercised in determining fair value is greatest for instruments categorized in Level 3.The inputs used to measure fair value may fall into different levels of the fair value hierarchy. In such cases, for disclosure purposes, the fair value hierarchy classification
Notes to Consolidated Financial Statements (unaudited) (continued)
N O T E S T O C O N S O L I D A T E D F I N A N C I A L S T A T E M E N T S 14

is determined based on the lowest level input that is significant to the fair value measurement in its entirety. Investments classified within Level 3 have significantunobservable inputs used by the Global Valuation Committee in determining the price for Fair Valued Investments. Level 3 investments include equity or debt issued byprivately held companies or funds that may not have a secondary market and/or may have a limited number of investors. The categorization of a value determined forfinancial instruments is based on the pricing transparency of the financial instruments and is not necessarily an indication of the risks associated with investing in thosesecurities.
4. DERIVATIVE FINANCIAL INSTRUMENTS
Futures Contracts: The Fund’s use of futures contracts is generally limited to cash equitization. This involves the use of available cash to invest in index futures contractsin order to gain exposure to the equity markets represented in or by the Fund’s underlying index and is intended to allow the Fund to better track its underlying index. Futurescontracts are standardized, exchange-traded agreements to buy or sell a specific quantity of an underlying instrument at a set price on a future date. Depending on the termsof a contract, a futures contract is settled either through physical delivery of the underlying instrument on the settlement date or by payment of a cash amount on thesettlement date.
Upon entering into a futures contract, a fund is required to pledge to the executing broker which holds segregated from its own assets, an amount of cash, U.S. governmentsecurities or other high-quality debt and equity securities equal to the minimum initial margin requirements of the exchange on which the contract is traded. Securitiesdeposited as initial margin, if any, are designated in the consolidated schedule of investments and cash deposited, if any, is shown as cash pledged for futures contractsin the consolidated statement of assets and liabilities.
Pursuant to the contract, a fund agrees to receive from or pay to the broker an amount of cash equal to the daily fluctuation in market value of the contract (“variationmargin”). Variation margin is recorded as unrealized appreciation or depreciation and, if any, shown as variation margin receivable or payable on futures contracts in theconsolidated statement of assets and liabilities. When the contract is closed, a realized gain or loss is recorded in the consolidated statement of operations equal to thedifference between the notional amount of the contract at the time it was opened and the notional amount at the time it was closed. Losses may arise if the notional valueof a futures contract decreases due to an unfavorable change in the market rates or values of the underlying instrument during the term of the contract or if the counterpartydoes not perform under the contract. The use of futures contracts involves the risk of an imperfect correlation in the movements in the price of futures contracts and theassets underlying such contracts.
5. INVESTMENT ADVISORY AGREEMENT AND OTHER TRANSACTIONS WITH AFFILIATES
Investment Advisory Fees: Pursuant to an Investment Advisory Agreement with the Trust, BFA manages the investment of the Fund’s assets. BFA is a Californiacorporation indirectly owned by BlackRock. Under the Investment Advisory Agreement, BFA is responsible for substantially all expenses of the Fund, except (i) interest andtaxes; (ii) brokerage commissions and other expenses connected with the execution of portfolio transactions; (iii) distribution fees; (iv) the advisory fee payable to BFA; and(v) litigation expenses and any extraordinary expenses (in each case as determined by a majority of the independent trustees).
For its investment advisory services to the Fund, BFA is entitled to an annual investment advisory fee of 0.89%, accrued daily and paid monthly by the Fund, based on theaverage daily net assets of the Fund.
The Subsidiary has entered into a separate contract with BFA under which BFA provides investment advisory services to the Subsidiary but does not receive separatecompensation from the Subsidiary for providing it with such services. The Subsidiary has also entered into separate arrangements that provide for the provision of otherservices to the Subsidiary (including administrative, custody, transfer agency and other services), and BFA pays the costs and expenses related to the provision of thoseservices.
Distributor: BlackRock Investments, LLC, an affiliate of BFA, is the distributor for the Fund. Pursuant to the distribution agreement, BFA is responsible for any fees orexpenses for distribution services provided to the Fund.
Officers and Trustees: Certain officers and/or trustees of the Trust are officers and/or trustees of BlackRock or its affiliates.
The Fund may invest its positive cash balances in certain money market funds managed by BFA or an affiliate. The income earned on these temporary cash investmentsis shown as dividends – affiliated in the consolidated statement of operations.
A fund, in order to improve its portfolio liquidity and its ability to track its underlying index, may invest in shares of other iShares funds that invest in securities in the fund’sunderlying index.
6. PURCHASES AND SALES
For the six months ended September 30, 2020, purchases and sales of investments, excluding short-term investments and in-kind transactions, were as follows:
iShares ETF Purchases Sales
India 50 . . . . . . . . . . . . . . . . . . . . . . . . . . . . . . . . . . . . . . . . . . . . . . . . . . . . . . . . . . . . . . . . . . . . . . . . . . . . . . . . . . . . . . . . . . . . . . . . . . . . . . . . . . . . . . . . . . . . . . . . . . . . . . . . . $31,406,019 $78,603,729
There were no in-kind transactions for the six months ended September 30, 2020.
Notes to Consolidated Financial Statements (unaudited) (continued)
15 2 0 2 0 I S H A R E S S E M I - A N N U A L R E P O R T T O S H A R E H O L D E R S

7. INCOME TAX INFORMATION
The Fund is treated as an entity separate from the Trust's other funds for federal income tax purposes. It is the policy of the Fund to qualify as a regulated investmentcompany by complying with the provisions applicable to regulated investment companies, as defined under Subchapter M of the Internal Revenue Code of 1986, asamended, and to annually distribute substantially all of its ordinary income and any net capital gains (taking into account any capital loss carryforwards) sufficient to relieveit from all, or substantially all, federal income and excise taxes. Accordingly, no provision for federal income taxes is required.
Management has analyzed tax laws and regulations and their application to the Fund as of September 30, 2020, inclusive of the open tax return years, and does not believethat there are any uncertain tax positions that require recognition of a tax liability in the Fund's consolidated financial statements.
As of March 31, 2020, the Fund had non-expiring capital loss carryforwards available to offset future realized capital gains of $79,418,544.
A fund may own shares in certain foreign investment entities, referred to, under U.S. tax law, as “passive foreign investment companies.” Such fund may elect tomark-to-market annually the shares of each passive foreign investment company and would be required to distribute to shareholders any such marked-to-market gains.
As of September 30, 2020, gross unrealized appreciation and depreciation based on cost of investments (including short positions and derivatives, if any) for U.S. federalincome tax purposes were as follows:
iShares ETF Tax CostGross Unrealized
AppreciationGross Unrealized
Depreciation
Net UnrealizedAppreciation
(Depreciation)
India 50 . . . . . . . . . . . . . . . . . . . . . . . . . . . . . . . . . . . . . . . . . . . . . . . . . . . . . . . . . . . . . . . . . . . . . . . . . . . . . . . . $373,667,372 $ 266,100,872 $ (56,259,263) $ 209,841,609
8. PRINCIPAL RISKS
In the normal course of business, the Fund invests in securities or other instruments and may enter into certain transactions, and such activities subject the Fund to variousrisks, including, among others, fluctuations in the market (market risk) or failure of an issuer to meet all of its obligations. The value of securities or other instruments mayalso be affected by various factors, including, without limitation: (i) the general economy; (ii) the overall market as well as local, regional or global political and/or socialinstability; (iii) regulation, taxation or international tax treaties between various countries; or (iv) currency, interest rate or price fluctuations. Local, regional or global eventssuch as war, acts of terrorism, the spread of infectious illness or other public health issues, recessions, or other events could have a significant impact on the Fund and itsinvestments. The Fund’s prospectus provides details of the risks to which the Fund is subject.
BFA uses a “passive” or index approach to try to achieve the Fund’s investment objective following the securities included in its underlying index during upturns as well asdownturns. BFA does not take steps to reduce market exposure or to lessen the effects of a declining market. Divergence from the underlying index and the compositionof the portfolio is monitored by BFA.
Market Risk: An outbreak of respiratory disease caused by a novel coronavirus has developed into a global pandemic and has resulted in closing borders, quarantines,disruptions to supply chains and customer activity, as well as general concern and uncertainty. The impact of this pandemic, and other global health crises that may arisein the future, could affect the economies of many nations, individual companies and the market in general in ways that cannot necessarily be foreseen at the present time.This pandemic may result in substantial market volatility and may adversely impact the prices and liquidity of a fund's investments. The duration of this pandemic and itseffects cannot be determined with certainty.
Valuation Risk: The market values of equities, such as common stocks and preferred securities or equity related investments, such as futures and options, may declinedue to general market conditions which are not specifically related to a particular company. They may also decline due to factors which affect a particular industry orindustries. A fund may invest in illiquid investments. An illiquid investment is any investment that a fund reasonably expects cannot be sold or disposed of in current marketconditions in seven calendar days or less without the sale or disposition significantly changing the market value of the investment. A fund may experience difficulty in sellingilliquid investments in a timely manner at the price that it believes the investments are worth. Prices may fluctuate widely over short or extended periods in response tocompany, market or economic news. Markets also tend to move in cycles, with periods of rising and falling prices. This volatility may cause a fund’s NAV to experiencesignificant increases or decreases over short periods of time. If there is a general decline in the securities and other markets, the NAV of a fund may lose value, regardlessof the individual results of the securities and other instruments in which a fund invests.
The price the Fund could receive upon the sale of any particular portfolio investment may differ from the Fund’s valuation of the investment, particularly for securities thattrade in thin or volatile markets or that are valued using a fair valuation technique or a price provided by an independent pricing service. Changes to significant unobservableinputs and assumptions (i.e., publicly traded company multiples, growth rate, time to exit) due to the lack of observable inputs.
Counterparty Credit Risk: The Fund may be exposed to counterparty credit risk, or the risk that an entity may fail to or be unable to perform on its commitments relatedto unsettled or open transactions, including making timely interest and/or principal payments or otherwise honoring its obligations. The Fund manages counterparty creditrisk by entering into transactions only with counterparties that the Manager believes have the financial resources to honor their obligations and by monitoring the financialstability of those counterparties. Financial assets, which potentially expose the Fund to market, issuer and counterparty credit risks, consist principally of financialinstruments and receivables due from counterparties. The extent of the Fund's exposure to market, issuer and counterparty credit risks with respect to these financial assetsis approximately their value recorded in the consolidated statement of assets and liabilities, less any collateral held by the Fund.
Notes to Consolidated Financial Statements (unaudited) (continued)
N O T E S T O C O N S O L I D A T E D F I N A N C I A L S T A T E M E N T S 16

A derivative contract may suffer a mark-to-market loss if the value of the contract decreases due to an unfavorable change in the market rates or values of the underlyinginstrument. Losses can also occur if the counterparty does not perform under the contract.
With exchange-traded futures, there is less counterparty credit risk to the Fund since the exchange or clearinghouse, as counterparty to such instruments, guaranteesagainst a possible default. The clearinghouse stands between the buyer and the seller of the contract; therefore, credit risk is limited to failure of the clearinghouse. Whileoffset rights may exist under applicable law, the Fund does not have a contractual right of offset against a clearing broker or clearinghouse in the event of a default (includingthe bankruptcy or insolvency). Additionally, credit risk exists in exchange-traded futures with respect to initial and variation margin that is held in a clearing broker’s customeraccounts. While clearing brokers are required to segregate customer margin from their own assets, in the event that a clearing broker becomes insolvent or goes intobankruptcy and at that time there is a shortfall in the aggregate amount of margin held by the clearing broker for all its clients, typically the shortfall would be allocated ona pro rata basis across all the clearing broker’s customers, potentially resulting in losses to the Fund.
Concentration Risk: A diversified portfolio, where this is appropriate and consistent with a fund’s objectives, minimizes the risk that a price change of a particularinvestment will have a material impact on the NAV of a fund. The investment concentrations within the Fund’s portfolio are disclosed in its consolidated schedule ofinvestments.
The Fund invests a significant portion of its assets in securities within a single or limited number of market sectors. When a Fund concentrates its investments in this manner,it assumes the risk that economic, regulatory, political and social conditions affecting such sectors may have a significant impact on the fund and could affect the incomefrom, or the value or liquidity of, the fund’s portfolio. Investment percentages in specific sectors are presented in the schedule of investments.
LIBOR Transition Risk: The United Kingdom’s Financial Conduct Authority announced a phase out of the London Interbank Offered Rate (“LIBOR”) by the end of 2021,and it is expected that LIBOR will cease to be published after that time. The Fund may be exposed to financial instruments tied to LIBOR to determine payment obligations,financing terms, hedging strategies or investment value. The transition process away from LIBOR might lead to increased volatility and illiquidity in markets for, and reducethe effectiveness of new hedges placed against, instruments whose terms currently include LIBOR. The ultimate effect of the LIBOR transition process on the Fund isuncertain.
9. CAPITAL SHARE TRANSACTIONS
Capital shares are issued and redeemed by the Fund only in aggregations of a specified number of shares or multiples thereof (“Creation Units”) at NAV. Except whenaggregated in Creation Units, shares of the Fund are not redeemable.
Transactions in capital shares were as follows:
Six Months Ended09/30/20
Year Ended03/31/20
iShares ETF Shares Amount Shares Amount
India 50Shares sold . . . . . . . . . . . . . . . . . . . . . . . . . . . . . . . . . . . . . . . . . . . . . . . . . . . . . . . . . . . . . . . . . . . . . . . . . . . . . . . . . . . . . . . . . . — $ — 3,500,000 $ 133,151,069Shares redeemed . . . . . . . . . . . . . . . . . . . . . . . . . . . . . . . . . . . . . . . . . . . . . . . . . . . . . . . . . . . . . . . . . . . . . . . . . . . . . . . . . . . . (1,750,000) (48,545,037) (6,650,000) (245,781,691)
Net decrease. . . . . . . . . . . . . . . . . . . . . . . . . . . . . . . . . . . . . . . . . . . . . . . . . . . . . . . . . . . . . . . . . . . . . . . . . . . . . . . . . . . . . . (1,750,000) $ (48,545,037) (3,150,000) $ (112,630,622)
The consideration for the purchase of Creation Units of a fund in the Trust generally consists of the in-kind deposit of a designated portfolio of securities and a specifiedamount of cash. Certain funds in the Trust may be offered in Creation Units solely or partially for cash in U.S. dollars. Investors purchasing and redeeming Creation Unitsmay pay a purchase transaction fee and a redemption transaction fee directly to State Street Bank and Trust Company, the Trust's administrator, to offset transfer and othertransaction costs associated with the issuance and redemption of Creation Units, including Creation Units for cash. Investors transacting in Creation Units for cash may alsopay an additional variable charge to compensate the relevant fund for certain transaction costs (i.e., stamp taxes, taxes on currency or other financial transactions, andbrokerage costs) and market impact expenses relating to investing in portfolio securities. Such variable charges, if any, are included in shares sold in the table above.
From time to time, settlement of securities related to in-kind contributions or in-kind redemptions may be delayed. In such cases, securities related to in-kind transactionsare reflected as a receivable or a payable in the consolidated statement of assets and liabilities.
10. LEGAL PROCEEDINGS
On June 16, 2016, investors in certain iShares funds (iShares Core S&P Small-Cap ETF, iShares Russell 1000 Growth ETF, iShares Core S&P 500 ETF, iShares RussellMid-Cap Growth ETF, iShares Russell Mid-Cap ETF, iShares Russell Mid-Cap Value ETF, iShares Select Dividend ETF, iShares Morningstar Mid-Cap ETF, iSharesMorningstar Large-Cap ETF, iShares U.S. Aerospace & Defense ETF and iShares Preferred and Income Securities ETF) filed a class action lawsuit against iShares Trust,BlackRock, Inc. and certain of its advisory affiliates, and certain directors/trustees and officers of the Funds (collectively, “Defendants”) in California State Court. The lawsuitalleges the Defendants violated federal securities laws by failing to adequately disclose in the prospectuses issued by the funds noted above the risks of using stop-lossorders in the event of a ‘flash crash’, such as the one that occurred on May 6, 2010. On September 18, 2017, the court issued a Statement of Decision holding that thePlaintiffs lack standing to assert their claims. On October 11, 2017, the court entered final judgment dismissing all of the Plaintiffs’ claims with prejudice. In an opinion datedJanuary 23, 2020, the California Court of Appeal affirmed the dismissal of Plaintiffs’ claims. On March 3, 2020, plaintiffs filed a petition for review by the California SupremeCourt. On May 27, 2020, the California Supreme Court denied Plaintiff’s petition for review. The case is now closed.
Notes to Consolidated Financial Statements (unaudited) (continued)
17 2 0 2 0 I S H A R E S S E M I - A N N U A L R E P O R T T O S H A R E H O L D E R S

11. SUBSEQUENT EVENTS
Management has evaluated the impact of all subsequent events on the Fund through the date the consolidated financial statements were available to be issued and hasdetermined that there were no subsequent events requiring adjustment or additional disclosure in the consolidated financial statements.
Notes to Consolidated Financial Statements (unaudited) (continued)
N O T E S T O F I N A N C I A L S T A T E M E N T S 18

iShares India 50 ETF (the “Fund”)
Under Section 15(c) of the Investment Company Act of 1940 (the “1940 Act”), the Trust's Board of Trustees (the “Board”), including a majority of Board Members who arenot “interested persons” of the Trust (as that term is defined in the 1940Act) (the “Independent Board Members), is required annually to consider and approve the InvestmentAdvisory Contract between the Trust and BFA (the “Advisory Contract”) whereby the Board and its committees (composed solely of Independent Board Members) assessBlackRock’s services to the Fund, including investment management; fund accounting; administrative and shareholder services; oversight of the Fund’s service providers;risk management and oversight; legal and compliance services; and ability to meet applicable legal and regulatory requirements. The Independent Board Membersrequested, and BFA provided, such information as the Independent Board Members, with advice from independent counsel, deemed reasonably necessary to evaluate theAdvisory Contract. At meetings on April 17, 2020 and May 19, 2020, a committee composed of all of the Independent Board Members (the “15(c) Committee”), withindependent counsel, met with management and reviewed and discussed information provided in response to initial requests of the 15(c) Committee and/or its independentcounsel, and requested certain additional information, which management agreed to provide. At a meeting held on June 8-10, 2020, the Board, including the IndependentBoard Members, reviewed the additional information provided by management in response to these requests.
After extensive discussions and deliberations, the Board, including all of the Independent Board Members, approved the continuance of the Advisory Contract for the Fund,based on a review of qualitative and quantitative information provided by BFA and their cumulative experience as Board Members. The Board noted its satisfaction with theextent and quality of information provided and its frequent interactions with management, as well as the detailed responses and other information provided by BFA. TheIndependent Board Members were advised by their independent counsel throughout the process, including about the legal standards applicable to their review. In approvingthe continuance of the Advisory Contract for the Fund, the Board, including the Independent Board Members, considered various factors, including: (i) the expenses andperformance of the Fund; (ii) the nature, extent and quality of the services provided by BFA; (iii) the costs of services provided to the Fund and profits realized by BFA andits affiliates; (iv) potential economies of scale and the sharing of related benefits; (v) the fees and services provided for other comparable funds/accounts managed by BFAand its affiliates; and (vi) other benefits to BFA and/or its affiliates. The material factors, none of which was controlling, and conclusions that formed the basis for the Board,including the Independent Board Members, to approve the continuance of the Advisory Contract are discussed below.
Expenses and Performance of the Fund: The Board reviewed statistical information prepared by Broadridge Financial Solutions Inc. (“Broadridge”), an independentprovider of investment company data, regarding the expense ratio components, including gross and net total expenses, fees and expenses of another fund in which theFund invests (if applicable), and waivers/reimbursements (if applicable) of the Fund in comparison with the same information for other ETFs (including, where applicable,funds sponsored by an “at cost” service provider), objectively selected by Broadridge as comprising the Fund’s applicable peer group pursuant to Broadridge’s proprietaryETF methodology (the “Peer Group”). The Board was provided with a detailed description of the proprietary ETF methodology used by Broadridge to determine the Fund’sPeer Group. The Board noted that, due to the limitations in providing comparable funds in the Peer Group, the statistical information provided in Broadridge’s report mayor may not provide meaningful direct comparisons to the Fund in all instances. The Board also noted that the overall fund expenses (net of waivers and reimbursements)for the Fund were higher than the median of overall fund expenses (net of waivers and reimbursements ) of the funds in its Peer Group, excluding iShares funds.
In addition, to the extent that any of the comparison funds included in the Peer Group, excluding iShares funds, track the same index as the Fund, Broadridge also provided,and the Board reviewed, a comparison of the Fund’s performance for the one-year, three-year, five-year, ten-year, and since inception periods, as applicable, and for thequarter ended December 31, 2019, to that of relevant comparison fund(s) for the same periods.
The Board noted that the Fund seeks to track its specified underlying index and that, during the year, the Board received periodic reports on the Fund’s short- andlonger-term performance in comparison with its underlying index. Such periodic comparative performance information, including additional detailed information asrequested by the Board, was also considered. The Board noted that the Fund generally performed in line with its underlying index over the relevant periods.
Based on this review, the other factors considered at the meeting, and their general knowledge of ETF pricing, the Board concluded that the investment advisory fee rateand expense level and the historical performance of the Fund supported the Board’s approval of the continuance of the Advisory Contract for the coming year.
Nature, Extent and Quality of Services Provided: Based on management’s representations, including information about recent and proposed enhancements to theiShares business, including with respect to capital markets support and analysis, technology, portfolio management, product design and quality, compliance and riskmanagement, global public policy and other services, the Board expected that there would be no diminution in the scope of services required of or provided by BFA underthe Advisory Contract for the coming year as compared with the scope of services provided by BFA during prior years. In reviewing the scope of these services, the Boardconsidered BFA’s investment philosophy and experience, noting that BFA and its affiliates have committed significant resources over time, including during the past year,to support the iShares funds and their shareholders and have made significant investments into the iShares business. The Board also considered BFA’s complianceprogram and its compliance record with respect to the Fund. In that regard, the Board noted that BFA reports to the Board about portfolio management and compliancematters on a periodic basis in connection with regularly scheduled meetings of the Board, and on other occasions as necessary and appropriate, and has providedinformation and made relevant officers and other employees of BFA (and its affiliates) available as needed to provide further assistance with these matters. The Board alsoreviewed the background and experience of the persons responsible for the day-to-day management of the Fund, as well as the resources available to them in managingthe Fund. In addition to the above considerations, the Board reviewed and considered detailed presentations regarding BFA’s investment performance, investment and riskmanagement processes and strategies, which were provided at the June 8-10, 2020 meeting and throughout the year.
Based on review of this information, and the performance information discussed above, the Board concluded that the nature, extent and quality of services provided to theFund under the Advisory Contract supported the Board’s approval of the continuance of the Advisory Contract for the coming year.
Costs of Services Provided to the Fund and Profits Realized by BFA and its Affiliates: The Board reviewed information about the estimated profitability to BlackRockin managing the Fund, based on the fees payable to BFA and its affiliates (including fees under the Advisory Contract), and other sources of revenue and expense to BFAand its affiliates from the Fund’s operations for the last calendar year. The Board reviewed BlackRock’s methodology for calculating estimated profitability of the iShares
Board Review and Approval of Investment Advisory Contract
19 2 0 2 0 I S H A R E S S E M I - A N N U A L R E P O R T T O S H A R E H O L D E R S

funds, noting that the 15(c) Committee and the Board had focused on the methodology and profitability presentation. The Board recognized that profitability may be affectedby numerous factors, including, among other things, fee waivers by BFA, the types of funds managed, expense allocations and business mix. The Board thus recognizedthat calculating and comparing profitability at individual fund levels is challenging. The Board discussed with management the sources of direct and ancillary revenue,including the revenues to BTC, a BlackRock affiliate, from securities lending by the Fund. The Board also discussed BFA’s estimated profit margin as reflected in the Fund’sprofitability analysis and reviewed information regarding potential economies of scale (as discussed below).
Based on this review, the Board concluded that the profits realized by BFA and its affiliates under the Advisory Contract and from other relationships between the Fund andBFA and/or its affiliates, if any, were within a reasonable range in light of the factors and other information considered.
Economies of Scale: The Board reviewed information and considered the extent to which economies of scale might be realized as the assets of the Fund increase, notingthat the issue of potential economies of scale had been focused on by the 15(c) Committee and the Board during their meetings and addressed by management. The 15(c)Committee and the Board received information regarding BlackRock’s historical estimated profitability, including BFA’s and its affiliates’ estimated costs in providingservices. The estimated cost information distinguished, among other things, between fixed and variable costs, and showed how the level and nature of fixed and variablecosts may impact the existence or size of scale benefits, with the Board recognizing that potential economies of scale are difficult to measure. The 15(c) Committee andthe Board reviewed information provided by BFA regarding the sharing of scale benefits with the iShares funds through various means, including, as applicable, throughrelatively low fee rates established at inception, breakpoints, waivers, or other fee reductions, as well as through additional investment in the iShares business and theprovision of improved or additional infrastructure and services to the iShares funds and their shareholders. The Board noted that the Advisory Contract for the Fund did notprovide for breakpoints in the Fund’s investment advisory fee rate as the assets of the Fund increase. However, the Board would continue to assess the appropriatenessof adding breakpoints in the future.
The Board concluded that this review of potential economies of scale and the sharing of related benefits, as well as the other factors considered at the meeting, supportedthe Board’s approval of the continuance of the Advisory Contract for the coming year.
Fees and Services Provided for Other Comparable Funds/Accounts Managed by BFA and its Affiliates: The Board considered information regarding the investmentadvisory/management fee rates for other funds/accounts in the U.S. for which BFA (or its affiliates) provides investment advisory/management services, including open-endfunds registered under the 1940 Act (including sub-advised funds), collective trust funds, and institutional separate accounts (collectively, the “Other Accounts”). The Boardacknowledged BFA’s representation that the iShares funds are fundamentally different investment vehicles from the Other Accounts. The Board noted that BFA and itsaffiliates do not manage Other Accounts with substantially the same investment objective and strategy as the Fund and that track the same index as the Fund. The Boardfurther noted that BFA provided the Board with detailed information regarding how the Other Accounts generally differ from the Fund, including in terms of the types ofservices and generally more extensive services provided to the Fund, as well as other significant differences. In that regard, the Board considered that the pricing of servicesto institutional clients is typically based on a number of factors beyond the nature and extent of the specific services to be provided and often depends on the overallrelationship between the client and its affiliates and the adviser and its affiliates. In addition, the Board considered the relative complexity and inherent risks and challengesof managing and providing other services to the Fund, as a publicly traded investment vehicle, as compared to the Other Accounts, particularly those that are institutionalclients, in light of differing regulatory requirements and client-imposed mandates. The Board also acknowledged management’s assertion that, for certain iShares funds,and for client segmentation purposes, BlackRock has launched an iShares fund that may provide a similar investment exposure at a lower investment advisory fee rate.The Board also considered the “all-inclusive” nature of the Fund’s advisory fee structure, and the Fund’s expenses borne by BFA under this arrangement. The Board notedthat the investment advisory fee rate under the Advisory Contract for the Fund was generally higher than the investment advisory/management fee rates for certain of theOther Accounts (particularly institutional clients) and concluded that the differences appeared to be consistent with the factors discussed.
Other Benefits to BFA and/or its Affiliates: The Board reviewed other benefits or ancillary revenue received by BFA and/or its affiliates in connection with the servicesprovided to the Fund by BFA, both direct and indirect, such as payment of revenue to BTC, the Fund’s securities lending agent, for loaning portfolio securities (which wasincluded in the profit margins reviewed by the Board pursuant to BFA’s estimated profitability methodology), payment of advisory fees or other fees to BFA (or its affiliates)in connection with any investments by the Fund in other funds for which BFA (or its affiliates) provides investment advisory services or other services and BlackRock’s profilein the investment community. The Board also noted the revenue received by BFA and/or its affiliates pursuant to an agreement that permits a service provider to use certainportions of BlackRock’s technology platform to service accounts managed by BFA and/or its affiliates, including the iShares funds. The Board noted that BFA generally doesnot use soft dollars or consider the value of research or other services that may be provided to BFA (including its affiliates) in selecting brokers for portfolio transactions forthe Fund. The Board further noted that any portfolio transactions on behalf of the Fund placed through a BFA affiliate or purchased from an underwriting syndicate in whicha BFA affiliate participates (including associated commissions) are reported to the Board pursuant to Rule 17e-1 or Rule 10f-3, as applicable, under the 1940 Act. The Boardconcluded that any such ancillary benefits would not be disadvantageous to the Fund and thus would not alter the Board’s conclusion with respect to the appropriatenessof approving the continuance of the Advisory Contract for the coming year.
Conclusion: Based on a review of the factors described above, as well as such other factors as deemed appropriate by the Board, the Board, including all of theIndependent Board Members, determined that the Fund’s investment advisory fee rate under the Advisory Contract does not constitute a fee that is so disproportionatelylarge as to bear no reasonable relationship to the services rendered and that could not have been the product of arm’s-length bargaining, and concluded to approve thecontinuance of the Advisory Contract for the coming year.
Board Review and Approval of Investment Advisory Contract (continued)
B O A R D R E V I E W A N D A P P R O V A L O F I N V E S T M E N T A D V I S O R Y C O N T R A C T 20

Section 19(a) Notices
The amounts and sources of distributions reported are estimates and are being provided pursuant to regulatory requirements and are not being provided for tax reportingpurposes. The actual amounts and sources for tax reporting purposes will depend upon the Fund's investment experience during the year and may be subject to changesbased on tax regulations. Shareholders will receive a Form 1099-DIV each calendar year that will inform them how to report these distributions for federal income taxpurposes.
September 30, 2020
Total Cumulative Distributionsfor the Fiscal Year-to-Date
% Breakdown of the Total CumulativeDistributions for the Fiscal Year-to-Date
iShares ETF
NetInvestment
IncomeNet Realized
Capital GainsReturn of
CapitalTotal Per
Share
NetInvestment
IncomeNet Realized
Capital GainsReturn of
CapitalTotal Per
Share
India 50(a). . . . . . . . . . . . . . . . . . . . . . . . . . . . . . . . . . . . . . . . $ — $ — $0.032761 $0.032761 —% —% 100% 100%
(a) The Fund estimates that it has distributed more than its net investment income and net realized capital gains; therefore, a portion of the distribution may be a return of capital. A returnof capital may occur, for example, when some or all of the shareholder's investment in the Fund is returned to the shareholder. A return of capital does not necessarily reflect theFund's investment performance and should not be confused with "yield" or "income". When distributions exceed total return performance, the difference will incrementally reduce theFund's net asset value per share.
Supplemental Information (unaudited)
21 2 0 2 0 I S H A R E S S E M I - A N N U A L R E P O R T T O S H A R E H O L D E R S

Electronic Delivery
Shareholders can sign up for email notifications announcing that the shareholder report or prospectus has been posted on the iShares website at iShares.com. Once youhave enrolled, you will no longer receive prospectuses and shareholder reports in the mail.
To enroll in electronic delivery:
• Go to icsdelivery.com.• If your brokerage firm is not listed, electronic delivery may not be available. Please contact your broker-dealer or financial advisor.
Householding
Householding is an option available to certain fund investors. Householding is a method of delivery, based on the preference of the individual investor, in which a single copyof certain shareholder documents can be delivered to investors who share the same address, even if their accounts are registered under different names. Please contactyour broker-dealer if you are interested in enrolling in householding and receiving a single copy of prospectuses and other shareholder documents, or if you are currentlyenrolled in householding and wish to change your householding status.
Availability of Quarterly Schedule of Investments
The iShares Funds file their complete schedule of portfolio holdings with the SEC for the first and third quarters of each fiscal year as an exhibit to its reports on FormN-PORT. The iShares Fund's Forms N-PORT are available on the SEC’s website at sec.gov. The iShares Funds also disclose their complete schedule of portfolio holdingson a daily basis on the iShares website at iShares.com.
Availability of Proxy Voting Policies and Proxy Voting Records
A description of the policies and procedures that the iShares Funds use to determine how to vote proxies relating to portfolio securities and information about how theiShares Funds voted proxies relating to portfolio securities during the most recent twelve-month period ending June 30 is available without charge, upon request (1) bycalling toll-free 1-800-474-2737; (2) on the iShares website at iShares.com; and (3) on the SEC website at sec.gov.
A description of the Company's policies and procedures with respect to the disclosure of the Fund's portfolio securities is available in the Fund Prospectus. The Funddiscloses its portfolio holdings daily and provides information regarding its top holdings in Fund fact sheets at iShares.com.
General Information
G E N E R A L I N F O R M A T I O N 22

THIS PAGE INTENTIONALLY LEFT BLANK.

Want to know more?iShares.com | 1-800-474-2737
This report is intended for the Fund's shareholders. It may not be distributed to prospective investors unless it is
preceded or accompanied by the current prospectus.
Investing involves risk, including possible loss of principal.
The iShares Funds are distributed by BlackRock Investments, LLC (together with its affiliates, “BlackRock”).
The iShares Funds are not sponsored, endorsed, issued, sold or promoted by India Index Services & Products Ltd., nor
does this company make any representation regarding the advisability of investing in the iShares Funds. BlackRock is
not affiliated with the company listed above.
©2020 BlackRock, Inc. All rights reserved. iSHARES and BLACKROCK are registered trademarks of BlackRock, Inc. or its
subsidiaries. All other marks are the property of their respective owners.
iS-SAR-307-0920