2020 review of the national quality use of medicines
TRANSCRIPT

2020 Review of
the National Quality Use of Medicines Indicators
for Australian Hospitals:
Report on use, relevance and potential for automation
using electronic medical records
July 2021

Report: 2020 Review of the NQUM Indicators for Australian Hospitals | NSW TAG | July 2021 | Page 2 of 46
New South Wales Therapeutic Advisory Group Inc. is an initiative of NSW clinical pharmacologists and
pharmacists and is funded by NSW Health.
Address:
NSW TAG
26 Leichhardt Street
Darlinghurst NSW, Australia, 2010
Phone: (02) 8382 2852
Email: [email protected]
Web: www.nswtag.org.au
ABN: 82 707 308 091
Disclosure
The development of this report was funded by NSW Health.
Copyright
© NSW Therapeutic Advisory Group Inc 2021
Requests and inquiries concerning reproduction and rights for purposes other than those indicated above requires the
written permission of NSW Therapeutic Advisory Group Inc.:
NSW Therapeutic Advisory Group Inc. 26 Leichhardt Street, Darlinghurst NSW 2010 or [email protected]
Suggested citation
NSW Therapeutic Advisory Group. 2020 Review of the National Quality Use of Medicine Indicators for Australian Hospitals:
Report on use, relevance and potential for automation using electronic medical records. NSW TAG. July 2021.
This document is available on the NSW Therapeutic Advisory Group website at www.nswtag.org.au
Disclaimer
Whilst the information contained in this document has been presented with all due care, NSW TAG does not warrant or
represent that the information is free from errors or omission. Changes in circumstances after publication may impact on
the accuracy of the information. The information provided should not be regarded as a substitute for detailed expert
advice in individual cases. NSW TAG will accept no responsibility for any loss, claim or damage suffered or caused by any
person acting or refraining from action as a result of any material in this publication.
ISBN 978-0-6480174-4-8 (Online)

Report: 2020 Review of the NQUM Indicators for Australian Hospitals | NSW TAG | July 2021 | Page 3 of 46
Table of Contents
List of Figures and Tables ............................................................................................................................... 3
List of abbreviations ....................................................................................................................................... 4
Background ..................................................................................................................................................... 5
Aims ................................................................................................................................................................. 5
Methodology................................................................................................................................................... 5
Results ............................................................................................................................................................. 6
1. Use of NQUM Indicators ............................................................................................................................................................... 7
2. Comparative indicator collections .......................................................................................................................................... 10
3. Prioritisation for automation ................................................................................................................................................... 13
4. Suggested modifications to existing NQUM Indicators ................................................................................................... 15
5. New QUM indicators suggested for development............................................................................................................. 16
6. Other issues raised ...................................................................................................................................................................... 17
Discussion ......................................................................................................................................................18
Limitations.....................................................................................................................................................22
Conclusions ...................................................................................................................................................22
References .....................................................................................................................................................23
Appendices ....................................................................................................................................................24
Acknowledgments ........................................................................................................................................44
List of Figures and Tables
Figure 1: Participation in each survey according to jurisdictions .....................................................................6
Figure 2: Frequency of use of NQUM Indicators ..................................................................................................7
Figure 3: Frequency of amendments to NQUM Indicators ..............................................................................10
Figure 4: NQUM Indicator prioritisation for eMR automation ........................................................................13
Table 1: Top 10 NQUM Indicators reported as used once or more (as proportion of responses) ..............8
Table 2: NQUM Indicators least used by respondents ........................................................................................9
Table 3: NQUM Indicator alignment with other current national indicator sets .........................................11
Table 4: Overall prioritisation for automation into eMR ..................................................................................14
Table 5: Relative individual prioritisation for automation into eMR .............................................................14
Table 6: Proposed amendments to existing NQUM Indicators .......................................................................15
Report: 2020 Review of the NQUM Indicators for Australian Hospitals | NSW TAG | July 2021 | Page 4 of 46
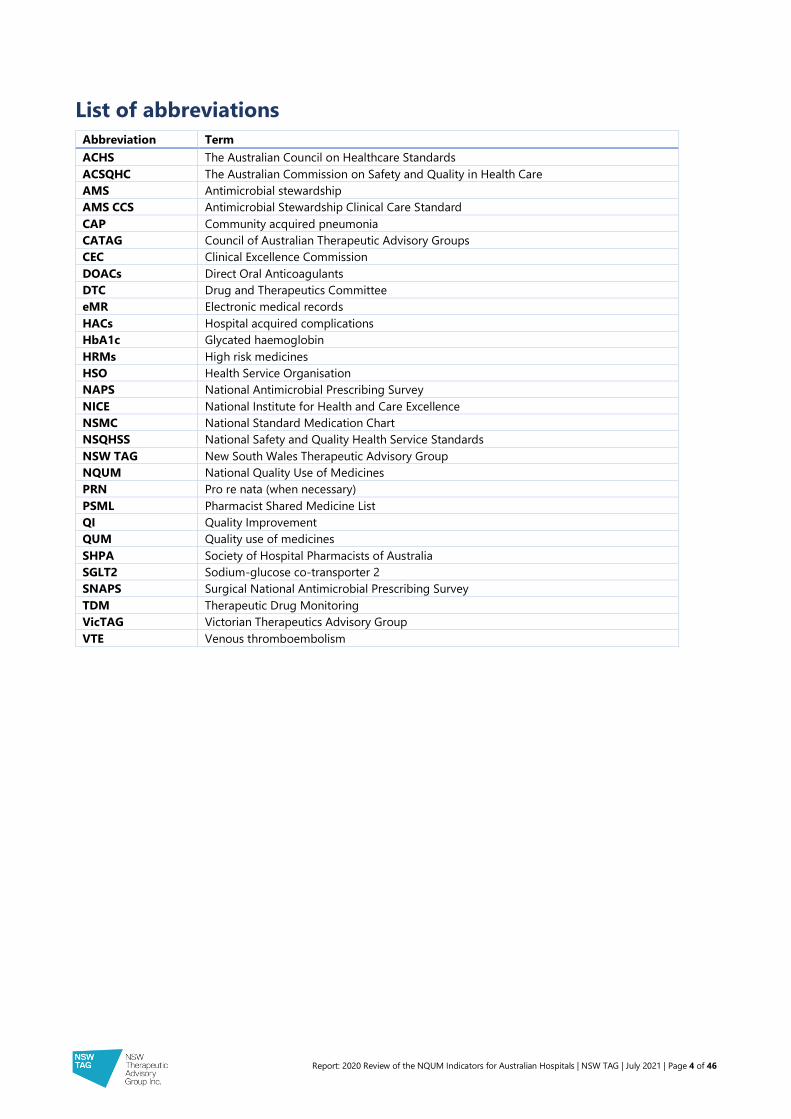
List of abbreviations
Abbreviation Term
ACHS The Australian Council on Healthcare Standards
ACSQHC The Australian Commission on Safety and Quality in Health Care
AMS Antimicrobial stewardship
AMS CCS Antimicrobial Stewardship Clinical Care Standard
CAP Community acquired pneumonia
CATAG Council of Australian Therapeutic Advisory Groups
CEC Clinical Excellence Commission
DOACs Direct Oral Anticoagulants
DTC Drug and Therapeutics Committee
eMR Electronic medical records
HACs Hospital acquired complications
HbA1c Glycated haemoglobin
HRMs High risk medicines
HSO Health Service Organisation
NAPS National Antimicrobial Prescribing Survey
NICE National Institute for Health and Care Excellence
NSMC National Standard Medication Chart
NSQHSS National Safety and Quality Health Service Standards
NSW TAG New South Wales Therapeutic Advisory Group
NQUM National Quality Use of Medicines
PRN Pro re nata (when necessary)
PSML Pharmacist Shared Medicine List
QI Quality Improvement
QUM Quality use of medicines
SHPA Society of Hospital Pharmacists of Australia
SGLT2 Sodium-glucose co-transporter 2
SNAPS Surgical National Antimicrobial Prescribing Survey
TDM Therapeutic Drug Monitoring
VicTAG Victorian Therapeutics Advisory Group
VTE Venous thromboembolism

Report: 2020 Review of the NQUM Indicators for Australian Hospitals | NSW TAG | July 2021 | Page 5 of 46
Background
The New South Wales Therapeutic Advisory Group (NSW TAG), supported by the Clinical
Excellence Commission (CEC), published a set of thirty indicators to measure and monitor
Quality Use of Medicines (QUM) in Australian hospitals in 2007. With funding support from
the Australian Commission in Safety and Quality in Health Care (ACSQHC), these indicators
were reviewed, revised and expanded and published as the National Quality Use of Medicine
Indicators for Australian Hospitals (NQUM Indicators) in 2014.1 These indicators measure
adherence to processes of medicines management shown to improve health outcomes.
The current thirty-seven indicatorsi (see Appendix 1) have seven themes:
• antithrombotic therapy;
• antibiotic therapy;
• medication ordering;
• pain management;
• continuity of care;
• hospital-wide medication management policies; and
• acute mental health care.
Practice change, evidence-based gaps in care which have been resolved and new emerging
gaps mean that the NQUM Indicators require periodic review, updating and potential
archiving. Moreover, the implementation and embedding of quality improvement (QI)
strategies will be more achievable when measurement becomes more efficient and routine,
for example by utilising electronic medical records (eMRs) for data collection.
Aims
The review aimed to:
• determine the overall utilisation and relevance of the NQUM Indicators;
• describe clinicians’ priorities for NQUM Indicator automation within eMR; and
• explore potential improvements to existing NQUM Indicators and potentially new QUM
indicators.
Methodology
A series of six online questionnaires (using the Survey Monkey® platform) were developed
and distributed in sequence (Appendix 2-6), via NSW TAG and the Council of Australian
Therapeutic Advisory Groups (CATAG) email distribution lists. They were also advertised in
the NSW TAG weekly newsletter (TAG Mail) and Society of Hospital Pharmacists of Australia
(SHPA) member network specialty stream discussion forums and SHPA weekly eNews
bulletin. Clinicians, with an understanding of QUM activities, were invited to participate and
circulate to appropriate colleagues. Multiple responses per hospital or health district were
possible. When this occurred, responses were recorded individually, as reported usage and
prioritisation for automation varied between individual clinicians and could not be combined.
i NSW TAG has also recently published an additional polypharmacy indicator set with seven individual indicators. These are not
included in this report.

Report: 2020 Review of the NQUM Indicators for Australian Hospitals | NSW TAG | July 2021 | Page 6 of 46
The surveys requested responses to a) participants’ frequency of use of the 2014 NQUM
Indicators; b) participants’ prioritisation for automation of NQUM Indicators using eMR data;
c) suggested improvements to existing NQUM Indicators; and d) participants’ suggestions
for new QUM indicators. Use of a NQUM Indicator was described if it had been measured
and reported for QUM purposes within the relevant HSO in the previous 6 years (i.e. from
2014, when the most recent version of the NQUM Indicators was published). Respondents
could specify use of each NQUM Indicator as “not used”, “used once”, “used more than one”,
“used frequently” and/or “used an amended version”.
Responses were collated and analysed by February 2021. A number of sites and jurisdictions
were contacted directly to gain more information and a better understanding of coordinated
indicator activities/programs.
Responses were described according to their jurisdictions, frequency of use, frequency and
type of amendments, prioritisation for automation using eMR, suggested modifications and
suggestions for new QUM indicators. The NQUM Indicators were also compared with other
indicator sets for similarity.
Results
Responses were received from 186 participants across the six surveys (average 30 per
survey). Responses were received from public and private health service organisations (HSOs)
in metropolitan and regional Australia as well as one national pillar organisation. All
Australian states and territories provided responses. Participation according to jurisdictions is
displayed in Figure 1.
Figure 1: Participation in each survey according to jurisdictions, n=182* *Excludes four responses from one national pillar organisation.
There were 14 instances where more than one response was provided per hospital. However,
these reflected difference experiences or expertise of respondents and were therefore
reported individually. For example, in the antithrombotic therapy survey there were three
responses provided from one hospital including a response from a medical advanced trainee,
a staff specialist and a senior pharmacist.
0
10
20
30
40
Antithrombotic Antibiotic Continuity of care Medicationordering
Acute mentalhealth care
Pain & MedsManagement
Policies
Nu
mb
er o
f re
spo
nd
ents
NQUM Indicator surveys
ACT NSW NT QLD SA TAS VIC WA

Report: 2020 Review of the NQUM Indicators for Australian Hospitals | NSW TAG | July 2021 | Page 7 of 46
1. Use of NQUM Indicators
Figure 2 displays the frequency of use of the 37 NQUM Indicators (either as originally designed or amended).
Figure 2: Frequency of use of NQUM Indicators, n=182
0%
10%
20%
30%
40%
50%
60%
70%
80%
90%
100%
1.1 1.2 1.3 1.4 1.5 1.6 2.1 2.2 2.3 2.4 2.5 3.1 3.2 3.3 3.4 3.5 3.6 4.1 4.2 5.1 5.2 5.3 5.4 5.5 5.6 5.7 5.8 5.9 6.1 6.2 6.3 6.4 7.1 7.2 7.3 7.4 7.5
Freq
uen
cy (
pro
po
rtio
n)
NQUM Indicator
Used once or more Not used

Report: 2020 Review of the NQUM Indicators for Australian Hospitals | NSW TAG | July 2021 | Page 8 of 46
1.1 Frequently Used Indicators
Table 1 indicates the NQUM Indicators most commonly used by hospitals according to their
QUM domain. NQUM Indicators for pain management (4.1 and 4.2) were not used as
commonly as NQUM Indicators in the other therapeutic themes and are not displayed in
Table 1.
Table 1: Top 10 NQUM Indicators reported as used once or more (as proportion of
responses), n=182
NQUM Indicator number and description QUM domain Use by
Respondents
Antithrombotic therapy
1.1 Appropriate VTE risk assessment Judicious selection 65%
1.3 Appropriate enoxaparin dosing Safe and effective use 60%
Antibiotic therapy
2.1 Appropriate antibiotic prophylaxis for surgery Appropriate choice
Safe and effective use
66%
2.2 DTC-concordant use of restricted antibiotics Appropriate choice
Safe and effective use
59%
Medication ordering
3.1 Appropriate medication reconciliation Appropriate choice
Safe and effective use
94%
3.2 Appropriate documentation of ADRs Appropriate choice
Safe and effective use
91%
3.3 Appropriate documentation of abbreviations Safe and effective use 67%
Continuity of care
5.9 Appropriate provision of medication list on
discharge
Safe and effective use 59%
Hospital-wide medication management policies
6.1 Appropriate potassium ampoule storage Safe and effective use 74%
6.2 Timely clinical pharmacist review Judicious selection
Appropriate choice
74%

Report: 2020 Review of the NQUM Indicators for Australian Hospitals | NSW TAG | July 2021 | Page 9 of 46
1.2 Under-utilised NQUM Indicators
All indicators had been used by one or more respondent at some stage. However, some
indicators were more commonly ‘not used’ and are displayed in Figure 2 and in Table 2,
according to therapeutic theme and QUM domain. The NQUM Indicator least used was
indicator 6.3 (by 5% of respondents).
Table 2: NQUM Indicators least used by respondents, n=182
NQUM Indicator number and title QUM domain Respondents
Antithrombotic therapy
1.6 Percentage of patients with atrial fibrillation that are
discharged on oral anticoagulants
Judicious selection 25%
Continuity of care
5.6 Appropriate provision of asthma action plan at discharge Safe and effective use 14%
5.7 Percentage of patients receiving sedatives at discharge that
were not taking them at admission
Judicious selection 28%
Hospital wide medication management policies
6.3 Percentage of parenteral opioid dosage units that are
pethidine
Appropriate choice 5%
Acute mental health care
7.3 Percentage of patients who receive written and verbal
information on regular psychotropic medicines initiated during
their admission
Safe and effective use 29%
1.3 Amendments made to NQUM Indicators
Respondents documented eighty occasions when an amended version of an NQUM
Indicator had been used. The most commonly amended NQUM Indicators were 2.1, 3.1 and
3.3 (see Figure 3).
Reasons for amendment included:
• Adaptation for paediatric hospital (NQUM Indicator 5.4) and residential aged care
facilities (Indicators 1.1, 1.2, 1.6)
• Modification of assessment tool into Quality Audit Reporting System (QARS)ii (NQUM
Indicator 1.1, 6.1)
• Addition of venous thromboembolism (VTE) prophylaxis policy components into
assessment tool (NQUM Indicator 1.1)
• Modification to capture implementation of an electronic medication transfer summary
made by pharmacists (NQUM Indicator 5.3)
• Amendment to use electronic medication management system analytics and capture
data electronically (NQUM Indicators 3.1, 3.2, 3.3, 3.4, 3.5, 3.6, 6.1, 6.2, 6.2)
ii Quality Audit Reporting System (QARS) is an electronic tool created by the Clinical Excellence Commission available for health
entities to collect data to help drive the implementation of safety and quality systems.

Report: 2020 Review of the NQUM Indicators for Australian Hospitals | NSW TAG | July 2021 | Page 10 of 46
• Amendment to better capture local policy/guidelines or to fit in with other program
requirements (NQUM Indicators 2.1, 2.2, 2.4, 2.5, 3.1, 3.2, 3.3, 3.4, 3.5, 3.6, 5.1, 5.2, 5.3, 5.8)
• Amendment to include whether there had been a de-escalation plan developed for
antipsychotic polypharmacy (NQUM Indicator 7.5)
• Combining several indicators onto one survey to improve time efficiency for
accreditation preparation (NQUM Indicators 3.1, 3.2).
Figure 3: Frequency of amendments to NQUM Indicators, n=79
One respondent noted they have a Cerner® PowerPlan® in the eMR for baseline monitoring
for patients prescribed lithium (equivalent to NQUM Indicator 7.2). NQUM Indicator 4.1 was
amended by another respondent to record pain at rest as well as movement.
2. Comparative indicator collections
Respondents acknowledged there was overlap in other data collected/audits performed,
particularly in the antimicrobial stewardship field, which may have contributed to a reduced
utility of the NQUM Indicators. Conversely, many NQUM indicators provided useful evidence
for purposes of accreditation for the National Safety and Quality Health Service Standards
(NSQHSS) and have mandatory reporting requirements in some HSOs. Table 3 outlines the
crossover of indicator content.
0
1
2
3
4
5
6
7
1.1
1.2
1.3
1.4
1.5
1.6
2.1
2.2
2.3
2.4
2.5
3.1
3.2
3.3
3.4
3.5
3.6
4.1
4.2
5.1
5.2
5.3
5.4
5.5
5.6
5.7
5.8
5.9
6.1
6.2
6.3
6.4
7.1
7.2
7.3
7.4
7.5
Nu
mb
er o
f re
spo
nd
ents
NQUM Indicator number

Report: 2020 Review of the NQUM Indicators for Australian Hospitals | NSW TAG | July 2021 | Page 11 of 46
Table 3: NQUM Indicator alignment with other current national indicator sets
NQUM Indicator ACHS NSQHSS NSMC audit APAC AMS CCS NAPS
1.1 7.1 4.1 6.1
1.2 3.1* 4.1/4.2 6.2
1.3 1.1 4.1/4.2
1.4 1.2 4.1/4.15
1.5 1.3 4.2 GP5
1.6 4.10
2.1 1.5, 2.1-2.9, 5.1€ 3.15/3.16 8a/b/c
2.2 2.1 3.15/3.16 2a/b
2.3 2.2 3.15/3.16 GP5 8d
2.4 3.15/3.16
2.5 2.3 3.15/3.16 2a/b
3.1 3.1 4.5/4.6 5.1 GP3/4/5/6
3.2 3.2 4.7/4.8 4.1/4.2/4.3 GP4 3a¥ ¥
3.3 3.3 10.3/11.3 GP5
3.4 10.7
3.5 4.2 GP5
3.6 3.4 4.1
4.1 4.1 4.1
4.2 4.11 GP7
5.1 4.2 6b/c‡
5.2 1.1-1.3 4.2
5.3 5.1 4.12 GP 3/7/9
5.4 5.2 4.11 9.2 GP /7/9
5.5 5.3** 4.11/4.12 GP9
5.6 5.3** 4.11/4.12
5.7 5.4 4.15
5.8 5.5 4.12 GP 1/2
5.9 5.6 4.11/4.12 GP 1
6.1 4.14/4.15
6.2 6.1 4.10 7.1 GP5
6.3 4.14/4.15
6.4
7.1 4.2 11.2/11.3/11.4 GP 5
7.2 4.2 GP 5
7.3 3.4 4.11 GP 7/9
7.4 3.7 4.2 GP 5
7.5 3.5 GP 5
* ICU specific; € modified wording; ¥ antimicrobial specific; ‡ Acute coronary syndrome clinical care standard2
ACHS: The Australian Council on Healthcare Standards; NSQHSS: National Safety and Quality Health Service Standards; NSMC: National Standard Medication Chart;
APAC: Australian Pharmaceutical Advisory Council; AMS CCS: Antimicrobial Stewardship Clinical Care Standard; NAPS: National Antimicrobial Prescribing Survey
Top 10 NQUM Indicators in use
10 NQUM Indicators least commonly used

Report: 2020 Review of the NQUM Indicators for Australian Hospitals | NSW TAG | July 2021 | Page 12 of 46
The Australian Council on Healthcare Standards (ACHS)3: A number of the NQUM
Indicators have been included in ACHS accreditation programs. These indicators are already
in wide use throughout Australia including the private hospital sector and may be used in
the present Evaluation and Quality Improvement Program (EQuIP 6), to satisfy evidence
required for mandatory ACHS criteria.
ACSQHC National Standard Medication Chart (NSMC) audit4: This program audits the
safe and quality use of paper-based medication charts which may become less necessary in
sites, as electronic medication management systems are implemented and forcing functions
prevent a multitude of errors usually detected by this audit.
Australian Pharmaceutical Advisory Council (APAC) Guiding Principles to Achieve
Continuity in Medication Management (2005)5: This widely recognised practice standard
for continuity of care from acute to community sectors includes several guiding principles
relating to the NQUM Indicators.
National Antimicrobial Prescribing Survey (NAPS)6: NAPS is a voluntary annual audit and
review of antimicrobial use, which targets compliance with prescribing guidelines and
prescribing appropriateness. It allows benchmarking against peer hospitals. More recently,
there has been a surgical focused NAPS (SNAPS), which investigates procedural and post-
procedural prescribing practices.
ACSQHC Antimicrobial Stewardship Clinical Care Standard (AMS CCS)7: This Standard
provides guidance to clinicians and health service managers on delivering appropriate care
when prescribing antimicrobials. It includes 8 quality statements and a set of 10
corresponding indicators. Other relevant clinical care standards (CCS) in use include acute
coronary syndromes and delirium. Low back pain and sepsis are currently in development
and may also have some crossover with NQUM Indicators.

Report: 2020 Review of the NQUM Indicators for Australian Hospitals | NSW TAG | July 2021 | Page 13 of 46
3. Prioritisation for automation
Data collection from the eMR represents an opportunity to utilise a less resource intense
mechanism to collect data, allow more comprehensive data collection/analysis, assist with
monitoring of medicines use for Drug and Therapeutics Committees (DTCs) and expedite
QUM-related QI project processes. Participants were asked to nominate which NQUM
Indicators they believed would be beneficial to automate using eMR. Figure 4 outlines
participant support for automation across all the NQUM Indicators.
Figure 4: NQUM Indicator prioritisation for eMR automation, n=168iii
iii All 186 respondents had the opportunity to provide feedback. Number of responses varied per theme but a response rate of
>90% was obtained for each theme with the exception of antibiotic theme with a response rate of 81%.
0%
20%
40%
60%
80%
100%
1.1
1.2
1.3
1.4
1.5
1.6
2.1
2.2
2.3
2.4
2.5
3.1
3.2
3.3
3.4
3.5
3.6
4.1
4.2
5.1
5.2
5.3
5.4
5.5
5.6
5.7
5.8
5.9
6.1
6.2
6.3
6.4
7.1
7.2
7.3
7.4
7.5
Per
cen
tage
of
resp
on
den
ts
NQUM Indicator number
Yes/Maybe No

Report: 2020 Review of the NQUM Indicators for Australian Hospitals | NSW TAG | July 2021 | Page 14 of 46
Table 4 outlines the NQUM Indicators given the highest and lowest rated priority for
automation. The NQUM Indicator with unanimous support for automation was NQUM
Indicator 4.2 (percentage of postoperative patients that are given a written pain
management plan at discharge AND a copy if communicated to the primary care clinician).
Conversely, the largest proportion of participants believed NQUM Indicator 6.3 should not
be automated (percentage of parenteral opioid dosage units that are pethidine).
Table 4: Overall prioritisation for automation into eMR, n=168iii
NQUM Indicator set Highest priority for automation
(support from > 80% of respondents)
Lowest prioritisation for automation
(support from < 70% of respondents)
Antithrombotic 1.1*, 1.2* and 1.6 1.4
Antibiotic 2.2, 2.5* 2.1, 2.3
Medication ordering 3.1*, 3.2, 3.5 3.3
Pain management 4.1, 4.2*
Continuity of care 5.3, 5.5, 5.7*, 5.8, 5.9*
Medication
management policies
6.2* 6.1, 6.3, 6.4
Acute mental health 7.2, 7.3*, 7.4, 7.5
* Highest score within each NQUM Indicator set
Within each survey and corresponding NQUM Indicator set, participants were asked to
nominate which ONE indicator was their highest priority for automation (see Table 5).
Table 5: Relative individual prioritisation for automation into eMR, n=168iii
NQUM Indicator set
according to theme
Highest ranked indicator for automation in each
theme
Antibiotic 2.1
Medication ordering 3.1
Pain management 4.2
Continuity of care 5.8
Medication management policies 6.2
Acute mental health 7.5

Report: 2020 Review of the NQUM Indicators for Australian Hospitals | NSW TAG | July 2021 | Page 15 of 46
4. Suggested modifications to existing NQUM Indicators
Participants provided feedback on suggested amendments to update the NQUM Indicator
sets. Table 6 outlines proposed amendments to the existing indicators.
Table 6: Proposed amendments to existing NQUM Indicators
NQUM
Indicator
Proposed amendment
2.4 Better align with therapeutic guidelines stratification of community acquired pneumonia (CAP)
severity.
3.1-3.6 Rebadge as “medicines documentation” or “medicines management”.
3.3 Include verification process/step (particularly important for chemotherapy orders) OR consider
archiving – potentially redundant due to forcing functions in eMR (i.e. only relevant for hospitals
using paper charts).
3.4 Amend to percentage of medication orders that include weight (perhaps also date of birth & basis
for dose calculations).
3.6 Modernise to align with digital health system developments e.g. VicTAG chemotherapy audit
toolkit.8
4.2 Remove criteria that plan is “communicated to primary care clinician” which may be difficult to
capture; or modernise to align with digital health systems such as My Health Record, which
includes the Pharmacist Shared Medicines List (PSML).9
5.1-5.9 Rebadge as “transitions of care”.
5.4 Include oral direct thrombin inhibitors and Factor Xa inhibitors.
5.7 Include antipsychotics on discharge (to capture delirium population).
6.1 Percentage of medication storage areas outside pharmacy where the storage of potassium does
not comply with hospital policy requirements (to address policy compliance).
6.3 Archive.
7.1-7.5 Clarify definitions of psychotropic vs antipsychotic.
7.1-7.5 Consider reframing to include other uses of psychotropics e.g. cognitive disorders or separate
indicator set to capture inappropriate use of antipsychotics for patients in aged care facilities and
disabilities etc.
7.1 Consider Medication Safety in Mental Health scoping study re: variety of interpretations for “PRN”
as needed for treating symptoms or mental illness, evaluation of their effects and documenting
reason for or expected outcomes.
7.2 Consider separate indicator - Percentage of adults with bipolar disorder prescribed lithium who
have their dosage adjusted if their plasma lithium levels are outside the optimum range.
7.4 Review with aim to monitor progress towards “improved physical health and wellbeing” in line
with National Institute for Health and Clinical Excellence (NICE) indicators that apply more focused
monitoring of total cholesterol:high-density lipoprotein (HDL) ratio; glucose or HbA1c;
cardiovascular disease (CVD) risk assessment; blood pressure; body mass index (BMI) record; and
alcohol consumption.

Report: 2020 Review of the NQUM Indicators for Australian Hospitals | NSW TAG | July 2021 | Page 16 of 46
5. New QUM indicators suggested for development
Participants also provided feedback on what new indicators would be worthwhile
developing. The following indicators were suggested:
• Anticoagulant-related indicators e.g. duplication of therapy, appropriate dosing,
appropriate management in perioperative period, appropriate documentation of
start/stop/review dates.
• Hospital-acquired complications (HACs)-related indicators e.g. percentage of patients
diagnosed with hospital acquired thromboembolism who received VTE prophylaxis
inappropriate to VTE risk; proportion of hospitalised patients who have received
naloxone; percentage of medication complications where an opioid analgesic is
implicated (e.g. drug-related respiratory complication/depression).
• Therapeutic Drug Monitoring (TDM)-related indicators e.g. antimicrobials, clozapine
(including appropriate dose adjustment based on levels).
• Pharmacy service indicators e.g. uptake of antimicrobial stewardship (AMS) interventions,
intravenous to oral antimicrobial switch appropriateness, time taken for pharmacists to
review and verify orders, percentage of digital chemotherapy orders verified according to
hospital policy, appropriate counselling regarding teratogenicity and appropriate
prescribing of contraceptives for women on valproate; percentage of patients prioritised
correctly for pharmacist review (including tool to identify these).
• High risk medicines (HRMs)-related e.g. appropriate prescribing of opioids/sedatives on
discharge, appropriate prescribing of chemotherapy (e.g. oral methotrexate) for non-
oncological conditions, monitoring system overrides for HRMs, appropriate second
person checking for hydromorphone, appropriate initiation and re-commencement and
consent of depot injections; appropriate clozapine titration/monitoring/documentation;
percentage of patients given rapid tranquilisation who have side effects (per NICE Quality
Standard)10; percentage of opioid analgesic doses that are extended release; provision of
opioid de-escalation plan on discharge; percentage of patients over 65 with a drug
burden index and anticholinergic burden risk documented against a validated
assessment tool.
• Condition-specific indicators e.g. appropriate management of patients on sodium-
glucose co-transporter 2 (SGLT2) inhibitors (also known as ‘gliflozins’) in the
perioperative period; osteoporosis management plans for minimal trauma fractures;
mental health conditions relating to borderline or antisocial disorders prescribed
antipsychotics/sedatives and anxiety prescribed benzodiazepines or antipsychotics.

Report: 2020 Review of the NQUM Indicators for Australian Hospitals | NSW TAG | July 2021 | Page 17 of 46
6. Other issues raised
A number of issues relating to utilisation and relevance of specific indicators also emerged
from the surveys. These are summarised below.
6.1 Antithrombotics
Percentage of VTE risk assessment completed (NQUM Indicator 1.1) and percentage of VTE
risk assessment completed within 24 hours are currently automated as part of the Cerner®
Business Objects® reporting at one hospital.
6.2 Antibiotics
Two of the five NQUM Indicators (2.1 and 2.2) relating to surgical prophylaxis and DTC-
concordant use of antibiotics, were frequently used, while other indicators in this set were
under-utilised. Similar indicators are measured in other programs, such as NAPS6, Surgical
NAPS (SNAPS)11, AMS CCS7 and ACHS3 indicators. Comments from respondents suggested
clinicians were prioritising participation in these audits rather than NQUM Indicators, some
of which need archiving or updating.
6.3 Medication ordering
The majority of respondents had implemented electronic medication management systems
such that NQUM Indicator 3.3 may not have current relevance. Moreover, hospitals still using
NSMC will capture this information in the NSMC audit.4 There may be scope, however, to
audit “unlisted” or free text medication orders in electronic medication management systems
where error-prone abbreviations are more likely to occur.
6.4 Continuity of Care
Respondents commented that some indicators might warrant modernisation to align with
digital health system developments including electronic transfer of information between
systems. For instance, transfer of medicine-related information between hospital electronic
medical records (eMR) and My Health Record, such as the Pharmacist Shared Medicine List
(PSML).9 This includes NQUM Indicators 5.8 and 5.9.

Report: 2020 Review of the NQUM Indicators for Australian Hospitals | NSW TAG | July 2021 | Page 18 of 46
Discussion
The value of the NQUM Indicators and their ability to drive practice change was
acknowledged by all respondents.
Utilisation of NQUM Indicators
All NQUM Indicators had been used since the 2014 update, with varying frequencies of use
reported. The most frequently used indicators align with measures used in other programs.
For example, NQUM Indicator 3.2 is a part of other current national indicator sets.3-6,12 A
similar pattern is seen with NQUM Indicators 2.1, 2.2, 3.1, 5.9 and 6.2. However, this is not the
sole criterion for frequent use as demonstrated by the popularity of NQUM Indicators 1.1
and 1.3 despite only aligning with two or three other programs. Corresponding with the
high frequency of use, NQUM Indicators 1.1, 1.2 and 1.3 rated highly in respondents’ priority
for automation into eMR. Mandatory measurement of these indicators was frequently
reported. Their frequent use supports trend analysis when considering rates of hospital
acquired VTE, a current focus of improving practice in HSOs.
Frequent use of the NQUM Indicators is also influenced by the need to provide evidence for
accreditation purposes. Nine of the top ten most frequently used NQUM Indicators provide
evidence for Standards 3 and 4 of the NSQHSS (Preventing and controlling healthcare-
associated infection standard and Medication safety standard, respectively).12 Accreditation
requirements and mandatory reporting requirements should be factored in when
considering prioritisation for indicator automation.
Low use of NQUM Indicators by survey respondents should not necessarily be seen to
devalue those indicators. In many cases, an indicator’s importance was acknowledged by the
respondents; however, other priorities including implementation of eMR and COVID-19
pandemic preparation and management had intervened.
Widespread participation in the NAPS and SNAPS audits were reported by respondents
which may have impacted on use of the antimicrobial NQUM Indicators. These
comprehensive snapshot audits cross-over with parameters measured for NQUM Indicators
2.1, 2.2, 2.3, 2.4 and 2.5 suggesting there may be a duplication of work and potentially less
utility for these NQUM Indicators. However, SNAPS and NAPS are labour intensive audits
performed annually, whereas the NQUM antibiotic indicator set is more targeted and
therefore enable snapshot audits that may help monitor activity and quality improvement
progress between annual audits. Additionally, availability of the AMS CCS and corresponding
clinical indicators was reported to be frequently used by respondents, which may also
contribute to reduced utility of the NQUM antibiotic indicator set.
Despite strong evidence that discharge medication prescription in diseases such as acute
coronary syndrome and heart failure lead to improved patient outcomes13,14 there was a low
reported use of NQUM Indicators 5.1 and 5.2, which was also noted in the previous review.
The previous study highlighted a common perception that specialist clinical units may have
been collecting indicator data because it reflects directly on their prescribing practices.15 It is
unclear what impacted on the low utility in this review; however, it is likely that the value of
these indicators would be enhanced if indicator collection and feedback was undertaken as a

Report: 2020 Review of the NQUM Indicators for Australian Hospitals | NSW TAG | July 2021 | Page 19 of 46
collaborative, multidisciplinary exercise. There is significant potential for collaborative data
collection for NQUM Indicators 1.6, 4.1, 4.2, 5.1, 5.2 and 5.6. Moreover, collaboration is more
likely to drive and maintain practice change. Despite their relative low utility, it was
suggested that indicators relating to HRMs or serious medical conditions (such as the
aforementioned indicators) should be prioritised for automation. Development of Acute
Coronary Syndromes CCS in 2019 supports the suggestion that these NQUM Indicators
should be prioritised for automation.
Considerations for NQUM Indicator automation
Frequency of use should not be the sole criterion for NQUM Indicator automation. Some
indicators are targeted at special patient groups that may attend specialist hospitals and
therefore rate lower in reported utilisation. For example, NQUM Indicator 3.4 (percentage of
paediatric medication orders that include the correct dose per kilogram (or body surface
area) AND an effective safe total dose) were not used in hospitals whose focus is adult
medicine. This may also apply to NQUM Indicator 3.6 (percentage of patients receiving
cytotoxic chemotherapy whose treatment is guided by a hospital approved chemotherapy
treatment protocol). A significant proportion of respondents have electronic chemotherapy
prescribing systems, which may enable automated data collection.
Nevertheless, availability of data points in eMR, collection of relevant data points and inter-
operability of electronic systems will be significant factors when considering automation of
NQUM Indicators in addition to standardised practice (or lack thereof) across health system
organisations with respect to processes or systems. For example, in order to automate
NQUM Indicator 5.6 (percentage of patients with asthma that are given a written asthma
action plan at discharge AND a copy is communicated to the primary care clinician), a
standardised approach to electronically documenting asthma action plans and whether they
were communicated to the primary care clinician would be required. Data would then need
to be extracted from various sources (e.g. eMR and My Health Record) to facilitate electronic
reporting. Conversely, NQUM Indicator 1.1 (percentage of hospitalised adult patients that are
assessed for risk of venous thromboembolism) requires data from one system only (for
hospitals using Cerner® eMR) and would be easier to automate. In fact, one respondent
reported there is already automated reporting in place assessing NQUM Indicator 1.1 using
Cerner® Business Objects® reporting. Future consideration should be given to
interoperability with other eMR or outcome data for more meaningful assessment of quality
measurement and performance.
Respondents suggested that another method by which to assess prioritisation for
automation would be to prioritise NQUM Indicators that assess practice involving HRMs in
order to monitor risk mitigation strategies and requirements of the NSW High-Risk
Medicines Management Policy Directive (PD2020_045).16 This may include NQUM Indicators
1.3, 1.4, 1.5, 1.6, 2.3, 3.6, 5.7, 6.1 and 6.3.
Whilst NQUM Indicator 6.4 (percentage of submissions for formulary listing of new chemical
entities for which the Drug and Therapeutics Committee [DTC] has access to adequate
information for appropriate decision making) remains important, it relies on information
obtained outside the medical record (whether electronic or not) and data collection by DTCs

Report: 2020 Review of the NQUM Indicators for Australian Hospitals | NSW TAG | July 2021 | Page 20 of 46
or equivalent. Electronic DTC software applications, which standardise records across
hospitals, may facilitate data collection and indicator measurement.
Potential modification and archiving of NQUM Indicators
An important consideration in the utility and retention of the NQUM Indicators is their
currency with evidence-based guidelines. NQUM Indicator review must be constant and
indicators developed or modified to meet current guideline recommendations.
Australian guideline recommendations assessing pneumonia severity changed in the most
recent edition of Therapeutic Guidelines Antibiotic. Validated tools including SMART-COP17
and CORB18 have been replaced by clinical parameters or ‘red flags’ which can be used to
help identify pneumonia severity and guide medication therapy choices.19 As a result, NQUM
Indicator 2.4 (Percentage of adult patients with community acquire pneumonia that are
assessed using an appropriate validated objective measure of pneumonia severity) will need
updating to reflect these new recommended practices.
The same also applies to NQUM Indicator 5.4 (percentage of patients on warfarin that
receive written information regarding warfarin management prior to discharge) which would
benefit from inclusion of direct acting oral anticoagulants (DOACs) now licensed for many of
the same indications as warfarin, a significant change in practice since the last publication of
the NQUM Indicators in 2014.
Changes in terminology and expanded QUM targets must also be considered. For example,
‘antimicrobial’ is now a major focus of quality health care strategies including NSQHSS
Standard 3 ‘Preventing and controlling healthcare-associated infection’.12 It is a more
appropriate term than ‘antibiotic’ for the existing antibiotic indicator set and specifically
NQUM Indicator 2.2. Other terminology changes suggested by respondents were rebadging
the medication ordering indicator set to ‘medicines documentation’ or ‘medicines
management’, rebadging the continuity of care indicator set to ‘transitions of care’, clarifying
psychotropic versus antipsychotic for NQUM Indicator 7.1, which may help capture
inappropriate use of antipsychotics for patients in aged care facilities and amending NQUM
Indicator 5.7 to include antipsychotics as well as sedatives to capture inappropriate
prescribing in delirium.
NQUM Indicator 6.3 (percentage of parenteral opioid dosage units that are pethidine) was
initially driven by results from a NSW TAG project in 2002/3 Improving Analgesia in Hospital
Emergency Departments – Optimising Use of Pethidine, which identified that pethidine was
widely used in hospital emergency departments, despite safer alternatives being available.20
A clinical practice change is evident by many respondents reporting removal of pethidine
from hospital formularies. This has likely been driven by several factors including the 2002
NSW TAG project, use of NQUM Indicator 6.3, NSW TAG letters written to NSW DTCs in 2016
and 2018 outlining the CEC’s NSW Maternal and Perinatal Root Cause Analysis Review
Committee recommendations to remove pethidine from formulary. However, the results of
our survey are primarily confined to public hospitals and anecdotal reports suggest pethidine
remains a QUM issue for private hospitals.
Use of NQUM Indicators 4.1 and 4.2 was noted to be low in the current survey as well as the
previous review (although there was strong support for automation in this review, likely

Report: 2020 Review of the NQUM Indicators for Australian Hospitals | NSW TAG | July 2021 | Page 21 of 46
indicating the recent focus on opioid stewardship in HSOs). Respondents noted that
modification of both indicators may be warranted. NQUM Indicator 4.1 may benefit with
inclusion of a patient’s functional capacity, rather than unidimensional pain scores alone. It
was also proposed that NQUM Indicator 4.2 should monitor the content of the written pain
management plan in order that reduced opioid-related harm is achieved. Suggested content
change included assessment of functional capacity, multimodal analgesia, and instructions
for use, risks and de-escalation in the pain management plan. Any amended indicators will
require further consultation and consideration for field testing.
Development of new QUM indicators
Respondents provided substantial feedback about new potentially useful QUM indicators. A
frequent theme that featured were indicators relating to HRMs particularly in the evolving
field of opioid stewardship. Use of opioids such as fentanyl and hydromorphone are now
recognised as QUM challenges. The ACSQHC’s HACs list of adverse events includes at least
one medication complication where drug related respiratory complications/depression could
be caused by opioid analgesics.21 In light of this and feedback from respondents, there
appears to be a need for opioid-specific medication management indicators targeting issues
such as inappropriate use of extended release opioids/transdermal patches and prescribing
at discharge when newly commenced in hospital among others.
Use of new technologies including TDM as well as new medicines including SGLT2 inhibitors
would be a valuable field to explore for development of new indicators. Respondents noted
the potential for development of indicators with relevance across various healthcare settings.
For example, the use of antipsychotics in behavioural and psychological symptoms of
dementia in geriatric wards and aged care facilities, as well as use of antipsychotics for acute
mental health purposes, would be useful. Another example is the use of NQUM Indicators
such as 5.1 and 5.2 at various times of the patient’s journey (e.g. at discharge from hospital,
at entry and discharge from cardiac rehabilitation programs and at relevant times thereafter).
Many antibiotic-related practices are covered by a combination of NAPS, AMS CCS and/or
ACHS antibiotic indicators (although how well these are integrated to give a view of a
hospital’s overall concordance with antibiotic-related best practice is unclear). However,
there are currently no indicators assessing TDM, utility and appropriateness of electronic
approval systems, uptake of AMS interventions, antibiotic shortages, time delays in antibiotic
administration or intravenous (IV) to oral switch. These gaps could be addressed in QUM
indicator development or modification following appropriate consultation.
When deliberating over development of new indicators, it is important to consider an
indicator’s ability to be applied to multiple settings and/or patients populations e.g.
paediatric patients and patients in aged care facilities. Also, future consideration should be
given to interoperability with other eMR or linkage to outcome data for more meaningful
assessment of quality measurement and performance. Newly developed indicators will
require wide consultation and field testing in accordance with previous NSW TAG
development processes.

Report: 2020 Review of the NQUM Indicators for Australian Hospitals | NSW TAG | July 2021 | Page 22 of 46
Limitations
It is not known how many hospitals or HSOs could have responded to these nationally
distributed surveys. It is likely that the COVID-19 pandemic affected participation.
Furthermore, the invitation for survey participation focused on the public hospital sector.
Only three responses from the private hospital sector were received. The respondents were
considered representative of Australian public hospitals in metropolitan, regional and rural
locations. For example, this is demonstrated by responses to the acute mental health NQUM
Indicator survey where a quarter of respondents (7/28) were from regional hospitals across
four Australian states. The investigators consider that a broad experience of indicator utility
was captured and results are likely generalisable, particularly for hospitals in the public
hospital sector. Reports from the ACHS of indicator usage show high use of QUM indicators
in the private hospital sector and representation of this sector should be included in any
relevant working groups for indicator modification or development.
The surveys did not enquire about barriers to NQUM Indicator use, which should be
considered in the context of future modifications to the indicator sets. The review also did
not include the recently developed NSW TAG QUM Indicators for Polypharmacy.22
Conclusions
Results indicate the NQUM Indicators are useful tools to measure quality use of medicines
and are used relatively frequently by a broad range of Australian HSOs. However, practice
change, evidence-based gaps in care now resolved and new emerging gaps mean review
and update of the indicators is needed. A steering committee was convened in early 2021 to
review data and make recommendations regarding future direction of the NQUM Indicator
sets and consider funding models to facilitate the update. Modified or newly developed
indicators will require wide consultation and field testing. NSW TAG will continue to liaise
with eHealth and other relevant stakeholders to advocate for automation of NQUM
Indicators within eMR systems.

Report: 2020 Review of the NQUM Indicators for Australian Hospitals | NSW TAG | July 2021 | Page 23 of 46
References 1. NSW Therapeutic Advisory Group (NSW TAG). National Quality Use of Medicines Indicators for Australian Hospitals. 2014.
https://www.nswtag.org.au/qum-indicators/. 2. Australian Commission on Safety and Quality In Health Care. Acute Coronary Syndromes Clinical Care Standard. 2014.
https://www.safetyandquality.gov.au/sites/default/files/migrated/Acute-Coronary-Syndromes-Clinical-Care-Standard.pdf. Accessed July 2021. 3. Australian Council on Healthcare Standards (ACHS). Australasian Clinical Indicator Report: 2012-2019: 21st Edition. 2020.
https://www.achs.org.au/media/183244/acir_2012-2019_21st_ed_correction_16.2.21.pdf. Accessed July 2021. 4. Australian Commission on Safety and Quality in Health Care. National Standard Medication Chart (NSMC) Audit Form. 2018.
https://www.safetyandquality.gov.au/publications-and-resources/resource-library/national-standard-medication-chart-nsmc-audit-form. Accessed July 2021.
5. Australian Pharmaceutical Advisory Council. Guiding principles to achieve continuity in medication management. 2005. https://www1.health.gov.au/internet/main/publishing.nsf/650f3eec0dfb990fca25692100069854/3b48796d9e2ddd8aca257bf00021ddb8/$FILE/Guiding-principles-to-achieve-continuity-in-medication-management.pdf. Accessed July 2021.
6. National Centre for Antimicrobial Stewardship. National Antimicrobial Prescribing Survey. https://www.naps.org.au/Default.aspx. Accessed July 2021.
7. Australian Commission on Safety and Quality in Health Care. Indicators for the Antimicrobial Stewardship Clinical Care Standard. 2020. https://www.safetyandquality.gov.au/our-work/clinical-care-standards/antimicrobial-stewardship-clinical-care-standard/indicators-antimicrobial-stewardship-clinical-care-standard#list-of-indicators. Accessed July 2021.
8. Victorian Therapeutics Advisory Group. Projects and Research. Chemotherapy Audit Toolkit Web site. https://www.victag.org.au/programs/chemotherapy-audit-toolkit. Accessed July 2021.
9. Pharmacist Shared Medicines List. Australian Digital Health Agency Web site. https://www.myhealthrecord.gov.au/for-healthcare-professionals/howtos/pharmacist-shared-medicines-list Accessed 6 July 2021.
10. National Institute for Health and Care Excellence (NICE). Violent and aggressive behaviours in people with mental health problems. 2017. https://www.nice.org.uk/guidance/qs154/chapter/Quality-statements. Accessed July 2021.
11. National Centre for Antimicrobial Stewardship. Surgical National Antimicrobial Prescribing Survey User Guide 2020. https://www.naps.org.au/Resources/SurgicalNAPS_userguide_2020.pdf. Accessed July 2021.
12. Australian Commission on Safety and Quality in Health Care. The NSQHS Standards. https://www.safetyandquality.gov.au/standards/nsqhs-standards. Published 2021. Accessed July 2021.
13. Peterson ED, Roe MT, Mulgund J, et al. Association between hospital process performance and outcomes among patients with acute coronary syndromes. Jama. 2006;295(16):1912-1920.
14. Fonarow GC, Abraham WT, Albert NM, et al. Association between performance measures and clinical outcomes for patients hospitalized with heart failure. Jama. 2007;297(1):61-70.
15. NSW Therapeutic Advisory Group (NSW TAG). Indicators for Quality Use of Medicines in Australian Hospitals. Final report of 2011 Survey. 2012. https://www.nswtag.org.au/wp-content/uploads/2017/07/project-qumindicatorreview-usagesurvey-finalreport-sept-2012.pdf. Accessed July 2021.
16. NSW Health. Policy Directive: High-Risk Medicines Management. PD2020_45 Web site. https://www1.health.nsw.gov.au/pds/Pages/doc.aspx?dn=PD2020_045. Published 2020. Accessed July 2021.
17. Charles PG WR, Whitby M, Fine MJ, Fuller AJ, Stirling R, et al. SMART-COP: a tool for predicting the need for intensive respiratory or vasopressor support in community-acquired pneumonia. Clin Infect Dis. 2008;47(3).
18. Buising KL TK, Black JF, MacGregor L, Street AC, Kennedy MP, et al. Identifying severe community-acquired pneumonia in the emergency department: a simple clinical prediction tool. Emerg Med Australas. 2007;19(5).
19. Therapeutic Guidelines Ltd. Community-acquired pneumonia in adults. CAP in adults: assessment of pneumonia severity. 2019. Published March 2021. Accessed July 2021.
20. NSW Therapeutics Advisory Group (NSW TAG). Use of Pethidine for pain management in the Emergency Department. 2004. https://www.nswtag.org.au/wp-content/uploads/2017/07/pethidine-emergency-aug-2004.pdf. Accessed July 2021.
21. Australian Commission on Safety and Quality in Health Care. Hospital-acquired complications (HACs). https://www.safetyandquality.gov.au/our-work/indicators/hospital-acquired-complications. Published 2019. Accessed July 2021.
22. NSW Therapeutic Advisory Group (NSW TAG). Resource Kit for Measuring Strategies to Reduce Harm from Polypharmacy in Australian Hospitals. 2020. https://www.nswtag.org.au/polypharmacy-qum-indicators-and-resources/.

Report: 2020 Review of the NQUM Indicators for Australian Hospitals | NSW TAG | July 2021 | Page 24 of 46
Appendices
Appendix 1: NQUM Indicator summary
No. Indicator QUM domain
addressed by indicator
Antithrombotic therapy
1.1 Percentage of hospitalised adult patients that are assessed for risk of
venous thromboembolism Judicious selection
1.2 Percentage of hospitalised adult patients that receive venous
thromboembolism prophylaxis appropriate to their level of risk
Judicious selection
Appropriate choice
1.3 Percentage of patients prescribed enoxaparin whose dosing schedule is
appropriate Safe and effective use
1.4
Percentage of patients prescribed hospital initiated warfarin whose loading
doses are consistent with a drug and therapeutics committee approved
protocol
Safe and effective use
1.5 Percentage of patients with an INR above 4 whose dosage has been
adjusted or reviewed prior to the next warfarin dose Safe and effective use
1.6 Percentage of patients with atrial fibrillation that are discharged
on oral anticoagulants Judicious selection
Antibiotic therapy
2.1 Percentage of patients undergoing specified surgical procedures that
receive an appropriate prophylactic antibiotic regimen
Appropriate choice
Safe and effective use
2.2 Percentage of prescriptions for restricted antibiotics that are concordant
with drug and therapeutics committee approved criteria
Appropriate choice
Safe and effective use
2.3 Percentage of patients in whom doses of empirical aminoglycoside therapy
are continued beyond 48 hours Safe and effective use
2.4
Percentage of adult patients with community acquired pneumonia
that are assessed using an appropriate validated objective measure
of pneumonia severity
Judicious selection
2.5 Percentage of patients presenting with community acquired pneumonia
that are prescribed guideline concordant antibiotic therapy
Appropriate choice
Safe and effective use
Medication ordering
3.1 Percentage of patients whose current medicines are documented and
reconciled at admission
Appropriate choice
Safe and effective use
3.2 Percentage of patients whose known adverse drug reactions are
documented on the current medication chart
Appropriate choice
Safe and effective use
3.3 Percentage of medication orders that include error-prone abbreviations Safe and effective use
3.4 Percentage of paediatric medication orders that include the correct dose
per kilogram (or body surface area) AND an effective and safe total dose Safe and effective use
3.5 Percentage of medication orders for intermittent therapy that are
prescribed safely Safe and effective use
3.6 Percentage of patients receiving cytotoxic chemotherapy whose treatment
is guided by a hospital approved chemotherapy treatment protocol
Appropriate choice
Safe and effective use
Pain management
4.1 Percentage of postoperative patients whose pain intensity is documented
using an appropriate validated assessment tool
Judicious selection
Safe and effective use
4.2
Percentage of postoperative patients that are given a written pain
management plan at discharge AND a copy is communicated to
the primary care clinician
Safe and effective use

Report: 2020 Review of the NQUM Indicators for Australian Hospitals | NSW TAG | July 2021 | Page 25 of 46
Continuity of care
5.1 Percentage of patients with acute coronary syndrome that are prescribed
appropriate medicines at discharge
Judicious selection
Appropriate choice
5.2 Percentage of patients with systolic heart failure that are prescribed
appropriate medicines at discharge
Judicious selection
Appropriate choice
5.3 Percentage of discharge summaries that include medication therapy
changes and explanations for changes Safe and effective use
5.4 Percentage of patients on warfarin that receive written information
regarding warfarin management prior to discharge Safe and effective use
5.5
Percentage of patients with a new adverse drug reaction (ADR) that are
given written ADR information at discharge AND a copy is communicated
to the primary care clinician
Safe and effective use
5.6 Percentage of patients with asthma that are given a written asthma action
plan at discharge AND a copy is communicated to the primary care clinician Safe and effective use
5.7 Percentage of patients receiving sedatives at discharge that were not taking
them at admission Judicious selection
5.8 Percentage of patients whose discharge summaries contain a current,
accurate and comprehensive list of medicines
Appropriate choice
Safe and effective use
5.9 Percentage of patients who receive a current, accurate and comprehensive
medication list at the time of hospital discharge Safe and effective use
Hospital-wide medication management policies
6.1 Percentage of medication storage areas outside pharmacy where potassium
ampoules are available Safe and effective use
6.2 Percentage of patients that are reviewed by a clinical pharmacist within one
day of admission
Judicious selection
Appropriate choice
Safe and effective use
6.3 Percentage of parenteral opioid dosage units that are pethidine Appropriate choice
6.4
Percentage of submissions for formulary listing of new chemical entities for
which the drug and therapeutics committee has access to adequate
information for appropriate decision making
Appropriate choice
Safe and effective use
Acute mental health care
7.1
Percentage of as required (PRN) psychotropic medication orders with
documented indication, dose (or dose range), frequency and maximum
daily dose specified
Safe and effective use
7.2 Percentage of patients taking lithium who receive appropriate monitoring
during their inpatient episode Safe and effective use
7.3 Percentage of patients who receive written and verbal information on
regular psychotropic medicines initiated during their admission Safe and effective use
7.4 Percentage of patients taking antipsychotic medicines who receive
appropriate monitoring for the development of metabolic side effects Safe and effective use
7.5 Percentage of patients prescribed two or more regular antipsychotic
medicines at hospital discharge
Judicious selection
Safe and effective use

Report: 2020 Review of the NQUM Indicators for Australian Hospitals | NSW TAG | July 2021 | Page 26 of 46
Appendix 2 - Antithrombotic therapy NQUM Indicator survey

Report: 2020 Review of the NQUM Indicators for Australian Hospitals | NSW TAG | July 2021 | Page 27 of 46

Report: 2020 Review of the NQUM Indicators for Australian Hospitals | NSW TAG | July 2021 | Page 28 of 46

Report: 2020 Review of the NQUM Indicators for Australian Hospitals | NSW TAG | July 2021 | Page 29 of 46
Appendix 3 - Antibiotic therapy NQUM Indicator survey

Report: 2020 Review of the NQUM Indicators for Australian Hospitals | NSW TAG | July 2021 | Page 30 of 46

Report: 2020 Review of the NQUM Indicators for Australian Hospitals | NSW TAG | July 2021 | Page 31 of 46

Report: 2020 Review of the NQUM Indicators for Australian Hospitals | NSW TAG | July 2021 | Page 32 of 46
Appendix 4 – Medication ordering NQUM Indicator survey

Report: 2020 Review of the NQUM Indicators for Australian Hospitals | NSW TAG | July 2021 | Page 33 of 46

Report: 2020 Review of the NQUM Indicators for Australian Hospitals | NSW TAG | July 2021 | Page 34 of 46
Report: 2020 Review of the NQUM Indicators for Australian Hospitals | NSW TAG | July 2021 | Page 35 of 46
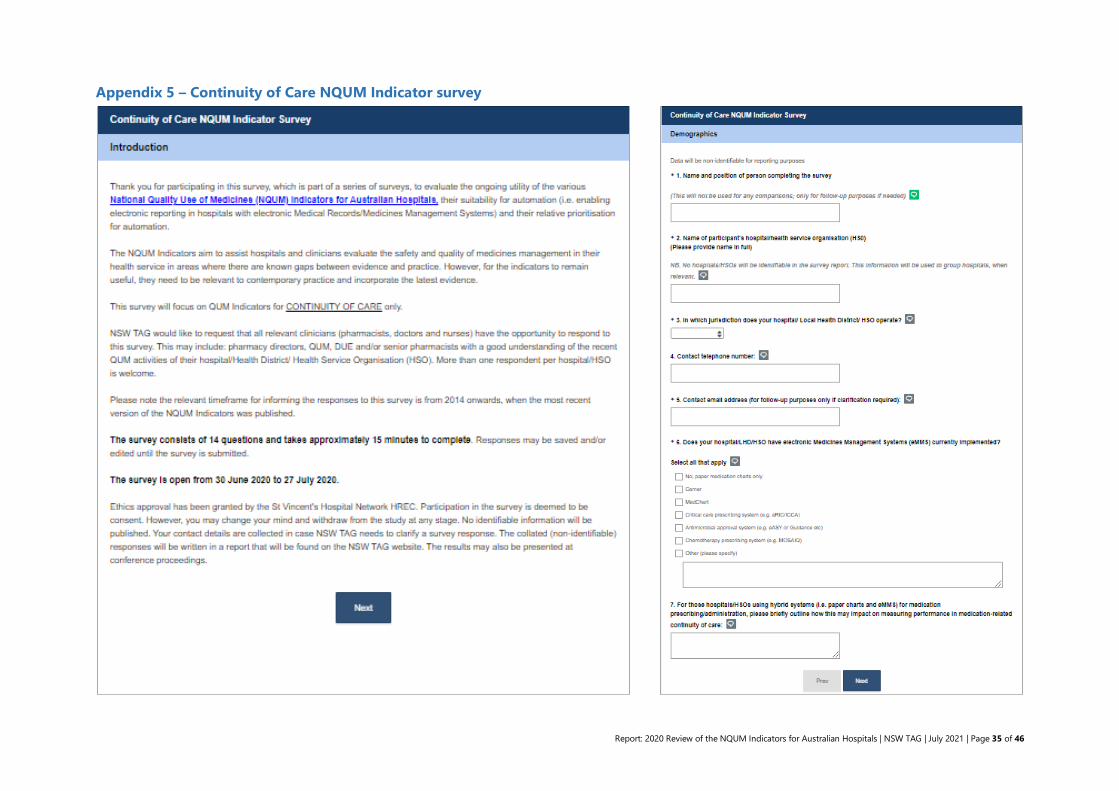
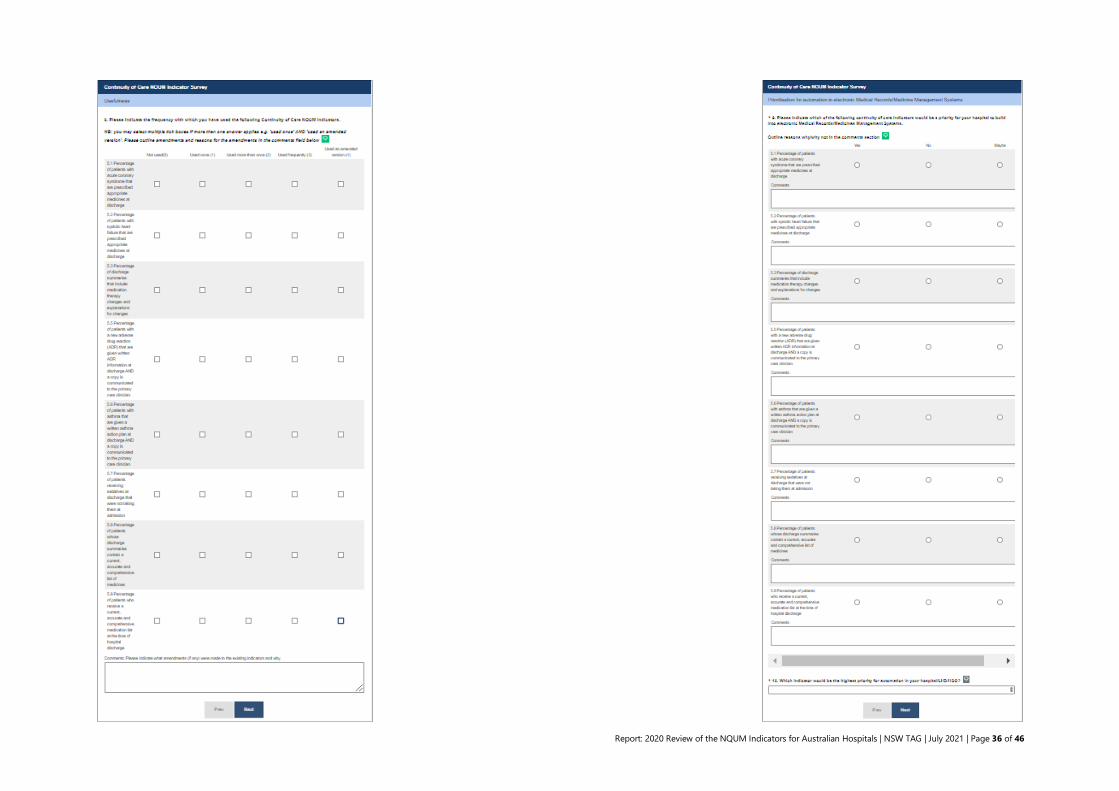
Appendix 5 – Continuity of Care NQUM Indicator survey
Report: 2020 Review of the NQUM Indicators for Australian Hospitals | NSW TAG | July 2021 | Page 36 of 46

Report: 2020 Review of the NQUM Indicators for Australian Hospitals | NSW TAG | July 2021 | Page 37 of 46

Report: 2020 Review of the NQUM Indicators for Australian Hospitals | NSW TAG | July 2021 | Page 38 of 46
Appendix 6 – Acute mental health care NQUM Indicator survey

Report: 2020 Review of the NQUM Indicators for Australian Hospitals | NSW TAG | July 2021 | Page 39 of 46

Report: 2020 Review of the NQUM Indicators for Australian Hospitals | NSW TAG | July 2021 | Page 40 of 46
Report: 2020 Review of the NQUM Indicators for Australian Hospitals | NSW TAG | July 2021 | Page 41 of 46
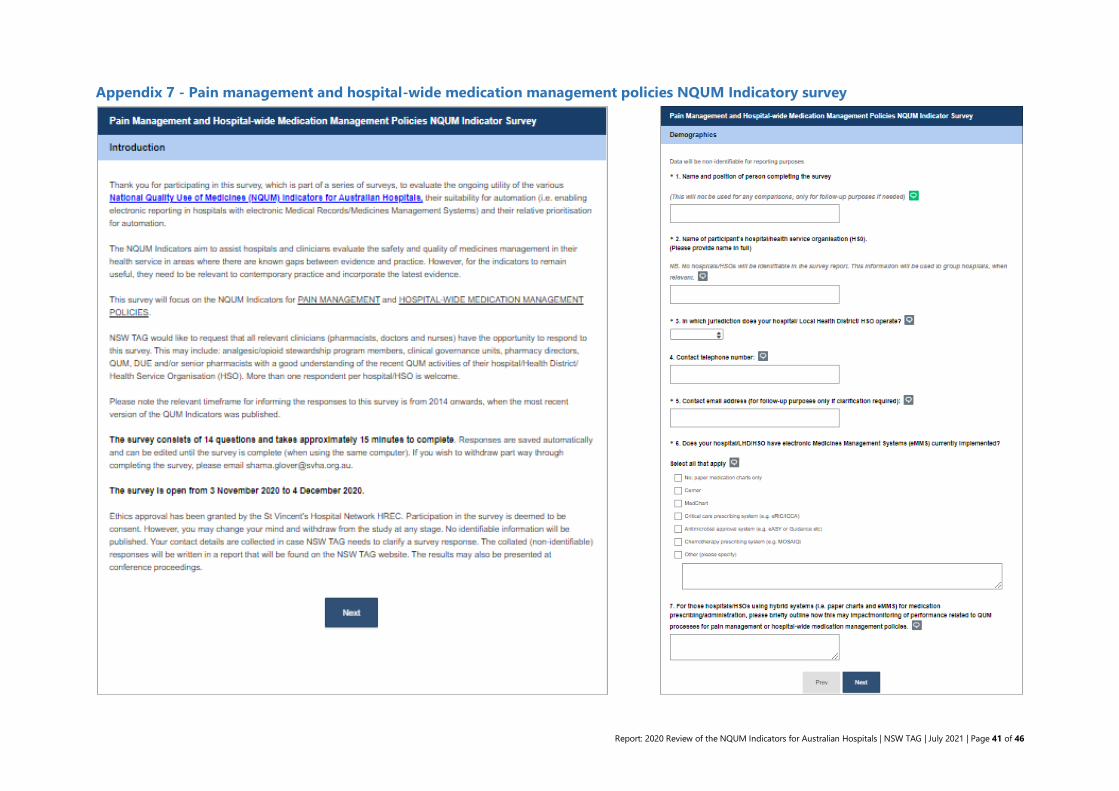
Appendix 7 - Pain management and hospital-wide medication management policies NQUM Indicatory survey

Report: 2020 Review of the NQUM Indicators for Australian Hospitals | NSW TAG | July 2021 | Page 42 of 46

Report: 2020 Review of the NQUM Indicators for Australian Hospitals | NSW TAG | July 2021 | Page 43 of 46

Report: 2020 Review of the NQUM Indicators for Australian Hospitals | NSW TAG | July 2021 | Page 44 of 46
Acknowledgments
NSW TAG Project Team
Dr Alexandra (Sasha) Bennett, Executive Officer NSW TAG
Ms Sharna Glover, QUM Project Officer NSW TAG
Ms Sarah Dinh, QUM Project Officer NSW TAG
Dr Don Lohitha Wanasinghe, Project Officer, NSW TAG
A/Prof Winston Liauw, Chair, NSW TAG Electronic Medical Record Quality Use of Medicines Working Group and member,
NSW TAG Management Comittee
NSW TAG thanks the members from the NSW TAG medSMART Group and the NSW TAG Electronic Medical Record Quality
Use of Medicines Working Group for their advice and feedback in the review of the 2014 NQUM Indicators.
NSW TAG thanks CATAG and SHPA for distributing the invitation to participate in the surveys to its members.
NSW TAG thanks Prof Sarah Hilmer, Chair, NSW TAG Management Committee and Prof Asad Patanwala, Chair, NSW TAG
Editorial Committee for their review of the report.
Survey Respondents
The following hospitals and health districts and organisations provided responses to the surveys and we gratefully
acknowledge their contribution. We thank all individual respondents to the surveys.
Antimicrobial Stewardship Expert Advisory Committee, CEC, NSW
Australian Commission on Safety and Quality in Health Care, NSW
Albury Wodonga Health, VIC
Alfred Health, VIC
Alice Springs Hospital, NT
Auburn Hospital, NSW
Austin Health, VIC
Ballarat Health Service, VIC
Bankstown-Lidcombe Hospital, NSW
Barwon Health, VIC
Bowral District Hospital, NSW
Blacktown/Mt Druitt Hospitals, NSW
Braidwood Multi-Purpose Service, NSW
Caboolture Hospital, QLD
Cabrini Health Service, VIC
Cairns and Hinterland Hospital and Health Service, QLD
Calvary Mater Newcastle, NSW
Calvary Public Hospital, ACT
Canberra Hospital and Health Services, ACT
Central Adelaide Local Health Network, SA
Central Coast Local Health District, NSW
Chris O'Brien Lifehouse, NSW
Clinical Excellence Commission, NSW
Coffs Harbour Clinical Network, NSW
Colac Area Health, VIC
Concord Hospital, NSW
Cumberland Hospital, NSW
Department of Health, TAS
Dubbo Base Hospital, NSW
Eastern Health, VIC
Fremantle hospital, WA
Gold Coast Hospital and Health Service, QLD
Goulburn Valley Health, VIC
Herberton Hospital, QLD
Hornsby Hospital, NSW
Hunter New England Local Health District, NSW
Ipswich Hospital, QLD
John Hunter Hospital, NSW
Joyce Palmer Health Service, QLD
King Edward Memorial Hospital, WA
Logan Hospital Metro South Hospital and Health
Service, QLD
Liverpool Hospital, NSW
Mackay Hospital and Health Service, QLD
Maitland Hospital, NSW
Mercy Health, VIC
Metro North Hospital and Health Service, QLD
Mid North Coast Local Health District, NSW
Monash Health, VIC
Murrumbidgee Local Health District, NSW
Nepean Hospital, NSW
Nepean Blue Mountains Local Health District, NSW
North Metropolitan Health Service, WA
Northam Regional Hospital, WA
Northern Beaches Hospital, NSW
Northern NSW Local Health District, NSW
Orange Health Service, NSW
Peninsula Health, VIC
Perth Children's Hospital, WA
Peter MacCallum Cancer Centre, VIC
Port Macquarie Base Hospital, NSW
Port Pirie Hospital, SA
Primary Health Care, Top End Health Service, NT
Prince Charles Hospital, QLD
Prince of Wales Hospital, NSW
Princess Alexandra Hospital, QLD
Queen Elizabeth Hospital, SA
Rockingham General hospital, WA
Royal Darwin Hospital, NT
Royal Hobart Hospital, TAS
Royal North Shore Hospital, NSW
Royal Prince Charles Hospital, QLD

Report: 2020 Review of the NQUM Indicators for Australian Hospitals | NSW TAG | July 2021 | Page 45 of 46
Royal Victorian Eye and Ear Hospital, VIC
Shoalhaven District Memorial Hospital, NSW
Sir Charles Gairdner Hospital, WA
St George Hospital, NSW
St John of God Subiaco, WA
St Vincent’s Public Hospital, NSW
St Vincent's Public Hospital, VIC
South East Sydney Local Health District, NSW
South West Sydney Local Health District, NSW
Southern NSW Local Health District, NSW
Sunshine Coast University Hospital, QLD
Sydney Adventist Hospital, NSW
Sydney and Sydney Eye Hospital, NSW
Sydney Children’s Hospital, NSW
Sydney Local Health District, NSW
Townsville University Hospital, QLD
Tweed Hospital, NSW
WA Country Health Service, WA
Wagga Wagga Base Hospital, NSW
Western Health, VIC
Westmead Children’s Hospital, NSW
Westmead Hospital, NSW
West Moreton Hospital and Health Service, QLD
Wimmera Health Care Group, VIC
Back to Contents page
