2020 preliminary budget - operating and capital - volume 2
TRANSCRIPT
Volume 2
Operating and Capital2020 Preliminary Budget

WINNIPEG, MANITOBA, CANADA
City of Winnipeg
2020 Preliminary Budget
Operating and Capital Volume 2

The City of Winnipeg Winnipeg, Manitoba
R3B 1B9
Telephone Number: 311
Toll Free : 1-877-311-4WPG(4974)
www.winnipeg.ca

GOVERNMENT FINANCE OFFICERS ASSOCIATION
DistinguishedBudget Presentation
AwardPRESENTED TO
City of Winnipeg
ManitobaFor the Fiscal Year Beginning
January 1, 2019
PExecutive Director
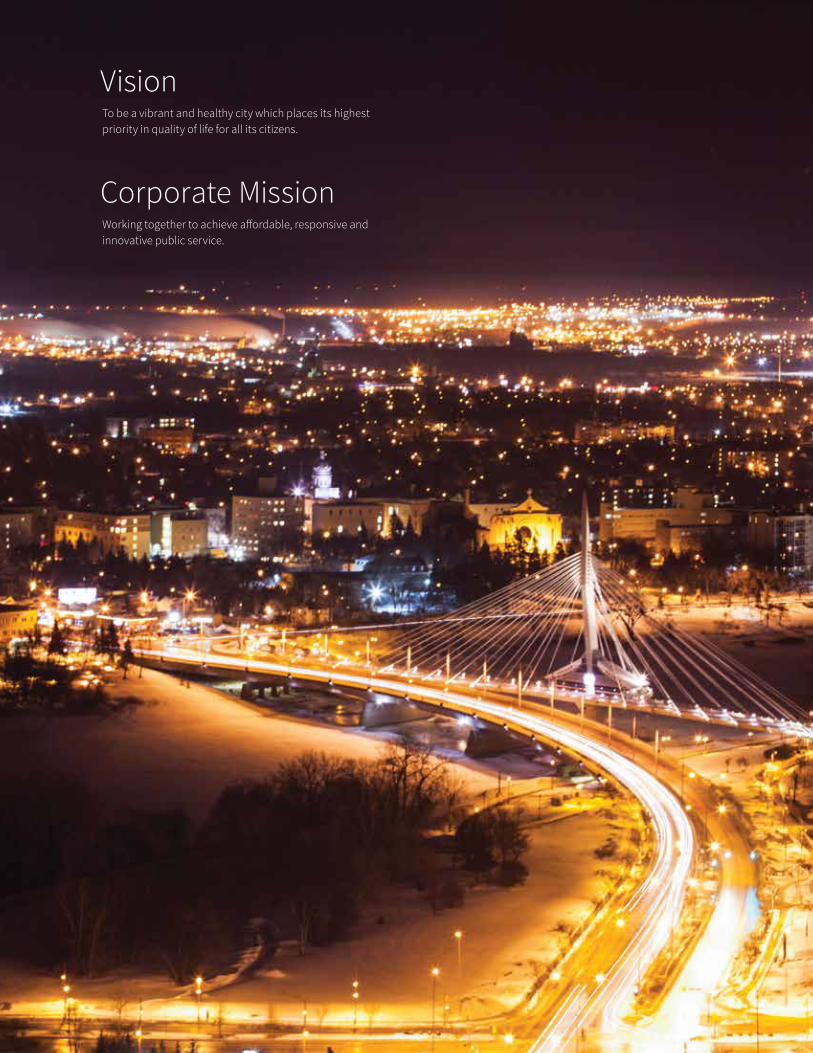
Vision
Corporate Mission
To be a vibrant and healthy city which places its highest priority in quality of life for all its citizens.
Working together to achieve affordable, responsive and innovative public service.

City of Winnipeg Council
Mayor Brian Bowman
Jeff BrowatyNORTH KILDONAN
Kevin KleinCHARLESWOOD - TUXEDO - WESTWOOD
Sherri RollinsFORT ROUGE - EAST FORT GARRY
Markus ChambersST. NORBERT - SEINE RIVERDeputy Mayor
Janice LukesWAVERLEY WEST
Vivian SantosPOINT DOUGLASActing Deputy Mayor
Matt AllardST. BONIFACE
Cindy GilroyDANIEL MCINTYRE
John OrlikowRIVER HEIGHTS-FORT GARRY
Ross EadieMYNARSKI
Brian MayesST. VITAL
Jason SchreyerELMWOOD-EAST KILDONAN
Scott GillinghamST. JAMES
Shawn NasonTRANSCONA
Devi SharmaOLD KILDONAN
i

City of Winnipeg Organization
City Electorate
APPENDIX “A” to By-law No. 7100/97amended 143/2008; 22/2011; 48/2011; 139/2014; 106/2015; 84/2019
City Council
Executive Policy Committee
CAO
CFO*
* CFO, City Auditor and City Clerk have statutory reporting relationships to City Council
Governance Committee of Council
City Clerk*
City Auditor*
Standing Policy Committee on
Water and Waste, Riverbank Management and the Environment
Standing Policy Committee on
Finance
• Additional Appropriations
• Engineering Services• Fleet Management• Public Works
Maintenance• Traffic Control• Transit• Transportation
Planning
• Animal Control• By-Law Enforcement• Cultural Services• Disaster Planning• Fire and Paramedic
Services• Harbour Master• Libraries• Museums• Parks Planning• Parks and Open Spaces• Public Health• Recreation & Parks• Programming and
Services
• Annual reports of SSUs• Business plans of SSUs• Feasibility studies re.
SSUs • Innovation, Transformation and Technology • Economic Development• Business Liason• CentreVenture Development Corporation• Economic Development Winnipeg
• Asset Management• Acquisition of Buildings• Building Inspections• Civic Buildings• Development Control• Downtown
Development• Facility Maintenance• Heritage Matters• Housing Policy• Land Acquisition• Land Development• Planning & Land Use• Transportation
Planning• Vacant and Derelict
Buildings
• Engineering Services• Environmental Matters• Riverbank Management• Solid Waste• Water, Wastewater and
Land Drainage Services
Standing Policy Committee on
Infrastructure Renewal and Public Works
Standing Policy Committee on
Protection, Community Services and Parks
Standing Policy Committee on
Innovation andEconomicDevelopment
Standing Policy Committee on
Property and Development, Heritage and Downtown Development
ii

2020 Letter from the Mayor and Chairperson of the Standing Policy Committee on Finance ...... 1
Budget Recommendations ........................................................................................................ 13
Overview ................................................................................................................. Section One
Reader’s Guide ..................................................................................................................1-1
2020 Budget at a Glance ....................................................................................................1-2
Basis of Budgeting .............................................................................................................1-3
City of Winnipeg Fund Structure .........................................................................................1-6
Budget Process ..................................................................................................................1-7
2020 Budget Presentation ................................................................................................ 1-11
Service Based Budget ........................................................................................... Section Two
Financial Summary ............................................................................................................2-1
Infrastructure Renewal and Public Works ...........................................................................2-5
Water and Waste, Riverbank Management and the Environment..................................... 2-21
Property and Development, Heritage and Downtown Development ................................. 2-39
Protection, Community Services and Parks / Winnipeg Police Board ............................... 2-59
Innovation and Economic Development ........................................................................... 2-97
Executive Policy ............................................................................................................. 2-113
Appendices ......................................................................................................... Section Three
Appendix 1 – Traditional View Financial Summary .............................................................3-1
Tax Supported ..............................................................................................3-3
Utility Operations ........................................................................................ 3-11
Special Operating Agencies........................................................................ 3-18
Appendix 2 – Listings of Grants/Payments ....................................................................... 3-23
Appendix 3 – Reserves Budget Summary ........................................................................ 3-33
Appendix 4a – Tax Supported Transfers from Other Funds.............................................. 3-35
Appendix 4b – Tax Supported Transfers to Other Funds .................................................. 3-36
Table of Contents

Appendix 5 –Transfer to Capital Reconciliation ................................................................ 3-37
Appendix 6 – Fees & Charges Schedule .......................................................................... 3-39
Appendix 7 – Asset Management and Capital Recoveries ............................................... 3-41
Appendix 8 – 2020 Consolidated Budget .......................................................................... 3-43
Appendix 9 – Capital Projects Summary .......................................................................... 3-47
Appendix 10 – Services by Policy Area ............................................................................ 3-77
Appendix 11 – Glossary ................................................................................................... 3-79
Table of Contents

2020 LETTER FROM THE MAYOR AND CHAIRPERSON OF THE STANDING POLICY COMMITTEE ON
FINANCE
Introduction
We are very pleased to table the preliminary 2020-2023 multi-year balanced operating and capital
budgets.
2020 is a significant year for the City of Winnipeg. Unlike previous years when City budgets were
balanced one year at a time, this year, we are presenting preliminary balanced operating and
capital budgets for the next four years.
The multi-year balanced budget process provides Council with an opportunity to make adjustments
to the budgets each year as part of an annual review process. Council will still be required to vote
on the annual operating and capital budgets each year in accordance with The City of Winnipeg
Charter.
Multi-year balanced budgeting allows us to take a longer term view of Winnipeg's needs and better
plan for stable service delivery and infrastructure investment.
The preliminary multi-year balanced budgets will also provide a blueprint for transformative change
in the way we deliver key services and invest in infrastructure while providing certainty and
predictability for ratepayers.
Key priorities for the multi-year balanced budgets include investment in transit, community safety,
community services, roads, fire protection, trees as well as controlling expenses and driving
efficiencies. The multi-year balanced budget process will also chart a course forward to review our
building asset footprint, repurpose City owned golf lands, reduce the number of City owned and
leased fleet vehicles over time, develop a wading pool and splash pad strategy, and consider a
multi-year funding formula for the Winnipeg Police Service.
Winnipeg's population is on track to continue to grow steadily and strongly over the coming
decades. It is critical that we manage and support this growth by investing in the right
infrastructure and services at the right time so these investments are in place when we need them.
The new multi-year balanced budget process is more open and transparent than previous annual
budget processes and has provided greater opportunity for active involvement of all members of
Council community organizations, the public and the Public Service. The process began four
months ahead of today's tabling of the preliminary multi-year balanced budgets and today marks
the continuation of this open and transparent review process.
As other levels of government struggle to balance their budgets one year at a time, we are
presenting balanced operating budgets for each of the next four consecutive years.
1

Despite flat operating funding support from the provincial government, the preliminary budgets are
balanced without significant cuts to City services while capping annual dedicated property tax
increases at 2.33 percent for investment in road renewal and financing the Southwest Rapid
Transitway (SWT).
Overall, we believe the preliminary 2020-2023 multi-year balanced budgets present a responsible
plan that strikes the right balance between fiscal and environmental sustainability while making
investments in key services and infrastructure that will build our growing City for the future.
Operating Revenues and Expenses
At the start of the multi-year balanced budget process, we were facing an operating deficit of $89.6
million in the tax-supported budget for 2020 that was projected to increase to $174.9 million by
2023.
In October 2019, the Executive Policy Committee endorsed a framework to balance the budgets
over the next four years. This framework included stringent operating expenditure targets for all
departments and caps on capital expenditures.
In November 2019, City Departments came forward with approximately $147 million of tax
supported operating expenditure reduction options over the next four years to assist in bringing the
budgets into balance.
Many of the operating reduction options involved the closure of pools, libraries, fire halls and other
civic facilities, along with eliminating important City services.
The preliminary multi-year balanced budgets do not include any of the proposed closures of existing
City facilities or any other significant reductions to important City services, such as discontinuing
multi-family garbage collection or changes to street lighting.
The preliminary multi-year balanced budgets do, however, reflect approximately $118 million of
operating expenditure reductions and includes many of the options proposed by the Public Service,
as well as some additional expenditure reductions.
Additional expenditure reductions that are reflected in the total of $118 million noted above,
include a proposal for the strategic use of debt instead of cash to fund bus purchases and a
proposal to discontinue the U Pass program once the agreements with the universities expire in
May 2020.
A further expenditure reduction measure included in the preliminary multi-year balanced budgets is
a proposal for a 10 percent reduction to all annual grants starting in 2020, excluding grants to
organizations that have multi-year agreements with the City. Organizations providing services on
behalf of the City through community partnership arrangements will also be excluded from this 10%
grant reduction.
2

With difficult but necessary decisions like these, we have been able to meet the expenditure targets
for a majority of City departments, as prescribed by the Executive Policy Committee last year and
balance the budgets for the next 4 years. Also assisting in balancing the budgets is slightly higher
property tax revenue and investment income than was originally projected at the start of the multi
year balanced budget process.
Before capital-related expenses, the tax-supported operating budget will increase by an average of
1.5 percent per year over the next four years, which is among the smallest increases in over a
decade. After capital related expenses are included, the next four years would see an average
annual increase of 2.6 percent. This is lower than the average annual projected rate of growth in
the consumer price index and population growth over this period of 3.37 percent.
Winnipeg continues to have among the lowest operating costs per capita and the lowest property
taxes of all major cities in Canada.
The preliminary multi-year balanced budgets propose to maintain Winnipeg's competitive position
in this regard by capping property tax increases at 2.33 percent per year for the next four years with
the entire increase dedicated to Winnipeg's infrastructure requirements.
Two percent of the proposed 2.33 percent annual increase is dedicated to rebuilding our roads and
0.33 percent is dedicated to financing the SWT. This means the average homeowner will pay an
additional $41.00 in property taxes in 2020.
To continue powering the economy and encouraging investment, the business tax rate is being
reduced from 4.97 percent to 4.85 percent and the business tax threshold will increase from $33,900 to $35,700 in 2020. This will ensure that approximately one half of Winnipeg's businesses
will continue to be exempt from this tax.
The preliminary multi-year balanced budgets propose no changes to the current frontage levy rate
or the water and sewer dividend rate. There are no new fees or charges included in the preliminary
multi-year balanced budgets.
Increases to most remaining fees and charges will be limited to the rate of inflation at
approximately two percent over the next four years, with the notable exception of water and sewer
rates which will increase higher than the rate of inflation to fund provincially mandated capital
upgrades. The waste diversion fee will increase by three percent from $63.00/year to $65.00/year
in 2020 to reflect the cost of the City's recycling contract. The Impact Fee will decrease by five
percent in 2020 and parking rates will remain frozen.
Transit
Executive Policy Committee set an annual operating expenditure growth target of 2 percent per
year for Transit for the multi-year balanced budget.
3

At the outset of the multi-year balanced budget process, Transit proposed a total of $52.6 million of
operating expenditure reduction options over the next four years to meet its expenditure targets.
The preliminary budgets reject most of the proposed operating expenditure reductions that involve
significant service reductions in favour of a plan that will allow Transit to meet its expenditure
targets without significantly impacting service while building transit for the future in a fiscally
responsible and environmentally sustainable way.
In April 2020, the SWT linking downtown with the University of Manitoba and southwest Winnipeg
will be complete and open for service. The SWT was substantially completed ahead of schedule and
over $165 million under budget.
The multi-year balanced budgets propose an investment of over $13.1 million over the next four
years for a new "spine and feeder" transit service model that will serve the SWT by providing high
frequency, reliable, efficient and significantly improved service for passengers who travel to, from
and within southwest Winnipeg.
The investment in the new spine and feeder system includes several new Transit routes, changes to
existing routes and elimination of some redundant routes. This new service plan will be supported
by twenty eight new 60 ft. articulated buses along with seven new rapid transit stations located at
various points along Stage 2 of the SWT.
The Winnipeg Transit Master Plan will be presented for Council's consideration in 2020. This plan
will provide a 25 year vision for Transit services and infrastructure that will support a growing city.
Affordability is a key feature of a modern public transit system and Winnipeg continues to have
among the lowest transit fares compared to other major Canadian cities. The multi-year balanced
budgets take concrete steps towards enhancing transit affordability for those residents that need it
the most by implementing Winnipeg's first low income Transit pass. Starting in 2020, qualifying
individuals will be eligible to receive a 30 percent discount on the full adult fare monthly pass with
the low income Transit pass. In 2021, this discount will increase to 40 percent followed by SO
percent in 2022.
To further enhance affordability, starting in 2021 children under 12 years of age will be able to ride
Transit at no cost.
The multi-year balanced budgets propose significant new investments in Transit Plus, including
approximately $1.3 million starting in 2021 to eliminate a barrier that currently requires the origin
and destination of a trip to be within 500 meters of an established bus route. Eliminating this
barrier is one of the key recommendations of the Ombudsman's 2019 report on Transit Plus.
4

The multi-year balanced budgets also propose a total investment of $2.5 million over the next four
years to implement several more of the Ombudsman's recommendations for Transit Plus which will
assist in providing better Transit service to some of our most vulnerable residents.
The preliminary multi-year balanced budgets also reflect approximately $20.5 million of the
operating expenditure reductions originally proposed by Transit, including reduced cash
contributions to the bus replacement program and discontinuing the free Downtown Spirit service.
The preliminary multi-year balanced budgets also involves the strategic use of debt and retained
earnings rather than operating funds to purchase replacement buses, as well as a plan to reduce
Transit service on selected low volume routes
As well, the budgets do not propose a renewal of the U-Pass program once the current agreements
with the universities expire in May 2020. However, post-secondary students can still receive a 20
percent discount off the cost of a regular adult fare with the purchase of a Post-Secondary Pass and
those students in financial need can now apply for a low income Transit pass.
With all of the measures noted above, Transit's overall operating budget will increase by an annual
average of 2.5 percent over the next four years (before capital related expenses), slightly higher
than its target of two percent.
The tax supported subsidy to Transit is projected to increase by 35 percent from $70.5 million in
2019 to $95.5 million in 2023. Despite significant provincial government funding reductions to
Transit over the last few years, investment in Transit remains a top priority for us in the multi-year
balanced budgets.
Community Safety
Executive Policy Committee set an annual operating expenditure growth target of 2 percent per
year for the Winnipeg Police Service (WPS) for the multi-year balanced budgets.
In November 2019, the WPS came forward with a plan to meet their expenditure targets that
involved reducing the complement of sworn officers by 34 positons, as well as 25 cadet positions.
At the same time, City Council made the difficult but necessary decision to approve reforms to the
Police Pension Plan sustainability for its members and for property taxpayers.
Council's decision on the police pension reforms allow for approximately $14.7 million in pension
savings to be reinvested back into the WPS over the next four years. This will enable the WPS to
meet their operating expenditure targets without reducing the complement of sworn officers or
cadets, which reflects the recommendations of the Winnipeg Police Board on the multi-year budget
in December 2019 ..
5

The police pension reforms will also allow for a further $1.5 million in savings each year to be
reinvested back into the WPS starting in 2021. These savings can support new investments in police
and public safety to be determined by the Chief of Police, in consultation with the Winnipeg Police
Board.
Overall, the preliminary 2020-2023 multi-year balanced operating budget proposes historic
investments by increasing the operating budget for the WPS by an average of 2 percent annually
from $289.4 million in 2019 (before capital related expenses) to over $313 million by 2023, which is
the largest share of the City's tax supported operating budget.
The preliminary 2020-23 multi-year balanced budgets will support continued annual investments of
$100,000 for the next 3 years in the new Community Safety and Crime Prevention Program to
bolster community-level activities that strengthen local crime prevention and community safety
efforts.
The preliminary multi-year balanced budgets will support phase 2 of the Downtown Public Safety
Strategy by providing new operating funds for a Community Connections space at the Millennium
Library to assist vulnerable and at risk residents make important connections to social services.
Also proposed is a total investment of $1 million over the next four years to support an expansion
of 24 hour safe spaces by community agencies, which is a key recommendation of the 2019 Illicit
Drug Task Force Report. 24 hour safe spaces offer an overnight, safe environment for vulnerable
individuals to rest and to access food, as well as other resources and supports. It is our expectation
that Winnipeg's proposed new investment in 24 hour safe spaces will encourage additional
investments from both the federal and provincial governments in this critical service.
The preliminary multi-year balanced budgets also propose renewed investment of $600,000 over
the next 4 years for End Homelessness Winnipeg in support of their efforts to address housing
needs and extreme weather support services for the most vulnerable in our community.
Community Services
Executive Policy Committee set an annual operating expenditure growth target of 0.5 percent per
year for Community Services for the multi-year balanced budget.
At the outset of the multi-year balanced budget process, the Public Service had proposed over $16
million of operating expenditure reduction options in order for Community Services to meet its
expenditure targets.
The recommended operating expenditure reduction options involved the closure of pools, libraries,
arenas and other civic facilities. Winnipeggers voiced significant concerns at the prospect of these
closures and the multi-year balanced budgets reflect community feedback on this matter.
6

As stated earlier, the preliminary budgets do not propose the permanent closure of any currently
open City facilities. Terry Sawchuk arena is currently closed and would remain closed.
The preliminary multi-year balanced budgets accept approximately $4.7 million of the operating
expenditure reduction options in Community Services proposed by the Public Service. Currently, 14
of 20 City of Winnipeg libraries are not open on Sundays and the remaining 6 libraries would be
brought into line with this standard. Additionally, there are currently irregular closing times for
libraries across the city and a change would see uniformity in the closing times so that all libraries
close at 8 pm.
The budgets also include a proposal to reduce Leisure Guide programming by 50 percent starting in
January 2021. This reduction will involve a review of all Leisure Guide programming, with a view to
retaining programming in high needs areas and a focus on children and youth.
Overall, the preliminary 2020-2023 multi-year balanced budgets propose to increase the
Community Services operating budget by an average of 1.3 percent annually for the next four years
from $105.1 million in 2019 (before capital related expenses) to $110.9 million in 2023, which
significantly exceeds the initial target of 0.5 percent approved by Executive Policy Committee, in
order to keep key City facilities open.
Road Renewals
The preliminary multi-year balanced budgets propose significant investments for roads.
Over the last 5 years, the City has invested a total of $535.3 million in regional and local road
renewals which has resulted in the completion of 686 lane kilometers of road, back lane and side
walk renewals.
The preliminary 2020 capital budget and five year capital forecast continues to invest the full value
of the two percent property tax increase in regional and local road renewal. In 2020, we will invest
a total of $130.3 million in local and regional road renewal, the highest annual level of investment
in our city's history.
A projected total of almost $847 million or an average of $141 million per year will be invested in
regional and local road renewals over the next 6 years. This compares to an adjusted six year
projected investment of $821 million in 2019 or an average of $136.8 million per year.
The projected investment of $847 million over the next 6 years will result in approximately 900
lane kilometers of road, back lane and sidewalk renewals, which is slightly greater than the distance
from Winnipeg to Minneapolis. This investment will support important projects across all areas of
Winnipeg including:
• Re-construction of Fermor Ave from Lagimodiere to Plessis;
7

• Re-construction of various downtown streets including Broadway from Osborne to Main
St.,;• Re-construction of various segments of Erin St., Wall St. and Sargent Ave.;• Re-construction of Stafford St., Taylor Avenue and Corydon Ave; and• Reconstruction of Leila Ave from McPhillips to McGregor.
With the investment of over $535.3 million over the last five years combined with the planned
investment of $847 million over the next six years, Winnipeg is on track to invest almost $1.4 billion
in regional and local street renewals over eleven years.
Winnipeg Fire Paramedic Service
Executive Policy Committee set an annual operating expenditure growth target of 2 percent per
year for the Winnipeg Fire Paramedic Service (WFPS) for the multi-year balanced budgets.
At the outset of the multi-year balanced budget process, the Public Service proposed approximately
$7.5 million of operating expenditure reduction options over the next four years and $7.8 million of
capital expenditure reductions to the WFPS over the next six years.
The preliminary multi-year balanced budgets reject the majority of the proposed operating and
capital expenditure reduction options in favour of an investment plan for this critical service area.
This plan is built on the recommendations of the recently released report on the WFPS Strategic
Direction that provides a 15 year blueprint for investments in the WFPS to support a growing city.
The multi-year balanced budgets propose capital investments of over $25 million to construct 2
new fire paramedic stations beginning in 2022 and 2023. These investments address two of the
most immediate capital priorities contained in the WFPS Strategic Direction report.
One of the new stations will be built on the site of the existing Windsor Park station (15) and
adjacent city land. This new station will consolidate and replace the existing station in Windsor
Park and the St. Boniface station on Marion Street (9). The investment in this station is proposed to
begin in 2022. This investment is estimated at $13 million and will be financed primarily through
the use of external debt.
The second new station will be built in Waverley West. The investment in this station is proposed to
begin in 2023. This investment is estimated at $12.1 million and will be financed partially through
the use of external debt of $5.1 million with the balance of $7 million funded from the Impact Fee
reserve, recognizing that this new station is required to support a growing area of the city.
The two new fire paramedic stations will each be designed to accommodate an ambulance, subject
to Shared Health agreeing to cover its portion of the capital cost of these facilities, recognizing that
the City of Winnipeg provides ambulance services on behalf of Shared Health on a contract basis.
8

It is also expected that the City of Winnipeg will explore options with its neighbouring municipalities
in the Winnipeg metropolitan region to help defray the cost of these new fire paramedic stations.
The preliminary multi-year balanced budgets also reflect approximately $2.2 million of the
operating expenditure reduction options proposed for WFPS, roughly 30 percent of all of the
options proposed by the Public Service. These mostly involve reductions to station maintenance
over the next four years.
Overall, the preliminary 2020-2023 multi-year balanced budgets propose to increase the operating
budget for the WFPS by an average of 2.1 percent annually for the next four years from $199.5
million in 2019 (before capital related expenses) to $216.8 million in 2023, which slightly exceeds
the target increase of two percent approved by Executive Policy Committee.
Tree Protection and Enhancement
In 2019, the Million Tree Challenge was launched to challenge Winnipeggers to help plant 1 million
new trees as our population grows towards 1 million people over the coming decades.
Winnipeg's tree canopy is a great source of pride for our residents and a key asset in the battle
against climate change however; our tree canopy is under threat from destructive forces such as
the Emerald Ash Borer Beetle and Dutch Elm Disease.
The preliminary multi-year balanced budgets have made the protection and enhancement of our
trees a priority by increasing the operating budget for tree planting, pruning and Dutch Elm Disease
Control from $11.8 million in 2019 to $12.5 million in 2023, an increase of 6 percent.
The total capital investment in the Urban Forest Enhancement Program and the Reforestation
Improvements over the next four years is budgeted to be over $25 million, an increase of almost
$10 million or 60 percent from the previous four year capital investment in this area. Budget
investments build on previous financial support by Council to Trees Winnipeg who will be leveraged
to deploy funds and resources from the private sector to expand the urban canopy.
Six Year Capital Investment Plan
The preliminary 2020-23 multi-year balanced capital budget and five year capital forecast proposes
an investment of $2.152 billion, which is a decrease of approximately $154 million from the $2.306
billion in the 2019 budget and five year forecast.
This decrease in capital investment is primarily attributable to a decrease in capital investment from
the operating budget (cash to capital) from $360.2 million in last year's budget and five year
forecast to $128 million in this year's budget and five year forecast. This decrease in cash to capital
investment is necessary in order to bring the budgets into balance. The overall decrease in the six
year capital investment plan reflects a majority of the capital expenditure reduction options that
have been proposed by the Public Service.
9

External debt for new capital investment for the next six years is projected to be slightly under
$133.7 million (excluding Fleet vehicle related debt) which is an increase of $24.3 million from the
six year forecast last year of $109.5 million but still well within the City's self-imposed debt limits.
The new debt in the six year capital investment plan will primarily support inter-generational
investments in roads and construction of new fire paramedic stations.
$20 million from the Federal Gas Tax top up allocated to Winnipeg last year will be used to support
investments in safety, security and accessibility improvements to recreation facilities, a renewal of
the St. James Civic Centre and the Bonivital Pool, as well as the Urban Forestry Program.
The six year capital investment plan also includes key infrastructure investments that address
environmental sustainability and improve our overall quality of life including:
• An investment of $180 million to reduce the incidence of combined sewer overflows;• An investment of $23.3 million in Active Transportation Infrastructure;• An investment of $113.5 million for water main renewals and a further $113 million for
sewer main renewals;• An investment of $132.8 million for the purchase of 180 buses to replace existing buses;• An investment of $6 million to install new heated bus shelters at various locations
throughout the City;• An investment of $4.2 million to digitalize the Planning, Property & Development permitting
process;• An investment of $14.6 million for ongoing capital improvements at Assiniboine Park; and,• An investment of $3.0 million towards the renewal of Rainbow Stage in Kildonan Park.
Driving Transformative Change
The preliminary multi-year balanced budgets will chart a course for real, measurable transformative
change over the next four years. In 2020, the Public Service will bring forward options to establish a
new Transformative Fund (TF) for Council's consideration that will be funded from the sale of assets
deemed surplus to the City's needs.
The TF will support investments that transform the delivery of City services and reduce the City's
infrastructure deficit with a focus on recreation, public green space as well as protection and
enhancement of Winnipeg's tree canopy.
The Public Service will also present a plan for Council's consideration early in 2020 to initiate the
sale of John Blumberg Golf Course, and report back later in 2020 with a plan to re-purpose up to 30
percent of all City-owned golf lands.
The Public Service will also report back in 2020 with a plan for Council's consideration to reduce the
number of City owned building assets, including those leased to 3rd parties.
10

The Public Service will also report back in 2020 with a wading pool and splash pad reinvestment
strategy for Council's consideration that will be funded by the TF.
And finally, in preparation for the 2024-2027 multi-year balanced budgets, the Public Service will be
working collaboratively with the Winnipeg Police Service (WPS) and Winnipeg Police Board to bring
forward options for Council's consideration on a new multi-year funding formula for the WPS that
will provide planning certainty for the City, and a sustainable and predictable funding level for the
WPS.
Conclusion
In the coming decades, Winnipeg's population is expected to chart strong and steady increases as
we move toward a city of 1 million people. It is critical that we invest in the services and
infrastructure now that we know we will need to support this level of growth in the future.
The preliminary 2020-2023 multi-year balanced budgets present a responsible and sustainable fiscal
blueprint to support a growing city.
We must continue to work with our federal and provincial partners to maximize Winnipeg's share of
infrastructure funding for investments that will support our growing city. We must also continue to
work with our provincial government to ensure that the City of Winnipeg has a fair say in how
provincial infrastructure grants are spent in Manitoba. We will continue to scrutinize all of our
expenditures to ensure we are providing certainty and maximum value for taxpayers.
We now invite all residents and members of Council to continue our efforts to finalize the
preliminary 2020-2023 multi-year balanced budgets.
Respectfully submitted,
Brian Bowman
MAYOR
olicy Committee on Finance
11

12
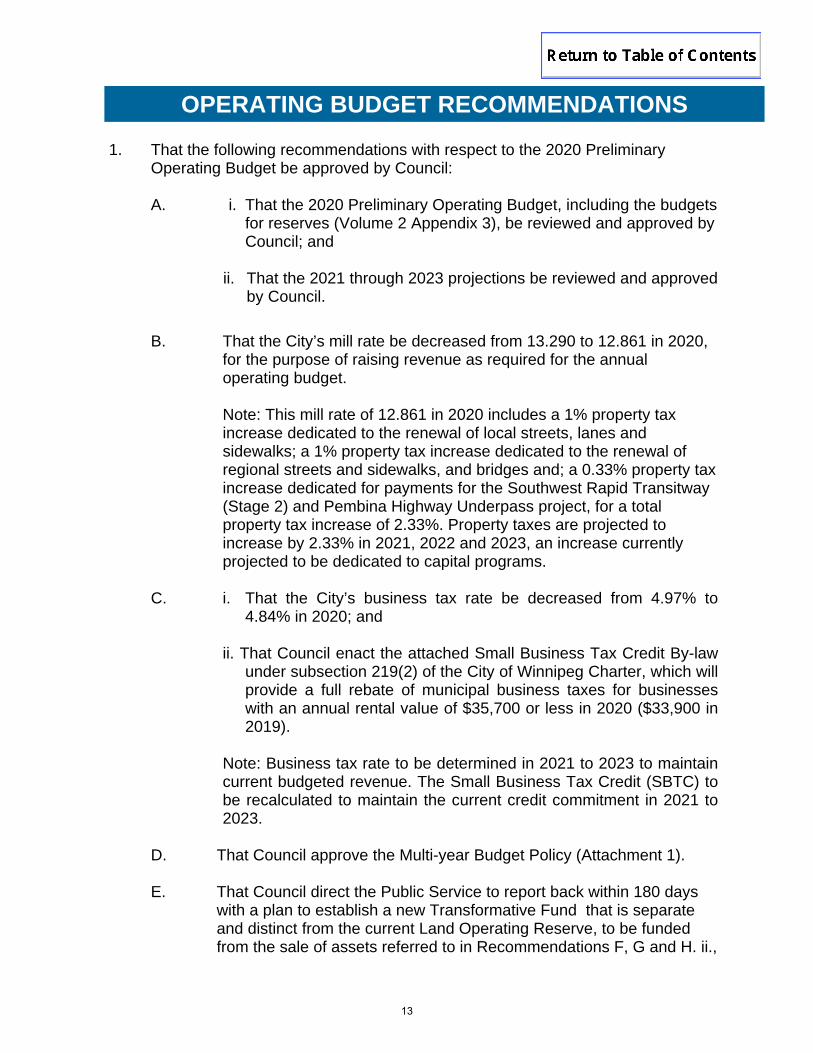
OPERATING BUDGET RECOMMENDATIONS
1. That the following recommendations with respect to the 2020 Preliminary Operating Budget be approved by Council:
A. i. That the 2020 Preliminary Operating Budget, including the budgets for reserves (Volume 2 Appendix 3), be reviewed and approved by Council; and
ii. That the 2021 through 2023 projections be reviewed and approved
by Council.
B. That the City’s mill rate be decreased from 13.290 to 12.861 in 2020,
for the purpose of raising revenue as required for the annual operating budget.
Note: This mill rate of 12.861 in 2020 includes a 1% property tax increase dedicated to the renewal of local streets, lanes and sidewalks; a 1% property tax increase dedicated to the renewal of regional streets and sidewalks, and bridges and; a 0.33% property tax increase dedicated for payments for the Southwest Rapid Transitway (Stage 2) and Pembina Highway Underpass project, for a total property tax increase of 2.33%. Property taxes are projected to increase by 2.33% in 2021, 2022 and 2023, an increase currently projected to be dedicated to capital programs.
C. i. That the City’s business tax rate be decreased from 4.97% to
4.84% in 2020; and
ii. That Council enact the attached Small Business Tax Credit By-law under subsection 219(2) of the City of Winnipeg Charter, which will provide a full rebate of municipal business taxes for businesses with an annual rental value of $35,700 or less in 2020 ($33,900 in 2019).
Note: Business tax rate to be determined in 2021 to 2023 to maintain
current budgeted revenue. The Small Business Tax Credit (SBTC) to be recalculated to maintain the current credit commitment in 2021 to 2023.
D. That Council approve the Multi-year Budget Policy (Attachment 1).
E. That Council direct the Public Service to report back within 180 days
with a plan to establish a new Transformative Fund that is separate and distinct from the current Land Operating Reserve, to be funded from the sale of assets referred to in Recommendations F, G and H. ii.,
13

and that the report from the Public Service include the following parameters for the Transformative Fund:
i. That the Transformative Fund be used to support investments thattransform the delivery of services and reduce the City’sinfrastructure deficit with a focus on recreation, public green spaceas well as preservation, protection and enhancement of Winnipeg’stree canopy; and
ii. That the Transformative Fund include a requirement that a majorityof the proceeds deposited into this fund be re-invested within thearea in which the funds were generated.
F. That Council direct the Public Service to report in 180 days to theStanding Policy Committee of Property Development, Heritage andDowntown Development with recommendations to sell or enter into ajoint venture in respect of John Blumberg Golf Course or the land onwhich the John Blumberg Golf Course is situated and that a portion ofthe sale/development proceeds be deposited into the TransformativeFund.
G. That Council direct the Public Service to report back in 2020 with aplan to re-purpose up to 30% of all City owned golf lands. The re-purposing options of these golf lands may include, but are not limitedto, public green space, active transportation, reforestation, communitygardens, residential development (with affordable housing) andrecreational opportunities. The report from the Public Service is toinclude a policy to deposit a portion of any proceeds from the sale ofthese lands into the Transformative Fund.
H. That Council direct the Public Service to report back within 180 dayswith a plan to rationalize City owned and/or leased building assetsincluding:
i. Administrative buildings that the Public Service considers to besurplus to the needs of the City, with any sale proceeds from thesebuildings deposited into the Land Operating Reserve;
ii. Buildings leased to third parties that the Public Service considersto be surplus to the needs of the City (including a relocation planfor any non-profit tenants) and the Terry Sawchuk Arena, with aportion of any sale proceeds deposited into the TransformativeFund.
I. That Council direct the Public Service to report back within 180 dayswith a wading pool rationalization and splash pad reinvestmentstrategy which proposes funding from the Transformative Fund.
14

J. That Council direct the Chief Administrative Officer to immediately reduce the number of City owned and leased fleet vehicles by 5% starting in 2020 and report back in 2020 to the appropriate committee of Council on the feasibility of any further reductions to the City’s vehicle fleet.
K. That Council direct the Public Service, in preparation for the 2024 –
2027 multi-year budgets, working collaboratively with the Winnipeg Police Service (WPS) and the Winnipeg Police Board, to bring forward on or before March 2022 options and recommendations for Council’s consideration on a multi-year funding formula for the WPS that will provide planning certainty for the City of Winnipeg and a sustainable, predictable funding level for the WPS.
L. That Council amend the purposes of the Financial Stabilization Reserve to allow transfers between the Financial Stabilization Reserve and the General Revenue Fund, subject to maintaining required annual minimum balances in the Financial Stabilization Reserve, in order to ensure that the tax-supported operating budget is balanced.
M. In order to balance the four-year operating budget, that Council
approve the following transfers between Financial Stabilization Reserve Fund and the General Revenue Fund as noted below.
2020 2021 2022 2023 4year Total
Transfer (to)/ from Financial Stabilization Reserve Fund
($4,959,067) ($6,817,945) $4,555,491 $24,221,521 $17,000,000
N. That Council approve the fees (Volume 2 Appendix 6), levies and
transfers between funds (from / to General Revenue Fund summarized in Volume 2 Appendix 4) outlined in the 2020 Operating Budget.
O. That Council direct the Public Service to report to the appropriate
committee of Council within 90 days outlining the creation of a grants program to support the delivery of $1,000,000 in new funding over four years to provide 24/7 safe space supports and services in Winnipeg. Informed by End Homelessness Winnipeg’s 2019 review entitled “Safe Spaces in Winnipeg: A Brief Review of Existing Reports and Services”, the report must outline the parameters for the grants program, including but not limited to, the program’s purpose, objectives, application criteria, selection process, and timelines for this initiative.
P. That Council direct Winnipeg Transit to amend the rule that excludes from Winnipeg Transit Plus services an eligible user located more than 500 meters from a bus route in favour of a rule that includes for the
15

purposes of Winnipeg Transit Plus services any eligible user located within the City of Winnipeg boundaries and all necessary documents be updated to reflect the change.
Q. That Council approve the introduction of a program allowing childrenunder the age of 12 to travel on Transit free of charge, which programis to be administered as a separate program from any other fareprograms and further direct Winnipeg Transit to report to the StandingPolicy Committee on Infrastructure Renewal and Public Works within180 days with respect to the details of the program, an implementationplan, a formal policy and an implementation timeline with a launch datein 2021.
R. That Council approve the elimination of Transit’s Downtown Spiritservice effective Fall 2020.
S. That Council approve the elimination of the U-Pass program effectiveJune 1, 2020.
T. That Council approve the reduction of bus service as outlined inAttachment 2.
U. That Council amend the Business Improvement Zone Procedures By-law 8111/2002 to reflect that Business Improvement Zones,commencing with their 2021 budget, must allocate funds to offset aportion of the costs of the Neighbourhood Economic DevelopmentOfficer and that the allocation of this cost to individual BusinessImprovement Zones be based on (adjusted) annual rental value.
V. That Council reiterate its prior direction to the Public Service tocontinue to pursue a new agreement with Shared Health Services forthe provision of Emergency Medical Services by the City that reflectsfull cost recovery, including but not limited to the leasing costs for anynew fire paramedic stations.
W. That Council authorize the Chief Financial Officer to:
i. allocate operational savings realized from Innovation projectswithin this four-year operating budget and approved in 2018 or2019, to individual departments and Special Operating Agencieswith the prior approval of the department(s) in which the projectwas implemented; and
ii. allocate any new operational efficiencies realized within theInnovation, Transformation and Technology Department within thisfour-year operating budget as a portion of the return on investmentrequired to self-fund the Innovation Strategy and Smart Citiescapital programs up to a maximum annual program value of $2million.
16

X. That Council direct the Chief Innovation Officer to report back on the
return on investments and results of the innovation and transformation initiatives through the annual budget process.
Y. That Council:
i. require that, prior to payment of grants exceeding $5,000 annually approved in the 2020 operating budget, the City enter into, execute and deliver four-year grant agreements with grant recipients, and authorize the Chief Financial Officer to negotiate and approve the terms and conditions of grant agreements in accordance with the budgetary approval and such other terms and conditions deemed necessary by the City Solicitor/Director of Legal Services to protect the interests of the City, including a provision that grants for years following 2020 are subject to budgetary approval; and
ii. approve grant and grant delegations as indicated in Volume 2 Appendix 2.
Z. That Council enact amendments to the Tax Certificate Fees By-law 53/205 to increase the fee for the making and mailing of a paper tax certificate to $58.00.
AA. That Council enact amendments to the Advertising Signs Business
Tax By-law 6298/96 to increase the fee for a licence in lieu of business tax to:
i. $28.75 per square foot of the face of each digital sign; ii. $3.25 per square foot of the face of each advertising sign that is
not a digital sign.
BB. That Council repeal the Residential Toilet Replacement Credit Program By-law No. 111/2009 as the program has been discontinued.
CC. That Council enact amendments to the Sewer By-law No. 106/2018 to ensure that the City continues to pay private sewer service pipe repairs under section 41 for pipes serving owner-occupied single family dwellings and duplexes but discontinue paying private sewer service pipe repairs for those serving other buildings.
DD. That Council enact amendments to section 98 of the Sewer By-law No. 106/2018 to adjust the annual credit applicable to total sewer charges and overstrength wastewater surcharges for qualifying properties from 30% of the total sewer charges and overstrength wastewater surcharges to 20% effective January 1, 2021, 10% effective January 1, 2022 and zero % effective January 1, 2023.
17

EE. That Council direct Special Operating Agencies to include a budget for vacancy management, as is the practice for other City departments, to be transferred to the tax supported fund and direct the Chief Administrative Officer to manage these in the same manner as with departments of the City.
FF. That Council, consistent with its prior direction to the Public Service, direct the Chief Administrative Officer, as part of the 2021 to 2023 annual multi-year budget review process, to apply continuous improvement tools as set out in Council motion on July 18, 2019.
GG. That Council direct the City Solicitor/ Director of Legal Services to submit the necessary by-laws and policy amendments to implement the above recommendations directly to Council by way of a communication through the Office of the City Clerk.
18

CAPITAL BUDGET RECOMMENDATIONS
2. That the following recommendations with respect to the 2020 Preliminary Capital Budget and 2021 to 2025 Five Year Forecast be approved by Council: A. i. That the 2020 Preliminary Capital Budget, totaling $369.569 million
be reviewed and approved by Council;
iii. That Council approve new capital borrowing authority as follows: a) $56.327 million external borrowing for 2020 tax-supported
operations, including Transit and Municipal Accommodations; and
b) $1.440 million external borrowing for 2020 tax-supported internal financing.
Note: The borrowing authority for Winnipeg Fleet Management Special Operating Agency (SOA) is approved as part of the SOA’s 2020 to 2023 business plan report.
iii. That the 2021 to 2025 Five Year Capital Forecast be reviewed and approved by Council.
B. That Council approve the following cash to capital contribution:
Year $ Millions
2020 22.721 (budget) 2021 22.889 (forecast) 2022 21.408 (forecast) 2023 21.500 (forecast) 2024 20.000 (forecast) 2025 20.000 (forecast)
C. That Council approve all other transfers from prior years’ surplus or authorizations (Volume 3 Appendix 4), to/from reserves and other funds outlined in the capital budget.
D. That Council cancel the following unutilized borrowing authorities in the noted amounts:
i. By-law 120/2009 in the amount of $50 million (Tax supported
borrowing related to Disraeli Bridge and Overpass Facility); and
ii. By-law 133/2017 in the amount of $801,434 (Solid Waste Fund). E. That Council authorize expenditures on the following projects in 2020 or
prior to the adoption of the 2021 capital budget as a first charge against the General Capital Fund, in accordance with Subsection 288(2) of the City of Winnipeg Charter, to facilitate timely work on the projects:
19

i. Up to $84.500 million for various Accelerated Regional StreetRenewal projects as set out in the capital detail sheet page 2-13;
ii. Up to $1.000 million for the University Crescent - Pembina Highwayto Chancellor Matheson Drive regional street project;
iii. Up to $0.500 million for the Portage Avenue Eastbound – St.Charles to David Street regional street project;
iv. Up to $7.000 million in Local Street Renewals to facilitate deliveryof industrial streets, residential streets, alley, and sidewalkrenewals;
v. Up to $4.820 million for the combined Sherwin Road - DublinAvenue to Notre Dame Ave road renewal and bridge project;
vi. Up to $2.100 million for the Wellington Crescent RiverbankStabilization project; and
vii. Up to $500,000 for the Boni-Vital Pool.
F. That Council approve transfers from Land Operating Reserve in 2020
i. to the General Capital Fund to a maximum of $4.515 million
ii. to the General Revenue Fund to a maximum of $4.235 million
provided the reserve’s unallocated equity balance does not enter into a deficit position. Should the unallocated equity balance be such that the full transfer cannot be made, any shortfall will be addressed during 2020.
G. That Council approve that $1.876 million in prior years’ tax supportedcash to capital surplus due to capital projects coming under budget,identified in Volume 3 Appendix 5b,be utilized as a funding source in theGeneral Capital Fund in the 2020 tax supported capital budget.
H. That Council direct the City Solicitor/ Director of Legal Services tosubmit the necessary borrowing by-law directly to Council by way of acommunication through the Office of the City Clerk.
3. That the Proper Officers of the City be authorized to do all things necessary toimplement the foregoing.
20

Attachment 1
CITY OF WINNIPEG POLICY NO. ________
1. Purpose:
The purpose of this policy is to define the approach to be used for multi-year budget and Council approvals.
2. Definitions:
2.1 “Budget cycle” means a four-year budget cycle beginning with operating and capital budgets adopted by Council for the second fiscal year following a general election of members of Council as provided for in this Policy.
2.2 “Budget Working Group” means the working group of councillors with the functions outlined in this Policy and consists of members of Council appointed by the Mayor.
2.3 “Capital Budget” means the annual plan for capital projects to be undertaken by the City, together with the method of financing for each. In accordance with the City of Winnipeg Charter, a capital budget must be prepared and approved for the current year and the subsequent five years (forecast years).
2.4 “Chief Administrative Officer” means the individual appointed to that position pursuant to the City of Winnipeg Charter, or an employee of the City to which the Chief Administrative Officer has delegated some or all of the functions assigned to his or her by this Policy.
2.5 “Chief Financial Officer” means the individual appointed to that position
pursuant to the City of Winnipeg Charter, or an employee of the City to which the Chief Financial Officer has delegated some or all of the functions assigned to him or her by this Policy.
2.6 “Charter” means The City of Winnipeg Charter, S.M. 2002, c. 39.
2.7 “Committees” means the Standing Policy Committees of Council and Winnipeg Police Board.
POLICY TITLE Multi-Year Budget
ADOPTED BY City Council
EFFECTIVE DATE
ORIGIN / AUTHORITY Executive Policy
Committee / City Council
CITY POLICY NO MOST RECENT CONSOLIDATION
21

Attachment 1
2.8 “Operating Budget” means the annual plan of city’s services and programs with estimated revenues and expenditures associated with each.
2.9 “Multi-year Budget” means the annual operating and capital budgets adopted by Council together with operating budget projections and capital budget forecasts as required by this Policy.
3. Policy
3.1 This Policy builds on – but does not supersede - the legislative requirementsfor the City’s budgets. A multi-year budget for a four year time period beginning in the second fiscal year following a general election of members of Council shall be prepared and adopted by Council. In the first year of a budget cycle, Council shall adopt operating and capital budgets for that year and shall also adopt an operating budget projection for an additional three years and a capital forecast for the next five years, both of which must balance. In the remaining years of the budget cycle, Council must adopt annual budgets on the basis of operating budget projections and capital budget forecasts it previously approved, with adjustments to the projections and forecasts made as provided for in this Policy.
3.2 Legislative requirements for budgets a) Annual operating budget - subsection 284(1) of the Charter states that
before March 31 of each fiscal year, or such later day in the year asmay be fixed for that year by the Lieutenant Governor in Council for thepurposes of this section, Council must adopt an operating budget forthat year.
b) Capital budget and forecast – subsection 284(2) of the Charter statesbefore December 31 of each fiscal year, Council must adopt a capitalbudget for that year and a capital forecast for the next five fiscal years.
c) Executive Policy Committee – subsection 62(1) of the Charter statesthat Executive Policy Committee must formulate and presentrecommendations to Council respecting budgets.
d) Expenditures – subject to subsection 288(2), subsection 288(1) of theCharter states the City may make expenditures only if they are providedfor in the operating budget or capital budget of the City or otherwiseapproved by Council under the authority of this or any other Act.
e) Subsection 288(2) of the Charter states that, before the City's operatingor capital budget for a fiscal year is adopted, Council may authorizeexpenditures to be made of amounts for operating or capital expenses,not exceeding in total 30% of the expenditures estimated in the City'soperating and capital budgets for the previous fiscal year. TheExpenditures Before Budget Adoption By-law No. 8164/2002 authorizesspecific expenditures to be made prior to the adoption of the budgetpursuant to this authority.
22

Attachment 1
f) In adopting an operating budget, subsection 285(2) of the Charter states that Council must ensure that the estimated expenditures for a fiscal year do not exceed the estimated revenues for the year.
g) Subsection 286 of the Charter states that the capital budget of the City for each fiscal year and each five year capital forecast of the City shall include estimates of the amount needed to acquire or construct each of the works proposed in the budget or forecast, and the anticipated sources of the amount needed for each of those works.
3.3 In adopting the annual operating and capital budgets in years two to four of
the budget cycle, Council must review the operating budget projection and capital budget forecast previously approved for that year, make adjustments to them (if any) in accordance with this Policy and adopt them as the budget for that year.
3.4 In addition to approving budgets and projections for years within the budget cycle, in each year of the budget cycle, Council must approve operating budget projections for a further three years and capital budget forecasts for a further five years. Operating budget projections for years beyond the budget cycle need not be balanced (i.e. revenue need not equal expenditures).
3.5 Before adopting a budget in Years 2-4 of the budget cycle, Council may consider adjusting the approved operating projections and capital forecasts for reasons including: a) Legislative changes – new or amended legislation or regulations with
a financial impact to the City; b) New council direction – a new Council direction that has been
approved since the approval of the multi-year budget; c) Cost or revenue driver changes – a corporate or service area budget
adjustment as a result of changes in economic or other conditions. d) Incremental operational impact of approved capital projects within
the multi-year year budget.
3.6 In-year budget amendments: a) Operating Budget Amendment Process – Council approval is required
to amend the net operating budget amount in the course of the year and to add new programs or remove programs from the budget. The Standing Policy Committee on Finance is authorized to approve the addition of budgeted amounts including reallocation of budgets for a purpose other than that set out in the budget to existing programming so long as the net operating budget amount is not increased.
b) Capital Budget Amendment Process - Only Council can approve any new capital project, whether funded by surpluses from other projects or by new funding. Any required additional borrowing authority must be approved by the Minister of Finance of the Province of Manitoba and enacted through a by-law of Council. The Standing Policy Committee on
23

Attachment 1
Finance may approve transfers of budgets between existing capital projects. If the transfer is smaller than $100,000 or 25% of the budget being increased (whichever is the lesser), the transfer can be approved by the Chief Financial Officer.
3.7 The Chief Financial Officer is authorized to make minor adjustments that are “housekeeping” in nature. These include the following: a) increases to program expenditures in the operating budget that can be
off-set by under-expenditures within the same program including, inlimited circumstances, transfers from permanent salary to non-salaryexpenditures (e.g. expenditures incurred for contractors completingwork that would otherwise be the responsibility of an employee whoseposition is vacant);
b) increases to operating expenditures within a program that are offset byrevenues or recoveries directly associated with the expenditureincrease;
c) transfers of up to $100,000 of capital project surplus by way of the non-specified account to an existing approved capital project withoutcreating a new project or program. (Note: Tax-supported departmentnon-specified capital accounts accumulate capital budget surplus cashto capital amounts);
d) redistribution of financing sources, including provincial funding, federalgas tax revenue, cash to capital, debt financing and others inaccordance with Council-approved borrowing by-laws, provided thetotal approved capital financing is not exceeded, to ensure the mosteffective use and timing of financing sources.
e) re-stating the budget subsequent to adoption to reallocate amounts toreflect Council’s ratification of collective agreements, Council’s approvalof decisions with budget implications, as well as Corporate costreduction measures, including efficiency savings and the impact of anydecisions made in relation to vacancy management, if required, on abudget neutral basis.
3.8 In addition to the authority given in section 35.1 of the City Organization By-law, the Chief Administrative Officer is authorized to manage vacancies within City departments and administrative units within the scope of the annual operating budget without affecting the general level of public services as identified in the operating budget or overall civic staff establishment.
24

Attachment 1
4. Budget Process 4.1 The guiding directive of the multi-year budget process is that, over the period
of the four year budget cycle, the City shall maintain a balanced budget.
4.2 In the first year of each multi-year budget cycle, under the oversight of the Budget Working Group, the Chief Administrative Officer shall ensure that the Public Service prepares draft operating and capital budget forecasts for the period of the budget cycle and presents recommendations to the appropriate Committees for consideration and discussion. a) In preparing the draft operating budget projections and capital budget
forecasts, the Public Service shall take into account the strategic priorities identified by Council and outlined in OurWinnipeg and its associated implementation strategies, as well as corporate and departmental strategic plans; and
b) Proposals by the Public Service shall reflect Council’s priorities and guidelines which are achievable within the limits of approved budget guidelines that have been determined by the Executive Policy Committee.
4.3 The Committees shall consider the recommendations of the Public Service
and forward the results of their deliberations and recommendations to the Budget Working Group.
4.4 The Budget Working Group shall consider the recommendations of Committees as well as the budget proposals from the Public Service.
4.5 The Budget Working Group shall propose a preliminary multi-year budget to
the Executive Policy Committee, which must table it at a public meeting and forward it to Committees for their consideration of its implications within the areas of their jurisdiction.
4.6 The Executive Policy Committee shall receive and consider recommendations
on the preliminary multi-year budget from the Committees and shall recommend the multi-year budget, with or without amendments, to Council for approval.
4.7 In Years 2 to 4 of a budget cycle, the Budget Working Group shall oversee
the annual budget review.
4.8 In Years 2 to 4 of a budget cycle, multi-year budget publications or presentations shall be consistent with previous years but shall be flexible to adapt to changing environments and/or direction from Council.
25

Attachment 1
5. Policy Review
This Policy shall be reviewed at a minimum after each budget cycle by the ChiefAdministrative Officer and be updated as deemed appropriate or required.
6. Responsibilities
6.1 City Council has the responsibility for overall budgetary policy and direction,strategic considerations as well as amendment of this Policy. Only City Council has authority to approve the annual operating and capital budgets as well as operating budget projections and capital budget forecasts.
6.2 Budget Working Group shall review submissions from the Public Service and Committees as part of the multi-year budget development and annual adjustments and, based on those submissions, shall propose a draft budget to Executive Policy Committee.
6.3 Executive Policy Committee shall a) approve budget guidelines and provide any supplemental direction to
Committees in the first year of the budget cycle;b) table the preliminary multi-year operating budget and capital budget
(including projections and forecasts) proposed by the Budget WorkingGroup;
c) recommend a budget to Council for adoption.
6.4 Committees shall in the first year of a budget cycle a) consider presentations by the Public Service and delegations from the
public concerning the areas of the budget within their jurisdictions andprovide recommendations for consideration by the Budget WorkingGroup; and
b) hear delegations from the public concerning the areas within theirjurisdictions of the budget and make recommendations concerning thepreliminary budget to Executive Policy Committee.
6.5 Chief Administrative Officer shall oversee the Public Service’ participation in the multi-year budget process.
6.6 Public Service shall a) prepare and present to Committees, Budget Working Group, and
Council as a whole, long-term forecasts including consideration ofcorporate and departmental strategic plans as background informationto Council’s preparation of guidelines for four-year budgets.
b) provide the necessary analysis and information aligned with ExecutivePolicy Committee budget guidelines and Council direction.
26

Attachment 2Winnipeg TransitService Rationalization - Route Reductions
Route No.
Route Name Day Type Current Hours Reduced Hours
10 St Boniface/Wolseley Sunday 06:43-24:36 10:59-22:3068 Crescent Saturday 10:36 - 18:52 No Saturday Service79 Charleswood Saturday 05:32 - 26:05 05:32 - 19:0079 Charleswood Sunday 06:32 - 25:01 11:00 - 22:2979 Charleswood Weekday 08:33 - 26:05 08:33 - 22:3082 Saturday 08:27 - 18:49 No Saturday Service83 Saturday 08:07 - 22:21 11:00 - 19:0083 Sunday 11:53 - 19:47 No Sunday Service84 Saturday 05:36 - 23:41 11:00 - 19:2185 Saturday 10:49 - 19:21 No Saturday Service85 Sunday 10:51 - 19:01 No Sunday Service85 Weekday 05:35 - 22:55 05:35 - 19:0089 Saturday 06:54 - 25:22 No Saturday Service89 Weekday 08:59 - 25:44 08:59 - 19:0092 Saturday 06:47 - 23:25 11:00 - 19:0092 Sunday 11:13-18:37 No Sunday Service92 Weekday 08:28 - 24:25 08:28 - 19:0093 Saturday 06:35 - 19:30 No Saturday Service93 Sunday 11:32-17:33 No Sunday Service94 Weekday 05:44 - 24:32 05:44 - 22:2595 Saturday 07:43 - 19:18 No Saturday Service95 Sunday 10:49-19:18 No Sunday Service95 Weekday 05:21 - 20:46 05:21 - 19:0097 Weekday 05:44 - 19:09 Rush Hour Only98 Weekday 05:53 - 18:36 Rush Hour Only
Notes:•••
The following routes will lose all Saturday service: 68, 82, 85, 89, 93, 95The following routes will lose all Sunday service: 83, 85, 93, 95These are the rationalization options with the lowest passenger impacts
27

28
Reader’s Guide
This Reader’s Guide is intended to provide the reader with a basic understanding of Volume 2 of the budget documents developed from the budgeting process, as well as briefly describe the document’s content and layout.
The budget documents have several purposes: As a policy document, they outline the financial policies that guide the development of the budget
as well as articulate financial priorities and issues; As a financial plan, they provide, in dollar terms, the plans for the next several years; As an operating guide, the budget documents help City departments manage their day-to-day
operations by providing important financial and policy information and by identifying the financial and staffing resources available to carry out their activities; and
As a communications device, the documents give all readers a comprehensive look at the services provided by the City and the costs related to those services.
Volume 2 provides summary and detailed budget information on 2020 operations and 2021, 2022, and 2023 projections; and summary information on capital projects including financing for the capital program, set out in the following sections:
The very front of the book includes the 2019 GFOA budget award and the City of Winnipeg Council organization chart, 2020 Letter from the Mayor and the budget recommendations to be submitted for Council approval.
Section 1 - the Overview section provides key information about the operating and capital budgets. Reader’s Guide 2020 Budget at a Glance identifies and summarizes the City budgets for major funds on a
consolidated basis. Basis of Budgeting and Budget Process provide the guidelines and key steps in developing the
budget. Budget Presentation provides information about the public consultation process, budget context
and highlights, how the operating and capital dollars are to be spent and future budget challenges.
Section 2 - Service Based Budget The Financial Summary section provides a listing of all City services and the Standing Policy
Committee responsible for each, together with a summary of the revenue, investment and full time equivalents (FTEs) related to each service. Page references on the Financial Summary direct the reader to more detailed information by service in the next section.
The Detailed Service Based Budget section, categorized by responsible Standing Policy Committee, gives additional information about each service, including description, key goals, service level statistics, multi-year operating budgets and actuals by major account categories, revenue, expense and full-time equivalent position variance explanations, sub-services, as well as hi-level summary information of reserves and capital budget investments relevant to the service.
Section 3 - the Appendices provide additional context information in support of the rest of the budget document.
Preliminary 2020 Budget - Overview 1-1

2019Adopted Budget
2020 Preliminary
Budget
Tax Supported Operations 1,125.0 1,144.5 Utilities 652.6 661.0 Special Operating Agencies 81.3 81.4 Reserves 312.0 279.2 Capital 367.8 369.6
Total Revenue 2,538.7 2,535.7
2019Adopted Budget
2020 Preliminary
Budget
Tax Supported Operations 1,125.0 1,144.5 Utilities 685.2 618.2 Special Operating Agencies 89.3 85.4 Reserves 263.1 275.7 Capital 367.8 369.6
Total Expenditures 2,530.4 2,493.4
Surplus / (Deficit) 8.3 42.3
Notes: 1.
2.
3 -The beginning and ending balance in the General Revenue Fund is zero.
4. - A detailed list of reserve funds can be found in Appendix 3 of Volume 2.
2020 BUDGET AT A GLANCE
(In millions of $)
- The consolidated budgets are presented in Appendix 8 of Volume 2 for 2019 and 2020.
- The entity's audited financial statements are prepared on a consolidated basis and can be found on theCity website: http://www.winnipeg.ca/finance/documents_page.stm.
Revenue
Expenditures
1-2 Preliminary 2020 Budget - Overview

Basis of Budgeting
The City, for the first time ever, has produced a four year, multi-year operating budget. The 2020 to 2023 Tax Supported Operating Budget is balanced in all four years. The 2020 preliminary operating budget and projections will go to Council for adoption in March.
The City prepares a six-year capital investment plan, including related funding sources. The six-year capital view is required by legislation (The City of Winnipeg Charter). The preliminary capital budget for 2020 and five-year forecast will go to Council for adoption in March 2020.
The City budgets for several funds – the capital fund; the general revenue or tax-supported fund; utility operations (Transit, Waterworks, Sewage Disposal, Solid Waste Disposal, Land Drainage, Municipal Accommodations); and Special Operating Agencies (Animal Services, Golf Services, Parking Authority and Fleet Management). Transfers to or from the General Revenue Fund (see Appendix 4A and B, Volume 2) and between funds are included in the budget. In addition, revenues and expenses for capital and special purpose reserves are included in the budget (see Appendix 3, Volume 2).
The basis of budgeting for the City is described in more detail in the following sections:
Expense and Revenue Recognition
The City of Winnipeg develops its operating budget for tax supported and utility operations on a modified accrual basis. The modified accrual basis of accounting records revenue when it is earned, measurable and available. Expenditures are recognized when the liability is incurred, except for certain expenses, for example, those associated with retirement allowances, accrued vacation, worker’s compensation, compensated absences, and landfill liabilities which are budgeted on a cash basis. Debt servicing payments are budgeted for when due (depreciation of assets is not budgeted). Revenue from land sales is recorded in accordance with accounting principles used within the real estate industry.
The City uses the full accrual basis of accounting. Revenue is recorded as it is earned and measurable. Expenses are recognized as they are incurred and measurable based on receipt of goods and/or the legal obligation to pay. The City’s financial statements are developed in accordance with generally accepted accounting principles for local governments, as recommended by Public Sector Accounting Board (PSAB).
Capital Assets
Capital assets are generally defined as those with a cost exceeding $100,000 (non-recurring capital projects and recurring/ongoing capital programs) with a minimum 10-year life. These assets are budgeted for in the capital budget and the financing costs are expensed in the operating budgets. Major equipment or automated systems development projects are also included in the capital budget although their useful life may be less than 10 years. Land acquisition and local improvements are considered capital works regardless of expected cost. Smaller asset purchases are expensed in the operating budgets.
Preliminary 2020 Budget - Overview 1-3

A multi-criteria approach to prioritize capital investment based on a triple bottom line approach, which includes assessing projects based on social, economic and environmental factors, has been developed as part of the City’s asset management initiative. This annual prioritization tool is available to all departments and facilitates the development of their capital budget submission.
Service-Based Budget
The City reports budget information on a service-based basis (how much the service will cost and how the service is to be funded), regardless of which area or department delivers the service. The service-based budget is intended to provide more transparent reporting and a more direct link between budgets provided and the services delivered. As part of the budget document a more traditional, by department view is also provided (see Appendix 1, Volume 2).
Capital Leases
Leases are classified as capital or operating leases. Leases which transfer substantially all of the benefits and risks incidental to ownership of property are accounted for as capital leases. All other leases are accounted for as operating leases and the related lease payments are charged to expense as incurred.
Debt and Debt Payments
The City may only incur debt for the purposes of capital expenditures. With the approval of the Provincial Minister of Finance, a borrowing by-law is passed by Council which authorizes borrowing for the capital budget.
Annual payments of principal and interest are budgeted in the City’s operating budget as debt and finance charges.
Consolidation
The annual operating budget adopted by Council provides the spending authorization for each fund, and therefore the current year budget is adopted on a non-consolidated basis. That is, inter-fund transactions have not been eliminated in order to ensure full spending authority is provided. However, each year in the budget document, a consolidated budget is prepared for the current year which eliminates inter-fund transactions. This consolidated budget is then available each year-end to allow comparison and variance reporting to the annual financial statements, also prepared on a consolidated basis (see Appendix 8 Volume 2).
Balanced Operating Budgets
The City of Winnipeg Charter requires that the City adopt a balanced operating budget for the current year (estimated expenditures for a fiscal year do not exceed the estimated revenues for the year). Council policy provides that year-end surplus be transferred to the Financial Stabilization Reserve. Any operating deficits arising in-year must be addressed in the next year’s budget.
1-4 Preliminary 2020 Budget - Overview
As per the Multi-Year Budget Policy, subject to Council approval, the 2020 to 2023 tax supported operating budget is balanced in all four years.
Reserves
Reserves are established by Council, as required for future financial commitments and are operated under the regulations and policies prescribed by provincial legislation or City by-laws as applicable. Budgets are prepared for reserve expenditures and revenues, and transfers to and from reserves are included in the tax-supported, utility, and capital budgets.
Fees and Charges
A Fees and Charges Schedule is published annually in accordance with the Fees and Charges By-Law (196/2008) to identify the current fees and charges administered by the City of Winnipeg and the authority under which they are administered. The Chief Financial Officer is authorized to increase annually any fee imposed by the City by an amount equal to or less than the rate of inflation. New fees or fee increases greater than inflation must be approved by Council unless specifically otherwise delegated. Normally new fees or fee increases greater than inflation would be included as part of the annual budget process (see Appendix 6, Volume 2).
Long-Term Capital Forecasting
Asset Management Policy F1-001 (adopted by Council on January 28, 2015), states that the Public Service will implement a comprehensive approach to managing the City’s assets, to meet established levels of service at the lowest overall cost of ownership, at an acceptable level of risk. Winnipeg’s City Asset Management Plan (CAMP) and the State of the Infrastructure Report (SOIR) were released in 2018. The CAMP summarizes the inventory, overall replacement value, age and condition of the City’s major asset groups. It also outlines the funding deficit and strategies associated with meeting assumed levels of service for existing and new infrastructure. In addition, this report serves as an action plan for continual improvement initiatives across the entire organization. Winnipeg’s CAMP and the annual capital budget process are the tools to implement the city’s long-term capital planning process.
Preliminary 2020 Budget - Overview 1-5

City of Winnipeg Fund Structure
General Revenue
•Police Service •Public Works •Fire Paramedic Service
•Community Services
•Planning, Property and Development
•Waste and Waste - Solid Waste Collection
•Street Lighting• Innovation, Transformation and Technology
•Human Resource Services
•Customer Service and Communications
•Assessment and Taxation
•Corporate Finance
•Legal Services•Chief Administrative Office
•Council•Mayor’s Office•Audit•City Clerks•Office of Policy and Strategic Initiatives
•Museums
General Capital
•Same departments as the General Revenue Fund
Utilities
•Transit •Waterworks •Sewage Disposal •Solid Waste Disposal
•Municipal Accommodations
•Land Drainage and Flood Control
Special Operating Agencies
•Animal Services •Golf Services •Fleet Management
•Parking Authority
Reserves
•Examples:•Destination Marketing
•Environmental Projects
•Financial Stabilization
•Local Street Renewal
•Regional Street Renewal
•Southwest Rapid Transitway(Stage 2) & Pembina Highway Underpass
•Water Main Renewal
1-6 Preliminary 2020 Budget - Overview

Budget Process
Departments report and analyze performance measures to assess performance against previous years, other municipalities, targets, and citizen satisfaction.
The results of this process as well as economic and demographic trends are published in budget Volume 1 Community Trends and Performance Report.
An annual citizen survey is also undertaken.
Each year, the Chief Financial Officer issues the Budget Call Letter, launching the annual budget process.
The operating budget submission has been typically comprised of three years; the budget year and two projection years. The capital budget submission is comprised of six years; the budget year and a five year capital forecast.
The 2020 Budget Call Letter requested four years of operating budget information; the budget year and three projection years.
The previous year’s adopted budget, adjusted to reflect recent City Council approvals and any new developments, forms the starting point for budget development.
Budgets are updated by the departments and submitted for administrative review and corporate compilation.
The Executive Policy Committee has responsibility for budget development.
Based on targets given by Executive Policy Committee, departments presented cost reduction options to the applicable Committee of Council for their review.
Allowed citizens to provide in person and online feedback to the Committees. The Committees then had opportunity to forward their own recommendations to Budget Working Group, if any.
The Preliminary Operating and Capital Budgets are tabled at a meeting of Executive Policy Committee.
PublicConsultationApril toMay
2019
BudgetDevelopmentMay 2019 toFebruary 2020
TablePreliminaryBudgets
March 6, 2020
PerformanceMeasurementApril to July
2019
CallLetter
May 2019
Multi yearBalancedBudget
October toDecember 2019
Preliminary 2020 Budget - Overview 1-7

The Executive Policy Committee refers the preliminary operating and capitalbudget to the City’s Standing Policy Committees for review andrecommendations. Each Committee reviews the part of the budget related to itsjurisdiction:
– Infrastructure Renewal and Public Works,
– Water and Waste, Riverbank Management and the Environment,
– Property and Development, Heritage and Downtown Development,
– Protection, Community Services and Parks,
– Innovation and Economic Development, and
– The Winnipeg Police Board.
The Committees hear presentations by departments. Members of the public andinterest groups may also make presentations at these meetings.
The Executive Policy Committee provides for delegations from the public andreviews the recommendations from the Standing Policy Committees.Recommendations are finalized by the Executive Policy Committee andforwarded to Council.
Council debates, amends, and adopts the operating and capital budget forwardedfrom the Executive Policy Committee.
Council then passes a by-law to set the mill rate for the operating tax-supportedbudget.
Council also gives first reading of a borrowing by-law to externally finance thecapital program, if required. In accordance with legislation, approval of theborrowing is then requested of the Provincial Minister of Finance. Onceauthorization is received from the Minister, Council gives second and thirdreadings of the by-law before it is passed.
Council must adopt the operating budget no later than March 31 each year, andthe capital budget and five-year forecast by December 31 each year, as requiredby “The City of Winnipeg Charter”.
Budget Amendments
Operating Budget Amendment Process
From time to time during the year, it may be necessary to amend the operating budget to accommodate new or existing programming. New programming must be approved by Council. The Standing Policy Committee on Finance is the body authorized to approve the addition of budgeted amounts to existing programming. The Public Service has some authority.
Capital Budget Amendment Process
From time to time during the year, it may be necessary to amend the capital budget. Any new capital project, whether funded by surpluses from other projects or by new funding, must be approved by Council. Any required additional borrowing authority must be approved by the Minister of Finance of the Province of Manitoba and enacted through a by-law of Council.
CommitteeReview
March 2020
CouncilApproval
March 25, 2020
1-8 Preliminary 2020 Budget - Overview

Standing Policy Committee of Finance may approve transfers of budgets between existing capital projects. If the transfer is smaller than $100,000 or 25% of the budget being increased (whichever is the lesser), the transfer can be approved by the Chief Financial Officer.
For more information, refer to the Multi-Year Budget Policy (Volume 2 – attachment to the budget recommendations).
Preliminary 2020 Budget - Overview 1-9

1-10 Preliminary 2020 Budget - Overview

Corporate Finance | City of Winnipeg 1
a
2020 – 2023 PRELIMINARYOPERATING AND CAPITAL BUDGET
City of Winnipeg March 6, 2020
Prelim
inary 2020 Budget - O
verview1-11

Corporate Finance | City of Winnipeg 2
• Budget Context• Budget Consultation – Public Engagement• Multi-Year Balanced Budget
• Key Goals and Priorities• Transformative Service Delivery• Operating and Capital Budgets• Budget Highlights
• Debt Strategy and Net Debt per Capita• Budget Outlook• Schedule of Budget Review Meetings
Agenda1-12P
reliminary 2020 B
udget - Overview

Corporate Finance | City of Winnipeg 3
• Multi-year Budget Goal:
• Budget Process
• Starting tax supported deficit: $89.6 million in 2020, up to $174.9 million by 2023
• EPC Recommended Targets to Balance
• Multi-year budget policy including annual budget review / update
Budget ContextPrelim
inary 2020 Budget - O
verview1-13

Corporate Finance | City of Winnipeg 4
Multi-year Budget Public Feedback
Information posted online
Department presentations
Written comments online
In-person delegations at
committee meetings
Feedback provided directly
to elected officials
21COMMITTEEMEETINGS
20DEPARTMENTALPRESENTATIONS
159 IN-PERSON
DELEGATIONS
37,993WEBSITE
VISITS
215SOCIAL MEDIA
REACTIONS
447 WRITTEN
SUBMISSIONS
1-14P
reliminary 2020 B
udget - Overview

Corporate Finance | City of Winnipeg 5
Multi-year Budget Public FeedbackPrelim
inary 2020 Budget - O
verview1-15

Corporate Finance | City of Winnipeg 6
1-16P
reliminary 2020 B
udget - Overview
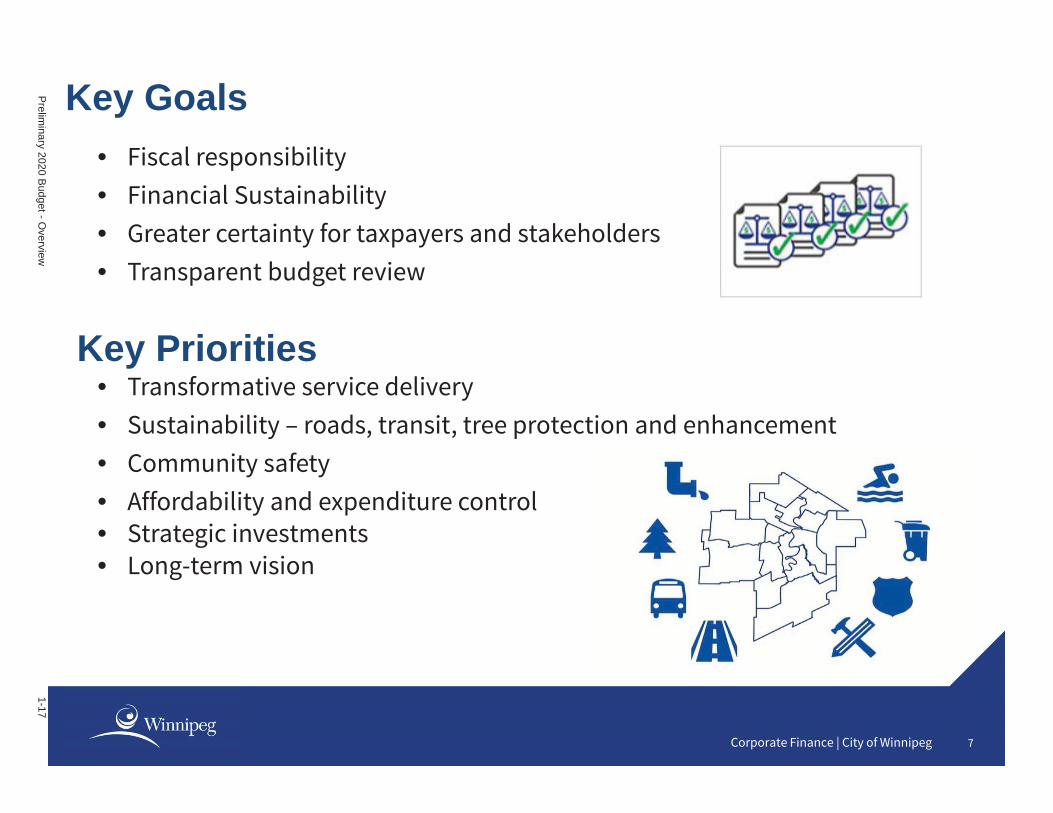
Corporate Finance | City of Winnipeg 7
• Fiscal responsibility• Financial Sustainability• Greater certainty for taxpayers and stakeholders• Transparent budget review
• Transformative service delivery• Sustainability – roads, transit, tree protection and enhancement• Community safety• Affordability and expenditure control• Strategic investments • Long-term vision
Key Goals
Key Priorities
Prelim
inary 2020 Budget - O
verview1-17

Corporate Finance | City of Winnipeg 8
“This multi-year balanced budget process provides an opportunity to develop a transformative budget that creates a sustainable financial plan to meet thedynamic needs of a growing city.”
Quote from Councillor Scott Gillingham, Chair of Standing Policy Committee of Finance
• Transformative fund – Sources of funds:
• Sale of certain assets deemed surplus
Transformative Service Delivery
• Re-purpose golf lands– Golf Lands Repurposing Review - $200,000 investment– Options: public green space, active transportation,
reforestation, community gardens, residential development, recreational opportunities
1-18P
reliminary 2020 B
udget - Overview

Corporate Finance | City of Winnipeg 9
• Sale of (or enter into a joint venture) John Blumberg golf course
• Rationalize owned and leased buildings– Buildings leased to third parties – Terry Sawchuk arenaNote: sale of administrative buildings – Land Operating Reserve
• Reduction in fleet inventory and assets
Transformative Service Delivery Prelim
inary 2020 Budget - O
verview1-19

Corporate Finance | City of Winnipeg 10
– Reinvestment:• Recreation, public green space, protect tree canopy
• Wading pool rationalization and spray pad reinvestment strategy• Portion re-invested within the area in which the funds were generated
• Collaboration of Public Service with Police Service and Police Board – options for a multi-year funding formula for police service
• Transformative Fund (policy, implementation plan) to be approved by Council in fall of 2020
Transformative Service Delivery 1-20P
reliminary 2020 B
udget - Overview

Corporate Finance | City of Winnipeg 11
Starting shortfall $ 542.9 $ 542.9 $ 542.9
Less Adjustments:
Operating expenditures $ 144.2 $ 146.9 $ 118.1
Cash to Capital 186.5 180.9 177.1
Corporate Efficiencies 145.0 145.0 142.3
Police pension savings 16.5
Refined budget estimates 20.2
Grant reductions 3.3
Other and administrative
adjustments *
67.2 67.2 65.4
Total Adjustments $ 542.9 $ 540.0 $ 542.9
$ (0.0) $ 2.9 $
PreliminaryBudgetOptions
Total 4 yearIn Millions of $ Targets
* Other and administrative adjustments include Council decisions for YMCA grant due to inclusion in the ICIP report and salary adjustments from collective agreement and other corporate adjustments.
Balancing the 4-year tax supported budget
Prelim
inary 2020 Budget - O
verview1-21

Corporate Finance | City of Winnipeg 12
2019 Budget
2020 Preliminary
Budget
2021Budget
Projection
2022Budget
Projection
2023 Budget
Projection
Tax Supported Operations 1,125.0 1,144.5 1,158.9 1,196.5 1,245.5
Utilities Operations 652.6 661.0 688.6 708.6 732.1
Special Operating Agencies 81.3 81.4 81.2 80.9 81.9
Total Revenue 1,858.9 1,886.9 1,928.7 1,986.0 2,059.5
Tax Supported Operations 1,125.0 1,144.5 1,158.9 1,196.5 1,245.5
Utilities Operations 685.2 618.2 647.5 666.0 688.3
Special Operating Agencies 89.3 85.4 79.9 79.9 80.4
Total Expenditures 1,899.5 1,848.1 1,886.3 1,942.4 2,014.2
Surplus / (Deficit) (40.6) 38.8 42.4 43.6 45.3
Operating Budget at a Glance(in millions of $)
Revenue
Expenditures
Operating Budget Summary1-22P
reliminary 2020 B
udget - Overview

Corporate Finance | City of Winnipeg 13
2019 Capital Budget and 5-year Forecast $2.306 billion
Tax Supported $ 186.4 $ 206.0 $ 969.2 $ 1,175.2
Utilities 158.0 147.0 729.5 876.5
Special Operating Agencies 23.4 16.6 84.0 100.6
TOTAL $ 367.8 $ 369.6 $1,782.7 $ 2,152.3
2019AdoptedBudget
2020PreliminaryBudget
2021 to2025
Forecast
6 yearTotalIn Millions of $
Capital Budget SummaryPrelim
inary 2020 Budget - O
verview1-23

Corporate Finance | City of Winnipeg 14
Property and Business Taxes• Combined 2.33% property tax increase
– 2% property tax increase dedicated to capital (1% to each of Regional Street and Bridges, and Local Street Renewal Programs)
– 0.33% property tax increase dedicated for future payments for the Southwest Rapid Transitway (Stage 2)
– 2.33% tax increase per year from 2020 to 2023
Property taxes revenue (in millions)
2020 $634.6
2021 $658.5
2022 $680.7
2023 $705.1
Revenue Highlights1-24P
reliminary 2020 B
udget - Overview

Corporate Finance | City of Winnipeg 15
Property and Business Taxes
• Business Tax rate reduced from 4.97% to 4.84%
– Full rebate of municipal business taxes for businesses that have a rental value of $35,700 or less in 2020 ($33,900 in 2019)
– Impacts 47% of all businesses
– Approximately 5,710 businesses will benefit
– Business tax revenue $57.9 million from 2020 to 2023 ($56.9 million in 2019)
Revenue HighlightsPrelim
inary 2020 Budget - O
verview1-25
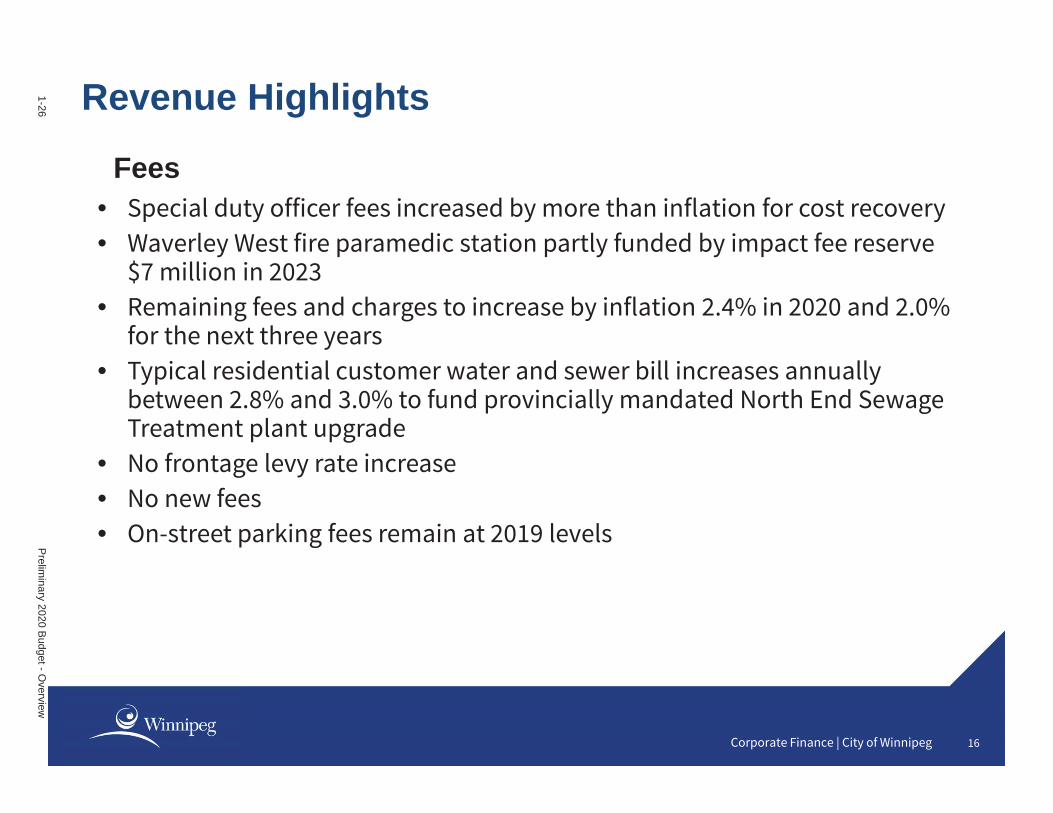
Corporate Finance | City of Winnipeg 16
Revenue Highlights
Fees• Special duty officer fees increased by more than inflation for cost recovery• Waverley West fire paramedic station partly funded by impact fee reserve
$7 million in 2023• Remaining fees and charges to increase by inflation 2.4% in 2020 and 2.0%
for the next three years• Typical residential customer water and sewer bill increases annually
between 2.8% and 3.0% to fund provincially mandated North End Sewage Treatment plant upgrade
• No frontage levy rate increase • No new fees• On-street parking fees remain at 2019 levels
1-26P
reliminary 2020 B
udget - Overview

Corporate Finance | City of Winnipeg 17
Provincial Funding
• Provincial operating and public safety grants at $147 million*
– Consistent with 2019 funding levels
• Provincial capital funding
– 2020/2021 – strategic infrastructure basket funding $75.0 million*
– 2019/2020 - $113.1 million
• Additional funding related to Investing in Canada Infrastructure Program:
» North End Sewage Treatment Plant (NEWPCC) $21.8 million bringing total funding to $56.2 million ($21.8 million + previous funding of $34.4 million)
» St. James Civic Centre renovation and expansion -$3.9 million)
* Amount to be confirmed from the Province’s annual budget
Revenue HighlightsPrelim
inary 2020 Budget - O
verview1-27

Corporate Finance | City of Winnipeg 18
Transfers to General Revenue Fund
Financial Stabilization Reserve $ 10.3 $ 17.0 $ $ $
Other Reserves 9.0 6.8 1.8 1.8 1.8
Other Funds 11.6 11.0 9.7 9.9 10.1
TOTAL $ 30.9 $ 34.8 $ 11.5 $ 11.7 $ 11.9
In millions of $ 20232019 2020 2021 2022
Revenue Highlights1-28P
reliminary 2020 B
udget - Overview

Corporate Finance | City of Winnipeg 19
$3,943$3,805
$3,006$2,805$2,743$2,699
$2,586
$2,256$2,081$2,000$1,967
$1,774
$0
$500
$1,000
$1,500
$2,000
$2,500
$3,000
$3,500
$4,000
$4,500
OttawaHamiltonTorontoVictoriaVancouverQuébecEdmontonReginaSaskatoonCalgaryHalifaxWinnipeg
Source: Cities Assessment and Taxation Websites and various other media sources
2019 Municipal Property Tax Comparison for Average Home
Prelim
inary 2020 Budget - O
verview1-29

Corporate Finance | City of Winnipeg 20
City 2016 2017 2018 2019 2020 Compounded Increase since 1998
Vancouver 2.30% 3.90% 4.24% 4.90% 7.00% 117%
Edmonton 3.40% 2.90% 3.20% 3.30% 2.08% 148%
Calgary 3.50% 0.00% 3.80% 3.45% 7.51% 144%
Saskatoon 3.96% 2.55% 3.79% 4.40% 3.70% 130%
Regina 3.30% 6.49% 4.34% 4.33% 3.25% 101%
Winnipeg 2.33% 2.33% 2.33% 2.33% 2.33% 20%
Source: Cities’ websites and news outlets, City of Winnipeg Economic Research Calculations
Residential Property Tax Changes in Western Canadian Cities
1-30P
reliminary 2020 B
udget - Overview

Corporate Finance | City of Winnipeg 21
Source: Cities’ websites and news outlets, City of Winnipeg Economic Research Calculations
City Municipal Property Tax Increase in 2020
Dollar Increase on Avg. Municipal Property Tax
Bill in 2020
Dollar Impact on Avg. Municipal Property Tax
Bill per 1% Increase
Vancouver 7.00% $183 $26.14
Edmonton 2.08% $51 $24.52
Calgary 7.51% $150 $19.97
Saskatoon 3.70% $70 $18.88
Regina 3.25% $67 $20.68
Winnipeg 2.33% $41 $17.73
Residential Property Tax Changes in Western Canadian Cities
Prelim
inary 2020 Budget - O
verview1-31

Corporate Finance | City of Winnipeg 22
2019 2020 Change
Municipal property taxes(excludes school taxes)
$1,774 $ 1,815 $ 41.31 2.33%
Average Home Assessed at $313,590 in 20201-32P
reliminary 2020 B
udget - Overview

Corporate Finance | City of Winnipeg 23
Municipal Property Tax Total for Average Homeowner: $1,815
annually in 2020
Source: City of Winnipeg Economic Research
How the Average Annual Municipal Property Tax Bill is Spent on Tax-Supported Services in 2020
Police Service$57031%
Community Services, Recreation & Parks
$33819%
Roads, Snow Removal, Solid Waste Collection & Insect
Control$31717%
Fire Paramedic Service$29116%
Other$1579%
Transit Subsidy$1428%
Community Services, Recreation & Parks includes the following services: Assiniboine Park Conservancy, City Beautification, Community Liveability, Golf Services, Libraries, Parks and Urban Forestry, Recreation, and Arts, Entertainment, and Culture. Other includes the following services: 311 Contact Centre, Animal Services, Assessment and Taxation, Cemeteries, City Planning, Inspection, and Housing, Council Services, Economic Development, Innovation, Organizational Support Service, and Property Asset Management.
Prelim
inary 2020 Budget - O
verview1-33

Corporate Finance | City of Winnipeg 24
REVENUEProperty Taxes $ 607.7 $ 634.6 $ 26.9 Business Taxes 56.9 57.9 1.0
Other 460.4 452.0 (8.4)
TOTAL REVENUE 1,125.0 1,144.5 19.5
OPERATING EXPENDITURESDepartmental 922.1 931.4 9.3
Corporate 78.8 70.4 (8.4)
TOTAL OPERATING EXPENDITURES 1,000.9 1,001.8 0.9
Capital related expenditures 124.1 142.7 18.6
TOTAL EXPENDITURES 1,125.0 1,144.5 19.5
SURPLUS / (SHORTFALL) $ - $ - $ -
Year Over Year % Increase on Operating Expenditures 0.1%
4Year Average % Increase on Operating Expenditures 1.5%
2020PreliminaryBudget
In Millions of $ 2019Budget
Increase /(Decrease)
4-year Average Increase in Total Expenditures 2.6%
2021 to 2023 Annual Budget ~$1.2 billion
Tax Supported Operating Budget1-34P
reliminary 2020 B
udget - Overview

Corporate Finance | City of Winnipeg 25
In Millions of $
Tax Supported Expenditure HighlightsPrelim
inary 2020 Budget - O
verview1-35

Corporate Finance | City of Winnipeg 26
* Sewage Disposalincludes $70 million one-time transfer to theEnvironmental ProjectsReserve in 2019.
Utilities and SOAs Expenditure Highlights
In Millions of $
1-36P
reliminary 2020 B
udget - Overview

27
2019 Adopted Budget 2020 Budget
Increase / (Decrease) 2021 2022 2023
Full Time Equivalents(number of FTEs)
9,129 9,139 10 9,121 9,107 9,091
Salaries & Benefits (in millions of $)
883.8$ 899.8$ 16.0$ 916.8$ 935.3$ 955.4$
Vacancy Management included in Salaries & Benefits (in millions of $)
(18.4)$ (18.8)$ (0.4)$ (19.7)$ (20.4)$ (20.9)$
FTE Reductions by 2023 In Comparison to 2019 Budgeted FTEs
2023
Vacant Positions (17)
Filled Positions (21)
Total FTE reductions (38)
2020 - 2023 Preliminary Operating Budget
Salary Budget and Full Time Equivalents (FTEs) / Vacancy Management
Prelim
inary 2020 Budget - O
verview1-37

Corporate Finance | City of Winnipeg 28
• Vacancy management budgeted at $18.8 million in comparison to $18.4 million in 2019
• 2020 vacancy management budget - 2% of city-wide salaries and benefits ($899.8 million)
Tax s upported, Transit and M unicipal A ccommodations
$ 13.9 $ 13.7 $ 13.9 $ 14.1 $ 14.5
W ater and W aste 4.2 4.1 4.1 4.2 4.2 S O A s 0.3 1.0 1.7 2.1 2.2
T OT A L $ 18.4 $ 18.8 $ 19.7 $ 20.4 $ 20.9
In Millions of $20232019 2020 2021 2022
Expenditure Highlights1-38P
reliminary 2020 B
udget - Overview

Corporate Finance | City of Winnipeg 29
• Increased efficiency savings from $14.6 million in 2019 to $16.5 million in 2020
• 4-year efficiency savings $144.2 million
C orporate E fficiencies $ 12.2 $ 15.2 $39.7 $ 42.2 $42.0
Police S ervice 1.0 1.0 1.0 1.0 1.0
O ther departments 1.4 0.3 0.3 0.3 0.2
TOTA L $ 14.6 $ 16.5 $41.0 $ 43.5 $43.2
In M illions of $ 2023 2019
A doptedBudget
2020 Budget 2021 2022
Expenditure HighlightsPrelim
inary 2020 Budget - O
verview1-39

Corporate Finance | City of Winnipeg 30
• The City is challenged by aging infrastructure and the infrastructure deficit• Federal funding $79.8 million in 2020, 6-year total $393.8 million• Provincial funding for 2020 $16.5 million, 6-year total $86.6 million
• Amounts to be confirmed from the Province’s annual budget• 6-year borrowing:
E xternal D ebt $ 38.2 $ 56.3 $ 77.4 $ 133.7
Internal F inancing 34.9 1.4 3.0 4.4
F leet Borrowing 22.3 15.2 78.3 93.5
TOTA L $ 95.4 $ 72.9 $ 158.7 $ 231.6
2019 A dopted
B udget
2020 Preliminary
B udget
2021 to 2025
Forecas t
6-year Total Debt
FundingIn Millions of $
Capital Budget Highlights1-40P
reliminary 2020 B
udget - Overview
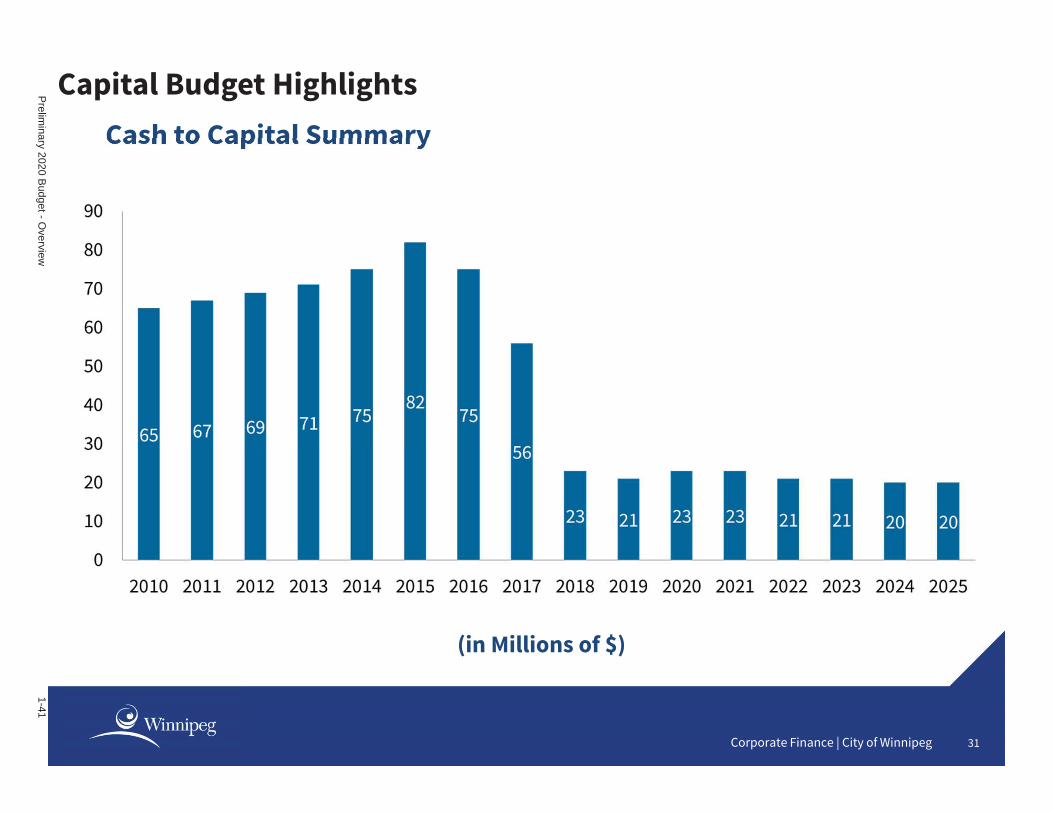
Corporate Finance | City of Winnipeg 31
Cash to Capital Summary
(in Millions of $)
Capital Budget HighlightsPrelim
inary 2020 Budget - O
verview1-41

Corporate Finance | City of Winnipeg 32
1-42P
reliminary 2020 B
udget - Overview

Corporate Finance | City of Winnipeg 33
Safety and Security
Winnipeg Police Service• 2020 Operating expenditures $294.6 million, 1.8% over 2019• 2020 Total expenditures $304.1 million, 0.9% over 2019• 4-year average 2% on operating net of capital expenditures• 6-year capital program $20.8 million
Winnipeg Fire Paramedic Service• 2020 Operating expenditures $205.5 million, 3.0% over 2019• 2020 Total expenditures $209.0 million, 3.7% over 2019• 4-year average 2% on operating net of capital expenditures• 6-year capital program $46.6 million
Public Safety comprises 45% of total tax supported operating budget
A City That WorksPrelim
inary 2020 Budget - O
verview1-43

Corporate Finance | City of Winnipeg 34
Public Works• 2020 Operating expenditures $151.9 million, (0.1%) over
2019• 2020 Total expenditures $259.2 million, 5.9% over 2019• 4-year average 0.7% on operating net of capital
expenditures• 6-year capital budget $1.0 billion
Transit• 2020 Operating expenditures $184.0 million, 1.0% over 2019• 2020 Total expenditures $206.0 million, 0.9% over 2019• 4-year average 2.5% on operating net of capital
expenditures• 6-year capital budget $166.8 million
A Sustainable City, Sustainable TransportationA City That Works1-44
Prelim
inary 2020 Budget - O
verview

Corporate Finance | City of Winnipeg 35
Continued Dedicated Funding Plan for Street Renewal
• 2% property tax increase funds reserves dedicated to the renewal of regional and local streets, back lanes, sidewalks and bridge renewals in the capital program
• Continuation of tri-level government funding for regional roads• $20 million external debt in 2020, to be repaid by the local street renewal reserve
6 – Year Program2020 130.3 Million
2021 151.0 Million
2022 161.4 Million
2023 136.0 Million
2024 124.1 Million
2025 144.1 Million
Total $ 846.9 Million
A City That Works, A Sustainable CityPrelim
inary 2020 Budget - O
verview1-45
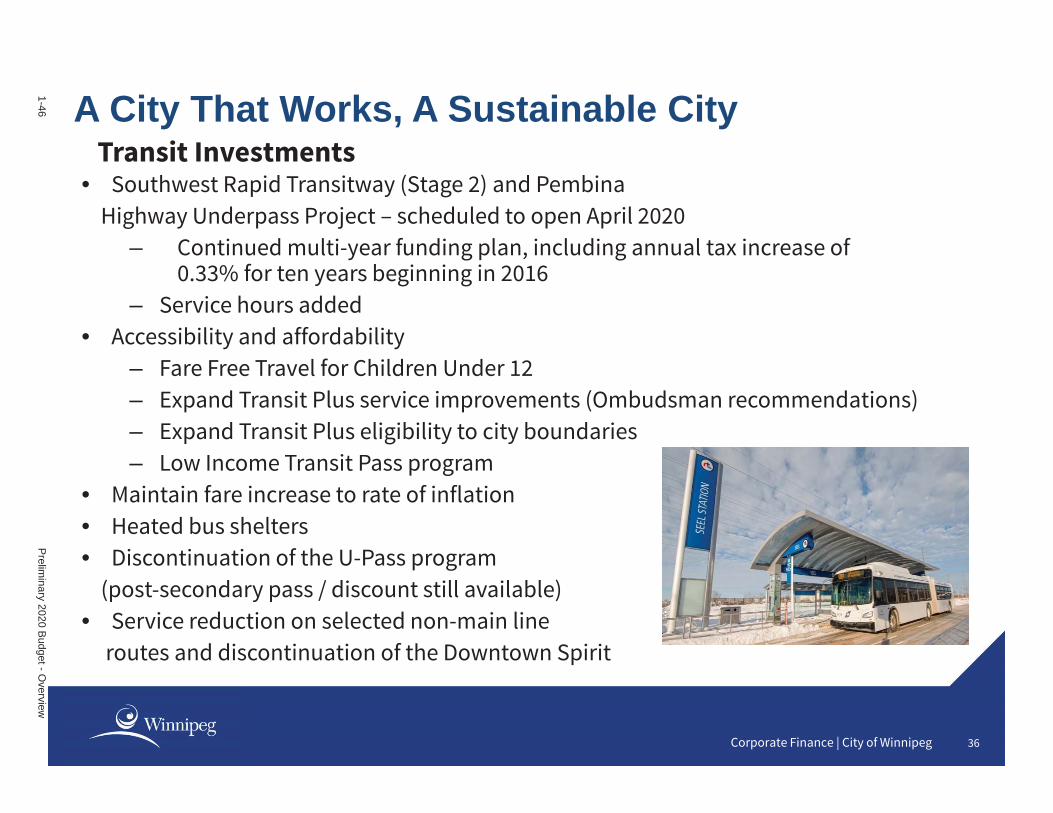
Corporate Finance | City of Winnipeg 36
Transit Investments• Southwest Rapid Transitway (Stage 2) and Pembina
Highway Underpass Project – scheduled to open April 2020– Continued multi-year funding plan, including annual tax increase of
0.33% for ten years beginning in 2016– Service hours added
• Accessibility and affordability– Fare Free Travel for Children Under 12– Expand Transit Plus service improvements (Ombudsman recommendations)– Expand Transit Plus eligibility to city boundaries – Low Income Transit Pass program
• Maintain fare increase to rate of inflation• Heated bus shelters• Discontinuation of the U-Pass program
(post-secondary pass / discount still available)• Service reduction on selected non-main line
routes and discontinuation of the Downtown Spirit
A City That Works, A Sustainable City
1-46P
reliminary 2020 B
udget - Overview

Corporate Finance | City of Winnipeg 37
(all funds)
• Operating expenditures $304.1 million, (19.0%) over 2019 • Total expenditures $363.3 million, (15.8%) over 2019*• 4-year average (2.3%) on operating net of capital
expenditures and dividend• 6-year capital budget $695.5 million
Sustainable Water and Waste
* Sewage Disposal includes $70 million one-time transfer to the Environmental Projects Reserve in 2019.
A City That WorksPrelim
inary 2020 Budget - O
verview1-47

Corporate Finance | City of Winnipeg 38
Community Services• Operating expenditures $106.8 million, 1.6% over 2019
• Total expenditures $114.9 million, 0.7% over 2019
• 4 year average 1.3% on operating net of capitalexpenditures
• 6 year capital program $45.7 million
Planning, Property and Development (includesMunicipal Accommodations)
• Operating expenditures $108.8 million, 1.4% over 2019
• Total expenditures $118.2 million, 1.4% over 2019
• 4 year average 0.7% on operating net of capitalexpenditures
• 6 year capital program $25.7 million
A Sustainable Winnipeg1-48P
reliminary 2020 B
udget - Overview

Corporate Finance | City of Winnipeg 39
Innovation, Transformation and Technology (INV)
• 2020 Operating expenditures $22.4 million, 1.4% over 2019
• 2020 Total expenditures $28.1 million, 11.9% over 2019
• 4-year average (1.9)% on operating net of capital expenditures
• 6-year capital budget $24.7 million
A City That Works
INV Programs
• Innovation Strategy Program (self funded)• Smart Cities Innovation Program (self funded)• Enterprise Content Management (self funded)• Security Program Enhancements• Technology Renewal
Prelim
inary 2020 Budget - O
verview1-49

Corporate Finance | City of Winnipeg 40
• Fire Paramedic Stations– Consolidate St. Boniface and Windsor Park stations - $13.4 million– New Waverley West station - $12.1 million
• One-time gas tax top up of $20 million allocated to other capital programs
• Community Safety– Community Safety and Crime Prevention program - $300,000 from
2020 to 2022– Phase 2 of the Downtown Public Safety Strategy - $1.0 million over 4
years (operating budget $673,000 primarily funded by DestinationMarketing Reserve plus $336,000 in capital investments)
– 24/7 safe spaces - $1 million over four years
Strategic Investments 1-50P
reliminary 2020 B
udget - Overview

Corporate Finance | City of Winnipeg 41
• Operating and capital support to Assiniboine Park Conservancy– $11.3 million in 2020 operating grant, 4-year total $46.8 million– $4.6 million in 2020 for ongoing infrastructure renewal, 6-year
investment $14.6 million• Grant reductions
– 10% in 2020 excluding multi-year agreements and community partnerships
– Further reductions in 2021 to 2023 – City can enter into 2020 – 2023 grant agreements subject to annual
budget approval• Reduce incidence of combined sewer overflows• Source Separated Organics – pilot project• Urban Forest Enhancement Program, includes Reforestation
– $12.5 million in 2020, 4-year operating total $51.7 million– $6.5 million in 2020, 6-year capital investment $30.8 million
• City share for Rainbow Stage capital improvement $3 million
Strategic Investments Prelim
inary 2020 Budget - O
verview1-51

Corporate Finance | City of Winnipeg 42
Stabilization 107.8 111.8
Capital 245.0 250.3
Special Purpose 88.6 82.8
TOTAL $ 441.4 $444.9
2019ForecastBalance
2020BalanceInMillions of $
Reserves
1-52P
reliminary 2020 B
udget - Overview

Corporate Finance | City of Winnipeg 43
• To proactively set debt limits• To establish a prudent level of debt to support the City’s capital
infrastructure program• To maintain an appropriate credit rating• Continued long-term financial flexibility and sustainability
Purpose
ForecastedDebt Metrics Maximum Peak
Debt as a % of revenueCity 90.0% 77.2%Tax-supported and other funds 80.0% 63.3%Utilities and other 220.0% 141.7%
Debt-servicing as a % of revenueCity 11.0% 7.0%Tax-supported and other funds 10.0% 5.5%Utilities and other 20.0% 10.3%
Debt per capitaCity $2,800 $2,292Tax-supported and other funds $1,500 $1,124Utilities and other $1,500 $1,367
Note: "City" includes "Tax-supported and other funds", "Utilities and Other" and consolidated entities. "Tax-supported and other funds" includes Municipal Accommodations and Gleet Management. "Utilities and Other" includes Transit System, Waterworks System, Sewage Disposal System and Solid Waste Disposal. "Forecasted Peak" does not account for the implications of consolidated accounting entries.
As AtDecember 31, 2018
55.0%52.4%48.4%
5.1%5.1%4.5%
$1,398$878$408
Debt StrategyPrelim
inary 2020 Budget - O
verview1-53

Corporate Finance | City of Winnipeg 44
Standard and Poor’s – AA/Stable/since January 2003 (Reaffirmed November 2019)
• Standard and Poor’s (S&P) affirmed Winnipeg’s AA (Stable) credit rating based on:
– A strong and stable economy– Strong financial management– Management team that is experienced and qualified to effectively enact
fiscal policies, as well as effectively respond to external risks– Management’s debt and liquidity management policies are prudent – City management has been proactive in developing capital asset tools and
metrics
S&P noted in the report “We believe Winnipeg's growing anddiversified economy and expected high operating balances should support the planned debt issuance while the city's strong liquidity balances will provide bondholders with additional support.”
Debt Strategy - Credit Rating1-54P
reliminary 2020 B
udget - Overview
Corporate Finance | City of Winnipeg 45
Moody – Aa2 Stable• In July 2019, Moody’s affirmed the City of Winnipeg credit rating at Aa2-stableMoody’s noted in the report “The credit profile is constrained by Winnipeg's debt burden, which we expect to peak at around 80-85% of operating revenue over the next 3 years as the city continues to invest in significant capital projects and infrastructure. Nevertheless, debt affordability remains strong.”
The City’s credit rating has benefited from:
Debt Strategy - Credit Rating
– Disciplined fiscal planning and ability to post operating surpluses despite funding pressures
– Economic diversity providing buffer against volatility in economic cycles– Strong governance and management structure and mature institutional
framework
Preliminary 2020 Budget - O
verview1-55
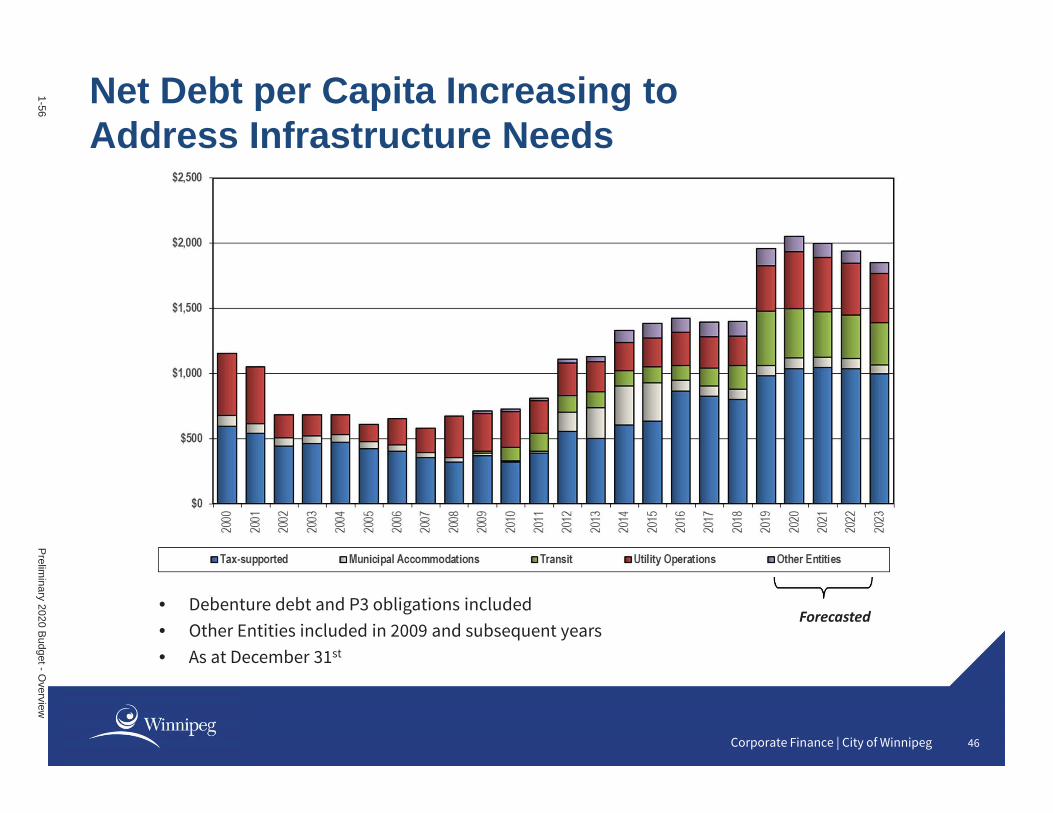
Corporate Finance | City of Winnipeg 46
• Debenture debt and P3 obligations included• Other Entities included in 2009 and subsequent years• As at December 31st
Forecasted
Net Debt per Capita Increasing to Address Infrastructure Needs
1-56P
reliminary 2020 B
udget - Overview

Corporate Finance | City of Winnipeg 47
Prelim
inary 2020 Budget - O
verview1-57

Corporate Finance | City of Winnipeg 48
• 4-year balanced operating budget (2020 to 2023) and 6-year capitalprogram
• Next steps:– Annual budget review and update– Corporate business and strategic plans to be forwarded for Council
approval– New multi year budget cycle 2024 to 2027 with balanced operating
and capital budgets
Multi-year Balanced Budget 1-58P
reliminary 2020 B
udget - Overview

Corporate Finance | City of Winnipeg 49
$750
$850
$950
$1,050
$1,150
$1,250
$1,350
$1,450
$1,550
2008 2009 2010 2011 2012 2013 2014 2015 2016 2017 2018 2019 2020 2021 2022 2023 2024 2025 2026 2027 2028 2029 2030
Tax S
uppo
rted
Ope
ratin
g Bu
dget
Mill
ions
Budget Year
Adopted Budget Expenditure Forecast - EPC Targets in Perpetuity Revenue Forecast
Assumptions- Cash to Capital: $20 million annually- Does not include unfunded capital projects $21 Million deficit
starting in 2024
$19 Million deficit by 2030
EPC Operating Budget Targets maintained for next 10 years
Budget OutlookTax-Supported Operating Budget Forecast - EPC Targets maintained until 2030
Prelim
inary 2020 Budget - O
verview1-59

Corporate Finance | City of Winnipeg 50
$750
$850
$950
$1,050
$1,150
$1,250
$1,350
$1,450
$1,550
2008 2009 2010 2011 2012 2013 2014 2015 2016 2017 2018 2019 2020 2021 2022 2023 2024 2025 2026 2027 2028 2029 2030
Tax S
uppo
rted
Ope
ratin
g Bu
dget
Mill
ions
Budget Year
Adopted Budget Expenditure Forecast - Historical Averages Revenue Forecast
Assumptions- Cash to Capital: $20 million annually- Does not include unfunded capital projects
$30 Million deficit starting in 2024 $92 Million deficit by
2030
EPC Operating Budget Targets maintained for 4
years to 2023
Historical average growth rates resume in 2024
Budget OutlookTax-Supported Operating Budget Forecast – Historical Average Growth Rates Resume in 2024
1-60P
reliminary 2020 B
udget - Overview

Corporate Finance | City of Winnipeg 51
• Reliance on non-recurring one-time revenues and deferral of spending and maintenance costs is non-sustainable
Budget Outlook
• Monitoring Liquidity– Actively monitored and projected to maintain financial sustainability and
the City’s credit rating
• Operating and Capital Budgets – New long-term growth revenue sources will
be required in the future to address the future years operational deficit
– Based on the 2018 State of the Infrastructure Report, Winnipeg’s infrastructure deficit over 10 years was estimated at $6.9 billion
Prelim
inary 2020 Budget - O
verview1-61

Corporate Finance | City of Winnipeg 52
Multi-year Operating and Capital Budget
Date CommitteeFriday, March 6, 2020 Special Executive Policy Committee Meeting to Table Budget
Wednesday, March 11, 2020 Standing Policy Committee on Property and Development, Heritage and DowntownDevelopment (Special Meeting)
Thursday, March 12, 2020 Standing Policy Committee on Infrastructure Renewal and Public Works (Special Meeting)
Friday, March 13, 2020 Standing Policy Committee on Protection, Community Services and Parks (Special Meeting)
Friday, March 13, 2020 Winnipeg Police Board (Special Meeting)
Monday, March 16, 2020 Standing Policy Committee on Innovation and Economic Development (Special Meeting)
Wednesday, March 18, 2020 Standing Policy Committee on Water and Waste, Riverbank Management and the Environment(Special Meeting)
Thursday, March 19, 2020 Executive Policy Committee to hear delegations on Budgets (Special Meeting)
Friday, March 20, 2020 Executive Policy Committee to consider Standing Policy Committee recommendations and tablefinal recommendations (Special Meeting)
Wednesday, March 25, 2020 Special Meeting of Council to consider Budgets
Schedule of Meetings1-62P
reliminary 2020 B
udget - Overview

ServiceRevenue
Investment(Cost) Net FTEs
Infrastructure Renewal and Public Works5 Roadway Construction and Maintenance 68.709 138.405 (69.696) 229 8 Transportation Planning and Traffic Management 2.886 19.340 (16.454) 165
11 Roadway Snow Removal and Ice Control 0.113 35.060 (34.947) 133 14 Public Transit 206.023 206.023 - 1,602
Public Transit - Subsidy - 67.363 (67.363) 17 City Beautification 0.061 17.587 (17.526) 120
Infrastructure Renewal and Public Works 277.792 483.778 (205.986) 2,249 Water and Waste, Riverbank Management and the Environment
21 Water 134.433 120.547 13.886 404 24 Wastewater 196.351 163.341 33.010 409 27 Land Drainage and Flood Control 5.139 6.105 (0.966) 27 30 Solid Waste Collection 1.167 23.542 (22.375) 17 32 Solid Waste Disposal (4) 15.265 13.692 1.573 40 35 Recycling and Waste Diversion (4) 31.595 37.248 (5.653) 81
Water and Waste, Riverbank Management and the Environment
383.950 364.475 19.475 978
Property and Development, Heritage and Downtown Development
39 City Planning 0.001 2.440 (2.439) 20 42 Neighbourhood Revitalization 0.162 1.913 (1.751) 1 45 Development Approvals, Building Permits and Inspections 29.020 20.697 8.323 206 48 Heritage Conservation - 0.466 (0.466) 3 50 Property Asset Management 18.421 12.904 5.517 47 52 Municipal Accommodations 72.407 72.407 - 286 55 Cemeteries 1.780 2.743 (0.963) 24
Property and Development, Heritage and Downtown Development
121.791 113.570 8.221 587
Protection, Community Services and Parks / Winnipeg Police Board
59 Police Response 24.917 248.035 (223.118) 1,554 62 Crime Prevention 1.533 49.526 (47.993) 297 65 Traffic Safety and Enforcement 20.057 19.399 0.658 91 68 Fire and Rescue Response 4.638 136.673 (132.035) 919 71 Fire and Injury Prevention 1.197 6.158 (4.961) 41 74 Medical Response 65.143 65.143 - 411 77 Emergency Management - 1.074 (1.074) 8 79 Recreation 13.808 57.227 (43.419) 378 82 Parks and Urban Forestry 1.692 39.945 (38.253) 311 86 Community Liveability 1.228 8.863 (7.635) 56 89 Libraries 2.972 31.834 (28.862) 273 92 Arts, Entertainment and Culture - 23.965 (23.965) 6 95 Insect Control 4.307 10.431 (6.124) 67
Protection, Community Services and Parks / Winnipeg Police Board
141.492 698.273 (556.781) 4,412
Innovation and Economic Development97 Innovation, Transformation and Technology - 28.099 (28.099) 166
100 Economic Development - 1.183 (1.183) 3 102 Winnipeg Fleet Management Special Operting Agency (SOA) 51.002 49.902 1.100 119 105 Winnipeg Parking Authority Special Operting Agency (SOA) 23.858 28.994 (5.136) 62 108 Golf Services Special Operting Agency (SOA) 3.184 2.719 0.465 24
Golf Services - Subsidy - 0.730 (0.730) 110 Animal Services Special Operting Agency (SOA) 3.387 3.750 (0.363) 27
Animal Control and Care - Subsidy - 0.771 (0.771) Innovation and Economic Development 81.431 116.148 (34.717) 401
Executive Policy Committee113 Organizational Support Services 0.871 26.762 (25.891) 221 117 Assessment, Taxation and Corporate 879.491 26.351 853.140 130 121 Contact Centre - 311 - 4.644 (4.644) 80 123 Council Services 0.096 14.034 (13.938) 79
Executive Policy Committee 880.458 71.791 808.667 510
Total City Services 1,886.914 1,848.035 38.879 9,137
Notes: (1)
(2) Services in black font are included in General Revenue Fund.
(3) Services in coloured font are separate utility / SOA funds.(4) Services included in Solid Waste fund.
Amounts in the financial tables are system generated and rounded to the nearest thousand. Therefore, totals and sub-totals may be impacted.
Services(millions of $)
2020 Budget
2020 Preliminary Operating Budget - All ServicesTax Supported, Utilities and SOAs
Section 2Page #
Preliminary 2020 Budget - Service Based 2-1

Net Revenue / (Cost)
2021 2022 2023Infrastructure Renewal and Public Works
5 Roadway Construction and Maintenance (80.915) (93.210) (105.980) 8 Transportation Planning and Traffic Management (15.568) (15.820) (16.075)
11 Roadway Snow Removal and Ice Control (34.887) (35.160) (35.566) 14 Public Transit - - -
Public Transit - Subsidy (78.669) (85.801) (95.502) 17 City Beautification (17.459) (17.616) (17.831)
Infrastructure Renewal and Public Works (227.498) (247.607) (270.954) Water and Waste, Riverbank Management and the Environment
21 Water 13.937 14.505 15.411 24 Wastewater 28.914 29.056 30.401 27 Land Drainage and Flood Control (0.566) (0.470) (0.473) 30 Solid Waste Collection (23.260) (23.133) (24.087) 32 Solid Waste Disposal (4) 1.726 0.246 0.084 35 Recycling and Waste Diversion (4) (3.559) (1.188) (2.115)
Water and Waste, Riverbank Management and the Environment
17.192 19.016 19.221
Property and Development, Heritage and Downtown Development
39 City Planning (2.252) (2.316) (2.339) 42 Neighbourhood Revitalization (1.754) (1.754) (1.756) 45 Development Approvals, Building Permits and Inspections 8.728 9.365 10.146 48 Heritage Conservation (0.309) (0.317) (0.314) 50 Property Asset Management 1.695 1.984 2.169 52 Municipal Accommodations - - - 55 Cemeteries (0.933) (0.693) (0.688)
Property and Development, Heritage and Downtown Development
5.175 6.269 7.218
Protection, Community Services and Parks / Winnipeg Police Board
59 Police Response (231.110) (234.163) (240.430) 62 Crime Prevention (50.273) (52.330) (53.699) 65 Traffic Safety and Enforcement 0.033 (0.481) (0.734) 68 Fire and Rescue Response (137.172) (139.670) (142.556) 71 Fire and Injury Prevention (5.180) (5.285) (5.395) 74 Medical Response - - - 77 Emergency Management (1.102) (1.124) (1.144) 79 Recreation (43.994) (45.869) (47.304) 82 Parks and Urban Forestry (37.574) (37.431) (37.170) 86 Community Liveability (6.724) (7.162) (7.416) 89 Libraries (28.945) (29.420) (30.174) 92 Arts, Entertainment and Culture (20.946) (21.417) (23.081) 95 Insect Control (8.151) (8.241) (8.352)
Protection, Community Services and Parks / Winnipeg Police Board
(571.138) (582.593) (597.455)
Innovation and Economic Development97 Innovation, Transformation and Technology (28.053) (27.812) (27.267)
100 Economic Development (1.188) (1.186) (1.186) 102 Winnipeg Fleet Management (SOA) 0.549 0.310 0.688 105 Winnipeg Parking Authority (SOA) 0.028 0.028 0.027 108 Golf Services (SOA) 0.555 0.590 0.643
Golf Services - Subsidy (0.730) (0.730) (0.730) 110 Animal Services (SOA) 0.139 0.109 0.087
Animal Control and Care - Subsidy (1.271) (1.271) (1.271) Innovation and Economic Development (29.971) (29.962) (29.009)
Executive Policy Committee113 Organizational Support Services (26.404) (26.761) (27.218) 117 Assessment, Taxation and Corporate 893.190 924.112 962.166 121 Contact Centre - 311 (4.422) (4.440) (4.641) 123 Council Services (13.836) (14.379) (14.102)
Executive Policy Committee 848.528 878.532 916.205
Total City Services 42.288 43.655 45.226
Notes: (1)
(2) Services in black font are included in General Revenue Fund.
(3) Services in coloured font are separate utility / SOA funds.(4) Services included in Solid Waste fund.
2020 Preliminary Operating Budget - All ServicesTax Supported, Utilities and SOAs
Amounts in the financial tables are system generated and rounded to the nearest thousand. Therefore, totals and sub-totals may be impacted.
Services(millions of $)
Section 2Page #
2-2 Preliminary 2020 Budget - Service Based

2018 Actual
2019 Budget
2020 Preliminary
Budget
2020 Compared
to 2019 Variance *
2021 Projection
2022 Projection
2023Projection
Infrastructure Renewal and Public Works
6 Roadway Construction and Maintenance 227 229 229 - 229 229 229 9 Transportation Planning and Traffic Management 158 164 165 1 165 165 165
12 Roadway Snow Removal and Ice Control 125 134 133 (1) 133 133 133
15 Public Transit 1,503 1,570 1,602 32 1,612 1,614 1,615
Public Transit - Subsidy - - - 18 City Beautification 134 121 120 (1) 120 120 120
Infrastructure Renewal and Public Works 2,147 2,218 2,249 31 2,259 2,261 2,262 Water and Waste, Riverbank Management and the Environment
22 Water 390 409 404 (5) 404 404 404
25 Wastewater 398 410 409 (1) 410 410 410
28 Land Drainage and Flood Control 28 28 27 (1) 27 27 27
31 Solid Waste Collection 10 15 17 2 17 17 17
33 Solid Waste Disposal 42 38 40 2 40 40 40
36 Recycling and Waste Diversion 69 82 81 (1) 81 81 81
Water and Waste, Riverbank Management and the Environment
937 982 978 (4) 979 979 979
Property and Development, Heritage and Downtown Development
40 City Planning 17 21 20 (1) 20 19 19
43 Neighbourhood Revitalization 8 2 1 (1) 1 1 1
46
Development Approvals, Building Permits and Inspections
218 210 206 (4) 206 196 189
49 Heritage Conservation 2 2 3 1 3 2 2
51 Property Asset Management 39 46 47 1 47 45 45
54 Municipal Accommodations 281 289 286 (3) 286 286 285
56 Cemeteries 27 25 24 (1) 24 24 24
Property and Development, Heritage and Downtown Development
592 595 587 (8) 587 573 565
Protection, Community Services and Parks / Winnipeg Police Board
60 Police Response 1,548 1,565 1,554 (11) 1,554 1,554 1,554
63 Crime Prevention 298 287 297 10 297 297 297
66 Traffic Safety and Enforcement 84 91 91 - 91 91 91
69 Fire and Rescue Response 941 919 919 - 919 919 919
72 Fire and Injury Prevention 43 44 41 (3) 42 42 42
75 Medical Response 423 408 411 3 412 412 412
78 Emergency Management 5 8 8 - 8 8 8
80 Recreation 361 374 378 4 367 367 367
83 Parks and Urban Forestry 338 308 311 3 311 310 310
87 Community Liveability 55 56 56 - 56 56 55
90 Libraries 260 277 273 (4) 265 265 265
93 Arts, Entertainment and Culture 8 6 6 - 6 6 6
96 Insect Control 65 67 67 - 67 67 67
Protection, Community Services and Parks / Winnipeg Police Board
4,429 4,410 4,412 2 4,395 4,394 4,393
Innovation and Economic Development
98 Innovation, Transformation and Technology 152 162 166 4 167 167 167
101 Economic Development 4 4 3 (1) 3 3 3
103 Winnipeg Fleet Management (SOA) 120 129 119 (10) 109 102 102
106 Winnipeg Parking Authority (SOA) 50 61 62 1 62 62 62
109 Golf Services (SOA) 20 24 24 - 24 24 24
111 Animal Services (SOA) 25 27 27 - 27 27 27
Innovation and Economic Development 371 407 401 (6) 392 385 385
Executive Policy Committee -
114 Organizational Support Services 223 223 221 (2) 223 220 220
118 Assessment, Taxation and Corporate 121 131 130 (1) 130 130 130
122 Contact Centre - 311 101 84 80 (4) 75 75 75
124 Council Services 99 77 79 2 79 86 79
Executive Policy Committee 544 515 510 (5) 507 511 504
Total City Services 9,020 9,127 9,137 10 9,119 9,103 9,088
*
Services
Full-time equivalent position variance explanations are noted in their respective service based budget sheets - refer to page numbers noted
2020 Preliminary Operating Budget - All ServicesTax Supported, Utilities and SOAs
Full-time Equivalent Positions
Section 2 Page #
Preliminary 2020 Budget - Service Based 2-3

2-4 Preliminary 2020 Budget - Service Based

Roadway Construction and MaintenanceIncludes:
• Bridge Construction & Maintenance• Regional Streets Construction & Maintenance• Local Streets Construction & Maintenance• Regional Sidewalk Construction & Maintenance• Local Sidewalk Construction & Maintenance
Description Key GoalsTo provide citizens with access to well-maintained roadways, sidewalks and bridges in order to ensure the safe, efficient movement of people, goods and services.
1. Expand and refine Roadway Asset Management systems.
2. Support Downtown revitalization.3. Provide optimized delivery of infrastructure projects.4. Utilize principles of environmental stewardship.5. Coordinate processes with other major project
stakeholders.6. Implement active transportation components in
regional street projects where feasible.
Service Level Statistics Description 2016 2017 2018Roadway transferred from developers (lane-km) 17.0 54.8 31.3Capital Addition of Regional Streets (lane-km) 7.5 0.6 0.0Capital Reconstruction of Regional Streets (lane-km) [A] 11.3 2.8 24.0Capital Rehabilitation of Regional Streets (lane-km) [A] 58.9 24.9 9.6Capital Reconstruction of Local Streets (lane-km) 18.8 17.9 28.1Capital Rehabilitation of Local Streets (lane-km) 71.8 78.1 66.3Capital Addition of Surfaced Alleys (lane-km) 7.7 3.5 1.6Capital Reconstruction of Alleys (lane-km) 4.0 3.6 7.6New Pedestrian/Cycle Pathways (metres) [B] 1,483 8,609 14,143Major Bridge Rehabilitations 3 locations
$8,620,0003 locations
$17,333,0008 locations
$23,555,000Significant Bridge Maintenance Repair Works 26 locations
$1,310,00026 locations $1,435,000
22 locations $506,000
Slope Stabilization Works 1 location $3,500,000
1 location $3,500,000
1 location $3,000,000
Bridge Deck Sealing Program 3 locations $5,000 0
2 locations $302,000
Overhead Sign Structure Maintenance 2 locations $56,700
1 location $27,500 0
Pumping Station Maintenance0
1 location $446,000
1 location $350,000
[A] The increase in Capital Reconstruction of Regional Streets in 2018 is mainly due to the funding shift in from Capital Rehabilitation of Regional Streets to Reconstruction.
[B] The increase in 2018 is based on current Active Transportation capital projects. 2018 reporting also includes pedestrian/cycle pathways as part of developer work.
Preliminary 2020 Budget - Service Based 2-5
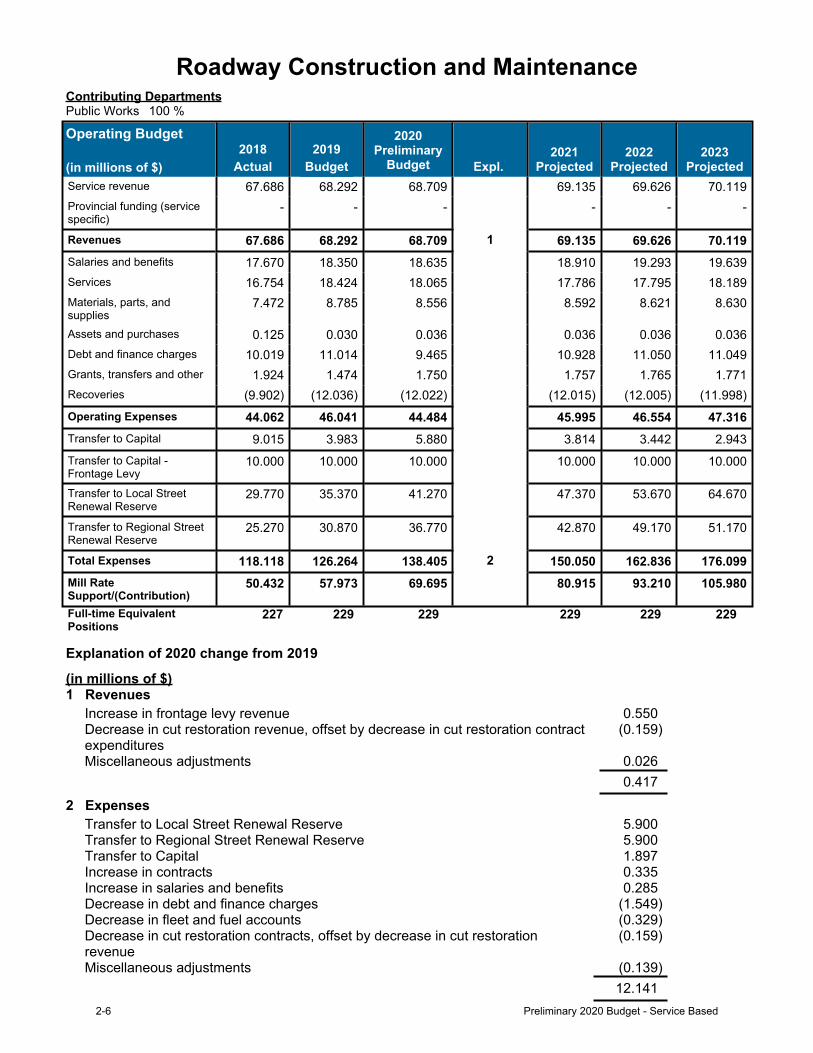
Roadway Construction and MaintenanceContributing DepartmentsPublic Works 100 %
Operating Budget
(in millions of $)2018
Actual2019
Budget
2020Preliminary
Budget Expl. 2021
Projected2022
Projected2023
ProjectedService revenue 67.686 68.292 68.709 69.135 69.626 70.119Provincial funding (service specific)
- - - - - -
Revenues 67.686 68.292 68.709 1 69.135 69.626 70.119Salaries and benefits 17.670 18.350 18.635 18.910 19.293 19.639Services 16.754 18.424 18.065 17.786 17.795 18.189Materials, parts, and supplies
7.472 8.785 8.556 8.592 8.621 8.630
Assets and purchases 0.125 0.030 0.036 0.036 0.036 0.036Debt and finance charges 10.019 11.014 9.465 10.928 11.050 11.049Grants, transfers and other 1.924 1.474 1.750 1.757 1.765 1.771Recoveries (9.902) (12.036) (12.022) (12.015) (12.005) (11.998)Operating Expenses 44.062 46.041 44.484 45.995 46.554 47.316Transfer to Capital 9.015 3.983 5.880 3.814 3.442 2.943Transfer to Capital - Frontage Levy
10.000 10.000 10.000 10.000 10.000 10.000
Transfer to Local Street Renewal Reserve
29.770 35.370 41.270 47.370 53.670 64.670
Transfer to Regional Street Renewal Reserve
25.270 30.870 36.770 42.870 49.170 51.170
Total Expenses 118.118 126.264 138.405 2 150.050 162.836 176.099Mill Rate Support/(Contribution)
50.432 57.973 69.695 80.915 93.210 105.980
Full-time Equivalent Positions
227 229 229 229 229 229
Explanation of 2020 change from 2019
(in millions of $)1 Revenues
0.550(0.159)
Increase in frontage levy revenueDecrease in cut restoration revenue, offset by decrease in cut restoration contract expendituresMiscellaneous adjustments 0.026
0.4172 Expenses
5.9005.9001.8970.3350.285
(1.549)(0.329)(0.159)
Transfer to Local Street Renewal ReserveTransfer to Regional Street Renewal ReserveTransfer to CapitalIncrease in contractsIncrease in salaries and benefitsDecrease in debt and finance chargesDecrease in fleet and fuel accountsDecrease in cut restoration contracts, offset by decrease in cut restoration revenueMiscellaneous adjustments (0.139)
12.1412-6 Preliminary 2020 Budget - Service Based

Roadway Construction and Maintenance
Service Detail
Sub-services (in millions of $)2018
Actual2019
Budget
2020Preliminary
Budget2021
Projection2022
Projection2023
ProjectionBridge Constr & Maint
Revenue 10.077 10.007 10.007 10.007 10.007 10.007Operating expenses 2.702 2.756 2.860 2.879 2.921 2.965Transfer to Capital 12.513 12.390 13.128 11.825 12.078 12.079
5.138 5.139 5.981 4.697 4.992 5.037Regl Streets Constr & Maint
Revenue 29.137 29.191 29.458 29.667 29.887 30.106Operating expenses 20.347 21.584 19.262 20.351 20.550 20.795Transfer to Capital 4.708 32.463 38.345 43.545 49.861 51.845
(4.082) 24.856 28.149 34.229 40.524 42.534Local Streets Constr & Maint
Revenue 25.178 25.466 25.657 25.846 26.065 26.285Operating expenses 17.481 18.096 18.714 19.081 19.334 19.734Transfer to Capital 55.354 35.370 41.270 47.370 53.670 64.670
47.658 28.001 34.327 40.605 46.939 58.119Regl Sidewalk Constr & Maint
Revenue 0.897 1.009 0.999 1.006 1.020 1.035Operating expenses 0.878 0.923 0.963 0.976 0.994 1.013Transfer to Capital 1.372 - 0.589 0.657 0.336 0.095
1.354 (0.086) 0.553 0.627 0.309 0.073Local Sidewalk Constr & Maint
Revenue 2.398 2.618 2.588 2.608 2.647 2.686Operating expenses 2.654 2.681 2.685 2.709 2.756 2.808Transfer to Capital 0.108 - 0.589 0.657 0.337 0.095
0.364 0.063 0.686 0.758 0.446 0.217Mill Rate Support/(Contribution) 50.432 57.973 69.695 80.915 93.210 105.980
Additional Financial Information
Reserves
Balance, December 31 (in millions of $)2018
Actual2019
Forecast
2020Preliminary
Budget2021
Projection2022
Projection2023
ProjectionFederal Gas Tax Reserve 0.491 1.310 13.448 7.126 3.632 1.689Local Street Renewal Reserve 0.098 0.104 0.205 0.408 0.713 1.022Regional Street Renewal Res 0.118 0.123 0.225 0.428 2.745 3.075
Note: Balances in Federal Gas Tax Reserve include Winnipeg Transit, Community Services, and Municipal Accommodations portions.
Capital Budget2020
Preliminary2021-2025Forecast
6 YearTotal
(In millions of $) 150.694 811.311 962.005
Preliminary 2020 Budget - Service Based 2-7

Transportation Planning and Traffic ManagementIncludes:
• Transportation Planning & Design• Traffic/Right-of-Way Management
Description Key GoalsTo plan, design and manage the transportation system and the traffic regulatory environment to provide a safe, environmentally-aware, accessible and sustainable transportation system.
1. Provide integrated transportation and land use planning.
2. Provide an accessible transportation system.3. Invest in equipment and technology that supports a
sustainable transportation system.4. Expand the Active Transportation System network.5. Support Downtown revitalization initiatives.6. Maintain or improve service levels on the street
system.
Service Level Statistics
Description 2016 2017 2018Lane Kilometres of Regional Streets 1,822 1,824 1,824Lane Kilometres of Truck Routes [A] 1,775 1,777 1,777Number of Signalized Intersections 657 665 674Number of Accessible Pedestrian Signals 484 521 583Number of Pedestrian Corridors 181 181 185Kilometres of Active Transportation Facilities 410 419 431Kilometres of Multi-use paths 201 211 223Kilometres of Bike Lanes 49 50 53Kilometres of Sharrows 37 37 37Kilometres of Bike Boulevards 56 56 56Transportation System Use Estimates Daily Vehicle-Kilometre of Travel 10.20 million 10.28 million 10.33 million
[A] In 2016, the Regional Streets Network increased due to the twinning of Dr. Jose Rizal Way. Truck Routes Lane Kilometers increased with re-designation of streets in the Omand's Creek Industrial area, west of Route 90.
2-8 Preliminary 2020 Budget - Service Based

Transportation Planning and Traffic ManagementContributing DepartmentsPublic Works 99 %Planning, Prop. & Devl. 1 %
Operating Budget
(in millions of $)2018
Actual2019
Budget
2020Preliminary
Budget Expl. 2021
Projection2022
Projection2023
ProjectionService revenue 2.229 2.746 2.886 2.946 3.007 3.070Provincial funding (service specific) - - - - - -Revenues 2.229 2.746 2.886 1 2.946 3.007 3.070Salaries and benefits 13.657 14.285 14.753 15.015 15.345 15.645Services 3.573 3.444 3.337 3.268 3.226 3.262Materials, parts and supplies 3.284 2.484 2.424 2.432 2.438 2.438Assets and purchases 0.132 0.078 0.079 0.079 0.079 0.079Debt and finance charges 0.046 0.039 0.033 0.035 0.035 0.035Grants, transfers and other 1.109 1.120 1.134 1.141 1.148 1.153Recoveries (7.386) (3.454) (3.461) (3.469) (3.470) (3.473)Operating expenses 14.415 17.995 18.298 18.501 18.801 19.140Transfer to Capital 3.635 0.956 1.041 0.013 0.026 0.005Total Expenses 18.050 18.951 19.340 2 18.514 18.827 19.145Mill Rate Support/(Contribution) 15.821 16.205 16.453 15.568 15.820 16.075Full-time Equivalent Positions 158 164 165 165 165 165
Explanation of 2020 Change from 2019
(in millions of $)1 Revenues
0.154Increase in street rental permits Miscellaneous adjustments (0.014)
0.140
2 ExpensesIncrease in salaries and benefits 0.468Transfer to Capital 0.085Decrease in fleet and fuel accounts (0.167)Miscellaneous adjustments 0.003
0.389
Full-time Equivalent PositionsIncrease of 1 FTE due to refinement of service based view.
Preliminary 2020 Budget - Service Based 2-9
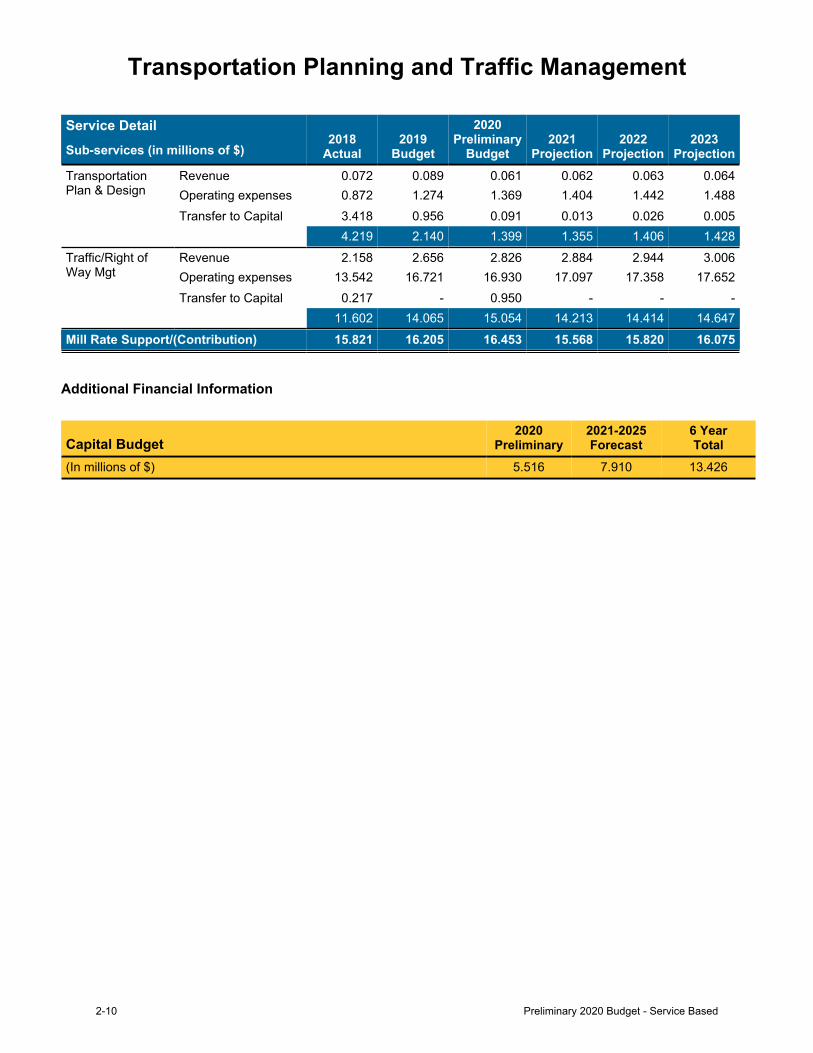
Transportation Planning and Traffic Management
Service Detail Sub-services (in millions of $)
2018 Actual
2019 Budget
2020Preliminary
Budget2021
Projection2022
Projection2023
ProjectionTransportation Plan & Design
Revenue 0.072 0.089 0.061 0.062 0.063 0.064Operating expenses 0.872 1.274 1.369 1.404 1.442 1.488Transfer to Capital 3.418 0.956 0.091 0.013 0.026 0.005
4.219 2.140 1.399 1.355 1.406 1.428Traffic/Right of Way Mgt
Revenue 2.158 2.656 2.826 2.884 2.944 3.006Operating expenses 13.542 16.721 16.930 17.097 17.358 17.652Transfer to Capital 0.217 - 0.950 - - -
11.602 14.065 15.054 14.213 14.414 14.647Mill Rate Support/(Contribution) 15.821 16.205 16.453 15.568 15.820 16.075
Additional Financial Information
Capital Budget2020
Preliminary2021-2025Forecast
6 YearTotal
(In millions of $) 5.516 7.910 13.426
2-10 Preliminary 2020 Budget - Service Based

Roadway Snow Removal and Ice ControlIncludes:
• Regional Streets Snow and Ice Removal• Local Streets Snow and Ice Removal• Sidewalk Snow and Ice Removal• Park & Facility Snow and Ice Removal• Snow Disposal Sites
Description Key GoalsUndertake effective roadway snow and ice control services in order to provide safe and accessible conditions on city streets and sidewalks during the winter season.
1. To provide the citizens of Winnipeg with safe and accessible roadway infrastructure during the winter months by delivering efficient and effective snow and ice control services.
2. To implement Best Management Practices for the municipal use of road salt for snow and ice control in winter months in accordance with Environment Canada's Code of Practice for Road Salt Management.
3. To work closely with the private sector to ensure there is a sustainable quantity of private sector equipment to assist the City in carrying out the winter snow clearing operations.
4. To examine various options for the provision of snow disposal sites and develop a long term strategy to provide this service in a cost-effective manner in the future.
Service Level StatisticsDescription 2016 2017 2018Annual Snowfall (centimetres) 140 93 95Days of Snowfall (3 cm or more) 16 11 6Regional Streets - Priority 1 Truck Plows (Department budgets for 3 events) 5 4 5Regional Streets - Priority 1 Grader Plows (Department budgets for 3 events) 3 1 1Bus Routes and Truck Routes - Priority 2 Truck Plows (Department budgets for 3 events) 4 4 5Bus Routes and Truck Routes - Priority 2 Grader Plows (Department budgets for 2 events) 3 2 1Residential Streets - Priority 3 Grader Plows (Department budgets 2 events) 3 0 1Alleys (Department Budgets for 2 events) 3 1 3Salt Applied (tonnes) 20,518 27,000 20,622Sand Applied (tonnes) 54,710 58,000 49,979Snow Removed/Hauled (cubic metres) 1,126,870 1,700,000 689,717Sidewalks Plowed (kilometres) 26,790 45,627 48,261
Preliminary 2020 Budget - Service Based 2-11

Roadway Snow Removal and Ice ControlContributing DepartmentsPublic Works 100 %
Operating Budget
(in millions of $)2018
Actual2019
Budget
2020Preliminary
Budget Expl. 2021
Projection2022
Projection2023
ProjectionService revenue 0.078 0.113 0.113 0.113 0.113 0.113Provincial funding (service specific) - - - - - -Revenues 0.078 0.113 0.113 1 0.113 0.113 0.113Salaries and benefits 9.306 10.006 10.090 10.238 10.460 10.659Services 20.647 18.950 19.229 18.981 19.001 19.201Materials, parts, and supplies 4.546 4.653 4.473 4.507 4.531 4.533Assets and purchases 0.029 0.015 0.015 0.015 0.015 0.015Debt and finance charges 0.046 0.015 0.015 0.015 0.015 0.015Grants, transfers and other 1.403 1.332 1.380 1.386 1.394 1.399Recoveries (0.746) (0.142) (0.142) (0.142) (0.142) (0.142)Operating expenses 35.230 34.828 35.060 35.000 35.273 35.679Transfer to Capital - - - - - -Total Expenses 35.230 34.828 35.060 2 35.000 35.273 35.679Mill Rate Support/(Contribution) 35.152 34.715 34.947 34.887 35.160 35.566Full-time Equivalent Positions 125 134 133 133 133 133
Explanation of 2020 Change from 2019
(in millions of $)1 Revenues n/a
2 ExpensesAnnualized cost for the winter maintenance strategy effective winter 2019/2020 0.419Increase in salaries and benefits 0.084Decrease in fleet and fuel accounts (0.320)Miscellaneous adjustments 0.049
0.232
Full-time Equivalent PositionsDecrease of 1 FTE due to refinement of service based view.
2-12 Preliminary 2020 Budget - Service Based

Roadway Snow Removal and Ice Control
Service Detail
Sub-services (in millions of $)2018
Actual2019
Budget
2020Preliminary
Budget2021
Projection2022
Projection2023
ProjectionRegl Streets Snow/Ice Removal
Revenue 0.032 0.042 0.042 0.042 0.042 0.042Operating expenses 13.441 12.752 12.619 12.572 12.670 12.827Transfer to Capital - - - - - -
13.409 12.711 12.577 12.531 12.628 12.786Local Streets Snow/Ice Removal
Revenue 0.033 0.048 0.048 0.048 0.048 0.048Operating expenses 16.822 15.779 15.774 15.755 15.882 16.062Transfer to Capital - - - - - -
16.789 15.730 15.725 15.706 15.834 16.014Sidewalk Snow/Ice Removal
Revenue 0.005 0.012 0.012 0.012 0.012 0.012Operating expenses 2.854 4.384 4.776 4.776 4.804 4.852Transfer to Capital - - - - - -
2.849 4.372 4.764 4.764 4.791 4.840Parks,Facility Snow,Ice Remove
Revenue 0.007 0.009 0.009 0.009 0.009 0.009Operating expenses 0.881 1.190 1.171 1.175 1.193 1.210Transfer to Capital - - - - - -
0.874 1.181 1.162 1.166 1.184 1.200Snow Disposal Sites
Revenue 0.002 0.002 0.002 0.002 0.002 0.002Operating expenses 1.232 0.722 0.721 0.722 0.725 0.728Transfer to Capital - - - - - -
1.231 0.720 0.719 0.720 0.723 0.726Mill Rate Support/(Contribution) 35.152 34.715 34.947 34.887 35.160 35.566
Preliminary 2020 Budget - Service Based 2-13

Public TransitIncludes:
• Regular Transit• Transit Plus• Chartered and Special Events Transit
Description Key GoalsTo operate a public transportation system in Winnipeg that provides a network of service routes throughout the City which includes conventional, express, downtown shuttle and suburban 'DART' routes designed to meet various levels of demand city-wide with a fleet of low-floor accessible, GPS- equippedbuses.
To provide a parallel Transit service to individuals who are unable to use the fixed-route transit some, part or none of the time due to a disability in accordancewitheligibilitycriteria.
The transit system is being expanded through the development of a rapid transit network designed to provide improved reliability, reduced travel time, and the opportunity for transit-oriented development. Winnipeg's first rapid transit project, Phase 1 of the Southwest Transitway, opened in April 2012. Phase 2 is currently under construction and will open in April 2020.
1. Encourage increased ridership by optimizingaccessibility and improved service reliability.
2. Enhance safety protocols to protect employees,passengers and specialized transit contractors.
3. Develop a positive image through enhanced publicinformation, communication systems and the use oftechnology.
4. Minimize the impact on the environment throughthoughtful bus procurement, use of fuel andmaintenance strategies.
5. Operate in a cost effective manner through a cultureof continuous improvement and implementation ofefficiencies.
Service Level Statistics
Regular and Chartered Transit Transit PlusDescription 2016 2017 2018Number of Buses in Fleet 623 640 641Bus Hours Operated 1,541,618 1,548,594 1,553,590Bus Kilometres Operated 29,978,613 30,160,628 30,328,539Passengers Carried: Annual 48,521,820 48,098,447 48,409,060Passengers Carried: Average Weekday 169,908 168,425 169,513Number of Routes 93 93 93Number of Bus Stops 5,084 5,173 5,179
Description 2016 2017 2018Active Registrants at Year End 7,512 7,443 7,924% of Registrants Age 65+ 73% 74% 72%Passengers Carried: Annual [A] 467,924 473,390 459,470Passengers Carried: Average Weekday 1,532 1,790 1,514Customer No Shows (Annual) 7,702 8,440 8,508Trip Requests Unable to Provide 5,359 7,036 7,907Priority 1 - % of Passengers Carried (Work, Medical, Post-Secondary) 55% 59% 60%Wheelchair - % of Passengers Carried 30% 31% 32%Ambulant - % of Passengers Carried 70% 69% 68%
[A] 2016 restated for revised reporting methodology.
2-14 Preliminary 2020 Budget - Service Based

Public TransitContributing DepartmentsTransit 100 %
Operating Budget
(in millions of $)2018
Actual2019
Budget
2020Preliminary
Budget Expl.2021
Projection2022
Projection2023
ProjectionService revenue 90.528 91.675 96.637 99.120 100.337 102.133Provincial funding (service specific) 42.024 41.970 42.024 42.024 42.024 42.024Revenues 132.552 133.645 138.660 1 141.143 142.360 144.156Salaries and benefits 114.408 121.403 123.624 127.011 130.025 134.059Services 18.094 21.372 20.208 21.379 22.246 23.100Materials, parts, and supplies 34.387 37.969 38.595 39.711 41.078 42.342Assets and purchases 0.842 0.861 0.724 0.799 0.679 0.894Debt and finance charges 9.138 10.216 10.380 11.773 13.209 14.334Grants, transfers and other 25.154 11.937 13.922 16.032 18.198 20.432Recoveries (3.674) (4.591) (4.235) (4.368) (4.480) (4.716)Operating Expenses 198.349 199.167 203.218 212.336 220.955 230.445Transfer to Capital 0.607 5.039 2.805 7.476 7.206 9.213Total Expenses 198.956 204.206 206.023 2 219.812 228.161 239.658Mill Rate Support/(Contribution) 66.405 70.561 67.363 78.669 85.801 95.502Full-time Equivalent Positions 1,503 1,570 1,602 1,612 1,614 1,615
Explanation of 2020 Change from 2019
(in millions of $)1 Revenues
Net increase in fare revenue from changes to programs including the introduction of Southwest Rapid Transitway (Stage 2) service, the low income bus pass program and elimination of the U-Pass program
5.546
Increase in advertising revenue 0.189Decrease in charter revenue (0.687)Miscellaneous adjustments (0.033)
5.015
2 ExpensesNet increase in salaries and benefits (refer to page 3-17 for details) 2.221Increase transfer to Southwest Rapid Transitway Payment Reserve 1.947Increase in carbon tax 0.786Decrease in recoveries primarily due to recoveries from capital program 0.356Increase in computer software maintenance contracts 0.327Transfer to Capital (2.234)Decrease in bus parts (0.753)Decrease in fuel (0.610)Miscellaneous adjustments (0.223)
1.817
Full-time Equivalent PositionsIncrease of 32 FTES due to added service from the opening of the Southwest Rapid Transitway (Stage2) (36.75 FTEs) and the implementation of the low income bus pass program (5.25 FTEs) as well as new Transit Plus processes as recommended by the Provincial Ombudsman (2.80 FTEs). The added FTEs offset by reduction in service (5.70 FTEs), decreased interior bus and shelter cleaning schedules (2.75 FTEs) and FTEs funded by capital projects (4.00 FTEs).
Preliminary 2020 Budget - Service Based 2-15

Public Transit
Service Detail
Sub-services (in millions of $)2018
Actual2019
Budget
2020Preliminary
Budget2021
Projection2022
Projection2023
ProjectionRegular Transit Revenue 124.362 127.436 133.095 135.536 136.732 138.505
Operating expenses 183.404 187.144 192.641 200.876 208.943 217.688Transfer to Capital 0.602 5.039 2.805 7.476 7.206 9.213
59.645 64.747 62.351 72.816 79.417 88.397Transit Plus Revenue 7.332 5.266 5.309 5.346 5.362 5.380
Operating expenses 14.087 11.080 10.321 11.199 11.746 12.486Transfer to Capital 0.005 - - - - -
6.760 5.814 5.012 5.853 6.384 7.105Chartered Bus & Special Events
Revenue 0.858 0.942 0.256 0.261 0.266 0.271Operating expenses 0.858 0.942 0.256 0.261 0.266 0.271Transfer to Capital - - - - - -
0.000 - - - - -Mill Rate Support/(Contribution) 66.405 70.561 67.363 78.669 85.801 95.502
Additional Financial Information
Reserves
Balance, December 31 (in millions of $)
2018 Actual
2019Forecast
2020Preliminary
Budget2021
Projection2022
Projection2023
ProjectionSW Rapid Transit Corridor Res 2.144 2.164 2.181 2.198 2.215 2.233SW Rpd Trwy - 2 & Peb Hwy Udrp 10.325 15.803 10.576 7.062 5.559 6.072Transit Bus Replacemt Res 11.026 0.775 0.783 0.792 0.801 0.810
Capital Budget2020
Preliminary2021 - 2025
Forecast6 YearTotal
(in millions of $) 26.435 140.392 166.827
2-16 Preliminary 2020 Budget - Service Based

City BeautificationIncludes:
• Litter Collection• Public Gardens / Landscaping• Ornamental Lighting / Flags & Banners / Public Art• Graffiti Control• Regional Street Cleaning• Local Street Cleaning
Description Key GoalsTo provide citizens and visitors with flower gardens, streetscaping, cleanliness, graffiti control and public art in order to promote the aesthetic appeal of the City of Winnipeg.
1. Maintain and continuously improve image route streetscaping to contribute to the beautification of our city.
2. Continue to beautify the city through enhanced floral displays, streetscaping, street cleaning and other clean and green initiatives.
3. Reduce graffiti occurrences through ongoing education and awareness while improving the level of service for graffiti removal through partnerships with volunteer community groups and maintaining a database for tracking graffiti incidents.
Service Level StatisticsDescription 2016 2017 2018Number of litter containers in park sites [A] 2,976 3,561 3,287Number of street litter containers 1,588 1,588 1,705Tonnes of boulevard abrasives removed (streets only) 22,305 29,500 21,516Flower Beds (raised/fixed/in-ground - not including shrubs) m2 [A]
21,291 23,442 24,998
Number of flower planters [A] 1,202 1,257 1,276Number of hanging baskets [A] 20 20 37Number of park lighting units [A] 3,601 3,588 3,800Number of community clean-up & Adopt-A-Park projects 40 43 43Number of graffiti tags removed 21,859 17,374 20,056Square metres of graffiti removed 45,589 38,331 45,187Number of graffiti sites treated 7,222 5,577 6,485Number of public art projects completed [B] 6 5 11
[A] Source: Parks and Open Spaces Asset Management (audited data). Inventory excludes Assiniboine Park.[B] Source: Winnipeg Arts Council
Preliminary 2020 Budget - Service Based 2-17
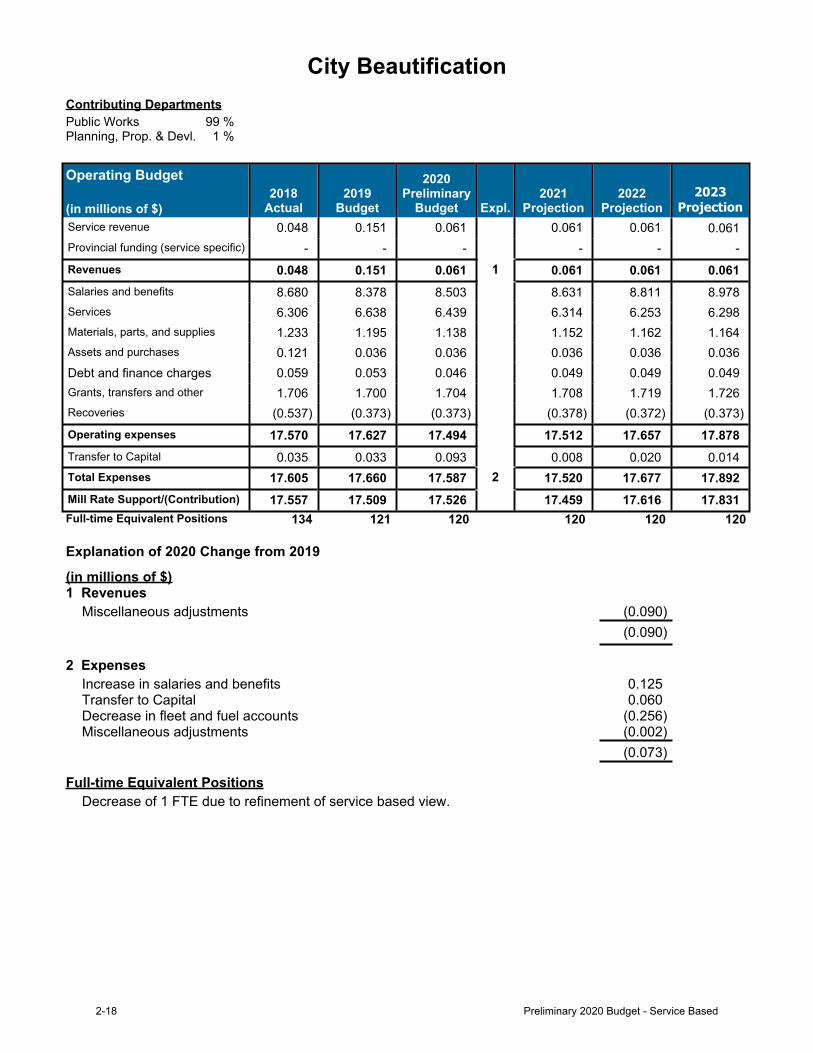
City BeautificationContributing DepartmentsPublic Works 99 %Planning, Prop. & Devl. 1 %
Operating Budget
(in millions of $)2018
Actual2019
Budget
2020Preliminary
Budget Expl.2021
Projection2022
Projection2023
ProjectionService revenue 0.048 0.151 0.061 0.061 0.061 0.061Provincial funding (service specific) - - - - - -Revenues 0.048 0.151 0.061 1 0.061 0.061 0.061Salaries and benefits 8.680 8.378 8.503 8.631 8.811 8.978Services 6.306 6.638 6.439 6.314 6.253 6.298Materials, parts, and supplies 1.233 1.195 1.138 1.152 1.162 1.164Assets and purchases 0.121 0.036 0.036 0.036 0.036 0.036Debt and finance charges 0.059 0.053 0.046 0.049 0.049 0.049Grants, transfers and other 1.706 1.700 1.704 1.708 1.719 1.726Recoveries (0.537) (0.373) (0.373) (0.378) (0.372) (0.373)Operating expenses 17.570 17.627 17.494 17.512 17.657 17.878Transfer to Capital 0.035 0.033 0.093 0.008 0.020 0.014Total Expenses 17.605 17.660 17.587 2 17.520 17.677 17.892Mill Rate Support/(Contribution) 17.557 17.509 17.526 17.459 17.616 17.831Full-time Equivalent Positions 134 121 120 120 120 120
Explanation of 2020 Change from 2019
(in millions of $)1 Revenues
Miscellaneous adjustments (0.090)(0.090)
2 ExpensesIncrease in salaries and benefits 0.125Transfer to Capital 0.060Decrease in fleet and fuel accounts (0.256)Miscellaneous adjustments (0.002)
(0.073)
Full-time Equivalent PositionsDecrease of 1 FTE due to refinement of service based view.
2-18 Preliminary 2020 Budget - Service Based

City Beautification
Service Detail
Sub-services (in millions of $)2018
Actual2019
Budget
2020Preliminary
Budget2021
Projection2022
Projection2023
Projection
Litter Collection Revenue 0.010 0.013 0.013 0.013 0.013 0.013Operating expenses 4.297 4.091 4.034 4.037 4.090 4.145Transfer to Capital - - - - - -
4.286 4.078 4.021 4.024 4.077 4.132Public Gardens/Landscaping
Revenue 0.017 0.095 0.020 0.020 0.020 0.021Operating expenses 4.087 4.196 4.161 4.167 4.223 4.283Transfer to Capital 0.035 0.027 0.078 0.007 0.016 0.011
4.106 4.127 4.218 4.154 4.219 4.274OrnLight/Flags,Banners/PubArt
Revenue 0.002 0.017 0.002 0.002 0.002 0.002Operating expenses 0.702 0.825 0.834 0.842 0.854 0.866Transfer to Capital - 0.005 0.016 0.001 0.003 0.002
0.699 0.813 0.847 0.841 0.855 0.865Graffiti Control Revenue 0.003 0.003 0.003 0.003 0.003 0.003
Operating expenses 1.392 1.538 1.505 1.514 1.537 1.551Transfer to Capital - - - - - -
1.389 1.534 1.501 1.511 1.533 1.548Regional Street Cleaning
Revenue 0.009 0.011 0.011 0.011 0.011 0.011Operating expenses 3.292 3.579 3.568 3.565 3.578 3.623Transfer to Capital - - - - - -
3.284 3.567 3.557 3.553 3.567 3.612Local Street Cleaning
Revenue 0.008 0.010 0.010 0.010 0.010 0.010Operating expenses 3.800 3.398 3.391 3.386 3.376 3.409Transfer to Capital - - - - - -
3.792 3.388 3.381 3.376 3.366 3.400Mill Rate Support/(Contribution) 17.557 17.509 17.526 17.459 17.616 17.831
Additional Financial Information
Capital Budget2020
Preliminary2021-2025Forecast
6 YearTotal
(In millions of $) 0.352 0.993 1.345
Preliminary 2020 Budget - Service Based 2-19

2-20 Preliminary 2020 Budget - Service Based

WaterIncludes:
• Water Supply and Treatment• Water Distribution
Description Key GoalsTo provide citizens with a safe and adequate supply of potable water for residential and commercial use through water supply, storage, treatment, pumping, distribution and metering.
1. To improve the state of the environment and public health.
2. To exceed our customers' needs and expectations.3. To continue improving water quality through ongoing
operation and maintenance of the water treatment plant and the water distribution systems.
4. To increase the efficiency and effectiveness of our services.
5. To implement best practices.6. To maintain a high quality safe working environment.7. To improve information management.
Service Level StatisticsDescription 2016 2017 2018Number of billed water accounts 205,759 208,008 210,490Number of complaints - taste and odour [A] 190 205 157Average daily volume of water pumped (ML/D) 189 189 195Average volume of water pumped daily per capita (litres) 260 252 255Kilometres of distribution water mains 2,637 2,660 2,679Kilometres of feeder mains 152 152 152Kilometres of water mains cleaned 755 839 614Number of water main breaks [B] 268 236 721Number of hydrants 22,045 22,376 22,785Number of water quality tests conducted 71,289 66,734 65,895Average monthly residential water bill $29.19 $33.07 $34.25Number of reservoirs 4 4 4Reservoir capacity (ML) 9,510 9,510 9,510Number of Water Treatment Plants 1 1 1Number of Water Treatment Plant tests conducted [C] 45,161 65,754 42,594
[A] Reflects complaints received through the City's 311 system.[B] 2018 increase in watermain breaks due to dry weather and soil conditions.[C] 2017 statistic includes pilot testing of an alternative coagulant at the Water Treatment Plant.
Preliminary 2020 Budget - Service Based 2-21

WaterContributing DepartmentsWater and Waste 100 %
Operating Budget
(in millions of $)2018
Actual2019
Budget
2020Preliminary
Budget Expl.2021
Projection2022
Projection2023
ProjectionService revenue 133.313 129.582 133.647 137.305 142.054 146.892Provincial funding (service specific) 0.796 0.765 0.785 0.785 0.785 0.785Revenues 134.109 130.347 134.433 1 138.091 142.840 147.678Salaries and benefits 30.286 33.090 33.745 34.427 35.161 35.966Services 19.467 20.635 20.236 20.492 20.889 21.164Materials, parts, and supplies 14.820 17.198 16.469 17.117 17.878 17.843Assets and purchases 1.197 1.165 1.268 1.241 1.255 1.292Debt and finance charges* 8.618 13.489 13.691 13.911 14.141 14.381Grants, transfers and other 40.954 39.802 43.152 45.304 47.390 50.016Recoveries (6.614) (8.449) (8.013) (8.338) (8.378) (8.395)Expenses 108.729 116.930 120.547 2 124.153 128.335 132.267Surplus/(Deficit) 25.381 13.417 13.886 13.937 14.505 15.411Full-time Equivalent Positions 390 409 404 404 404 404
* Actual does not include principal payments on debt.
The Water Utility maintains a retained earnings/working capital balance to fund capital projects on a pay as you go basis and to provide a reserve to prevent significant rate increases in the event of major unforeseen expenditures or shortfalls in revenue. The 2020 budgeted dividend is $14.262 million.
Explanation of 2020 Change from 2019
(in millions of $)1 Revenues
Increase in water sales 3.638Increase in interest earned 0.214Miscellaneous adjustments 0.234
4.086
2 ExpensesTransfer to Water Meter Renewal Reserve 2.332Increase in salaries and benefits 0.655Increase in transfer to Watermain Renewal Reserve 0.500Decrease in recoveries 0.436Increase in dividend transfer 0.400Increase in utilities 0.259Increase in property and payroll tax 0.209Increase in debt and finance 0.202Decrease in materials and maintenance (0.854)Decrease in consultant and professional services (0.343)Decrease in fleet and equipment rentals (0.154)Miscellaneous adjustments (0.025)
3.617
2-22 Preliminary 2020 Budget - Service Based

Water
Full-time Equivalent PositionsDecrease of 5 FTEs due to reduction of 24 hour emergency coverage from two crews to one, reduction of the Engineer in Training program, and internal FTE allocations within the Water and Waste department.
Service DetailSub-Services (in millions of $)
2018 Actual
2019 Budget
2020Preliminary
Budget2021
Projection2022
Projection2023
ProjectionWater Supply & Treatment
Revenue 66.941 65.093 67.136 68.965 71.340 73.759Expense 54.620 58.716 60.814 62.876 65.308 67.459
12.321 6.377 6.322 6.089 6.031 6.300Water Distribution Revenue 67.169 65.254 67.297 69.125 71.500 73.919
Expense 54.109 58.214 59.733 61.277 63.026 64.80813.060 7.040 7.564 7.849 8.474 9.111
Surplus/(Deficit) 25.381 13.417 13.886 13.937 14.505 15.411
Additional Financial Information
Reserves
Balance, December 31 (in millions of $)2018
Actual2019
Forecast
2020Preliminary
Budget2021
Projection2022
Projection2023
ProjectionWater Main Renewal Reserve 0.258 3.908 7.928 8.448 8.268 7.488Water Meter Renewal Reserve - - 4.664 12.597 23.448 37.273
Note: Balances in the Water Meter Renewal Reserve include contributions from the Wastewater Utility.
Capital Budget2020
Preliminary2021- 2025Forecast
6 YearTotal
(in millions of $) 37.600 169.350 206.950
Preliminary 2020 Budget - Service Based 2-23

WastewaterIncludes:
• Wastewater Collection• Wastewater Treatment
Description Key GoalsTo provide property owners with the collection, transmission, disposal, treatment and monitoring of wastewater in order to ensure the environmentally appropriate handling of high volume sewage discharge.
1. To improve the state of the environment / public health.
2. To exceed our customers' needs and expectations.3. To increase the efficiency and effectiveness of our
services.4. To successfully develop and implement the Winnipeg
Sewage Treatment Program.5. To operate and upgrade the Sewage Treatment
Plants to achieve environmental licence requirements.
6. To strive to better monitor and reduce combined sewer overflows.
7. To implement best practices throughout the Department.
8. To maintain a high quality safe working environment for our staff.
9. To improve information management in the Department.
Service Level StatisticsDescription 2016 2017 2018Number of billed sewer accounts 205,655 207,903 210,386Number of complaints - raw sewer backup [A] 752 687 808Number of complaints - clean sewer backup [A] 595 419 545Volume of wastewater processed (ML/D) 275 252 225Kilometres of collection system pipeline [B] 2,635 2,640 2,658Number of pumping stations 74 75 75Number of diversion chambers 14 14 14Kilometres of sewer inspected and cleaned 209 124 139Number of industrial waste tests conducted 49,279 41,522 43,717Number of treatment plant tests conducted 124,349 123,084 126,444Number of manholes 47,680 48,175 48,620Average monthly residential sewer bill $40.31 $45.29 $50.16[A] Reflects total complaints received through the City's 311 system including both City and customer areas of responsibility.[B] Includes sanitary, combined and interceptor sewers.
2-24 Preliminary 2020 Budget - Service Based

WastewaterContributing DepartmentsWater and Waste 100 %
Operating Budget
(in millions of $)2018
Actual2019
Budget
2020Preliminary
Budget Expl.2021
Projection2022
Projection2023
ProjectionService revenue 201.517 194.368 196.005 202.966 207.884 212.772Provincial funding (service specific) 0.347 0.336 0.347 0.347 0.347 0.347Revenues 201.863 194.703 196.351 1 203.313 208.231 213.119Salaries and benefits 32.288 34.719 35.523 36.358 37.337 38.242Services 26.119 28.880 28.997 30.329 30.828 31.245Materials, parts, and supplies 12.955 11.219 11.708 12.670 11.409 10.560Assets and purchases 0.088 0.146 0.167 0.117 0.097 0.092Debt and finance charges* 0.843 4.357 7.461 10.653 10.726 10.801Grants, transfers and other 83.367 155.985 80.402 85.188 89.691 92.691Recoveries (1.027) (1.731) (0.917) (0.914) (0.913) (0.914)Expenses 154.633 233.575 163.341 2 174.399 179.174 182.717Surplus/(Deficit) 47.231 (38.872) 33.010 28.914 29.056 30.401Full-time Equivalent Positions 398 410 409 410 410 410* Actual does not include principal payments on debt.
The Wastewater Utility maintains a retained earnings/working capital balance to fund capital projects on a pay as you go basis and to provide a reserve to prevent significant rate increases in the event of major unforeseen expenditures or shortfalls in revenue. The 2020 budgeted dividend is $20.325 million.
Explanation of 2020 Change from 2019
(in millions of $)1 Revenues
Increase in industrial waste surcharge 1.000Increase in leachate and hauled waste 0.763Decrease in sewer services revenue (0.230)Miscellaneous adjustments 0.115
1.648
2 ExpensesDecrease in transfer to Environmental Projects Reserve (75.322)Decrease in transfer to Land Drainage (2.409)Decrease in biosolids composting (0.520)Decrease in maintenance and materials (0.630)Decrease in fleet and rentals (0.298)Increase in debt and finance 3.104Transfer to Water Meter Renewal Reserve 2.332Decrease in recoveries 0.814Increase in salaries and benefits 0.804Increase in chemicals 0.756Increase in hauling 0.448Increase in utilities 0.407Increase in large volume sewer discount 0.233Miscellaneous adjustments 0.047
(70.234)
Preliminary 2020 Budget - Service Based 2-25

Wastewater
Full-time Equivalent PositionsDecrease of 1 FTE due to reduction of 24 hour emergency coverage from two crews to one, reduction of industrial waste sampling and inspection activities, and internal FTE allocations within the Water and Waste department.
Service Detail
Sub-services (in millions of $)2018
Actual2019
Budget
2020Preliminary
Budget2021
Projection2022
Projection2023
ProjectionWastewater Collection
Revenue 96.997 93.544 93.467 96.797 99.205 101.649Expense 67.333 106.177 70.203 74.563 76.878 78.307
29.665 (12.633) 23.264 22.233 22.327 23.342Wastewater Treatment
Revenue 104.866 101.159 102.884 106.517 109.025 111.469Expense 87.300 127.398 93.138 99.836 102.296 104.410
17.566 (26.239) 9.746 6.681 6.729 7.059Surplus/(Deficit) 47.231 (38.872) 33.010 28.914 29.056 30.401
Additional Financial Information
Reserves
Balance, December 31 (in millions of $) 2018 Actual
2019Forecast
2020Preliminary
Budget2021
Projection2022
Projection2023
ProjectionEnvironmental Projects Reserve 106.383 165.991 146.848 152.001 154.879 136.545Sewer System Rehab Reserve 6.496 9.938 8.724 6.402 4.219 1.737
Capital Budget2020
Preliminary2021-2025Forecast
6 YearTotal
(In millions of $) 69.065 368.230 437.295
2-26 Preliminary 2020 Budget - Service Based

Land Drainage and Flood ControlIncludes:
• Flood Control • Waterways Management• Land Drainage
Description Key GoalsTo provide property owners with storm and flood water control in order to prevent flood damage to property.
To monitor riverbank conditions, including undertaking stabilization and erosion protection along city-owned riverbank lands.
1. To improve the state of the environment / publichealth.
2. To exceed our customers' needs and expectations.3. To increase the efficiency and effectiveness of our
services.4. To implement best practices throughout the
Department.5. To maintain a high quality safe working environment
for our staff.6. To investigate options to improve aesthetics at
stormwater retention basins.7. To protect city-owned riverbanks using innovative
approaches.8. To provide public awareness, education, and
information on matters related to riverbanks.
Service Level StatisticsDescription 2016 2017 2018Number of stormwater retention basins (SRB) [A] 86 92 102Number of permanent flood pumping stations 31 31 31Number of SRB pumping stations 5 5 5Kilometres of land drainage sewer mains [B] 1,206 1,218 1,243Kilometres of storm relief sewer mains [B] 188 188 184Peak river elevations (>8.5 feet) - spring 16.5 19.31 15.67Peak river elevations (>8.5 feet) - summer 12.1 7.15 7.61Meters of City owned riverbank protected annually 360 70 150Number of waterway permits issued 128 116 136
[A] Stormwater retention basins (SRB) are added to inventory only after the warranty expires. In 2018, 10 SRB came off warrantyand were added to inventory.
[B] An improvement in data collection and analysis resulted in a reclassification of 4.3 km of storm relief sewers mains as landdrainage sewers mains in 2018.
Preliminary 2020 Budget - Service Based 2-27

Land Drainage and Flood ControlContributing Departments
Water and Waste 81 %Planning, Property and Development 16 %Public Works 3 %
Operating Budget
(in millions of $)2018
Actual2019
Budget
2020Preliminary
Budget Expl. 2021
Projection2022
Projection2023
ProjectionService Revenue 4.863 5.904 5.139 5.171 5.202 5.232Provincial funding (service specific) - - - - - -Revenues 4.863 5.904 5.139 1 5.171 5.202 5.232Salaries and Benefits 2.285 2.354 2.404 2.428 2.453 2.478Services 1.905 2.363 2.213 2.201 2.190 2.180Materials, parts and supplies 0.657 0.809 0.626 0.647 0.668 0.686Assets and purchases 0.002 0.003 0.004 0.004 0.004 0.004Debt and finance charges 0.120 0.789 0.321 0.321 0.320 0.320Grants, transfers and other 0.041 0.041 0.037 0.037 0.037 0.037Recoveries (0.050) - - - - - Operating expenses 4.959 6.360 5.605 5.637 5.672 5.705Transfer to Capital 0.506 0.205 0.500 0.100 - -Total Expenses 5.465 6.565 6.105 2 5.737 5.672 5.705Mill Rate Support/(Contribution) 0.602 0.661 0.965 0.566 0.470 0.473Full-time Equivalent Positions 28 28 27 27 27 27
Explanation of 2020 Change from 2019
(in millions of $)1 Revenues
Decrease in transfer from Sewage Disposal Fund (0.819)Miscellaneous adjustments 0.054
(0.765)
2 ExpensesDecrease in debt and finance (0.469)Decrease in certificates, permits and licenses (0.171)Decrease in maintenance materials (0.166)Transfer to Capital 0.295Miscellaneous adjustments 0.051
(0.460)
Full-time Equivalent PositionsDecrease of 1 FTE due to reduction of the land drainage sewer maintenance program and internal FTE allocations within the Water and Waste department.
2-28 Preliminary 2020 Budget - Service Based

Land Drainage and Flood ControlService Detail
Sub-services (in millions of $)2018
Actual2019
Budget
2020Preliminary
Budget2021
Projection2022
Projection2023
ProjectionFlood Control Revenue 0.016 - - - - -
Operating expenses 1.504 2.004 1.825 1.836 1.842 1.850Transfer to Capital - - - - - -
1.488 2.004 1.825 1.836 1.841 1.849Land Drainage Revenue 4.495 5.728 4.959 4.988 5.015 5.041
Operating expenses 3.103 3.904 3.331 3.348 3.370 3.390Transfer to Capital 0.506 - - - - -
(0.886) (1.824) (1.629) (1.640) (1.644) (1.651)Waterways Management
Revenue 0.351 0.175 0.180 0.183 0.187 0.191Operating expenses 0.352 0.451 0.449 0.453 0.459 0.465Transfer to Capital - 0.205 0.500 0.100 - -
0.000 0.481 0.769 0.370 0.273 0.275Mill Rate Support/(Contribution) 0.602 0.661 0.965 0.566 0.470 0.473
Additional Financial Information
Capital Budget2020
Preliminary2021-2025Forecast
6 YearTotal
(In millions of $) 7.821 28.155 35.976
Preliminary 2020 Budget - Service Based 2-29

Solid Waste Collection
Description Key GoalsThe Solid Waste collection services include weekly collection of garbage from single-family and multi-family homes. Other miscellaneous services are offered on a fee for service basis and include collection of surplus waste, large items, and appliances as well as garbage collection from small commercial entities and the collection of dead animalsfrompublicright-of-ways.Garbage collection services are provided by contractors and the City manages multiple contracts for this service.
1. To improve the state of the environment / public health.
2. To exceed our customers' needs and expectations.3. To increase the efficiency and effectiveness of our
services.4. To implement best practices throughout the
Department.5. To maintain a high quality safe working environment
for our staff.
Service Level StatisticsDescription 2016 2017 2018Number of dwelling units served 296,147 299,395 303,515Weight of residential garbage collected (tonnes) 174,280 172,209 172,041Weight of garbage collected per capita (kilograms) 237 230 225Number of large item pick ups per year 12,636 13,098 12,934
2-30 Preliminary 2020 Budget - Service Based

Solid Waste CollectionContributing DepartmentsWater and Waste 100 %
Operating Budget
(in millions of dollars)2018
Actual2019
Budget
2020Preliminary
Budget Expl.2021
Projection2022
Projection2023
ProjectionService revenue 1.161 1.142 1.167 1.187 1.206 1.226Provincial funding (service specific)
- - - - - -
Revenues 1.161 1.142 1.167 1 1.187 1.206 1.226Salaries and benefits 0.879 1.123 1.437 1.478 1.522 1.550Services 20.376 21.637 21.310 22.157 21.989 22.929Materials, parts, and supplies 0.027 0.095 0.382 0.391 0.398 0.394Assets and purchases 0.244 0.239 0.256 0.263 0.271 0.279Debt and finance charges 0.012 0.008 0.008 0.008 0.008 0.008Grants, transfers and other 0.124 0.124 0.149 0.150 0.151 0.152Recoveries (0.028) - - - - -Operating Expenses 21.634 23.226 23.542 24.448 24.340 25.312Transfer to Capital - - - - - -Total Expenses 21.634 23.226 23.542 2 24.448 24.340 25.312Mill Rate Support/(Contribution) 20.473 22.084 22.374 23.260 23.133 24.087Full-time Equivalent Positions 10 15 17 17 17 17
Explanation of 2020 Change from 2019
(in millions of $)1 Revenues
Miscellaneous adjustments 0.0250.025
2 ExpensesIncrease in fleet 0.430Increase in salaries and benefits 0.314Increase in fuel 0.098Decrease in collection costs (0.692)Miscellaneous adjustments 0.166
0.316
Full-time Equivalent PositionsIncrease of 2 FTEs is due to the addition of 5 FTEs for the Pilot Project - Multi-Family Solid Waste Collection Services provided by City staff, partially offset by internal FTE allocations within the Water and Waste department.
Preliminary 2020 Budget - Service Based 2-31

Solid Waste Disposal
Description Key GoalsSolid Waste Disposal services include the operation and maintenance of the City's active and closed landfills.The Brady Road Resource Management Facility is the site of the only active landfill the City of Winnipeg operates and it receives all of the City's residential garbage and some commercial waste as well. A landfill gas system collects and flares landfill gas, which diverts equivalent tonnes of carbon dioxide every year. Additionally this area is responsible for the maintenance and environmental monitoring of the thirty-three closed landfill sites within the City.
1. To improve the state of the environment / public health.
2. To increase opportunities to reduce the amount of material landfilled.
3. To exceed our customers' needs and expectations.4. To increase the efficiency and effectiveness of our
services.5. To implement best practices throughout the
Department.6. To maintain a high quality safe working environment
for our staff.7. To initiate landfill gas recovery projects to reduce
greenhouse gases.
Service Level StatisticsDescription 2016 2017 2018Number of tonnes disposed 363,664 355,326 332,564Total number of non-commercial vehicles 80,439 69,658 82,722Total number of commercial and contractor vehicles 65,336 70,989 70,567Kilolitres of leachate hauled and treated 65,360 53,930 39,541Tonnes of landfill gas (CO2e) captured and flared 104,349 85,819 78,602
2-32 Preliminary 2020 Budget - Service Based

Solid Waste DisposalContributing DepartmentsWater and Waste 100 %
Operating Budget
(in millions of $)2018
Actual2019
Budget
2020Preliminary
Budget Expl.2021
Projection2022
Projection2023
ProjectionService revenue 15.276 15.343 15.200 15.612 14.455 14.616Provincial funding (service specific) 0.065 0.062 0.065 0.065 0.065 0.065Revenues 15.342 15.404 15.265 1 15.678 14.521 14.682Salaries and benefits 3.495 3.344 3.503 3.595 3.687 3.775Services 5.934 8.274 8.337 8.490 8.807 9.025Materials, parts, and supplies 0.739 0.710 0.722 0.739 0.753 0.756Assets and purchases 0.002 0.095 0.094 0.094 0.094 0.094Debt and finance charges 0.210 0.366 0.364 0.355 0.252 0.260Grants, transfers and other 0.794 0.748 0.706 0.713 0.718 0.722Recoveries (0.836) (0.035) (0.035) (0.035) (0.035) (0.035)Expenses 10.339 13.503 13.692 2 13.952 14.275 14.598Surplus/(Deficit) 5.002 1.902 1.574 1.726 0.246 0.084Full-time Equivalent Positions 42 38 40 40 40 40
The Solid Waste Utility maintains a retained earnings/working capital balance to fund a portion of its capital program on a pay as you go basis, and to provide a reserve to prevent significant rate increases in the event of major unforeseen expenditures or shortfalls in revenue.
Explanation of 2020 Change from 2019
(in millions of $)1 Revenues
Miscellaneous adjustments (0.139)(0.139)
2 ExpensesIncrease in leachate treatment 0.331Miscellaneous adjustments (0.142)
0.189
Full-time Equivalent PositionsIncrease of 2 FTEs due to internal FTE allocations within the Water and Waste department.
Preliminary 2020 Budget - Service Based 2-33

Solid Waste Disposal
Additional Financial Information
Reserves
Balance, December 31 (in millions of $)2018
Actual2019
Forecast
2020Preliminary
Budget2021
Projection2022
Projection2023
ProjectionLandfill Rehab Reserve 7.788 8.027 5.074 3.703 2.612 1.503
Capital Budget2020
Preliminary2021-2025Forecast
6 YearTotal
(In millions of $) 1.670 13.600 15.270
2-34 Preliminary 2020 Budget - Service Based

Recycling and Waste DiversionIncludes:
• Recycling• Waste Diversion
Description Key GoalsRecycling services provided to residents include the weekly collection for single-family and some multi-family homes and sorting of the recyclables at the material recovery facility. Bales of commodities collected are sold and shipped at market prices. Public recycling community drop-off depots are also locatedthroughouttheCity.
Waste diversion services include bi-weekly seasonal yard waste collection and the operation of a nine hectare composting pad located at the Brady Road Resource Management Facility. Additionally, there are three 4R Winnipeg Depot locations which provide residents a one-stop location for recycling materials, divertible materials and the safe disposal of hazardouswasteincludingpaints,oilandelectronics.
Waste minimization services include an education program that supports backyard composting, grasscycling, giveaway weekends and other waste diversion initiatives.
1. To improve the state of the environment / publichealth.
2. To increase the opportunity to reduce the amount ofmaterial being landfilled.
3. To exceed our customers' needs and expectations.4. To increase the efficiency and effectiveness of our
services.5. To implement best practices throughout the
Department.6. To maintain a high quality safe working environment
for our staff.
Service Level StatisticsDescription 2016 2017 2018Number of dwelling units served 296,147 299,395 303,515Weight of residential recycling material collected (tonnes) [A] 55,010 54,177 52,553Average weight of residential recycling per household (kg) [A] 186 181 173Total yard waste composted (tonnes) 34,123 28,528 33,041Total material collected at the 4R Winnipeg Depots (tonnes) [B] 3,989 8,845 9,821
[A] Decrease in tonnes primarily due to lightweighting of packaging material.[B] The Brady 4R Winnipeg Depot opened February, 2016. The Pacific 4R Winnipeg Depot opened February, 2017. The Panet 4R
Winnipeg Depot opened February, 2018.
Preliminary 2020 Budget - Service Based 2-35

Recycling and Waste DiversionContributing DepartmentsWater and Waste 100 %
Operating Budget
(in millions of $)2018
Actual2019
Budget
2020Preliminary
Budget Expl.2021
Projection2022
Projection2023
ProjectionService revenue 23.573 24.884 27.011 30.001 32.340 32.723Provincial funding (service specific) 5.451 4.926 4.584 4.621 4.624 4.626Revenues 29.024 29.810 31.595 1 34.622 36.963 37.350Salaries and benefits 4.880 5.860 5.886 6.012 6.163 6.309Services 27.388 29.406 27.531 28.457 29.518 30.532Materials, parts, and supplies 0.394 0.577 0.469 0.435 0.435 0.432Assets and purchases 0.267 0.323 0.338 0.339 0.340 0.341Debt and finance charges* 0.773 3.177 3.069 2.981 1.736 1.888Grants, transfers and other 0.162 0.211 0.216 0.218 0.220 0.222Recoveries (0.336) (0.780) (0.260) (0.260) (0.260) (0.260)Expenses 33.529 38.775 37.248 2 38.181 38.151 39.464Surplus/(Deficit) (4.505) (8.965) (5.654) (3.559) (1.188) (2.115)Full-time Equivalent Positions 69 82 81 81 81 81* Actual does not include principal payments on debt. The Solid Waste Utility maintains a retained earnings/working capital balance to fund a portion of its capital program on a pay as you go basis, and to provide a reserve to prevent significant rate increases in the event of major unforeseen expenditures or shortfalls in revenue.
Explanation of 2020 Change from 2019
(in millions of $)1 Revenues
Increase in funding from Multi-Material Stewardship Manitoba 1.870Increase in waste diversion revenue 0.453Decrease in waste reduction support grant (0.375)Decrease in sale of recyclables (0.158)Miscellaneous adjustments (0.005)
1.785
2 ExpensesDecrease in recycling processing (2.170)Decrease in interfund recoveries 0.520Increase in leaf and yard waste collection 0.297Miscellaneous adjustments (0.174)
(1.527)Full-time Equivalent Positions
Decrease of 1 FTE due to internal FTE allocations within the Water and Waste department.
2-36 Preliminary 2020 Budget - Service Based

Recycling and Waste Diversion
Service Detail
Sub-services (in millions of $)2018
Actual2019
Budget
2020Preliminary
Budget2021
Projection2022
Projection2023
ProjectionRecycling Revenue 17.991 18.826 20.492 23.300 25.441 25.623
Operating expenses 24.523 28.162 25.910 26.604 26.154 27.130Transfer to Capital - - - - - -
(6.532) (9.336) (5.418) (3.304) (0.713) (1.507)Waste Diversion Revenue 11.033 10.984 11.103 11.322 11.523 11.727
Operating expenses 9.005 10.613 11.338 11.577 11.998 12.335Transfer to Capital - - - - - -
2.028 0.371 (0.236) (0.255) (0.475) (0.608)Surplus/(Deficit) (4.505) (8.965) (5.654) (3.559) (1.188) (2.115)
Additional Financial Information
Reserves
Balance, December 31 (in millions of $)2018
Actual2019
Forecast
2020Preliminary
Budget2021
Projection2022
Projection2023
ProjectionWaste Diversion Reserve 5.188 5.221 3.251 2.470 2.003 1.570
Capital Budget2020
Preliminary2021-2025Forecast
6 YearTotal
(In millions of $) 1.800 0.450 2.250
Preliminary 2020 Budget - Service Based 2-37

2-38 Preliminary 2020 Budget - Service Based

City PlanningIncludes:
• Area Development & Renewal Planning• City-wide Long Range Planning
Description Key GoalsTo manage a wide range of planning initiatives, such as the OurWinnipeg Development Plan and Complete Communities Direction Strategy, which guide growth and change in Winnipeg. The service reviews ongoing development proposals in a fair and objective manner to ensure the creation of sustainable and complete communities that are responsive to community values, while advising Council on planning processes and development applications. The service enables development and growth that follows the City's development plan through local area planning initiatives, policies, regulations, guidelines and tools while working collaboratively with stakeholders.
1. Support the implementation of OurWinnipeg througha range of effective tools and guidelines.
2. Ensure the City has an adequate supply of land toaccommodate projected growth in a sustainablemanner.
3. Enhance existing infrastructure and assets in waysthat make most amenities for daily living universallyaccessible.
4. Integrate land use and infrastructure planning insupport of the creation of complete communities.
Service Level Statistics
Description 2016 2017 2018No. of Development Servicing Agreements Administered [A] 20 26 175Number of Urban Design Applications Reviewed 106 111 111Number of Zoning Agreements Processed 39 39 24No. of Survey Information Requests (for construction work) 2,863 2,150 2,282Number of Surveys Performed (Contract / In-house) [B] 81 / 40 66 / 58 39 / 51Number of Survey Monuments Restored [C] 196 231 470Number of Street Closings / Openings 23 11 9Number of new greenfield dwelling units [D] 2,220 3,410 1,882Number of new infill dwelling units [E] 1,337 1,232 1,435No. of new dwelling units within 400 meters of a regional mixed-use corridor 397 478 379
[A] Variance in 2018 is due to a change in methodology.[B] Over the last few years Geomatics has seen a significant increase in the number of large scale projects. Some, such as the
Arlington Bridge and the Kenaston/Route 90 projects, each require the services of at least one staff member for a significantportion of the year.
[C] Restored survey monuments results from survey monuments established in new developments; these monuments are initiallyestablished by the developer so have not been counted in the past.
[D] Greenfield refers to units built in areas designated as 'Emerging Communities' and 'New Communities'. 'Emerging Communities'are a subset of 'Areas of Stability - Recent Communities' that have been recently planned and are still under development.
[E] Infill refers to units built in 'Areas of Stability', excluding 'Emerging Communities'.
Preliminary 2020 Budget - Service Based 2-39

City PlanningContributing DepartmentsPlanning, Prop. & Devl. 100 %
Operating Budget
(in millions of $)2018
Actual2019
Budget
2020Preliminary
Budget Expl.2021
Projection2022
Projection2023
ProjectionService revenue 0.007 0.316 0.001 0.001 0.001 0.001Provincial funding (service specific)
- - - - - -
Revenues 0.007 0.316 0.001 1 0.001 0.001 0.001Salaries and benefits 1.657 1.894 1.970 2.030 2.049 2.093Services 0.139 0.195 0.189 0.189 0.189 0.189Materials, parts, and supplies 0.003 0.003 0.003 0.003 0.003 0.003Assets and purchases 0.004 0.004 0.004 0.004 0.004 0.004Debt and finance charges 0.028 0.034 0.029 0.031 0.031 0.031Grants, transfers and other 0.324 0.041 0.058 0.058 0.058 0.058Recoveries (0.055) (0.131) (0.084) (0.097) (0.084) (0.086)Operating expenses 2.100 2.040 2.167 2.218 2.248 2.291Transfer to Capital - 0.122 0.272 0.035 0.068 0.048Total Expenses 2.100 2.162 2.440 2 2.252 2.317 2.339Mill Rate Support/(Contribution) 2.093 1.846 2.439 2.252 2.316 2.339Full-time Equivalent Positions 17 21 20 20 19 19
Explanation of 2020 Change from 2019
(in millions of $)1 Revenues
Decrease due to one-time transfer from Multi-Family Dwelling Investment Reserve in 2019
(0.315)
(0.315)
2 ExpensesTransfer to Capital 0.150Increase in salaries and benefits 0.076Miscellaneous adjustments 0.052
0.278
Full-time Equivalent PositionsDecrease of 1 FTE due to refinement of service based view.
2-40 Preliminary 2020 Budget - Service Based

City Planning
Service Detail
Sub-service (in millions of $)2018
Actual2019
Budget
2020Preliminary
Budget2021
Projection2022
Projection2023
ProjectionArea Dev & Renewal Planning
Revenue 0.003 0.195 - - - -Operating expenses 1.532 1.088 1.158 1.186 1.207 1.232Transfer to Capital - 0.074 0.125 0.021 0.042 0.030
1.529 0.967 1.282 1.207 1.249 1.261
City-wide Long Range Planning
Revenue 0.004 0.120 - - - -Operating expenses 0.568 0.952 1.009 1.031 1.041 1.060Transfer to Capital - 0.047 0.147 0.014 0.026 0.018
0.564 0.879 1.156 1.045 1.067 1.077Mill Rate Support/(Contribution) 2.093 1.846 2.439 2.252 2.316 2.339
Preliminary 2020 Budget - Service Based 2-41

Neighbourhood RevitalizationIncludes:
• Housing Initiatives
Description Key GoalsProvide neighbourhood residents with tools and support to build resilient, healthy communities and to promote and deliver community based projects and programs that support sustainable neighbourhoods and healthy communities. Service activities include the administration of Council's neighbourhood and housingprogramsincluding,butnotlimitedto:- HousingRenewal,BuildingCommunitiesandAffordableHousingInitiatives- ResidentialInfillTaxCreditProgram- NeighbourhoodMulti-Family/Mixed-UseBuildingGrantProgram- DowntownMulti-Family/Mixed-UseBuildingGrantProgram- DowntownResidentialDevelopmentGrantProgram- Live Downtown - Rental Development GrantProgram- Strategic Economic Incentives - Project SpecificGrants
1. Increase community confidence in theirneighbourhood and encourage residents to remainand invest in their own communities.
2. Encourage and promote community involvement indefining neighbourhood values and needs andprioritizing neighbourhood infrastructure improvementprojects that meet those values and needs.
3. Participate directly in the revitalization of thedowntown as a collection of vibrant residentialneighbourhoods.
Service Level StatisticsDescription 2016 2017 2018Targeted Development Programs/projects- # of units created 297 147 192Housing Reserve - $ invested in neighbourhood revitalization and Indigenous housing via housing coordination, infill development, fix up grants, etc. $635,628 $680,196 $846,770Building Communities Funding ($ 000's) / Projects completed $1,885 / 12 $580 / 7 $836 / 1
2-42 Preliminary 2020 Budget - Service Based

Neighbourhood RevitalizationContributing DepartmentsPlanning, Prop. & Devl. 100 %
Operating Budget
(in millions of $)2018
Actual2019
Budget
2020Preliminary
Budget Expl.2021
Projection2022
Projection2023
ProjectionService revenue 0.687 0.152 0.162 0.162 0.162 0.162Provincial funding (service specific) - - - - - -Revenues 0.687 0.152 0.162 1 0.162 0.162 0.162Salaries and benefits 0.638 0.194 0.077 0.078 0.078 0.080Services 0.702 0.677 0.653 0.653 0.653 0.653Materials, parts, and supplies 0.003 0.002 - - - -Assets and purchases 0.001 - - - - -Debt and finance charges 0.031 0.039 0.033 0.035 0.035 0.035Grants, tranfers and other 0.240 1.195 1.166 1.166 1.166 1.166Recoveries (0.010) (0.016) (0.016) (0.016) (0.016) (0.017)Operating expenses 1.606 2.091 1.913 1.916 1.917 1.918Transfer to Capital - - - - - -Total Expenses 1.606 2.091 1.913 2 1.916 1.917 1.918Mill Rate Support/(Contribution) 0.919 1.939 1.751 1.754 1.754 1.756Full-time Equivalent Positions 8 2 1 1 1 1
Explanation of 2020 Change from 2019
(in millions of $)1 Revenues
Transfer from Housing Reserve related to the Winnipeg Housing Rehabilitation Corp (WHRC) Grant
0.162
Decrease due to expiration of Homelessness Partnering Strategy agreement March 31, 2019
(0.152)
0.010
2 ExpensesDecrease in salaries and benefits, and other expenses due to the expiration of the Homelessness Partnering Strategy agreement March 31, 2019
(0.178)
(0.178)
Full-time Equivalent PositionsDecrease of 1 FTE due to the expiration of the Homelessness Partnering Strategy agreement March 31, 2019.
Preliminary 2020 Budget - Service Based 2-43

Neighbourhood Revitalization
Additional Financial Information
Reserves
Balance, December 31 (in millions of $)2018
Actual2019
Forecast
2020Preliminary
Budget2021
Projection2022
Projection2023
ProjectionHousing Rehab Invest Reserve 3.134 1.556 1.372 1.236 1.099 0.961Multi-Family Dwell Tax Inv Res 1.469 0.391 0.674 1.292 1.836 2.585
Capital Budget2020
Preliminary2021-2025Forecast
6 YearTotal
(In millions of $) 1.000 2.000 3.000
2-44 Preliminary 2020 Budget - Service Based

Development Approvals, Building Permits and InspectionsIncludes:
• Residential Development Approvals & Inspections• Commercial Development Approvals & Inspections
Description Key GoalsEnsure compliance with provincial building codes, by-laws and standards through consultation, education, administration, inspections and the regulatory enforcement of property standards, construction, renovation, and demolition of buildings. This service includes:
- Planexamination- Inspections for compliance with codes and otherby-lawstandards- Enforcement action including warnings, penalties,and charges
1. Ensure safe, healthy, accessible, and energy efficientbuildings through the administration and enforcementof building by-laws and property standards.
2. Continue to streamline the building permit applicationand approval process, and improve our ability toprovide timely inspection services and proactive by-law enforcement.
3. Continue to improve the comprehensive customerexperience, including providing clear information andcommunication, excellent customer service, andinnovative approaches.
4. Enhance the public's awareness of necessary safetyand non-safety-related building project requirements.
5. Pursue financial self-sufficiency.6. Transparency of actual performance to targets.
Service Level StatisticsDescription 2016 2017 2018Total New Dwelling Units Created 3,995 4,875 3,757Permit Volumes
Residential Permits Issued 6,917 7,100 6,897Non-Residential Permits Issued 3,251 3,615 3,351Other Permits Issued 20,835 23,239 24,423
Total Permits Issued 31,130 34,084 34,825Total Permit Fees ($) [A] 25,009,590 26,189,264 25,604,707Permit Values (in thousands of $)
Residential Permit Values 977,900 1,203,747 1,035,491Non-Residential Permit Values 1,039,764 890,191 833,420
Total Permit Values 2,017,665 2,093,938 1,868,912Plan Examination Volume (Number of Plans Reviewed): Residential 5,268 5,333 5,871 Commercial 6,784 7,524 7,805Total Plan Examination Volume 12,052 12,857 13,676Inspection Volume (Number Conducted):
Residential 75,031 79,097 96,160Commercial 46,909 47,115 47,902
Total Inspection Volume 121,940 126,212 144,062
[A] Does not include impact fees.
Preliminary 2020 Budget - Service Based 2-45

Development Approvals, Building Permits and InspectionsContributing DepartmentsPlanning, Prop. & Devl. 98 %Public Works 2 %
Operating Budget
(in millions of $)2018
Actual2019
Budget
2020Preliminary
Budget Expl.2021
Projection2022
Projection2023
ProjectionService revenue 27.881 28.779 29.020 29.697 30.143 30.695Provincial funding (service specific)
- - - - - -
Revenues 27.881 28.779 29.020 1 29.697 30.143 30.695Salaries and benefits 18.008 17.886 17.901 18.312 18.113 17.908Services 1.714 1.685 1.711 1.710 1.702 1.701Materials, parts and supplies 0.088 0.101 0.099 0.099 0.099 0.099Assets and purchases 0.084 0.081 0.081 0.081 0.081 0.081Debt and finance charges 0.311 0.322 0.318 0.319 0.319 0.319Grants, transfers and other 1.413 0.652 0.725 0.753 0.776 0.776Recoveries (0.487) (0.421) (0.377) (0.384) (0.381) (0.384)Operating expenses 21.130 20.306 20.458 20.890 20.710 20.501Transfer to Capital - 0.180 0.239 0.079 0.068 0.048Total Expenses 21.130 20.486 20.697 2 20.969 20.779 20.549Mill Rate Support/(Contribution) (6.751) (8.292) (8.323) (8.728) (9.365) (10.146)Full-time Equivalent Positions 218 210 206 206 196 189
Explanation of 2020 Change from 2019
(in millions of $)1 Revenues
Increase in regulation fee revenue due to inflation 0.739Decrease due to one-time transfer from Multi-Family Dwelling Investment Reserve in 2019
(0.315)
Decrease in transfer from Permit Reserve (0.203)Miscellaneous adjustments 0.020
0.241
2 ExpensesIncrease in civic accommodation charges 0.090Transfer to Capital 0.059Decrease in recoveries 0.044Increase in salaries and benefits 0.015Miscellaneous adjustments 0.003
0.211
Full-time Equivalent PositionsDecrease of 4 FTEs due to 1 FTE transferred to Community Services, and reduction of FTEs in Planning, Property and Development (in divisions other than Development and Inspections), 3 of which are allocated to this service.
2-46 Preliminary 2020 Budget - Service Based

Development Approvals, Building Permits and Inspections
Service detail
Sub-services (in millions of $)2018
Actual2019
Budget
2020Preliminary
Budget2021
Projection2022
Projection2023
ProjectionRes Dev Approvals & Inspection
Revenue 8.402 8.727 8.742 8.945 9.079 9.244Operating expenses 10.295 10.132 10.269 10.488 10.324 10.195Transfer to Capital - 0.087 0.152 0.039 0.033 0.023
1.893 1.493 1.679 1.582 1.278 0.974Com Dev Approvals & Inspection
Revenue 19.479 20.052 20.279 20.753 21.065 21.451Operating expenses 10.835 10.174 10.190 10.402 10.386 10.306Transfer to Capital - 0.093 0.087 0.040 0.036 0.025
(8.644) (9.785) (10.001) (10.311) (10.643) (11.120)Mill Rate Support/(Contribution) (6.751) (8.292) (8.323) (8.728) (9.365) (10.146)
Additional Financial Information
Reserves
Balance, December 31 (in millions of $)2018
Actual2019
Forecast
2020Preliminary
Budget2021
Projection2022
Projection2023
ProjectionPermit Reserve 1.376 2.000 0.800 - - -
Capital Budget2020
Preliminary2021-2025Forecast
6 YearTotal
(In millions of $) 1.215 2.966 4.181
Preliminary 2020 Budget - Service Based 2-47

Heritage Conservation
Description Key GoalsTo promote the long-term conservation of heritage assets in the City of Winnipeg.
1. Ensure the long-term conservation of heritage resources in Winnipeg through the implementation of new incentives, integrated planning, district/area designation, regulatory reforms, well established design standards and principled design review.
2. Be a catalyst for greater public awareness, education and participation in heritage conservation.
3. Improve the suitability of Heritage Buildings for occupancy by City Departments and other civic uses.
Service Level StatisticsDescription 2016 2017 2018Total Listed Historic Resources 269 294 315Total Nominated Resources 100 74 52Total Commemorated Resources 338 339 342Number of Nominated Resources Added to the List of Historical Resources 15 25 21Number of Heritage Resources De-Listed 0 0 0Number of Buildings Receiving Heritage Tax-based Incentives for Capital Projects [A] 27 25 15Number of Heritage Permits Issued 56 61 58Number of Projects Awarded under the Gail Parvin Hammerquist Fund City-wide Program:
a. Capital Project Grants 9 4 4b. Research and Interpretive Grants 5 5 2
[A] Reflects the total number of buildings actively receiving the Heritage Conservation Tax Credit or the Heritage Conservation Grant Program.
2-48 Preliminary 2020 Budget - Service Based

Heritage ConservationContributing DepartmentsPlanning, Prop. & Devl. 100 %
Operating Budget
(in millions of $)2018
Actual2019
Budget
2020Preliminary
Budget Expl.2021
Projection2022
Projection2023
ProjectionService revenue 0.003 0.120 - - - -Provincial funding (service specific)
- - - - - -
Revenues 0.003 0.120 - 1 - - -Salaries and benefits 0.211 0.231 0.267 0.272 0.254 0.259Services 0.010 0.012 0.012 0.012 0.012 0.012Materials, parts, and supplies 0.001 0.001 0.001 0.001 0.001 0.001Assets and purchases - - - - - -Debt and finance charges 0.004 0.005 0.004 0.004 0.004 0.004Grants, transfers and other 0.066 0.044 0.046 0.046 0.046 0.046Recoveries (0.034) (0.028) (0.029) (0.038) (0.027) (0.028)Operating expenses 0.258 0.266 0.302 0.298 0.291 0.295Transfer to Capital - 0.043 0.164 0.011 0.026 0.018Total Expenses 0.258 0.309 0.466 2 0.309 0.317 0.314Mill Rate Support/(Contribution) 0.255 0.189 0.466 0.309 0.317 0.314Full-time Equivalent Positions 2 2 3 3 2 2
Explanation of 2020 Change from 2019
(in millions of $) 1 Revenues
Decrease due to one-time transfer from Multi-Family Dwelling Tax Investment Reserve in 2019
(0.120)
(0.120)
2 ExpensesTransfer to Capital 0.121Miscellaneous adjustments 0.036
0.157
Full-time Equivalent PositionsIncrease of 1 FTE due to refinement of service based view.
Additional Financial Information
Reserves
Balance, December 31 (in millions of $)2018
Actual2019
Forecast
2020Preliminary
Budget2021
Projection2022
Projection2023
ProjectionHeritage Investment Reserve 0.062 (0.190) 0.035 0.001 0.015 0.027
Capital Budget2020
Preliminary2021-2025Forecast
6 YearTotal
(In millions of $) 0.100 0.100Preliminary 2020 Budget - Service Based 2-49
-

Property Asset ManagementIncludes:
• Land & Property • Arena Facilities• Municipal Accommodations • Recreation Centres• Pool Facilities • Community Centre Facilities
Description Key GoalsThe Property Asset Management Service facilitates the acquisition, development, operation, maintenance, security and disposition of City-owned land and buildings. The service is composed of two sub-services:REAL ESTATE: administers the sale and leasing of City-owned property; negotiates property acquisition or real estate appraisals on behalf of civic departments.MUNICIPAL ACCOMMODATIONS: manages leases, operates, maintains, protects and preserves the City's physical building infrastructure/assets to provide for current and future program accommodation needs and provides design and project management of new and existing civic buildings.
1. Migrate the Real Estate Transaction Management Framework (RETMF) into the Department's AMANDA software.
2. Optimize infrastructure condition through a Physical Asset Management Program for City buildings.
3. Provide effective facilities management.4. Develop and implement environmental stewardship
policies and programs to guide the management and maintenance of all new and existing City facilities.
5. Update and modernize existing real estate policies to reflect current practices and needs.
Service Level StatisticsDescription 2016 2017 2018Real Estate Property Sales / Gross Revenues from Sales Closed 31 / $11.3M 30 / $15.6M 21 / $8.0MNumber of Leases Approved / Annual Lease Revenue 33 / $6,444 41 / $116,550 25 / $94,095Municipal Accommodations Estimated Market Value $3 - $4B $3 - $4B $3 - $4BNumber of Buildings / Total Square Footage (Owned & Leased) 1,034 / 7.7M sq ft 1,188 / 7.7M sq ft 1,059 / 8.3M sq ft
NOTE: M=millionsB = billions
2-50 Preliminary 2020 Budget - Service Based
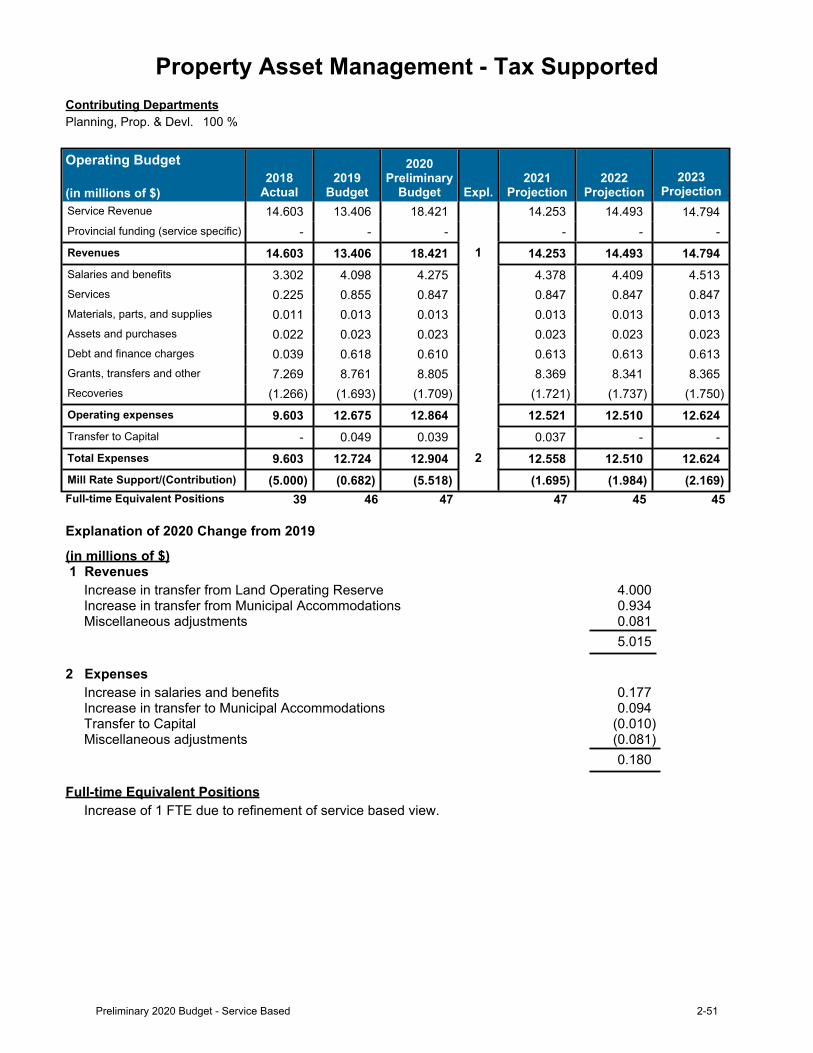
Property Asset Management - Tax SupportedContributing DepartmentsPlanning, Prop. & Devl. 100 %
Operating Budget
(in millions of $)2018
Actual2019
Budget
2020Preliminary
Budget Expl.2021
Projection2022
Projection2023
ProjectionService Revenue 14.603 13.406 18.421 14.253 14.493 14.794Provincial funding (service specific) - - - - - -Revenues 14.603 13.406 18.421 1 14.253 14.493 14.794Salaries and benefits 3.302 4.098 4.275 4.378 4.409 4.513Services 0.225 0.855 0.847 0.847 0.847 0.847Materials, parts, and supplies 0.011 0.013 0.013 0.013 0.013 0.013Assets and purchases 0.022 0.023 0.023 0.023 0.023 0.023Debt and finance charges 0.039 0.618 0.610 0.613 0.613 0.613Grants, transfers and other 7.269 8.761 8.805 8.369 8.341 8.365Recoveries (1.266) (1.693) (1.709) (1.721) (1.737) (1.750)Operating expenses 9.603 12.675 12.864 12.521 12.510 12.624Transfer to Capital - 0.049 0.039 0.037 - -Total Expenses 9.603 12.724 12.904 2 12.558 12.510 12.624Mill Rate Support/(Contribution) (5.000) (0.682) (5.518) (1.695) (1.984) (2.169)Full-time Equivalent Positions 39 46 47 47 45 45
Explanation of 2020 Change from 2019
(in millions of $) 1 Revenues
Increase in transfer from Land Operating Reserve 4.000Increase in transfer from Municipal Accommodations 0.934Miscellaneous adjustments 0.081
5.015
2 ExpensesIncrease in salaries and benefits 0.177Increase in transfer to Municipal Accommodations 0.094Transfer to Capital (0.010)Miscellaneous adjustments (0.081)
0.180
Full-time Equivalent PositionsIncrease of 1 FTE due to refinement of service based view.
Preliminary 2020 Budget - Service Based 2-51

Property Asset Management - Tax Supported
Service Detail
Sub-services (in millions of $)2018
Actual2019
Budget
2020Preliminary
Budget2021
Projection2022
Projection2023
ProjectionMunicipal Accommodations
Revenue 12.296 10.029 10.964 9.726 9.896 10.124Operating expenses 7.745 9.116 9.206 8.770 8.756 8.780Transfer to Capital - 0.024 0.019 0.018 - -
(4.551) (0.889) (1.739) (0.938) (1.140) (1.344)Land and Property Revenue 2.306 3.377 7.458 4.527 4.597 4.669
Operating expenses 1.857 3.559 3.659 3.751 3.753 3.844Transfer to Capital - 0.025 0.020 0.019 - -
(0.450) 0.208 (3.778) (0.757) (0.844) (0.825)Mill Rate Support/(Contribution) (5.000) (0.682) (5.518) (1.695) (1.984) (2.169)
Additional Financial Information
Reserves
Balance, December 31 (in millions of $)2018
Actual2019
Forecast
2020Preliminary
Budget2021
Projection2022
Projection2023
ProjectionLand Operating Reserve 17.434 29.005 29.075 30.549 34.750 39.210
Capital Budget2020
Preliminary2021-2025Forecast
6 YearTotal
(In millions of $) 0.106 0.200 0.306
2-52 Preliminary 2020 Budget - Service Based

Property Asset Management - Municipal AccommodationsContributing DepartmentsPlanning, Prop. & Devl. 100 %
Operating Budget
(in millions of $)2018
Actual2019
Budget
2020Preliminary
Budget Expl.2021
Projection2022
Projection2023
ProjectionService revenue 70.773 72.083 72.048 71.696 72.508 74.196Provincial funding (service specific) 0.357 0.359 0.359 0.359 0.359 0.359Revenues 71.130 72.443 72.407 1 72.055 72.867 74.555Salaries and benefits 20.275 20.441 20.718 21.001 21.432 21.677Services 26.280 30.486 30.266 29.720 30.153 31.419Materials, parts, supplies 7.877 6.250 6.209 6.213 6.283 6.351Assets and purchases 0.018 0.030 0.030 0.030 0.030 0.030Debt and finance charges 4.753 4.829 4.866 5.009 5.019 5.019Grants, transfers and other 14.621 11.411 12.170 10.938 11.107 11.336Recoveries (3.707) (3.260) (3.020) (3.035) (3.044) (3.053)Operating expenses 70.118 70.187 71.238 69.877 70.980 72.779Transfer to Capital 1.012 2.256 1.169 2.178 1.887 1.776Total Expenses 71.130 72.443 72.407 2 72.055 72.867 74.555Surplus/(Deficit) - - - - - -Full-time Equivalent Positions 281 289 286 286 286 285
Explanation of 2020 Change from 2019
(in millions of $) 1 Revenues
0.720
0.225(0.107)(0.138)(0.477)
Increase in transfer from Community Services for facilities operations and maintenanceIncrease in transfer from General Revenue Fund for accommodation charges Decrease in transfer from Fleet Management AgencyDecrease in transfer from Parks and Open SpacesDecrease in transfer from Community Services for CapitalMiscellaneous adjustments (0.259)
(0.036)
2 ExpensesIncrease in transfer to General Revenue Fund (Provision) due primarily to decrease in cash-to-capital transfer
0.934
Increase in salaries and benefits 0.277Transfer to Capital (1.087)Decrease in rentals (0.167)Decrease in fleet leases and other fleet related costs (0.137)Miscellaneous adjustments 0.144
(0.036)
Full-time Equivalent PositionsDecrease of 2 Project Officer positions due to reduced capital reinvestment budget and 1 Building Servicer FTE attributable to the closure of Terry Sawchuk Arena.
Preliminary 2020 Budget - Service Based 2-53

Property Asset Management - Municipal Accommodations
Service Detail
Sub-services (in millions of $)2018
Actual2019
Budget
2020Preliminary
Budget2021
Projection2022
Projection2023
ProjectionMunicipal Accommodations
Revenue 51.088 50.830 50.553 49.788 50.070 51.294Operating expenses 49.795 49.302 49.262 47.635 48.207 49.548Transfer to Capital 1.012 1.779 1.169 2.178 1.887 1.776
0.280 (0.251) 0.123 (0.025) (0.024) (0.030)Pool Facilties Revenue 13.450 14.315 14.352 14.690 15.032 15.334
Operating expenses 12.364 13.609 14.443 14.692 15.036 15.337Transfer to Capital - 0.459 - - - -
1.087 0.248 (0.092) - (0.003) (0.003)Arena Facilities Revenue 4.120 4.643 4.751 4.763 4.887 4.993
Operating expenses 5.414 4.634 4.764 4.739 4.865 4.968Transfer to Capital - 0.012 - - - -
(1.294) (0.003) (0.013) 0.024 0.022 0.026Recreation Centres
Revenue 1.241 1.367 1.403 1.441 1.481 1.512Operating expenses 1.626 1.378 1.413 1.441 1.478 1.507Transfer to Capital - 0.004 - - - -
(0.385) (0.016) (0.011) - 0.003 0.004Community Centre Facilities
Revenue 1.231 1.287 1.349 1.373 1.397 1.422Operating expenses 0.919 1.264 1.356 1.370 1.395 1.419Transfer to Capital - 0.002 - - - -
0.312 0.021 (0.007) 0.002 0.003 0.003Surplus/(Deficit) - - - - - -
Additional Financial Information
Capital Budget2020
Preliminary2021-2025Forecast
6 YearTotal
(In millions of $) 4.607 9.390 13.997
2-54 Preliminary 2020 Budget - Service Based

CemeteriesIncludes:
• Brookside Cemetery• St. Vital Cemetery• Transcona Cemetery
Description Key GoalsProvides interment services and perpetually maintained cemeteries in order to ensure that all citizens have access to a range of choices in intermentservices.Serviceactivitiesinclude:-Interments-Saleofplots/lots,nichesandintermentvaults-Collectionoffeesandcharges-Maintainingandpreservingintermentrecords-Intermentsearches-Installationofflatmarkermemorials-ToursofBrooksideCemeteryFieldofHonour-Facilitationofopenairmemorialservices-Custodianofhistoricalmilitarymonuments-Designandpreparationoffutureintermentsites-Facilitiesandphysicalsiteimprovements- Perpetual maintenance of cemetery grounds
1. Ensure that the service evolves to reflect the diversity of the community and increase public awareness.
2. Increase revenues to enable self sufficiency while continuing to act as a benchmark for cemetery services within Winnipeg.
3. Continue to develop environmentally sound work processes and practices.
4. Maintain the heritage of cemeteries and continue to promote their significance in the community.
Service Level StatisticsDescription 2016 2017 2018Lineal Feet of New Poured in Place Monument Beam Foundation Installed, in Public Sections [A] 401 0 353Lineal Feet of New Field of Honour Precast Beam foundation installed [B] 176 0 3,104Number of Individual Foundations Installed 60 54 34Number of Educational Tours 15 15 0Number of Interment Sites Re-leveled and Re-seeded 1,254 1,104 1,025Number of Field of Honour Interment Sites re-landscaped 250 400 440Number of Trees Planted 90 100 120Lineal feet of existing Field of Honour Precast Beam refurbished 2,128 88 1,812
[A] Variance due to poured in place foundations for public being installed in accordance with demand and operational needs.[B] Variance due to a 4-year project with Veterans Affairs Canada to replace the foundations of over 7,000 veterans which began in
2018.
Preliminary 2020 Budget - Service Based 2-55

CemeteriesContributing DepartmentsPlanning, Prop. & Devl. 100 %
Operating Budget
(in millions of $)2018
Actual2019
Budget
2020Preliminary
Budget Expl.2021
Projection2022
Projection2023
ProjectionService revenue 1.953 1.760 1.780 1.817 1.855 1.894Provincial funding (service specific)
- - - - - -
Revenues 1.953 1.760 1.780 1 1.817 1.855 1.894Salaries and benefits 1.736 1.732 1.710 1.742 1.776 1.808Services 0.521 0.511 0.459 0.440 0.435 0.446Materials, parts and supplies 0.194 0.100 0.129 0.132 0.133 0.133Assets and purchases 0.003 0.007 0.007 0.007 0.007 0.004Debt and finance charges 0.041 0.042 0.039 0.041 0.041 0.036Grants, transfers and other 0.162 0.184 0.188 0.191 0.195 0.197Recoveries (0.026) (0.040) (0.040) (0.040) (0.040) (0.041)Operating expenses 2.631 2.536 2.493 2.512 2.548 2.582Transfer to Capital - 0.243 0.250 0.238 - -Total Expenses 2.631 2.778 2.743 2 2.750 2.548 2.582Mill Rate Support/(Contribution) 0.679 1.018 0.963 0.933 0.693 0.688Full-time Equivalent Positions 27 25 24 24 24 24
Explanation of 2020 Change from 2019
(in millions of $)1 Revenues
Increase in Cemeteries revenue due to inflation offset by decreased transfer to Perpetual Maintenance Reserve
0.020
0.020
2 ExpensesIncrease in materials, parts and supplies 0.029Decrease in services (0.052)Decrease in salaries and benefits (0.022)Miscellaneous adjustments 0.010
(0.035)
Full-time Equivalent PositionsDecrease of 1 FTE - Cemeteries Customer Service Representative.
2-56 Preliminary 2020 Budget - Service Based

Cemeteries
Additional Financial Information
Reserves
Balance, December 31 (in millions of $)2018
Actual2019
Forecast
2020Preliminary
Budget2021
Projection2022
Projection2023
ProjectionPerpetual Mtce-Brookside Cem 17.210 17.637 18.025 18.442 18.869 19.306Perpetual Mtce-St Vital Cem 1.224 1.276 1.319 1.363 1.408 1.455Perpetual Mtce-Transona Cem 0.854 0.900 0.934 0.968 1.003 1.039
Capital Budget2020
Preliminary2021-2025Forecast
6 YearTotal
(In millions of $) 1.048 1.086 2.134
Preliminary 2020 Budget - Service Based 2-57

2-58 Preliminary 2020 Budget - Service Based

Police ResponseIncludes:
• Police Response• Contract Policing• Crime Investigation• Police Training
Description Key GoalsThe Winnipeg Police Service (WPS) provides emergency, urgent, and non-urgent responses to public calls for service. In addition, the Service undertakes criminal investigations, offender identification, arrest or other resolution. The Service is also responsible for training all police and civilian members of the WPS. The Service must marshal its resources appropriately and efficiently to ensure that response is always available to answer to public needs.Per The Police Services Act 29 (2) Council is responsible for establishing the total budget for the police service and (3) the police board is responsible for allocating the funds.
1. Address crime through evidence-based policing strategies.
2. Ensure people are in the right jobs in the right numbers.
3. Enhance training and professionalism in the Service.
Service Level StatisticsDescription 2016 2017 2018Police Officer Complement (Authorized) 1,421 1,412 1,360Civilian Staff Complement (Authorized) 504 551 554Police Officer to Civilian Staff Ratio 2.8:1 2.6:1 2.5:1Police Officer to Population Ratio (per 100,000) 197 192 181.4Total Calls for Service to the Communications Centre 578,607 585,984 618,321Total Dispatched and Police-Initiated Calls 205,641 225,129 225,204
% of Total Calls 35.5% 38.4% 36.4Police-Initiated Events 68,164 80,540 75,320
% of Dispatched Call and Police-Initiated Calls 33.1% 35.8% 33.4Citizen Generated Events 137,476 144,591 149,884
% of Dispatched Call and Police-Initiated Calls 66.9% 64.2% 66.6Dispatched via Alternate Phone Response (APR) 2,237 3,002 7,934
% of Dispatched Call and Police-Initiated Calls 1.1% 1.3% 3.5Dispatched and Police-Initiated Calls by Priority Level
Priority 0 to 2: Emergency 17,726 21,535 19,823Priority 3 to 4: Urgent 76,221 79,669 84,564Priority 5 to 9: Non-Urgent 111,694 123,927 120,817
Preliminary 2020 Budget - Service Based 2-59

Police ResponseContributing DepartmentsPolice 100 %
Operating Budget
(in millions of $)2018
Actual2019
Budget
2020Preliminary
Budget Expl.2021
Projection2022
Projection2023
ProjectionService revenue 5.744 5.339 5.738 5.743 5.858 5.828Provincial funding (service specific) 19.862 18.992 19.179 18.992 18.992 18.992Revenues 25.606 24.330 24.917 1 24.735 24.850 24.819Salaries and benefits 201.321 210.132 211.619 215.605 217.989 225.055Services 10.677 11.650 11.781 11.965 11.968 11.824Materials, parts, and supplies 5.166 5.004 5.126 4.980 5.026 5.145Assets and purchases 1.538 1.501 1.474 1.630 1.630 1.630Debt and finance charges 8.809 9.201 7.995 8.623 9.173 9.303Grants, transfers and other 9.553 8.708 8.918 8.555 8.683 9.761Recoveries (0.569) (0.503) (0.503) (0.503) (0.503) (0.503)Operating expenses 236.495 245.693 246.410 250.855 253.966 262.215Transfer to Capital 3.277 2.900 1.625 4.990 5.047 3.034Total Expenses 239.772 248.593 248.035 2 255.845 259.013 265.249Mill Rate Support/(Contribution) 214.166 224.262 223.118 231.110 234.163 240.430Full-time Equivalent Positions 1,548 1,565 1,554 1,554 1,554 1,554
Explanation of 2020 Change from 2019
(in millions of $)1 Revenues
Increase in service revenue - special duty, alarm permit renewal and inflation 0.400Increase in provincial funding - Federal Guns & Gangs Initiative 0.187
0.587
2 ExpensesIncrease in salaries and benefits net of reallocation of 10 positions to Crime Prevention Service
1.487
Increase in office equipment maintenance relating to IT maintenance contracts 0.339Increase in rentals for Active Response Training 0.196Transfer to Capital (1.275)Decrease in debt and finance charges (1.206)Miscellaneous adjustments (0.099)
(0.558)
Full-time Equivalent PositionsDecrease due to transfer of 10 FTEs within the Police Service to Crime Prevention and refinement of service based view.
2-60 Preliminary 2020 Budget - Service Based

Police Response
Service Detail
Sub-services (in millions of $)2018
Actual2019
Budget
2020Preliminary
Budget2021
Projection2022
Projection2023
ProjectionPolice Response Revenue 20.756 19.415 19.523 19.492 19.498 19.462
Operating expenses 149.301 157.972 154.730 157.132 157.033 163.196Transfer to Capital 3.277 2.900 1.625 4.990 5.047 3.034
131.822 141.457 136.832 142.630 142.581 146.768Contract Policing Revenue 1.602 1.584 1.711 1.749 1.791 1.808
Operating expenses 0.263 1.298 0.454 0.463 0.481 0.489Transfer to Capital - - - - - -
(1.339) (0.286) (1.257) (1.286) (1.311) (1.319)Crime Investigation
Revenue 3.201 3.281 3.566 3.378 3.442 3.434Operating expenses 78.916 78.904 82.785 84.671 87.617 89.586Transfer to Capital - - - - - -
75.715 75.623 79.219 81.292 84.175 86.152Police Training Revenue 0.047 0.051 0.117 0.115 0.118 0.115
Operating expenses 8.015 7.519 8.441 8.589 8.835 8.943Transfer to Capital - - - - - -
7.968 7.468 8.324 8.474 8.717 8.828Mill Rate Support/(Contribution) 214.166 224.262 223.118 231.110 234.163 240.430
Additional Financial Information
Capital Budget2020
Preliminary2021-2025Forecast
6 YearTotal
(In millions of $) 2.966 17.824 20.790
Preliminary 2020 Budget - Service Based 2-61

Crime PreventionIncludes:
• Community Policing• Street Lighting• Crime Prevention Initiatives
Description Key GoalsPromote safer communities through engagement, education,andproactivepolicing.
Per The Police Services Act 29 (2) Council is responsible for establishing the total budget for the police service and (3) the police board is responsible for allocating the funds.
1. Promote positive interaction with the community.2. Strengthen proactive policing.3. Increase effectiveness of street lighting.
Service Level StatisticsDescription 2016 2017 2018Community PolicingNumber of Followers on Social Media Platforms 88,998 111,000 118,591Thunderwing: Number of referrals 6 29 54Citizen Survey: WPS Trustworthy (% of respondents believe WPS is trustworthy) [A] N/A 72.9% N/ACitizen Survey: WPS Confidence (% of respondents have confidence in WPS) [A] N/A 91.3% N/ACitizen Survey: WPS Service Quality (% of respondents rated WPS' Service Quality excellent/good) [A] N/A 72.9% N/ANumber of proactive and reactive events in Centreline 3,967Joint projects for Highway Traffic Act and impaired driving enforcement 102Public website development: hits, page views, engagement from social media 191,230Counter Exploitation Unit/Missing Persons Unit interventions 1022Number of WPS Diversions 401Number of arrests that involve illicit drugs 1,091Proactive PolicingTotal Proactive target driven events: Special Policing Initiatives Events 21,166 24,001 20,372Street Lighting [B]Number of Street Lights, Lane Lights and Pathway Lights [C] 75,094 76,872 76,680Number of Lighting Complaints Requiring a Lighting Upgrade 11 44 85Number of Lighting Complaints 62 122 177Prevention & Intervention: Missing Person Incidents 9,776 10,990 7,361
[A] The Winnipeg Police Service (WPS) conducts the survey every second year.[B] Data supplied by the Public Works Department.[C] Includes all street and lane lighting, decorative lighting and pathway lighting.Note: The Winnipeg Police Board established a number of new measures for Service Level Statistics in 2018. Consequently,
historic data are not available for these measures.
2-62 Preliminary 2020 Budget - Service Based
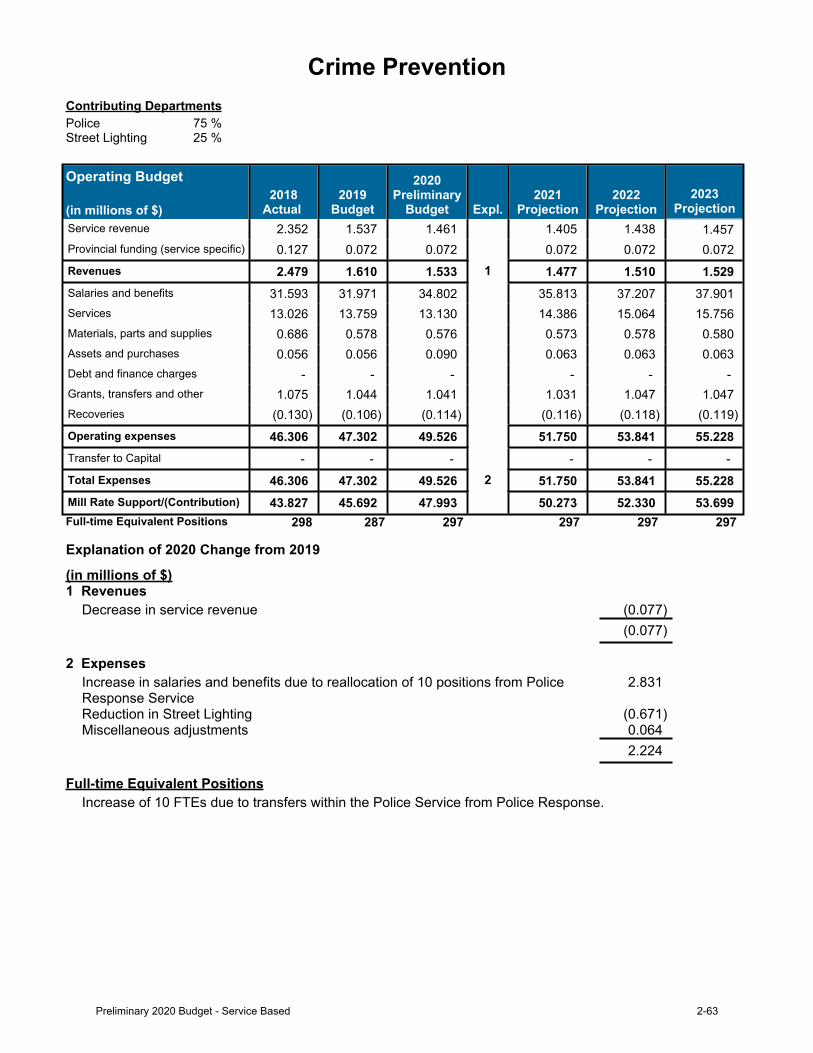
Crime PreventionContributing DepartmentsPolice 75 %Street Lighting 25 %
Operating Budget
(in millions of $)2018
Actual 2019
Budget
2020Preliminary
Budget Expl.2021
Projection2022
Projection2023
ProjectionService revenue 2.352 1.537 1.461 1.405 1.438 1.457Provincial funding (service specific) 0.127 0.072 0.072 0.072 0.072 0.072Revenues 2.479 1.610 1.533 1 1.477 1.510 1.529Salaries and benefits 31.593 31.971 34.802 35.813 37.207 37.901Services 13.026 13.759 13.130 14.386 15.064 15.756Materials, parts and supplies 0.686 0.578 0.576 0.573 0.578 0.580Assets and purchases 0.056 0.056 0.090 0.063 0.063 0.063Debt and finance charges - - - - - -Grants, transfers and other 1.075 1.044 1.041 1.031 1.047 1.047Recoveries (0.130) (0.106) (0.114) (0.116) (0.118) (0.119)Operating expenses 46.306 47.302 49.526 51.750 53.841 55.228Transfer to Capital - - - - - - Total Expenses 46.306 47.302 49.526 2 51.750 53.841 55.228Mill Rate Support/(Contribution) 43.827 45.692 47.993 50.273 52.330 53.699Full-time Equivalent Positions 298 287 297 297 297 297
Explanation of 2020 Change from 2019
(in millions of $)1 Revenues
Decrease in service revenue (0.077)(0.077)
2 ExpensesIncrease in salaries and benefits due to reallocation of 10 positions from Police Response Service
2.831
Reduction in Street Lighting (0.671)Miscellaneous adjustments 0.064
2.224
Full-time Equivalent PositionsIncrease of 10 FTEs due to transfers within the Police Service from Police Response.
Preliminary 2020 Budget - Service Based 2-63

Crime Prevention
Service Detail
Sub-services (in millions of $)2018
Actual2019
Budget
2020Preliminary
Budget2021
Projection2022
Projection2023
ProjectionCommunity Policing
Revenue 0.506 0.464 0.445 0.426 0.436 0.439Operating expenses 28.273 27.771 30.377 31.229 32.394 32.950Transfer to Capital - - - - - -
27.766 27.306 29.932 30.803 31.957 32.511Street Lighting Revenue - - - - - -
Operating expenses 12.425 13.116 12.445 13.681 14.350 15.052Transfer to Capital - - - - - -
12.425 13.116 12.445 13.681 14.350 15.052Crime Prevention Initiatives
Revenue 1.973 1.146 1.088 1.051 1.074 1.090Operating expenses 5.609 6.415 6.703 6.841 7.098 7.226Transfer to Capital - - - - - -
3.636 5.270 5.615 5.789 6.023 6.136Mill Rate Support/(Contribution) 43.827 45.692 47.993 50.273 52.330 53.699
2-64 Preliminary 2020 Budget - Service Based

Traffic Safety and EnforcementIncludes:
• Traffic Safety & Enforcement - Automated• Traffic Safety & Enforcement - Officer• Traffic Safety & Enforcement - Division
Description Key GoalsTo improve traffic safety through focusing efforts on enforcementandeducation.
Per The Police Services Act 29 (2) Council is responsible for establishing the total budget for the police service and (3) the police board is responsible for allocating the funds.
1. Explore data driven approaches to traffic safety.2. Set enforcement priorities.
Service Level StatisticsDescription 2016 2017 2018General Traffic EnforcementTotal Number of Traffic Stops 28,981 33,752 29,556Highway Traffic Act Provincial Offence Notices Issued 43,462 45,803 N/AHighway Traffic Act Warnings Issued 9,940 9,940 9,808Percentage of Notices Issued 65.7% 70.5% N/APhoto Enforcement Reduced School Zone 53,263 50,125 41,784All Other Zones 45,530 47,196 55,378Intersection Safety CamerasSpeeding 35,411 34,132 34,010Red Light 10,098 10,154 9,856Criminal Code Driving OffencesPersons Charged with Impaired Driving 479 440 439Persons Charged with Other Criminal Code Driving Offences 259 228 382EducationNumber of Safe Driving Public Service Announcements [A] 1,118 1,214 2,142
Note: SourcesforServiceLevelStatistics:WinnipegPoliceServiceAnnualStatisticalReportsWinnipegPoliceCentralTrafficUnitPhotoEnforcementSafetyProgramAnnualReport:JustSlowDownDue to the change in provincial regulations, Provincial based Offences are unavailable at time of printing.
[A] 2016 restated to reflect changed reporting methodology.
Preliminary 2020 Budget - Service Based 2-65

Traffic Safety and EnforcementContributing DepartmentsPolice 100 %
Operating Budget
(in millions of $)2018
Actual2019
Budget
2020Preliminary
Budget Expl.2021
Projection2022
Projection2023
ProjectionService revenue 19.892 20.195 20.057 19.659 19.670 19.668Provincial funding (service specific) - - - - - -Revenues 19.892 20.195 20.057 1 19.659 19.670 19.668Salaries and benefits 11.348 12.859 13.237 13.593 14.119 14.377Services 5.386 5.652 5.536 5.405 5.398 5.390Materials, parts, and supplies 0.157 0.193 0.188 0.189 0.192 0.193Assets and purchases 0.028 0.058 0.047 0.047 0.047 0.047Debt and finance charges - - - - - -Grants, transfers and other 0.402 0.402 0.403 0.404 0.406 0.406Recoveries (0.021) (0.012) (0.012) (0.012) (0.012) (0.012)Operating expenses 17.302 19.152 19.399 19.626 20.151 20.402Transfer to Capital - - - - - -
Total Expenses 17.302 19.152 19.399 2 19.626 20.151 20.402Mill Rate Support/(Contribution) (2.591) (1.043) (0.658) (0.033) 0.481 0.734
Full-time Equivalent Positions 84 91 91 91 91 91
Explanation of 2020 Change from 2019
(in millions of $)1 Revenues
Decrease in photo enforcement revenue (0.400)Increase in police services revenue - for number of escorts and inflation 0.265Miscellaneous adjustments (0.003)
(0.138)
2 ExpensesIncrease in salaries and benefits 0.378Decrease in non-professional services (related to decrease in photo enforcement revenue)
(0.133)
Miscellaneous adjustments 0.0020.247
2-66 Preliminary 2020 Budget - Service Based

Traffic Safety and Enforcement
Service Detail
Sub-services (in millions of $)2018
Actual2019
Budget
2020Preliminary
Budget2021
Projection2022
Projection2023
ProjectionTraffic Safety-Automated
Revenue 16.470 16.200 15.800 15.400 15.400 15.400Operating expenses 5.829 6.086 5.889 5.770 5.797 5.809Transfer to Capital - - - - - -
(10.641) (10.114) (9.911) (9.630) (9.603) (9.591)Traffic Safety-Officer
Revenue 3.422 3.995 4.257 4.259 4.270 4.268Operating expenses 11.473 13.066 13.510 13.856 14.354 14.593Transfer to Capital - - - - - -
8.051 9.071 9.253 9.596 10.084 10.325Traffic Safety-Division
Revenue - - - - - -Operating expenses - - - - - -Transfer to Capital - - - - - -
- - - - - -Mill Rate Support/(Contribution) (2.591) (1.043) (0.658) (0.033) 0.481 0.734
Preliminary 2020 Budget - Service Based 2-67

Fire and Rescue ResponseIncludes:
• Fire Investigation• Fire Paramedic Response• Fire Supression and Life Rescue• Specialty Rescue
Description Key GoalsTo provide quick, proficient, emergency and non-emergency fire suppression and rescue assistance to victims of fire, accidents, and other disasters or emergencies in order to prevent or minimize loss of life or property. This includes fire suppression, notification and evacuation of citizens, rescue services, including motor vehicle extrication, high angle, trench, water, and ice rescue, investigation and mitigation of carbon monoxide or other gas leaks, andotherhazardousmaterialsincidents.Additional contributions include standby fire and rescue service at public events, support to public education programs, supplement fire inspection and by-law enforcement program, fire investigation services potentially leading to offender identification, arrest and/or counselling in regard to incidents of deliberately set fires and response to medical emergencies.
1. Improve capacity to effectively respond to emergencies and disasters in a manner that is financially sustainable for the citizens of Winnipeg.
2. Invest in technology, equipment, and staff training to maximize safety for all emergency responders as well as the public.
3. Invest in technology, equipment, and staff training to protect the environment.
4. Ensure a respectful work environment and positive public image.
Service Level StatisticsDescription 2016 2017 2018Total Fires 1,496 1,560 1,837Alarm - No Fire 7,742 8,282 8,668Gas/Odor/Hazardous Materials Emergencies 809 934 1,058Miscellaneous Emergencies 4,649 4,668 5,024Rescue Emergencies 180 193 210Fire Investigations 330 359 365Arson Determinations [A] 515 436 441Emergency Medical Incidents - Fire Only Dispatched [B] 13,063 16,285 15,675Emergency Medical Incidents-Ambulance+Fire Dispatched [B] 38,378 42,150 44,287Fire Assisted Scheduled Inter-Facility Transfers [C] 18 8 6
[A] Source: Winnipeg Police Service (WPS), based on all charges to a maximum of four.[B] This measure was previously reported under the Medical Response section.[C] New measure
2-68 Preliminary 2020 Budget - Service Based

Fire and Rescue ResponseContributing DepartmentsFire Paramedic Service 100 %
Operating Budget
(in millions of $)2018
Actual *2019
Budget *
2020Preliminary
Budget Expl.2021
Projection2022
Projection2023
ProjectionService revenue 0.762 0.665 0.611 0.612 0.610 0.610Provincial funding (service specific) 4.029 4.027 4.027 4.027 4.027 4.027Revenues 4.791 4.692 4.638 1 4.639 4.637 4.637Salaries and benefits 116.300 118.782 121.143 125.114 127.436 129.793Services 5.998 6.254 7.317 7.336 6.708 6.597Materials, parts, and supplies 4.241 3.923 4.526 4.513 4.526 4.539Assets and purchases 0.398 0.348 0.221 0.221 0.221 0.221Debt and finance charges 0.868 1.669 2.595 3.747 4.534 5.159Grants, transfers and other 1.166 0.855 1.054 1.063 1.065 1.067Recoveries (0.108) (0.184) (0.183) (0.183) (0.183) (0.183)Operating expenses 128.863 131.648 136.673 141.811 144.307 147.193Transfer to Capital - - - - - -Total Expenses 128.863 131.648 136.673 2 141.811 144.307 147.193Mill Rate Support/(Contribution) 124.073 126.956 132.035 137.172 139.670 142.556Full-time Equivalent Positions 941 919 919 919 919 919
* Restated to align with 2020 Budget.
Explanation of 2020 Change from 2019
(in millions of $)1 Revenues
Miscellaneous adjustments (0.054)(0.054)
2 ExpensesIncrease in salaries and benefits 2.361Increase in debt and finance charges 0.926External fleet leasing 0.780Increase in vehicle parts and maintenance 0.425Increase in fleet leasing 0.292Increase in information technology equipment 0.287Miscellaneous adjustments (0.046)
5.025
Preliminary 2020 Budget - Service Based 2-69

Fire and Rescue Response
Service Detail
Sub-services (in millions of $)2018
Actual2019
Budget
2020Preliminary
Budget2021
Projection2022
Projection2023
ProjectionFire Suppression & Life Rescue
Revenue 4.788 4.683 4.633 4.634 4.632 4.632Operating expenses 118.435 120.758 125.377 130.162 132.511 135.205Transfer to Capital - - - - - -
113.647 116.075 120.743 125.528 127.879 130.572Fire Investigation Revenue 0.002 - - - - -
Operating expenses 0.906 0.958 0.910 0.941 0.957 0.975Transfer to Capital - - - - - -
0.904 0.958 0.910 0.941 0.957 0.975Specialty Rescue Revenue - - - - - -
Operating expenses 0.065 0.104 0.127 0.127 0.127 0.127Transfer to Capital - - - - - -
0.065 0.104 0.127 0.127 0.127 0.127Fire Paramedic Response
Revenue 0.001 0.008 0.004 0.004 0.004 0.004Operating expenses 9.458 9.828 10.260 10.581 10.712 10.886Transfer to Capital - - - - - -
9.457 9.820 10.256 10.576 10.707 10.882Mill Rate Support/(Contribution) 124.073 126.956 132.035 137.172 139.670 142.556
Additional Financial Information
Capital Budget2020
Preliminary2021-2025Forecast
6 YearTotal
(In millions of $) 5.773 27.571 33.344
2-70 Preliminary 2020 Budget - Service Based

Fire and Injury PreventionIncludes:
• Fire & Injury Prevention Education• Fire Inspection
Description Key GoalsTo reduce the incidence of illness, injury, death and property loss due to fire, accident or personal health by educating citizens regarding fire and life safety, and through the enforcement of the Manitoba Fire Code and the Fire Prevention By-law.
1. Provide fire and life safety educational programming to citizens of all ages to help prevent fire and medical emergencies and reduce injury, death, and property loss.
2. Identify the need for, develop new educational programming, and deliver that programming to identified groups within our community.
3. Promote and participate in public safety initiatives with partner agencies.
4. Enforce structural fire and life safety standards through the provision of plan examination, building fire inspection services and enforcement.
5. Ensure the required maintenance of fire and life safety systems is conducted by qualified individuals through the ongoing licensing of service persons.
6. Regulate potentially hazardous activities to ensure they are conducted in an approved, and safe manner through permit processes.
Service Level StatisticsDescription 2016 2017 2018Fire Prevention By-Law/Fire Code Inspections 10,901 10,210 10,836Operations Inspections [A] 2,157 1,297 1,116Permits Issued 269 254 311Property File Searches/Plans Examined 959 1,019 890Fire Code/By-Law Violations Cited 14,050 12,408 11,304Licenses Issued (New/Renewal/Fire Extinguisher Trainer) 623 611 657Fire Safety House 205 205 152Other Community Events 207 161 112Fire Safety Lectures/Presentations 289 209 184Medical/Injury Prevention Lectures/Presentations 100 174 186Youth Fire Stop 46 13 53Career Symposiums 13 7 14Evacuation Fire Drills 119 100 80Fire/Paramedic Station Tours 351 159 154Community Fire Prevention Partnership 958 309 1648Arson Prevention in Schools 79 35 45Career Camps [B] 19Community Education [B] 7
[A] In 2017, to support existing standards and practices, the frequency of fire inspections was updated from annually to once every 3 years.
[B] Data collection began in 2018.
Preliminary 2020 Budget - Service Based 2-71

Fire and Injury PreventionContributing DepartmentsFire Paramedic Service 100 %
Operating Budget
(in millions of $)2018
Actual2019
Budget
2020Preliminary
Budget Expl.2021
Projection2022
Projection2023
ProjectionService revenue 0.613 1.108 1.147 1.147 1.147 1.147Provincial funding (service specific) 0.050 0.050 0.050 0.050 0.050 0.050Revenues 0.664 1.158 1.197 1 1.197 1.197 1.197Salaries and benefits 4.954 5.463 5.264 5.483 5.592 5.698Services 0.322 0.369 0.317 0.317 0.312 0.316Materials, parts, and supplies 0.101 0.101 0.236 0.234 0.235 0.235Assets and purchases 0.057 0.048 0.043 0.043 0.043 0.043Debt and finance charges 0.002 - - - - -Grants, transfers and other 0.372 0.361 0.303 0.305 0.305 0.306Recoveries (0.007) (0.005) (0.005) (0.005) (0.005) (0.005)Operating expenses 5.800 6.338 6.158 6.377 6.482 6.592Transfer to Capital - - - - - -Total Expenses 5.800 6.338 6.158 2 6.377 6.482 6.592Mill Rate Support/(Contribution) 5.136 5.180 4.961 5.180 5.285 5.395Full-time Equivalent Positions 43 44 41 42 42 42
Explanation of 2020 Change from 2019
(in millions of $)1 Revenues
Increase in permit and inspection fees 0.036Miscellaneous adjustments 0.003
0.039
2 ExpensesReallocation of Public Education for Emergency Medical Services to Medical Response service area
(0.287)
Increase in salaries and benefits, net of the reallocation above 0.088Miscellaneous adjustments 0.019
(0.180)
Full-time Equivalent PositionsDecrease of 3 FTEs to reflect allocation of Emergency Medical Services public education transferred to Medical Response from Fire and Injury Prevention.
2-72 Preliminary 2020 Budget - Service Based

Fire and Injury Prevention
Service Detail
Sub-services (in millions of $)2018
Actual2019
Budget
2020Preliminary
Budget2021
Projection2022
Projection2023
ProjectionFire & Injury Prev Education
Revenue 0.007 - - - - -Operating expenses 0.926 0.970 0.691 0.723 0.737 0.749Transfer to Capital - - - - - -
0.920 0.970 0.691 0.723 0.737 0.749Fire Inspection Revenue 0.657 1.158 1.197 1.197 1.197 1.197
Operating expenses 4.874 5.368 5.467 5.654 5.746 5.843Transfer to Capital - - - - - -
4.216 4.210 4.270 4.457 4.548 4.646Mill Rate Support/(Contribution) 5.136 5.180 4.961 5.180 5.285 5.395
Preliminary 2020 Budget - Service Based 2-73

Medical ResponseIncludes:
• Community Paramedicine• Emergency Ambulance• Medical Transfers
Description Key GoalsTo provide quick, proficient primary response to all medical emergency situations, including the provision of pre-hospital patient care, patient transport to hospital, patient transfer services between facilities, and standby at critical police and fire rescue incidents, and special events.
1. Improve capacity to effectively respond to medical emergencies in a manner that is financially sustainable for the citizens of Winnipeg.
2. Improve quality of medical service provided.3. Expand the quality improvement process to quantify
and improve customer satisfaction.4. Pursue partnerships to enhance delivery of medical
service.5. Ensure a respectful work environment and positive
public image.
Service Level StatisticsDescription 2016 2017 2018Emergency Medical Incidents-Total Ambulance Dispatched [A] 58,792 64,418 67,679Emergency Medical Incidents-Ambulance Only Dispatched [A] 20,414 22,268 23,392Emergency Medical Incidents-Ambulance&Fire Dispatched [A] 38,378 42,150 44,287Scheduled Inter-facility Transfers-Total Dispatched [A] 7,316 6,414 6,104Emergency Patient Transports 48,088 51,770 53,194Patients Assessed or Treated at Scene (not transported) [B] 22,002 25,712 26,340Total Patient Contacts (no Community Paramedicine) [B] 75,434 81,967 83,794Patient Contacts per Thousand Population [B] 102.5 109.4 111.2Main Street Project Patient Contacts 15,089 13,948 13,547Community Paramedicine Patient Contacts (EPIC) [C] 1,357 1,416 1,598
[A] Updated breakdown and sequencing of 'Emergency Medical Incidents' and 'Scheduled Inter-facility Transfers' statistics to better correspond to related Volume 2 data. Please note the removal of all 'Fire only Dispatched' Statistics, which will now appear in the Fire and Rescue Response service area. 2016 and 2017 values restated.
[B] 2017 restated to correct a reporting error.[C] EPIC = Emergency Paramedics in the Community program
2-74 Preliminary 2020 Budget - Service Based

Medical ResponseContributing DepartmentsFire Paramedic Service 100 %
Operating Budget
(in millions of $)2018
Actual *2019
Budget *
2020Preliminary
Budget Expl.2021
Projection2022
Projection2023
ProjectionService revenue 22.320 16.349 16.455 16.712 16.985 17.227Provincial funding (service specific) 36.457 46.179 48.688 49.940 51.069 52.010Revenues 58.777 62.528 65.142 1 66.652 68.055 69.237Salaries and benefits 46.366 48.868 50.779 52.305 53.684 54.806Services 6.719 6.245 6.599 6.587 6.596 6.649Materials, parts and supplies 1.980 1.956 2.368 2.346 2.351 2.353Assets and purchases 0.475 0.362 0.417 0.417 0.417 0.417Debt and finance charges 5.843 2.925 3.124 3.671 4.142 4.392Grants, transfers and other 1.309 3.106 2.987 2.458 1.994 1.750Recoveries (1.738) (0.935) (1.131) (1.131) (1.131) (1.131)Operating expenses 60.954 62.528 65.143 66.652 68.054 69.237Transfer to Capital - - - - - -Total Expenses 60.954 62.528 65.143 2 66.652 68.054 69.237Mill Rate Support/(Contribution) 2.177 - - - - -Full-time Equivalent Positions 423 408 411 412 412 412
* Restated to align with 2020 Budget.
Explanation of 2020 Change from 2019
(in millions of $)1 Revenues
Increase in Shared Health grant 1.607Increase in fee reduction grant 0.901Increase in ambulance revenue 0.107
2.615
2 ExpensesIncrease in salaries and benefits 1.660Increase in equipment 0.410Reallocation of Public Education for Emergency Medical Services from Fire and Injury Prevention service area
0.287
Miscellaneous adjustments 0.2582.615
Full-time Equivalent PositionsIncrease of 3 FTEs to reflect allocation of Emergency Medical Services public education transferred from Fire and Injury Prevention to Medical Response.
Preliminary 2020 Budget - Service Based 2-75

Medical Response
Service Detail
Sub-services (in millions of $)2018
Actual2019
Budget
2020Preliminary
Budget2021
Projection2022
Projection2023
ProjectionEmergency Ambulance
Revenue 47.023 51.181 52.959 54.124 55.221 56.160Operating expenses 49.200 51.181 52.959 54.124 55.221 56.160Transfer to Capital - - - - - -
2.177 - - - - -Medical Transfers Revenue 9.486 8.391 9.172 9.469 9.746 9.960
Operating expenses 9.486 8.391 9.172 9.469 9.746 9.960Transfer to Capital - - - - - -
- - - - - -Community Paramedicine
Revenue 2.268 2.956 3.012 3.059 3.088 3.116Operating expenses 2.268 2.956 3.012 3.059 3.088 3.116Transfer to Capital - - - - - -
- - - - - -Mill Rate Support/(Contribution) 2.177 - - - - -
Capital Budget2020
Preliminary2021-2025Forecast
6 YearTotal
(In millions of $) 5.339 7.891 13.230
2-76 Preliminary 2020 Budget - Service Based

Emergency Management
Description Key GoalsTo provide a prompt and coordinated response by the CityofWinnipegtomajorpeacetimedisastersby:- Minimizing the impact of an emergency or disaster ontheCityofWinnipeg.- Protecting and preserving the health and property of thecitizensofWinnipeg.- Maintaining and restoring essential services during anemergencyordisaster.- Building resilient communities through sustainability, business continuity and enhanced recovery programs.This service was formerly known as Disaster Preparedness and Response.
1. Prepare and test plans and strategies for new and emerging health risks and hazards.
2. Develop new and/or enhance current partnerships with other levels of government, authorities and community agencies.
3. Enhance the City's emergency plan to be more responsive to the needs of at risk populations (e.g. disabled, seniors, and children) and geographic communities and stakeholders within Winnipeg.
4. Provide emergency management education and training to staff, partnering agencies, and the general community.
Service Level StatisticsDescription 2016 2017 2018OEM Presentations/Consultations Delivered 9 21 16OEM Disaster Management Training Sessions Delivered 16 9 4OEM Individuals Trained [A] 200 150 83OEM Exercises (internal and with stakeholders) 12 6 5OEM Notifications and Threat Assessments [B] n/a n/a 12EOC / Multiple Department Activation 5 2 4EOC Days Activated 5 14 4PIO News Releases [C] n/a n/a 78PIO Media Inquiries [C] n/a n/a 684
* OEM-TheOfficeofEmergencyManagementEOC-EmergencyOperatingCentrePIO - Public Information Office for Winnipeg Fire Paramedic Service (WFPS)
[A] Comprised of both City staff and external organizations.[B] Data collection began in 2018.[C] In 2018, the Emergency Management Office added a Public Information Office Branch. WFPS news releases and media inquiry
figures are provided by Customer Service & Communications.
Preliminary 2020 Budget - Service Based 2-77

Emergency ManagementContributing DepartmentsFire Paramedic Service 100 %
Operating Budget
(in millions of $)2018
Actual2019
Budget
2020Preliminary
Budget Expl.2021
Projection2022
Projection2023
ProjectionService revenue - - - - - -Provincial funding (service specific) - - - - - -Revenues - - - 1 - - -Salaries and benefits 0.592 0.845 0.894 0.921 0.943 0.963Services 0.091 0.046 0.047 0.047 0.047 0.047Materials, parts, and supplies 0.010 0.004 0.020 0.020 0.020 0.020Assets and purchases 0.019 0.018 0.018 0.018 0.018 0.018Debt and finance charges 0.000 - - - - -Grants, transfers and other 0.379 0.091 0.095 0.095 0.095 0.095Recoveries (0.001) - - - - -Operating expenses 1.090 1.003 1.074 1.103 1.124 1.145Transfer to Capital - - - - - -Total Expenses 1.090 1.003 1.074 2 1.103 1.124 1.145Mill Rate Support/(Contribution) 1.090 1.003 1.074 1.102 1.124 1.144Full-time Equivalent Positions 5 8 8 8 8 8
Explanation of 2020 Change from 2019
(in millions of $)1 Revenues n/a
2 ExpensesIncrease in salaries and benefits 0.049Miscellaneous adjustments 0.022
0.071
2-78 Preliminary 2020 Budget - Service Based

RecreationIncludes:
• Arenas• Aquatic Services• Recreation Services• Community Centres
Description Key GoalsProvide high quality aquatics, recreation and leisure opportunities/programs in order to enhance life skills, community leadership development and overall safety and well-being for citizens in our neighbourhoods.Includes the administration of the Community Centre Renovation Grant Program to support repairs, upgrades, retrofits, safety improvements, and renovation projects at City of Winnipeg community centre facilities.
1. Continuously improve services to be more responsive to the recreational, cultural and leisure needs of Winnipeggers.
2. Provide leadership and support the work of other service providers to build the foundation for quality of lifeandtopromoteasafeandhealthycommunity.
3. Provide recreation services by collaborating and leveraging resources through partnerships.
4. Provide equitable opportunities to participate in recreation programs and services.
5. Provide meaningful and relevant recreational opportunities to increase the participation of Indigenous youth in City of Winnipeg services.
6. Provide community development and recreation opportunities for vulnerable youth as an integral component of crime prevention efforts.
7. Provide safe and healthy environments in the delivery of programs conducive to an enjoyable experience and personal well-being.
Service Level StatisticsDescription 2016 2017 2018% of Prime Time Ice Sold in the Regular Season 81% 82% 85%Number of Paid Aquatics Courses [A] 8,320 8,333 7,788Number of Recreation and Leisure Paid Courses [B] 3,303 3,431 3,538Number of Hours of Recreation & Leisure Paid Courses [B] 33,322 34,681 36,845Number of Registered Course Subsidies Issued [C] 1,041 2,365 3,065Number of Facility Pass Subsidies Issued [C] 2,416 4,288 5,161Number of Public Swim Visits to Outdoor Pools 128,087 155,967 151,073Participation Visits to Recreation, Leisure & Free Swim Programming [D] 261,925 257,028 239,121Number of Hours of Wading Pool Free Programming 22,422 21,331 22,483Number of Hours of Spray Pad Free Programming [E] 18,446 21,186 23,947Number of Recreation Grants Administered [F] 7 7 7Value of Recreation Grants Administered [F] $2,027,682 $2,130,014 $2,157,374
[A] In 2018, there were renovation shutdowns at Pan Am Pool and Seven Oaks Pool. Seven Oaks Pool was closed for all of 2018.[B] Excludes Aquatics and Leadership Development.[C] Increased as a result of the promotion of the expanded Recreation & Aquatics Fee Subsidy Program (introduced in Mar 2016).[D] Total Free Swim, Free Public Skate, and Free Youth, Children and Adult Drop-In.[E] Three new spray pads opened in 2018: Freight House (June 2018), Old Ex (July 2018) and Valley Gardens (August 2018).[F] Excludes Community Centre Renovation Grant Program (adopted budget of $965,000 in 2018) and all Community Centre
Universal Funding Formula Grants (total of $5,680,595 in 2018 distributed to 63 community centres).
Preliminary 2020 Budget - Service Based 2-79

RecreationContributing DepartmentsCommunity Services 100 %
Operating Budget
(in millions of $)2018
Actual2019
Budget
2020Preliminary
Budget Expl.2021
Projection2022
Projection2023
ProjectionService Revenue 12.911 13.362 13.108 12.390 12.390 12.390Provincial funding (service specific) 0.500 0.700 0.700 0.700 0.700 0.700Revenues 13.411 14.062 13.808 1 13.090 13.090 13.090Salaries and benefits 20.742 21.672 22.648 22.309 22.846 23.302Services 2.907 3.214 2.905 2.341 2.346 2.343Materials, parts, and supplies 0.447 0.502 0.489 0.467 0.468 0.470Assets and purchases 0.108 0.059 0.049 0.049 0.047 0.049Debt and finance charges 0.501 0.658 0.772 1.024 1.704 2.091Grants, transfers and other 28.774 30.254 30.955 31.497 32.163 32.768Recoveries (0.829) (0.570) (0.591) (0.603) (0.617) (0.631)Operating expenses 52.650 55.789 57.227 57.084 58.958 60.394Transfer to Capital 0.609 2.070 - - - -Total Expenses 53.259 57.859 57.227 2 57.084 58.958 60.394Mill Rate Support/(Contribution) 39.848 43.796 43.419 43.994 45.869 47.304Full-time Equivalent Positions 361 374 378 367 367 367
Explanation of 2020 Change from 2019
(in millions of $)1 Revenues
Decrease in arena revenue due to the closure of Terry Sawchuk Arena (0.184)Miscellaneous adjustments (0.070)
(0.254)
2 ExpensesIncrease in salaries and benefits 0.976Increase in building services charges 0.720Increase in Universal Funding Formula grants to community centres 0.143Increase in debt and finance charges 0.114Transfer to Capital (2.070)Reclassification of community grants to the Community Liveability service (0.365)Reduction in grants provided to General Council of Winnipeg Community Centres (GCWCC)
(0.100)
Miscellaneous adjustments (0.050)(0.632)
Full-time Equivalent PositionsIncrease of 4 FTEs due to internal FTE allocations.
2-80 Preliminary 2020 Budget - Service Based

Recreation
Service Detail
Sub-services (in millions of $)2018
Actual2019
Budget
2020Preliminary
Budget2021
Projection2022
Projection2023
ProjectionAquatic Services Revenue 6.530 7.363 6.973 6.973 6.973 6.973
Operating expenses 27.481 28.685 30.233 30.785 31.458 32.048Transfer to Capital 0.152 1.030 - - - -
21.104 22.352 23.260 23.812 24.485 25.075Recreation Services
Revenue 3.923 3.621 3.900 3.181 3.181 3.181Operating expenses 11.180 11.969 11.538 10.599 11.276 11.711Transfer to Capital 0.457 1.026 - - - -
7.713 9.375 7.638 7.418 8.095 8.530Arenas Revenue 2.725 2.657 2.514 2.514 2.514 2.514
Operating expenses 4.314 4.865 4.843 4.853 4.980 5.089Transfer to Capital - 0.012 - - - -
1.589 2.219 2.329 2.340 2.467 2.575Community Centres
Revenue 0.233 0.422 0.422 0.422 0.422 0.422Operating expenses 9.675 10.270 10.613 10.846 11.244 11.546Transfer to Capital - 0.002 - - - -
9.442 9.850 10.191 10.424 10.822 11.124Mill Rate Support/(Contribution) 39.848 43.796 43.419 43.994 45.869 47.304
Additional Financial Information
Capital Budget2020
Preliminary2021-2025Forecast
6 YearTotal
(In millions of $) 8.485 18.179 26.664
Preliminary 2020 Budget - Service Based 2-81

Parks and Urban ForestryIncludes:
• Park Grass Maintenance • Dutch Elm Disease Control (DED)• Park Amenity Maintenance • Weed Control• Athletic Field Maintenance • Natural Areas Management• Park Pathway Maintenance • Playground Management• Park Planning / Development • Winter Amenity Maintenance• Tree Planting • Boulevard Maintenance• Tree Pruning & Removal (non-DED)
Description Key GoalsTo develop, operate, maintain and preserve all parks and open spaces to promote vibrant, healthy communities while fostering environmental stewardship.This service includes park, boulevard, and open space maintenance; litter collection; athletic field maintenance; pathway maintenance; park planning and development (shared with Planning, Property and Development); tree planting, pruning, removal; Dutch Elm Disease control (inspection, removal, disposal, public education); Emerald Ash Borer Management; weed control (inspection, serving of weed notices); natural areas management (replanting of native species, controlled burns, native and invasive species monitoring, education); playground equipment inspection and repair; and winter amenity maintenance (knock-down hockey rinks, pleasure skating rinks/ponds, toboggan slides/hills, park pathway snow clearing, cross-country ski trails and speed skating oval maintenance).
1. Maintain and improve parks, athletic fields, playgrounds and related amenities to meet community leisure needs and interests.
2. Provide natural environment and conservation education.
3. Preserve and enhance natural areas across the City's park and open space system.
4. Protect and enhance the urban forest through effective tree care practices and replacement planting.
5. Invest strategically in new and existing infrastructure.
Service Level StatisticsDescription 2016 2017 2018Total hectares of parks and open spaces [A] 3,587 3,610 3,615Hectares of park, boulevard and athletic field turf mowing [A] 2,338 2,325 2,275Park pathways/walkways maintained (linear km) [A] 266 280 284Number of environmental program participants 4,522 5,427 5,020Number of ecologically significant natural areas 467 476 479Number of athletic fields in Parks and Open Spaces [A] 661 665 667Number of boulevard and park trees [B] 304,278 304,530 302,986Number of trees planted [B] 2,757 2,448 2,586Number of DED trees and non-DED trees removed [B] 6,123/3,296 6,575/2,093 9,031/2,894Number of trees pruned [B] 13,723 11,154 12,395Number of playground equipment sites inspected and maintained [A] 505 499 501Number of 311 Service Requests [C] 14,964 14,650 15,778Number of Park Projects (New / Completed) 21 / 29 12 / 36 60 / 50
[A] Source: 2016, 2017 and 2018 Parks and Open Spaces Asset Management (audited data). Inventory excludes Assiniboine Park.[B] Source: 2016 and 2017 Urban Forestry Tree Inventory.[C] Source: 311 2017 Annual Reports. Does not include Insect Control.
2-82 Preliminary 2020 Budget - Service Based

Parks and Urban ForestryContributing DepartmentsPublic Works 96 %Planning, Prop. & Devl. 4 %
Operating Budget
(in millions of $)2018
Actual2019
Budget
2020Preliminary
Budget Expl.2021
Projection2022
Projection2023
ProjectionService revenue 0.740 1.194 0.687 0.699 0.711 0.724Provincial funding (service specific) 1.002 1.005 1.005 1.005 1.005 1.005Revenue 1.742 2.199 1.692 1 1.704 1.716 1.729Salaries and benefits 21.660 20.957 21.633 21.952 22.333 22.755Services 11.044 11.207 10.528 10.278 10.327 10.369Materials, parts, and supplies 3.211 3.090 2.950 2.983 3.008 3.013Assets and purchases 0.200 0.034 0.034 0.034 0.034 0.034Debt and finance charges 0.089 0.071 0.462 0.573 0.579 0.579Grants, transfers and other 3.810 3.708 3.501 3.503 3.536 3.556Recoveries (3.425) (2.267) (2.277) (2.317) (2.281) (2.288)Operating expenses 36.590 36.799 36.831 37.008 37.536 38.017Transfer to Capital 2.915 0.741 3.114 2.270 1.611 0.882Total Expenses 39.506 37.540 39.945 2 39.277 39.147 38.899Mill Rate Support/(Contribution) 37.763 35.341 38.253 37.574 37.431 37.170Full-time Equivalent Positions 338 308 311 311 310 310
Explanation of 2020 Change from 2019
(in millions of $)1 Revenues
Decrease due to one-time transfer from Multi-family Dwelling Tax Investment Reserve in 2019
(0.510)
Miscellaneous adjustments 0.003(0.507)
2 ExpensesTransfer to Capital 2.373Increase in salaries and benefits 0.676Increase in debt and finance charges 0.391Decrease in fleet and fuel accounts (0.819)Decrease in community partnership contributions (0.242)Miscellaneous adjustments 0.026
2.405
Full-time Equivalent PositionsNet increase of 2 FTEs to support athletic field bookings, and an increase of 1 FTE due to refinement of service based view.
Preliminary 2020 Budget - Service Based 2-83

Parks and Urban Forestry
Service Detail
Sub-services (in millions of $)2018
Actual2019
Budget
2020Preliminary
Budget2021
Projection2022
Projection2023
ProjectionPark Grass Maintenance
Revenue 0.016 0.021 0.021 0.021 0.021 0.021Operating expenses 7.993 8.120 7.966 7.959 8.064 8.176Transfer to Capital - - - - - -
7.977 8.099 7.945 7.938 8.043 8.155
Park Amenity Maintenance
Revenue 0.296 0.042 0.042 0.042 0.043 0.043Operating expenses 4.289 3.965 3.995 4.044 4.104 4.158Transfer to Capital 1.024 0.085 0.732 1.837 1.500 0.181
5.018 4.008 4.685 5.839 5.562 4.296
Athletic Field Maintenance
Revenue 0.287 0.424 0.424 0.434 0.444 0.454Operating expenses 2.678 3.117 2.860 2.860 2.896 2.931Transfer to Capital 0.072 - - - - -
2.464 2.693 2.435 2.426 2.452 2.477
Park Pathway Maintenance
Revenue 0.001 0.001 0.001 0.001 0.001 0.001Operating expenses 0.252 0.294 0.291 0.292 0.296 0.301Transfer to Capital 0.055 - - - - -
0.306 0.292 0.289 0.290 0.295 0.299
Park Planning/Development
Revenue 0.014 0.531 0.021 0.021 0.021 0.022Operating expenses 2.860 2.647 2.843 2.832 2.838 2.884Transfer to Capital 0.242 0.273 0.641 0.050 0.111 0.078
3.087 2.389 3.463 2.860 2.928 2.940
Tree Planting Revenue 0.003 0.002 0.002 0.002 0.002 0.002Operating expenses 1.770 1.722 1.765 1.774 1.803 1.813Transfer to Capital 0.277 0.383 0.050 0.383 - 0.083
2.044 2.103 1.813 2.155 1.801 1.894
Tree Pruning & Removal
Revenue 0.015 0.015 0.015 0.015 0.015 0.015Operating expenses 4.945 4.587 4.599 4.615 4.690 4.721Transfer to Capital 0.235 - 0.190 - - 0.080
5.164 4.572 4.774 4.600 4.675 4.786
Dutch Elm Disease Control
Revenue 1.009 1.011 1.011 1.011 1.011 1.011Operating expenses 4.790 5.526 5.693 5.783 5.900 5.993Transfer to Capital 0.235 - 0.769 - - 0.320
4.017 4.515 5.451 4.772 4.889 5.302
Weed Control Revenue 0.067 0.094 0.096 0.098 0.100 0.103Operating expenses 0.853 0.954 0.965 0.969 0.986 1.007Transfer to Capital - - - - - -
0.786 0.860 0.869 0.871 0.886 0.905
2-84 Preliminary 2020 Budget - Service Based
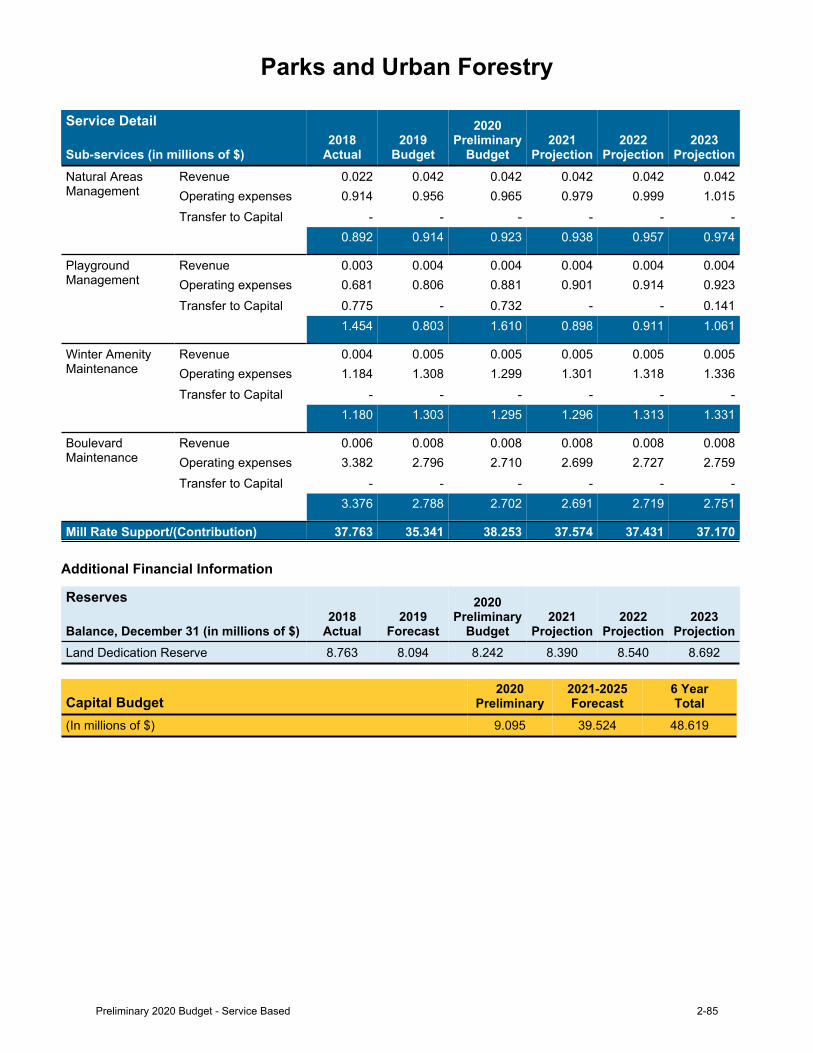
Parks and Urban Forestry
Service Detail
Sub-services (in millions of $)2018
Actual2019
Budget
2020Preliminary
Budget2021
Projection2022
Projection2023
ProjectionNatural Areas Management
Revenue 0.022 0.042 0.042 0.042 0.042 0.042Operating expenses 0.914 0.956 0.965 0.979 0.999 1.015Transfer to Capital - - - - - -
0.892 0.914 0.923 0.938 0.957 0.974
Playground Management
Revenue 0.003 0.004 0.004 0.004 0.004 0.004Operating expenses 0.681 0.806 0.881 0.901 0.914 0.923Transfer to Capital 0.775 - 0.732 - - 0.141
1.454 0.803 1.610 0.898 0.911 1.061
Winter Amenity Maintenance
Revenue 0.004 0.005 0.005 0.005 0.005 0.005Operating expenses 1.184 1.308 1.299 1.301 1.318 1.336Transfer to Capital - - - - - -
1.180 1.303 1.295 1.296 1.313 1.331
Boulevard Maintenance
Revenue 0.006 0.008 0.008 0.008 0.008 0.008Operating expenses 3.382 2.796 2.710 2.699 2.727 2.759Transfer to Capital - - - - - -
3.376 2.788 2.702 2.691 2.719 2.751
Mill Rate Support/(Contribution) 37.763 35.341 38.253 37.574 37.431 37.170
Additional Financial Information
Reserves
Balance, December 31 (in millions of $)2018
Actual2019
Forecast
2020Preliminary
Budget2021
Projection2022
Projection2023
ProjectionLand Dedication Reserve 8.763 8.094 8.242 8.390 8.540 8.692
Capital Budget2020
Preliminary2021-2025Forecast
6 YearTotal
(In millions of $) 9.095 39.524 48.619
Preliminary 2020 Budget - Service Based 2-85

Community LiveabilityIncludes:
• Community By-law Enforcement • Community Crisis Response• Vacant Building Enforcement • Community Grants• Community Development • Bicycle Recovery
Description Key GoalsThrough outreach, promotion, prevention, protection and regulatory services, support the development of ahealthycommunityincluding:- Community By-law Enforcement Services - promoting neighbourhood liveability by regulating housing and property standards on all properties, with aspecializedfocusonvacantbuildings.- Business Licensing (Doing Business in Winnipeg By-law).- Community Development - working collaboratively with stakeholders to improve the capacity, safety and well-beingofthecommunity.- Crisis response coordination - connecting citizens to available services as required in relation to mandated cityservices.- Critical support services for citizens during local emergencies(24hoursaday,sevendaysaweek).- Administration of grants to community organizations in support of safe and healthy neighbourhoods, includingtheCommunityIncentiveGrantProgram.- Administration of a bicycle recovery program.
1. To continue to build and enhance performance measurement/accountability systems in order to improve service quality, operational due diligence, and customer service.
2. To continue to build on the success of our community-based civic engagement model to strengthen partnerships and increase community capacity.
3. To continue to deliver a coordinated, integrated, and seamless service response to address community needs and priorities that contribute to building healthy communities.
4. To continue to deliver an efficient and comprehensive Vacant Building Program designed to accelerate property restoration and re-occupancy.
Service Level StatisticsDescription 2016 2017 2018No. of Service Requests 13,963 12,703 14,478No. of Service Requests per By-Law Officer 616 652 712No. of Property Standards Inspections/Officer & By-Law Support Worker Visits [A] 30,769 24,715 26,469No. of Vacant Buildings as at January 1 467 536 536No. of Vacant Buildings Added to List During the Year 301 235 199No. of Vacant Buildings Removed from List During the Year 232 235 265No. of Vacant Buildings as at December 31 536 536 470No. of Compliance Orders Issued [A] 6,081 4,955 6,848No. of Offence Notices Served (Tickets) [B] 284 290 1,950No. of Property Clean-Ups Conducted by the Public Service 386 540 587No. of Business Types Regulated 15 15 15No. of Business Licenses Issued 893 918 894No. of Crisis Response/Resource Connection/Information Referrals Responded to 401 246 297No. of Emergencies Responded/No. of Individuals Impacted 10 / 401 14 / 538 14 / 170No. of Community Grants Administered [C] 17 20 18Value of Community Grants Administered [C] $1,076,939 $1,622,037 $1,577,039No. of New Bike Registrations [D] 322 510 2,451
[A] In 2017, the Seasonal Support Unit operated for a shorter period of time and with a smaller complement of inspectors.[B] Increase in 2018 reflects the first full year of operating under the Municipal By-law Enforcement Act.[C] Excludes Community Incentive Grant Program (CIGP). The adopted budget for CIGP in 2018 was $1,732,000.[D] The new online bike registry launched in April 2018.
2-86 Preliminary 2020 Budget - Service Based

Community LiveabilityContributing DepartmentsCommunity Services 93 %Planning, Property, & Development 6 %Corporate Accounts 1 %
Operating Budget
(in millions of $)2018
Actual *2019
Budget *
2020Preliminary
Budget Expl.2021
Projection2022
Projection2023
ProjectionService revenue 1.286 1.155 1.228 1.221 1.223 1.224Provincial funding (service specific) - - - - - -Revenues 1.286 1.155 1.228 1 1.221 1.223 1.224Salaries and benefits 4.313 4.524 4.690 4.811 4.930 4.972Services 0.918 0.813 0.923 0.897 0.898 0.894Materials, parts, and supplies 0.069 0.084 0.073 0.073 0.073 0.073Assets and purchases 0.042 0.022 0.025 0.018 0.017 0.018Debt and finance charges 0.534 0.616 0.346 0.477 0.771 0.919Grants, transfers and other 2.392 1.682 2.153 2.159 2.166 2.165Recoveries (0.664) (0.374) (0.493) (0.503) (0.496) (0.417)Operating expenses 7.603 7.366 7.717 7.933 8.359 8.622Transfer to Capital 1.732 1.856 1.145 0.012 0.026 0.018Total Expenses 9.335 9.222 8.863 2 7.945 8.385 8.640Mill Rate Support/(Contribution) 8.049 8.067 7.635 6.724 7.162 7.416Full-time Equivalent Positions 55 56 56 56 56 55
* Restated to align with 2020 Budget.
Explanation of 2020 Change from 2019
(in millions of $)1 Revenues
Miscellaneous adjustments 0.0730.073
2 ExpensesReclassification of community grants from the Recreation Service 0.365Establish new funding for 24/7 Safe Spaces granting program 0.250Increase in salaries and benefits 0.166Transfer to Capital (0.711)Decrease in debt and finance charges (0.270)Decrease in grants to community organizations net of reclassification of community grants from the Recreation Service above
(0.095)
Miscellaneous adjustments (0.064)(0.359)
Preliminary 2020 Budget - Service Based 2-87

Community Liveability
Service Detail
Sub-services (in millions of $)2018
Actual2019
Budget
2020Preliminary
Budget2021
Projection2022
Projection2023
ProjectionVacant Building Enforcement
Revenue 0.328 0.315 0.335 0.335 0.335 0.335Operating expenses 0.691 0.835 0.780 0.797 0.817 0.832Transfer to Capital - - - - - -
0.362 0.520 0.445 0.462 0.482 0.497Community By-law Enforcement
Revenue 0.845 0.638 0.800 0.794 0.795 0.796Operating expenses 2.766 3.049 3.200 3.254 3.340 3.407Transfer to Capital - - - - - -
1.921 2.411 2.400 2.460 2.545 2.610Bicycle Recovery Revenue 0.109 0.082 0.092 0.092 0.092 0.092
Operating expenses 0.188 0.210 0.237 0.240 0.244 0.244Transfer to Capital - - - - - -
0.079 0.128 0.145 0.147 0.151 0.152Community Crisis Response
Revenue - - - - - -Operating expenses 0.195 0.222 0.230 0.236 0.245 0.252Transfer to Capital - - - - - -
0.195 0.222 0.230 0.236 0.245 0.252Community Grants
Revenue - - - - - -Operating expenses 0.750 0.763 1.548 1.549 1.552 1.555Transfer to Capital - - - - - -
0.750 0.763 1.548 1.549 1.552 1.555Community Development
Revenue 0.003 0.120 - - - -Operating expenses 3.014 2.287 1.723 1.858 2.162 2.332Transfer to Capital 1.732 1.856 1.145 0.012 0.026 0.018
4.742 4.022 2.868 1.870 2.188 2.350Mill Rate Support/(Contribution) 8.049 8.067 7.635 6.724 7.162 7.416
2-88 Preliminary 2020 Budget - Service Based

LibrariesIncludes:
• Library Circulation • Children's Library• Library Information
Description Key GoalsTo enrich the lives of all Winnipeg citizens and their communities by providing high quality, responsive andinnovativelibraryservices.Key services include programming, technology, facilities and collections.
1. Provide excellent customer service.2. Ensure all library branches are safe, welcoming and
accessible destinations.3. Enhance strategic partnerships with organizations to
better meet the unique needs of the community.4. Invest in more programs and services that advance
digital literacy.5. Support the development of early literacy skills in
young children through increased investment in materials, services and programs for families, childcare providers and educators.
6. Adjust open hours of library branches to encourage new library users to visit and to be more convenient.
7. Select material that reflects the diverse needs of the community so that relevant print, digital and special collections are freely available.
8. Increase awareness of the library and its benefits through expanded promotion of programs/services.
9. Develop stronger relationships with newcomers and Indigenous peoples by providing responsive programs and services.
10. Provide opportunities for older adults to meet, learn and contribute so that we build strong connections within the community.
11. Expand the impact of the library beyond branches through community outreach and digital services.
Service Level StatisticsDescription 2016 2017 2018Number of Items Circulated 5,121,266 4,888,125 4,879,201Number of Information Questions Answered [A] 176,058 163,957 231,896Number of Library Material Holdings 1,221,832 1,262,438 1,290,385Number of Programs (All ages) 4,266 3,808 3,603Number of Programs (Children/Youth) 2,685 2,770 3,109Number of Attendees at Programs (All ages) 106,221 100,650 95,272Number of Attendees at Programs (Children/Youth) 75,599 77,184 83,936Number of Computer Bookings [B] 438,244 368,544 313,010Number of Visits to Library Website [C] 14,422,306 11,628,048 11,596,929Number of Annual In-person Visits 2,990,003 2,969,413 2,832,351
NOTE: The temporary closure of four library branches for refurbishment in 2018 (126 weeks in total) resulted in decreases for many of the service level statistics.
[A] Because of the increase in branch single service desks, the number includes some circulation statistics.[B] Library supplied computer use is decreasing because customers have access to library wifi for their own devices.[C] In 2017, the number of visits to the website decreased due to changes in how web catalogue visits are recorded.
Preliminary 2020 Budget - Service Based 2-89

LibrariesContributing DepartmentsCommunity Services 100 %
Operating Budget
(in millions of $)2018
Actual2019
Budget
2020Preliminary
Budget Expl.2021
Projection2022
Projection2023
ProjectionService revenue 0.810 0.918 0.918 0.918 0.918 0.918Provincial funding (service specific) 2.066 2.054 2.054 2.054 2.054 2.054Revenues 2.876 2.972 2.972 1 2.972 2.972 2.972Salaries and benefits 16.191 17.419 17.685 17.575 18.004 18.380Services 1.064 1.165 1.169 1.126 1.128 1.126Materials, parts, and supplies 0.275 0.300 0.296 0.296 0.296 0.301Assets and purchases 3.228 3.157 3.173 3.173 3.171 3.173Debt and finance charges 1.294 1.162 1.086 1.258 1.269 1.290Grants, transfers and other 8.909 8.754 8.627 8.697 8.735 8.782Recoveries (0.080) (0.160) (0.203) (0.209) (0.213) (0.222)Operating expenses 30.881 31.795 31.834 31.917 32.392 32.829Transfer to Capital - 0.530 - - - 0.317Total Expenses 30.881 32.325 31.834 2 31.917 32.392 33.146Mill Rate Support/(Contribution) 28.005 29.353 28.863 28.945 29.420 30.174Full-time Equivalent Positions 260 277 273 265 265 265
Explanation of 2020 Change from 2019
(in millions of $)1 Revenues n/a
2 ExpensesIncrease in salaries and benefits, net of a decrease due to service changes effective September 2020: closing all libraries on weekday evenings at 8:00pm and closing all libraries on Sundays
0.266
Transfer to Capital (0.530)Decrease in facility costs (0.164)Decrease in debt and finance charges (0.076)Decrease in grant to Winnipeg Public Library Board (0.008)Miscellaneous adjustments 0.021
(0.491)
Full-time Equivalent PositionsDecrease of 4 FTEs primarily due to a reduction of operating hours effective September 2020 and changes to internal FTE allocations.
2-90 Preliminary 2020 Budget - Service Based

Libraries
Service Detail
Sub-services (in millions of $)2018
Actual2019
Budget
2020Preliminary
Budget2021
Projection2022
Projection2023
ProjectionLibrary Circulation Revenue 1.748 1.783 1.782 1.782 1.782 1.782
Operating expenses 17.808 18.723 19.081 19.134 19.400 19.644Transfer to Capital - 0.180 - - - 0.108
16.061 17.120 17.299 17.352 17.618 17.969Library Information
Revenue 0.700 0.743 0.743 0.743 0.743 0.743Operating expenses 8.565 8.655 8.403 8.429 8.571 8.701Transfer to Capital - 0.175 - - - 0.105
7.865 8.087 7.660 7.686 7.828 8.062Children's Library Revenue 0.428 0.446 0.446 0.446 0.446 0.446
Operating expenses 4.508 4.418 4.350 4.353 4.421 4.484Transfer to Capital - 0.175 - - - 0.105
4.079 4.147 3.903 3.907 3.975 4.143Mill Rate Support/(Contribution) 28.005 29.353 28.863 28.945 29.420 30.174
Additional Financial Information
Capital Budget2020
Preliminary2021-2025Forecast
6 YearTotal
(In millions of $) 0.661 1.925 2.586
Preliminary 2020 Budget - Service Based 2-91

Arts, Entertainment and CultureIncludes:
• Arts, Entertainment and Culture Grants • Museums• Arts, Entertainment and Culture Events • Assiniboine Park Conservancy
Description Key GoalsTo provide citizens and visitors with attractions, entertainment, arts and cultural events that contribute to a dynamic urban image, economic development andavibrantcitylifestylethrough:
- Operating and capital grant support to theAssiniboine Park Conservancy Inc., a not-for-profitcorporation established to manage, fundraise andredevelop Assiniboine Park and its attractions.Assiniboine Park is a 400 acre manicured Englishlandscape style park featuring a zoo with one ofCanada's largest animal collections, a conservatorywith ever-changing botanic displays, outdoorgardens, theatre, performance and art displays,annual community events, trails, meadows andathleticfieldsforyear-roundleisureactivities;- Grant support to museums, arts, entertainment andcultural communities to provide a wide range ofevents, shows and displays for Winnipeg residentsandvisitorstotheCity;and- Attracting and assisting film-makers and eventorganizers by providing logistical support, facilitatedcontact and liaison with civic departments, privatesector business and organizations in support of awelcoming community for film activities and a strongand vibrant calendar of cultural and special events.
1. Work with Assiniboine Park Conservancy to supportcapital development and improvement to the Park.
2. Support film, culture and special events by workingcooperatively with civic departments and otherorganizations to provide logistical support to the filmindustry, event organizers, and arts organizations.
Service Level StatisticsDescription 2016 2017 2018Film, Culture, and Special EventsVisitors Attending Festivals [A] 1,224,587 1,231,336 1,219,432Visitors Attending Cultural Events [A] 2,903,788 2,956,557 2,920,842Manitoba Value in Film Industry [B] $127 million $139 million $269 millionSpecial Events Held in Winnipeg [C] 357 393 509Number of Full Length Feature Films Filmed in Winnipeg 50 67 75[A} Source: Winnipeg Arts Council
[B] Source: Manitoba Film & Sound
[C] Variance is due to a change in tracking methodology
2-92 Preliminary 2020 Budget - Service Based

Arts, Entertainment and CultureContributing DepartmentsCommunity Services 70 %City Clerks 25 %Museums 3 %CAO Office 2 %
Operating Budget
(in millions of $)2018
Actual2019
Budget
2020Preliminary
Budget Expl.2021
Projection2022
Projection2023
ProjectionService revenue - - - - - -Provincial funding (service specific) - - - - - -Revenues - - - 1 - - -Salaries and benefits 0.547 0.477 0.477 0.488 0.502 0.514Services 0.038 0.037 0.033 0.030 0.030 0.030Materials, parts and supplies 0.006 0.005 0.005 0.005 0.005 0.005Assets and purchases 0.002 - - - - -Debt and finance charges 2.264 3.118 2.822 3.144 3.233 3.250Grants, transfers and other 18.558 18.335 18.029 17.280 17.649 17.646Recoveries (0.016) (0.001) (0.001) (0.001) (0.001) (0.001)Operating expenses 21.399 21.971 21.365 20.946 21.417 21.443Transfer to Capital - - 2.600 - - 1.638Total Expenses 21.399 21.971 23.965 2 20.946 21.417 23.081Mill Rate Support/(Contribution) 21.399 21.971 23.965 20.946 21.417 23.081Full-time Equivalent Positions 8 6 6 6 6 6
Explanation of 2020 Change from 2019
(in millions of $)1 Revenues n/a
2 ExpensesTransfer to Capital 2.600Increase in operating grant for Assiniboine Park Conservancy (2019 - $11,078,000; 2020 - $11,327,000)
0.249
Decrease in Arts, Entertainment, and Culture grants (0.555)Decrease in debt and finance charges (0.296)Miscellaneous adjustments (0.004)
1.994
Preliminary 2020 Budget - Service Based 2-93
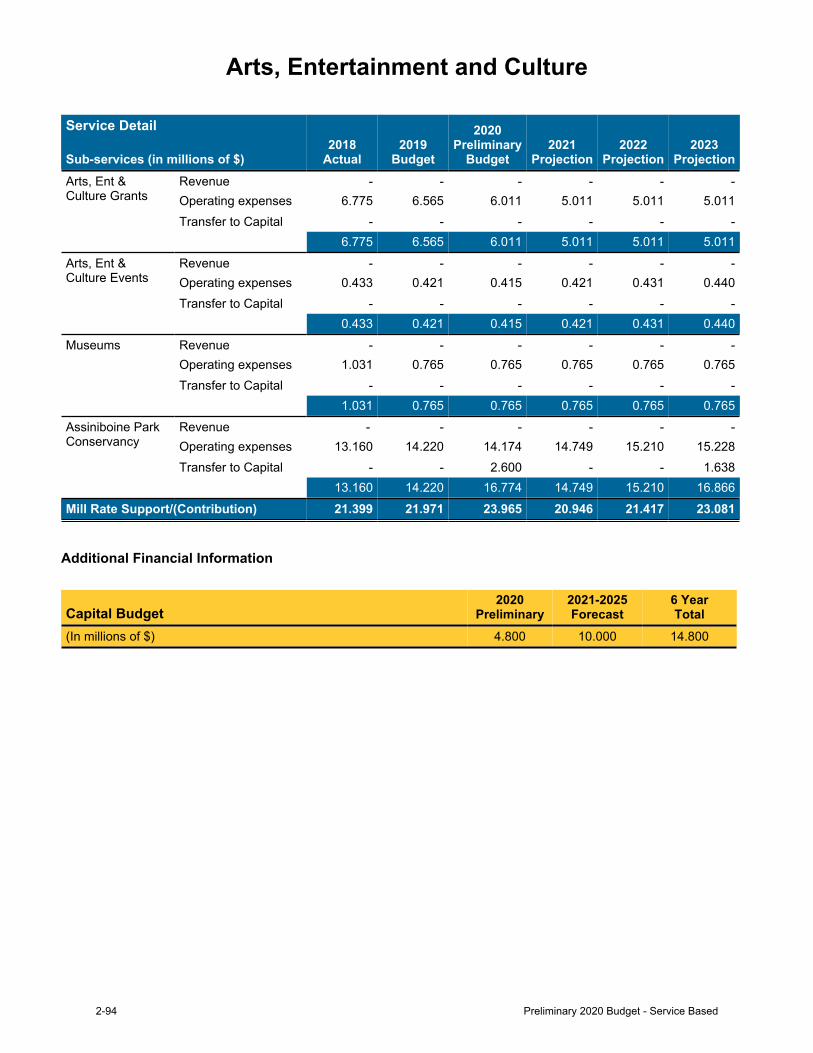
Arts, Entertainment and Culture
Service Detail
Sub-services (in millions of $)2018
Actual2019
Budget
2020Preliminary
Budget2021
Projection2022
Projection2023
ProjectionArts, Ent & Culture Grants
Revenue - - - - - -Operating expenses 6.775 6.565 6.011 5.011 5.011 5.011Transfer to Capital - - - - - -
6.775 6.565 6.011 5.011 5.011 5.011Arts, Ent & Culture Events
Revenue - - - - - -Operating expenses 0.433 0.421 0.415 0.421 0.431 0.440Transfer to Capital - - - - - -
0.433 0.421 0.415 0.421 0.431 0.440Museums Revenue - - - - - -
Operating expenses 1.031 0.765 0.765 0.765 0.765 0.765Transfer to Capital - - - - - -
1.031 0.765 0.765 0.765 0.765 0.765Assiniboine Park Conservancy
Revenue - - - - - -Operating expenses 13.160 14.220 14.174 14.749 15.210 15.228Transfer to Capital - - 2.600 - - 1.638
13.160 14.220 16.774 14.749 15.210 16.866Mill Rate Support/(Contribution) 21.399 21.971 23.965 20.946 21.417 23.081
Additional Financial Information
Capital Budget2020
Preliminary2021-2025Forecast
6 YearTotal
(In millions of $) 4.800 10.000 14.800
2-94 Preliminary 2020 Budget - Service Based

Insect Control
Description Key GoalsProvide insect abatement in order to protect persons and properties against the negative effects of insects while minimizing impact on the environment.
1. Effective and coordinated nuisance mosquito control and mosquito-borne disease control.
2. Use surveillance-based Integrated Pest Management strategies to effectively control targeted species with biological and reduced risk products.
3. Protect the urban forest by reducing the damage caused by tree pest caterpillars, Elm Bark Beetle and Emerald Ash Borer.
4. Evaluate new control products and equipment to maximize services and minimize impact on the environment.
5. Enhance public education and communication systems related to Insect Control.
Service Level StatisticsDescription 2016 2017 2018No. of hectares larvicided with biorational insecticides [A] [B] 29,263 11,464 17,398No. of hectares larvicided by aircraft 20,692 7,950 10,020No. of hectares larvicided by ground-based operations 8,571 3,514 7,378No. of hours committed to larval mosquito surveillance 30,297 27,026 24,796No. of hectares fogged for adult nuisance mosquito control [B] 46,160 0 0No. of trap nights for adult mosquito surveillance [C] 5,513 5,661 5,587No. of boulevard and parkland trees treated for defoliator insects 32,398 44,585 26,073No. of parkland trees treated for the control of Elm Bark beetle 89,168 82,325 20,197No. of stumps treated for the control of Elm Bark beetle 15,681 5,277 1,871No. of 311 inquiries [B] 6,221 2,751 1,228No. of website visits [B] 338,853 158,333 62,740
[A] In addition to Winnipeg, portions or all of the following municipalities are larvicided: East St. Paul, Headingley, Ritchot, Rosser, Springfield, St. Clements, Tache, West St. Paul, MacDonald, St. Andrews.
[B] Drier than normal conditions resulted in less mosquito control activities in 2017 and 2018.[C] 2016 value has been restated.
Preliminary 2020 Budget - Service Based 2-95

Insect ControlContributing DepartmentsPublic Works 100 %
Operating Budget
(in millions of $)2018
Actual2019
Budget
2020Preliminary
Budget Expl.2021
Projection2022
Projection2023
ProjectionService revenue 1.977 2.007 2.107 0.107 0.107 0.107Provincial funding (service specific) 2.376 2.300 2.200 2.200 2.200 2.200Revenues 4.354 4.307 4.307 1 2.307 2.307 2.307Salaries and benefits 4.182 4.400 4.483 4.544 4.642 4.730Services 1.746 3.251 3.179 3.139 3.127 3.150Materials, parts, and supplies 2.331 2.690 2.663 2.669 2.673 2.673Assets and purchases 0.107 0.131 0.131 0.131 0.131 0.131Debt and finance charges - - - - - -Grants, transfers and other 2.099 0.119 0.119 0.119 0.119 0.119Recoveries (0.843) (0.144) (0.144) (0.144) (0.144) (0.144)Operating expenses 9.622 10.446 10.431 10.458 10.547 10.659Transfer to Capital - - - - - -Total Expenses 9.622 10.446 10.431 2 10.458 10.547 10.659Mill Rate Support/(Contribution) 5.268 6.140 6.125 8.151 8.241 8.352
Full-time Equivalent Positions 65 67 67 67 67 67
Explanation of 2020 Change from 2019
(in millions of $)1 Revenues n/a
2 ExpensesIncrease in salaries and benefits 0.083Decrease in fleet equipment and fleet-related accounts (0.099)Miscellaneous adjustments 0.001
(0.015)
Additional Financial Information
Reserves
Balance, December 31 (in millions of $)2018
Actual2019
Forecast
2020Preliminary
Budget2021
Projection2022
Projection2023
ProjectionInsect Control Reserve 3.000 3.000 1.021 1.032 1.042 1.053
2-96 Preliminary 2020 Budget - Service Based

Innovation, Transformation and TechnologyIncludes:
• Innovation• Information Technology• Enterprise Architecture• Enterprise Transformation
Description Key GoalsThe Innovation, Transformation and Technology service includes enabling innovation across the city, finding new ways to deliver services to improve effectiveness and efficiency and maximize value to thecitizen.Providing change management support to the organization as it adopts a culture of innovation and implements the required processes to identify, evaluate and implement high value innovation opportunities that support our most important businessoutcomes.Implementation of enterprise architecture practices to identify and document business services, inter-relationships with other services and supporting capabilities to facilitate effective business planning across the city. Strategic planning leadership and support for all business services to ensure optimal decision making to encourage and foster growth withinthecity.Providing technology leadership to all city services and advise on solutions that support their evolving needs of today and the future.
1. Establish a culture of innovation across the city, empowering all employees to make meaningful improvements to service delivery.
2. Deliver upon a wide range of innovation projects that deliver high levels of Return on Investment and Return on Value with significant organizational and citizen impact.
3. Apply innovation engineering methodology to address business challenges in new ways and expand effective approaches everywhere they can be applied for benefit.
4. Utilization of performance measures to ensure all activities are effective, efficient and providing high value to the outcomes that are most important to the city.
5. Enable collaboration across service areas, balancing focus on departmental and corporate goals to achieve optimal results.
6. Provision of highly reliable, flexible and cost effective technology services that are aligned with business needs.
Service Level StatisticsDescription 2016 2017 2018Number of Website Visits 22.7 million 23.3 million 20.1 millionPercentage of Service Level Agreements Achieved 97% 98% 97%Number of Open Data Datasets n/a 114 126Number of Managed Workstations 5,943 6,625 6,877Number of Email Accounts 7,677 8,261 8,624Number of Technology Service tickets addressed 29,596 30,023 31,854Percentage of scheduled computer network available during business hours 99.945% 99.960% 99.800%Number of pieces of mail processed 3.1 million 3.3 million 3.2 millionNumber of Innovation ideas received [A] [B] 28 17 52Number of Innovation projects initiated [A] [B] 11 9 19Number of staff trained in Innovation Engineering [C] 0 0 20
[A] In 2016 and 2017 the number is related to the Innovation Capital Fund (City Clerks).[B] In 2018 the number is a combined Innovation Capital Fund (City Clerks) and Innovation Strategy Program (Innovation,
Transformation and Technology).[C] Innovation Engineering training is a new activity that began in 2018.Note: This service was formerly reported in Organizational Support Service.
Preliminary 2020 Budget - Service Based 2-97

Innovation, Transformation and TechnologyContributing DepartmentsInnovation, Transformation and Technology 100 %
Operating Budget
(in millions of $)2018
Actual *2019
Budget *
2020Preliminary
Budget Expl.2021
Projection2022
Projection2023
ProjectionService revenue 0.146 0.146 - - - -Provincial funding (service specific) - - - - - -Revenues 0.146 0.146 - 1 - - -Salaries and benefits 14.673 16.719 17.756 18.145 18.556 18.938Services 2.583 2.745 2.837 3.012 3.200 3.383Materials, parts, and supplies 3.354 4.313 3.737 3.968 3.934 4.012Assets and purchases 0.648 0.534 0.448 0.503 0.513 0.519Debt and finance charges 1.582 2.974 3.989 5.095 5.382 5.471Grants, transfers and other 1.766 2.039 2.242 2.013 2.095 2.179Recoveries (4.609) (4.211) (4.571) (5.872) (7.226) (8.582)Operating expenses 19.998 25.113 26.439 26.863 26.454 25.921Transfer to Capital - - 1.660 1.190 1.358 1.346Total Expenses 19.998 25.113 28.099 2 28.053 27.812 27.267Mill Rate Support/(Contribution) 19.852 24.967 28.099 28.053 27.812 27.267Full-time Equivalent Positions 152 162 166 167 167 167
* Restated to align with 2020 Budget.
Explanation of 2020 Change from 2019
(in millions of $)1 Revenues
Reclassification of revenue to inter-fund transfer (0.146)(0.146)
2 Expenses1.6601.0371.0150.089
(0.146)(0.250)(0.622)
Transfer to CapitalIncrease in salaries and benefitsIncrease in debt and finance chargesIncrease in transfer to Computer, Critical Systems and Support Systems Reserve Reclassification of revenue to inter-fund transferIncrease in recoveries relating to efficiencies with the Innovation Strategy Program Decrease in softwareMiscellaneous adjustments 0.203
2.986
Full-time Equivalent PositionsIncreaseof4FTEsduetoadditionof6FTEsintheInnovation,Transformation&Technologydepartmentduetocapitalprojectsapprovedinprioryearsandtransferof2FTEsfromtheInnovation,Transformation&TechnologydepartmenttotheCityClerksdepartment.
2-98 Preliminary 2020 Budget - Service Based

Innovation, Transformation and Technology
Service Detail
Sub-services (in millions of $)2018
Actual2019
Budget
2020Preliminary
Budget2021
Projection2022
Projection2023
ProjectionInnovation Revenue - - - - - -
Operating expenses 0.501 2.066 2.206 0.929 (0.304) (1.496)Transfer to Capital - - - - - -
0.501 2.066 2.206 0.929 (0.304) (1.496)Information Technology
Revenue 0.146 0.146 - - - -Operating expenses 17.293 19.698 19.850 20.441 20.972 21.535Transfer to Capital - - - - - -
17.147 19.552 19.850 20.441 20.972 21.535Enterprise Transformation
Revenue - - - - - -Operating expenses 2.204 3.349 4.383 5.493 5.787 5.882Transfer to Capital - - 1.660 1.190 1.358 1.346
2.204 3.349 6.043 6.683 7.145 7.228Mill Rate Support/(Contribution) 19.852 24.967 28.099 28.053 27.812 27.267
Additional Financial Information
Reserves
Balance, December 31 (in millions of $)2018
Actual2019
Forecast
2020Preliminary
Budget2021
Projection2022
Projection2023
ProjectionComp, Critical Sys & Sup Res 1.589 1.293 2.122 2.732 1.286 2.027
Capital Budget2020
Preliminary2021-2025Forecast
6 YearTotal
(In millions of $) 6.776 17.951 24.727
Preliminary 2020 Budget - Service Based 2-99

Economic Development
Description Key GoalsTo encourage economic growth and prosperity in Winnipeg through delivery of Council approved programs, partnership with senior levels of government, and support to partner agencies and businesses as well as to coordinate resources across City departments to respond to high priority projects ofstrategiceconomicimportancetotheCity.
Serviceactivitiesinclude:- Partner with the Province of Manitoba in creation ofbusinessdevelopmentprogramsandinitiatives.- Support partner agencies including EconomicDevelopment Winnipeg and Yes! Winnipeg inbusinessattraction,expansionandretention.- Support CentreVenture Development Corporation instrategic development initiatives, programs anddevelopmentprojectsinthedowntown.- Coordinate interdepartmental responses toconfidential and high profile strategic economicincentiverequeststoattractnewbusiness.- Report and make recommendations to Councilregarding economic development initiatives and taxincrement financing programs to support localbusiness and economic growth and prosperity ofWinnipeg.- Administer Council approved tax incrementfinancing(TIF)programs.- Manage strategic economic development projects.
1. Build a strong economic climate for Winnipeg.2. Facilitate strategic economic development incentives
that demonstrate a return on investment to Winnipeg.3. Identify opportunities to respond to critical success
factors for industries wanting to do business inWinnipeg through existing City services, incentivesand discount programs.
4. Capitalize on opportunities to establishintergovernmental and public/private partnerships.
5. Identify and recommend, policies, processes andresources required to support Manitoba's economicdevelopment strategy and new tax incrementfinancing (TIF) framework.
Service Level StatisticsDescription 2016 2017 2018Residential Building Permit Applications 6,138 6,649 6,493Residential Building Permit Application Value (in millions) $575 $643 $563Commercial Building Permits Issued 3,960 3,657 3,398Commercial Building Permit Value (in millions) $1,203 $1,208 $882Total Building Permit Value (in millions) $1,778 $1,851 $1,445Number of Downtown Development Applications (Construct New, Construct Addition, Alter Exterior)
28 20 19
Construction Value of Downtown Projects Above (in millions) $188 $146 $50Number of Major City-Wide Development Projects (>$2 million)
106 88 81
Construction Value of Major City-Wide Projects (in millions) (>$2 million)
$835 $896 $554
Number of Business Improvement Zones / Businesses in Improvement Zones
16 / 4,748 16 / 4,708 16 / 4,679
2-100 Preliminary 2020 Budget - Service Based

Economic DevelopmentContributing DepartmentsPlanning, Prop. & Devl. 53 %City Clerks 29 %Mayor's Office 18 %
Operating Budget
(in millions of $)2018
Actual2019
Budget
2020Preliminary
Budget Expl.2021
Projection2022
Projection2023
ProjectionService revenue 0.001 1.806 - - - -Provincial funding (service specific)
- - - - - -
Revenues 0.001 1.806 - 1 - - -Salaries and benefits 0.416 0.571 0.362 0.368 0.375 0.382Services 0.320 0.455 0.495 0.495 0.495 0.495Materials, parts and supplies 0.026 0.025 0.025 0.025 0.025 0.025Assets and purchases 0.006 0.001 0.001 0.001 0.001 0.001Debt and finance charges 0.154 0.153 0.021 0.022 0.022 0.022Grants, transfers and other 0.363 0.324 0.317 0.314 0.307 0.300Recoveries (0.123) (0.036) (0.036) (0.037) (0.038) (0.038)Operating expenses 1.161 1.492 1.182 1.187 1.186 1.186Transfer to Capital - 0.001 0.001 0.001 - -Total Expenses 1.161 1.493 1.183 2 1.188 1.186 1.186Mill Rate Support/(Contribution) 1.161 (0.313) 1.183 1.188 1.186 1.186Full-time Equivalent Positions 4 4 3 3 3 3
Explanation of 2020 Change from 2019
(in millions of $) 1 Revenues
Decrease due to one-time transfer from Economic Development Investment Reserve in 2019
(1.806)
(1.806)
2 ExpensesDecrease in salaries and benefits (0.209)Miscellaneous adjustments (0.101)
(0.310)
Full-time Equivalent PositionsChange due to elimination of Economic Development Administrator position.
Additional Financial InformationReserves
Balance, December 31 (in millions of $)2018
Actual2019
Forecast
2020Preliminary
Budget2021
Projection2022
Projection2023
ProjectionDestination Marketing Reserve 14.834 11.254 8.802 8.374 8.042 8.745Economic Dev Invest Reserve 2.482 3.172 3.290 3.324 3.326 3.360
Preliminary 2020 Budget - Service Based 2-101

Winnipeg Fleet Management Agency (SOA)
Description Key GoalsWinnipeg Fleet Management Agency provides economical, state-of-the-art, safe and eco-friendly fleet vehicle, equipment and other asset management services to The City of Winnipeg and other public sector organizations, in support of their service delivery. The Agency delivers the following comprehensive fleet management services to City of Winnipegdepartments:1.Specification,inspectionandprocurement2.Insurance,licensingandregistration3.Manufacturingandfabrication4.Vehicleandequipmentleases,seasonalandshort-termrentals5.Surplussalesanddisposal6.Fuel7. Repair and maintenance
1. Provide planned, and unscheduled, fleet vehicles and equipment to City departments, meeting operational performance, environmental, and safety requirements.
2. Maintain Fleet Service Centres to support the City's geographically dispersed and varying fleet, providing superior customer service, reliability and safety.
3. Manage the City's fuel distribution system on a day-to-day and emergency basis, providing a safe, dependable and convenient fuel supply.
4. Encourage fleet greenhouse gas emission awareness through research, testing, and offering environmentally friendly vehicles and equipment, recommendations and alternative fuels.
Service Level StatisticsDescription 2016 2017 2018Number of vehicle and equipment units managed 2,224 2,199 2,230Number of vehicle and equipment bid opportunities completed 67 64 58Number of vehicle and equipment units acquired 182 265 325Number of insurance and license registrations completed 1,900 1,835 1,935Number of service repairs, by work order lines completed 35,536 33,779 35,373Number of service labour hours completed 71,361 65,735 65,125Number of parts transactions 41,528 35,631 41,543Number of fuel fill-up transactions and odometer readings verified 116,618 115,955 115,275Litres of unleaded gasoline, clear diesel, and marked diesel provided 7,880,797 7,770,068 7,719,032Number of vehicle and equipment motor pool rental days provided 103,518 108,489 109,069Number of vehicle and equipment units disposed 188 234 322
2-102 Preliminary 2020 Budget - Service Based

Winnipeg Fleet Management Agency (SOA)Contributing DepartmentsFleet Management 100 %
Operating Budget
(in millions of $)2018
Actual2019
Budget
2020Preliminary
Budget Expl.2021
Projection2022
Projection2023
ProjectionService Revenue 48.708 48.692 50.828 49.875 49.398 50.153Provincial funding (service specific) 0.174 0.172 0.174 0.174 0.174 0.174Revenues 48.882 48.865 51.002 1 50.049 49.572 50.327Salaries and benefits 9.908 11.043 10.238 9.458 9.270 9.448Services 9.194 8.945 9.963 10.238 10.081 10.292Materials, parts, and supplies 11.431 10.341 11.246 11.557 11.856 11.998Assets and purchases 0.145 0.174 0.146 0.143 0.146 0.150Debt and finance charges 16.448 16.789 17.143 17.054 16.852 16.686Grants, transfers and other 1.532 1.500 1.166 1.049 1.057 1.064Recoveries (0.041) - - - - -Expenses 48.616 48.792 49.902 2 49.500 49.262 49.639Surplus/(Deficit) 0.266 0.072 1.100 0.549 0.310 0.688Full-time Equivalent Positions 120 129 119 109 102 102
Winnipeg Fleet Management Agency (FMA) is a Special Operating Agency (SOA) with its own operating charter approved by Council. SOA budgets are subject to change based on Council approvals in the business plan report process.
Explanation of 2020 Change from 2019
(in millions of $)1 Revenues
Increase in fleet rentals 0.767Increase in other income 0.729Increase in fuel sales 0.535Increase in fleet leases 0.106
2.137
2 ExpensesIncrease in services primarily equipment rental 1.018Increase in fuel 0.623Increase in debt and finance charges, includes amortization 0.354Increase in parts 0.218Increase in other supplies 0.065Decrease in salaries and benefits (0.805)Decrease in dividend transfer to tax supported (0.150)Decrease in civic accommodations costs (0.107)Decrease in other transfer to tax supported (0.062)Miscellaneous adjustments (0.044)
1.110
Full-time Equivalent PositionsDecrease of 2 FTE's in 2020 due to miscellaneous staffing reductions and 8 FTE's due to closure of Waverley repair facility.
Preliminary 2020 Budget - Service Based 2-103

Winnipeg Fleet Management Agency (SOA)
Additional Financial Information
Capital Budget2020
Preliminary2021-2025Forecast
6 YearTotal
(In millions of $) 15.972 83.148 99.120
2-104 Preliminary 2020 Budget - Service Based

Winnipeg Parking Authority (SOA)Includes:
• Parking Facilities • Vehicles for Hire• On-Street Parking Enforcement • MBEA non-parking• On-Street Parking
Description Key GoalsThe Parking Authority provides management for city-owned on-street and off-street parking. It provides leadership to local parking service providers and provides input from a parking services perspective in supportofpublicpolicyobjectives.
The Parking Authority currently manages and administratively supports the Screening and Adjudication process for all Municipal By-law offences which are under the jurisdiction of the Municipal By-law Enforcement Act (MBEA) and Provincial Offences Act.
The Parking Authority also currently provides regulatory and licensing oversight of the Vehicle for Hire industry in the City of Winnipeg including taxis, limousines and personal transportation providers, with an emphasis on safety and accessibility.
1. Manage a dynamic service delivery structure for allon-street and off-street parking in order to manageoccupancy levels as appropriate.
2. Ensure the impartiality and transparency of thescreening and adjudication process under theMunicipal By-law Enforcement Act.
3. Manage the regulatory oversight of the Vehicle forHire industry to ensure safety and accessibility for allcitizens.
4. Improve the quality of service offered to customers inall lines of service.
5. Maintain engagement with key stakeholder groups.6. Optimize the use of agency resources in order to
balance cost efficiencies and high levels of customerservice.
Service Level StatisticsDescription 2016 2017 2018Number of Pay Stations on Street [A] 580 572 375Number of Pay Stations in City Lots 12 12 9Number of Parking and Non-Moving Violations Issued [B] 125,077 162,674 139,239Number of High Demand On-Street Spaces 1,307 1,319 1,287Number of Low Demand On-Street Spaces 2,505 2,571 2,523Average Number of Vehicles for Hire Available per Month [C] n/a n/a 994Total Vehicles for Hire Trips [D] n/a n/a 4,309,216Total Vehicles for Hire Inspections [E] n/a n/a 16,706
[A] Long term construction projects can impact the number of on-street paystations and spaces per zone on a year over year basis.High demand zone numbers include paystations located on-street in vicinity of St. Boniface Hospital and Health SciencesCentre.
[B] Ticket volumes are subject to fluctuations dependent on seasonal events such as street cleaning and snow fall.[C] The City of Winnipeg began licensing and regulating the vehicles for hire industry on March 1, 2018. The average number of
vehicles for hire per month represents the industry capacity. It includes taxi cabs, limousines as well as personal transportationproviders that offer ride sharing services.
[D] The number of trips provided by personal transportation providers increased throughout 2018, however taxi cabs provided thehighest proportion of vehicle for hire trips. In 2018 taxi cabs provided 97% of the total vehicles for hire trips.
[E] As part of the regulatory oversight of the vehicles for hire industry, the City conducts regular inspections of both taxi cabs andpersonal transportation providers to ensure that all vehicle-required safety equipment is functioning as intended as well as topromote safety amongst all industry participants.
Preliminary 2020 Budget - Service Based 2-105

Winnipeg Parking Authority (SOA)Contributing DepartmentsParking Authority SOA 100 %
Operating Budget
(in millions of $)2018
Actual2019
Budget
2020Preliminary
Budget Expl.2021
Projection2022
Projection2023
ProjectionService Revenue 22.784 26.074 23.800 23.899 23.996 24.114Provincial funding (service specific) 0.058 0.055 0.058 0.058 0.058 0.058Revenues 22.842 26.129 23.858 1 23.957 24.053 24.171Salaries and benefits 3.809 4.774 4.975 5.117 5.260 5.406Services 6.774 7.559 7.707 7.639 7.666 7.486Materials, parts, and supplies 0.846 1.536 1.231 1.385 1.357 1.365Assets and purchases 0.084 0.108 0.130 0.103 0.103 0.140Debt and finance charges 2.521 2.335 2.279 2.353 2.347 2.273Grants, transfers and other 11.780 17.537 12.674 7.335 7.294 7.478Recoveries (0.036) (0.003) (0.003) (0.003) (0.003) (0.003)Expenses 25.777 33.847 28.994 2 23.929 24.025 24.145Surplus/(Deficit) (2.935) (7.718) (5.136) 0.028 0.028 0.027Full-time Equivalent Positions 50 61 62 62 62 62
Winnipeg Parking Authority (WPA) is a Special Operating Agency (SOA) with its own operating charter approved by Council. SOA budgets are subject to change based on Council approvals in the business plan report process.
Explanation of 2020 Change from 2019
(in millions of $)1 Revenues
Decrease in enforcement revenue (1.421)Decrease in parking permits and meter fee revenue (1.234)Parking revenue (not budgeted in 2019) offset in grants in kind expenses 0.290Miscellaneous adjustments 0.094
(2.271)
2 ExpensesElimination of one-time transfer to Land Operating Reserve in 2019 (4.405)Elimination of one-time transfer to the General Capital Fund in 2019 for Civic Parkade demolition.
(1.434)
Decrease in other equipment servicing (0.625)Decrease in computer software (0.268)Decrease in City of Winnipeg property tax (0.102)Increase in dividend transfer to General Revenue Fund 1.138Increase in professional services 0.390Increase in paystation maintenance 0.266Increase in salaries and benefits 0.201Miscellaneous adjustments (0.014)
(4.853)
2-106 Preliminary 2020 Budget - Service Based
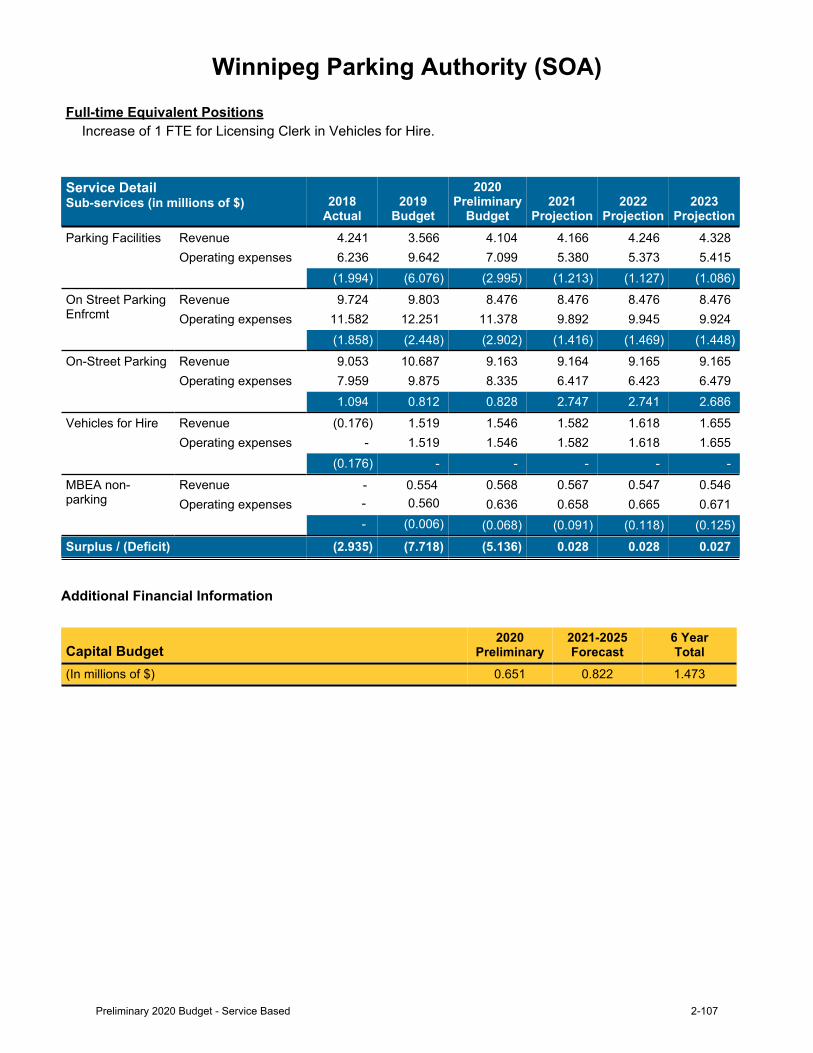
Winnipeg Parking Authority (SOA)Full-time Equivalent Positions
Increase of 1 FTE for Licensing Clerk in Vehicles for Hire.
Service DetailSub-services (in millions of $) 2018
Actual2019
Budget
2020Preliminary
Budget2021
Projection2022
Projection2023
ProjectionParking Facilities Revenue 4.241 3.566 4.104 4.166 4.246 4.328
Operating expenses 6.236 9.642 7.099 5.380 5.373 5.415(1.994) (6.076) (2.995) (1.213) (1.127) (1.086)
On Street Parking Enfrcmt
Revenue 9.724 9.803 8.476 8.476 8.476 8.476Operating expenses 11.582 12.251 11.378 9.892 9.945 9.924
(1.858) (2.448) (2.902) (1.416) (1.469) (1.448)On-Street Parking Revenue 9.053 10.687 9.163 9.164 9.165 9.165
Operating expenses 7.959 9.875 8.335 6.417 6.423 6.4791.094 0.812 0.828 2.747 2.741 2.686
Vehicles for Hire Revenue (0.176) 1.519 1.546 1.582 1.618 1.655Operating expenses - 1.519 1.546 1.582 1.618 1.655
(0.176) - - - - -MBEA non-parking
Revenue - 0.554 0.568 0.567 0.547 0.546Operating expenses - 0.560 0.636 0.658 0.665 0.671
- (0.006) (0.068) (0.091) (0.118) (0.125)Surplus / (Deficit) (2.935) (7.718) (5.136) 0.028 0.028 0.027
Additional Financial Information
Capital Budget2020
Preliminary2021-2025Forecast
6 YearTotal
(In millions of $) 0.651 0.822 1.473
Preliminary 2020 Budget - Service Based 2-107

Golf Services (SOA)
Description Key GoalsThe City of Winnipeg has operated municipal golf courses since 1921. Winnipeg Golf Services was established in 2002 to administer the City's 12 golf course assets. The Agency is responsible for operating and maintaining golf courses, managing contracts and leases for City lands used by privately operated golf courses, managing a contracted cross country ski operation and managing the lease for Thermea Spa.
1. Ensure financial and environmental sustainability.2. Provide high quality customer service.3. Improve golf course playability.4. Improve the image of municipal courses.
Service Level StatisticsDescription 2016 2017 2018Kildonan (39.49 hectares)
Days Open 189 186 179Total Rounds 26,184 24,034 24,884
Windsor (46.13 hectares) Days Open 181 166 171Total Rounds 21,305 20,638 21,482
Crescent Drive (15.39 hectares) Days Open 174 158 159Total Rounds 15,029 13,872 14,158
Harbour View (12.8 hectares) Days Open 189 187 174Total Rounds 11,251 10,262 9,609
There are four different types of arrangements under which the golf courses are managed: - City Operated and Maintained: Kildonan Park, Windsor Park, Crescent Drive - Leased Properties: Rossmere, St. Boniface, Transcona, Wildwood Club, Assiniboine, Canoe Club, Tuxedo - Managed Contract: John Blumberg - City Maintained/Contractor Operated: Harbour View Golf Course and Recreation Complex
2-108 Preliminary 2020 Budget - Service Based

Golf Services (SOA)Contributing DepartmentsGolf Services SOA 100 %
Operating Budget
(in millions of $)2018
Actual2019
Budget
2020Preliminary
Budget Expl.2021
Projection2022
Projection2023
ProjectionService Revenue 2.275 2.258 2.430 2.532 2.620 2.709Grant from the City 0.730 0.730 0.730 0.730 0.730 0.730Provincial funding (service specific) 0.023 0.025 0.023 0.023 0.023 0.023Revenues 3.027 3.013 3.184 1 3.285 3.373 3.462Salaries and benefits 1.246 1.517 1.512 1.539 1.580 1.616Services 0.650 0.716 0.634 0.620 0.633 0.649Materials, parts and supplies 0.213 0.272 0.210 0.215 0.224 0.223Assets and purchases - - - - - -Debt and finance charges 0.346 0.309 0.337 0.331 0.320 0.305Grants, transfers and other 0.024 0.029 0.025 0.026 0.026 0.027Recoveries - - - - - -Operating expenses 2.479 2.843 2.719 2.730 2.783 2.820Transfer to Capital - - - - - -Total Expenses 2.479 2.843 2.719 2 2.730 2.783 2.820Surplus/(Deficit) 0.548 0.170 0.464 0.555 0.590 0.643Full-time Equivalent Positions 20 24 24 24 24 24Winnipeg Golf Services is a Special Operating Agency (SOA) with its own operating charter approved by Council. SOA budgets are subject to change based on Council approvals in the business plan report process. Explanation of 2020 Change from 2019
(in millions of $)1 Revenues
Increase in service revenue 0.172Miscellaneous adjustments (0.001)
0.171
2 ExpensesDecrease in services costs (0.082)Decrease in materials, parts and supplies (0.062)Miscellaneous adjustments 0.020
(0.124)
Preliminary 2020 Budget - Service Based 2-109

Animal Services (SOA)
Description Key GoalsTo provide animal control measures under the Responsible Pet Ownership By-Law. The Agency's servicesinclude:
- Licensing:Petlicensingandpermits.- Kenneling: Kenneling and care for stray pets.Quarantinekennelingforbitingdogs.- Adoption: A progressive adoption program forunclaimeddogs,whichreduceseuthanasia.- Educational Outreach: Attendance at communityevents regarding responsible pet ownership and petsafety. Additional ongoing presentations to schoolgroups,serviceorganizations,andnewcomergroups.- By-Law Enforcement: Enforcement of theResponsible Pet Ownership By-Law, neighbourhooddispute resolution, investigation and response, pickup of injured animals, after hours emergencyresponse, police and fire assists, investigation ofillegalanimalcomplaints.
The Agency also provides funding to the Winnipeg Humane Society for the intake/sheltering of stray cats, care of injured animals, and a subsidized cat spray/neutering program.
1. Increase customer service and satisfaction.2. Improve health and safety of neighbourhoods.3. Enhance the Agency's public image.
Service Level StatisticsDescription 2016 2017 2018Number of requests for service 11,974 12,755 10,325Number of dogs impounded 973 987 972Number of dogs adopted 256 239 286Number of dogs returned to owners by the Animal Services Agency 621 646 564Number of licensed pets reunited with their owner by 311 [A] 584 670 534Number of dogs sent to rescues 65 65 28Number of dogs euthanized [B] 28 31 32Number of biting dog complaints 246 236 248Number of biting dogs quarantined 77 60 78Number of dogs running at large complaints 2,420 2,402 2,646Number of cats running at large complaints 538 680 783Number of current dog licenses 54,582 51,665 48,302Number of current cat licenses 28,901 27,026 26,053Number of by-law charges laid 1,095 1,045 749
[A] Includes dogs and cats wearing licenses reunited by 311 without those pets setting foot in an animal shelter.[B] Out of the 32 dogs euthanized in 2018, 12 had bitten people.
2-110 Preliminary 2020 Budget - Service Based

Animal Services (SOA)Contributing DepartmentsAnimal Services SOA 100 %
Operating Budget
(in millions of $)2018
Actual2019
Budget
2020Preliminary
Budget Expl.2021
Projection2022
Projection2023
ProjectionService Revenue 2.643 2.505 2.588 2.603 2.618 2.632Grant from the City 1.295 0.771 0.771 1.271 1.271 1.271Provincial funding (service specific) 0.027 0.028 0.027 0.027 0.027 0.027Revenues 3.965 3.304 3.387 1 3.901 3.916 3.931Salaries and benefits 1.587 1.913 2.000 2.038 2.088 2.133Services 0.363 0.461 0.378 0.354 0.355 0.357Materials, parts and supplies 0.138 0.127 0.132 0.132 0.131 0.131Assets and purchases 0.042 0.009 0.009 0.009 0.009 0.009Debt and finance charges 0.057 0.057 0.046 0.044 0.039 0.039Grants, transfers and other 1.258 1.247 1.185 1.185 1.185 1.175Recoveries - - - - - -Expenses 3.445 3.814 3.750 2 3.762 3.807 3.844Surplus/(Deficit) 0.520 (0.510) (0.364) 0.139 0.109 0.087Full-time Equivalent Positons 25 27 27 27 27 27
Animal Services is a Special Operating Agency (SOA) with its own operating charter approved by Council. SOA budgets are subject to change based on Council approvals in the business plan report process. The mill rate support grant from the City is administered through the Community Services Department. This includes funding in the amount of $652,273 annually for a Service Agreement with the Winnipeg Humane Society for the intake/sheltering of stray cats, care of injured animals and a subsidized cat spray/neutering program.
Explanation of 2020 Change from 2019
(in millions of $)1 Revenues
Increase in citation revenue 0.058Increase in regulation fees 0.016Miscellaneous adjustments 0.009
0.083
2 Expenses0.087
(0.035)(0.033)(0.031)(0.030)(0.024)
Increase in salaries and benefitsDecrease in postageDecrease in advertisingDecrease in grantsDecrease in recovery from General Revenue Decrease in capital leaseMiscellaneous adjustments 0.002
(0.064)
Preliminary 2020 Budget - Service Based 2-111

2-112 Preliminary 2020 Budget - Service Based
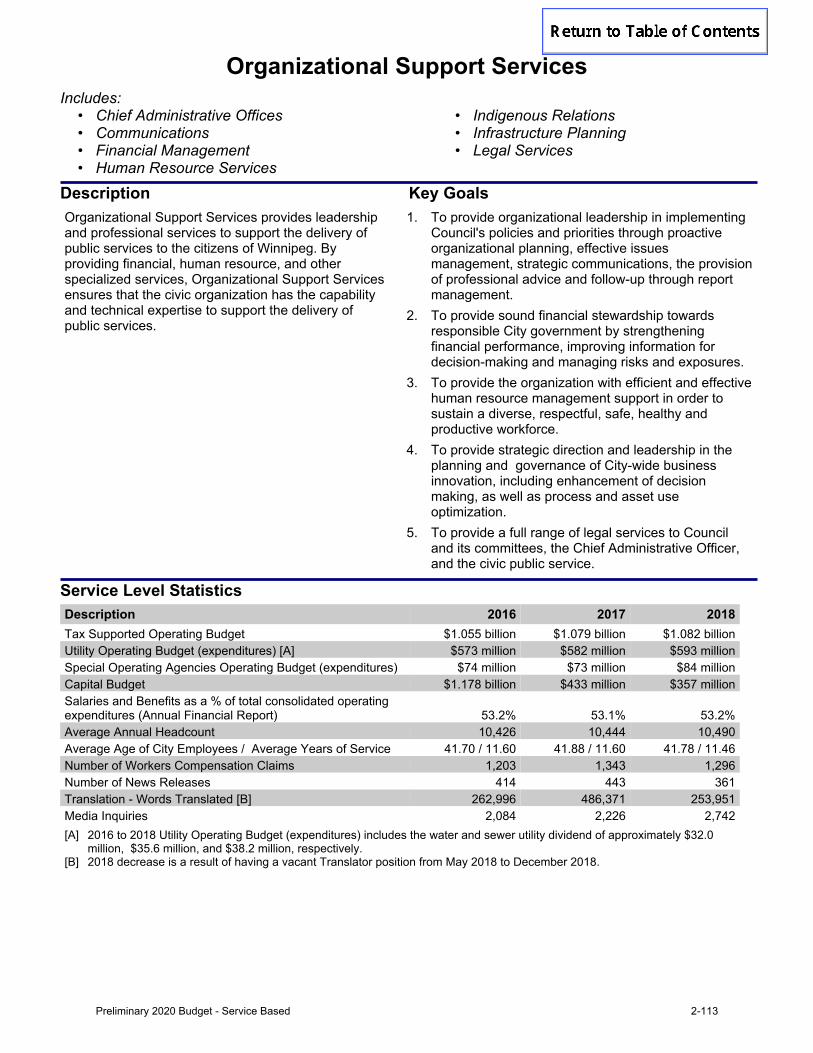
Organizational Support ServicesIncludes:
• Chief Administrative Offices • Indigenous Relations• Communications • Infrastructure Planning• Financial Management • Legal Services• Human Resource Services
Description Key GoalsOrganizational Support Services provides leadership and professional services to support the delivery of public services to the citizens of Winnipeg. By providing financial, human resource, and other specialized services, Organizational Support Services ensures that the civic organization has the capability and technical expertise to support the delivery of public services.
1. To provide organizational leadership in implementing Council's policies and priorities through proactive organizational planning, effective issues management, strategic communications, the provision of professional advice and follow-up through report management.
2. To provide sound financial stewardship towards responsible City government by strengthening financial performance, improving information for decision-making and managing risks and exposures.
3. To provide the organization with efficient and effective human resource management support in order to sustain a diverse, respectful, safe, healthy and productive workforce.
4. To provide strategic direction and leadership in the planning and governance of City-wide business innovation, including enhancement of decision making, as well as process and asset use optimization.
5. To provide a full range of legal services to Council and its committees, the Chief Administrative Officer, and the civic public service.
Service Level StatisticsDescription 2016 2017 2018Tax Supported Operating Budget $1.055 billion $1.079 billion $1.082 billionUtility Operating Budget (expenditures) [A] $573 million $582 million $593 millionSpecial Operating Agencies Operating Budget (expenditures) $74 million $73 million $84 millionCapital Budget $1.178 billion $433 million $357 millionSalaries and Benefits as a % of total consolidated operating expenditures (Annual Financial Report) 53.2% 53.1% 53.2%Average Annual Headcount 10,426 10,444 10,490Average Age of City Employees / Average Years of Service 41.70 / 11.60 41.88 / 11.60 41.78 / 11.46Number of Workers Compensation Claims 1,203 1,343 1,296Number of News Releases 414 443 361Translation - Words Translated [B] 262,996 486,371 253,951Media Inquiries 2,084 2,226 2,742[A] 2016 to 2018 Utility Operating Budget (expenditures) includes the water and sewer utility dividend of approximately $32.0
million, $35.6 million, and $38.2 million, respectively.[B] 2018 decrease is a result of having a vacant Translator position from May 2018 to December 2018.
Preliminary 2020 Budget - Service Based 2-113

Organizational Support ServicesIndigenous Relations
Description Key GoalsEnhancing the City of Winnipeg's role to be a leader in reconciliation and Indigenous Relations in Winnipeg. Including but not limited to initiatives such as:- Implementing the 5 Truth and Reconciliation Calls to Actionsdirectedatmunicipalities: - Number 43 UNDRIP (United Nations Declaration oftheRightsofIndigenousPeoples)-Number47DoctrineofDiscovery-Number57Training-Number77Archives-Number75Cemeteries- Oshki Annishinabe - the City of Winnipeg's IndigenousYouthStrategy-WelcomingWinnipeg- The Indigenous Accord
1. To provide leadership and guidance to empower departments to become municipal leaders in Indigenous relations through the implementation of the Truth and Reconciliation Commission's Call to Action and other reconciliation based initiatives.
2. To collaborate with stakeholders and provide resources that support Indigenous community priorities.
Service Level StatisticsDescription 2016 2017 2018INTERNAL Number of internal requests for support 63 26 38Number of policy, process, system or physical changes 2 3 9Number of staff who participated in education and awareness opportunities 542 3,364 5,546Number of Internal partnerships and initiatives maintained, developed or enhanced that support Indigenous citizen participation in the civic system 28 35 34EXTERNAL Number of external requests for support 104 83 72Number of youth participants 292 335 204Number of external partnerships and initiatives maintained, developed or enhanced that support Indigenous citizens participation in Winnipeg's economy 45 42 40Number of Accord partners n/a 105 135
2-114 Preliminary 2020 Budget - Service Based

Organizational Support ServicesContributing DepartmentsCorporate Finance 31 %Human Resource Services 22 %CAO's Office 20 %Legal Services 17 %Customer Service & Communications 10 %
Operating Budget
(in millions of $)2018
Actual *2019
Budget *
2020Preliminary
Budget Expl2021
Projection2022
Projection2023
ProjectionService revenue 0.787 0.613 0.801 0.774 0.659 0.659Provincial funding (service specific) 0.079 - 0.070 0.070 0.070 0.070Revenues 0.866 0.613 0.871 1 0.844 0.729 0.729Salaries and benefits 21.644 22.501 23.664 24.466 24.841 25.406Services 2.046 2.408 2.586 2.337 2.243 2.171Materials, parts and supplies 0.296 0.297 0.304 0.300 0.300 0.300Assets and purchases 0.089 0.140 0.147 0.140 0.140 0.140Debt and finance charges 0.002 0.002 0.002 0.002 0.002 0.002Grants, transfers and other 2.564 3.443 3.095 3.109 3.111 3.112Recoveries (3.341) (3.260) (3.036) (3.106) (3.147) (3.183)Operating expenses 23.300 25.532 26.762 27.248 27.490 27.947Transfer to Capital - - - - - -Total Expenses 23.300 25.532 26.762 2 27.248 27.490 27.947Mill Rate Support/(Contribution) 22.434 24.919 25.892 26.404 26.761 27.218Full-time Equivalent Positions 223 223 221 223 220 220
* Restated to align with 2020 Budget.
Explanation of 2020 Change from 2019
(in millions of $)1 Revenues
Increase in federal grants 0.146Miscellaneous adjustments 0.112
0.258
2 ExpensesIncrease in salaries and benefits 1.163Increase in consulting services 0.342One-timecostformappingandmodelingforClimate Action Plan
0.200
Decrease in recoveries due to salaries and non-salary expenditures no longer recovered from other departments
0.149
Increase in civic accommodations costs 0.107Reduction in grants and community contributions (0.385)Decrease in professional services due to transfer of Employee Assistance Program budget to departments
(0.281)
Increase in recoveries due to increase in investment management fees charged to reserves
(0.117)
Miscellaneous adjustments 0.0521.230
Preliminary 2020 Budget - Service Based 2-115

Organizational Support Services
Full-time Equivalent PositionsDecrease of 2.00 FTEs is the result of deleted positions, net of added positions, in various Departments (Human Resource Services -1.50 FTE, Corporate Finance -2.25 FTE, Legal Services +1.50 FTE, and CAO's Office +0.25 FTE). Customer Service & Corporate Communications +1.00 FTE transfer from Water & Waste and -1.00 FTE as a result of reductions in internal French language services.
Service Detail
Sub-services (in millions of $)2018
Actual2019
Budget
2020Preliminary
Budget2021
Projection2022
Projection2023
ProjectionChief Administrative Offices
Revenue 0.019 - 0.146 0.116 - -Operating expenses 2.052 2.100 2.462 2.316 2.248 2.293Transfer to Capital - - - - - -
2.033 2.100 2.316 2.200 2.248 2.293Communications Revenue 0.070 - 0.070 0.070 0.070 0.070
Operating expenses 2.024 2.242 2.601 2.673 2.616 2.686Transfer to Capital - - - - - -
1.954 2.242 2.531 2.603 2.546 2.616Financial Management
Revenue 0.136 0.138 0.180 0.184 0.184 0.184Operating expenses 8.266 8.342 8.218 8.396 8.604 8.793Transfer to Capital - - - - - -
8.130 8.204 8.039 8.212 8.421 8.609Human Resource Services
Revenue - - - - - -Operating expenses 6.098 6.055 6.027 6.144 6.248 6.348Transfer to Capital - - - - - -
6.098 6.055 6.027 6.144 6.248 6.348Indigenous Relations
Revenue - - - - - -Operating expenses 1.620 2.127 1.894 1.898 1.913 1.925Transfer to Capital - - - - - -
1.619 2.127 1.894 1.898 1.913 1.925Infrastructure Planning
Revenue - - - - - -Operating expenses - 1.207 1.099 1.118 1.144 1.171Transfer to Capital - - - - - -
- 1.207 1.099 1.118 1.144 1.171Legal Services Revenue 0.640 0.475 0.475 0.475 0.475 0.475
Operating expenses 3.240 3.459 4.461 4.703 4.715 4.731Transfer to Capital - - - - - -
2.600 2.984 3.986 4.228 4.240 4.256Mill Rate Support/(Contribution) 22.434 24.919 25.892 26.404 26.761 27.218
2-116 Preliminary 2020 Budget - Service Based

Assessment, Taxation and CorporateIncludes:
• Assessment and Taxation• Corporate Accounts
Description Key GoalsTo provide timely and accurate property and business valuations, tax billing and collection services. General revenue and corporate expenses/savings that are not attributable directly to any other public or internalservice,include:-Taxationrevenueandtaxcredits.-OperatinggrantsfromtheProvinceofManitoba.- Provincial payroll tax and offsetting support grant fromtheProvince.- Revenue from sale of Winnipeg Hydro/utility dividends.-Pensioncontributionadjustments.-Interestincome.- Debt and finance charges not attributable to any otherCityservices.- Corporate risk management.
1. Provide valuations that are accessible to the public.2. Reduce the financial risk of assessment appeals.3. Provide accurate valuations that are fair and timely.4. Enhance the understanding of valuations and their
underlying principles both internally and externally.5. Deliver a timely, accurate tax billing and collection
service.6. Improve customer service.
Service Level StatisticsDescription 2016 2017 2018Budgeted Revenue: Property tax $550.5 million $570.2 million $586.9 million Business tax $57.3 million $57.5 million $56.9 million Other taxation $23.8 million $24.1 million $24.2 millionProperty Tax: Residential properties 213,073 215,871 218,361 Non-residential properties 13,816 13,799 13,873 % Residential 93.9% 94.0% 94.0% % Non-residential 6.1% 6.0% 6.0% Total market value assessment $84.2 billion $85.3 billion $89.6 billion Total taxable portioned assessment $40.9 billion $41.4 billion $43.6 billion % Residential 72.8% 73.2% 72.06% % Non-residential 27.2% 26.8% 27.94%Number of real and personal property assessment notices produced [A] 220,686 26,208 225,735Business tax: Number of businesses 15,720 15,393 15,708Collections: Current 97.9% 97.7% 98.0%Arrears 66.5% 63.8% 59.8%
[A] General Reassessment in 2016 and 2018
Preliminary 2020 Budget - Service Based 2-117

Assessment, Taxation and CorporateContributing DepartmentsAssessment & Taxation 77 %Corporate Accounts 23 %
Operating Budget
(in millions of $)2018
Actual2019
Budget
2020Preliminary
Budget Expl. 2021
Projection2022
Projection2023
ProjectionProperty Taxation 585.591 607.737 634.562 658.509 680.725 705.092Business Taxation 56.916 56.916 57.916 57.916 57.916 57.916Other Taxation 25.732 25.978 27.376 28.125 28.849 29.693Provincial grants 68.350 68.440 68.347 68.347 68.347 68.347Sale of Winnipeg Hydro 16.000 16.000 16.000 16.000 16.000 16.000Utility Dividend 38.215 34.212 34.587 35.681 36.693 37.721Transfers from Other City Funds 4.400 13.085 (4.877) (6.734) 4.641 24.308Other corporate revenue (primarily tax penalty interest, general government charges, and dividend from Parking Authority)
39.822 41.692 45.580 40.445 40.473 40.466
Revenues 835.026 864.060 879.491 1 898.288 933.643 979.544Salaries and benefits 2.031 13.879 11.629 10.048 10.077 9.396Services 2.771 3.964 4.639 4.537 4.712 5.014Materials, parts and supplies 0.283 0.383 0.388 0.402 0.402 0.417Assets and purchases 0.018 0.036 0.042 0.042 0.042 0.042Debt and finance charges (1.231) 5.777 5.830 7.365 7.275 7.122Grants, transfers and other 42.940 10.639 4.438 (16.907) (12.753) (3.966)Recoveries (0.700) (0.507) (0.615) (0.625) (0.636) (0.646)Operating expenses 46.111 34.172 26.351 4.861 9.119 17.378Transfer to Capital - (1.995) - 0.237 0.412 -Total Expenses 46.111 32.178 26.351 2 5.098 9.531 17.378Mill Rate Support/(Contribution) (788.915) (831.882) (853.140) (893.190) (924.112) (962.166)Full-time Equivalent Positions 121 131 130 130 130 130
2-118 Preliminary 2020 Budget - Service Based

Assessment, Taxation and CorporateExplanation of 2020 Change from 2019
(in millions of $)1 Revenues
Increase in the municipal property tax due to growth in the assessment base and reduction in tax credits
26.825
Increase in tax penalty revenue 1.900Increase in electricity and gas tax revenue 1.300Increase in dividend from Winnipeg Parking Authority 1.138Increase in short term investment interest 1.063Increase in business tax revenue due to a decrease in the transfer to the Economic Development Reserve related to Old Tuxedo Yards
1.000
Transfer from Financial Stabilization Reserve (15.263)Transfer from Insurance Reserve (1.700)Transfer from Workers Compensation Reserve (1.000)Miscellaneous adjustments 0.168
15.4312 Expenses
Decrease in capital closing surplus from $2,524,798 in 2019 to nil in 2020 2.525Increase in funding for the review of the Winnipeg Police Pension Fund 0.350Increase in provincial payroll tax 0.293Increase in insurance premiums and claims 0.184Increase in efficiency savings from $12,276,146 in 2019 to $15,200,342 in 2020 (2.924)Decrease due to pension contribution adjustment for police pension (2.308)Decrease in municipal tax (appeal losses) (2.300)Decrease in provision for cost increases (0.785)Transfer to Capital (0.530)Transfer to Land Operating Reserve (0.131)Decrease in cyclical expenses related to General Assessment (0.122)Miscellaneous adjustments (0.079)
(5.827)
Full-time Equivalent PositionsDecrease due to deletion of 1 Clerk B FTE in Assessment and Taxation Department.
Preliminary 2020 Budget - Service Based 2-119

Assessment, Taxation and Corporate
Service DetailSub-services (in millions of $) 2018
Actual2019
Budget
2020Preliminary
Budget2021
Projection2022
Projection2023
ProjectionAssessment and Taxation
Revenue 692.183 714.516 745.560 770.293 793.326 818.550Operating expenses 25.164 23.024 20.272 20.469 20.057 20.331Transfer to Capital - 0.530 - 0.237 0.412 -
(667.019) (690.962) (725.287) (749.587) (772.856) (798.218)Corporate Revenue 142.844 149.544 133.932 127.996 140.317 160.994
Operating expenses 22.460 11.149 6.079 (15.608) (10.938) (2.953)Transfer to Capital (1.512) (2.525) - - - -
(121.896) (140.920) (127.853) (143.603) (151.256) (163.947)Mill Rate Support/(Contribution) (788.915) (831.882) (853.140) (893.190) (924.112) (962.166)
Additional Financial Information
Reserves
Balance, December 31 (in millions of $)2018
Actual2019
Forecast
2020Preliminary
Budget2021
Projection2022
Projection2023
Projection
Commitment Reserve 3.648 3.913 2.574 2.428 2.641 2.558Financial Stabilization Res 110.961 107.766 111.786 118.743 114.400 90.344General Purpose Reserve 0.173 0.171 0.173 0.175 0.177 0.179Impact Fee Reserve 16.702 30.375 44.231 58.694 73.874 84.644Insurance Reserve 4.758 3.076 3.108 3.141 3.174 3.208Workers Compensation Reserve 3.173 3.325 3.360 3.395 3.431 3.467
Capital Budget2020
Preliminary2021-2025Forecast
6 YearTotal
(In millions of $) 1.111 1.111
2-120 Preliminary 2020 Budget - Service Based
-

Contact Centre - 311
Description Key GoalsTo provide accurate information and enhanced customer service through requests for non-emergency services to the citizens and customers of the City of Winnipeg through a single point of contact.
1. Improve citizen satisfaction through the ease of use and access to 311.
2. Improve call tracking capabilities to better analyze citizen needs for service.
3. Improve service request routing and tracking to ensure accountability to citizens.
Service Level StatisticsDescription 2016 2017 2018Total Calls Received [A] 1,074,895 959,676 858,962Total Calls Answered [A] [B] 798,068 808,666 666,565Number of Service Requests 273,681 496,946 417,628Number of Information Requests 692,103 646,192 583,016Number of Emails [F] 113,392 107,082 93,107Average Talk Time (in minutes) [G] 4:53 4:39 4:54Average Wait Time (in minutes) [C] 5:53 3:04 7:36Number of Self Service Online [E] 2,000 1,782 2,032Number of Mobile App Interactions [E] 1,311 1,032 1,464Number of In-person Interactions [D] [E] 27,404 6,459 22,360Number of Social Media Interactions [E] 12,726 13,862 12,969
[A] The difference between Total Calls Received and Total Calls Answered is due to a combination of abandoned calls, as well as the use of an Interactive Voice Response (IVR) system which answers the caller's question without needing to speak to an agent.
[B] Overall call volumes decreased but complex calls are seen requesting more detailed information, especially as it relates to spring/yard waste cleaning, snow clearing, Assessment and Taxation and Transit. More interactions are also seen in other service channels other than phone.
[C] Increase in 2018 wait time due to issues with staffing.[D] Decrease in 2017 In Person Interactions is attributable to lack of recording the statistic.[E] 2016 and 2017 restated to correct a reporting error.[F] 2016 restated to correct a reporting error.[G] 2017 restated to correct a reporting error.
Preliminary 2020 Budget - Service Based 2-121

Contact Centre - 311Contributing DepartmentsCustomer Service and Communications 100 %
Operating Budget
(in millions of $)2018
Actual2019
Budget
2020Preliminary
Budget Expl.2021
Projection2022
Projection2023
ProjectionService revenue 1.451 1.452 - - - -Provincial funding (service specific) - - - - - -Revenues 1.451 1.452 - 1 - - -Salaries and benefits 5.123 5.105 4.944 4.734 4.841 4.933Services 0.541 0.606 0.561 0.561 0.561 0.561Materials, parts, and supplies 0.013 0.109 0.109 0.109 0.109 0.109Assets and purchases 0.008 0.006 0.006 0.006 0.006 0.006Debt and finance charges 0.004 0.001 0.001 0.001 0.001 0.001Grants, transfers and other 0.415 0.481 0.417 0.429 0.442 0.455Recoveries (0.012) (0.012) (1.517) (1.519) (1.521) (1.524)Operating expenses 6.093 6.295 4.522 4.322 4.440 4.541Transfer to Capital - - 0.122 0.100 - 0.100Total Expenses 6.093 6.295 4.644 2 4.422 4.440 4.641Mill Rate Support/(Contribution) 4.641 4.843 4.644 4.422 4.440 4.641Full-time Equivalent Positions 101 84 80 75 75 75
Explanation of 2020 Change from 2019
(in millions of $)1 Revenues
Reclassification of revenue to inter-fund transfer (1.452)(1.452)
2 ExpensesTransfer to Capital 0.122Increase in inter-fund transfer from Winnipeg Parking Authority relating to Vehicle for Hire
(0.051)
Decrease in salaries and benefits (0.161)Reclassification of revenue to inter-fund transfer (1.452)Miscellaneous adjustments (0.109)
(1.651)
Full-time Equivalent PositionsNet decrease of 4 FTEs largely due to reducing the number of Customer Service Representatives in the call centre.
Capital Budget2020
Preliminary2021-2025Forecast
6 YearTotal
(In millions of $) 0.122 0.200 0.322
2-122 Preliminary 2020 Budget - Service Based
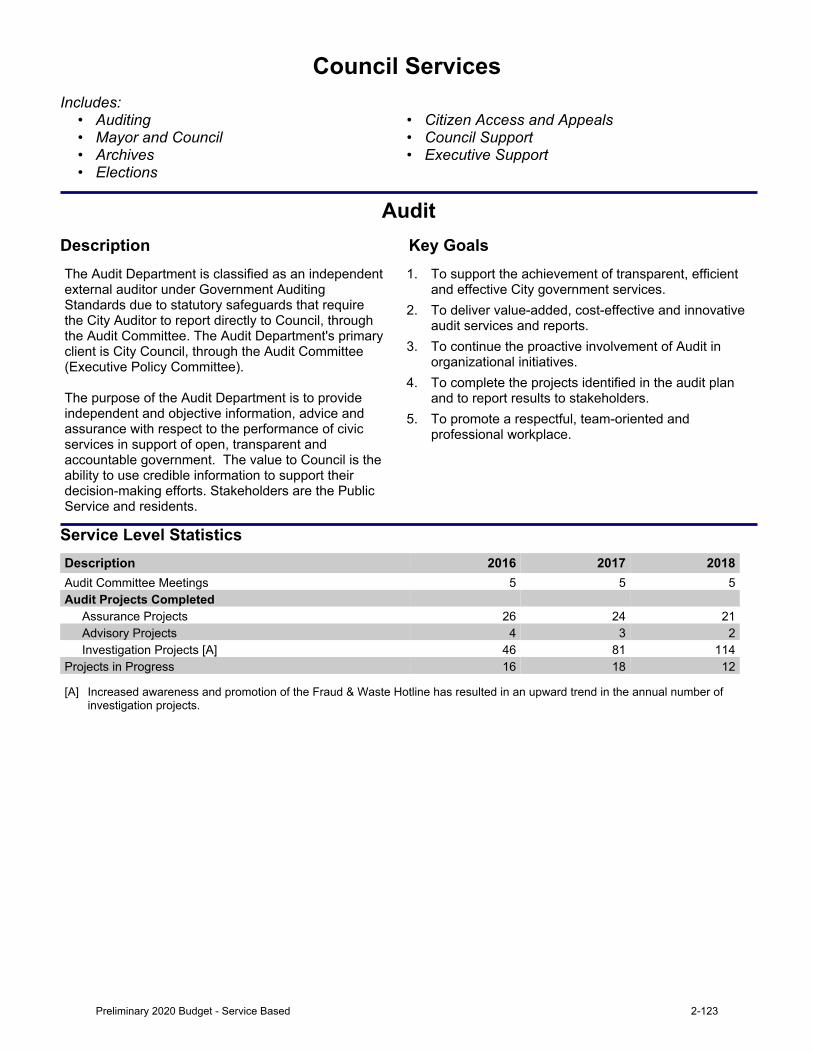
Council ServicesIncludes:
• Auditing • Citizen Access and Appeals• Mayor and Council • Council Support• Archives • Executive Support• Elections
AuditDescription Key GoalsThe Audit Department is classified as an independent external auditor under Government Auditing Standards due to statutory safeguards that require the City Auditor to report directly to Council, through the Audit Committee. The Audit Department's primary client is City Council, through the Audit Committee (ExecutivePolicyCommittee).The purpose of the Audit Department is to provide independent and objective information, advice and assurance with respect to the performance of civic services in support of open, transparent and accountable government. The value to Council is the ability to use credible information to support their decision-making efforts. Stakeholders are the Public Service and residents.
1. To support the achievement of transparent, efficient and effective City government services.
2. To deliver value-added, cost-effective and innovative audit services and reports.
3. To continue the proactive involvement of Audit in organizational initiatives.
4. To complete the projects identified in the audit plan and to report results to stakeholders.
5. To promote a respectful, team-oriented and professional workplace.
Service Level StatisticsDescription 2016 2017 2018Audit Committee Meetings 5 5 5Audit Projects Completed
Assurance Projects 26 24 21Advisory Projects 4 3 2Investigation Projects [A] 46 81 114
Projects in Progress 16 18 12
[A] Increased awareness and promotion of the Fraud & Waste Hotline has resulted in an upward trend in the annual number of investigation projects.
Preliminary 2020 Budget - Service Based 2-123

Council Services
City ClerksDescription Key GoalsThe City Clerk's Department provides direct policy, procedural and administrative services to the Mayor, Speaker and Members of Council, Executive Policy Committee, Standing Policy Committees, the Mayor's Office and Senior Administrators. The Department is the gateway to the City for political decision-making and providing access to information about the City, its services and the decision-making process. It captures, communicates and maintains a complete and accurate recordofallCouncildecisionssincetheCity'sinception.The City Clerk's Department has statutory responsibility for the administration of elections and by-elections as designated by The City of Winnipeg Charter, The Municipal Councils and School Boards Elections Act and for supporting Council and its Committees under The City Organization By-law, and undertakes all hearings related to assessment appeals through the Board of Revision. As well, the Department coordinates requests for access to information under The Freedom of Information and Protection of Privacy Act (FIPPA), leads the City-wide records and information management program and preserves civic history through the operation of the City of Winnipeg Archives.
1. To lead in the provision of customer service to our varied clients including the Mayor's Office, Councillors, the Administration and the Public.
2. Enable cost savings and improve delivery of services to Council and the Public through the ongoing development of information technology by continuing to enhance Open Government, e-government and other electronic systems.
3. Review existing systems to ensure they are in keeping with changing environmental conditions and making full usage of technology and processes to reduce costs and maximize efficiency.
4. Ensure democracy at the local government level with ongoing election planning and delivery for by-elections and general elections.
Service Level StatisticsDescription 2016 2017 2018Total Committee meetings held 318 277 244Public Council / Standing Committee meetings undertaken 116 114 84Committee meeting videos - live streamed & posted 220 241 222Board of Revision appeals filed 765 5,653 602Board of Revision hearings 423 337 318Board of Adjustment meetings 24 24 23Board of Adjustment orders issued 297 257 322Appeal Committee hearings 84 66 66Decision Making Information System site visits [A] n/a n/a 527,385Decision Making Information System documents posted 802 1,004 811FIPPA requests processed 855 859 917Records requested from Records Centre 1,432 1,301 903Records requested from Archives 1,562 1,473 1,061In-person visits to Archives 302 347 353Mail and phone inquiries processed by Archives 1,110 1,021 908Public tours 14 29 11Archival exhibits 4 5 4Records transferred to Archives/Records Centre 1,174 961 155Records destroyed - By-law 86/2010 (Cu. Ft.) 1,602 40 405Visits to Archives Website [B] 47,206 35,579 105,475 [A] Method to track statistics has been modified from previous years. [B] 2018 includes the addition of visits to the Winnipeg in Focus website.
2-124 Preliminary 2020 Budget - Service Based

Council ServicesContributing DepartmentsCity Clerk's 44 %Council 29 %Mayor's Office 11 %Audit 10 %Policy & Strategic Initiatives 6 %Operating Budget
(in millions of $)2018
Actual2019
Budget
2020Preliminary
Budget Expl.2021
Projection2022
Projection2023
ProjectionService revenue 1.617 0.516 0.096 0.516 0.096 0.516Provincial funding (service specific) 0.014 - - - - -Revenues 1.631 0.516 0.096 1 0.516 0.096 0.516Salaries and benefits 8.369 8.003 8.352 8.500 9.785 8.845Services 4.228 3.185 2.987 3.048 4.993 2.998Materials, parts, and supplies 0.206 0.174 0.174 0.174 0.256 0.174Assets and purchases 0.087 0.017 0.017 0.017 0.117 0.017Debt and finance charges (2.153) 0.860 0.860 0.860 (2.024) 0.817Grants, transfers and other* 3.091 1.896 1.744 1.752 2.474 1.767Recoveries (0.418) (0.100) (0.100) (0.100) (1.336) (0.100)Operating expenses 13.408 14.035 14.034 14.252 14.265 14.518Transfer to Capital - - - 0.100 0.210 0.100Total Expenses 13.408 14.035 14.034 2 14.352 14.475 14.618Mill Rate Support/(Contribution) 11.777 13.519 13.938 13.836 14.379 14.102Full-time Equivalent Positions 99 77 79 79 86 79* Civic Initiatives, Promotional and Protocol (partially allocated to the Economic Development Service) are Mayor's Office programs that may include making grants: (a) to assist a charitable or non-profit organization, association or corporation; (b) to aid sports and recreation; (c) to support economic and cultural development; (d) to improve, preserve, repair, maintain, convert or develop any property in the City; or (e) for any other purpose that the Mayor considers may be in the interests or to the advantage of the City or its citizens.Explanation of 2020 Change from 2019
(in millions of $)1 Revenues
Decrease due to Board of Revision assessment appeals filing fee revenue (0.420)(0.420)
2 ExpensesIncrease in salaries and benefits 0.349Increase in transfer to General Purpose Reserve 0.100Decrease in transfer to civic accommodations mainly due to 311 Ross (0.185)Decrease in grants (0.100)Decrease in services due to Board of Revision assessment appeals filing expenses (0.090)Miscellaneous adjustments (0.075)
(0.001)Full-time Equivalent Positions
Increase due to transfer of 2 FTEs from Innovation, Transformation and Technology Department to Council Services - City Clerks.
Preliminary 2020 Budget - Service Based 2-125

Council Services
Service Detail
Sub-services (in millions of $)2018
Actual2019
Budget
2020Preliminary
Budget2021
Projection2022
Projection2023
ProjectionAuditing Revenue - - - - - -
Operating expenses 1.154 1.396 1.379 1.375 1.375 1.375Transfer to Capital - - - - - -
1.154 1.396 1.379 1.375 1.375 1.375Mayor and Council
Revenue 0.011 - - - - -Operating expenses 5.272 5.928 5.959 5.995 6.044 6.095Transfer to Capital - - - - - -
5.260 5.928 5.959 5.995 6.044 6.095Archives-City Clerks
Revenue 0.004 - - - - -Operating expenses 0.624 1.383 1.462 1.489 1.522 1.552Transfer to Capital - - - - - -
0.620 1.383 1.462 1.489 1.522 1.552Elections-City Clerks
Revenue 0.981 - - - - -Operating expenses 1.677 0.753 0.753 0.753 0.710 0.710Transfer to Capital - - - - - -
0.696 0.753 0.753 0.753 0.710 0.710Citizen Access and Appeals
Revenue 0.567 0.475 0.055 0.475 0.055 0.475Operating expenses 0.755 0.829 0.747 0.856 0.770 0.883Transfer to Capital - - - - - -
0.188 0.354 0.692 0.381 0.715 0.408Council Support-City Clerks
Revenue 0.068 0.041 0.041 0.041 0.041 0.041Operating expenses 3.379 2.917 2.914 2.966 3.026 3.085Transfer to Capital - - - 0.100 0.210 0.100
3.311 2.876 2.873 3.025 3.195 3.144Executive Support Revenue - - - - - -
Operating expenses 0.549 0.830 0.820 0.818 0.818 0.818Transfer to Capital - - - - - -
0.549 0.830 0.820 0.818 0.818 0.818Mill Rate Support/(Contribution) 11.777 13.519 13.938 13.836 14.379 14.102
Additional Financial Information
Capital Budget2020
Preliminary2021-2025Forecast
6 YearTotal
(In millions of $) 0.410 0.410
2-126 Preliminary 2020 Budget - Service Based
-

How is the money spent in the Tax Supported Operating Budget?
Organizational Support/Other(Innovation, Transformation &
Technology, Human Resources, Customer Service
& Communications Finance, Assessment, Chief Administrative Office, Legal,
Corporate)$86.3 million
7.5%
Street System, Solid Waste Collection, Street Lighting and Insect Control$295.1 million25.8%
Transit Subsidy$67.4 million5.9%
Property, Development, Planning, Permitsand Buildings$45.9 million4.0%
Fire Paramedic Service$209.0 million18.3%
Police Service $304.1 million26.6%
Community Services (e.g. Libraries, Recreation Services, Assiniboine Park
Conservancy)$115.0 million
10.0%
City Clerks, Mayor and Council, Office of Policy andStrategic Initiatives,
Museums, Audit$21.7 million
1.9%
2020 Preliminary Operating Budget - $1,144.5 million
Preliminary 2020 Budget - Appendices
3-1

Business Tax $57.9 million5.1%
Property Tax $634.6 million55.4%
Interest and Other$35.5 million3.1%
Utility Dividend$34.6 million3.0%
Sales of Goods & Services$54.3 million4.8%
Other Taxation$27.3 million
2.4%
Frontage Levy(street repair)$63.8 million
5.6%
Government Grants$146.6 million
12.8%
Transfers fromOther Funds$12.9 million
1.1%
Licenses, Finesand Fees
$77.0 million6.7%
Where does the money come from in the Tax Supported Operating Budget?
2020 Preliminary Operating Budget - $1,144.5 million
3-2Prelim
inary 2020 Budget - Appendices

Appendix 1
Net Net
2019 2020 Variance Variance Expl. 2021 2022 2023
Adopted
Budget
(Restated) ③Preliminary
Budget $ % No. Projection Projection Projection
4-year
Avg.
%
Revenue:
Property tax 617,869,183$ 641,748,483$ 23,879,300$ 3.9 1 664,716,502$ 688,204,567$ 712,534,713$ 3.6Property tax credits (10,132,174) (7,186,318) 2,945,856 (29.1) 1 (6,207,318) (7,479,379) (7,442,349) (5.7)Business tax 63,332,745 63,378,301 45,556 0.1 2 63,378,301 63,378,301 63,378,301 0.0Business tax credits (6,416,905) (5,462,461) 954,444 (14.9) 2 (5,462,461) (5,462,461) (5,462,461) (3.7)Other taxation 25,978,387 27,375,934 1,397,547 5.4 3 28,125,183 28,849,346 29,693,354 3.4Street renewal frontage levy 63,244,760 63,795,219 550,459 0.9 4 64,176,719 64,558,219 64,939,719 0.7Government grants 143,833,770 146,551,985 2,718,215 1.9 5 147,586,568 148,600,262 149,540,931 1.0Regulation fees 74,854,233 76,975,310 2,121,077 2.8 6 77,640,551 77,826,289 78,816,619 1.3Sale of goods and services 53,935,283 54,388,605 453,322 0.8 7 54,199,369 54,855,280 55,426,000 0.7Interest 6,136,200 7,198,482 1,062,282 17.3 8 7,110,742 6,928,741 6,713,359 2.6Transfers from other funds 30,932,037 12,793,606 (18,138,431) (58.6) 9 4,705,600 16,258,379 36,162,608 61.5Utility dividends 34,212,072 34,586,983 374,911 1.1 10 35,680,697 36,692,778 37,720,937 2.5Other 27,172,352 28,306,943 1,134,591 4.2 11 23,207,237 23,339,228 23,501,003 (3.1)
Total Revenue 1,124,951,943$ 1,144,451,072$ 19,499,129$ 1.7 1,158,857,690$ 1,196,549,550$ 1,245,522,734$ 2.6
Expenditures: ①
Departmental Operating Expenditures:Police Service 289,353,323$ 294,560,130$ 5,206,807$ 1.8 12 299,587,538$ 304,086,786$ 313,135,110$ 2.0Public Works 152,081,988 151,931,323 (150,665) (0.1) 13 152,250,842 154,065,448 156,372,043 0.7Fire Paramedic Service 199,473,578 205,479,503 6,005,925 3.0 14 210,674,913 213,440,625 216,764,543 2.1Community Services 105,148,621 106,785,631 1,637,010 1.6 15 107,146,020 109,315,886 110,893,146 1.3Planning, Property and Development
41,933,716 42,418,903 485,187 1.2 16 42,548,881 42,377,434 42,398,231 0.3
Water and Waste 23,225,817 23,541,882 316,065 1.4 17 24,447,615 24,339,694 25,312,126 2.2Street Lighting 13,116,449 12,445,465 (670,984) (5.1) 18 13,680,553 14,349,532 15,052,065 3.6Assessment and Taxation 21,078,471 18,418,150 (2,660,321) (12.6) 19 18,549,726 18,760,051 19,186,438 (2.1)Innovation, Transformation and Technology
22,139,440 22,449,575 310,135 1.4 20 21,768,258 21,072,228 20,449,948 (1.9)
City Clerks 13,470,757 12,821,309 (649,448) (4.8) 21 12,016,499 11,988,047 12,197,697 (2.4)Corporate Finance 8,341,593 8,218,443 (123,150) (1.5) 22 8,396,245 8,604,401 8,792,871 1.3Customer Service and Communications
8,537,608 7,122,322 (1,415,286) (16.6) 23 6,994,948 7,056,104 7,227,561 (3.8)
Human Resource Services 6,054,877 6,026,831 (28,046) (0.5) 24 6,144,099 6,248,295 6,348,234 1.2Other departments 18,137,992 19,146,850 1,008,858 5.6 25 19,297,522 19,335,572 19,487,269 1.8Sub-total Departmental 922,094,230$ 931,366,317$ 9,272,087$ 1.0 943,503,659$ 955,040,103$ 973,617,282$ 1.4
Corporate:Taxes 11,454,223 11,747,206 292,983 12,008,428 12,248,597 12,493,569 Insurance and damage claims 3,716,624 3,900,814 184,190 4,191,988 4,510,226 4,697,565 Contribution to Transit ② 70,560,859 67,362,644 (3,198,215) 78,669,161 85,800,582 95,501,956 Other (6,950,650) (12,648,153) (5,697,503) (36,655,241) (33,076,205) (25,523,090) Sub-total Corporate 78,781,056$ 70,362,511$ (8,418,545)$ (10.7) 26 58,214,336$ 69,483,200$ 87,170,000$ 4.2
Total Operational Expenditures 1,000,875,286$ 1,001,728,828$ 853,542$ 0.1 1,001,717,995$ 1,024,523,303$ 1,060,787,282$ 1.5
Capital related expenditures:
Transfer to Capital 13,965,000 18,747,000 4,782,000 13,235,000 12,315,000 10,511,000 Transfer to Regional Street Renewal Reserve
30,870,000 36,770,000 5,900,000 42,870,000 49,170,000 51,170,000
Transfer to Local Street Renewal Reserve
35,370,000 41,270,000 5,900,000 47,370,000 53,670,000 64,670,000
Transfer to Capital - Frontage Levy 10,000,000 10,000,000 - 10,000,000 10,000,000 10,000,000 Debt and Finance Charges 36,396,455 35,935,244 (461,211) 43,664,695 46,871,247 48,384,452 Capital Closure Surplus (2,524,798) - 2,524,798 - - -
Total Capital Related Expenditures 124,076,657$ 142,722,244$ 18,645,587$ 15.0 157,139,695$ 172,026,247$ 184,735,452$ 10.5Total Expenditures 1,124,951,943$ 1,144,451,072$ 19,499,129$ 1.7 1,158,857,690$ 1,196,549,550$ 1,245,522,734$ 2.6
-$ -$ -$ -$ -$ -$
Year over Year Variance 1.3% 3.3% 4.1%
4-year Total -$
Notes:①
②
③ 2019 Adopted Budget figures have been restated for Tax Penalties Revenue from Interest to Regulation fees account categories.
Operating Budget
Tax Supported Summary
This view is different than previous years; departmental operating expenditures are net of capital related expenditures (transfers to capital and debt and finance charges). Refer to variance explanation #6 in Utility Operations section of this Appendix.
Preliminary 2020 Budget - Appendices 3-3

Appendix 1
Expl.
No. Explanations Variance
1 Property tax $ 26,825,156
2020 property tax revenue reflects a mill rate of 12.861 and includes a 1% property tax increase dedicated to the renewal of local streets, lanes and sidewalks, an additional 1% property tax increase dedicated to the renewal of regional streets, sidewalks and bridges, and a .33% property tax increase dedicated to the second phase of the Southwest Rapid Transitway, for a total property tax increase of 2.33%.
2 Business tax 1,000,000$
2020 business tax rate has been reduced from 4.97% to 4.84%. The small business tax credit program will provide a full rebate in 2020 to businesses with an annual rental value of $35,700 ($33,900 in 2019) or less. Increase due to transfer to the Economic Development Reserve related to Old Tuxedo Yards in 2019 only.
3 Other taxation
Increase in electricity tax revenue. 1,300,000$ Net increase in other taxation revenue. 97,547 Total $ 1,397,547
4 Street renewal frontage levy
Increase in street renewal frontage levy revenue for frontage foot growth. $ 550,459
5 Government grants
Increase in Provincial / Shared Health funding based on costs allocated to emergency medical services program.
2,508,373$
Increase in Provincial Funding for Police Services - Guns & Gangs. 187,246 Net increase in other grants. 22,596 Total $ 2,718,215
6 Regulation fees
Increase in tax penalties revenue. 1,900,000$ Increase in building, electrical and mechanical fees due to inflation. 773,071 Increase in citation revenue due to Municipal By-law Enforcement Act (MBEA) process.
110,000
Decrease in Board of Revision appeals filing fees. (420,000) Decrease in traffic enforcement initiatives. (400,000) Decrease in cut restoration revenue offset by cut restoration contracts (see Public Works explanation # 13).
(159,209)
Net increase in other miscellaneous revenue. 317,215 Total $ 2,121,077
Operating Budget
Tax Supported Revenue - 2020 Compared to 2019
3-4 Preliminary 2020 Budget - Appendices

Appendix 1
Expl.
No. Explanations Variance
Operating Budget
Tax Supported Revenue - 2020 Compared to 2019
7 Sale of goods and services
Increase in contract police service revenue. 492,678$ Net decrease in other sales of goods and services. (39,356)Total $ 453,322
8 Interest
Increase in short-term investment revenue. 1,062,282$
9 Transfers from other funds
Increases / (decreases) in transfers from other funds:- Land Operating Reserve. $ 4,000,000 - Municipal Accommodations. 934,401 - Financial Stabilization Reserve. (15,262,800)- Economic Development Investment Reserve. (1,806,000)- Insurance Reserve. (1,700,000)- Multi-Family Dwelling Tax Investment Reserve. (1,500,000)- Workers Compensation Reserve. (1,000,000)- Permit Reserve. (203,000)- Reclassification of 311 revenue from Waterworks, Transit and Parking Authority to inter-fund recoveries account.
(1,453,685)
- Net decrease in other transfers. (147,347)Total $ (18,138,431)
10 Utility dividends
Increase in Water and Sewer dividend revenue relating to increase in rates. $ 374,911
11 Other
Increase in Winnipeg Parking Authority dividend. $ 1,137,993 Decrease in Fleet Management Agency dividend. (150,263) Net increase in other. 146,861
$ 1,134,591
Preliminary 2020 Budget - Appendices 3-5

Appendix 1
Expl.
No. Explanations Variance
Police Service
Increase in salaries and benefits primarily due to negotiated wage increases and annual increments.
7,100,280$
Increase in civic accommodation charges. 229,375 Increase in facility rentals for active response training. 195,750 Decrease in pension costs due to pension savings recognized (refer to Council approved report on November 21, 2019).
(2,307,309)
Decrease in photo enforcement services costs net of increased relocation costs for Division 13.
(168,068)
Net operational cost increase. 156,779 12 Total operational expenditures increase net of capital related expenditures. 5,206,807$
Transfer to Capital. (1,275,000) Debt and finance charges. (1,209,127)
Total 2,722,680$
Public Works
Increase in salaries and benefits primarily due to negotiated wage increases and annual increments.
1,546,761$
Increase in winter maintenance strategy (annualized cost) - Active Transportation Network.
419,220
Increase in contracts. 226,042 Increase in civic accommodation charges. 101,486 Decrease in fleet leases and other fleet related costs. (1,430,027) Decrease in fuel costs. (506,618) Decrease in grants. (272,320) Decrease in cut restoration contracts, offset by decrease in cut restoration revenue (see Explanation # 6).
(159,209)
Net operational cost decrease. (76,000)13 Total operational expenditures decrease net of capital related expenditures. (150,665)$
Transfer to Local Street Renewal Reserve. 5,900,000 Transfer to Regional Street Renewal Reserve. 5,900,000 Transfer to Capital. 3,853,000 Debt and finance charges. (1,149,810)
Total 14,352,525$
Operating Budget
Tax Supported Expenditures - 2020 Compared to 2019
3-6 Preliminary 2020 Budget - Appendices

Appendix 1
Expl.
No. Explanations Variance
Operating Budget
Tax Supported Expenditures - 2020 Compared to 2019
Fire Paramedic Service
Increase in salaries and benefits primarily due to negotiated wage increases and annual increments.
4,121,141$
Increase in computer software and hardware related to implementation of Computer Aided Dispatch system.
964,791
Increase in equipment rental of fire apparatus to provide urgently required back-up capability.
780,000
Increase in vehicle maintenance, parts and accessories. 530,566 Increase in fleet fuel and leasing costs. 276,645 Decrease in bad debt provision. (400,000) Decrease in Shared Health capital contribution. (348,399) Net operational cost increase. 81,181
14 Total operational expenditures increase net of capital related expenditures. 6,005,925$ Debt and finance charges. 1,525,045
Total 7,530,970$
Community Services
Increase in salaries and benefits primarily due to negotiated wage increases and annual increments, including the net decrease of FTEs, and changing library hours to close at 8:00 pm on weekday evenings and closing libraries with Sunday service hours effective September 2020.
1,260,128
Increase in grant for 24/7 Safe Spaces towards meeting UN safe practices. Total 4-year funding from 2020 to 2023 is $1 million.
250,000
Increase in grant to Assiniboine Park Conservancy. 249,000 Increase in facilities costs. 243,194 Increase in universal funding formula grants to community centres. 142,771 Decrease in civic accommodation charges. (270,308) Decrease of 10% in grants to various community groups. (110,781) Decrease in grant due to the cancellation of the Infrastructure Capital Grant provided to General Council of Winnipeg Community Centres.
(100,000)
Net operational cost decrease. (26,994) 15 Total operational expenditures increase net of capital related expenditures. 1,637,010$
Transfer to Capital. (334,000) Debt and finance charges. (495,674)
Total 807,336$
Preliminary 2020 Budget - Appendices 3-7

Appendix 1
Expl.
No. Explanations Variance
Operating Budget
Tax Supported Expenditures - 2020 Compared to 2019
Planning, Property and Development
Increase in salaries and benefits due to negotiated wage increases and annual increments.
288,837$
Increase transfer to Municipal Accommodations for vacant, common and corporate space.
245,354
Net operational cost decrease. (49,004) 16 Total operational expenditures increase net of capital related expenditures. 485,187$
Transfer to Capital. 1,286,000 Debt and finance charges. (77,726)
Total 1,693,461$
Water and Waste - Garbage Collection
Increase in fleet costs. 430,206 Increase in salaries and benefits primarily due to increases in FTEs for the in-house multi-family collection pilot project.
379,988
Increase in fuel costs. 98,209 Decrease in multi family bin collection contract costs. (460,631) Decrease in bulky waste collection contract costs. (208,640) Net operational cost increase. 76,933
17 Total operational expenditures increase net of capital related expenditures. 316,065$
18 Street Lighting
Net decrease in costs due to Manitoba Hydro rate changes, new installations and upgrades, and LED savings from early completion of bulb replacements in 2020.
(670,984)$
Assessment and Taxation
Decrease in municipal tax due to appeal losses. (2,300,000)$ Decrease in transfer to Land Operating Reserve. (131,490) Decrease in cyclical expenses related to the general assessment cycle. (121,500) Decrease in civic accommodation costs. (90,360) Net operational cost decrease. (16,971)
19 Total operational expenditures decrease net of capital related expenditures. (2,660,321)$ Transfer to Capital. (530,000) Debt and finance charges. (91,075)
Total (3,281,396)$
3-8 Preliminary 2020 Budget - Appendices
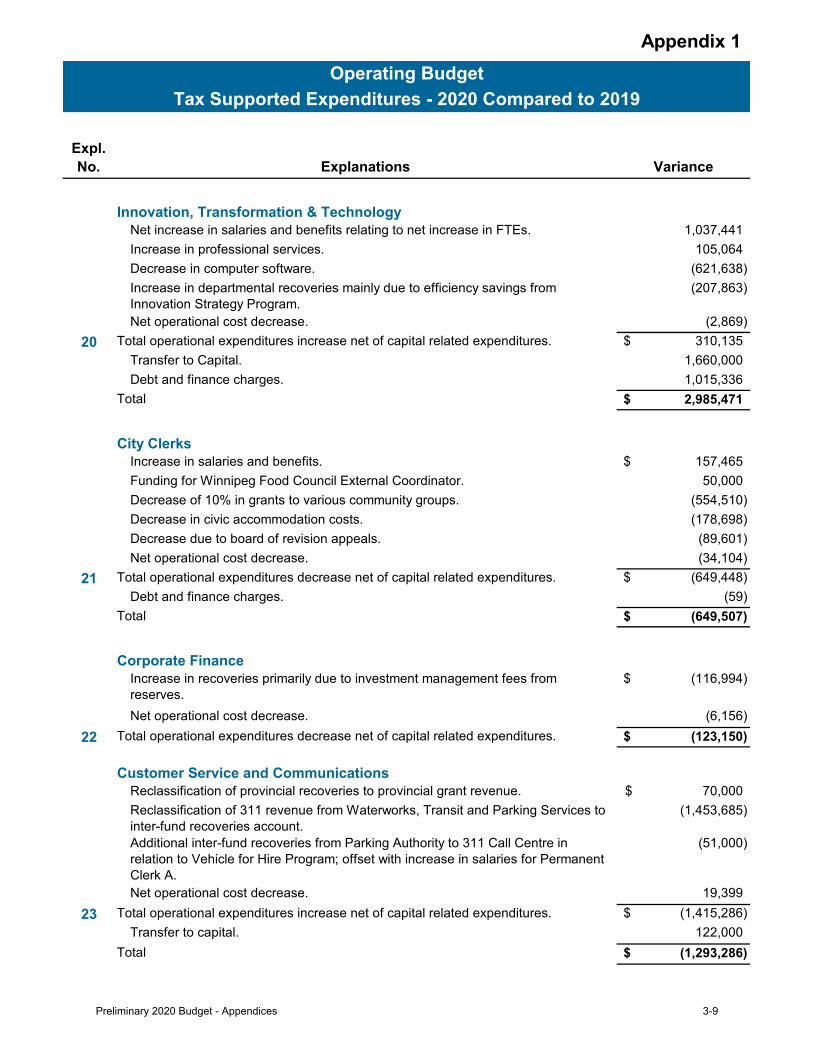
Appendix 1
Expl.
No. Explanations Variance
Operating Budget
Tax Supported Expenditures - 2020 Compared to 2019
Innovation, Transformation & Technology
Net increase in salaries and benefits relating to net increase in FTEs. 1,037,441 Increase in professional services. 105,064 Decrease in computer software. (621,638) Increase in departmental recoveries mainly due to efficiency savings from Innovation Strategy Program.
(207,863)
Net operational cost decrease. (2,869) 20 Total operational expenditures increase net of capital related expenditures. 310,135$
Transfer to Capital. 1,660,000 Debt and finance charges. 1,015,336
Total 2,985,471$
City Clerks
Increase in salaries and benefits. 157,465$ Funding for Winnipeg Food Council External Coordinator. 50,000 Decrease of 10% in grants to various community groups. (554,510) Decrease in civic accommodation costs. (178,698) Decrease due to board of revision appeals. (89,601) Net operational cost decrease. (34,104)
21 Total operational expenditures decrease net of capital related expenditures. (649,448)$ Debt and finance charges. (59)
Total (649,507)$
Corporate Finance
Increase in recoveries primarily due to investment management fees from reserves.
(116,994)$
Net operational cost decrease. (6,156) 22 Total operational expenditures decrease net of capital related expenditures. (123,150)$
Customer Service and Communications
Reclassification of provincial recoveries to provincial grant revenue. 70,000$ Reclassification of 311 revenue from Waterworks, Transit and Parking Services to inter-fund recoveries account.
(1,453,685)
Additional inter-fund recoveries from Parking Authority to 311 Call Centre in relation to Vehicle for Hire Program; offset with increase in salaries for Permanent Clerk A.
(51,000)
Net operational cost decrease. 19,399 23 Total operational expenditures increase net of capital related expenditures. (1,415,286)$
Transfer to capital. 122,000 Total (1,293,286)$
Preliminary 2020 Budget - Appendices 3-9

Appendix 1
Expl.
No. Explanations Variance
Operating Budget
Tax Supported Expenditures - 2020 Compared to 2019
Human Resource Services
Net operational cost decrease. (28,046)$
24 Total operational expenditures decrease net of capital related expenditures. (28,046)$
Other departments
Net increase in salaries and benefits, including additional lawyer positions, and Executive Assistant within Legal Services, and one temporary FTE for Natural Resources Canada Fund for Benchmarking for Labelling and Disclosure Program Grant within Chief Administrative Offices.
987,005$
External counsel to support Legal Services Department with additional expertise on complex files where required.
281,031
One-time finding for mapping and modeling Climate Action Plan. 200,000 Decrease in Indigenous Youth Strategy Grants (10% reduction - $125,000) and Indigenous Relation's Journey of Reconciliation funding ($95,908).
(220,908)
Decrease in consultant services for Independent Fairness Commission Commissioner.
(44,000)
Net operational cost decrease. (194,270) 25 Total 1,008,858$
Corporate
Increase in funding for the review of the Winnipeg Police Pension Fund. 350,000$ Increase in provincial payroll tax estimate. 292,983 Increase in insurance costs reflecting recent experience with claims and premiums. 184,190 Decrease in contribution to transit (refer to variance explanation #6 under "Utility Operations" section of this appendix for additional information on Transit).
(3,198,215)
Increase in efficiency savings $15,200,342 in 2020 in comparison to $12,238,862 in 2019.
(2,961,480)
Corporately held Police pension savings (refer to Council approved report on November 21, 2019).
(2,307,750)
Decrease in provision for cost increases. (785,112) Net operational cost increase. 6,839
26 Total operational expenditures decrease net of capital related expenditures. (8,418,545)$ Capital closure surplus. 2,524,798 Debt and finance charges. 21,879
Total (5,871,868)$
3-10 Preliminary 2020 Budget - Appendices

Appendix 1
2019 2020 Net 4-yearAdopted Preliminary Variance Expl. 2021 2022 2023 Avg.
Budget Budget Variance % No. Projection Projection Projection
Avg
%
Municipal Accommodations
Revenue 72,442,743$ 72,407,149$ (35,594)$ (0.0) 1 72,054,833$ 72,867,487$ 74,555,264$ 0.7Operating Expenditures 65,378,227 66,392,240 1,014,013 1.6 2 64,878,466 65,981,122 67,779,899 0.9Surplus/(Deficit) 7,064,516 6,014,909 (1,049,607) 7,176,367 6,886,365 6,775,365
Sewage Disposal ①
Revenue 194,703,385 196,351,392 1,648,007 0.8 3 203,313,102 208,230,648 213,118,518 2.3Operating Expenditures 208,867,907 135,555,039 (73,312,868) (35.1) 4 142,702,429 146,888,283 149,832,011 (6.2)Surplus/(Deficit) (14,164,522) 60,796,353 74,960,875 60,610,673 61,342,365 63,286,507
Solid Waste Disposal ①
Revenue 45,214,335 46,859,815 1,645,480 3.6 5 50,299,861 51,484,020 52,031,374 3.6Operating Expenditures 48,889,454 47,673,540 (1,215,914) (2.5) 6 48,966,536 50,607,544 52,083,522 1.6Surplus/(Deficit) (3,675,119) (813,725) 2,861,394 1,333,325 876,476 (52,148)
Waterworks ①
Revenue 130,346,967 134,432,919 4,085,952 3.1 7 138,090,524 142,839,501 147,677,540 3.2Operating Expenditures 89,726,166 92,734,391 3,008,225 3.4 8 95,747,634 99,205,618 102,395,046 3.4Surplus/(Deficit) 40,620,801 41,698,528 1,077,727 42,342,890 43,633,883 45,282,494
Land Drainage
Revenue 5,727,980 4,959,478 (768,502) (13.4) 9 4,987,872 5,014,542 5,041,342 (2.9)Operating Expenditures 4,938,663 4,638,923 (299,740) (6.1) 10 4,666,955 4,695,032 4,721,838 (1.1)Surplus/(Deficit) 789,317 320,555 (468,762) 320,917 319,510 319,504
Transit
Revenue 204,205,751 206,022,838 1,817,087 0.9 11 219,812,261 228,160,809 239,658,263 4.1Operating Expenditures 182,240,189 183,990,594 1,750,405 1.0 12 189,697,565 194,800,811 201,021,785 2.5Surplus/(Deficit) 21,965,562 22,032,244 66,682 30,114,696 33,359,998 38,636,478
Total
Revenue 652,641,161 661,033,591 8,392,430 688,558,453 708,597,007 732,082,301
Operating Expenditures ② 600,040,606 530,984,727 (69,055,879) 546,659,585 562,178,410 577,834,101
Debt and Finance Charges 36,463,349 39,577,223 3,113,874 44,428,990 44,826,673 46,424,310 Transfer to Southwest Rapid Transit Payment Reserve 7,148,000 9,095,000 1,947,000 11,108,000 13,187,000 15,332,000 Transfer to Capital 7,295,000 3,974,000 (3,321,000) 9,663,000 9,093,000 10,989,000
50,906,349 52,646,223 1,739,874 65,199,990 67,106,673 72,745,310
Dividend Transfer to General Revenue Fund 34,212,072 34,586,983 374,911 35,680,697 36,692,778 37,720,937
Total Expenditures 685,159,027 618,217,933 (66,941,094) 647,540,272 665,977,861 688,300,348
Surplus/(Deficit) (32,517,866)$ 42,815,658$ 75,333,524$ 41,018,181$ 42,619,146$ 43,781,953$
①
②
Utilities Summary
Operating Budget
Utility maintains a retained earnings/working capital balance to fund all or a portion of its capital program on a pay as you go basis, and to provide a reserve to prevent significant rate increases in the event of major unforeseen expenditures or shortfalls in revenue.This view is different than previous years; departmental operating expenditures are net of capital related and dividend expenditures.
Capital related and dividend
expenditures:
Total Capital Related
Expenditures
Preliminary 2020 Budget - Appendices 3-11

Appendix 1
Expl.
No. Explanations Variance
Municipal Accommodations
Revenue Changes:
Increase in transfer from Community Services for facilities operation and maintenance.
$ 720,104
Increase in transfer from General Revenue Fund for facility costs. 225,184 Decrease in transfer from Community Services related to capital investments.
(476,910)
Decrease transfer from Fleet Management Agency. (106,537)Decrease transfer from Parks and Open Spaces. (138,000)Miscellaneous adjustments. (259,435)
1 $ (35,594)
Expenditure Changes:
Increase in transfer to General Revenue Fund. $ 934,401 Net increase in salary and benefits. 276,334 Decrease in rentals. (166,683)Decrease in fleet leases and other fleet related costs. (136,567)Miscellaneous adjustments. 106,528
2 Total operational expenditures increase net of capital related expenditures. $ 1,014,013 Debt and finance charges. 37,393 Transfer to Capital. (1,087,000)
$ (35,594)Variance. $ -
Operating Budget
Utilities - 2020 Compared to 2019
The Municipal Accommodations fund does not accrue retained earnings.
3-12 Preliminary 2020 Budget - Appendices

Appendix 1
Expl.
No. Explanations Variance
Operating Budget
Utilities - 2020 Compared to 2019
Sewage Disposal
Revenue Changes:
Increase in industrial waste surcharge based on actual experience and approved 2020 water and sewer rate report.
$ 1,000,000
Increase in leachate treatment revenue primarily due to volume (now collecting from the most recently closed cell).
650,000
Increase in hauled waste revenue consistent with approved 2020 water and sewer rate report.
112,500
Decrease in sewer services revenue as per approved 2020 water and sewer rate report.
(229,987)
Miscellaneous adjustments. 115,494 3 $ 1,648,007
Expenditure Changes:
Transfer to Water Meter Renewal Reserve. $ 2,331,945 Decrease in recoveries. 810,153 Increase in chemicals due to volume and price. 756,400 Increase in salaries and benefits primarily due to an increase to FTEs to support the expansion of the South End Sewage Treatment Plant.
697,772
Increase in hauling due to volume and price. 448,000 Increase in utilities. 406,550 Increase in large volume sewer discounts. 233,000 Increase in electrical and communication. 120,800 Decrease in transfer to Environmental Projects Reserve. (75,322,076)Decrease in transfer to Land Drainage Fund primarily related to capital program.
(2,409,002)
Decrease in maintenance and materials. (629,900)Decrease in biosolids composting. (520,000)Decrease in fleet and rentals. (298,160)Miscellaneous adjustments. 61,650
4Total operational expenditures decrease net of capital related and dividend expenditures.
$ (73,312,868)
Debt and finance charges. 3,104,039 Dividend transfer to General Revenue. (25,299)
$ (70,234,128)Variance. $ 71,882,135
Note: Utility maintains a retained earnings/working capital balance to fund a portion of its capital program on a pay as you go basis, and to provide a reserve to prevent significant rate increases in the event of major unforeseen expenditures or shortfalls in revenue. Retained earnings unaudited balance at December 31, 2019 is $48.8 million.
Preliminary 2020 Budget - Appendices 3-13

Appendix 1
Expl.
No. Explanations Variance
Operating Budget
Utilities - 2020 Compared to 2019
Solid Waste Disposal
Revenue Changes:
Increase in funding from Multi-Material Stewardship Manitoba. $ 1,870,000 Increase in waste diversion revenue due to inflationary rate increase. 452,860 Decrease in waste reduction support grant. (375,000)Decrease in residential recycling sales driven by volatility of market prices. (158,000)Miscellaneous adjustments. (144,380)
5 $ 1,645,480
Expenditure Changes:
Decrease in recoveries related to biosolids composting (see Explanation # 4).
$ 520,000
Increase in leachate treatment. 331,250 Increase in leaf and yard waste collection contracts. 297,000 Increase in salaries and benefits. 29,155 Decrease in recyclables processing. (2,170,000)Decrease in allocated departmental costs. (246,220)Miscellaneous adjustments. 22,901
6 Total operational expenditures decrease net of capital related expenditures. $ (1,215,914)Debt and finance charges. (121,207)
$ (1,337,121)Decrease in deficit. $ 2,982,601
Note: Utility maintains a retained earnings/working capital balance to fund a portion of its capital program on a pay as you go basis and to provide a reserve to prevent significant rate increase in the event of major unforeseen expenditures or shortfalls in revenue. Retained earnings unaudited balance at December 31, 2019 is $9.9 million.
3-14 Preliminary 2020 Budget - Appendices
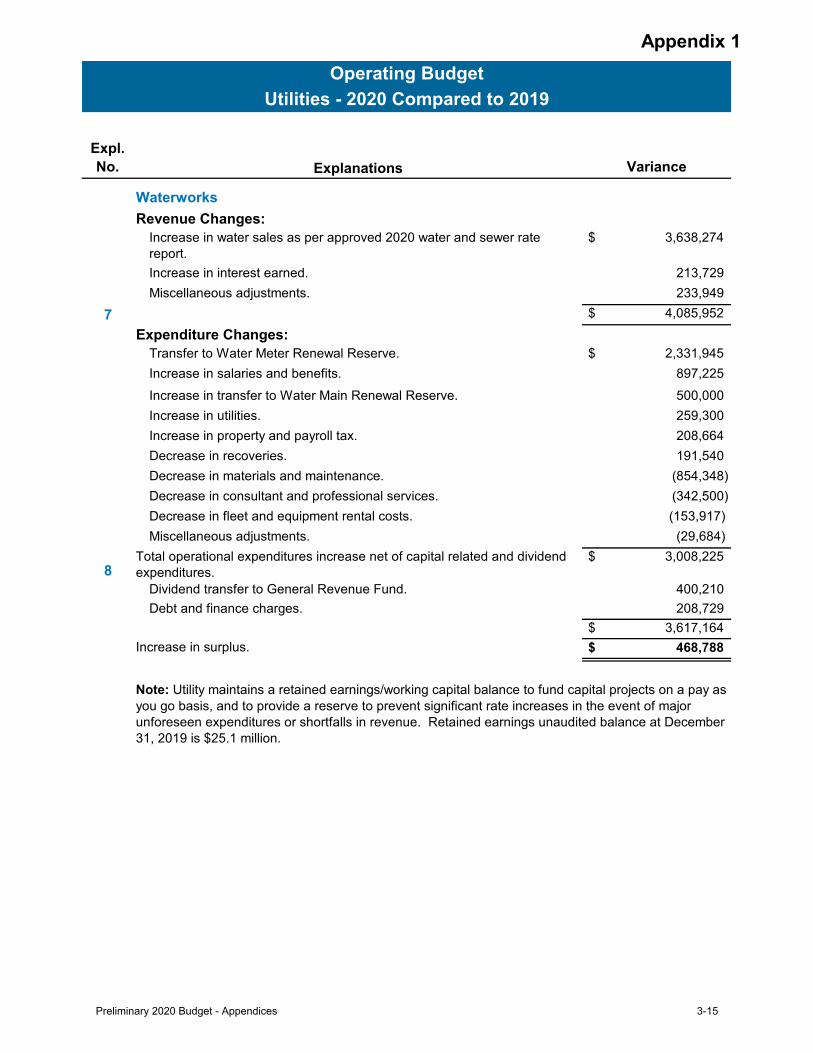
Appendix 1
Expl.
No. Explanations Variance
Operating Budget
Utilities - 2020 Compared to 2019
Waterworks
Revenue Changes:
Increase in water sales as per approved 2020 water and sewer rate report.
$ 3,638,274
Increase in interest earned. 213,729 Miscellaneous adjustments. 233,949
7 $ 4,085,952 Expenditure Changes:
Transfer to Water Meter Renewal Reserve. $ 2,331,945 Increase in salaries and benefits. 897,225 Increase in transfer to Water Main Renewal Reserve. 500,000 Increase in utilities. 259,300 Increase in property and payroll tax. 208,664 Decrease in recoveries. 191,540 Decrease in materials and maintenance. (854,348) Decrease in consultant and professional services. (342,500) Decrease in fleet and equipment rental costs. (153,917)Miscellaneous adjustments. (29,684)
8Total operational expenditures increase net of capital related and dividend expenditures.
$ 3,008,225
Dividend transfer to General Revenue Fund. 400,210 Debt and finance charges. 208,729
$ 3,617,164 Increase in surplus. $ 468,788
Note: Utility maintains a retained earnings/working capital balance to fund capital projects on a pay as you go basis, and to provide a reserve to prevent significant rate increases in the event of major unforeseen expenditures or shortfalls in revenue. Retained earnings unaudited balance at December 31, 2019 is $25.1 million.
Preliminary 2020 Budget - Appendices 3-15

Appendix 1
Expl.
No. Explanations Variance
Operating Budget
Utilities - 2020 Compared to 2019
Land Drainage
Revenue Changes:
Increase in regulation fees. $ 50,000 Decrease in transfer from Sewage Disposal. (818,502)
9 $ (768,502)Expenditure Changes:
Decrease in certificates, permits and licenses. $ (170,750)Decrease in maintenance materials. (165,000) Miscellaneous adjustments. 36,010
10 Total operational expenditures decrease net of capital related expenditures. $ (299,740)Debt and finance charges. (468,762)
$ (768,502)Variance. $ -
3-16 Preliminary 2020 Budget - Appendices
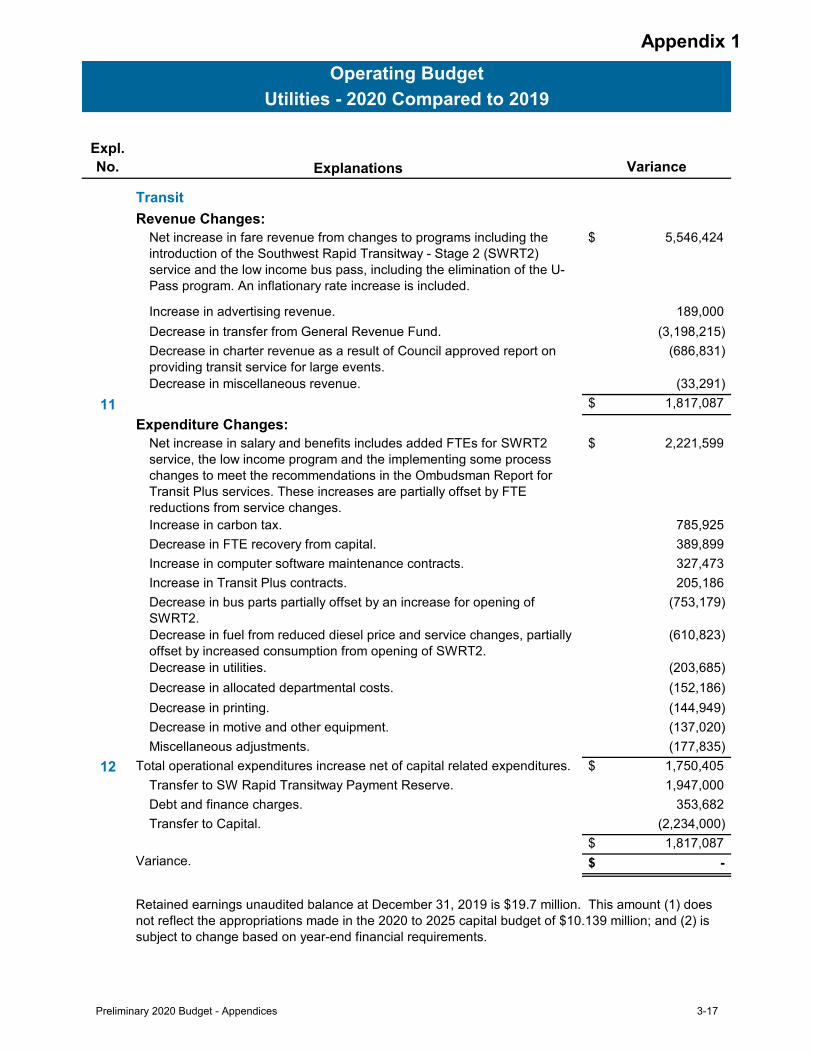
Appendix 1
Expl.
No. Explanations Variance
Operating Budget
Utilities - 2020 Compared to 2019
Transit
Revenue Changes:
Net increase in fare revenue from changes to programs including the introduction of the Southwest Rapid Transitway - Stage 2 (SWRT2) service and the low income bus pass, including the elimination of the U-Pass program. An inflationary rate increase is included.
$ 5,546,424
Increase in advertising revenue. 189,000 Decrease in transfer from General Revenue Fund. (3,198,215)Decrease in charter revenue as a result of Council approved report on providing transit service for large events.
(686,831)
Decrease in miscellaneous revenue. (33,291)11 $ 1,817,087
Expenditure Changes:
Net increase in salary and benefits includes added FTEs for SWRT2 service, the low income program and the implementing some process changes to meet the recommendations in the Ombudsman Report for Transit Plus services. These increases are partially offset by FTE reductions from service changes.
$ 2,221,599
Increase in carbon tax. 785,925 Decrease in FTE recovery from capital. 389,899 Increase in computer software maintenance contracts. 327,473 Increase in Transit Plus contracts. 205,186 Decrease in bus parts partially offset by an increase for opening of SWRT2.
(753,179)
Decrease in fuel from reduced diesel price and service changes, partially offset by increased consumption from opening of SWRT2.
(610,823)
Decrease in utilities. (203,685)Decrease in allocated departmental costs. (152,186)Decrease in printing. (144,949)Decrease in motive and other equipment. (137,020)Miscellaneous adjustments. (177,835)
12 Total operational expenditures increase net of capital related expenditures. $ 1,750,405 Transfer to SW Rapid Transitway Payment Reserve. 1,947,000 Debt and finance charges. 353,682 Transfer to Capital. (2,234,000)
$ 1,817,087 Variance. $ -
Retained earnings unaudited balance at December 31, 2019 is $19.7 million. This amount (1) does not reflect the appropriations made in the 2020 to 2025 capital budget of $10.139 million; and (2) is subject to change based on year-end financial requirements.
Preliminary 2020 Budget - Appendices 3-17

Appendix 1
2019 2020 Net Net 4-yearAdopted Preliminary Variance Variance Expl. 2021 2022 2023 Avg.Budget Budget $ % No. Projection Projection Projection %
Fleet ManagementRevenue 48,864,750$ 51,002,339$ 2,137,589$ 4.4 1 50,049,160$ 49,571,941$ 50,326,780$ 0.8Operating Expenditures 47,188,841 48,196,226 1,007,385 2.1 2 47,562,715 47,137,780 47,281,537 0.1Surplus/(Deficit) 1,675,909 2,806,113 1,130,204 2,486,445 2,434,161 3,045,243
Parking Authority
Revenue 26,128,981 23,857,547 (2,271,434) (8.7) 3 23,956,581 24,053,264 24,171,453 (1.8)Operating Expenditures 23,934,666 17,943,875 (5,990,791) (25.0) 4 17,979,570 17,975,144 17,914,612 (6.3)Surplus/(Deficit) 2,194,315 5,913,672 3,719,357 5,977,011 6,078,120 6,256,841
Golf Services
Revenue 3,013,010 3,183,537 170,527 5.7 5 3,285,398 3,373,057 3,462,294 3.5Operating Expenditures 2,792,419 2,636,125 (156,294) (5.6) 6 2,656,346 2,719,754 2,768,066 (0.2)Surplus/(Deficit) 220,591 547,412 326,821 629,052 653,303 694,228
Animal Services
Revenue 3,304,054 3,386,586 82,532 2.5 7 3,901,336 3,916,086 3,930,836 4.6Operating Expenditures 3,814,499 3,750,303 (64,196) (1.7) 8 3,762,199 3,807,054 3,844,094 0.2Surplus/(Deficit) (510,445) (363,717) 146,728 139,137 109,032 86,742
Total
Revenue 81,310,795 81,430,009 119,214 81,192,475 80,914,348 81,891,363
Operating Expenditures ① 77,730,425 72,526,529 (5,203,896) 71,960,830 71,639,732 71,808,309
Capital related expenditures:
Debt and Finance Charges 1,412,253 1,697,562 285,309 1,919,181 2,096,209 2,317,180 Total Capital Related Expenditures 1,412,253 1,697,562 285,309 1,919,181 2,096,209 2,317,180
Dividend Transfer to General Revenue Fund 10,154,023 11,141,753 987,730 6,041,080 6,141,585 6,321,787
Total Expenditures 89,296,701 85,365,844 (3,930,857) 79,921,091 79,877,526 80,447,276 Surplus/(Deficit) (7,985,906)$ (3,935,835)$ 4,050,071$ 1,271,384$ 1,036,822$ 1,444,087$
① This view is different than previous years; departmental operating expenditures are net of capital related and dividend expenditures.
Special Operating Agencies Summary
Operating Budget
3-18 Preliminary 2020 Budget - Appendices

Appendix 1
Expl.
No. Explanations Variance
Fleet Management
Revenue Changes:
Increase in services and parts revenue. 766,852$ Increase rental and other income. 729,089Increase in fuel sales. 535,082Increase in fleet leases. 106,566
1 2,137,589$
Expenditure Changes:
Increase in services including rental of fire apparatus (refer to Tax Supported Explanation # 14).
1,018,115$
Increase in fuel costs. 622,868Increase in parts. 217,776Increase in other supplies. 64,714Decrease in salaries and benefits. (805,285)Decrease in civic accommodation charges. (106,536)Miscellaneous adjustments. (4,267)
2 Total operational expenditures increase net of capital related expenditures. 1,007,385$ Debt and finance charges. 253,006 Dividend Transfer to General Revenue Fund. (150,263)
1,110,128$
Increase in surplus. 1,027,461$
Operating Budget
Special Operating Agencies - 2020 Compared to 2019
Preliminary 2020 Budget - Appendices 3-19

Appendix 1
Expl.
No. Explanations Variance
Operating Budget
Special Operating Agencies - 2020 Compared to 2019
Parking Authority
Revenue Changes:
Parking revenue (not budgeted in 2019) offset in grants in-kind expenses. 290,000$ Decrease in parking permits and meter fee revenue. (1,234,420)Decrease in enforcement revenue. (1,421,089) Miscellaneous adjustments. 94,075
3 (2,271,434)$
Expenditure Changes:
Increase in professional services. 389,981$ Increase in paystation maintenance. 265,614Increase in salaries and benefits. 200,647Transfer to the Land Operating Reserve in 2019 (from net of proceeds of the sale of the Longboat Development).
(4,405,000)
Decrease in Civic Parkade demolition costs. (1,434,000)Decrease in other equipment servicing. (624,763)Decrease in computer software. (267,862)Miscellaneous adjustments. (115,408)
4 Total operational expenditures decrease net of capital related expenditures. (5,990,791)$ Dividend Transfer to General Revenue Fund. 1,137,993
(4,852,798)$ Decrease in deficit. 2,581,364$
3-20 Preliminary 2020 Budget - Appendices
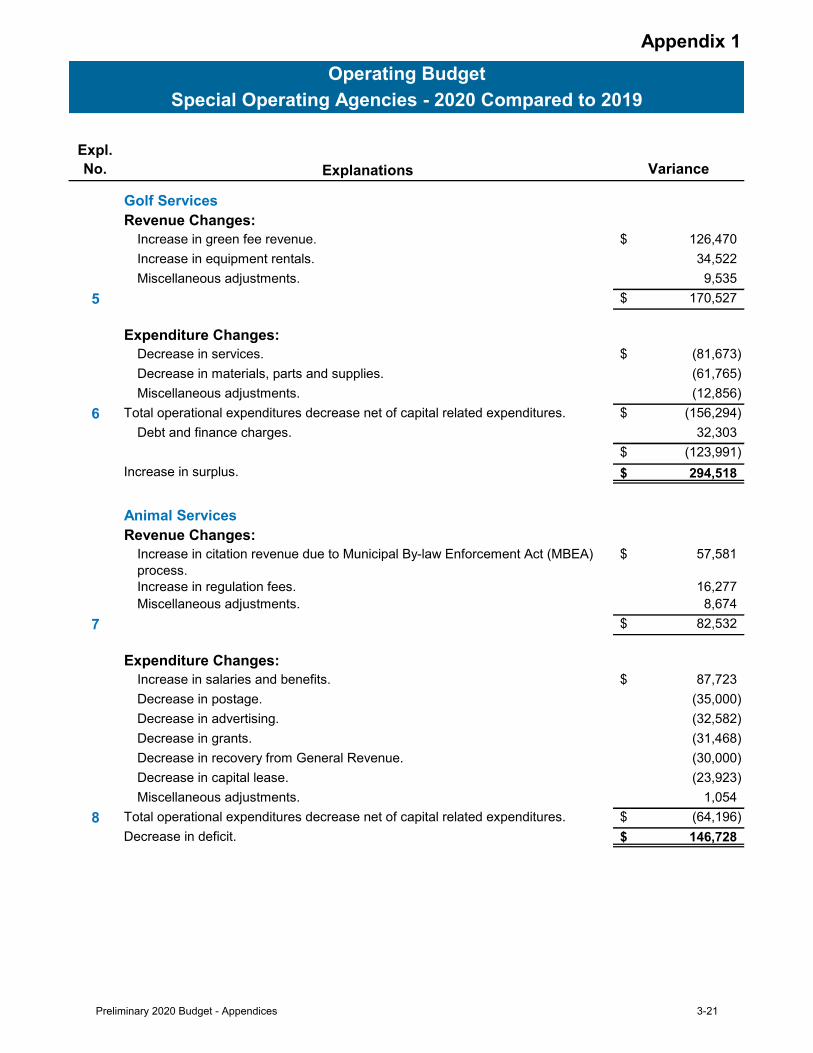
Appendix 1
Expl.
No. Explanations Variance
Operating Budget
Special Operating Agencies - 2020 Compared to 2019
Golf Services
Revenue Changes:
Increase in green fee revenue. 126,470$ Increase in equipment rentals. 34,522 Miscellaneous adjustments. 9,535
5 170,527$
Expenditure Changes:
Decrease in services. (81,673)$ Decrease in materials, parts and supplies. (61,765) Miscellaneous adjustments. (12,856)
6 Total operational expenditures decrease net of capital related expenditures. (156,294)$ Debt and finance charges. 32,303
(123,991)$ Increase in surplus. 294,518$
Animal Services
Revenue Changes:
Increase in citation revenue due to Municipal By-law Enforcement Act (MBEA) process.
57,581$
Increase in regulation fees. 16,277Miscellaneous adjustments. 8,674
7 82,532$
Expenditure Changes:
Increase in salaries and benefits. 87,723$ Decrease in postage. (35,000) Decrease in advertising. (32,582) Decrease in grants. (31,468) Decrease in recovery from General Revenue. (30,000) Decrease in capital lease. (23,923) Miscellaneous adjustments. 1,054
8 Total operational expenditures decrease net of capital related expenditures. (64,196)$ Decrease in deficit. 146,728$
Preliminary 2020 Budget - Appendices 3-21

3-22 Preliminary 2020 Budget - Appendices

Appendix 2
Organization / Program Department
2019 Adopted Budget
(Restated)
2020Preliminary
Budget
2021Projection
2022Projection
2023Projection
Annual Grants - Operating BudgetAge and Opportunity Centre - Older victims services
Police Service 20,250 18,225 18,225 18,225 18,225
Age and Opportunity Centre Support Services for Older Adults Inc.
Community Services
80,100 72,090 72,090 72,090 72,090
Andrews Street Family Centre
Community Services
45,700 45,700 45,700 45,700 45,700
Art City City Clerks 100,000 90,000 90,000 90,000 90,000
Art City 5 Community Services
47,500 42,750 42,750 42,750 42,750
Big Brothers Big Sisters of Winnipeg, Inc.
Community Services
12,000 10,800 10,800 10,800 10,800
Block Parents Police Service 17,564 15,808 15,808 15,808 15,808 Boys and Girls Club of
Winnipeg Inc. 1Community Services
118,148 118,148 118,148 118,148 118,148
Boys and Girls Club of Winnipeg Inc. - Clean
Machine programs 1
Public Works 63,000 63,000 63,000 63,000 63,000
Broadway Neighbourhood Centre Inc.
Community Services
120,500 120,500 120,500 120,500 120,500
Broadway Neighbourhood Centre - Just TV
Community Services
150,000 135,000 135,000 135,000 135,000
Charleswood Social Club Community Services
1,600 1,440 1,440 1,440 1,440
Coalition to Save the Elms,
Manitoba Inc.1Public Works 20,000 20,000 20,000 20,000 20,000
Community Centres 4 Community Services
5,932,229 6,075,000 6,197,000 6,321,000 6,448,000
Downtown Winnipeg Biz -
Biz zone cleanliness 1Public Works 117,000 117,000 117,000 117,000 117,000
Downtown Winnipeg Biz - Community Homeless Assistance Team (CHAT)
City Clerks 150,000 135,000 135,000 135,000 135,000
Downtown Winnipeg Biz - Parking infrastructure
maintenance 1
Parking 115,000 115,000 57,500 57,500 57,500
Downtown Winnipeg Biz -
Transit shelter cleanliness 1Transit 100,000 100,000 100,000 100,000 100,000
Economic Development Winnipeg - YES! Winnipeg
City Clerks 135,000 121,500 121,500 121,500 121,500
Edge Urban Art Centre City Clerks 10,000 9,000 9,000 9,000 9,000 Exchange District Biz - Biz
zone cleanliness 1Public Works 8,000 8,000 8,000 8,000 8,000
Exchange District Biz - Historic Exchange Walking Tour
Community Services
3,150 2,835 2,835 2,835 2,835
Listing of Grants/Payments
Preliminary 2020 Budget - Appendices 3-23

Appendix 2
Organization / Program Department
2019 Adopted Budget
(Restated)
2020Preliminary
Budget
2021Projection
2022Projection
2023Projection
Listing of Grants/Payments
Annual Grants - Operating Budget (continued)Exchange District Biz - Parking infrastructure
maintenance 1
Parking 60,000 60,000 30,000 30,000 30,000
Exchange District Biz -
Transit shelter cleanliness 1Transit 5,000 5,000 5,000 5,000 5,000
Festival du Voyageur Planning, Property and Development
40,000 36,000 36,000 36,000 36,000
The Forks Renewal
Corporation 1Public Works 1,200 1,200 1,200 1,200 1,200
The Fort Whyte Foundation Inc.
Waterworks 60,000 54,000 54,000 54,000 54,000
General Council of Winnipeg Community
Centres (GCWCC) 1,4
Community Services
1,272,241 1,172,241 1,172,241 1,172,241 1,172,241
GCWCC - Athletic Field
Sweat Equity 1Public Works 374,484 374,484 374,484 374,484 374,484
GCWCC - Athletic Field Maintenance
Public Works 280,500 30,000 30,000 30,000 30,000
Graffiti Art Programming
Inc.5Community Services
60,000 54,000 54,000 54,000 54,000
Grant's Old Mill Museum Museums 17,240 17,240 17,240 17,240 17,240 Green Action Centre Solid Waste
Disposal35,000 31,500 31,500 31,500 31,500
Heritage Winnipeg Corporation
Planning, Property and Development
34,750 31,275 31,275 31,275 31,275
The Historical Museum Association of St. James-Assiniboia Inc.
Museums 83,391 83,391 83,391 83,391 83,391
Immigrant and Refugee Community Organization of Manitoba (IRCOM)
Community Services
73,810 66,429 66,429 66,429 66,429
Immigrant Centre Manitoba Inc. - 24 Hour Language Bank Interpreter Services
Community Services
27,000 24,300 24,300 24,300 24,300
Indigenous Youth Strategy (see schedule at end of Appendix 2)
CAO 1,250,000 1,125,000 1,125,000 1,125,000 1,125,000
Ma Mawi Wi Chi Itata Centre - Positive Athletic Cultural Experiences (PACE) for Youth
Community Services
60,000 54,000 54,000 54,000 54,000
Main Street Project Inc. Community Services
96,000 86,400 86,400 86,400 86,400
Manitoba Eco Network 1 Public Works 5,000 - - - - Manitoba Theatre for Young People
City Clerks 30,000 27,000 27,000 27,000 27,000
3-24 Preliminary 2020 Budget - Appendices

Appendix 2
Organization / Program Department
2019 Adopted Budget
(Restated)
2020Preliminary
Budget
2021Projection
2022Projection
2023Projection
Listing of Grants/Payments
Annual Grants - Operating Budget (continued)Mediation Services Community
Services10,000 9,000 9,000 9,000 9,000
Mother Earth Recycling
Inc.1Solid Waste Disposal
- 120,000 120,000 120,000 120,000
New Directions Adult Day Services (formerly Alternative Solutions Day Services)
Solid Waste Disposal
30,000 40,500 40,500 40,500 40,500
North End Community
Renewal Corporation 5
Community Services
54,000 48,600 48,600 48,600 48,600
Norwood Lawn Bowling
Club1
Public Works 16,851 16,851 16,851 16,851 16,851
Pan Am Boxing Club Inc. Community Services
25,100 22,590 22,590 22,590 22,590
Red Road Lodge Community Services
8,400 7,560 7,560 7,560 7,560
River East Neighborhood Network - Trails
Public Works 9,000 9,000 9,000 9,000 9,000
Ross House Museum (Seven Oaks House Museum)
Museums 31,077 31,077 31,077 31,077 31,077
Rossbrook House Community Services
256,339 230,705 230,705 230,705 230,705
Save Our Seine River Environment Inc.
Waterworks 30,000 27,000 27,000 27,000 27,000
Seven Oaks House Museums 28,226 28,226 28,226 28,226 28,226 Spence Neighbourhood Association Inc. -
Community Liaison 1
Community Services
21,150 21,150 21,150 21,150 21,150
Spence Neighbourhood Association Inc. -
Recreation Programming 1
Community Services
60,000 60,000 60,000 60,000 60,000
Spence Neighbourhood
Association 1Public Works 2,000 2,000 2,000 2,000 2,000
St. Boniface Museum Museums 450,000 450,000 450,000 450,000 450,000 Take Pride Winnipeg - General operating
Solid Waste Disposal
183,000 164,700 164,700 164,700 164,700
Take Pride Winnipeg - Cleaner Greener Winnipeg
Public Works 27,000 27,000 27,000 27,000 27,000
Take Pride Winnipeg - Team Up to Clean Up &
Mural Program 1
City Clerks 20,000 20,000 20,000 20,000 20,000
Preliminary 2020 Budget - Appendices 3-25

Appendix 2
Organization / Program Department
2019 Adopted Budget
(Restated)
2020Preliminary
Budget
2021Projection
2022Projection
2023Projection
Listing of Grants/Payments
Annual Grants - Operating Budget (continued)Take Pride Winnipeg -
Graffiti Control 1Public Works 20,000 20,000 20,000 20,000 20,000
Transcona Historical Museum Inc.
Museums 155,000 155,000 155,000 155,000 155,000
University of Manitoba - Faculty of Kinesiology and
Recreation Management 5
Community Services
51,000 45,900 45,900 45,900 45,900
University of Manitoba - Research Sustainable Wastewater Treatment and Nutrient Recovery
Waterworks 30,000 27,000 27,000 27,000 27,000
West End Biz - Biz zone
cleanliness 1Public Works 8,000 8,000 8,000 8,000 8,000
West End Biz - Parking infrastructure maintenance
Parking 32,500 32,500 16,250 16,250 16,250
William Whyte
Neighbourhood Association
Community Services
2,500 2,250 2,250 2,250 2,250
Winnipeg Arts Council City Clerks 4,645,319 4,180,787 4,180,787 4,180,787 4,180,787 Winnipeg Arts Council -
Museum Grant Funds 5
City Clerks 287,300 258,570 258,570 258,570 258,570
Winnipeg Art Gallery - Inuit Art Centre
City Clerks 1,000,000 1,000,000 - - -
Winnipeg Harvest Transit 50,000 - - - - Winnipeg Housing Rehabilitation Corporation
Planning, Property and Development
180,000 162,000 162,000 162,000 162,000
Winnipeg Parade Committee - Santa Claus
City Clerks 20,000 18,000 18,000 18,000 18,000
Winnipeg Public Library Board
Community Services
79,315 71,384 71,384 71,384 71,384
Winnipeg Repair Education and Cycling Hub Inc. (W.R.E.N.C.H Inc.)
Community Services
10,000 9,000 9,000 9,000 9,000
Total - Annual Grants 19,065,434 18,096,606 17,114,856 17,238,856 17,365,856
Multi-Year Agreements - Operating BudgetAssiniboine Park Conservancy
Community Services
11,078,000 11,327,000 11,579,262 11,950,864 11,950,864
Band 40 Aboriginal Youth Scholarship
Waterworks 4,000 4,000 4,000 4,000 4,000
Centre Venture - Youth Centre of Excellence
Planning, Property and Development
241,597 241,597 241,597 241,597 241,597
3-26 Preliminary 2020 Budget - Appendices

Appendix 2
Organization / Program Department
2019 Adopted Budget
(Restated)
2020Preliminary
Budget
2021Projection
2022Projection
2023Projection
Listing of Grants/Payments
Multi-Year Agreements - Operating Budget (continued)Transcona East End Community Club Inc. (formerly East End Community Centre)
Community Services
190,000 190,000 190,000 190,000 190,000
End Homelessness Winnipeg Inc.
Community Services
150,000 150,000 150,000 150,000 150,000
Garden City Community Centre
Community Services
358,929 358,929 358,929 358,929 358,929
True North - Refund of
Business Tax3
Assmt & Taxation
249,000 242,000 242,000 242,000 242,000
True North - Refund of
Entertainment Funding Tax2
Assmt & Taxation
8,100,000 8,100,000 8,100,000 8,100,000 8,100,000
University of Manitoba - Research Chair in Municipal Infrastructure
Public Works 50,000 50,000 50,000 50,000 50,000
Winnipeg Football Club - Refund of Entertainment
Funding Tax2
Assessment & Taxation
1,450,000 1,115,000 1,115,000 1,115,000 1,115,000
Winnipeg Goldeyes - Municipal Property Tax
Rebate3
Assessment & Taxation
43,100 42,000 42,980 43,980 26,250
Winnipeg Goldeyes - Refund of Entertainment
Funding Tax2
Assessment & Taxation
325,000 325,000 325,000 325,000 189,583
Winnipeg Humane Society (WHS)
Animal Services
652,273 652,273 652,273 652,273 652,273
Winnipeg Police Museum Police 18,000 18,000 18,000 18,000 18,000
Total - Multi-Year Grants 22,909,899 22,815,799 23,069,041 23,441,643 23,288,496
Other Programs - Operating BudgetCivic Initiatives,
Promotional and Protocol 6Mayor's Office 403,000 393,800 390,800 383,800 477,010
Local Grants (Per Capita Grants)
City Clerks 167,481 150,733 150,733 150,733 150,733
Minimal Municipal Services Assessment & Taxation
310,000 295,000 295,000 295,000 295,000
Community Committee Grants - Human Rights Committee
City Clerks - 3,000 3,000 3,000 3,000
Community Committee Grants - Committee for Safety
City Clerks 6,000 6,000 6,000 6,000 6,000
24/7 Safe Spaces Program Community Services
- 250,000 250,000 250,000 250,000
Preliminary 2020 Budget - Appendices 3-27

Appendix 2
Organization / Program Department
2019 Adopted Budget
(Restated)
2020Preliminary
Budget
2021Projection
2022Projection
2023Projection
Listing of Grants/Payments
Other Programs - Operating Budget (continued)Graffiti Control Partner Funding Allocation - various
organizations 1
Public Works 210,000 210,000 210,000 210,000 210,000
Province of Manitoba (Off The Wall Program) - Graffiti
Control 1
Public Works 10,000 10,000 10,000 10,000 10,000
Transit Community Events Support - Christmas Cheer Board "Santa Bus"
Transit 14,300 - - - -
Transit Community Events Support - Green Action Centre Commuter Challenge
Transit 10,000 9,000 9,000 9,000 9,000
Estimated grants in support of cat spay and neuter programs
Animal Services
176,525 145,057 145,057 145,057 145,057
Winnipeg Soccer Federation PP& D 27,145 6,300 6,300 6,300 6,300
Total - Other Grants 1,334,451 1,478,890 1,475,890 1,468,890 1,562,100
Value in Kind GrantsWpg. Aboriginal Sport Achievement Centre (W.A.S.A.C.)
Community Services
144,246 144,246 144,246 144,246 144,246
Canada Day (The Forks) Public Works 2,000 1,800 1,800 1,800 1,800 Festival du Voyageur Public Works 20,000 18,000 18,000 18,000 18,000 Fringe Festival Public Works 3,500 3,150 3,150 3,150 3,150 Fringe Festival Public Works 9,000 8,100 8,100 8,100 8,100 Jazz Winnipeg Public Works 7,000 6,300 6,300 6,300 6,300 National Film Institute Public Works 1,000 900 900 900 900 Santa Claus Parade Public Works 8,000 7,200 7,200 7,200 7,200 Temporary Street Closures for Entertainment Purposes
Public Works 100,289 90,260 90,260 90,260 90,260
Various Events Public Works 414 373 373 373 373 Various Public Works 15,000 13,500 13,500 13,500 13,500 Winnipeg International Children's Festival Public Works 2,000 1,800 1,800 1,800 1,800 Parking Pass Grants Parking 260,000 234,000 130,000 - - Various Events Parking - 27,000 15,000 - -
Bus Charter Transit 17,000 15,300 15,300 15,300 15,300 Bus is Better - Downtown Biz
Transit 5,400 4,860 4,860 4,860 4,860
Commuter Challenge - Green Action Centre
Transit 13,245 11,920 11,920 11,920 11,920
Fare Product Transit 5,000 4,500 4,500 4,500 4,500
Total - Value in Kind Grants 613,094 593,209 477,209 332,209 332,209
3-28 Preliminary 2020 Budget - Appendices

Appendix 2
Organization / Program Department
2019 Adopted Budget
(Restated)
2020Preliminary
Budget
2021Projection
2022Projection
2023Projection
Listing of Grants/Payments
Capital GrantsPedestrian Cycling Program Public Works 175,000 175,000 160,000 160,000 160,000 Bicycle Parking Partnership Grants
Public Works 25,000 42,000 40,000 30,000 30,000
Community Centre Renovation Grant Program (CCRGP)
Community Services
2,000,000 2,000,000 2,000,000 2,000,000 2,000,000
Community Incentive Grant Program (CIGP)
Community Services
1,961,000 1,000,000 1,000,000 1,000,000 -
Assiniboine Park Conservancy - Infrastructure and Sustainability
Community Services
5,123,000 4,600,000 2,000,000 2,000,000 2,000,000
Assiniboine Park Conservancy - Capital Development Plan
Community Services
4,728,000 - - - -
Biz Zones, Image Routes and Neighbourhood Main Streets
Planning, Property and Development
332,000 352,000 - 126,000 -
Winnipeg Arts Council - Public Art Strategy
Planning, Property and Development
250,000 200,000 - - -
Total - Capital Grants 14,594,000 8,369,000 5,200,000 5,316,000 4,190,000
Grants from ReservesBuilding External Lighting Program
Assessment & Taxation
200,000 300,000 - - -
Safewalk Program - Biz programs
Assessment & Taxation
- 375,000 - - -
Economic Development
Winnipeg 1Assessment & Taxation
3,395,000 3,465,000 3,500,000 3,535,000 3,570,000
Economic Development Winnipeg - Special Event
Marketing Fund 1
Assessment & Taxation
1,086,502 1,140,084 1,166,530 1,192,211 1,218,047
Winnipeg Convention
Centre1
Assessment & Taxation
1,500,000 1,500,000 1,500,000 1,500,000 1,500,000
Winnipeg Convention Centre - fire stopping, fire damping & washroom
Assessment & Taxation
2,100,000 2,769,904 - - -
Winnipeg Convention Centre - payment to pay down city commitment of $8
million 1
Assessment & Taxation
1,000,000 1,000,000 1,000,000 1,000,000 1,000,000
Community Safety and
Crime Prevention program 6Assessment & Taxation
100,000 100,000 100,000 100,000 -
Preliminary 2020 Budget - Appendices 3-29

Appendix 2
Organization / Program Department
2019 Adopted Budget
(Restated)
2020Preliminary
Budget
2021Projection
2022Projection
2023Projection
Listing of Grants/Payments
Grants from Reserves (continued)Gail Parvin Hammerquist - Centre Venture
Planning, Property and Development
- 470,964 595,084 431,895 431,895
Gail Parvin Hammerquist - City-Wide Program
Planning, Property and Development
395,775 - - - -
Heritage Conservation Grant Program By Law 2018/63
Planning, Property and Development
- 200,116 200,116 200,116 200,116
Housing Demo, Min. Home Repair & Indigenous Housing Programs
Planning, Property and Development
1,000,000 1,000,000 1,000,000 1,000,000 1,000,000
Homelessness Partnership Strategy (HPS)
Community Services
3,102,604 - - - -
Economic Development Grants
Planning, Property and Development
2,093,135 2,211,583 1,885,814 2,950,815 2,959,090
Neighbourhood/Downtown Multiple-Family Mixed use Building Grant Program
Planning, Property and Development
903,352 1,056,362 701,218 417,288 321,528
Downtown Residential Development Grant (DRDG) Program
Planning, Property and Development
1,573,631 1,734,591 1,734,591 1,734,591 1,734,591
DRDG - 320 Colony Planning, Property and Development
84,641 85,657 86,685 87,725 88,778
Live Downtown - Rental Development Grant Program
Planning, Property and Development
180,767 238,677 547,323 1,997,587 2,037,538
Total - Grants from Reserves 18,715,407 17,647,938 14,017,361 16,147,228 16,061,583
Total Grants 77,232,285 69,001,442 61,354,357 63,944,826 62,800,244
Notes:
5. 2019 budgets have been restated to reflect amounts that were budgeted in non-grant accounts.
6. 2019 budget restated move amount for the Community Safety and Crime Prevention program out of the operating budget and into reserves.
The listing of grants/payments includes grants in the operating, capital, and reserves budgets. The operating grants/payments are separated in to four categories (annual, multi-year, other programs and value in kind).
4. 2019 budget restated to show 2017 retroactive adjustment to community centres on the Community Centres grant line rather than General Council of Winnipeg Community Centres.
2. Grant is recorded as an offset to the Refundable Entertainment Funding Tax Revenue.
1. Includes Community Partnerships.
For all associated definitions please refer to the glossary in Appendix 11.
3. Grant is recorded as an offset to the Property Tax and Business Tax Revenue.
The City can enter into four year grant agreements with grant recipients with a provision that grants for years following 2020 are subject to annual budget approval.
3-30 Preliminary 2020 Budget - Appendices

Appendix 2
Organization / Program Department
2019 Adopted Budget
(Restated)
2020Preliminary
Budget
2021Projection
2022Projection
2023Projection
Indigenous Youth Strategy - Operating BudgetIndigenous Leadership Development Institute - Indigenous Construction Technology Program
Chief Administrative Office (CAO)
99,370 99,370 99,370 99,370 99,370
Assembly of Manitoba Chiefs - Eagle's Nest Youth Centre
CAO 146,500 146,500 146,500 146,500 146,500
Boys and Girls Club - Youth Recreation Activity Worker Program
CAO 20,000 20,000 20,000 20,000 20,000
Broadway Neighbourhood Centre - Just TV
CAO 41,380 41,380 41,380 41,380 41,380
Ka Ni Kanichihk Inc. - Honouring our Gifts
CAO 131,230 131,230 131,230 131,230 131,230
Ma Mawi Wi Chi Itata Centre - The Future is
CAO 107,331 107,331 107,331 107,331 107,331
Ndinaweaaganag Endaawaad Inc. - Youth Resource Centre Recreation Program
CAO 51,000 51,000 51,000 51,000 51,000
Spence Neighbourhood Association - First Jobs 4 Youth Project
CAO 36,549 36,549 36,549 36,549 36,549
Resource Assistance for Youth - Growing Opportunities
CAO 82,745 82,745 82,745 82,745 82,745
youthunited@winnipeg (University of Winnipeg)
CAO 200,000 150,000 150,000 150,000 150,000
Indigenous Youth Strategy - Internal City of Winnipeg Projects
CAO 83,895 83,895 83,895 83,895 83,895
Infrastructure training/apprenticeship program *
CAO 250,000 175,000 175,000 175,000 175,000
Total Indigenous Youth Strategy 1,250,000 1,125,000 1,125,000 1,125,000 1,125,000
Listing of Grants/Payments
* Infrastructure training/apprenticeship program (cash and in-kind services) – the City of Winnipeg 1/3 share of up to $175,000 in the program is subject to 1/3 funding from the Province and 1/3 funding from the private sector.
Preliminary 2020 Budget - Appendices 3-31

3-32 Preliminary 2020 Budget - Appendices
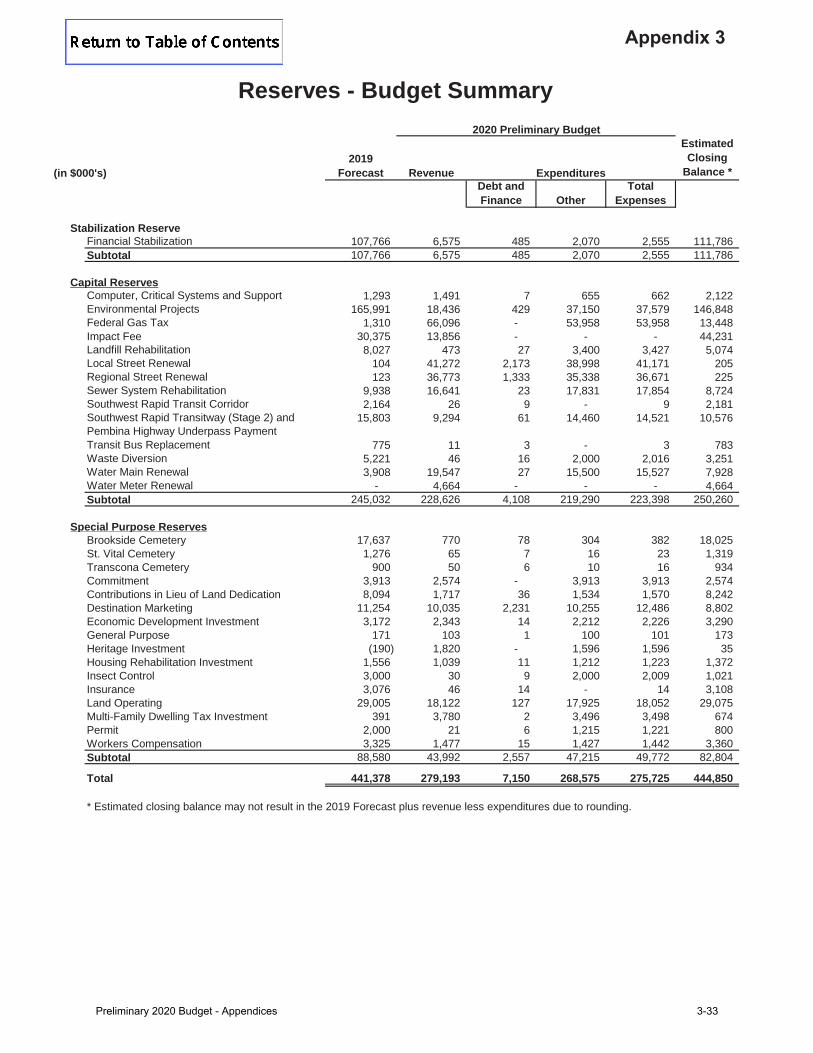
2020 Preliminary Budget
(in $000's)2019
Forecast Revenue
EstimatedClosing
Balance *Debt and Finance Other
Total Expenses
Stabilization ReserveFinancial Stabilization 107,766 6,575 485 2,070 2,555 111,786Subtotal 107,766 6,575 485 2,070 2,555 111,786
Capital ReservesComputer, Critical Systems and Support 1,293 1,491 7 655 662 2,122Environmental Projects 165,991 18,436 429 37,150 37,579 146,848Federal Gas Tax 1,310 66,096 - 53,958 53,958 13,448Impact Fee 30,375 13,856 - - - 44,231Landfill Rehabilitation 8,027 473 27 3,400 3,427 5,074Local Street Renewal 104 41,272 2,173 38,998 41,171 205Regional Street Renewal 123 36,773 1,333 35,338 36,671 225Sewer System Rehabilitation 9,938 16,641 23 17,831 17,854 8,724Southwest Rapid Transit Corridor 2,164 26 9 - 9 2,181Southwest Rapid Transitway (Stage 2) and Pembina Highway Underpass Payment
15,803 9,294 61 14,460 14,521 10,576
Transit Bus Replacement 775 11 3 - 3 783Waste Diversion 5,221 46 16 2,000 2,016 3,251Water Main Renewal 3,908 19,547 27 15,500 15,527 7,928Water Meter Renewal - 4,664 - - - 4,664Subtotal 245,032 228,626 4,108 219,290 223,398 250,260
Special Purpose ReservesBrookside Cemetery 17,637 770 78 304 382 18,025St. Vital Cemetery 1,276 65 7 16 23 1,319Transcona Cemetery 900 50 6 10 16 934Commitment 3,913 2,574 - 3,913 3,913 2,574Contributions in Lieu of Land Dedication 8,094 1,717 36 1,534 1,570 8,242Destination Marketing 11,254 10,035 2,231 10,255 12,486 8,802Economic Development Investment 3,172 2,343 14 2,212 2,226 3,290General Purpose 171 103 1 100 101 173Heritage Investment (190) 1,820 - 1,596 1,596 35Housing Rehabilitation Investment 1,556 1,039 11 1,212 1,223 1,372Insect Control 3,000 30 9 2,000 2,009 1,021Insurance 3,076 46 14 - 14 3,108Land Operating 29,005 18,122 127 17,925 18,052 29,075Multi-Family Dwelling Tax Investment 391 3,780 2 3,496 3,498 674Permit 2,000 21 6 1,215 1,221 800Workers Compensation 3,325 1,477 15 1,427 1,442 3,360Subtotal 88,580 43,992 2,557 47,215 49,772 82,804
Total 441,378 279,193 7,150 268,575 275,725 444,850
* Estimated closing balance may not result in the 2019 Forecast plus revenue less expenditures due to rounding.
Expenditures
Reserves - Budget Summary
Preliminary 2020 Budget - Appendices 3-33

3-34 Preliminary 2020 Budget - Appendices

Appendix 4a
Transfers from Other Funds
2019
Adopted
Budget
2020
Preliminary
Budget
Variance 2021
Projection
2022
Projection
2023
Projection
Financial Stabilization Reserve ② $ 10,303,733 (4,959,067) $ (15,262,800) (6,817,945) 4,555,491 24,221,521 ①Insect Control Reserve 2,000,000 2,000,000 - - - - ①Workers Compensation Reserve 1,000,000 - (1,000,000) - - - ①Insurance Reserve 1,700,000 - (1,700,000) - - - ①Economic Development Investment Reserve 1,806,000 - (1,806,000) - - - ①Multi-Family Dwelling Investment Reserve 1,500,000 - (1,500,000) - - - ①Permit Reserve 203,000 - (203,000) - - - ①Perpetual Maintenance Reserve 325,461 311,351 (14,110) 318,709 326,667 334,816 Housing Rehabilitation Investment Reserve 152,054 162,000 9,946 162,000 162,000 162,000 Land Operating Reserve 235,000 4,235,000 4,000,000 1,235,000 1,235,000 1,235,000 ①Destination Marketing Reserve 80,998 82,416 1,418 83,470 85,289 86,953 Municipal Accommodations 10,027,505 10,961,906 934,401 9,724,366 9,893,932 10,122,318 For 311 Contact Centre services provided 1,452,448 - (1,452,448) - - - Business Technology Services (BTS) transfers 145,838 - (145,838) - - -
Total $ 30,932,037 $ 12,793,606 $ (18,138,431) $ 4,705,600 $ 16,258,379 $ 36,162,608
① One-time transfers from reserves: $ 18,747,733 $ 1,275,933 $ (17,471,800) $ (5,582,945) $ 5,790,491 $ 25,456,521
② Financial Stabilization Reserve: 4-year total - $17,000,000 $ (4,959,067) $ (6,817,945) $ 4,555,491 $ 24,221,521
Tax Supported Transfers From Other Funds
(Revenue in General Revenue Fund)
Preliminary 2020 Budget - Appendices 3-35
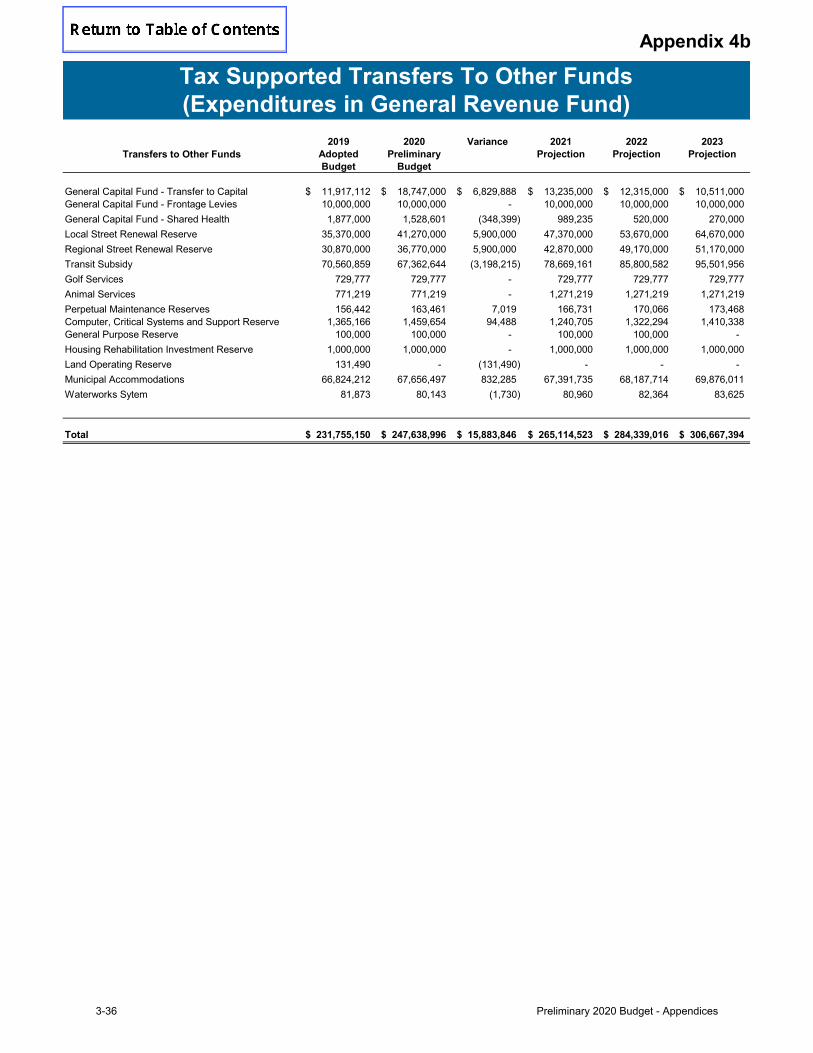
Appendix 4b
Transfers to Other Funds
2019
Adopted
Budget
2020
Preliminary
Budget
Variance 2021
Projection
2022
Projection
2023
Projection
General Capital Fund - Transfer to Capital $ 11,917,112 $ 18,747,000 $ 6,829,888 $ 13,235,000 $ 12,315,000 $ 10,511,000 General Capital Fund - Frontage Levies 10,000,000 10,000,000 - 10,000,000 10,000,000 10,000,000 General Capital Fund - Shared Health 1,877,000 1,528,601 (348,399) 989,235 520,000 270,000 Local Street Renewal Reserve 35,370,000 41,270,000 5,900,000 47,370,000 53,670,000 64,670,000 Regional Street Renewal Reserve 30,870,000 36,770,000 5,900,000 42,870,000 49,170,000 51,170,000 Transit Subsidy 70,560,859 67,362,644 (3,198,215) 78,669,161 85,800,582 95,501,956 Golf Services 729,777 729,777 - 729,777 729,777 729,777 Animal Services 771,219 771,219 - 1,271,219 1,271,219 1,271,219 Perpetual Maintenance Reserves 156,442 163,461 7,019 166,731 170,066 173,468 Computer, Critical Systems and Support Reserve 1,365,166 1,459,654 94,488 1,240,705 1,322,294 1,410,338 General Purpose Reserve 100,000 100,000 - 100,000 100,000 - Housing Rehabilitation Investment Reserve 1,000,000 1,000,000 - 1,000,000 1,000,000 1,000,000 Land Operating Reserve 131,490 - (131,490) - - - Municipal Accommodations 66,824,212 67,656,497 832,285 67,391,735 68,187,714 69,876,011 Waterworks Sytem 81,873 80,143 (1,730) 80,960 82,364 83,625
Total $ 231,755,150 $ 247,638,996 $ 15,883,846 $ 265,114,523 $ 284,339,016 $ 306,667,394
Tax Supported Transfers To Other Funds
(Expenditures in General Revenue Fund)
3-36 Preliminary 2020 Budget - Appendices

Departments
2019AdoptedBudget
2020Preliminary
Budget Variance2021
Forecast2022
Forecast2023
ForecastPublic Works $ 5,481,000 $ 9,334,000 $ 3,853,000 $ 6,045,000 $ 4,962,000 $ 3,748,000 Community Services 3,934,000 3,600,000 (334,000) 1,955,000 Winnipeg Police Service 2,900,000 2,681,000 (219,000) 4,990,000 5,047,000 3,034,000 Fire Paramedic Service - Planning, Property and Development 1,120,000 2,406,000 1,286,000 573,000 326,000 228,000 City Clerks - 100,000 210,000 100,000 Innovation, Transformation and Technology 1,660,000 1,660,000 1,190,000 1,358,000 1,346,000 Customer Service and Communications 122,000 122,000 100,000 100,000 Assessment and Taxation 530,000 (530,000) 237,000 412,000 Total tax supported $ 13,965,000 $ 19,803,000 $ 5,838,000 $ 13,235,000 $ 12,315,000 $ 10,511,000 Transit 5,039,000 2,805,000 (2,234,000) 7,476,000 7,206,000 9,213,000 Municipal Accommodations 2,256,000 113,000 (2,143,000) 2,178,000 1,887,000 1,776,000 Total City Transfer to Capital $ 21,260,000 $ 22,721,000 $ 1,461,000 $ 22,889,000 $ 21,408,000 $ 21,500,000
Corporate - Savings from capital closure (2,524,798) 2,524,798
TOTAL $ 18,735,202 $ 22,721,000 $ 3,985,798 $ 22,889,000 $ 21,408,000 $ 21,500,000
Notes:
Tax Supported:a) Transfer to capital reduction 5,838,000
2,524,798 Total Tax Supported 8,362,798 Utility - transfer to capital year over year change:
Transit (2,234,000)
Municipal Accommodations (2,143,000)
3,985,798
2. Year over year Total City Transfer to Capital change:
b) Corporate - difference in savings from capital closure
Total City Transfer to Capital change
Transfer to Capital Reconciliation
1. Public Works transfer to capital excludes transfers to the regional and local streets reserves (2019 - $66.240 million and 2020 - $78.040million) and transfer to capital - frontage levy of $10 million.
Appendix 5
Preliminary 2020 Budget - Appendices 3-37

3-38 Preliminary 2020 Budget - Appendices

Appendix 6
2019 RateProposed 2020 Rate
Units
All new and above inflation rates are Effective April 1, 2020
Police Response
GST applicable unless otherwise shown
Special duty officers
Constable $ 112.00 $ 116.00 per hour
Patrol/detective sergeant $ 116.00 $ 120.00 per hour
Sergeant $ 123.00 $ 127.00 per hour
Staff sergeant $ 134.00 $ 138.00 per hour
Fees and Charges - Inflationary Increases
Fees and Charges By-Law 196-2008 outlines the following:
Inflationary Increases to fees authorized
2019 - 1.6% (CPI in 2017)
2018 - 1.2% (CPI in 2016)
2017 - 1.4% (CPI in 2015)
2016 - 1.9% (CPI in 2014)
2015 - 2.3% (CPI in 2013)
2020 Fees and Charges Schedule
Fees and Charges are budgeted to increase at 2% per year in 2021 to 2023.
3(1) Subject to this By-law the Chief Financial Officer is hereby authorized to increase annually any fee imposed by the City of Winnipeg by an amount equal to or less that the rate of inflation.
The rate of inflation used for the 2020 fees was the last actual rate published by Statistics Canada (at the time of this budget process) - the Consumer Price Index (CPI) for Winnipeg in 2018 - 2.4%
Previous inflation rates used for past Fees and Charges Schedules:
Increases Greater than InflationService NameFee Name and Description
Preliminary 2020 Budget - Appendices 3-39

3-40 Preliminary 2020 Budget - Appendices

Appendix 7
2019
Adopted
Budget
2020
Preliminary
Budget
Budget
Variance
2019
Adopted
Budget
FTEs
2020
Preliminary
Budget
FTEs
FTE
Variance
Chief Administrative Office 416,934 422,518 5,584 3.00 3.00 - Community Services 387,375 460,365 72,990 3.00 3.00 - Corporate Finance 106,600 111,594 4,994 1.00 1.00 - Innovation, Transformation and Technology 490,770 499,832 9,062 4.00 4.00 -
Fire Paramedic Services 140,920 144,316 3,396 1.00 1.00 - Planning, Property & Development 780,772 717,071 (63,701) 7.00 6.00 (1.00) (including Municipal Accommodations)Public Works 1,434,144 1,434,144 - 8.00 8.00 - TOTAL 3,757,515$ 3,789,840$ 32,325$ 27.00 26.00 (1.00)
2019
Adopted
Budget
(Restated)
⑤
2020
Preliminary
Budget
Budget
Variance
2019
Adopted
Budget
FTEs
(Restated)
⑤
2020
Preliminary
Budget
FTEs
FTE
Variance
Community Services 79,628 77,345 (2,283) 1.00 1.00 - Legal Services 140,254 146,291 6,037 1.00 1.00 -
135,945 135,945 - 1.64 1.64 -
Public Works 2,769,374 2,769,374 - 19.00 19.00 - Transit 562,934 173,035 (389,899) 5.00 1.00 (4.00) Water and Waste 2,223,663 1,882,451 (341,212) 5.00 5.00 - TOTAL 5,911,798$ 5,184,441$ (727,357)$ 32.64 28.64 (4.00)
TOTAL 9,669,313$ 8,974,281$ (695,032)$ 59.64 54.64 (5.00)
Notes:
Departments
Departments
Planning, Property & Development (Municipal Accommodations)
⑤ 2019 Adopted Budget figures have been restated for a Planning, Property & Development correction.
Asset Management and Capital Recoveries
Asset and Project Management Recoveries
Other Capital Fund Recoveries
① Asset and Project Management Recoveries include Project Management Office (PMO) positions to date as part of the Asset Management initiative. ② Budget includes salary and non-salary amounts.③ Other Capital Fund Recoveries include administration for Community Incentive Grant Program (CIGP), Legal Services large scale projects, in-house engineering, etc.④ Temporary positions authorized in capital projects or programs in 2020 and prior that may have an impact on 2020 operations total $9.446 million, 99.5 FTEs. In comparison, 2019 and prior that may have had an impact on 2019 operations total $12.623 million, 133.5 FTEs.
FTEs ($ 000's)
Tax Supported 79.0 7,471$
Utilities 20.5 1,975
TOTAL CITY 99.5 9,446$
Total 2020 & Prior
Preliminary 2020 Budget - Appendicies 3-41
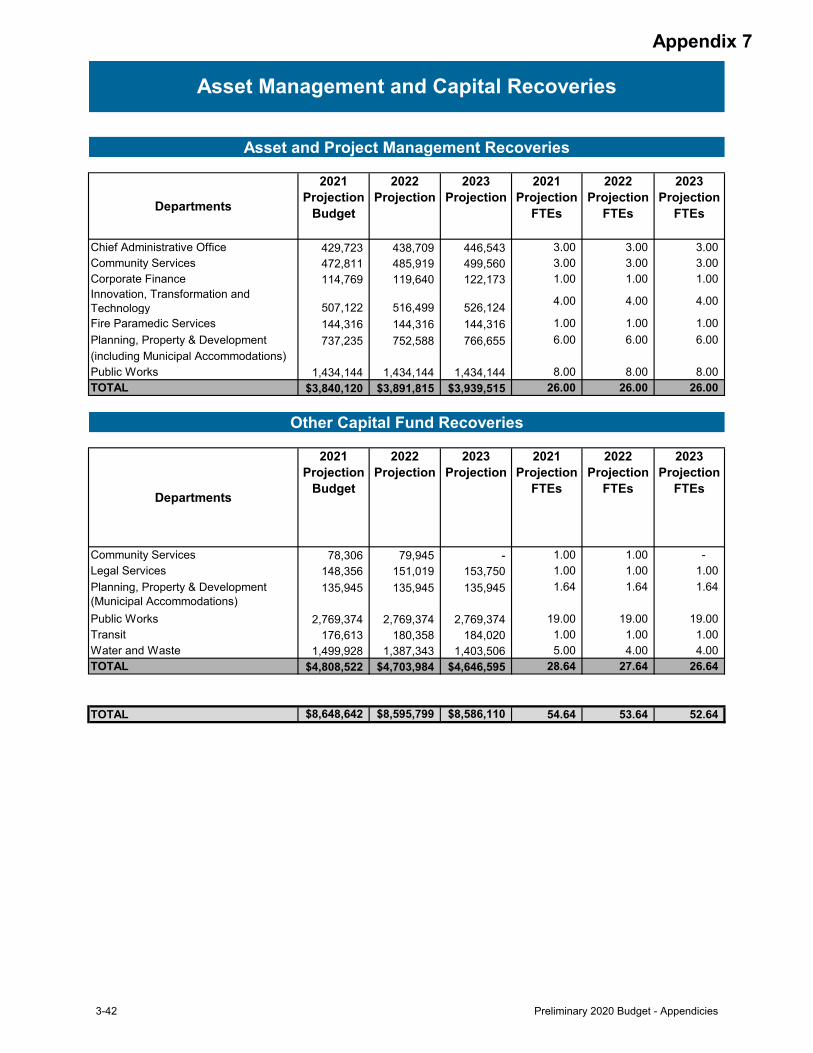
Appendix 7
Departments
2021
Projection
Budget
2022
Projection
2023
Projection
2021
Projection
FTEs
2022
Projection
FTEs
2023
Projection
FTEs
Chief Administrative Office 429,723 438,709 446,543 3.00 3.00 3.00 Community Services 472,811 485,919 499,560 3.00 3.00 3.00 Corporate Finance 114,769 119,640 122,173 1.00 1.00 1.00 Innovation, Transformation and Technology 507,122 516,499 526,124 4.00 4.00 4.00
Fire Paramedic Services 144,316 144,316 144,316 1.00 1.00 1.00 Planning, Property & Development 737,235 752,588 766,655 6.00 6.00 6.00 (including Municipal Accommodations)Public Works 1,434,144 1,434,144 1,434,144 8.00 8.00 8.00 TOTAL 3,840,120$ 3,891,815$ 3,939,515$ 26.00 26.00 26.00
Departments
2021
Projection
Budget
2022
Projection
2023
Projection
2021
Projection
FTEs
2022
Projection
FTEs
2023
Projection
FTEs
Community Services 78,306 79,945 - 1.00 1.00 - Legal Services 148,356 151,019 153,750 1.00 1.00 1.00
135,945 135,945 135,945 1.64 1.64 1.64
Public Works 2,769,374 2,769,374 2,769,374 19.00 19.00 19.00 Transit 176,613 180,358 184,020 1.00 1.00 1.00 Water and Waste 1,499,928 1,387,343 1,403,506 5.00 4.00 4.00 TOTAL 4,808,522$ 4,703,984$ 4,646,595$ 28.64 27.64 26.64
TOTAL 8,648,642$ 8,595,799$ 8,586,110$ 54.64 53.64 52.64
Planning, Property & Development (Municipal Accommodations)
Asset Management and Capital Recoveries
Asset and Project Management Recoveries
Other Capital Fund Recoveries
3-42 Preliminary 2020 Budget - Appendicies

(in thousands of dollars) 2020 2019 Change
RevenuesTaxation 784,701$ 756,921$ 27,780$ Sale of services and regulatory fees 652,041 637,921 14,120 Government transfers 201,991 216,802 (14,811) Investment income 35,407 34,237 1,170 Land sales and other revenue 24,833 23,698 1,135
Total Revenues 1,698,973 1,669,579 29,394
ExpensesProtection and community services 562,836 557,356 5,480 Utility operations 489,852 476,823 13,029 Public works 329,974 324,731 5,243 Property and development 152,787 143,498 9,289 Finance and administration 96,370 102,332 (5,962) Civic corporations 75,041 74,514 527 General government 21,300 26,504 (5,204) Total Expenses 1,728,160 1,705,758 22,402
(29,187) (36,179) 6,992
OtherGovernment transfers related to capital 149,333 293,877 (144,544) Developer contributions-in-kind related to capital 76,219 71,050 5,169 Other capital contributions 5,600 5,500 100
231,152 370,427 (139,275) Excess Revenues Over Expenses 201,965$ 334,248$ (132,283)$
Deficiency Revenues Over Expenses Before Other
2020 Consolidated Budget
A number of consolidation entries and some figures on the statements are derived from the 2019 audited financial statements. As such, some figures may be subject to change.
Appendix 8
Preliminary 2020 Budget - Appendices 3-43

Preliminary Consolidating Consolidated(in thousands of dollars) Budget * Entries Budget
RevenuesTaxation 799,753$ (15,052)$ 784,701$ Sale of services and regulatory fees 694,187 (42,146) 652,041 Government transfers 197,352 4,639 201,991 Land sales and other revenue 375,577 (350,744) 24,833 Investment income 33,254 2,153 35,407
Total Revenues 2,100,123 (401,150) 1,698,973
ExpensesProtection and community services 634,537 (71,701) 562,836 Utility operations 643,338 (153,486) 489,852 Public works 424,767 (94,793) 329,974 Property and development 179,744 (26,957) 152,787 Finance and administration 163,756 (67,386) 96,370 Civic corporations - 75,041 75,041 General government 77,619 (56,319) 21,300
Total Expenses 2,123,761 (395,601) 1,728,160
(23,638) (5,549) (29,187)
OtherGovernment transfers related to capital
Province of Manitoba - 75,597 75,597 Federal gas tax 65,986 - 65,986 Other capital funding - 7,750 7,750 Total government transfers related to capital 65,986 83,347 149,333
Developer contributions-in-kind related to capital - 76,219 76,219 Other capital contributions - 5,600 5,600
65,986 165,166 231,152
42,348$ 159,617$ 201,965$
* The Preliminary Budget consists of the following components:
Revenue Expenses
Excess/(Deficiency) Revenues Over
Expenses - Tax supported 1,144,451 1,144,451 - - Utilities 661,034 618,218 42,816 - Special Operating Agencies 81,430 85,366 (3,936) - Reserves 279,193 275,725 3,468
Total 2,166,108 2,123,760 42,348
(Deficiency) Revenues Over Expenses Before Other
Excess/(Deficiency) Revenues Over Expenses
2020 Consolidated Budget Reconciliation
Appendix 8
3-44 Preliminary 2020 Budget - Appendices

Revenues1. Eliminate inter-fund transfers (382,463)
2. Eliminate fleet charges paid by City entities (49,683)
3. Eliminate grants to Civic Corporations (19,277)
4. Eliminate property taxes paid by City entities (16,385)
5. Eliminate water revenue paid by City entities (3,095)
6. Eliminate general government charges (3,778)
7. Include capital related revenue not included in the Other category 1,500 8. Include revenue for Civic Corporations 67,504
9. Other 4,526
(401,150)
Expenses1. Eliminate inter-fund transfers (699,191) 2. Eliminate fleet charges paid by City entities (47,697)
3. Eliminate grants paid to Civic Corporations (27,058)
4. Eliminate property taxes paid by City entities (16,385)
5. Eliminate water expense paid by City entities (3,095)
6. Eliminate general government charges (3,778)
7. Include capital expenses 315,964
8. Include expenses for Civic Corporations 60,277
9. Increase in liability for environmental issues, vacation and workers' compensation 10,394
10. Include amortization for Civic Corporations 14,164
11. Other 804
(395,601)
OtherInclude estimates for revenue related to capital funding from government and developers 165,166
Explanation of Consolidating Entries from Preliminary Budget (in thousands of dollars)
Appendix 8
Preliminary 2020 Budget - Appendices 3-45

(For the year ended December 31 in thousands of dollars) 2020 2019 Change
Excess Revenues Over Expenses 201,965$ 334,248$ (132,283)$ Amortization of tangible capital assets 280,468 269,075 11,393 Proceeds on disposal of tangible capital assets 2,433 4,324 (1,891) Loss on sale of tangible capital assets 858 1,098 (240)
440 946 (506) Tangible capital assets received as contributions (76,219) (71,050) (5,169) Acquisition of tangible capital assets (521,945) (908,363) 386,418
Decrease in Net Financial Assets (112,000) (369,722) 257,722
Net Financial Liabilities, Beginning of Year (1,048,637) (678,915) (369,722)
Net Financial Liabilities, End of Year (1,160,637)$ (1,048,637)$ (112,000)$
Consolidated BudgetStatement of Change in Net Financial Liabilities
Change in inventories, prepaid expenses and deferred charges
Appendix 8
3-46 Preliminary 2020 Budget - Appendices

Ap
pen
dix 9
Preliminary 2020 Budget - Appendices
3-47

Summary of Capital Program ........................................................................................................................................................................ 3-49
Summary of Financing Sources .................................................................................................................................................................... 3-50
Tax Supported, Transit, and Municipal Accommodations
Public Works ......................................................................................................................................................................................... 3-54
Community Services ............................................................................................................................................................................. 3-59
Winnipeg Police Service ....................................................................................................................................................................... 3-62
Fire Paramedic Service ......................................................................................................................................................................... 3-63
Planning, Property and Development ................................................................................................................................................... 3-64
Municipal Accommodations .................................................................................................................................................................. 3-65
City Clerks ............................................................................................................................................................................................. 3-66
Innovation, Transformation and Technology ......................................................................................................................................... 3-67
Customer Service and Communications ............................................................................................................................................... 3-68
Assessment and Taxation ..................................................................................................................................................................... 3-68
Transit ................................................................................................................................................................................................... 3-69
Self-Supporting Utilities
Waterworks System .............................................................................................................................................................................. 3-71
Sewage Disposal System ..................................................................................................................................................................... 3-72
Solid Waste Disposal System ............................................................................................................................................................... 3-73
Land Drainage Utility ............................................................................................................................................................................. 3-74
Special Operating Agencies
Winnipeg Fleet Management Agency ................................................................................................................................................... 3-75
Winnipeg Parking Authority ................................................................................................................................................................... 3-75
Table of Contents 3-48Prelim
imary 2020 Budget - Appendices

CAPITAL PROJECTS SUMMARY(in Thousands of $)
Ap
pen
dix 9
Preliminary 2020 Budget - Appendices
3-49

CAPITAL PROJECTS SUMMARY(in Thousands of $)
Ap
pen
dix 9
3-50Prelim
inary 2020 Budget - Appendices

CAPITAL PROJECTS SUMMARY(in Thousands of $)
Ap
pen
dix 9
Preliminary 2020 Budget - Appendices
3-51

CAPITAL PROJECTS SUMMARY(in Thousands of $)
Ap
pen
dix 9
3-52Prelim
inary 2020 Budget - Appendices
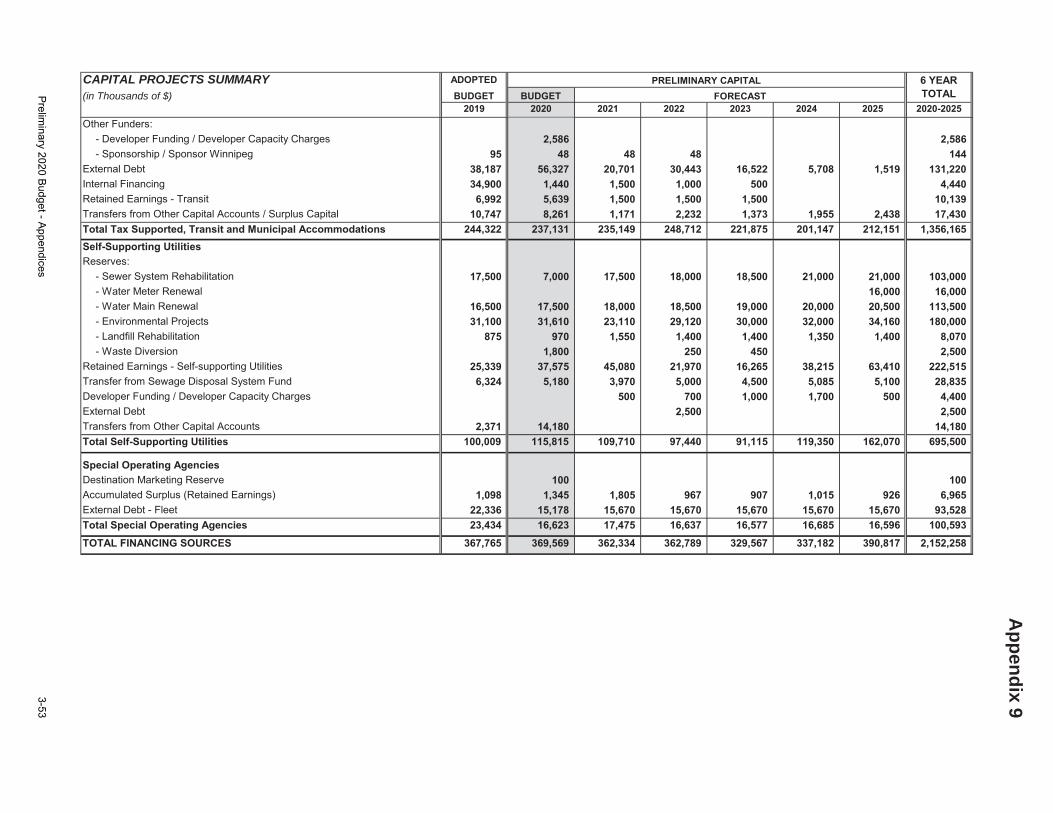
CAPITAL PROJECTS SUMMARY(in Thousands of $)
Ap
pen
dix 9
Preliminary 2020 Budget - Appendices
3-53

CAPITAL PROJECTS SUMMARY(in Thousands of $)
Active Transportation Facilities
Street Improvements
Ap
pen
dix 9
3-54Prelim
inary 2020 Budget - Appendices

CAPITAL PROJECTS SUMMARY(in Thousands of $)
Ap
pen
dix 9
Preliminary 2020 Budget - Appendices
3-55

CAPITAL PROJECTS SUMMARY(in Thousands of $)
Waterway Crossings and Grade Separations
Ap
pen
dix 9
3-56Prelim
inary 2020 Budget - Appendices

CAPITAL PROJECTS SUMMARY(in Thousands of $)
New Transportation Facilities
Other Streets Projects
Ap
pen
dix 9
Preliminary 2020 Budget - Appendices
3-57

CAPITAL PROJECTS SUMMARY(in Thousands of $)
Parks and Open Space
Ap
pen
dix 9
3-58Prelim
inary 2020 Budget - Appendices

CAPITAL PROJECTS SUMMARY(in Thousands of $)
Ap
pen
dix 9
Preliminary 2020 Budget - Appendices
3-59

CAPITAL PROJECTS SUMMARY(in Thousands of $)
Ap
pen
dix 9
3-60Prelim
inary 2020 Budget - Appendices

CAPITAL PROJECTS SUMMARY(in Thousands of $)
Ap
pen
dix 9
Preliminary 2020 Budget - Appendices
3-61
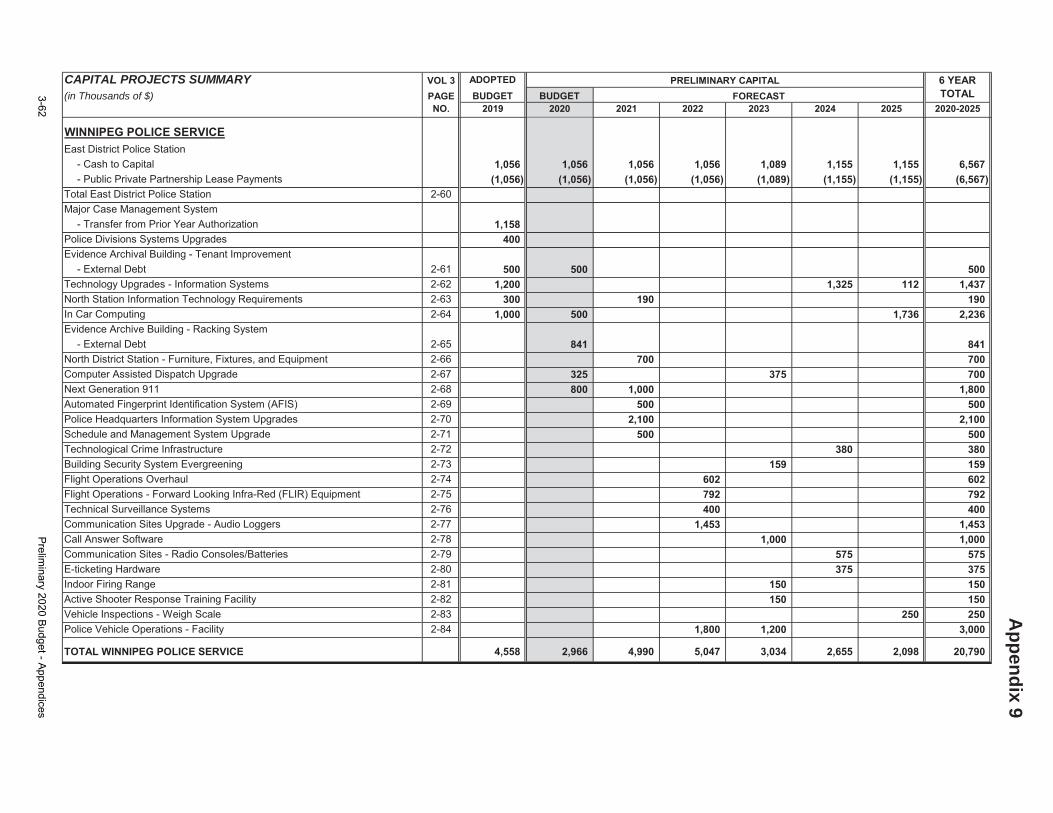
CAPITAL PROJECTS SUMMARY(in Thousands of $)
Ap
pen
dix 9
3-62Prelim
inary 2020 Budget - Appendices

CAPITAL PROJECTS SUMMARY(in Thousands of $)
Ap
pen
dix 9
Preliminary 2020 Budget - Appendices
3-63

CAPITAL PROJECTS SUMMARY(in Thousands of $)
Ap
pen
dix 9
3-64Prelim
inary 2020 Budget - Appendices

CAPITAL PROJECTS SUMMARY(in Thousands of $)
Ap
pen
dix 9
Preliminary 2020 Budget - Appendices
3-65

CAPITAL PROJECTS SUMMARY(in Thousands of $)
Ap
pen
dix 9
3-66Prelim
inary 2020 Budget - Appendices

CAPITAL PROJECTS SUMMARY(in Thousands of $)
Ap
pen
dix 9
Preliminary 2020 Budget - Appendices
3-67

CAPITAL PROJECTS SUMMARY(in Thousands of $)
Ap
pen
dix 9
3-68Prelim
inary 2020 Budget - Appendices

CAPITAL PROJECTS SUMMARY(in Thousands of $)
Ap
pen
dix 9
Preliminary 2020 Budget - Appendices
3-69

CAPITAL PROJECTS SUMMARY(in Thousands of $)
Ap
pen
dix 9
3-70Prelim
inary 2020 Budget - Appendices

CAPITAL PROJECTS SUMMARY(in Thousands of $)
Waterworks System - Supply and Treatment
Ap
pen
dix 9
Preliminary 2020 Budget - Appendices
3-71

CAPITAL PROJECTS SUMMARY(in Thousands of $)
Waterworks System - Distribution
Sewage Disposal System - Treatment
Ap
pen
dix 9
3-72Prelim
inary 2020 Budget - Appendices

CAPITAL PROJECTS SUMMARY(in Thousands of $)
Sewage Disposal System - Collection
Solid Waste Disposal System - Landfill
Ap
pen
dix 9
Preliminary 2020 Budget - Appendices
3-73

CAPITAL PROJECTS SUMMARY(in Thousands of $)
Solid Waste Disposal System - Collection
Land Drainage and Flood Control
Ap
pen
dix 9
3-74Prelim
inary 2020 Budget - Appendices

CAPITAL PROJECTS SUMMARY(in Thousands of $)
SPECIAL OPERATING AGENCIES
Ap
pen
dix 9
Preliminary 2020 Budget - Appendices
3-75

3-76 Preliminary 2020 Budget - Appendices

Appendix 10
Service Sub-Service Service Sub-Service
Roadway Constr. and Maintenance Bridge Constr. & Maint. Police Response Police ResponseRegional Streets Constr. & Maint. Contract PolicingLocal Streets Constr. & Maint. Crime InvestigationRegional Sidewalk Constr. & Maint. Police TrainingLocal Sidewalk Constr. & Maint. Crime Prevention Community Policing
Transp. Planning and Traffic Mgmt. Transportation Plan & Design Street LightingTraffic/Right of Way Management Crime Prevention Initiatives
Roadway Snow Rmvl. and Ice Cont. Regional Streets Snow & Ice Removal Traffic Safety and Enforcement Traffic Safety and Enforcement-AutomatedLocal Streets Snow & Ice Removal Traffic Safety and Enforcement-OfficerSidewalk Snow & Ice Removal Traffic Safety and Enforcement-DivisionPark & Facility Snow & Ice Removal Fire and Rescue Response Fire Suppression and Life RescueSnow Disposal Sites Special Rescue
Public Transit Regular Transit Fire InvestigationTransit PLUS Fire Paramedic ResponseChartered & Special Events Transit Fire and Injury Prevention Fire & Injury Prevention Education
City Beautification Litter Collection Fire InspectionPublic Gardens/Landscaping Medical Response Emergency AmbulanceOrnLight/Flags, Banners/Public Art Medical TransfersGraffiti Control Community ParamedicineRegional Street Cleaning Emergency Management Emergency ManagementLocal Street Cleaning Recreation Arenas
Aquatics ServicesWater Water Supply & Treatment Recreation Services
Water Distribution Community Centres Wastewater Wastewater Collection Parks and Urban Forestry Park Grass Maintenance
Wastewater Treatment Park Amenity MaintenanceLand Drainage and Flood Control Flood Control Athletic Field Maintenance
Land Drainage Park Pathway MaintenanceWaterways Management Park Planning/Development
Solid Waste Collection and Solid Waste Collection Tree PlantingSolid Waste Disposal Solid Waste Disposal Tree Pruning & Removal (non-DED)Recycling and Waste Diversion Recycling Dutch Elm Disease Control (DED)
Waste Diversion Weed ControlNatural Areas Management
City Planning Area Dev. & Renewal Planning Playground ManagementCity-wide Long Range Planning Winter Amenity Maintenance
Neighbourhood Revitalization Housing Initiatives Boulevard MaintenanceResidential Dev. Approvals & Inspection Community Liveability Community By-law EnforcementCommercial Dev. Approvals & Insp. Vacant Building Enforcement
Heritage Conservation Heritage Conservation Bicycle RecoveryProperty Asset Management Municipal Accommodations Community Crisis Response
Land and Property Community GrantsPool Facilities Community DevelopmentArena Facilities Libraries Library CirculationRecreation Centres Library InformationCommunity Centre Facilities Children's Library
Cemeteries Cemeteries Arts, Entertainment and Culture Arts, Entertainment & Culture GrantsArts, Entertainment & Culture Events
Innovation MuseumsInformation Technology Assiniboine Park ConservancyEnterprise Architecture Insect Control Insect ControlEnterprise Transformation
Economic Development Economic Development Organizational Support Services Chief Administrative OfficesAnimal Services SOA Animal Control & Care CommunicationsWinnipeg Fleet Management SOA Fleet Management Financial ManagementGolf Services SOA Golf Courses Human Resource ManagementWinnipeg Parking Authority SOA Parking Facilities Infrastructure Planning
On Street Parking Enforcement Indigenous RelationsOn-Street Parking Legal ServicesVehicles for Hire Assessment, Taxation & Corporate Assessment & TaxationMBEA non-parking Corporate
Contact Centre - 311 Contact Centre - 311Council Services Auditing
Mayor and CouncilArchives-City ClerksElections-City ClerksCitizen Access and AppealsCouncil Support-City ClerksExecutive Support
Innovation, Transformation and Technology
Executive Policy
Innovation and Economic Development
Service Based Budget – Services By Policy Area
Infrastructure Renewal and Public Works Protection, Community Services & Parks / Winnipeg Police Board
Water and Waste, Riverbank Management and the Environment
Property and Development, Heritage and Downtown Development
Development Approvals, Building Permits and Inspections
Preliminary 2020 Budget - Appendices 3-77

3-78 Preliminary 2020 Budget - Appendices

Appendix 11
Glossary
Accommodation Tax - A 5% levy on the purchase price of short term continuous accommodation of 30 days or less consumed and paid for after May 31, 2008. Amounts are collected in the Destination Marketing Reserve. Active Transportation (AT) - refers to any human-powered mode of transportation, which mainly includes walking, cycling and rolling. The first major stride towards implementing active transportation policy in the City of Winnipeg was the Council approval of the Active Transportation Study in 2006. The approved study served as a resource in formulating future active transportation policies and programs for the City of Winnipeg. Along with the approval of the study was a directive to develop an Implementation Plan based on the guiding principles of the Active Transportation Study. The Implementation Plan was prepared by the Department of Public Works and adopted by Council in April 2007. Since 2007, the City has been expanding the AT network. Administrative Buildings - Facilities or assets that do not contain or provide services to the public (i.e. facilities which are solely accessed by city staff and/or suppliers) Assessed Value - Value determined by estimating the market value of a property for a specific reference year. Taxes are levied on the basis of the assessed value of a property. Assessment Roll - A document that records assessments that are made in respect to properties described in the document and includes a real property assessment roll, a personal property assessment roll, and a business assessment roll. Asset Management - is an integrated business approach with the aim to minimize the lifecycle costs of owning, operating, and maintaining assets, at an acceptable level of risk, while continuously delivering established levels of service to the residents of Winnipeg. It includes the planning, design, construction, operation, and maintenance of infrastructure used to provide City services. By implementing asset management processes, infrastructure needs can be prioritized, while ensuring timely investments to minimize repair and rehabilitation costs, in order to maintain City assets. Balanced Budget - The City of Winnipeg Charter enacted by the Manitoba Legislature defines an operating budget to be balanced when the estimated expenditures for a fiscal year do not exceed the estimated revenues for the year. Basis of Accounting - The City of Winnipeg uses the full accrual basis of accounting. Revenue is recorded as it is earned and measurable. Expenses are recognized as they are incurred and measurable based upon receipt of goods or services and/or the creation of a legal obligation to pay. The City’s financial statements are developed in accordance with generally accepted accounting principles for local governments, as recommended by Public Sector Accounting Board (PSAB). Basis of Budgeting - The City of Winnipeg develops its operating budget for tax supported and utility operations on a modified accrual basis (see Modified Accrual Basis). Difference between the basis of budgeting and accounting include, for example, retirement allowances, vacation, workers compensation, compensated absences, contaminated sites, landfill liability and other accrued employee benefits which are budgeted on a cash basis.
Preliminary 2020 Budget - Appendices 3-79

Appendix 11
Glossary
Benchmark - A standard or reference point against which something is measured. The term is used in two different ways: in conjunction with setting long-term goals or targets for a broad range of societal and economic policies; and as a measure of effectiveness in comparing key aspects of an organization’s performance with that of similar organizations. Budget Cycle - A four-year budget cycle beginning with operating and capital budgets adopted by Council in the first full year following a general election of members of Council as provided for in this Policy. Budget Process - Executive Policy Committee (EPC) of City Council is responsible for budget development. The budget is presented to City Council for consideration and adoption. Each year, both an operating and a capital budget are approved by City Council. Both budgets contain multi-year views. The capital budget includes six years of budget information, including the current-year adopted budget and five forecast years. The operating budget contains four years of budget information, including the current-year adopted budget and three projection years. Budget Working Group – The working group of Councillors with the functions outlined in the Multi-Year Budgeting Policy and consists of members of council appointed by the Mayor. Business Tax - This is a tax on businesses that occupy space within the City of Winnipeg. Taxes are calculated by applying the annual business tax rate as a percentage of the annual rental value (ARV) of the business premise. The annual rental value is determined by taking into account the rents paid by premises similar in size and location and includes the cost of services necessary for the comfortable use or occupancy of the premise. Business Tax Adjustments / New Additions - Are taxes added to the taxation roll after tax bill update (TBU). These supplemental taxes are billed based on the change in the ARV for a given business. The Assessment and Taxation Department is allowed to issue supplemental tax bills for the current tax year and to January 1st of the prior year. For businesses, supplemental tax bills are normally prepared when businesses close, move or newly start up. By-laws - Legislation enacted by City Council under the provisions of The City of Winnipeg Charter. Capital - Expenditures are considered capital when they have a cost of $100,000 or more and a useful life of 10 years or longer. This includes individual non-recurring capital projects or ongoing programs investing in various capital assets. Minor maintenance projects should not be included in the capital budget even though the costs may exceed the dollar limit for capital works. Major equipment replacements with very large dollar values such as computer upgrades should be included in the capital budget even though their useful life may be less than 10 years. Capital Budget - The annual plan of the capital projects to be undertaken by the City, together with the method of financing for each. In accordance with the City of Winnipeg Charter, a capital budget must be prepared and approved for the current year and the subsequent five
3-80 Preliminary 2020 Budget - Appendices

Appendix 11
Glossary
years (forecast years). The capital budget is adopted on a project authorization basis, although cash flow estimates are provided for all projects. (See also Five-Year Capital Forecast) Capital Projects / Capital Works - Capital improvements and other works are generally considered to be projects of a fixed nature and long life which provide new, additional or replacement of public facilities such as streets, water mains, sewers, public buildings, parks, playgrounds, recreational centres, land, etc. Major replacements such as asphalt resurfacing of streets, water main renewals, and waste water sewer renewals could also be considered as capital works. Land acquisition and local improvements are considered to be capital works regardless of expected cost. Capital expenditures are typically acquisition, development or major renovations to assets where the benefit of the expenditure extends into the future. Cash to Capital - is the cash value that the City invests into its Capital projects. Chief Financial Officer - is the Council-appointed statutory officer mandated by the City of Winnipeg Charter. City (The) - Refers to the City of Winnipeg.
City of Winnipeg Charter (The) - Provincial legislation setting out the powers and responsibilities of the City of Winnipeg. Class Estimates - The cost estimate classification system was developed in 2015 based on the AACE International Recommended Practices and is included in an appendix in the annual capital budget book. The established benchmark is that a project should have a Class 3 estimate for budget authorization. Projects that are not at a Class 3 should indicate in the detail sheet that a Class 3 estimate or better will be achieved prior to the start of construction. For programs, those projects identified in the year of budget approval should also be at a Class 3 and the narrative should indicate that. The Class 3 estimate should set the authorization budget. Commitment Reserve - On March 12, 1998, City Council approved the establishment of the Commitment Reserve Fund. The purpose of the fund is to allow departments to carry forward committed budget dollars to the succeeding year thereby eliminating the need to re-budget. Contributions to the Reserve must be spent in the year following the transfer. However, contributions can be retained in the Reserve beyond the following year only if approved by the Fund Manager; otherwise the unspent amount must be transferred to the Financial Stabilization Reserve Fund. The Chief Financial Officer is the Fund Manager. Community Trends and Performance Report - The City of Winnipeg regularly produces community and demographic information as well as performance measurement information, which has been included as part of the budget since 2010. The ‘Community Trends and Performance Report’ combines this information and publishes it as budget ‘Volume 1’. This budget Volume 1 is produced early in the budget process to provide context and timely information for the City of Winnipeg Council and the public in support of the upcoming budget decision-making process.
Preliminary 2020 Budget - Appendices 3-81

Appendix 11
Glossary
The volume includes an outline of the City of Winnipeg organization, governance and administrative structure; Community Trends related to socio-economic information such as population, demographics, housing, etc.; an overview of the City of Winnipeg’s budget process and strategic framework, with highlights from OurWinnipeg and the City’s Financial Management Plan; and Performance Measures for City of Winnipeg services grouped by Standing Policy Committee, and organization-wide information. The information is intended to provide relevant current context, and facilitate discussion for the upcoming budget process. Computer, Critical Systems and Support Reserve - On March 22, 1995, City Council approved the establishment of the Computer Replacement Reserve Fund. Subject to Council approval of the 2019 Budget, the Reserve will be renamed to Computer, Critical Systems, and Support Reserve. The purpose of the Reserve is to provide financing for the replacement, refurbishing, modifying, or upgrading of personal computer hardware and/or software and to stabilize expenditures, therefore smoothing the effect on the annual budget. Through direct contributions, users contribute an amount to the Reserve for computer equipment based upon the latest actual purchase cost for that type of unit. Other contributions to the Reserve would include investment income. The Chief Innovation Officer is the Fund Manager. Consolidated Budget – includes the City of Winnipeg’s operating budgets for tax supported, utility, special operating agency and reserve operations as well as a capital budget and governmental functions or entities, which have been determined to comprise a part of the aggregate City operations. The consolidated budget considers inter-fund transaction eliminations, tangible capital asset based revenues and amortization, controlled entity operations and the accrual of unfunded expenses. Consolidated Entities - The organizations included in the consolidated financial statements are as follows: • Assiniboine Park Conservancy Inc. • CentreVenture Development Corporation • The Convention Centre Corporation • Winnipeg Arts Council Inc. • Winnipeg Public Library Board Consumer Price Index (CPI) - A statistical description of annual price levels provided by Statistics Canada (Government of Canada). The index is used as a measure of the increase in the cost of living (i.e. economic inflation). Contribution in Lieu of Land Dedication Reserve - On January 10, 1973, City Council adopted the policy that cash payments received by the City in lieu of land dedication for open space be deposited in a fund to the credit of each community. On January 17, 1979, City Council amended that policy to permit proceeds from the sale of surplus parks and recreation lands to be deposited to the Contributions in Lieu of Land Dedication Reserve Fund account of the respective community. On September 19, 1990, City Council adopted the recommendation that revenue would be apportioned amongst the communities on the basis of 75% to the
3-82 Preliminary 2020 Budget - Appendices
Appendix 11
Glossary
account of the community in which the revenue was collected and 25% to be divided equally amongst all communities. This change was phased in over three years commencing in 1991. Expenses are limited to the acquisition or improvement of land for parks, recreation facilities, or open space. The Director of Planning, Property and Development is the Fund Manager. Debt Charges - The annual amount of principal and interest which must be paid each year through the operating budget. There are two forms of debenture structure. The Sinking Fund Debenture issue requires annual payments to be made to the Sinking Fund. These funds are then invested by the Sinking Fund for the retirement of the debenture issue on its maturity date. A serial issue requires annual payments of principal and interest in order that the debt is paid off in regular installments throughout the life of the issue. Department - The basic organizational unit of the City which is functionally unique in its delivery of services. In general, Departments are managed by a Director. Destination Marketing Reserve - On October 22, 2008, City Council approved the creation of the Destination Marketing Reserve Fund with an effective date of January 1, 2009. The purpose of the Reserve is to support Economic Development Winnipeg Inc., The Convention Centre Corporation and special events including other organizations, projects and events that will encourage tourists to visit Winnipeg. The source of revenue for the Reserve is a 5% accommodation tax, which was adopted by City Council on April 23, 2008. The Chief Financial Officer is the Fund Manager. Director - The head of a City department. Dividend - A dividend is an interfund transfer from a City Utility or a Special Operating Agency (SOA) to the City tax-supported fund (Fund 001) based on Council approved policy or available uncommitted funds or operational surplus. Economic Development Investment Reserve - The Economic Development Investment Reserve Fund was created by City Council on June 21, 2000. It is intended to fund City economic development incentives and investment projects. This Reserve invests directly in particular projects rather than being a funding mechanism for programs. The incremental portion of realty and business taxes generated by projects in which the fund has invested will be returned to the Reserve until the original investment has been repaid. The Director of Planning, Property and Development is the Fund Manager. Effectiveness Measure - a performance measure intended to evaluate service delivery relative to service standards or the customer's needs and expectations. Efficiency Measure - a performance measure comparing the resources used to the number of units of service provided or delivered (typically cost for a service or unit of service).
Preliminary 2020 Budget - Appendices 3-83

Appendix 11
Glossary
Electricity Tax - The electricity tax is legislated by Section 441 of the City of Winnipeg Charter. The rate charged is 2.5% for domestic consumption and 5% for commercial consumption, beyond the electricity used for space heating purposes, which is conclusively deemed to be 80% of the total consumption. If a “primarily electric heat” dwelling unit, 20% is taxable, 80% is exempt. If a dwelling unit is “primarily gas heat”, then there is no exempt portion on the electrical side. The tax is calculated and levied by Manitoba Hydro and is remitted to the City of Winnipeg on a monthly basis. Entertainment Funding Tax - The tax is 10% on cinema ticket prices of $5.00 or more. Entertainment Funding Tax Refundable - Goldeyes - The Winnipeg Goldeyes has a long term arrangement expiring July 2023 with respect to entertainment tax approved by Council. The full amount of entertainment tax remitted during the year is refunded back at the end of the season - conditional upon all aspects of an amateur access/community use agreement with the City being honored. Entertainment Funding Tax Refundable - True North - True North Inc. has a long term arrangement expiring in 2029 with respect to entertainment tax approved by Council. The full amount of entertainment tax remitted during the year is refunded back at the end of the season. Entertainment Funding Tax Refundable - Winnipeg Football Club (WFC) - In a long term agreement approved by Council, the entertainment tax revenue from the Winnipeg Football Club’s one pre-season game and nine regular season games will be refunded back to the Winnipeg Football Club in order to pay off its debt with BBB Stadium Inc. Entertainment tax revenue for any playoff games or other events held at the stadium will be refunded back to the WFC. Environmental Projects Reserve - On December 17, 1993, City Council authorized the establishment of a River Quality Environmental Studies Reserve Fund for the purpose of providing funding for environmental projects to improve river quality. On January 24, 1996, City Council changed the name of this Reserve to the Environmental Projects Reserve Fund to more accurately reflect the nature of the projects reported in this Reserve. The Reserve is financed through a monthly transfer from the Sewage Disposal System Fund based on the amount of water consumption billed. The Reserve has funded ammonia, nitrification and combined sewer overflow ("CSO") studies. It now funds a portion of the wastewater collection and treatment system improvements as directed by the Province of Manitoba ("the Province"). This includes effluent disinfection, centrate treatment, biological nutrient removal, CSO mitigation infrastructure and biosolids. River quality is under the jurisdiction of the Province and in 2003 the Clean Environment Commission ("CEC"), at the request of the Minister of Conservation, conducted public hearings to review and receive comments on the City's 50-year wastewater collection and treatment improvement program. At the conclusion, the CEC recommended that the City implement these improvements over a 25-year period, which was subsequently ordered by the Minister of Conservation on September 26, 2003.
3-84 Preliminary 2020 Budget - Appendices

Appendix 11
Glossary
On September 3, 2004, the Province issued Environment Act License No. 2669 for the West End Water. Pollution Control Centre, which provided for the plan as directed by the Minister of Conservation. Certain provisions of this license were appealed by the City. Revised License No. 2669 E R R and No. 2684 R R R, for the North End Water Pollution Control Center, were issued on June 19, 2009, incorporating the City's requested changes. On March 3, 2006, a similar license (No. 2716) was issued for the South End Water Pollution Control Centre. Effective April 18, 2012, the South End Water Pollution Control Centre license (No. 2716RR) was revised in response to the Save Lake Winnipeg Act requirement. This Reserve partially funds capital projects to bring the City in compliance with the license requirements. The Director of Water and Waste is the Fund Manager. External Debt - Obligation resulting from the borrowing of money from sources other than City funds, primarily by the sale of debentures in public capital markets. Federal Gas Tax Revenue Reserve - City Council, on January 25, 2006, authorized the establishment of the Federal Gas Tax Revenue Reserve Fund. The purpose of the Reserve is to account for funds received from the Province under the Federal Gas Tax Funding Agreement. On November 18, 2005, the Government of Canada and the Province entered into an agreement on the Transfer of Federal Gas Tax Revenue under the New Deal for Cities and Communities. Under this deal, the Province agreed to administer the funds on behalf of the Federal Government and to conditionally provide the funds to the City, subject to receipt of funding from the Federal Government. The funds are intended specifically for eligible projects such as: Public Transit; Water; Wastewater; Solid Waste; Community Energy Systems; and Active Transportation Infrastructure. On March 24, 2006, the Province and the City signed the Gas Tax Funding Agreement. The agreement was effective as of April 1, 2005 and continues until March 31, 2015 or unless terminated earlier in accordance with section 10 of the agreement. On January 12, 2007, City Council authorized that Infrastructure Levies (Gas Tax) be allocated to the Public Works Department for road and bridge projects through the 2007 capital budget process. On July 16, 2014 City Council authorized that the purpose of the Federal Gas Tax Revenue Reserve be amended to include 18 project categories as listed in Schedule 1 of the most recent Manitoba-City of Winnipeg Municipal Gas Tax Agreement to administer the Canada-Manitoba Administrative Agreement on the Transfer of Federal Gas Tax Revenue. The list of eligible project categories includes local roads and bridges, broadband connectivity, public transit, drinking water, wastewater, solid waste, brownfield redevelopment, sport infrastructure, recreational infrastructure and cultural infrastructure. The Director of Public Works is the Fund Manager. Fees and Charges Schedule - published annually in accordance with the Fees and Charges By-Law (196/2008) to identify the current fees and charges administered by the City of
Preliminary 2020 Budget - Appendices 3-85

Appendix 11
Glossary
Winnipeg and the authority under which they are administered. http://www.winnipeg.ca/finance/documents_page.stm Financial Management Plan (FMP) - The City’s official public strategy for guiding the financial decision-making process. This document, adopted by Council on March 23, 2011, outlines the City’s top financial goals to strengthen and maintain its financial position. http://www.winnipeg.ca/finance/files/fmp.pdf Financial Stabilization Reserve - The purpose of the Financial Stabilization Reserve Fund is to counteract the budgetary effect of fluctuations from year to year in property and business taxes and/or to fund deficits in the General Revenue Fund, which assist in the stabilization of the City's mill rate and/or property tax requirements. Various structural changes have occurred over the years in this reserve. On September 28, 2011, City Council adopted the combining of the Fiscal Stabilization Reserve and the Mill Rate Stabilization Reserve Funds into the Financial Stabilization Reserve Fund. All previous regulations for the two Stabilization Reserves were replaced with the following: - Sources of funding for the Reserve are: the excess of actual total taxes billed compared to budget; surpluses in the General Revenue Fund; unspent amounts in the Commitment Reserve Fund; and interest revenue. - The Reserve can be used to fund any shortfall of actual total taxes billed compared to budget; major unforeseen expenditures once the target level is exceeded and subject to rules noted below; General Revenue Fund year-end deficits and subject to rules noted below; and one-time expenditures once the target level has been reached. - No transfers can be made to the General Revenue Fund to fund ongoing current operations. - Funds above the 8% target may be used for major unforeseen expenditures and General Revenue Fund deficits. Accessing funding in any given year requires City Council approval if the required amount would reduce the Reserve's balance below the 8% target. - A replenishment plan shall be adopted by City Council if the Financial Stabilization Reserve Fund's equity is reduced below the 8% target of tax-supported expenditures. On March 23, 2015, City Council adopted the 2015 Operating Budget which included a change in the target balance for the Financial Stabilization Reserve from 8% to a minimum of 6% of tax-supported expenditures. The Chief Financial Officer is the Fund Manager. Fiscal Year - The fiscal year of the City is the 12 months ending on December 31 each year. Five-Year Capital Forecast - The long-term plan for capital expenditures to be incurred for the five years following the budget year. Section 284(2) of “The City of Winnipeg Charter” requires Council, in addition to the capital budget for the budget year, to include a capital program for five years. Only the current year’s budget is adopted, and the five year capital forecast is approved as a forecast. Frontage Levy - A charge to property owners through the property tax bill. Calculation of the frontage levy is based on the length of the boundaries (frontage) of the property that fronts or
3-86 Preliminary 2020 Budget - Appendices

Appendix 11
Glossary
abuts any portion of a sewer main or water main. As set out in the City of Winnipeg Charter, these funds can be used for the upgrading, repair, replacement and maintenance of water and sewer mains, streets and sidewalks; installation, upgrading, repair, replacement and maintenance of lighting in streets and back lanes. Fund Balance - Measures the net financial resources available to finance expenditures of future periods and is the difference between governmental fund assets and liabilities, also referred to as fund equity. Full-Time Equivalent (FTE) - The total number of hours worked converted to the equivalent of full-time staff persons working a whole year. General Capital Fund - The accounting fund created to account for tax-supported capital transactions of The City of Winnipeg. General Purpose Reserve - On March 15, 2000, City Council approved the establishment of the Pension Surplus Reserve Fund. The Reserve was funded by the retroactive refund of pension contributions for 1998 and 1999. City Council also approved that the purpose of the Reserve and further details including the use of these funds be subsequently determined by City Council. On May 23, 2001, City Council approved the amalgamation of the Pension Stabilization Reserve and Pension Surplus Reserve Funds and the new Fund be renamed the General Purpose Reserve Fund. On June 25, 2014, City Council approved an amendment to the Councillors' Ward Allowance (CWA) Policy year end section 3.10, to include the following: “Unexpended funds from Councillor Ward Allowances may be carried over to the following year, at the discretion of the Ward Councillor, up to a maximum of 10% of the total ward allocation, and on October 28, 2015 added that the CWA carry over funds be established as a permitted use in the General Purpose Reserve.” The Chief Financial Officer is the Fund Manager.
General Revenue Fund – The accounting fund created to account for tax-supported operations, which include but are not limited to services provided by the City such as police, fire, ambulance, library and street maintenance. Golf Course Reserve - The Golf Course Reserve Fund was created by City Council on April 28, 1994, to provide funding for enhancements to the Municipal Golf Courses in order to keep them competitive with those in the private sector. The Director or Planning, Property and Development is the Fund Manager. Government Grants - Payments from other levels of government for specific programming or payments made unconditionally for City purposes.
Preliminary 2020 Budget - Appendices 3-87
Appendix 11
Glossary
Grant - means money, goods, or in-kind contributions provided to a recipient without consideration in return, other than recognition for the grant. A listing of operating, capital and reserve grants/payments is included in the annual operating budget in Appendix 2. Grant (Annual) - Annual grants are payments to organizations which provide demonstrable cultural, social or economic benefit to the community and where the City does not receive any goods or services directly in return for the funds (with the exception of community partnerships) nor do they expect repayment or any other financial return. Eligibility and entitlement requirements are reviewed annually. Grant (Multi-year grant agreements) - are payments to entities where the City of Winnipeg has long-term contractual arrangements in place or the nature of the arrangement is long-term. Grant (Other programs) - are primarily grant programs where recipients are determined throughout the course of the year. With the exception of the per capita grants, the Director of the department responsible for each such grant program is delegated the authority to determine grant recipients. Grant (In-kind contributions) - goods or services provided to a recipient for free or at a reduced rate. Heritage / Economic Development Property Tax Credit - The Program’s objective is to facilitate the conservation and continued use/viability of heritage buildings in Winnipeg by incenting the restoration or rehabilitation of existing buildings as well as projects that have economic benefit to the City. Heritage Investment Reserve - The Heritage Investment Reserve Fund was created by City Council on June 21, 2000. It funds all City and City-sponsored heritage programs and acts as a revolving fund so that future funding of heritage programs can be sustained and thereby reduces the need to obtain additional funding. An important source of ongoing funding for the Reserve will be incremental tax revenues from projects financed by the Fund. The Director of Planning, Property and Development is the Fund Manager. Housing Rehabilitation Investment Reserve - The Housing Rehabilitation Investment Reserve Fund was created by City Council on June 21, 2000. It funds City housing programs not provided for in operating budgets. It was intended that this Reserve act as a revolving fund so that incremental tax revenues resulting from housing programs in which the Reserve invested would be returned to the Reserve to finance future projects. The Reserve continues to support housing programs in Housing Improvement Zones as well as the Indigenous Housing Program and is funded by an annual transfer from the General Revenue Fund. Since 2012, the City has acted as the ‘Community Entity’ for the delivery of the federal government’s Homelessness Partnering Strategy (“HPS”), the related revenues and expenditures being recorded in the Reserve. Funding received covers the cost of grants provided under two HPS program streams ("Designated Community” and “Indigenous Homelessness”) as well as administrative expenditures.
3-88 Preliminary 2020 Budget - Appendices

Appendix 11
Glossary
The Director of Planning, Property and Development is the Fund Manager. Impact Fee - A fee imposed on new development to assist with the costs associated with accommodating and managing growth and development. On October 26, 2016, Council passed the Impact Fee By-Law (127/2016) which phases in the implementation of an Impact Fee over a three-year period. The Impact Fee, which was established by Council on October 26, 2016 and which took effect on May 1, 2017, shall be increased or decreased by an amount equal to the rate of construction inflation or rate of construction deflation for the previous year, to a maximum of 5% per year. Impact Fee Reserve - On October 26, 2016, Council approved the establishment of the Impact Fee Reserve to fund growth-related capital projects approved by the Chief Financial Officer with consideration to the input provided by the Impact Fee Working Group, as well as to pay the costs of administering the Impact Fee By-law and Reserve Fund. All funds generated by the impact fee are to be deposited into the Reserve. Use of the Impact Fee Reserve for purposes other than those set out in Council's October 26, 2016 resolution require a 2/3 vote of Council. The Chief Financial Officer is the Fund Manager. In-Kind Contributions - see Grant (In-kind contributions). Insect Control Reserve - On March 23, 2005, City Council approved the establishment of the Insect Control Reserve Fund. The purpose of the fund is to absorb unexpected costs for mosquito control in years where the City of Winnipeg experiences above average response levels. The Reserve balance should never exceed $3.0 million and the Chief Administrative Officer has the authority to over-expend to a maximum of $3.0 million in the event of insufficient funds. The Director of Public Works is the Fund Manager. Insurance Reserve - In 1960, the Insurance Reserve Fund was established. The reserve was to be used for the purpose of replacing or repairing City properties and/or contents that had been damaged by fire or any other cause. In 1973, the use of the Insurance Reserve Fund also included the purpose of paying for any other losses that the City might incur in any part of its self-insurance program. Such uses would include third party liability claims, or property damage claims, including motor vehicles. The Corporate Controller is the Fund Manager. Internal Financing - An interim funding source from the available, short-term cash flow surpluses from various City sources such as the general capital fund and capital and special purpose reserves that can be used to fund capital projects. Council also approves an external borrowing authority for the internal financing amount in the capital budget to ensure that funds are available for the projects to proceed if short term cash surpluses become unavailable.
Preliminary 2020 Budget - Appendices 3-89

Appendix 11
Glossary
Key Goals - Key Goals are provided for each service in the service-based budget, and represent the desired high-level outcomes for that service area. Land Operating Reserve - City Council, on May 16, 1973, authorized the establishment of a Land Operating Reserve Fund to reduce the need for the issuance and sale of debentures in connection with the acquisition cost of properties for resale. Disbursements from this Reserve are limited to the acquisition cost of properties for resale, and any other expenses directly related to the acquisition, sale and improvement of disposable City properties. Use of the Reserve's funds for any other purpose requires the authorization of City Council. This Reserve is maintained by the proceeds from the sale of City-owned properties and interest earned. In accordance with City Council directives, 5% of the gross sales revenue is allocated to the Historical Building Program, another 5% of gross sales revenue is allocated to the Enhanced Land Marketing Program to finance those activities necessary to facilitate the sale of surplus lands and 15% is allocated to the Community Centre Renovation Grant Program annually, subject to Council approval.
City Council, on July 19, 1999, adopted a policy that in order to sustain the business operations supported by the Reserve, equity be allowed to accumulate within the Reserve sufficient to eliminate the inter-fund debt owing to the General Revenue Fund created in past years. Any surplus funds greater than the amount required for the purposes of the Land Operating Reserve Fund and meeting the annual budgeted transfer to the General Revenue Fund is to be transferred to the Commitment Reserve Fund. The Director of Planning, Property and Development is the Fund Manager. Landfill Rehabilitation Reserve - On December 17, 1993, City Council authorized the establishment of a Brady Landfill Site Rehabilitation Reserve Fund for the purpose of providing funding for the future development of the Brady Landfill Site. The Reserve is financed through a monthly transfer from the Solid Waste Disposal Fund based on tonnages processed at the landfill. Effective January 1, 2018 the Brady Landfill Site Rehabilitation Reserve was terminated and replaced with a new Landfill Rehabilitation Reserve in accordance with Section 289 of the City of Winnipeg Charter. The purpose of the new reserve is to provide funding, over time, for closure and post-closure landfill needs including leachate management, environmental monitoring and site restoration costs for all active and closed landfills maintained under the responsibility of the City. This reserve will continue to be funded through annual deposits from tipping fee revenue accounts of the Solid Waste Disposal Fund based on a portion of the tipping fee per tonne charged on garbage disposal, the current rate is $1.00 per tonne of material landfilled. The Director of Water and Waste is the Fund Manager.
3-90 Preliminary 2020 Budget - Appendices

Appendix 11
Glossary
Local Improvements - Local Improvement capital projects are those which are financed partly by a direct levy on the properties benefited (Property Owner's Share) and partly by a mill rate levy over the city-at-large (City's Share). The program is governed by Local Improvement By-Law No. 98/72 and is subject to advertising and subsequent approval by the majority of ratepayers involved. The type of expenditures generally falling within this category are: paving of local streets and lanes; sidewalk and boulevard construction; installation of new water mains and sewers; ornamental street lighting and lane lighting. Local Street Renewal Reserve - The Local Street Renewal Reserve was established in 2013 to increase investment in local streets, lanes and sidewalks. Funds from this reserve will be used annually to fund the local street component of the Regional and Local Street Renewal program and the repair, renewal and/or replacement of bridges. Subject to annual Council approval, a separate property tax increase will fund this reserve each year to ensure a dedicated funding system for local streets. Use of the Local Street Renewal Reserve for purposes other than local streets, lanes, sidewalk, and bridge renewals requires approval of 2/3 of City Council. The Director of Public Works is the Fund Manager. Major Capital Projects - are projects that reach a specific minimum dollar threshold and above. In 2020 the threshold was $24 million. This threshold increases annually by construction inflation. A listing of major capital projects is included in the annual capital budget. Mill Rate - A mill rate is a term used to decide how taxes are set. A "mill" is equivalent to a one thousandth part. For the purposes of calculating property taxes, one mill represents $1.00 of taxes for every $1,000 of portioned assessment. The portioned assessment is the part of the total assessed value of a property that is subject to taxation. Modified Accrual Basis - A hybrid of cash and accrual methods of accounting in which revenues are recognized when earned, measurable and available. Expenses are recognized when liability is incurred, except for certain expenses such as those associated with retirement allowances, vacation, workers compensation, compensated absences, contaminated sites, landfill liability and other accrued employee benefits which are budgeted on a cash basis. As well, debt servicing payments are budgeted for when due and depreciation of assets is not budgeted. Multi-Family Dwelling Tax Investment Reserve - On May 22, 2002, City Council approved the establishment of the Multiple-Family Dwelling Tax Investment Reserve Fund. The Reserve is designed to act as a bank that accumulates incremental taxes generated by approved multi-family dwelling construction/rehabilitation projects. When the incremental taxes for each project accumulates to the pre-approved amount, the balance is paid back to the applicant developer as a "Tax Incentive Grant". The Director of Planning, Property and Development is the Fund Manager.
Preliminary 2020 Budget - Appendices 3-91

Appendix 11
Glossary
Municipal Benchmarking Network Canada (MBNC) - is a national benchmarking organization comprised of partner municipalities who identify, collect, analyze and report consistent and comparable data in municipal service areas. The information reported, and the partner network, promote sharing of best practices and strategies to support continuous improvement in the delivery of municipal services. http://mbncanada.ca/ Municipal General Services Fee - The General Services Fees is revenue related to municipal services that are billed for Urban Reserves and these fees are in lieu of property taxes. Multi-year budget - The annual operating and capital budgets adopted by Council together with operating budget projections for an additional three years and capital budget forecast for an additional five years. Natural Gas Tax - The natural gas tax is legislated in Section 441 of The City of Winnipeg Charter. The rate charged is 2.5% for domestic consumption and 5% for commercial consumption, beyond the natural gas used for space heating purposes. If the dwelling unit is “primarily gas heating”, a baseload is calculated based on consumption in June, July, and August. Gas tax is then applied to the lesser of actual consumption or baseload. If the dwelling unit is “primarily electric heat” then this tax is applied to the full consumption. The tax is calculated and levied by Manitoba Hydro and is remitted to the City of Winnipeg on a monthly basis. Net Taxes Added - Are taxes added to the taxation roll after tax bill update (TBU). These supplemental taxes are billed based on the change in the assessed value for a given property. The Assessment and Taxation Department is allowed to issue supplemental tax bills for the current tax year and to January 1st of the prior year. Not for Profit Organization - a club, society or association that is organized and operated exclusively for social welfare, civic improvement, pleasure or recreation or for any other purpose except profit. Operating Expenditures - The ongoing cost to provide a product or service. This includes the cost for personnel, materials, equipment and other consumables required for a department to function and provide services. OurWinnipeg - The City’s strategic long-term planning document, adopted by Council on July 20, 2011, which establishes direction for the City and the steps that need to be taken along the way. Other documents, budgets, public capital works, programs, or developments initiated or approved by the City of Winnipeg will align with OurWinnipeg. Pay-As-You-Go - A means of financing capital projects whereby the City pays for the projects from direct contributions from the current budget, from retained earnings, or from reserves established for capital purposes, rather than issuing external debt. Payments in Lieu of Taxes - The federal and provincial governments, crown corporations, universities and City utilities do not have a legal obligation to pay property taxes; however an amount equivalent to the taxes is paid to the General Revenue Fund for City services by way of a payment in lieu of taxes.
3-92 Preliminary 2020 Budget - Appendices
Appendix 11
Glossary
Pedestrian and Cycling Program - provides recommendations for infrastructure projects, programs and studies identified in the Pedestrian and Cycling Strategies. Projects may include: new sidewalks on regional and non-regional streets, new multi-use paths, new bicycle routes, crossing control improvements, public education, awareness and promotion and partnership grants. All recommended projects support the key directions of the Pedestrian and Cycling Strategies. Performance Measurement - Performance measurement is the process of collecting, analyzing and/or reporting information regarding the performance of an organization, service, system or component. Permit Reserve - On March 20, 2007, City Council approved the establishment of the Permit Reserve Fund. The purpose of the Reserve is to mitigate revenue shortfalls and fund temporary staffing needs during busy periods through economic boom/bust cycles. The Reserve is also meant to provide a source of funds for service and system improvements. The Reserve is funded by the excess of permit revenue in the General Revenue Fund compared to budget in any given year. The balance in the Reserve is capped at $3.0 million and any surplus funds over and above the cap are to be transferred to the General Revenue Fund. On March 22, 2011, City Council approved the cap be revised to $2.0 million and any surplus funds above the cap be transferred to the General Revenue Fund, reported in the Planning, Property and Development Department. The Director of Planning, Property and Development is the Fund Manager. Perpetual Maintenance Funds - (Brookside, St. Vital and Transcona Cemeteries) The terms of By-law No. 14725 of the former City of Winnipeg, passed on April 8, 1935, created a fund for the perpetual care and maintenance of Brookside Cemetery. Later on By-law No. 1996/78, also created funds for the perpetual care and maintenance of St. Vital and Transcona Cemeteries. Section 29 of By-law No. 5720/91 amending and restating By-law 1996/78, relating to Cemeteries, sets forth the purpose and use of the Perpetual Maintenance Funds. These funds are for the purpose of creating, building up, and maintaining a perpetual maintenance fund for the care and maintenance of Brookside, St. Vital, and Transcona Cemeteries. Section 12 of By-law No. 130/2007 includes: “Each cemetery will have a separate Perpetual Maintenance Reserve Fund created with a sum equal to 25% of the purchase price of a lot, plot or cremated remains lot/plot, or a sum equal to 15% of a cremorial or niche purchase, or a sum equal to 10% of a scattering of cremated remains, set aside in the reserve, invested and applied to and for the perpetual care of the lot or plot or cremated remains lot/plot, cremorial, niche, scattering bed or ossuary area. Perpetual care includes general maintenance of lots, plots, cremated remains lots/plots, columbarium niches or the cemetery enclosure. The City may, annually, utilize up to 50% of the yearly earnings from the relevant Perpetual Maintenance Reserve to undertake improvements or maintenance on the cemetery.” The Director of Planning, Property and Development is the Funds Manager.
Preliminary 2020 Budget - Appendices 3-93

Appendix 11
Glossary
Property Tax Revenue - This is the money that the City bills the property owners in the City of Winnipeg to fund tax-supported expenditures. Property taxes are calculated by applying the municipal mill rate against the portioned assessment of your property. By definition, a mill is a one-thousandth part. For calculating taxes, one mill represents $1.00 of taxes for every $1,000.00 of portioned assessment. Provision for Cost Variability (“Provision”) - is an inter-fund transfer from the Municipal Accommodations Fund (Fund 554) to the City tax-supported fund (Fund 001). It represents a portion of market rents charged by Municipal Accommodations to its accommodation customers; that portion being the variance between market rent rates charged and the cost to provide and reinvest in the accommodations.
Public-Private Partnership (PPP or P3) - is a contract between a public sector entity and a private sector entity that outlines the provision of assets and the delivery of services. Although this can include almost any type of infrastructure or service, some of the more common P3 projects include hospitals, bridges, highways, new types of technology and new government buildings. Across Canada, P3s have become an increasingly prominent procurement vehicle for governments. Residential Recycling - Revenue received from Multi Material Stewardship Manitoba (MMSM) on a percentage of cost basis to help fund the waste diversion program for the City. Regional Street Renewal Reserve - The Regional Street Renewal Reserve was established in 2014 to increase investment in regional streets and sidewalks. Funds from this reserve will be used annually to find the regional street component of the Regional and Local Street program and the repair, renewal and/or replacement of bridges. A separate property tax increase will fund this new reserve each year to ensure a dedicated funding system for regional streets. Use of the Regional Street Renewal Reserve for purposes other than regional streets, sidewalk, and bridge renewals requires approval of 2/3 of City Council. The Director of Public Works is the Fund Manager. Regulation Fees - Fees charged to users for regulated/controlled services typically where licenses and permits are required. Fines and penalties are also included in this revenue category for summary purposes. Reserves - Represent amounts appropriated for designated requirements as established by Council. Part of best practices for fund accumulation to replace capital assets and to provide financial flexibility in times of budget shortfall. A listing of the reserve funds is noted below and a description for each one can be found in this glossary.
- Commitment Reserve - Computer, Critical Systems and Support Reserve - Contribution in Lieu of Land Dedication Reserve - Destination Marketing Reserve - Economic Development Investment Reserve - Environmental Projects Reserve - Federal Gas Tax Revenue Reserve
3-94 Preliminary 2020 Budget - Appendices

Appendix 11
Glossary
- Financial Stabilization Reserve - General Purpose Reserve - Golf Course Reserve - Heritage Investment Reserve - Housing Rehabilitation Investment Reserve - Impact Fee Reserve - Insect Control Reserve - Insurance Reserve - Land Operating Reserve - Landfill Rehabilitation Reserve - Local Street Renewal Reserve - Multi-Family Dwelling Tax Investment Reserve - Permit Reserve - Perpetual Maintenance Funds - Regional Street Renewal Reserve - Sewer System Rehabilitation Reserve - Southwest Rapid Transit Corridor Reserve - Southwest Rapid Transitway (Stage 2) and Pembina Highway Underpass Payment
Reserve - Transit Bus Replacement Reserve - Waste Diversion Reserve - Water Main Renewal Reserve - Water Meter Renewal Reserve - Workers Compensation Reserve
Retained Earnings - Equity accounts that represent the accumulated surpluses from operations that are not for general distribution, but rather are used to fund capital projects, leverage debt, or are reinvested in service delivery. Revenue - Sources of income to The City of Winnipeg recorded in the General Revenue Fund. A listing of major sources of revenue is noted below and a description for each one can be found in this glossary.
- Accommodation Tax - Business Tax - Business Tax Adjustments / New Additions - Electricity Tax - Entertainment Funding Tax - Entertainment Funding Tax Refundable – Goldeyes - Entertainment Funding Tax Refundable – True North - Entertainment Funding Tax Refundable – Winnipeg Football Club (WFC) - Frontage Levy - Government Grants - Natural Gas Tax - Net Taxes Added - Payments in Lieu of Taxes - Property Tax Revenue - Regulation Fees - Sales of Goods and Services
Preliminary 2020 Budget - Appendices 3-95
Appendix 11
Glossary
- Sewer Services - Solid Waste Disposal Services - Tax Penalty Interest - Transfers - Transit Service Fare Revenue - Water Services Sales
Sales of Goods and Services - Revenue category of fees charged to users for services provided on a fee for service basis by the City for the convenience and quality of life for residents. Generally the consumer can exercise choice on whether or not to consume the service. Examples include recreation and ambulance fees. Self-Supporting Utility - The Water and Waste Utilities do not receive subsidies from the mill rate or tax supported budget. Service (Internal) - Those services which are offered internally to one or more organizational units within the corporation in support of public service delivery. Service (Public) - An operational concept where something of value is provided to individual members of the public, or defined members of the public (client set) or the public collectively. Service-Based Budget (SBB) - Displays budget information (how much the service will cost and how the service is to be funded) and performance measures for services provided, including all components regardless of which unit or department delivers the service. The service-based budget is intended to provide more transparent reporting and a more direct link between the budgets provided and the services delivered. Service Level Statistics - Are service-related metrics intended to reflect the amount of activity or services provided with the resources approved by City Council, as well as changing circumstances in the community or service industry that may impact the service. Sewer Services Revenue - This revenue is generated when the sewer rate is applied to the amount of water used as measured by the water meter, since most of it ends up as sewage. This money is used to collect, transport and treat sewage so that it meets environmental requirements before it is released to the Red and Assiniboine Rivers. Sewer System Rehabilitation Reserve - On May 27, 1992, City Council authorized the establishment of the Combined Sewer Renewal Reserve and the Wastewater Sewer Renewal Reserve Funds. These Reserves were established for the renewal and rehabilitation of combined sewers and wastewater sewers, respectively, with funding provided from the frontage levy identified for this purpose in By-law 549/73 (amended by By-law 7138/97). The purpose of the Reserves was to provide a consistent approach to financing infrastructure renewal and rehabilitate combined sewers and to renew and rehabilitate wastewater sewers (as defined by the Sewer Utility By-law 5058/88). The annual frontage levy funding was allocated by City Council between the Combined Sewer Renewal Reserve and the Wastewater Sewer Renewal Reserve in accordance with the capital program requirements.
3-96 Preliminary 2020 Budget - Appendices

Appendix 11
Glossary
On January 30, 2002, City Council passed By-law No. 7958/2002 "Frontage Levy By-law" to include the repair and replacement of streets and sidewalks in residential areas. On September 27, 2006, City Council approved the consolidation of the Combined Sewer Renewal Reserve and the Wastewater Sewer Renewal Reserve Funds into the Sewer System Rehabilitation Reserve Fund, which was effective on October 1, 2006. On December 15, 2009, City Council authorized, by way of approval of the Capital Budget, that effective 2009, frontage levy revenue collected on property taxes would no longer fund the Sewer System Rehabilitation Reserve as of 2011. Therefore, the Sewer System Rehabilitation Reserve is fully funded through sewer rates transferred from the Sewer Disposal System Fund as well as interest earned on the reserve fund balance. The Director of Water and Waste is the Fund Manager. Shared Health - Shared Health leads the planning and coordinates the integration of patient-centered clinical and preventive health services across Manitoba. The organization also delivers specific province-wide health services and supports centralized administrative and business functions for Manitoba health organizations. Sinking Fund - A fund established by setting aside annual contributions or levies over a period of time to fund the repayment of long-term debt at maturity. The city administration manages the sinking fund contributions on sinking fund debentures. Solid Waste Disposal Services Revenue - The service consists of several primary sources of revenue including tipping fees, waste diversion user fees and residential recycling revenue (a definition of each can be found in this glossary). Southwest Rapid Transit Corridor Reserve - On March 26, 2008, City Council approved that a Rapid Transit Infrastructure Reserve Fund be established, and that the purpose of the Reserve be to accumulate funds and subsequently to expend on future costs incurred on account of public transit infrastructure, including the construction of rapid transit corridors contemplated in the future. On October 22, 2008, City Council approved that the purpose of the Rapid Transit Infrastructure Reserve be revised to accumulate funds and subsequently expend on costs incurred on account of public transit infrastructure, including the operation and construction of the rapid transit infrastructure, structures and facilities, development, and other related costs including bus purchases, technology, personnel, and land acquisition. On January 29, 2013, City Council approved that effective January 1, 2014 the reserve be renamed the Southwest Rapid Transit Corridor - Stage 2 Reserve. In addition the purpose has been revised to: a) accumulate capital funds and subsequently expend such funds on future costs incurred on account of public transit infrastructure, and more specifically, the construction of the Southwest Rapid Transit Corridor - Stage 2, and the purchase of vehicles associated with Stage 2, contemplated in the future; b) contribute to the proposed Jubilee Rapid Transit Station if net proceeds of the disposition of the subject City property are insufficient to cover the City's share, as approved by City Council on October 24, 2012; c) pay for any residual land acquisition settlements for the Southwest Rapid Transit Corridor - Stage 1 project; and d) pay for the
Preliminary 2020 Budget - Appendices 3-97

Appendix 11
Glossary
ongoing replacement of the 10 buses purchased for the Southwest Rapid Transit Corridor Stage 1 project. On March 23, 2015 City Council approved that the Reserve be renamed the Southwest Rapid Transit Corridor Reserve. The Director of Transit is the Fund Manager. Southwest Rapid Transitway (Stage 2) and Pembina Highway Underpass Payment Reserve - On March 23, 2015 Council approved the establishment of the Southwest Rapid Transitway (Stage 2) and Pembina Highway Underpass Payment Reserve for the purpose of setting aside funding for the P3 annual service / financing payments commencing in 2019 for the Southwest Rapid Transitway (Stage 2) and Pembina Highway Underpass capital project. The funding source from the City was originally approved as dedicated property tax revenue transferred from the General Revenue Fund, a one-time fare increase in 2016 and an annual grant from the Province. Subsequently, the one-time fare increase was removed and the Province has advised the annual grant will not be provided. A 2/3 vote of Council is required in order for the use of funds to be other than those stipulated. The Director of Transit is the Fund Manager. Special Operating Agency (SOA) - A special unit of an organization which can operate within or outside the existing city department structure in the delivery of its service(s). It is granted more direct responsibility for results and increased management flexibility needed to attain new levels of service delivery. The authority for SOAs is provided by the City of Winnipeg Charter Section 215. Standing Committees - Sub-committees of City Council delegated certain powers and duties to facilitate the administration of their assigned City departments which report through them to the Executive Policy Committee and City Council. They also provide a forum for public input and receive recommendations from Community Committees related to their respective responsibilities. Areas of responsibility are Finance; Infrastructure Renewal and Public Works; Innovation and Economic Development; Property and Development, Heritage and Downtown Development; Protection, Community Services and Parks; and Water and Waste, Riverbank Management and the Environment. Strategy - Those steps taken in support of public and internal service goals. Tax Penalty Interest - This revenue is generated from property and business tax accounts that are in arrears. Tax penalties are applied to tax accounts in arrears in accordance with the Tax Penalty By-law 5796/91 and the Tax Sale Penalty By-law 8157/2002. Tax-Supported Services - Goods and services supplied by the City whose costs are supported, in whole or in part, by funds received through property tax revenues. Tipping Fees - This revenue is generated from charging a per tonne rate to residential and commercial garbage delivered to the City landfills.
3-98 Preliminary 2020 Budget - Appendices

Appendix 11
Glossary
Transfers - Refers to transfers to and from reserves, departments, and/or funds. Transfer to Capital - The mill rate supported funding source for capital projects. The transfer to capital amount is sourced from the general revenue (mill rate supported) fund and moved to the general capital fund to finance the City’s capital priorities. Transit Bus Replacement Reserve - On December 15, 1994, City Council approved the establishment of the Transit Bus Replacement Reserve Fund. The purpose of the Reserve is to provide financing for the replacement or refurbishment of transit buses in a scheduled and pragmatic manner. Contributions to this Reserve will be based on a budgeted appropriation from the Transit Department plus proceeds from the disposal of bus equipment and insurance claims on bus equipment written off. Upon the Transit Department making the outlay to replace or refurbish buses, this Reserve will contribute towards that purchase. The Director of Transit is the Fund Manager. Transit Plus - a service of Winnipeg’s public transit system that provides door-to-door transportation for people who are unable to regularly use the City’s fixed route transit system because they are legally blind or have significantly impaired mobility. Winnipeg Transit Plus registrants use a variety of mobility aides including scooters, canes, walkers, and both manual and motorized wheelchairs. Transit Service Fare Revenue - The revenue generated when the type or class of fare is applied to the applicable rider. There are different rates based on time period (i.e. single ride, weekly, monthly, etc), method (i.e. cash or e-card) and whether rider qualifies for a student, reduced or regular fare. User Fees/Charges - The payment of a fee for direct receipt of a public service by the party who benefits from the service. Utility - A utility or public utility provides funding and maintains the infrastructure for and provides a rate based service that is consumed by the public such as water, wastewater, waste disposal, and public transportation. Vacancy Management - Estimated savings derived from delaying the filling of vacant positions which were budgeted for. Waste Diversion User Fee - This revenue is generated to fund new programs that provide residents with more ways to reduce, reuse and recycle. The fee is charged on a daily basis according to dwelling units and appears on the water bill. Waste Diversion Reserve - On October 19, 2011, City Council approved the establishment of the Waste Diversion Reserve Fund for the purpose of funding waste diversion programs and projects. The reserve is to be funded by surplus monies collected through the waste diversion services user fee. The first transfer to the reserve occurred in 2013. The Director of Water and Waste is the Fund Manager.
Preliminary 2020 Budget - Appendices 3-99

Appendix 11
Glossary
Water Service Sales Revenue - This revenue is generated when the water rate is applied to the amount of water used, as measured by the water meter. This covers the cost of bringing water from Shoal Lake to the consumer, including operating and maintaining the aqueduct, pumping stations, reservoirs, and distribution system. Water Main Renewal Reserve - On February 18, 1981, City Council established this reserve fund for the purpose of financing the renewal of watermains. It was initially created by the transfer from the Waterworks System and funded through a frontage levy. Since 2009, the source of funding for the Water Main Renewal Reserve is water rates. The Director of Water and Waste is the Fund Manager. Water Meter Renewal Reserve - On January 30, 2020, City Council authorized the establishment of the Water Meter Renewal Reserve to fund a program for the replacement and renewal of water meters with advanced meters. The reserve is funded by customers through the Daily Basic Charge. The Director of Water and Waste is the Fund Manager. Winnipeg Police Board - The Winnipeg Police Board provides civilian governance and oversight of the Winnipeg Police Service to improve transparency and accountability in policing. It is made up of seven civilian members. Five members are appointed by Winnipeg City Council and two are appointed by the Province of Manitoba. It receives its authority from Manitoba’s Police Services Act (2009) and a City of Winnipeg By-Law (148/2012). Workers Compensation Reserve - Under the terms of By-law No. 9802 of the former City of Winnipeg, provision was made for the establishment of a Workers Compensation Reserve Fund. On January 1, 1972, as a result of the amalgamation of the City of Winnipeg with former area municipalities, The Workers Compensation Reserve Fund was established in accordance with Section 338 of the former City of Winnipeg Act. The City administers its workers compensation program on a self-insured basis. In lieu of paying premiums to the Workers Compensation Board of Manitoba, the City pays actual costs incurred plus an administration charge. Departments are charged actual costs as well as surcharges related to financing fatality pensions and upgrades of benefits. The net result is that costs and surcharges are transferred to/from the Workers Compensation Reserve Fund. The Workers Compensation Reserve Fund serves to counteract any budgetary fluctuation from year to year that would result from a work related incident of major proportions. On April 29, 2015, Council approved an amendment to the purpose of the Workers Compensation Reserve 1) to include Permanent Partial Impairment awards for occupational disease claims and 2) that pension surplus/deficit from Workers Compensation Board be accounted for in the Workers Compensation Reserve. The Corporate Controller is the Fund Manager.
3-100 Preliminary 2020 Budget - Appendices