2020 integrated report - pepkor
TRANSCRIPT

2020 INTEGRATED
REPORT

CONTENTS
READ MORE Corporate social responsibility report
LINK TO Our material matters
Introduction About this report 02Letter to shareholders 04Chief executive officer’s report 06
Understanding the group 10
Group performance 36
Additional information 80
Corporate overview 12
Chief financial officer’s report 38
Acronyms and terminology 82
Key performance indicators 14
Our businesses 42
Pro forma financial information 83
Operating environment 16
PEP 44
Retail footprint 91
Our strategy 18
Ackermans 48
Shareholder analysis 92
Our material matters 20
PEP Africa 52
Share performance 93
Material risks 23
Pepkor Speciality 54
Shareholders’ diary 94
Our stakeholders 24
JD Group 58
Corporate information 95
How we create value 26
Abacus 61
How we govern 28
Flash 62
Board of directors 31
Capfin 66
How we reward 34
Group Services 68The Building Company (discontinued operations) 76

INTRODUCTION
Purpose. Our purpose is to make a positive difference in the lives of our customers.
ALISCAI MKOSI, PEP customer
‘I always buy here because I can afford it. It’s cheap for me to buy here and get more.’
PEPKOR INTEGRATED REPORT 2020 01
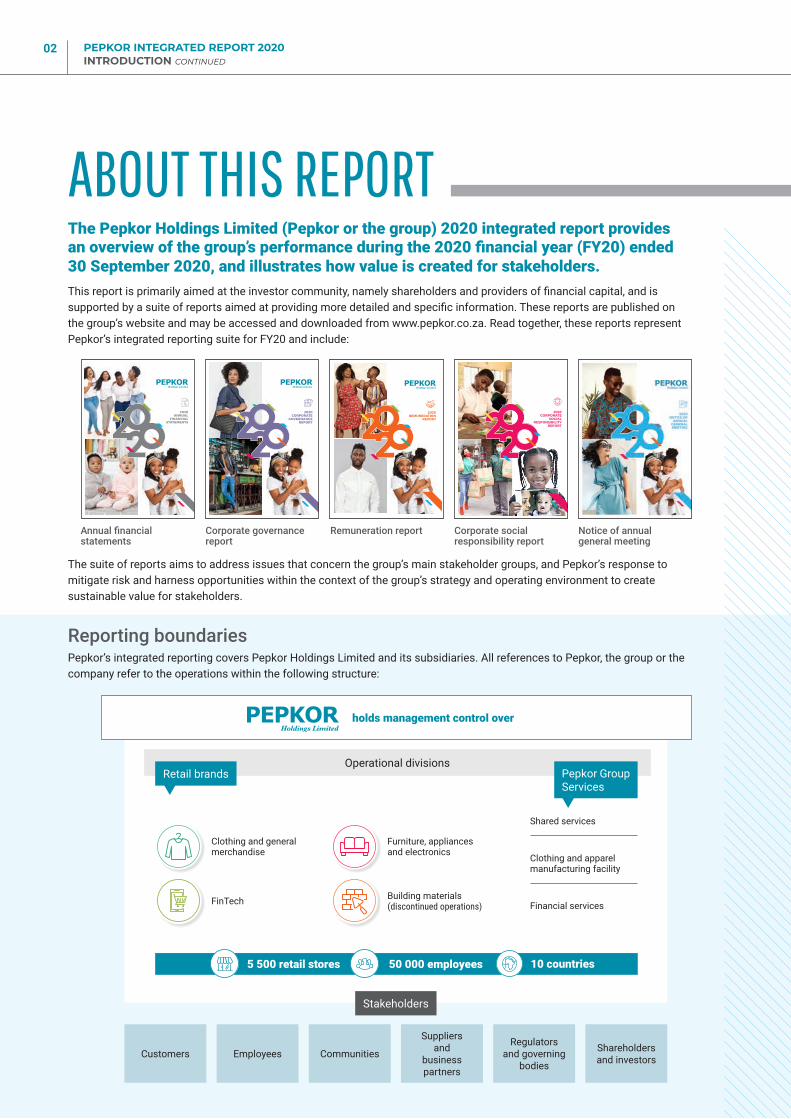
ABOUT THIS REPORTThe Pepkor Holdings Limited (Pepkor or the group) 2020 integrated report provides an overview of the group’s performance during the 2020 financial year (FY20) ended 30 September 2020, and illustrates how value is created for stakeholders.This report is primarily aimed at the investor community, namely shareholders and providers of financial capital, and is supported by a suite of reports aimed at providing more detailed and specific information. These reports are published on the group’s website and may be accessed and downloaded from www.pepkor.co.za. Read together, these reports represent Pepkor’s integrated reporting suite for FY20 and include:
Annual financial statements
Corporate governance report
Remuneration report Corporate social responsibility report
Notice of annual general meeting
2020 ANNUAL
FINANCIAL STATEMENTS
2020 CORPORATE
GOVERNANCE REPORT
2020 REMUNERATION
REPORT
2020 CORPORATE
SOCIAL RESPONSIBILITY
REPORT
The suite of reports aims to address issues that concern the group’s main stakeholder groups, and Pepkor’s response to mitigate risk and harness opportunities within the context of the group’s strategy and operating environment to create sustainable value for stakeholders.
Reporting boundariesPepkor’s integrated reporting covers Pepkor Holdings Limited and its subsidiaries. All references to Pepkor, the group or the company refer to the operations within the following structure:
Operational divisions
Stakeholders
Customers Employees Communities
Suppliers and
business partners
Regulators and governing
bodies
Shareholders and investors
Retail brands Pepkor Group Services
Furniture, appliances and electronics
Shared services
Clothing and apparel manufacturing facility
Financial services Building materials (discontinued operations)
Clothing and general merchandise
FinTech
holds management control over
5 500 retail stores 10 countries50 000 employees
PEPKOR INTEGRATED REPORT 2020 INTRODUCTION CONTINUED
02

There were no significant restatements from prior periods other than those described in the summary of the accounting policies: ‘Adoption of new or revised standards’ as included in the annual financial statements. Financial information contained in the integrated report is extracted from the audited annual financial statements that were approved by the Pepkor board on 15 December 2020. To provide a meaningful assessment of group performance, the commentary included in this report excludes the adoption of IFRS 16.
Reporting principles and frameworksThe following principles and frameworks were considered in the compilation of our reports:
� The Companies Act, No. 71 of 2008, as amended (Companies Act)
� The JSE Listings Requirements
� The International Financial Reporting Standards (IFRS)
� The King IV Report on Corporate Governance™ for South Africa, 2016 (King IV™)*
� The International <IR> Framework as issued by the International Integrated Reporting Council (IIRC)
� FTSE/JSE Responsible Investment Index – a series of ethical investment stock market indices
� United Nations Global Compact (UNGC), Organisation for Economic Co-operation and Development (OECD) and International Labour Organisation (ILO) principles
MaterialityPepkor management and the board consider materiality from both financial and non-financial perspectives, with the group’s risk management approach determining the group’s material issues. The group uses materiality to inform the content of reports and the context in and extent to which it discloses any material issues relating to the group.
AssurancePepkor’s combined assurance model addresses all the significant risks faced by the group. It comprises management, the internal audit function, external audit services and other specialists contributing to combined assurance.
Internal audit’s scope was extended this year to include a review of the integrated reporting suite, including financial and non-financial information. External assurance applies to the audit opinion on the group’s annual financial statements and the broad-based black economic empowerment (B-BBEE) contributor level status.
Forward-looking informationThis integrated report contains certain forward-looking statements that relate to the financial position and results of the operations of the group. These statements are based
on the view and considerations of the directors. These statements, by nature, involve risk and uncertainty, and they relate to events and depend on circumstances that may occur in the future. Factors that could cause actual results to differ materially from those in the forward-looking statements include, but are not limited to, global and national economic events, changing market conditions, interest and foreign exchange rate fluctuations, competitive conditions and regulatory factors. These forward-looking statements have not been reviewed or reported on by the group’s external auditor.
Value creationPepkor’s ability to create value over time is reported in the context of how we manage our available capital, as explained in the business model. We align our reporting of the capitals with that of the International <IR> Framework:
* Copyright and trade marks are owned by the Institute of Directors in South Africa NPC and all of its rights are reserved.
Approval of the integrated reportThe board acknowledges its responsibility to ensure the integrity of the integrated report. The directors confirm that they have reviewed the content and are satisfied with the reporting process. The integrated report represents a fair presentation of the performance of the group.
On behalf of the Pepkor board
WENDY LUHABE LEON LOURENSIndependent non-executive chairman Chief executive officer
29 January 2021
SOCIAL AND RELATIONSHIP CAPITAL: Our relationships with our customers, communities and suppliers that have been established and nurtured over many years.
HUMAN CAPITAL: Our culture and skills development that enable employees to deliver on Pepkor’s strategy and to grow on a personal level.
INTELLECTUAL CAPITAL: Our retail experience and disciplined way of doing business in a simplified and effective manner at the lowest possible cost, and consistent innovation to better serve the needs of customers.
MANUFACTURED CAPITAL: Our systems and processes, physical and virtual retail channels and supply chain capability give customers easy access to our products and services.
FINANCIAL CAPITAL: The funding to sustain and grow our operations, including shareholder equity, debt and other funding. We allocate capital optimally to maximise returns.
NATURAL CAPITAL: The impact of our business and operations on our communities and the environment.
PEPKOR INTEGRATED REPORT 2020 03

LETTER TO SHAREHOLDERS
I have said many times before that Pepkor is more than just a company. Pepkor has a unique culture and deep meaning for our employees, customers and other stakeholders.
In my letter to shareholders last year, I described 2019 as a year of consolidation, and anticipated that Pepkor would be able to benefit from that consolidation phase in the current year.
Pepkor undoubtedly benefited from that consolidation period, which facilitated us to be able to survive and emerge strongly from the unprecedented challenges resulting from the COVID-19 pandemic.I am pleased to report that the Pepkor board, management team and entire staff has worked tirelessly during this year to protect our employees and customers from the health and safety risks, and to ensure that the businesses survived.The full lockdown implemented by the South African government in March 2020, resulted in Pepkor having to absorb continuing costs for a significant period without the benefit of revenue. During the lockdown, the board met on a weekly basis to address particularly the liquidity challenges facing the company. The gradual relaxation of lockdown regulations by government enabled Pepkor to resume trading, initially for essential products supplied by our businesses, and later for our full range of discounted products that are provided conveniently to our customers. Pepkor was well positioned in the market, as our customers took advantage of the additional social benefits and grants that were provided by government to purchase affordable and essential products and services.
The strong trading post-lockdown and our focus on liquidity issues, assisted by a successful over-subscribed accelerated book-build, where slightly less than 5% of the company’s issued shares were successfully placed, enabled the company to reduce
PEPKOR INTEGRATED REPORT 2020 INTRODUCTION CONTINUED
04

its net debt from approximately R14 billion at the half-year to approximately R7 billion. This is a remarkable achievement and management is to be commended for this outcome.
The company lost an estimated R5 billion of sales during the hard lockdown period. Notwithstanding these lost sales, the company was able, at the end of the review period, to reflect an overall increase in revenue compared to the previous year. This is also a good achievement which has been possible as a result of solid market share gains, which are set out in more detail later in this annual report.
The pandemic impacted the profitability of the company, particularly as a consequence of the need to impair some of the goodwill and intangible assets that were held on the balance sheet. In determining the carrying values of these assets, the uncertainty of future performance was a major factor. The company determined that certain of the carrying values were considered to be too high, thus giving rise to the impairments that have now been made. The higher risks in an uncertain environment also gave rise to the need to increase provisions in the credit books owned by the company, which further impacted profitability. This cautious approach should benefit the company in the future. Full details of the financial and operational performance are outlined in detail elsewhere in this report.
Apart from the COVID-19-related interventions, the company remained focused on the need to continue with the implementation of its key strategies. An agreement for the sale of The Building Company was concluded and is awaiting consideration by the competition authorities. This had been identified as a non-core asset. Consistent with the approach to shift capital away from areas where acceptable returns are not being achieved and future strategic growth is questionable, the company disposed of its Zimbabwean operations and closed operations in Uganda. Subsequent to the year-end, a decision was also taken to dispose of the John Craig business.
Relatively small but important strategic acquisitions were made, which included the Abacus insurance business; the Eezi Global fintech business that was acquired by Flash to enhance its entry into the United Kingdom and Europe; and the S.P.C.C and CODE brands which were acquired by Pepkor Speciality to bolster the group’s focus on adult wear.
I have said many times before that Pepkor is more than just a company. Pepkor has a unique culture and deep meaning for our employees, customers and other stakeholders. It comprises committed and dedicated people, who wish to improve the lives of our customers and employees every day. The importance of being involved in the communities in which they operate is clearly exemplified by the many projects outlined in the corporate social responsibility report. At the time of the COVID-19 lockdown, executive management and the board of directors made donations from the earnings they derived from the company to assist those most directly affected by the pandemic.
Although I have been involved with Pepkor for many years prior to its listing in 2017, I have held the position of chairman since its listing. Since 2017, the company has faced stormy corporate and financial waters, which we have successfully navigated, and have now arrived at a point where we enjoy relatively lower risk and a more stable set of circumstances. The board and management are both much stronger than three years ago. Against that background, I decided not to make myself available for re-election at the end of my term of office on 30 November 2020, and recommended the appointment of an independent chairman. The company is fortunate to have a person with the experience and wisdom of Wendy Luhabe, who became chairman of the board with effect from 1 December 2020. I look forward to continue being involved with the success of Pepkor as a non-executive director.
Pepkor’s progress has been driven by Leon Lourens and his management team. My thanks go to him and his team for the valuable achievements over the review period. I would also like to convey my thanks and appreciation to my fellow board members for their help and guidance, and to all the various stakeholders without whom the achievements of this past year would not have been possible.
JAYENDRA NAIDOO Non-executive director, and chairman of the board from September 2017 to November 2020
Jayendra notified the board of his resignation as non-executive director on 20 January 2021 which is effective on 1 February 2021.
PEPKOR INTEGRATED REPORT 2020 05

CHIEF EXECUTIVE OFFICER’S REPORT
For the first time in history, many countries were locked down for trade, travel and social interaction at the same time. Never before have we experienced a phenomenon that had such a direct impact on all of us and our livelihoods.
Pepkor achieved substantial market share gains during the COVID-19 pandemic.
In a year of unprecedented uncertainty caused by the COVID-19 pandemic, the Pepkor group achieved an exceptional sales performance and substantial market share gains. Taking an opportunistic approach supported by the group’s strong execution abilities, Pepkor entrenched its position as the leading discount and value retailer in South Africa. Despite the adverse conditions, I am pleased with the performance of the group, which is better positioned now than it was before the pandemic. The COVID-19 pandemic is what 2020 will be remembered for in years to come. As it swept across the world, unprecedented measures were employed to contain and prevent the spread of the virus. For the first time in history, many countries were locked down for trade, travel and social interaction at the same time. Never before have we experienced a phenomenon that had such a direct impact on all of us and our livelihoods.
In South Africa, national lockdown protocols to prevent the spread of COVID-19 dealt a significant blow to the already fragile economy, and the retail sector in particular. The trade restrictions imposed in terms of the national lockdown prevented retail stores from trading during April 2020, while further trading restrictions resulted in the group not being able to trade in its full merchandise range until June 2020. Trading conditions since the relaxation of national lockdown measures favoured Pepkor’s defensive discount and value positioning. This resulted in the exceptional outcome of achieving revenue growth in FY20 compared to the prior year, despite losing approximately R5.0 billion in revenue due to store closures.
LINK TO OUR MATERIAL MATTERS Achieving growth in a low-growth environment p 20
PEPKOR INTEGRATED REPORT 2020 INTRODUCTION CONTINUED
06

Pepkor’s retail brands benefited from consumers seeking value, while its expansive store footprint appealed to customers choosing to shop in more convenient locations closer to their homes. Consumer focus on less discretionary and more affordable products and services resulted in a very satisfactory sales performance and substantial market share gains.
Pepkor’s strong corporate culture and execution ability ensured a swift and decisive response to the COVID-19 crisis, with stores and the supply chain reacting very quickly to the challenging and unpredictable environment. Pepkor applied a conservative approach in areas such as capital allocation and cost expenditure, as uncertainty surrounding the longer-term impact of the COVID-19 pandemic remains. Capital expenditure was reduced and the group limited expense growth to a credible 3% for the year.
LINK TO OUR MATERIAL MATTERS Maintaining a low cost of doing business p 21
The group opened 234 new stores during the year, reflecting a marked slowdown during the second half of the year. Except for the PEP and Ackermans brands, expansion for the group has been cut back substantially during these uncertain times. This approach will be continued into the new financial year, as expansion will be concentrated on the brands that are robust, more predictable and provide good returns on investment. The other brands will use the year to consolidate and improve their businesses to create a platform for expansion once there is more certainty in the market.
Our positive trading performance, prudent capital allocation and conservative working capital management resulted in unprecedented levels of cash generation to the value of R9.2 billion for the year. The group made substantial progress in enhancing and strengthening its balance sheet by reducing net debt by R6.9 billion during the last six months of the year. This positive development places Pepkor closer to the optimal level of debt it has been working towards.
LINK TO OUR MATERIAL MATTERS Allocating capital effectively and optimising gearing levels p 22
Our response to the COVID-19 pandemicPepkor prioritised the safety and livelihoods of our 50 000 employees through focus on safety in the workplace, maintaining full remuneration, and job preservation. The group stepped up to its responsibility through a wide range of contributions to help fight and alleviate the impact of the COVID-19 pandemic on the people and communities of South Africa by making a difference in the lives of our customers. Supply chain and procurement planning proved to be the most challenging operational aspect of the COVID-19 crisis, as lockdown restrictions varied between China and South Africa. This was exacerbated by the uncertainty of the local trading environment. Pepkor’s defensive product range, longer lead times and collaborative supplier partnerships contributed to the group achieving very good stock levels during the pandemic – ending the year low on stock, but having had enough to achieve sales growth.
The outcries on social media from new mothers who were not able to clothe their babies due to stores being closed was heartbreaking, and the group did everything in its power to resume operations as fast as possible. Our efficient supply chain and logistics infrastructure successfully dealt with significant bottlenecks in the distribution of merchandise to stores. Record service levels were achieved, allowing the group to meet pent-up demand from consumers for much needed products, such as winter and newborn baby clothing.
LINK TO OUR MATERIAL MATTERS Maintaining an efficient and effective supply chain p 21
READ MORECorporate social responsibility report: Group response to the COVID-19 pandemic p 9Case studies:Flash/CoCare partnership provides COVID-19 supportPepClo diversifies during the COVID-19 pandemic
PEPKOR INTEGRATED REPORT 2020 07

CHIEF EXECUTIVE OFFICER’S REPORT CONTINUED
Business performancePEP and Ackermans reported strong trading levels following the reopening of stores in May 2020. While the strong trading performance benefited from pent-up demand and additional social grant payments, the compelling customer value propositions of PEP and Ackermans are expected to continue to resonate with customers in search of value and affordability. This was confirmed by exceptionally strong growth of 240 basis points in the market share of both PEP and Ackermans, as reported by the Retailers’ Liaison Committee (RLC). Gross margins were in line with the previous year and stock levels have reduced with higher freshness levels providing an ideal platform for the future. PEP Africa continued to consolidate amid adverse macroeconomic conditions across most countries of operation. The management team is building a more robust business model to withstand the volatility of the African operation and has reduced operating expenses by almost 20%. The exit from Zimbabwe was completed and it was decided to close operations in Uganda, as expansion plans in East Africa have proven not to be feasible. No store expansion is planned for the next year.
The Pepkor Speciality division reported mixed results across its retail brands with weaker demand in adult footwear and apparel, which are inherently more discretionary in nature. Tekkie Town had good post-lockdown sales and stockholding was reduced through aggressive markdowns. Shoe City was negatively impacted by lower demand for formal shoes, their shopping mall store network, and the absence of back-to-school footwear sales. John Craig’s performance was impacted by a shift in consumer demand away from formal wear and the decision was made to dispose of the business. Dunns achieved profitability for the first time in many years and we are positive about the future potential of its 204 stores. Refinery achieved good results and continued to strengthen its brand equity, while it also successfully launched an e-commerce platform.
The JD Group achieved commendable sales results with strong trading momentum during the fourth quarter in both the furniture and consumer electronics and appliances divisions. Consumer demand continues to be driven by technology upgrades, work/school-from-home, and consumers investing in their homes. The contribution from online sales nearly doubled to 7% from the prior year in the
StrategyThe Pepkor purpose remains focused on making a positive difference in the lives of our customers. We live in a country and on a continent where the vast majority of people have very little disposable income. Pepkor’s strength lies in its ability to serve the needs of these consumers and to be their preferred shopping destination – making it possible for them to live with dignity and pride. At Pepkor, we see it as our responsibility to provide customers with affordable products, making their lives easier and better.Against this backdrop, our decentralised brands and operating divisions manage their businesses to provide the right products and services at the best prices and in the most convenient way to their customers. Each division is different and employs its own strategy to best mitigate its risks and execute on opportunities.
READ MORE
PRODUCT Provides variety with a focus on basic, needed
and replenishment product categories.
PRICE Provides affordable
products at the lowest price
possible through low cost of doing
business and efficiencies through
scale.
CONVENIENCE Provides access
through expansive footprint, various sales channels and fintech
services.
OUR CUSTOMERS are at the centre of our strategy
Operational review from p 44Material risks p 23Our material matters p 20 Our strategy p 18
PEPKOR INTEGRATED REPORT 2020 INTRODUCTION CONTINUED
08

consumer electronics and appliance division, facilitated by investments in omnichannel capability. The credit contribution to total sales reduced significantly and collections on the credit book were above expectations. The divisions are showing promising signs for the year ahead.
The Flash business achieved strong growth. Virtual turnover in the trader business increased by 25.7% for the year and includes 194 000 traders, mostly in the informal market. Capfin reduced the number of active accounts from 333 000 at 31 March 2020 to 219 000, as it reduced credit extension. Plans are to maintain the current credit book size with a future focus on six- and 12-month loans.
The group’s portfolio strategy to focus on its core business resulted in the decision to dispose of The Building Company. Performance was impacted due to the inactivity and contraction of the construction industry as a result of the COVID-19 lockdown. Nevertheless, the strategic journey of the business is progressing well, as it is consolidated into a more robust business through a simplified structure, effective cost management and a more centralised procurement strategy.
OutlookPepkor’s sales performance since the relaxation of lockdown measures has been excellent and underscores the strength of our business model and market positioning. Providing the South African consumer with affordable products has become even more important in the current environment and the group is ideally positioned to execute on this. While the evolution of the COVID-19 pandemic and its economic impact in the near to medium term remains uncertain, there is an expectation that the toughest times for the economy and customers are still to come as unemployment increases and special grants and other benefits are reduced. Our view of the future is optimistic, but we remain cautious and conservative until we obtain more certainty about the direction of our economy.
Cash generation has been excellent and the balance sheet has been significantly strengthened, which provides the group with the ability to capitalise on potential opportunities that may arise in the market. Significant progress was made in restructuring and consolidating the group’s portfolio of operations to enhance efficiency and profitability levels.
Pepkor is well positioned to continue gaining market share in a future constrained retail environment. The group will continue to entrench its discount and value positioning through providing affordable products to the consumer as we stand to benefit from consumers in search of value and more basic merchandise.
The resolve, resilience and loyalty shown by the group’s employees and customers during one of the most challenging periods in history is most encouraging. The strong and healthy corporate cultures of the group and our retail brands have supported the business during this trying time and resulted in a commendable, market-leading performance for the year. The support and understanding from our loyal, long-standing suppliers and business partners have been invaluable, and similarly we value the support from our investors.
LINK TO OUR MATERIAL MATTERS Attracting and retaining talent p 22
The group’s operations are prepared for changes in consumer behaviour with accelerated growth in e-commerce and fintech capability, supplemented by our convenient and accessible retail store footprint. The group continues to identify opportunities for store expansion, driven by PEP and Ackermans, in addition to the development of new retail formats. In terms of new markets, exciting opportunities exist in the adult wear market, while the group will also consider other expansion opportunities.
AppreciationThis year we have proved to ourselves that we truly live our purpose. We stayed the course and never wavered in our conviction and determination to deliver on it.I would like to thank our 50 000 employees for their loyalty, dedication and resilience during a most challenging year. I am humbled by the tireless commitment and agility of the various executive teams in the group in responding to the challenges faced during the year. Pepkor is very fortunate to have such an exceptional group of employees, who bring a very high level of skill, experience and leadership to the group.
Our board of directors provided invaluable support and guidance as we navigated our way through the COVID-19 crisis, and I commend and appreciate the readiness and willingness of all board members to contribute and add value.
LEON LOURENS Chief executive officer
PEPKOR INTEGRATED REPORT 2020 09

PEPKOR INTEGRATED REPORT 2020 10
IN THIS SECTION
UNDERSTANDING THE GROUP
Variety. We provide products and services to a wide customer base.
The implementation of global lockdowns and social distancing measures brought many industries to a complete standstill and influenced businesses’ ability to trade.
The interaction between our material matters, business model and strategy determines our success in the short, medium and long term.
The outcomes of our business model are delivered through a continuous focus on our stakeholders, with our customers being at the centre of our purpose.
Operating environment pages 16 – 17
Our material matters pages 20 – 22
How we create value pages 26 – 27

RANDALL BOTHA, Incredible Connection customer
‘I like to come here to see what’s new. There are many places to get products from, but when I need specialist items,
I come to Incredible Connection.’
PEPKOR INTEGRATED REPORT 2020 11

CORPORATE OVERVIEW
1901 1911
1916
1943 1947 1950
1965
1975
1978
1980
1986
1988 1989
1991
1992 1993
OUR EXPERIENCE spans more than 100 years of building trusted brands.
Pepkor has the largest retail store footprint
in southern Africa, and we leverage our assets to add value to
our customers’ lives. The scale of our operations, combined with our retail
experience and disciplined manner of execution, represents core assets
in which we continuously invest to sustain and grow our
business.
OUR VALUES are expressed through our culture. We believe in
supporting, respecting and trusting each other while we enable each other to
grow together.
OUR VISION is to be a globally respected discount and value retailer – by
being the best place to shop, work and invest.
OUR MISSION is to make a positive difference
in the lives of our customers and the communities in which we operate, by providing convenient access to everyday products and
services at affordable prices.
PEPKOR INTEGRATED REPORT 2020 UNDERSTANDING THE GROUP CONTINUED
12

PEPKOR INTEGRATED REPORT 2020 13
10 countriesAngola Malawi Mozambique
Nigeria Zambia
BotswanaeSwatiniLesotho
NamibiaSouth Africa
OUR FOOTPRINT
OPERATING CONTEXTSegmental revenue contribution
* On 4 August 2020, the group announced its disposal of The Building Company, comprising the entire building materials segment. The transaction remains subject to the fulfilment of certain conditions precedent and is classified as discontinued operations in the current year.
1993
1993
1994
1995
1996 1998
2000
2000 2006
2010
2011 2012
2015
2015 2016
13%Furniture, appliances
and electronics
Clothing and general merchandise
65%
10%Building materials
(discontinued operations)*
12%FinTech
READ MORE
Our material matters p 20 Segmental overview p 42

KEY PERFORMANCE INDICATORS
3.6% growth in revenue from continuing operations to
R63.7 billion
240 bpsgrowth in CFH market share1
R9.2 billioncash generated from operations, excluding IFRS 16
1 billionunits sold annually
400 milliontransactions annually
234 new stores opened
1 Market share growth in clothing, footwear and homeware (CFH). Source: Retailers’ Liaison Committee
PEPKOR INTEGRATED REPORT 2020 UNDERSTANDING THE GROUP CONTINUED
14

PEPKOR INTEGRATED REPORT 2020 15
KEY PERFORMANCE INDICATORS
2.4 million m2
total retail space
5 500 stores
50 000 employees
R40.7 millioncorporate social investment in communities
22 million km travelled in the Pepkor Logistics distribution network
2 600 tonnesof packaging material reused
Total stores
Buildingmaterials
2%
Furniture,appliances
andelectronics
16%
Clothingand generalmerchandise
82%
Clothingand generalmerchandise
68%
Total employeesFurniture, appliances
and electronics
12%
FinTech
3%
GroupServices
6%
Buildingmaterials
11%

Prior to the outbreak of the COVID-19 pandemic, economic conditions globally were precarious. This has been exacerbated by the impact of COVID-19 on markets and business activities. Our operating environment is mostly influenced by exchange rate fluctuations and pressure on consumer spending, with numerous underlying factors attributable to each of these.
OPERATING ENVIRONMENT
Our biggest market is South Africa, where
uncertainties continue around unemployment, economic
growth and resources, including food security, water shortages and
uninterrupted power supply. The impact of these conditions on the
most vulnerable in all societies was highlighted by the COVID-19 pandemic.
THE SOUTH AFRICAN ECONOMYThe national lockdown measures implemented by the South African government to curb the spread of the COVID-19 pandemic had a significant impact on the South African economy, resulting in economic contraction and increased job losses.The economy has been artificially supported by government intervention through increased social grants from the South African Social Security Agency (SASSA) and the Temporary Employer/Employee Relief Scheme (TERS) payments. This assisted a large portion of the population and some businesses over the short term. However, concern remains over the longer-term economic effect in context of increased government debt levels and its ability to support future economic growth.
The lockdown and social distancing measures required employees, in general, to work remotely from home, and forced businesses to adjust the way in which they trade. This tested businesses’ agility as well as the efficiency and effectiveness of their systems. These changes represent a potential structural shift in how people work. In certain respects, this benefited workforce morale through the increased flexibility enjoyed by employees.
Many businesses have prioritised investment in IT systems and management structures to improve operational execution. Due to the increase in remote working and dependence on technology and cyberconnectivity, there is a greater focus on cybercrime risk and requirements around information privacy legislation. Companies face the risk of financial loss or reputational damage as a result of a breakdown in technology breaches or an inability to sell products or provide services within a changed consumer environment.
THE GLOBAL ECONOMYThe COVID-19 pandemic affected the global economy and supply chains during 2020, owing to various responses by governments to prevent and slow its spread. The resulting economic effects are far-reaching, with many countries on the brink of recession. Stock markets, employment rates, consumer confidence and spending patterns have all been affected.
The implementation of global lockdowns and social distancing measures brought many industries to a complete standstill and influenced businesses’ ability to trade.
Uncertainty surrounding the long-term impact of the COVID-19 pandemic continues and is compounded by volatility in exchange rates. Trade and political tensions have increased globally due to increased populism among citizens, who are increasingly holding governments to account. These factors all have an impact on the performance of economies.
PEPKOR INTEGRATED REPORT 2020 UNDERSTANDING THE GROUP CONTINUED
16

THE RETAIL INDUSTRYConsumers in South Africa are feeling the impact of a prolonged period of low economic growth, high levels of unemployment and a stagnation in real wage growth. Consumer confidence is low with consumers’ ability to spend constrained. It is expected that unemployment will increase further, significantly impacting consumer spending and their ability to access credit.
These conditions have resulted in drastic changes in consumer spending patterns as consumers reconsidered the way in which they shop and transact. Trends indicate a growing preference for shopping online, closer to home with less frequent shopping trips, contactless payments and a move to value.
Since the relaxation of lockdown measures, consumer behaviour indicates increased focus on seeking value in babies’ and kids’ apparel. Product categories linked to technology and household goods have been favoured, driven by people spending more time at home.
Competition among retailers has intensified and will result in consolidation of the retail market. It is expected that the discount and value market segments will benefit from consumers’ increased focus on seeking value as spending is reprioritised to less discretionary products.
PEPKOR’S POSITION AND RESPONSE
Pepkor’s defensive market position and focus on the discount and value market positions it best to perform in a constrained retail environment as it stands to benefit from consumers buying down in search of value.
Success in the retail industry is heavily influenced by a retailer’s sustainable competitive advantage, including differentiation, innovation and operating at a low cost of doing business. To remain relevant, retailers must maintain an intense focus on customer needs and experience, invest in the digitisation of systems, and provide customers options through value and omnichannel platforms. Never before has customer centricity been so critically important.
The group’s strategy responds directly to many of the shifts in consumer behaviour as described above.
PEPKOR INTEGRATED REPORT 2020 17

OUR STRATEGYManaging a large retail group at a low cost of doing business in the discount and value retail market requires a disciplined approach that promotes simplicity to ensure that costs are contained. Our strategy focuses on three pillars that ultimately provide customers with value for money and guide the strategy of each of our operating divisions.
The group operates on a decentralised basis with each retail brand having its own unique customer value proposition and approach. Divisional senior leadership teams are responsible for its implementation through a specific strategy. These teams are supported and enabled by central group services (Group Services) that include specialist skills and capabilities, leveraging the scale of the group and applying best practice.
Collectively, all operating divisions focus on efficiencies to provide the right products at the best price at our customers’ convenience.
PEPKOR INTEGRATED REPORT 2020 UNDERSTANDING THE GROUP CONTINUED
18

CONVENIENCE Accessible locations and channels
194 000 Flash traders in the informal market
5 500 stores
PRICE Best possible price in product category
97% best price leadership (BPL) in PEP
8th consecutive yearAckermans voted Best Children’s Clothing retailer in South Africa1
PRODUCT The right products that serve our customers’ needs
Credit
7%
Payment channels – group sales mix
Lay-bys
8%
Cash
85%
We provide products and services for families and their homes, considering customer needs and trends, resulting in a wide VARIETY of product and service categories. These products are biased towards well-priced core products that are less discretionary in nature, thereby serving a wider consumer base.
The clothing and general merchandise segment includes the PEP and Ackermans’ discount and value retail brands, which focus on baby and kids’ apparel. A clear bias exists towards basic and replenishment products that customers need to purchase regularly. These retail brands comprise the largest portion of group revenue and earnings.
We are able to serve customers at their convenience through our expansive store footprint and variety of retail channels. Our numerous payment methods and innovative technology allow ACCESSIBILITY for customers, regardless of where they live. We believe in saving our customers money, not only with our low prices, but also in transport costs and time.
The world is moving towards the convenience of online trade and the group continues to strengthen its capabilities to remain relevant. The group’s expansive store footprint and supply chain continue to provide further opportunities to leverage this in areas such as omnichannel.
Our efficient supply chain, global sourcing capability and low cost of doing business enable us to provide products and services at the best possible price, resulting in AFFORDABILITY for our customers. Cost savings gained through efficiencies from leveraging the group’s scale are shared with customers by keeping prices as low as possible – thereby protecting the group’s market positioning.
The group’s supply chain is instrumental to minimise and control costs. Our scale of operations, infrastructure, and collaborative approach across retail brands and with suppliers continue to prove its worth.
Group revenue split
Clothing and generalmerchandise
65%
FinTech
12%Building
materials(discontinued
operations)
10%
Furniture, appliancesand electronics
13%
1 Ask Afrika Icon Brands
PEPKOR INTEGRATED REPORT 2020 19

PEPKOR INTEGRATED REPORT 2020 UNDERSTANDING THE GROUP CONTINUED
20
Achieving growth in a low-growth environment
OUR MATERIAL MATTERSThe group’s business model and strategy guide how we create value for stakeholders through the allocation of financial and non-financial resources. The interaction between our material matters, business model and strategy determines our success in the short, medium and long term.Our material matters are identified through our materiality process, which is managed by senior management with input from the board. Identifying and managing these material matters is based on our risk management process and is further informed by strategic issues raised by senior management and our key stakeholders, as well as our evolving operating environment. The materiality of any matter is based on its influence on the group’s ability to create value, regardless of whether it is positive or negative.
Sustainable growth remains challenging due to the current difficult operating environment. The operating environment places pressure on our customers’ disposable income, which inhibits growth in the retail market, especially in non-discretionary product categories like furniture, appliances, electronics and building materials.
Our defensive market position and bias towards basic product categories in the discount and value clothing and general merchandise segment has proved resilient. This focus is not subject to short-term seasonal or fashion trends and provides flexibility in the sourcing of products and the overall supply chain. This approach inherently promotes a higher sell-off rate, mitigates markdown risk and protects gross margins.
Our diverse geographic footprint, with stores in rural areas and small towns, has also added to our resilience. Investment in omnichannel and digitisation has become a necessity, as consumers are moving online to transact. The group has made good progress in its omnichannel and digital capability.
The impact that the prevailing economic climate will have on our customers’ ability to manage their credit leaves great uncertainty around responsible credit granting. The group, in aggregate, remains a cash retailer and has a very low dependency on credit in order to generate sales. In retail brands where the dependency on credit to enable sales is higher, the group has successfully reduced dependency through payment alternatives such as lay-bys.
Growth opportunities include: � Continued store footprint expansion
� Leveraging the group footprint through initiatives such as PAXI, our counter-to-counter parcel delivery service, and financial services
� Introducing new channels with e-commerce development across the group
� Category growth and introduction of new categories
Associated material risks
Sustainable growth
Elevated gearing
Supply chain disruption
Damage to reputation and brand
Currency volatility
Digital disruption
Regulatory change and complexity
Employee retention and engagement risk
Key to material risks
READ MORE Material risks p 23Corporate governance report

Our customers need the right product at the right time in the right store, all of which depends on maintaining an efficient and effective supply chain. Pepkor relies on an extensive supply chain that has been built over many years and is based on good supplier relationships, as well as effective systems and infrastructure. This matter was particularly important in the year under review, as our supply chain was tested by the COVID-19 pandemic. We are proud to have maintained good supplier relationships and proved our agility to deliver through this crisis.
We work collaboratively with a well-established supplier base, locally and across the globe, to find the best product at the best possible price. Although our dependence on our suppliers in China poses a risk due to the volumes we demand, we mitigate this risk through open communication and long-standing partnerships. COVID-19 has provided valuable insights on how many sourcing functions can be performed remotely through effective technology.
Although, in many instances, local sourcing is limited by high production demands, the group endeavours to actively source and build relationships and capacity of local suppliers to diversify supply sources.
Opportunities include: � Leveraging 3D and rendering technology to improve sourcing processes, product quality and fit
� Local sourcing opportunities. Pepkor is a signatory of the Department of Trade, Industry and Competition’s South African R-CTFL Master Plan to 2030 and is committed to investment and job creation with relevant support from the national government
� Investing in distribution centre capacity and systems
Maintaining an efficient and effective supply chain
Associated material risks
Pepkor’s commitment to improving the lives of customers by offering the best possible price drives our dedication to maintain a low cost of doing business and to share any savings with our customers.
Maintaining a low cost of doing business is part of our DNA through our disciplined approach to manage costs and to leverage our scale and investments in efficient systems and processes.
This also extends to other areas, such as foreign currency hedging, where a conservative policy is in place. Compliance with regulatory change and complexity are carefully considered.
Opportunities include: � Critically assess the cost base for opportunities to reduce costs
� Use the scale of the group to further consolidate and strengthen negotiation power
Maintaining a low cost of doing business
Associated material risks
PepClo’s new factory in Parow, Cape Town will be commissioned early in 2021. Since the production line was started in 2017, production of flip-flops has increased substantially and surpassed 4 million pairs this year.
PEPKOR INTEGRATED REPORT 2020 21

OUR MATERIAL MATTERS CONTINUED
The group is committed to develop employees, grow skills and enable job readiness. Divisions do their own job training relevant to their industry and operational requirements. Emphasis will be placed on ensuring that more accredited training is offered.
The group has improved the flexibility of its capital structure by reducing debt through various interventions. The group continues to target a reduced gearing level of one times net debt-to-EBITDA in the short to medium term. The strong trading since the relaxation in lockdown measures and positive collections on the credit books have supported this ambition to reduce debt. The successful completion of the accelerated book-build and announced sale of The Building Company further support this goal.
Lower gearing levels provide flexibility to deal with crisis situations such as a national lockdown, and underpin cash flow and liquidity. In addition, good progress was made towards diversifying our sources of funding and reducing funding cost through the successful launch of a Domestic Medium-Term Note (DMTN) programme comprising listed debt.
The COVID-19 pandemic resulted in unprecedented levels of consideration to ensure capital is allocated to areas of the group where returns are maximised. Credit granting was significantly curtailed to mitigate credit risk in anticipation of deterioration in the credit health of customers.
Opportunities include: � Reduce debt and improve flexibility to promote investment in growth opportunities
� Reduce the cost of funding
Allocating capital effectively and optimising gearing levels
Attracting and retaining talent
Each operating division or retail brand has its own culture, but they are all centred on the purpose of providing value to customers. This culture is maintained and nurtured by our talented employees and is an extremely important part of our success. A group culture such as this cannot be built in a time of crisis, but it is the kind of culture that will see you through any crisis.
We are led by a dedicated and experienced team who provide consistency and certainty in uncertain times. The agility of our people and the depth of knowledge they have of our business and retail in general was crucial in managing the COVID-19 pandemic. We work on an empowerment model that focuses on internal promotions. Looking forward, we continue to determine what the needs of our business model are and build towards ensuring capacity to support and deliver on our growth ambitions.
Opportunities include: � Leverage the scale of the group through greater alignment while still building decentralised employer brands
� Introducing more accredited learning programmes
� Dedicated leadership and succession development
Associated material risks
Associated material risks
PEPKOR INTEGRATED REPORT 2020 UNDERSTANDING THE GROUP CONTINUED
22

MATERIAL RISKSMaterial risks that substantially affect, or have the potential to substantially affect, the group’s strategy, business model or available resources (and ultimately its ability to create value over time) represent key uncertainties. These material risks are evaluated against the industry and global landscape to ensure that relevant emerging and current factors are considered.
READ MORE Corporate governance report
1 SUSTAINABLE GROWTHThe ability to capitalise on long-term growth opportunities in the South African market given current economic conditions. For the group to grow, it needs to identify and invest in growth initiatives.
2 SUPPLY CHAIN DISRUPTIONAny disruption in the supply chain, including production and import disruption or the loss of key strategic facilities or services, could result in business interruption and loss of income.
5 ELEVATED GEARINGHistorically, Pepkor maintained very low debt levels, with profits used to finance growth initiatives. High debt levels could potentially limit flexibility and impact decision-making for growth.
6 DAMAGE TO REPUTATION AND BRANDAny event that significantly damages the reputation of the group and/or its brands can negatively impact performance and long-term investor and consumer confidence.
7 DIGITAL DISRUPTIONThe rapid adoption of mobile technology across the African economy is creating a gateway into online retail, accompanied by increased competition (driven by lowered barriers to entry) and the development of the online market for certain classes of products. Customers also expect to find all information about products and brands online, with a clear preference for online services. Market share could potentially be gained by local and global online retailers, at the expense of traditional retailers.
8 REGULATORY CHANGE AND COMPLEXITYOngoing changes result in increased complexity, with non-compliance leading to regulatory sanction, business interruption, financial loss and reputational damage. The introduction of new laws and regulations affects the way Pepkor engages with clients and trains staff and impacts projected revenue targets as the cost of compliance increases.
3 CURRENCY VOLATILITYExchange rate volatility between where the group sources and sells its products could have an impact on retail selling prices. It also influences transport costs (due to fuel increases).
4 EMPLOYEE RETENTION AND ENGAGEMENT RISKSpecialist retail and IT skills remain scarce, while competition in retaining and attracting skilled staff remains concentrated, in South Africa and globally.
PEPKOR INTEGRATED REPORT 2020 23
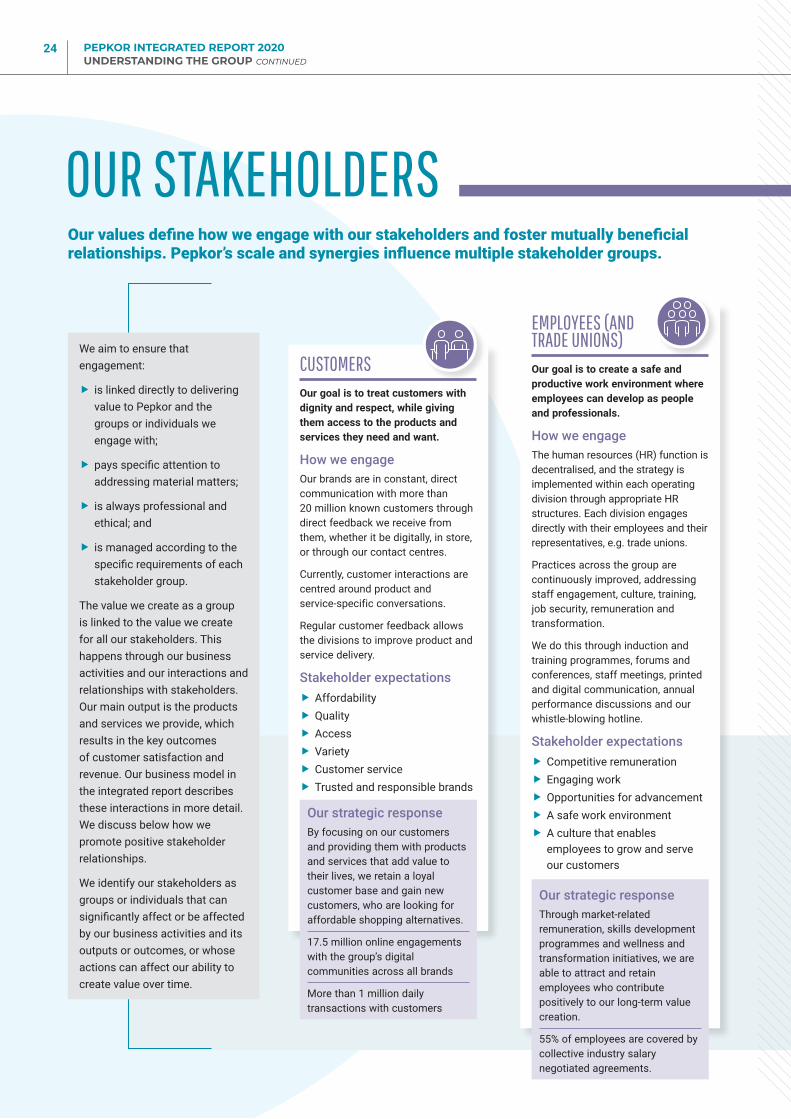
OUR STAKEHOLDERSOur values define how we engage with our stakeholders and foster mutually beneficial relationships. Pepkor’s scale and synergies influence multiple stakeholder groups.
CUSTOMERSOur goal is to treat customers with dignity and respect, while giving them access to the products and services they need and want.
How we engageOur brands are in constant, direct communication with more than 20 million known customers through direct feedback we receive from them, whether it be digitally, in store, or through our contact centres.
Currently, customer interactions are centred around product and service-specific conversations.
Regular customer feedback allows the divisions to improve product and service delivery.
Stakeholder expectations � Affordability � Quality � Access � Variety � Customer service � Trusted and responsible brands
EMPLOYEES (AND TRADE UNIONS)Our goal is to create a safe and productive work environment where employees can develop as people and professionals.
How we engageThe human resources (HR) function is decentralised, and the strategy is implemented within each operating division through appropriate HR structures. Each division engages directly with their employees and their representatives, e.g. trade unions.
Practices across the group are continuously improved, addressing staff engagement, culture, training, job security, remuneration and transformation.
We do this through induction and training programmes, forums and conferences, staff meetings, printed and digital communication, annual performance discussions and our whistle-blowing hotline.
Stakeholder expectations � Competitive remuneration � Engaging work � Opportunities for advancement � A safe work environment � A culture that enables employees to grow and serve our customers
We aim to ensure that engagement:
� is linked directly to delivering value to Pepkor and the groups or individuals we engage with;
� pays specific attention to addressing material matters;
� is always professional and ethical; and
� is managed according to the specific requirements of each stakeholder group.
The value we create as a group is linked to the value we create for all our stakeholders. This happens through our business activities and our interactions and relationships with stakeholders. Our main output is the products and services we provide, which results in the key outcomes of customer satisfaction and revenue. Our business model in the integrated report describes these interactions in more detail. We discuss below how we promote positive stakeholder relationships.
We identify our stakeholders as groups or individuals that can significantly affect or be affected by our business activities and its outputs or outcomes, or whose actions can affect our ability to create value over time.
Our strategic responseBy focusing on our customers and providing them with products and services that add value to their lives, we retain a loyal customer base and gain new customers, who are looking for affordable shopping alternatives.
17.5 million online engagements with the group’s digital communities across all brands
More than 1 million daily transactions with customers
Our strategic responseThrough market-related remuneration, skills development programmes and wellness and transformation initiatives, we are able to attract and retain employees who contribute positively to our long-term value creation.
55% of employees are covered by collective industry salary negotiated agreements.
PEPKOR INTEGRATED REPORT 2020 UNDERSTANDING THE GROUP CONTINUED
24

REGULATORS, LEGISLATORS AND GOVERNING BODIESOur goal is to be ethical in our business practices and to comply with applicable industry, regulatory and legislative requirements.
How we engageRegulators include, inter alia, the JSE Limited and the Prudential Authority. Where and when necessary, appropriate engagement with government, policymakers, legislators and industry regulators takes place.
Stakeholder expectations � Regulatory compliance � Ethical business practices � Participation in national priorities � Continued investment in community upliftment
COMMUNITIESOur goal is to assist communities through various projects that help improve their standard of living.
How we engageDaily interactions with our customers through our store employees create an awareness of the needs of their communities.
Each business chooses the best method of social interaction, and the nature of their connection to local communities.
Stakeholder expectations � Basic products and services � Appropriate social investment
SUPPLIERS AND BUSINESS PARTNERSOur goal is to provide suppliers with the opportunity to deliver on agreed quality and cost standards, building and improving efficiencies along the way.
How we engageSupplier relationships are closely managed by buying and merchandising teams, who have the support of buying agents, authorities, and a central sourcing division.
Pepkor is committed to growing local sourcing, investment and job creation with relevant support from the national government. Pepkor is a signatory of the Department of Trade, Industry and Competition’s South African R-CTFL Master Plan to 2030.
Stakeholder expectations � Consistency and reliability in the way business is conducted
Our strategic responseYears of building relationships with our suppliers and customers have helped us to understand our customers’ needs. We negotiate with suppliers to deliver the best quality products and services at the most affordable prices to satisfy customers’ needs.
We manage our supplier relationships beyond short-term contractual obligations and rather focus on long-term partnerships and collaboration.
SHAREHOLDERS AND INVESTORSOur goal is to deliver on shareholder and investor expectations.
How we engageThe group engages with the investor community annually, through the group’s corporate reporting and JSE-required communication, and periodically, through direct engagement at the group’s AGM and various events, including results and investor presentations. Management continuously engages with investors via meetings and by attending local and international investor conferences.
Stakeholder expectations � Return on investment � Appropriate and accurate disclosure and communication on performance and strategy
� Ethical and responsible business practices for long-term sustainability
Our strategic responseThe group maintains an appropriate level of transparency and consistency in communication and engagement with the investor community.
R7 billion reduction in net debt
Launch of a R10 billion DMTN programme
172.5 million shares issued via an accelerated book-build
Our strategic responseBy ensuring compliance, all stakeholders have confidence in the conduct of the group’s operations.
Due to the impact of the COVID-19 pandemic, interaction with legislators has been of paramount importance to ensure business continuity.
More than 6 000 screens and sanitiser stands were put in place in all offices and retail stores to comply with the COVID-19 regulations.
Our strategic responsePepkor businesses are close to their communities and invest in projects and initiatives that they believe will be most beneficial.
By keeping costs as low as possible, we enable the communities in which we operate to purchase products and use services they might otherwise not be able to access or afford.
R40.7 million invested in community support and upliftment
PEPKOR INTEGRATED REPORT 2020 25

HOW WE CREATE VALUESTRATEGY AND RESOURCE ALLOCATION
OUR CAPITALS AND STAKEHOLDERS INPUTS/OUTPUTS (Performance) OUTCOMES (Impact)SOCIAL AND RELATIONSHIP CAPITAL – All stakeholders
Our relationshipsProduct and service innovation, affordability and accessibility, supplier development, local sourcing, corporate social investment
More than 20 million known customersR40.7 million invested in corporate social investment initiativesImprovement in B-BBEE contributor score to 51.01 points
READ MORE Case studies
Going where our customers need usGroup response to the COVID-19 pandemic
FINANCIAL CAPITAL – Investors, employees and customers
Our fundingGood business practices, trusted corporate governance, shareholder returns, investor confidence, business growth, employee development
R9.2 billion cash generated R6.4 billion total tax contribution 75.4 cents headline earnings per shareR6.9 billion reduction in net debtR10 billion DMTN programme launched
READ MORE
NATURAL CAPITAL – Employees, customers and communities
Our environmentResponsible sourcing, supply chain efficiencies, waste management, recycling, awareness and behaviour
308 856 CO2e tonnes2 600 tonnes of cartons reused
READ MORE Case studies
Shopping bag alternatives
HUMAN CAPITAL – Employees
Our peopleEmployment, opportunity to develop and grow, exposure to retail and supply chain experience, employee support and wellness
R37.9 million spent on training and development73% black female store managers30 666 employees trained
READ MORE Case studies
Three levels of leadership programmesStore manager promotionsPepClo heroes: front-line staff
INTELLECTUAL CAPITAL – Employees, customers and suppliers
Our infrastructureInnovation, intellectual property, retail and supply chain experience, efficient processes, best price leadership, synergies across brands and businesses, governance, brand equity
27.4% cost of doing business24 million cartons distributed annually through supply chain network1.9 million PAXI parcels distributed, leveraging scale through innovation26 Ackermans Woman stand-alone stores 194 000 Flash traders
READ MORE Case studies
Flash/CoCare partnership provides COVID-19 support
MANUFACTURED CAPITAL – Employees, customers and suppliers
Our infrastructureLogistics and technology infrastructure, systems, scale, accessibility through expansive store footprint, mobile technology
234 new stores opened140 000 m2 DC expansion project in Hammarsdale (PEP)R24 million invested in new PepClo facility
READ MORE Case studies
Flip-flops expand into new factoryE-commerce goes livePepClo diversifies during the COVID-19 pandemic
VISION, MISSION AND VALUES
READ MORE p 12
Our material matters, risks and opportunities are identified, addressed and managed at operational level, and reviewed and reported on at group level. READ MORE p 20 – 22
AFFORDABILITY through: • Value for money• Low cost of doing
business
PRICE
PRODUCTS
VARIETY through: • Wanted and needed
products and services• A wide range across
market segments
ACCESSIBILITY through: • Flexible store formats• Physical and digital
channels• Various payment options
CONVENIENCE
Customers
Suppliers
EmployeesCommunities
Our business model
READ MORE Material risks p 23
PEPKOR INTEGRATED REPORT 2020 UNDERSTANDING THE GROUP CONTINUED
26

The outcomes of our business model are delivered through a continuous focus on our stakeholders, with our customers being at the centre of our purpose. We nurture our relationships, and we believe that contributing to our communities is key to maintaining trust in our brands. Although the environment in which we operate might influence the way we do business, it is through our products, services and relationships that we are able to create value.
OUR CAPITALS AND STAKEHOLDERS INPUTS/OUTPUTS (Performance) OUTCOMES (Impact)SOCIAL AND RELATIONSHIP CAPITAL – All stakeholders
Our relationshipsProduct and service innovation, affordability and accessibility, supplier development, local sourcing, corporate social investment
More than 20 million known customersR40.7 million invested in corporate social investment initiativesImprovement in B-BBEE contributor score to 51.01 points
READ MORE Case studies
Going where our customers need usGroup response to the COVID-19 pandemic
FINANCIAL CAPITAL – Investors, employees and customers
Our fundingGood business practices, trusted corporate governance, shareholder returns, investor confidence, business growth, employee development
R9.2 billion cash generated R6.4 billion total tax contribution 75.4 cents headline earnings per shareR6.9 billion reduction in net debtR10 billion DMTN programme launched
READ MORE
NATURAL CAPITAL – Employees, customers and communities
Our environmentResponsible sourcing, supply chain efficiencies, waste management, recycling, awareness and behaviour
308 856 CO2e tonnes2 600 tonnes of cartons reused
READ MORE Case studies
Shopping bag alternatives
HUMAN CAPITAL – Employees
Our peopleEmployment, opportunity to develop and grow, exposure to retail and supply chain experience, employee support and wellness
R37.9 million spent on training and development73% black female store managers30 666 employees trained
READ MORE Case studies
Three levels of leadership programmesStore manager promotionsPepClo heroes: front-line staff
INTELLECTUAL CAPITAL – Employees, customers and suppliers
Our infrastructureInnovation, intellectual property, retail and supply chain experience, efficient processes, best price leadership, synergies across brands and businesses, governance, brand equity
27.4% cost of doing business24 million cartons distributed annually through supply chain network1.9 million PAXI parcels distributed, leveraging scale through innovation26 Ackermans Woman stand-alone stores 194 000 Flash traders
READ MORE Case studies
Flash/CoCare partnership provides COVID-19 support
MANUFACTURED CAPITAL – Employees, customers and suppliers
Our infrastructureLogistics and technology infrastructure, systems, scale, accessibility through expansive store footprint, mobile technology
234 new stores opened140 000 m2 DC expansion project in Hammarsdale (PEP)R24 million invested in new PepClo facility
READ MORE Case studies
Flip-flops expand into new factoryE-commerce goes livePepClo diversifies during the COVID-19 pandemic
Our purpose comes to life and our strategy is implemented in our operational divisions through relevant and applicable activities and focus areas.
Investment is made at operational level and outcomes are measured against each divisional strategy Corporate social responsibility report
Clothing and general merchandise
� PEP
� PEP Africa
� Ackermans
� Pepkor Speciality
Furniture, appliances and electronics
� JD Group
� Abacus
FinTech
� Flash
� Capfin
Building materials (discontinued operations)
� The Building Company
READ MOREOperational review from p 44
CEO’s report – p 6CFO’s report – p 38
READ MORE Operational review from p 44
PEPKOR INTEGRATED REPORT 2020 27

STRATEGIC DIRECTION The board sets Pepkor’s strategic direction and purpose, and delegates to management responsibility for formulating strategy implementation in the short, medium and long term. Successful implementation of strategy, as a key responsibility of the board and management, is in the best interest of all stakeholders as it ensures superior operational performance.
REPORTING TO STAKEHOLDERS The board accepts its duty to present a balanced and understandable assessment of the group’s position when reporting to stakeholders.
ASSURANCE The board acknowledges that it cannot operate effectively without confidence in the information placed before it. The audit and risk committee provides oversight of direct assurance services and functions, as delegated by the board, to ensure the integrity of information used in decision-making.
RISK MANAGEMENT The group continuously embeds risk management throughout its business activities and decision-making processes at all levels.
HOW WE GOVERN
Good governance is a vital enabler of value creation at Pepkor. Sound corporate governance creates a solid foundation on which the sustainability of the group is founded. It instils a culture that attracts and retains employees, provides consumer confidence in the group’s brands, operations, products and services, and provides all stakeholders with confidence, thereby enhancing long-term growth in the company’s share price. The board recognises that the ethical culture of the group has an enduring impact on the value creation process over time. With a substantial number of retail stores in several countries, although primarily in southern Africa, the group also acknowledges the need to add value to the communities in which it operates through corporate responsibility initiatives.
Pepkor’s decades-long history as a private company allowed the formation of its strong, customer-centric corporate culture. Pepkor’s values were forged by employees, suppliers, customers and key stakeholders. The board and the CEO, supported by his executive leadership team, are responsible for upholding good corporate governance and safeguard the innate sense of ethics within Pepkor’s culture that is at heart of the company’s longevity. Listing on the JSE further strengthened Pepkor’s governance, since the board and executive management team have prioritised the adoption and implementation of governance policies and practices to meet JSE Listings Requirements.
Structures that ensure good governancePepkor’s values are underpinned by the governance framework set out in the board charter, the terms of reference of the committees of the board, the code of ethics, as well as policies and procedures.The board leads by example, collectively instilling and nurturing a group culture rooted in the Pepkor code of ethics. The code reflects the core principles of Pepkor’s philosophy and embodies the belief that ethical behaviour is good for business. The code is complemented by a number of corporate compliance policies, which provide more detailed guidelines on specific issues.
Good governance in action
READ MORE Corporate governance report
PEPKOR INTEGRATED REPORT 2020 UNDERSTANDING THE GROUP CONTINUED
28

HUMAN RESOURCE MANAGEMENT AND REMUNERATION The board, through the human resources and remuneration committee, sets the policy, direction and approach for remuneration.
GOVERNANCE BEYOND COMPLIANCE While the board is unwavering in its adherence to legislation and various codes and standards, its commitment to good governance goes beyond compliance.
ENHANCING VALUE CREATION THROUGH TECHNOLOGY The use of technology and the implementation of systems and infrastructure provide a competitive advantage and enhance efficiencies across the group. The board is mindful of the use of technology and the increased exposure to risks it may bring. The board, through the audit and risk committee, monitors the ethical and responsible usage of technology and information to ensure the safety of any personal or sensitive information obtained.
Individual contributions, collective resultsDecisions and actions of the board embody fairness, responsibility, accountability and transparency. By setting the tone at the top, the board ensures that a culture of robust governance filters down through the organisation.
The board’s response in a time of crisis – the COVID-19 pandemic In response to unpredictable and evolving circumstances brought on by the COVID-19 pandemic, the Pepkor board has adopted a highly active oversight role to support management. The board has addressed a range of complex issues focused primarily on the safety of our employees and on ensuring the survival of the company’s businesses, through necessary weekly, extraordinary board meetings for the duration of lockdown level 5. Pepkor was able to address all issues in a manner that enabled the group to face these challenges successfully as is outlined in this integrated report.
Challenges arising from the COVID-19 pandemic dominated the board’s agenda from March until year-end and will continue to be relevant in the future. In this time, the board considered how best to protect the values on which the group has been built, despite the unprecedented circumstances.
Decisions and actions of the board and executive management are underpinned by Pepkor’s values and driven by the group’s ultimate purpose: To make a positive difference in the lives of our customers.
READ MORE Corporate social responsibility report: Group response to the COVID-19 pandemic p 9
PEPKOR INTEGRATED REPORT 2020 29

Independent non-executive directors 4Non-executive directors 4Executive directors 2
Independence
Black 3 White 7 Female 2 Male 8
Board diversity
Scheduled board meetings 4 Extraordinary board meetings 9
Active participation
Audit and risk committee
Human resources and remuneration
committee
Nomination committee
Social and ethics committee
Pepkor board of directors
Company secretary
GOVERNANCE STRUCTURE
PEPKOR INTEGRATED REPORT 2020 UNDERSTANDING THE GROUP CONTINUED
30

BOARD OF DIRECTORS
Executive Independent non-executive Non-executive
2 / JOHANN CILLIERS (61) BAcc (Cum laude), BAcc Hons, CA(SA)
LEAD INDEPENDENT NON-EXECUTIVE DIRECTOR
Johann was appointed lead independent non-executive director of Pepkor on 29 May 2018, following his initial appointment to the Pepkor board on 18 August 2017. Johann completed his articles at PwC in 1988, following which he was appointed as financial director of Hicor Limited. In 1990, he joined Langeberg Foods Limited as group financial manager, serving on the board from 1991 to 1998 as financial director. In 1998, Johann joined PEP SA as director of operations and as an executive director. In 2004, he was appointed as an executive director of Pepkor Retail Limited and, until 2011, served on the group executive committee in various capacities. In 2011, he relinquished his executive role within the Pepkor group and was appointed as a non-executive director of Pepkor Holdings Proprietary Limited, which non-executive position he held until 2015. Johann currently manages various private investments.
• Chairman of the audit and risk committee• Member of the nomination committee
3 / LEON LOURENS (54) HND (Human Resources), BCom (Marketing)
CHIEF EXECUTIVE OFFICER
Leon was appointed as group chief executive officer on 6 December 2017. He completed a Higher National Diploma in Human Resources in 1987, before attaining a BCom degree in Marketing (Unisa) in 1994. He joined PEP in 1990. In 2000, he joined the supermarket group Panda in the Middle East as head of operations before returning to PEP in 2002. He was appointed as operations director in 2004, and became managing director of PEP SA in 2011. In 2016, Leon was appointed as Group MD: Pepkor Africa and he became chief operating officer of Pepkor Holdings at its listing on 20 September 2017. He has more than 28 years’ experience in retail, primarily from store operations in the discount sector of the market. Leon serves as a director on a number of subsidiary boards in the Pepkor group.
• Member of the social and ethics committee
1 / WENDY LUHABE (63) BCom
INDEPENDENT NON-EXECUTIVE Chairman
Wendy was appointed as an independent non-executive director on 1 January 2019, and as chairman of the company on 1 December 2020. Wendy started her career in marketing 38 years ago and worked in the cosmetics and automotive sectors, which included working in Germany and the United States of America. She graduated with a BCom in 1981 and currently has a portfolio of interests that includes investments in education and infrastructure development. Wendy has been a pioneer in social entrepreneurship over the past 26 years and has been involved in human capital development, the economic empowerment of women, and mentorship of younger generations. She pioneered the founding of WIPHOLD, WPEF and, more recently, WINDE. Wendy is passionate about education, leadership, economic justice and mentorship. She has served as a non-executive director/chairman of companies across diverse industries since 1992. She is a recipient of four honorary doctorates for her contribution to the empowerment of women in various sectors of the economy. Wendy was the founding Chancellor of the University of Johannesburg. Wendy serves as chairman of Libstar Holdings Limited and as non-executive director of Compagnie Financière Richemont SA.
• Member of the social and ethics committee• Member of the human resources and remuneration committee (appointed 20 November 2020)
PEPKOR INTEGRATED REPORT 2020 31

Executive Independent non-executive Non-executive
BOARD OF DIRECTORS CONTINUED
5 / STEVE MÜLLER (59) BAcc, BAcc (Hons), CA(SA), Sanlam EDP, IoD
INDEPENDENT NON-EXECUTIVE DIRECTOR
Steve was appointed as an independent non-executive director on 18 August 2017. Steve worked at KPMG until 1992, after which he worked as a senior manager at Rand Merchant Bank Limited until 1994. In 1995, he joined Genbel Investments Limited, inter alia as an executive director of Gensec Bank Limited, heading the Investment Banking division from 1999 to 2004. From 2004 to 2008, he managed various structured equity funds for Sanlam Capital Markets. He has been appointed as a non-executive director on the boards of several companies. Steve was appointed as an independent non-executive director of KAP Industrial Holdings Limited in 2012. He has chaired or served on the audit and risk committees and the human resources and remuneration committees of several companies over the last 23 years.
• Chairman of the human resources and remuneration committee• Member of the audit and risk committee
6 / FAGMEEDAH PETERSEN-COOK (45) BBusSc (Act.Sc.), FIFoA, FASSA, PGDip (MgtPrac), CD(SA), IoDSA (Cert.Dir.)
INDEPENDENT NON-EXECUTIVE DIRECTOR
Fagmeedah was appointed as an independent non-executive director on 16 April 2018. Fagmeedah is an actuary with 24 years’ technical experience in the financial services sector. Until 2016, she was the chief investment officer at the Eskom Pension and Provident Fund (EPPF), where she was responsible for the investment of R120 billion. Fagmeedah was appointed to the board of the Government Employees Pension Fund (GEPF) to bring her expertise to the oversight of the investment activity of the PIC. In 2012, she was appointed as member of the board of Telkom, where she chaired the investment committee while she was the acting CIO of the Eskom Pension Fund. She is an independent director of Absa Financial Services, chairs the investment committee of the Absa Pension Fund, and also serves as chairman of the Bankmed audit committee. As an actuary, Fagmeedah brings enterprise risk management skills and multigenerational planning techniques to the boardroom. She strongly believes in sustainability and was instrumental in developing the framework for the implementation of the UN PRI at both the GEPF and the EPPF, and now champions ESG principles at the various companies where she is involved. Fagmeedah is the FSCA-designated insurance director for the group.
• Chairman of the social and ethics committee• Member of the audit and risk committee
4 / RIAAN HANEKOM (51) BAcc, BCom Hons (Acc), CA(SA)
CHIEF FINANCIAL OFFICER
Riaan was appointed as group chief financial officer on 18 August 2017. He completed his articles with Ernst & Young in 1995, whereafter he spent six years with Shoprite as a financial manager. He joined Woolworths in 2001, and was the Woolworths retail operations group head of finance and administration when he joined the Pepkor group in 2006, as commercial director of Shoe City. He became the commercial director of Ackermans in 2008, and financial director of Ackermans in 2009. He was appointed as the group financial director of the Pepkor group in February 2016. Riaan serves as a director on a number of subsidiary boards in the Pepkor group.
PEPKOR INTEGRATED REPORT 2020 UNDERSTANDING THE GROUP CONTINUED
32

7 / THEODORE DE KLERK (50) BCom (Hons), CTA, HDip (Tax), CFM
NON-EXECUTIVE DIRECTOR
Theodore was appointed as a non-executive director on 28 May 2019. He completed his articles with Ernst & Young and worked as a corporate tax consultant for four years. He joined Murray & Roberts as financial director of its marine construction operation. He spent five years with Gensec Investment Bank as part of its corporate finance advisory unit, focusing on mergers and acquisitions, capital raisings and related structuring functions. In 2003, he joined Steinhoff, and in 2008 he was appointed chief executive officer of the group’s southern African building materials division, a position he held until 2015. He was appointed financial director of Steinhoff International Holdings N.V. on 1 September 2019. Theodore holds various directorships within the Steinhoff group and is also a director of the IEP Group.
8 / LOUIS DU PREEZ (51) BCom, LLB
NON-EXECUTIVE DIRECTOR
Louis was appointed as a non-executive director on 24 January 2018. He qualified as an attorney of the High Court of South Africa in 1997. Louis joined Jan S de Villiers and was appointed a partner of the firm in 1998. With the merger of Werksmans Attorneys in 2009, he became a member of the national executive committee of the combined firm and served on that committee until early 2017. While practising as an attorney, he advised clients on a variety of corporate and commercial matters. Louis served on the board of KAP Industrial Holdings Limited from 1 October 2017 until 3 April 2019, as a non-executive director. He joined the Steinhoff group as general counsel in mid-2017, was appointed as the commercial director of Steinhoff International Holdings N.V. on 19 December 2017, and as chief executive officer of Steinhoff International Holdings N.V. with effect from 1 January 2019
• Member of the human resources and remuneration committee• Member of the nomination committee
10 / JACOB WIESE (40) BA (US), MA International Economics & Management (Università Commerciale Luigi Bocconi, Italy), LLB (UCT)
NON-EXECUTIVE DIRECTOR
Jacob was appointed as a non-executive director on 18 August 2017. After completing his LLB at UCT in 2008 and his pupillage at the Cape Bar, Jacob was admitted as an advocate of the High Court of South Africa in 2009. He joined the investment committee of the Titan Group in 2010. Jacob is an independent non-executive director of Fairvest Property Holdings Limited and serves on the boards as an alternate or non-executive director of various publicly listed companies, which include Shoprite Holdings, Invicta Holdings and Tradehold. Jacob is also extensively involved in the management of Lourensford Wine Estate. Jacob notified the board on 18 December 2020 that he will not make himself available for re-election and will therefore retire from the board on 10 March 2021.
9 / JAYENDRA NAIDOO (60) BProc
NON-EXECUTIVE DIRECTOR
Jayendra was appointed as chairman on 18 August 2017, and fulfilled this role until 30 November 2020. Jayendra is a non-executive director of the company. As a full-time trade unionist in his youth, he played a significant role in the negotiation of the National Peace Accord in 1991, as well as in the establishment of a network of peace committees throughout South Africa. In 1995, he was appointed the first executive director of NEDLAC, serving until 1998. In 2000, he co-founded the J&J Group and he is the founder of the Lancaster Group. Jayendra has served on several committees and boards, including the board of Pepkor Holdings Proprietary Limited as a non-executive director between 2003 and 2011. In 1997, Jayendra was nominated by the World Economic Forum as a Global Leader of Tomorrow. Jayendra notified the board of his resignation as non-executive director on 20 January 2021 which is effective on 1 February 2021.
• Chairman of the nomination committee• Member of the human resources and remuneration committee
PEPKOR INTEGRATED REPORT 2020 33

HOW WE REWARDThe group’s remuneration philosophy seeks to serve stakeholder interests by supporting sustainable growth.
Our remuneration policy and philosophyRemuneration is governed by the Pepkor board, with the human resources and remuneration committee (Remcom) mandated to oversee that the group remunerates employees fairly, responsibly and transparently, in a manner that promotes the achievement of strategic objectives and positive outcomes.
The group remuneration policy and philosophy are designed to achieve this, and its effectiveness is reviewed annually by the Remcom. The Remcom is satisfied that the remuneration policy achieved its primary objectives in FY20.
Divisional remuneration policies collectively make up the group’s remuneration policy and are required to conform to and fit within a fair and approved remuneration policy framework.
OUR POLICY AND PHILOSOPHY: � originate from our purpose to make a positive difference in the lives of our customers;
� seek to serve shareholder interests by supporting sustainable growth;
� are reviewed once a year by the Remcom; and
� are adopted by each operating division, which has its own remuneration committee and policies, reflecting our decentralised operating structure.
How our remuneration policy and philosophy support value creation
We aim to position ourselves in the market to ensure we attract, motivate and retain key and critical talent. We achieve this by applying appropriate remuneration structures across all employee levels, as well as within our various group-level entities, ensuring that the correct balance between guaranteed pay, and short- and long-term incentives is achieved.
92.61% voted in favour of the remuneration policy
90.15% voted in favour of the implementation report
Shareholder engagementPepkor continued its engagement with shareholders on the topic of remuneration and we have made progress on our journey to enhance our remuneration policy and related disclosures.
At Pepkor’s third annual general meeting held on 11 March 2020, the group’s remuneration policy and implementation report were tabled for non-binding advisory shareholder votes, with the following results:
READ MORE
Our re
mun
erat
ion
policy and philosophy support val ue creation THEIR
BUSINESSES GROW
OUR GROUP GROWS
WHEN OUR PEOPLE GROW
Our stakeholders p 24
PEPKOR INTEGRATED REPORT 2020 UNDERSTANDING THE GROUP CONTINUED
34

How we rewardedguaranteed pay in FY20
GUARANTEED PAY AND BENEFITS SHORT-TERM INCENTIVES LONG-TERM INCENTIVES
We aim to attract, motivate and retain key and critical talent through:
THE COVID-19 PANDEMIC During the national lockdown, Pepkor aimed to remunerate all employees in operations and support functions by using different measures and relief options. The Remcom assessed the current remuneration policy to ensure that it remains effective in motivating employees to drive the right performance in the current operating environment to protect, sustain and grow performance of the group. As a result, changes were made to the incentives. These are described in more detail in the remuneration report.
READ MORE Remuneration report
Executive directors – Total single figure remuneration
99.0
Total paid (Rm)
27 233
23 642
FY19 FY20
-13%
Non-executive directors – fees paid
Total paid (Rm)
9 813
8 730
2019 2020
-11%
Salary benchmarking is based on two reputable salary surveys in South Africa. The Pepkor group utilises the services of REMchannel (previously PwC) and PE Corporate Services (Willis Towers Watson).
Salary increases awarded in 2020 and applicable to FY21 include:
� CEO guaranteed package increased 0% � CFO guaranteed package increased 3% � Pepkor executive management guaranteed package increased 1.6% on average
� General increase for operational, logistics and administrative support staff increased between 0.0% and 4.5%
The Remcom has identified the following areas that will be considered in FY21 to ensure alignment and compliance:
� Continue to look for mutually beneficial opportunities with regard to remuneration and benefits across the group and leverage the scale of the group.
� Drive greater standardisation with regard to STI structures across the group and continue to align the grading system.
� Monitor the application of equal pay for work of equal value to ensure equity is maintained within Pepkor and how this speaks to fair and responsible remuneration for executive directors and the executive team compared to employee remuneration.
FOCUS AREAS IN FY21
PEPKOR INTEGRATED REPORT 2020 35

PEPKOR INTEGRATED REPORT 202036
IN THIS SECTION
GROUP PERFORMANCE
Affordability. We make our products and services as affordable as possible.
Market share grew as the need for products and services at affordable prices became important to consumers.
Omnichannel is a focus area for growth.
Flash transformed into a full tech company with a mission to create new transaction economies.
Clothing and general merchandise pages 44 – 57
Furniture, appliances and electronics pages 58 – 61
FinTech pages 62 – 67

ASHLEIGH HENDRICKS, Ackermans customer
‘I shop for my little brother and my daughter. She is now two years old. This is the only
place where I can get the quality I want at this price, especially with kids
growing so fast.’
PEPKOR INTEGRATED REPORT 2020 37

PEPKOR INTEGRATED REPORT 2020 GROUP PERFORMANCE CONTINUED
38
CHIEF FINANCIAL OFFICER’S REPORTThe group successfully navigated the COVID-19 pandemic from a financial perspective, as the resilience of our business model was tested. The year under review highlighted the importance of balance sheet efficiency and flexibility, and the group closed the year in a substantially stronger position than a year ago.
The comparability of Pepkor’s statutory results is inhibited by the implementation of IFRS 16. To provide a meaningful assessment of group performance, the commentary that follows excludes the impact of the adoption of IFRS 16.
Pepkor’s balance sheet was substantially strengthened during the year.
Adoption of IFRS 16: Leases The group adopted IFRS 16: Leases (IFRS 16) on 1 October 2019, using the modified retrospective approach with no restatement of the prior year’s reported results. This had a material impact on the group’s statutory results for the current year, reducing headline earnings from continuing operations by R452 million and headline earnings per share from continuing operations by 17%, or 12.8 cents.
Leases were capitalised on 1 October 2019, resulting in the recognition of a right-of-use asset of R10.8 billion and a lease liability of R15.1 billion at 30 September 2020. The right-of-use asset was impaired by R235 million during the year. Refer to the annual financial statements for further details.
READ MORE
Audited annual financial statementsPro forma financial information p 83

Segment/businessType of credit offered
Credit sales contribution
Clothing and general merchandise 7%PEP None 0%Ackermans Revolving credit 17%PEP Africa None 0%Speciality Revolving credit 10%
JD Group 13%Furniture division Instalment sales 20%Consumer electronics and appliances division Instalment sales 5%
Pepkor 7%
Note: Capfin is not a sales enabler and is therefore not included above.
The clothing and general merchandise segment reported an increase in revenue of 1.4% to R45.6 billion for the year. This includes revenue growth of 12.1% during the fourth quarter, recovering from a 15.9% decline reported during the third quarter.
The furniture, appliances and electronics segment reported revenue growth of 1.4% to R9.5 billion for the year. Merchandise sales for the year decreased by 0.4%, with a decrease of 1.6% in like-for-like sales.
The FinTech segment reported revenue growth of 20.4% to R8.6 billion for the year.
Results from continuing operations RevenueDespite having lost approximately R5.0 billion in revenue through the COVID-19 trading restrictions, the group managed to achieve positive revenue growth for the year, which is an outstanding result. Group revenue increased by 3.6% to R63.7 billion compared to R61.5 billion in the prior financial year ended 30 September 2019 (FY19).
The group generates 85% of its sales in cash, with lay-bys contributing 8% to total sales. Credit remains a small enabler of sales, contributing 7% to the total sales mix.
Total sales mix
Cash
85%Lay-bys
8%Credit
7%
Segmental revenue contribution from continuing operations
Furniture, appliancesand electronics
15%FinTech
13%
Clothing andgeneral merchandisePEP and Ackermans
86%PEP Africa
4%
Speciality
10%
Clothing and generalmerchandise
72%
PEPKOR INTEGRATED REPORT 2020 39

PEPKOR INTEGRATED REPORT 2020 GROUP PERFORMANCE CONTINUED
40
Gross marginsGross profit margins reduced to 35.3% from 36.4% due to a shift in product mix with a higher contribution of financial services and cellular products. Markdowns were maintained on a like-for-like basis with better than expected sales performance, while store closures resulted in liquidation of inventory. A disciplined approach to maintaining consistent inflow margins on clothing, footwear and homeware merchandise across the majority of Pepkor businesses underpins long-term stability in the group’s gross margins.
Other incomeOther income reduced by 17.1% to R735 million, primarily as a result of external loan distribution fees that are no longer earned since the establishment of the Capfin internally funded credit book. Commissions earned on bill payments and money transfers initially suffered as a result of stores not being able to trade during the lockdown period and fewer customers visiting stores. Positive signs of recovery have since been reported.
Operating costsOperating costs, excluding debtors’ costs, increased by 3.4% despite additional COVID-19-related expenses incurred to the value of R92 million.
Cost savings of approximately R700 million compared to budget were achieved, with savings on property rental and employment costs being the biggest contributors. The group continues to operate at the lowest cost of doing business in the market.
Debtors’ costs increased by 48.3% to R1.7 billion as a result of increased credit book provision levels and bad debts. A conservative approach was applied in credit book provision levels in anticipation of a deterioration in the credit health of consumers, notwithstanding collection levels exceeding initial expectations. Provision levels on the Tenacity credit book, which facilitates credit sales in Ackermans and Speciality, were increased to 22% (FY19: 17%), while provision levels on the Connect credit book, which facilitates sales in the JD Group, increased to 42% (FY19: 33%). Provision levels on the Capfin unsecured lending credit book were increased to 26% (FY19: 15%).
LINK TO OUR MATERIAL MATTERS Maintaining a low cost of doing business p 21
Operating profitOperating profit (before capital items) decreased by 18.4% to R5.3 billion.
The clothing and general merchandise segment contributed more than 97% to the group’s operating profit in FY20 and decreased by 15.6% to R5.2 billion, impacted by lost sales and increased debtors’ costs.
An operating loss of R301 million was reported by the furniture, appliances and electronics segment and was impacted by increased debtors’ costs.
The FinTech segment operating profit decreased by 5.6% to R455 million and was impacted by higher debtors’ costs levels in the Capfin unsecured lending business.
Net finance costs and net debtNet finance costs reduced by 13.3% to R1.4 billion due to lower debt levels and interest rate reductions.
TaxationPepkor’s effective tax rate for the year was significantly impacted by the impairment of goodwill and intangibles, which are not tax deductible.
EarningsEarnings were impacted by the impairment of goodwill and intangible assets of R4.8 billion. The impairment is a result of constrained future growth expectations in PEP Africa, Shoe City, Tekkie Town and Incredible Connection, in addition to an increase in the weighted average cost of capital. This resulted in a loss per share of 62.5 cents, while headline earnings per share reduced by 21.0% to 75.4 cents. The impairment is excluded from headline earnings from continuing operations, as prescribed by Circular 1/2019 – Headline Earnings as issued by the South African Institute of Chartered Accountants (SAICA).
Cash generationCash generated by operations (excluding discontinued operations) amounted to R9.2 billion based on very strong trading, resulting in a cash conversion rate of 136%.
Working capitalThe strong trading levels following the relaxation of lockdown measures in combination with reduced merchandise inflows in anticipation of lower consumer demand levels resulted in a reduction in inventory levels of 13.2% to R10.7 billion (excluding discontinued operations in both years). The unprecedented levels of inventory productivity and freshness achieved as a result of this is not considered sustainable, although it provided many learnings to merchandising teams.
Capital expenditureCapital expenditure in continuing operations reduced by 23.5% from the prior year to R1.3 billion in the current year. This excludes land purchased in Hammarsdale for the development of a new PEP distribution centre. The land will be sold to an external developer for development of the distribution centre. It is expected that capital expenditure in FY21 will be similar, as capital allocation continues to be deployed where returns are maximised.
The group’s conservative approach to consumer credit resulted in reduced credit granting early in FY20 and was further curtailed at the onset of COVID-19. This, in addition to good post-lockdown collections, resulted in a total reduction of R1.1 billion in the gross size of all credit books since 31 March 2020.
LINK TO OUR MATERIAL MATTERS Allocating capital effectively and optimising gearing levels p 22
CHIEF FINANCIAL OFFICER’S REPORT CONTINUED

The Tenacity credit book reduced to R3.0 billion; the Connect credit book to R1.6 billion; and the Capfin credit book to R1.9 billion at 30 September 2020.
Net debtThe group reduced net debt from R14.1 billion at 31 March 2020 to R7.1 billion at 30 September 2020 (excluding the adoption of IFRS 16).
This was facilitated by strong cash generation and good credit book collections, in addition to the accelerated book-build completed in June 2020, which raised R1.9 billion and resulted in the issue of 172.5 million new Pepkor shares on 29 June 2020.
The debt reduction included the early settlement of the R1.5 billion bridge term loan facility and early settlement of R4.0 billion of the total R6.0 billion preference share funding that was due to mature in May 2022. The group’s debt repayment profile benefited from the refinancing and extension of R6.0 billion in debt, which is now repayable or expiring in September 2023. Debt covenants have been amended to create sufficient headroom and enhanced flexibility going forward. The contractual net debt-to-EBITDA ratio of 1.02 times and interest cover ratio of 5.38 times remain well within funding covenants.
Pepkor was successful in the launch of its R10 billion DMTN programme in March 2020. The group raised R1 billion in three- and five-year bonds issued on 10 March 2020 at favourable interest rates. The proceeds were used to reduce debt and diversify its sources of funding.
On 27 November 2020, Moody’s affirmed Pepkor’s Ba3 global scale long-term rating and repositioned the national scale long-term rating assigned to Pepkor to A2.za from A3.za. This reflects an improved national scale credit rating.
LINK TO OUR MATERIAL MATTERS Allocating capital effectively and optimising gearing levels p 22
Discontinued operations As announced on 4 August 2020 via SENS, the group’s portfolio strategy and intention to increase focus on its core business resulted in the decision to dispose of The Building
Company. Pepkor’s building materials reporting segment, in its entirety, is therefore classified as a discontinued operation in the group’s 2020 financial results. Completion of the transaction is subject to approval by the Competition Commission and is expected to be concluded during the first half of the 2021 financial year.
The Building Company reported a decline in sales of 12.6% and a decrease in like-for-like sales of 11.3% for the year due to the inactivity and contraction of the construction industry as a result of the COVID-19 pandemic. Despite a very challenging environment, the business achieved break-even.
Discontinued operations further include PEP Africa’s operations in Zimbabwe following the decision in the prior year to exit the country. The exit from Zimbabwe was concluded on 30 September 2020.
DividendAs communicated during the group’s interim results published on 27 May 2020, no dividend was declared, based on heightened levels of prudence applied by the board and the focus on liquidity preservation and allocation of resources.
Outlook The Pepkor group faces FY21 with a substantially strengthened financial position and capital structure. This will support performance in a potentially constrained operating environment. The group’s focus on providing value to customers will further support performance.
AppreciationI would like to thank the Pepkor executive team and board for their commitment and continued support.
RIAAN HANEKOM Chief financial officer
Gross book size development (Rm)
2.8
3.1
FY19 H1FY20*
3.0
FY20
1.5
1.8
FY19 H1FY20*
1.6
FY20
2.2
2.6
FY19 H1FY20*
1.9
FY20* Six months ended 31 March 2020.
PEPKOR INTEGRATED REPORT 2020 41
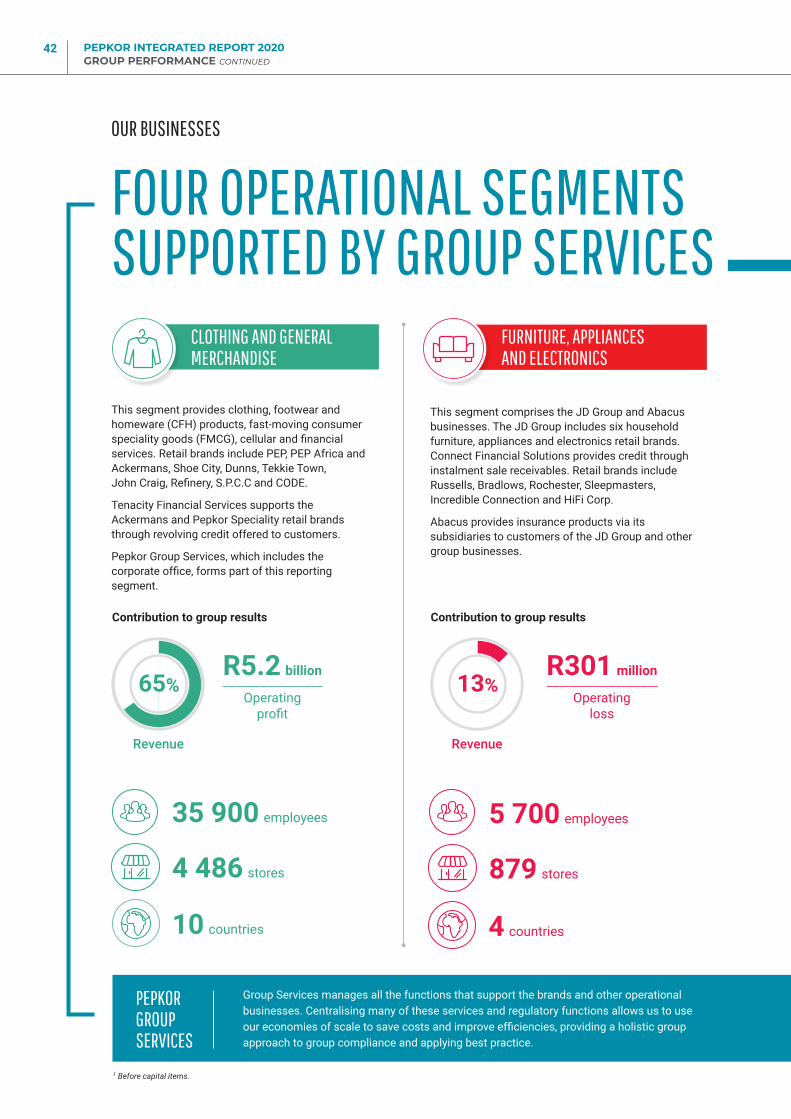
PEPKOR INTEGRATED REPORT 2020 GROUP PERFORMANCE CONTINUED
42
OUR BUSINESSES
FOUR OPERATIONAL SEGMENTS SUPPORTED BY GROUP SERVICES
CLOTHING AND GENERAL MERCHANDISE
FURNITURE, APPLIANCES AND ELECTRONICS
1 Before capital items.
This segment provides clothing, footwear and homeware (CFH) products, fast-moving consumer speciality goods (FMCG), cellular and financial services. Retail brands include PEP, PEP Africa and Ackermans, Shoe City, Dunns, Tekkie Town, John Craig, Refinery, S.P.C.C and CODE.
Tenacity Financial Services supports the Ackermans and Pepkor Speciality retail brands through revolving credit offered to customers.
Pepkor Group Services, which includes the corporate office, forms part of this reporting segment.
This segment comprises the JD Group and Abacus businesses. The JD Group includes six household furniture, appliances and electronics retail brands. Connect Financial Solutions provides credit through instalment sale receivables. Retail brands include Russells, Bradlows, Rochester, Sleepmasters, Incredible Connection and HiFi Corp.
Abacus provides insurance products via its subsidiaries to customers of the JD Group and other group businesses.
35 900 employees
4 486 stores
10 countries
5 700 employees
879 stores
4 countries
R301 million
Operating loss
Contribution to group results
65%
Revenue
88%
Operating profit1
Contribution to group results
13%
Revenue
R5.2 billion
Operating profit
PEPKOR GROUP SERVICES
Group Services manages all the functions that support the brands and other operational businesses. Centralising many of these services and regulatory functions allows us to use our economies of scale to save costs and improve efficiencies, providing a holistic group approach to group compliance and applying best practice.

OUR BUSINESSES
FOUR OPERATIONAL SEGMENTS SUPPORTED BY GROUP SERVICES
Our retail brands serve customers in the discount, value and specialist value retail market, which includes the vast majority of the southern African population.
FINTECH BUILDING MATERIALS Discontinued operations
The Building Company (TBCo) comprises this segment. The business operates across three divisions, which include more than 10 established and well-known brands that provide and distribute products for the building industry. Brands include BUCO, Timbercity, Chipbase, MacNeil, Cachet, Citiwood, Brands4Africa, Buchel, W&B Hardware, Bildware, B-One, Tiletoria and Floors Direct.
This segment includes businesses that provide virtual products and services to customers in the informal sector through digital technology to make their lives easier. In many instances, these businesses leverage other Pepkor retail channels, including the store footprint, but do not enable sales in any of the Pepkor retail brands. Flash and Capfin are included in this segment.
1 500 employees
194 000 Flash traders
5 countries (Flash) 2 countries
5 500 employees
115 stores
Contribution to group results
12%
Revenue
10%
Operating profit1
Contribution to group results
10%
Revenue
Break-even achieved
R455 million
Operating profit
PEPKOR INTEGRATED REPORT 2020 43

PEPKOR INTEGRATED REPORT 2020 GROUP PERFORMANCE CONTINUED
44
PEP’S PROXIMITY TO CUSTOMERS SUPPORTED SALES
CLOTHING AND GENERAL MERCHANDISE: PEP
IntroductionPEP’s customers are remarkable people who, on a very small budget, make it possible for their families to live with dignity and pride. PEP is positioned in the discount market segment to serve consumers predominantly in the lower- to mid-Socio-Economic Measure (SEM) clusters. These clusters are sensitive to increased living costs, which negatively impact their spending power. PEP provides them with non-discretionary, everyday products and services to make their lives easier.
Products and servicesClothing, footwear and homeware products, cellular and airtime products, fast-moving consumer goods, pay-TV decoders and a range of value-added services, including selected bill payments (such as DStv), Flash tokens, 1ForYou vouchers, cross-border and local money transfers, PAXI parcel delivery service, cash-backs, Capfin loan applications, and funeral insurance.
Strategy and approachPEP’s purpose is to make it possible for its customers to look and feel good. It provides them with products and services they can afford in stores that are close to where they live. This promise has positioned PEP as a trusted brand for 55 years.
Its performance is measured against its strategy of:
� Being the best price leader in its category: To provide customers with the ‘best products for less’ is a key performance indicator (KPI) and the whole business is centred around this customer value proposition. PEP maintains product margins through operational efficiencies and passes pricing benefits on to customers. Prices are benchmarked periodically to ensure that BPL is maintained.
� Providing the right assortment: PEP provides everyday products and services that people need. Scale, years of retail experience and a deep understanding of its customers give PEP the advantage to effectively source and sell the right product at the right price. 32460 - S20 - CF - WK 5 - SHARING SUMMER - RBUP 1 -CFALCF4161- v4.indd 132460 - S20 - CF - WK 5 - SHARING SUMMER - RBUP 1 -CFALCF4161- v4.indd 1 2020/11/17 12:132020/11/17 12:13
OUR PEP BRANDS
PEP customers stay loyal to the brand because its consistent ‘best products for less’ promise has not changed since 1965.

5 countries
16 500 employees
� Proximity to customers: PEP understands that not all customers have access to stores, the means to afford transport or e-commerce. PEP remains invested in its extensive store footprint, bringing its wide range of products and additional services closer to our customers.
Performance overviewPEP’s success during the year can be attributed to its defensive market positioning and being a trusted brand to provide the lowest possible prices to customers on basic and essential products and services. Price leadership was maintained with BPL of 97%, in addition to a positive price differential of 28% compared to other retailers.
The national lockdown and closure of stores resulted in pent-up demand from customers, driving very strong sales performance once stores reopened. While customers benefited from government support in the form of COVID-19-related SASSA grants, it is expected that consumer affordability will come under strain as unemployment increases. Customers are expected to reprioritise their spending, and PEP achieved significant market share gains during the second half of the financial year.
The store footprint increased to 2 384 stores with 83 new store openings during the year. PEP’s close proximity to customers supported performance, as customers chose to shop closer to home and less frequently. This resulted in fewer transactions but increased basket sizes.
PEP’s unique culture, Sikhula KunYe (growing together), underpinned the brand’s ability to respond to the COVID-19 pandemic and to continue driving its purpose. The PEP brand was refreshed as part of a process started two years ago. The update is more than a logo update; it reflects the brand’s positioning as the discount leader which, over recent years, has shown its appeal to a wider customer base. The new brand identity will be applied to new stores with roll-out to existing stores over the next seven years. The new brand includes a new store layout that is focused on giving customers a better shopping experience, without changing the product or price leadership position.
In responding to the COVID-19 pandemic, PEP worked closely with its loyal supplier base to manage and reduce stock inflows in anticipation of lower levels of consumer demand. Stock orders
5 distribution centres*
2 384 stores
PEP IN NUMBERS
Stores
PEPcell
525PEP
1 589PEPhome
254Dealz
16
Babies, kidsand essentials
49%
CFH product split (units)
Adult wear
11%
Footwear
14%
Homeware
26%
The updated PEP brand was rolled out to the first new store under the new branding, which opened in Paarl on 1 October 2020.
* Delivery from DCs to stores forms part of the Pepkor Logistics service through 18 distribution hubs.
PEPKOR INTEGRATED REPORT 2020 45

PEPKOR INTEGRATED REPORT 2020 GROUP PERFORMANCE CONTINUED
46
‘We owe to it our loyal customers to keep listening to them and carefully changing in ways that always offer them the lowest prices and convenience PEP is famous for, while ensuring that we provide a great shopping experience,’ said Jaap Hamman, CEO of PEP. Ntuthuko Gwala, station manager of PEP’s radio station, Feelgood FM, from PEP Talk, interviewed Jaap live on air at the opening of the first new-look, new-format PEP store in Paarl Mall.
In Cellular, smartphone volumes increased by 19.7% as a result of strong demand, while financial services transactions were impacted by store closures and fewer customers in store. The increase in handset sales is likely due to customers’ need to be more connected as the overall effect of the COVID-19 pandemic has made people more reliant on technology. Although the majority of PEP’s customers might not fully participate in e-commerce, owning a smartphone gives them the ability to communicate and engage in social media, as well as browse for products and information online.
The PAXI parcel delivery initiative uses PEP’s scale and logistics infrastructure to collect and deliver parcels between stores, providing a much needed, affordable and convenient service to customers. Performance surpassed expectations with the distribution of 1.9 million parcels during the year for customers and SMEs, compared to 850 000 during the previous year. The initiative successfully leverages the group’s retail footprint, and the number of distribution points was expanded to more than 2 000 with the inclusion of Shoe City stores. The PAXI service has also become a critical service to support SMEs operating in local communities, that make
were only cancelled where the production process had not started. In instances where products had already entered the production process, orders were delayed or postponed, as a large portion of PEP’s product range consists of basic everyday items that are not seasonal or dependent on trends. This provided both PEP and suppliers the opportunity to mitigate risks during a period where production capacity and sales were severely restricted.
Strong performance in baby products was supported by product quality and fabric improvements to meet customer demand, while performance in back-to-school trading was impacted by extended school closures due to the COVID-19 pandemic.
OPERATIONAL HIGHLIGHTS AND SUMMARY
Clothing, footwear and homeware � 9% growth in baby products
� PEPcell achieved good results and grew market share with increased category growth in smartphones, cell phone accessories
� A record 1 million handsets sold in August 2020
� Back-to-school, as a big seasonal sales drive, had a disappointing FY20 season with lower than usual sales in January 2020 due to changes in school terms, and extended school closures due to the COVID-19 pandemic
Value-added services � 1.3 million monthly money transfers
� 1.9 million PAXI parcels delivered during FY20 (FY19: 850 000)
� Extended PAXI reach to all Shoe City stores
� Number of transactions suffered due to fewer customers in store
� 10 million cellular handsets sold
PEP exceeded expectations and gained market share
680 million products sold (including virtual airtime)
314 million transactions (including virtual)
PEP launched its brand refresh in May 2020 and opened its first new-look store on 1 October 2020
130 000 PAXI parcels distributed for SMEs
More than 2 000 national PAXI distribution points

Corporate responsibility
PEP is proud to have a unique, inspiring and endearing company culture in the retail world that remains central to how they do business, how they treat each other and guides how they behave. Sikhula KunYe, a Xhosa phrase that means ‘we are growing together’, creates a unique environment of teamwork which fosters both business and personal growth.
It’s not every day that you win gold twice. PEP and PEPcell were awarded gold in the Daily Sun 2020 Readers Choice Awards for the categories of children’s clothing and cellular.
1 000 tonnes of post-consumer plastic waste was used for plastic bag production
All plastic bags already comply with government regulations for plastic bags set for 2028.
use of PAXI’s national footprint and cost effectiveness for their entrepreneurial enterprises. During the year, more than 130 000 parcels were distributed for SMEs. FMCG reported 9.7% sales growth through expansion of product ranges and private labels.
Dealz, PEP’s discount variety greenfields venture launched in 2016, experienced slow growth during the year, as it continued to develop and test the retail model. Good progress was made to establish and build the brand and its value proposition, which extends across 17 stores. As a greenfields venture, Dealz has provided several learning and developmental opportunities.
OutlookPEP remains conservative in its outlook over the next year as it navigates the post-COVID-19 market and the impact of this on its customers. The focus of the business will include continuing to invest in PEP Dynamos and being an employer of choice. PEP customers and their needs remain critically important, and PEP’s focus will be to maintain BPL, improve customer satisfaction, and grow market share.
Future growth drivers include retail footprint expansion, albeit at more conservative rates; the introduction of new product ranges; and investments in systems and infrastructure to promote long-term scale and efficiencies. Retail stores and digital will be used to enhance communication and marketing as a cost-effective and direct way to connect with customers.
PEP plans to invest in the fit-out of a new 140 000 m2 distribution centre (DC) in Hammarsdale, which will be developed externally by 2024, to build capacity for the next 15 years and improve delivery to stores and overall efficiencies.
The PEP and Ackermans DC location has the most prominent position on the N3 corridor between Johannesburg and Durban, and is the biggest platform created in South Africa.
PEPKOR INTEGRATED REPORT 2020 47

PEPKOR INTEGRATED REPORT 2020 GROUP PERFORMANCE CONTINUED
48
ACKERMANS HAS ACHIEVED RECORD MARKET SHARE
CLOTHING AND GENERAL MERCHANDISE: ACKERMANS
OUR ACKERMANS BRANDS
IntroductionAckermans brings ‘value to life’, offering its customers value with a wide range of clothing, footwear and value-added services. Ackermans strives to be the number one retailer for women with children in their lives and has aggressively focused on growing its market share in babies’ and children’s products. Its strategy focuses on its employees, customers and communities with its culture exemplified through its CRISP (Courage, Respect, Integrity, Simplicity and Performance) values.
Products and services These include clothing, footwear, cellular and value-added services, as well as cellular and financial services (such as insurance, personal loans, bill payments and money transfers).
Strategy and approachAckermans is a people-centred business that aims to equip its employees with knowledge and the tools needed to deliver on the Ackermans strategy. Ackermans’ employees have proved to be agile and adaptable, and its strong culture is testament to its continued growth in market share over the last number of years, notwithstanding the COVID-19 pandemic.
Externally, Ackermans focuses on its customers and their communities. It provides customers with a value proposition of price, assortment, quality, service and fashion that is affordable, on-trend and relevant. Ackermans has given back to its customers and the communities in which it operates through the Ububele programme for many years. Ackermans strongly believes that bringing employees, customers and the community together, as part of its business strategy, adds value to their lives and their support and loyalty to the brand. Ackermans customers, known as Siyamazi (‘we
know her’) are mainly women with kids in their lives. Ackermans is proud that it served and added value to the lives of more than 59 million Siyamazis this year.

6 countries
9 100 employees
3 distribution centres*
861 stores
Performance reviewCustomers are seeking more value at affordable prices as disposable income has come under pressure in recent years. This was exacerbated by the COVID-19 pandemic. What set Ackermans apart in this time was its employees’ knowledge and skills, agility, and their commitment to deal with the challenges of the pandemic, ensuring that the business continued as normally as possible.
With more people looking for affordable, alternative options in basic product categories, Ackermans has focused on its employees and customers, safeguarding its key stakeholders and operations.
Ackermans Woman
26
Stores
AckermansConnect
4
Ackermans
831
Adult wear
17%Footwear
14%
Apparel product split (units)
Babies, kidsand essentials
69%
Babies’ and kids’ wear comprise 69% of apparel products sold with character clothing being particularly popular. Ackermans continued to grow market share in these product categories.
ACKERMANS IN NUMBERS
* Delivery from DCs to stores forms part of the Pepkor Logistics service through 18 distribution hubs.
PEPKOR INTEGRATED REPORT 2020 49

PEPKOR INTEGRATED REPORT 2020 GROUP PERFORMANCE CONTINUED
50
Customer shopping behaviour changed, and customers shopped less frequently, while basket sizes increased in value. Shopping malls had a decline in sales, as customers chose to shop closer to home, choosing to support smaller shopping centres and nodes.
Despite the negative market conditions and a constrained operating environment, Ackermans gained significant market share during the year under review. This was evident in the Kids’ product category, which achieved record sales levels after the lockdown restrictions were lifted. Cellular performed well based on increased demand as customers’ lifestyles changed to include home entertainment and to stay connected during and after the COVID-19 lockdown.
Although planned store openings for the year were reduced due to the uncertainty created by the COVID-19 pandemic, the retail store base increased by 55 stores to 861 stores at 30 September 2020.
Credit sales contribution decreased to 17% from 19% in the prior year as credit granting was curtailed in anticipation of weaker consumer credit health. Contribution from lay-bys amounted to 17% with record fulfilment levels (exceeding 80%) achieved.
Ackermans Woman stores have proved to be a successful addition to the brand with more stores to open in future.
OPERATIONAL HIGHLIGHTS AND SUMMARY
Opened 62 new stores across different formats, including 4 Ackermans Connect stores
Served more than 59 million customers
More than 179 million units in clothing, footwear and essentials sold
2.3 million cell phone handsets sold
� All key big volume product categories exceeded plan on sales and margin post level 5 of the lockdown
� The biannual engagement survey result was the highest ever with 80% of employees participating
Credit
17%Lay-bys
17%
Sales mix
Cash
66%

Corporate responsibility
At the onset of the COVID-19 lockdown level 5, baby products to the value of R111 482 were donated to Gift of the Givers, who packaged the products into hampers and distributed it to hospital wards and clinics. Products included toiletry essentials, wash cloths, nappies, blankets and winter clothing.
Winner of the Ask Afrika Icon Brands Survey as Best Retailer in Children’s Wear for the eighth consecutive year.
Leveraging the trade partnership with the Character Group, Ackermans pledged R1 from the sale of every character face cover to support and assist with the reopening of 105 early childhood development centres.
R12.8 million in product donations were made during the year
The denim category is a big focus area and saw good market share growth during the year.
Ackermans outperformed the women’s apparel market. The Ackermans Woman stores have proved to be a successful addition to the brand with all 26 stores being profitable. Performance was supported by visual merchandise improvements, the drive to grow the denim and footwear product categories, and its exclusive A. List product range. The Ackermans Woman concept appeals to both legacy and new customers, leveraging the Ackermans brand equity. Key learnings from stand-alone Ackermans Woman formats are introduced in the women’s departments in conventional Ackermans stores with great success.
In 2019, Ackermans launched click-and-collect in selected product categories in certain stores. Its focus has been to build internal capability for further roll-out in future.
OutlookThe business will continue to focus on its customer value proposition to deliver results by providing exceptional value to women with kids in their lives.
It has taken a conservative approach towards its growth strategy for the next financial year, with a reduction in the number of store openings. Efforts continue to be focused on growing the women’s offering through Ackermans Woman.
Online and digital represent additional growth areas and Ackermans plans to fast-track development of its click-and-collect capability to leverage its bricks-and-mortar infrastructure. Local sourcing opportunities will also be explored to grow local sourcing opportunities to bolster rapid response, especially in the women’s product categories.
During lockdown, we launched the ‘Faces of change’ campaign that celebrated women who actively made a difference in their communities. The campaign gave customers the opportunity to nominate heroes like Mymoena Scholtz, pioneer and leader of Where Rainbows Meet Development Foundation.
PEPKOR INTEGRATED REPORT 2020 51

PEPKOR INTEGRATED REPORT 2020 GROUP PERFORMANCE CONTINUED
52
CLOTHING AND GENERAL MERCHANDISE: PEP AFRICA
the PEP Africa model remains robust and sustainable, the business had no option but to curtail costs and complete a restructuring process during the year. The exit from Zimbabwe was announced last year and was completed on 30 September 2020.
ZAMBIA is one of the fastest growing economies in Africa and is mostly driven by copper and agriculture. It is one of the most urbanised countries in sub-Saharan Africa with about half the population living in larger towns or cities. This is PEP Africa’s largest African operation and is fairly stable with good prospects, although high currency depreciation is a concern. The retail store base increased by one store on a net basis to 82. This included four new store openings and three closures. Performance is impacted by a significant component of the cost base, which is linked to the US dollar. This remains an ongoing focus.
ANGOLA remains heavily influenced by high currency depreciation and economic volatility. With the local currency depreciating by more than 50% in FY20, product price increases were necessary and resulted in reduced volumes. The scale of operations in-country was reduced to compensate for lower volumes and performance was supported by strong growth in the cellular product category following the successful award of a cellular licence in the previous year. The retail store base in Angola reduced to 85 and included five store closures.
MOZAMBIQUE is highly dependent on tourism and mining, and most of its population lives in rural areas. It has also seen an economic slowdown due to the negative impact of cyclones Idai and Kenneth in 2019, which put additional pressure on the country’s infrastructure. Despite additional concerns around political issues reported during the year, operations remain stable. As an essential retailer, all stores continued trading during the COVID-19 state of emergency, but restrictions on the freedom of movement impacted performance. The retail store base was reduced to 65 stores following the closure of two stores.
Strategy and approachPEP Africa was born out of PEP’s culture and way of doing business in South Africa, following the same strategic approach and offering the same customer value proposition. Country-specific nuances make trading in each African country unique and it is therefore managed by a separate management team. Customers know they can find quality new products and consistency in size and ranges, as well as the added benefit of good customer service and a money-back guarantee.
Similar to PEP in South Africa, PEP Africa is positioned in the discount segment of the CFH markets. While stronger informal markets with focus on second-hand clothing exist in many of its operating countries, PEP Africa’s positioning is the cheapest formal retail option. Apparel and footwear are the largest product categories followed by cellular. Babies’ and kids’ products dominate sales, as the informal market does not cater for these items.
Products and servicesCFH products, cellular and airtime products, FMCG and a range of value-added services, including cashbacks, electricity and cellular airtime, cross-border and local money transfers, selected bill payments (such as pay-TV).
Performance overviewCustomers in Africa have limited buying power and economic growth is largely dependent on the performance of commodity prices. Constant volatility in foreign exchange rates adds to the complexity of doing business in Africa, and the division reported mixed results from each of its country operations. Most African economies have been placed under significant pressure by the COVID-19 pandemic. Different lockdown levels, rules and regulations applied to different countries, causing trade in general to deteriorate. To ensure that
PEP AFRICA CONTINUES TO CONSOLIDATE

6 distribution centres
1 distribution hub
301 stores
Uganda
6
Stores per country
Mozambique
65
Angola
85
Nigeria
46
Zambia
82
Malawi
17
CFH product split (units)
Footwear
29%
Homeware
6%
Babies,kids andessentials
51%Adult wear
14%
PEP AFRICA IN NUMBERSNIGERIA’S emerging market is the largest economy in Africa and is expanding into the manufacturing, financial services, communications, technology and entertainment sectors. Despite this ‘growth’, the country faces significant challenges with the collapse in oil prices coupled with the impact of the COVID-19 pandemic. New import permit legislation added pressure to the supply chain and the outlook for Nigeria is to maintain the business at current levels for the short to medium term. Long-term growth will be planned through expansion into smaller towns, where there is an opportunity to build quicker brand recognition through PEP’s formal retail value proposition. The retail store base was reduced to 46, with the closure of five stores.
MALAWI is one of the poorest countries in the world and is dependent on agriculture, which employs the vast majority of the population. Although Malawi is PEP Africa’s smallest market with 17 stores, it is the best performing market in terms of profitability and cost of doing business. Conservative expansion is planned over the next three years.
UGANDA was entered in 2016 and it served as a strategic platform to enter the East African market with plans to expand and scale operations. These plans have not proved to be feasible, taking the current and future operating environment into consideration, and the decision was made to close down operations by the end of 2020.
OutlookPEP Africa remains committed to its current markets and will support its existing operations, providing the best formal retail experience to customers. Each country of operation must be profitable in its own right before any further expansion will be considered. In the short term, PEP Africa will focus on consolidating its retail footprint through closure of unprofitable stores. Minimising the cost of doing business is imperative and dollar-based property rentals are being reviewed and renegotiated.
Opportunities to collaborate further with the PEP South African operations will be explored in areas such as product sourcing and optimisation of the supply chain.
Group revenue contribution: 3%
Sales down by 16%Constant currency sales declined by 7% and like-for-like sales decreased by 9.6%.
OPERATIONAL HIGHLIGHTS AND SUMMARY
� Babies’ and kids’ products contribute more than 50% of CFH products sold
� Cellular growth of 31% was driven by strong growth in handset sales
6 distribution centres
1 distribution hub
301 stores
6 countries
2 300 employees
PEPKOR INTEGRATED REPORT 2020 53

PEPKOR INTEGRATED REPORT 2020 GROUP PERFORMANCE CONTINUED
54
EXPANDING THE GROUP’S ADULT WEAR OFFERING
CLOTHING AND GENERAL MERCHANDISE: PEPKOR SPECIALITY
IntroductionPepkor Speciality (Speciality) represents a ‘world of value’ through a group of adult wear and branded businesses that are uniquely positioned to open up a high-value, on-trend market to the group. It is the group’s incubator for smaller businesses and innovation, with each brand having its own customer value proposition. By working together and sharing services and infrastructure, they are able to accelerate growth and gain efficiencies. Through Speciality, the group can launch, nurture and reposition brands for future growth.
Products and servicesThese include clothing and footwear products, cellular and airtime.
Strategy and approachThe Speciality brands are at different stages of maturity and performance, facing different challenges and opportunities. Speciality’s strength lies in its diversity, as it continues to build a culture of collaboration between its brands and the group, enabling learning and success.
Speciality’s diverse market positioning provides Pepkor access to the adult wear market, in which it has a very low market share. This division focuses on adult wear for both men and women, within the value retail market segment with branded and value product categories.
The division’s overarching management focus is to empower individual leadership teams by providing them with support in retail direction, capital allocation and shared services, including finance, human resources, warehousing, technology, planning and store development. The division leverages the scale of the group through Pepkor’s Group Services, such as property, transport, data and analytics, treasury, internal audit, tax, IT and sourcing.
OUR SPECIALITY BRANDS
Refinery rolled out its e-commerce platform in August 2020. This new channel has increased the brand’s online presence. Social media impressions grew by 267% measured against the same nine-week period last year.

Performance overviewWith the outbreak of the COVID-19 pandemic, Speciality focused on cost savings and preserving cash. This resulted in the closure of 35 stores in aggregate across all retail brands. Market share was successfully defended by most brands. Speciality invested in key competencies during the year to enable growth in the adult apparel market. This included investments in e-commerce and the acquisition of S.P.C.C and CODE.
Tekkie Town is a branded footwear business, selling the most wanted and affordable branded footwear in southern Africa. Since the last reporting period, stock has been reduced substantially to manageable levels, a customer value proposition centred around ‘value’ has been adopted, and customers have responded well to this renewed offer. Tekkie Town grew their share of the market substantially, especially since the level 5 lockdown was lifted. Tekkie Town remains a preferred partner for international brands, providing expertise and access through its experience and extensive footprint in the African market.
Shoe City lost market share as the business felt the impact of the COVID-19 lockdown rules, even after level 5 was lifted. Sales were under pressure, as it has a high exposure to shopping malls, and the work, formal and school shoe ranges lost traction due to social restrictions and people working from home. There was also a store reduction during the year that negatively impacted on like-for-like revenue numbers. Although Shoe City is under pressure at the moment, the group believes there is a place for a specialist shoe store in the market.
5 distribution centres*
940 stores
Stores
Tekkie Town
411Dunns
204Shoe City
143
Refinery
71
John Craig
111
PEPKOR SPECIALITY IN NUMBERS
5 000 employees
5 countries
Over the past year, Tekkie Town has enhanced their customer experience with a focus on service, an updated product offering and a new store layout.
* Delivery from DCs to stores forms part of the Pepkor Logistics service through 18 distribution hubs.
PEPKOR INTEGRATED REPORT 2020 55

PEPKOR INTEGRATED REPORT 2020 GROUP PERFORMANCE CONTINUED
56
John Craig’s position in the market, focusing on branded smart and formal men’s clothing, does not leverage Pepkor’s core capabilities, therefore the group will dispose of the business.
Dunns performed well. Although sales were down, it outperformed the market in its category by growing market share and increasing profits.
Refinery had a good year, building on their success of the previous three seasons. It maintained good results despite the general downturn in retail and the impact of the COVID-19 pandemic. Seven new stores were rolled out, and the development of the e-commerce platform was fast-tracked to provide customers with an online solution. This was launched in August 2020, and initial uptake was very positive. Its in-stock position improved substantially on the back of improved sourcing.
Group revenue contribution: 7%
Strong sales performance post-lockdown driven by our ability to provide attractive deals to customers with fresh stock, welcoming stores and good price points.
� E-commerce was successfully launched in August 2020 through Refinery, while Shoe City, Dunns and Tekkie Town followed post-year-end.
� Expenses were well controlled.
� Dunns exceeded sales expectations with double-digit like-for-like sales growth after trade started again in May 2020, and returned to profitability.
� Shoe City was negatively impacted by lower demand for formal and school footwear.
� Tekkie Town’s performance was supported by aggressive markdowns.
� Refinery successfully launched an e-commerce platform.
� John Craig’s performance was impacted by a shift in consumer demand away from formal wear and the decision was made to dispose of the business.
� S.P.C.C and CODE were acquired.
OPERATIONAL HIGHLIGHTS AND SUMMARY
CODE owns the production process for the majority of its assortment with all key production and procurement processes under one roof. It is therefore agile enough to pull stock, repurpose, redesign and replenish within two weeks – from concept to store.
Shoe City introduced PAXI’s parcel delivery service to all its stores in September 2020. This is a true example of group collaboration and leveraging scale, infrastructure, systems and processes, as Shoe City, PEP, PAXI and Pepkor IT worked together on this roll-out.
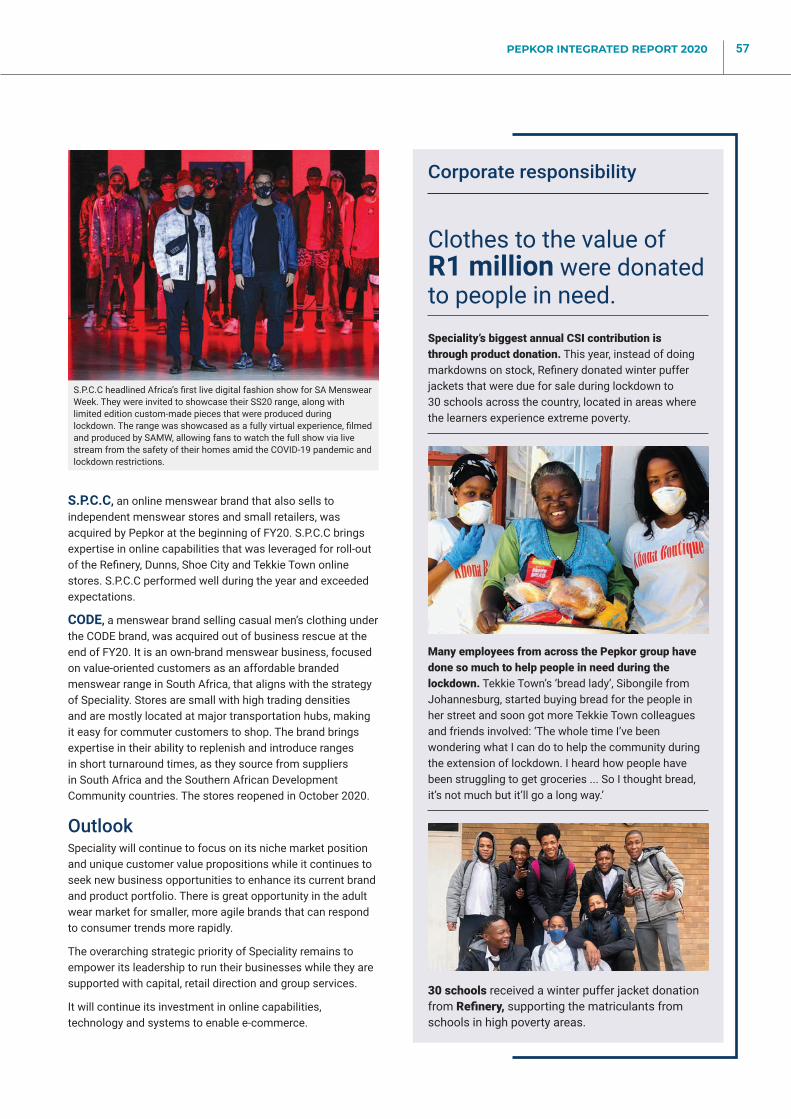
S.P.C.C, an online menswear brand that also sells to independent menswear stores and small retailers, was acquired by Pepkor at the beginning of FY20. S.P.C.C brings expertise in online capabilities that was leveraged for roll-out of the Refinery, Dunns, Shoe City and Tekkie Town online stores. S.P.C.C performed well during the year and exceeded expectations.
CODE, a menswear brand selling casual men’s clothing under the CODE brand, was acquired out of business rescue at the end of FY20. It is an own-brand menswear business, focused on value-oriented customers as an affordable branded menswear range in South Africa, that aligns with the strategy of Speciality. Stores are small with high trading densities and are mostly located at major transportation hubs, making it easy for commuter customers to shop. The brand brings expertise in their ability to replenish and introduce ranges in short turnaround times, as they source from suppliers in South Africa and the Southern African Development Community countries. The stores reopened in October 2020.
OutlookSpeciality will continue to focus on its niche market position and unique customer value propositions while it continues to seek new business opportunities to enhance its current brand and product portfolio. There is great opportunity in the adult wear market for smaller, more agile brands that can respond to consumer trends more rapidly.
The overarching strategic priority of Speciality remains to empower its leadership to run their businesses while they are supported with capital, retail direction and group services.
It will continue its investment in online capabilities, technology and systems to enable e-commerce.
S.P.C.C headlined Africa’s first live digital fashion show for SA Menswear Week. They were invited to showcase their SS20 range, along with limited edition custom-made pieces that were produced during lockdown. The range was showcased as a fully virtual experience, filmed and produced by SAMW, allowing fans to watch the full show via live stream from the safety of their homes amid the COVID-19 pandemic and lockdown restrictions.
Corporate responsibility
Clothes to the value of R1 million were donated to people in need. Speciality’s biggest annual CSI contribution is through product donation. This year, instead of doing markdowns on stock, Refinery donated winter puffer jackets that were due for sale during lockdown to 30 schools across the country, located in areas where the learners experience extreme poverty.
Many employees from across the Pepkor group have done so much to help people in need during the lockdown. Tekkie Town’s ‘bread lady’, Sibongile from Johannesburg, started buying bread for the people in her street and soon got more Tekkie Town colleagues and friends involved: ‘The whole time I’ve been wondering what I can do to help the community during the extension of lockdown. I heard how people have been struggling to get groceries ... So I thought bread, it’s not much but it’ll go a long way.’
30 schools received a winter puffer jacket donation from Refinery, supporting the matriculants from schools in high poverty areas.
PEPKOR INTEGRATED REPORT 2020 57

PEPKOR INTEGRATED REPORT 2020 GROUP PERFORMANCE CONTINUED
58
JD’S INVESTMENT IN OMNICHANNEL PAYS OFF IN A CHANGING RETAIL ENVIRONMENT
FURNITURE, APPLIANCES AND ELECTRONICS: JD GROUP
IntroductionThe JD Group (JD) is a diversified retail and consumer finance business that gives value-conscious mass-market customers in southern Africa the opportunity and means to create a comfortable lifestyle. Its purpose is to assist people from all walks of life by enabling them with the latest technology, and turning houses into homes with, quality, value-for-money furniture, appliances and household goods – both in-store and online. This is facilitated with consumer credit solutions and insurance products through the group-owned finance and insurance companies.
Products and services These include furniture, homeware, beds, appliances, electronics, technology assistance, credit and insurance.
Strategy and approachThe JD Group strives to be the leading lifestyle retailer in southern Africa with brands that customers prefer, suppliers seek, employees are proud of, and that satisfy investor requirements. JD supports its product offerings with various payment options, superior customer care and after-sales service.
Furniture
OUR JD BRANDS
Consumer electronics and appliances Credit offering
Sleepmasters offers a ‘120-night Sleep Happy Guarantee’ that allows customers to test their new mattress for up to 120 nights.

JD in numbers
Its strategy focuses on customer centricity, product leadership and operational efficiency. The business has taken an omnichannel retail approach, which leverages existing infrastructure and operational capability to deliver a competitive online retail offering. Digital transformation is particularly relevant to JD, since it believes that many customer journeys start online, although, in many instances, like furniture, it might still conclude in store.
JD’s long-term goals are to grow market share through its customer value proposition, to provide a world-class omniretail experience and to continue enhancing its quality of earnings by being less reliant on credit. Significant progress has been made on these fronts over the past five years, largely as a result of JD’s complete restructuring of the business and investment in systems and technology.
Performance reviewJD embarked on a turnaround strategy five years ago, which involved a substantial restructure of the business and consolidation of retail brands. Its positive contribution trajectory was unfortunately severely impacted this year by the COVID-19 pandemic.
Merchandise sales for the year decreased by 0.4%, with a decrease of 1.6% in like-for-like sales. Performance was impacted by the prolonged COVID-19 lockdown period for most of JD’s trading categories. Strong sales growth was seen across most of the retail brands in the fourth quarter, as consumers upgraded their homes and technology requirements. Online sales, both in volume and value, grew in excess of 100% with substantial growth during the fourth quarter.
Notwithstanding a recovery in the collections rate subsequent to the COVID-19 lockdown period, reduced debtors’ collections during lockdown necessitated an increase in the provision against the credit loan book and is a major contributing factor to the division’s operating loss of R301 million. Excluding the additional provisioning on the loan book in terms of IFRS 9, the operating loss for the year amounts to approximately R90 million, which compares to R167 million operating profit of the prior year before adoption of IFRS 9.
Due to an expected deterioration of the economy and the impact thereof on the consumer, a more stringent credit granting policy was adopted, which impacted negatively on sales, especially in the furniture retail chains. The overall JD credit sales mix for the 12-month period dropped to
Bradlows
256Rochester
34
IncredibleConnection
77Sleepmasters
199
Russells
262
Stores
HiFi Corp
51
Product split based on revenue
Furniture
39%
Appliancesandelectronics
61%
JD GROUP IN NUMBERS
16 distribution centres
879 stores
5 600 employees
4 countries
PEPKOR INTEGRATED REPORT 2020 59

PEPKOR INTEGRATED REPORT 2020 GROUP PERFORMANCE CONTINUED
60
� Consumer demand driven by technology upgrades, work/school from home and consumers investing in their homes
� Online sales contribution nearly doubled to 7% in the appliances and electronics division
� Credit sales mix reduced to 13% from 19%
Group revenue contribution: 15%
OPERATIONAL HIGHLIGHTS AND SUMMARY
Incredible Connection’s Techxperts provide expert advice, as well as assistance with installations, upgrades and technical repairs. Customers can get assistance in-store or on-site in their homes or offices.
12.5% compared to 18.5% for the corresponding period. However, the fourth quarter’s total credit mix was only 8.0% compared to 18.7% in the prior year. The strong sales growth was therefore mainly driven by cash and lay-by sales that increased the sales mix from 81.5% in the prior year to 87.5% in the current year.
The furniture retail chains underperformed the consumer electronics and appliances chains as furniture retail had a prolonged lockdown period and was affected more by the curtailing of credit granting as noted above. Incredible Connection and HiFi Corp were permitted to sell a limited range of products through online channels from mid-April, and stores reopened in May 2020. These chains, in particular, have shown very good sales growth subsequent to the lockdown period, fuelled by technology upgrades, work/school from home and online purchase trends. Incredible Connection was awarded the prestigious Microsoft Retail Partner of the Year award for 2020.
JD’s retail brands are predominantly positioned in the value market. Durable products are inherently discretionary in nature and have higher prices – often requiring credit to enable sales. Due to the general economic downturn, the uncertainty surrounding its long-term impact, and high levels of unemployment, JD has taken a very conservative approach towards granting credit. Credit remains an important sales enabler and JD manages this centrally through its Connect consumer credit business. JD continues to invest in systems and technology to support its credit sales. This includes in-store biometrics, DebiCheck debit order authentication, a new call centre dialler with improved functionality, and data analytics to improve credit scoring and collection strategies.
JD’s supply chain capabilities and national distribution footprint are key differentiators that support our omnichannel capabilities.
Continued investment in systems and technology is intended to support the long-term growth of JD’s online platforms. This investment has already offered excellent returns in the short term since the COVID-19 pandemic made online purchases and home deliveries the preferred (or only) option for customers.
Outlook The COVID-19 pandemic has put additional pressure on the non-discretionary product market. Consumer buying behaviour has changed and customers are expected to prioritise spending on necessities rather than durable products, which will impact JD’s performance.
In response, JD will focus on growing the middle- to higher-end bedding market through Sleepmasters and online. A second priority will be to attract the youthful, urban consumer with the right product offerings through, in particular, the more aspirational Rochester brand. Incredible Connection will continue to focus on being the preferred technology leader both in-store and online, while HiFi Corp will expand its value proposition to a broader and higher-income consumer by offering higher-end brands.
JD is well positioned to grow market share through its omnichannel offering and capability. The increased need for convenience through online shopping has inspired JD to look at innovative ways to serve its customers better, while also providing access to additional products, brands and categories not offered through its current retail channels.
This led to the formation of Everyshop – an online only store that will offer South African consumers an additional ‘one-stop’ shopping channel with a curated offering of the group’s existing product ranges, as well as many new product categories and leading brands, in a unique, tailored departmental shopping experience that can leverage the existing e-commerce, logistics and fulfilment capabilities.

Corporate responsibility
JD complies strictly with all the various COVID-19 regulations relating to safety, preventative measures and workplace safety.
Incredible Connection was awarded the prestigious Microsoft Retail Partner of the Year award for 2020.
JD supports the Do More Foundation as a new initiative. Customers have the option to donate R5 (or multiples thereof) towards this cause at point of sale. In addition, seasonal initiatives are also supported, such as a shoebox gift drive over the festive season.
JD supports the Rise Against Hunger initiative, which funded and packed 52 000 meals during November 2020.
JD supports the Santa Shoebox initiative. Employees voluntarily put together shoeboxes filled with essential items and treats for 805 children across nine charities.
R250 000 product donations
Abacus Holdco Proprietary Limited (Abacus) was acquired on 1 December 2019. The Abacus product offering includes life and short-term insurance products provided to customers of the JD Group and other group businesses.
Abacus is driven to provide customers with pioneering insurance solutions that are simple, relevant and easy to understand. We believe that all South Africans, from individuals to businesses, deserve to have access to cover that suits their needs and is always there when they need it. We provide terms and conditions that enlighten rather than confuse, and we constantly seek out innovative ways to deliver products that are priced low but deliver surprising value.
During the period under review, Abacus complied with applicable statutory capital and regulatory requirements and applied a conservative approach to debtors’ provisioning. While the bulk of services are provided to the JD Group, Abacus continues to develop innovative products for other businesses within the Pepkor group.
FURNITURE, APPLIANCES AND ELECTRONICS: ABACUS
100 employees
PEPKOR INTEGRATED REPORT 2020 61

PEPKOR INTEGRATED REPORT 2020 GROUP PERFORMANCE CONTINUED
62
CREATING AN OPEN ECOSYSTEM THAT ALLOWS EVERYONE TO TRANSACT THROUGH TECHNOLOGY
FINTECH: FLASH
IntroductionFlash Group is a global fintech group dedicated to ‘making people’s lives easier’ for the communities it serves. It disrupts through innovative technology, bringing value-added services and payment access to a wide range of industries and their customers.
The Flash Group comprises four main divisions:
The trader division focuses on the informal market and extends across 194 000 traders. With a high-volume transaction processing capability, its proprietary integration switch safely processes millions of virtual transactions daily, providing a robust and reliable system that connects customers, informal traders, virtual content and service partners.
The cellular division comprises SIM distribution, as well as airtime and data procurement and distribution. SIM distribution operates across multiple channels within Flash and across all four major South African networks. Airtime and data procurement and distribution operates across traders, business to business (B2B), business partners and wholesale markets.
The aggregation division onsells airtime and data alongside aggregating the Flash Group value-added service (VAS) suite into formal retail environments via our application programming interface (API).
The consumer payments division develops technology to convert cash into an online balance, allowing customers greater payment access and participation in the online economy, with access to a large and growing range of virtual products payable with one single form of virtual currency (1ForYou).
1
2
3
4

FLASH IN NUMBERS
Products and services Flash Group has expanded across South Africa, in addition to operations in the United Kingdom and Europe, effectively integrating its payment API and products into formal retail outlets. This process has allowed us to partner with content providers and brands on a global scale. Flash provides access for customers to buy and pay for:
Strategy and approachFlash Group’s vision is for everyone to have access to essential services in their communities, and to formalise the informal trading environment in a way that will benefit community entrepreneurs and their customers. Flash devices enable traders to offer greater convenience to their customers, and the commissions earned from transactions is shared between Flash and the traders. This keeps money in the communities and provides opportunities for small businesses to prosper. Through this, Flash creates new transaction economies through an open ecosystem that provides partners with seamless multiple platform integration, allowing products to be delivered to market efficiently.
� Airtime
� Data
� Electricity
� Water
� DStv
� Lotto
� Gift cards (content and gaming)
� 1ForYou (products ranging from Wi-Fi services to insurance and travel tickets)
� RICA
� SIM distribution
� Money transfers
� Bill payments
194 000 Flash traders
600 employees
South Africa, with services in the UK and Europe
Zwelonakele Ntwa from Saldanha Bay, Cape Town has been a Flash trader since October 2018.
PEPKOR INTEGRATED REPORT 2020 63
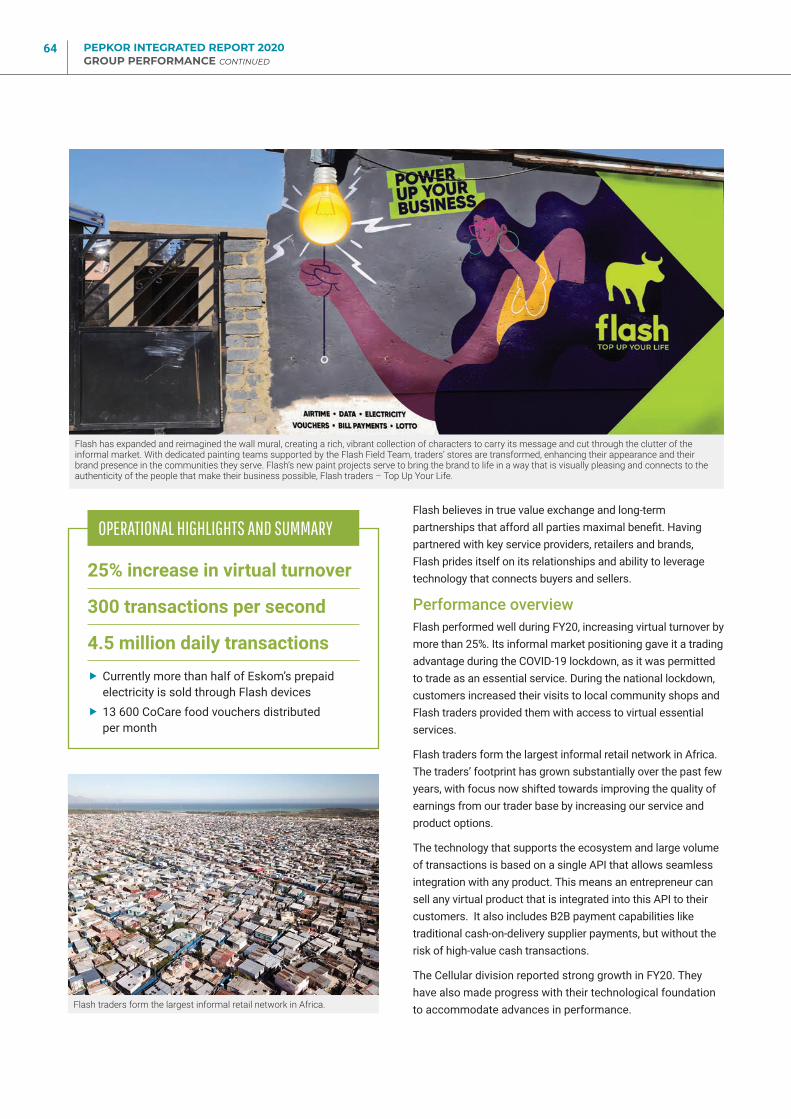
PEPKOR INTEGRATED REPORT 2020 GROUP PERFORMANCE CONTINUED
64
Flash believes in true value exchange and long-term partnerships that afford all parties maximal benefit. Having partnered with key service providers, retailers and brands, Flash prides itself on its relationships and ability to leverage technology that connects buyers and sellers.
Performance overviewFlash performed well during FY20, increasing virtual turnover by more than 25%. Its informal market positioning gave it a trading advantage during the COVID-19 lockdown, as it was permitted to trade as an essential service. During the national lockdown, customers increased their visits to local community shops and Flash traders provided them with access to virtual essential services.
Flash traders form the largest informal retail network in Africa. The traders’ footprint has grown substantially over the past few years, with focus now shifted towards improving the quality of earnings from our trader base by increasing our service and product options.
The technology that supports the ecosystem and large volume of transactions is based on a single API that allows seamless integration with any product. This means an entrepreneur can sell any virtual product that is integrated into this API to their customers. It also includes B2B payment capabilities like traditional cash-on-delivery supplier payments, but without the risk of high-value cash transactions.
The Cellular division reported strong growth in FY20. They have also made progress with their technological foundation to accommodate advances in performance.
25% increase in virtual turnover
300 transactions per second
4.5 million daily transactions
� Currently more than half of Eskom’s prepaid electricity is sold through Flash devices
� 13 600 CoCare food vouchers distributed per month
OPERATIONAL HIGHLIGHTS AND SUMMARY
Flash has expanded and reimagined the wall mural, creating a rich, vibrant collection of characters to carry its message and cut through the clutter of the informal market. With dedicated painting teams supported by the Flash Field Team, traders’ stores are transformed, enhancing their appearance and their brand presence in the communities they serve. Flash’s new paint projects serve to bring the brand to life in a way that is visually pleasing and connects to the authenticity of the people that make their business possible, Flash traders – Top Up Your Life.
Flash traders form the largest informal retail network in Africa.

Flash Group has strengthened its UK and European operations through strategic partnerships, rolling out virtual products into global retail and offering a comprehensive aggregation suite. While these operations are small in the context of the Flash Group, it is seen as a strategic advantage to gain access to the European market and service provider network.
OutlookFlash will continue to grow the business, both in South Africa and globally, while further investing in its technological capability. The short-term focus is to grow the product and services basket offered within the Flash Group ecosystem, bringing the business and its offering into sharper focus for potential partners and customers alike.
Payment options to convert cash into online was achieved through the development and launch of 1ForYou to make the online economy more inclusive and accessible through a bankless payment and top-up solution. A 1ForYou application (app) was also developed.
1ForYou is the digital payment solution for cash customers in South Africa, digitising cash to make payments and top-up wallets. 1ForYou is the most accessible payments solution in South Africa and exists to bridge the gap between the online economy and the informal market. As a member of the Flash Group of companies, 1ForYou enjoys retail partnerships that ensure an enormous footprint and ease of access for our customers. Located in all Flash shops, PEP, Shoprite and Ackermans stores, among others, 1ForYou is available at leading retailers nationwide.
Corporate responsibility
During the COVID-19 pandemic, Flash, together with the DG Murray Trust, pioneered the CoCare Voucher Programme. This programme uses electronic food vouchers as a delivery mechanism to food-insecure households, negating the need for them to queue for food parcels. CoCare vouchers are sponsored by various non-governmental organisations (NGOs), such as the Bill and Melinda Gates Foundation, and customers can also send food vouchers to people in their communities. CoCare vouchers provide a safe and secure way for homes struggling with food security to purchase food from a Flash trader in their community.
With enormous effort on the ground and through both digital and traditional media, shops were branded, traders were educated, and voucher recipients could redeem their CoCare vouchers.
Flash Group also continuously donates to Operation Smile, an NGO that provides free surgeries to youth with cleft lips and cleft palates, and helps educate the communities regarding care and the stigma associated with those conditions. They operate in underserved communities and provide life-changing interventions in the lives of those who need them most.
To date, Flash Group has sponsored two surgical missions and funded over 44 surgical procedures.
PEPKOR INTEGRATED REPORT 2020 65

PEPKOR INTEGRATED REPORT 2020 GROUP PERFORMANCE CONTINUED
66
COMMITTED TO MANAGING CREDIT RISK EFFECTIVELY
FINTECH: CAPFIN
IntroductionCapfin was founded in 2010, with a vision to provide customers with affordable loan products and services. Capfin transformed from a business process operator providing loan services to an external funder, to an unsecured lender with its own internally funded credit book that it started to fund in March 2019. Capfin has continued to meet the expectations of its customers with friendly service and responsible lending.
The business operates in South Africa’s unsecured lending market and makes use of digital channels and the PEP and Ackermans retail store footprint to market its products. Customers can apply for Capfin loans in store, online, or via SMS. Capfin assesses customer affordability and extends credit based on its proprietary credit granting methodology and scorecards. Capfin establishes contact with qualifying customers and deposits funds into their bank accounts via electronic funds transfer.
OPERATIONAL HIGHLIGHTS AND SUMMARY
219 000 accounts
R1.9 billion credit book
Approval rate reduced by 55% during the year
R7 000 average loan amount
The customer acquisition journey and responsible credit approval process has checks and balances in place to ensure that customers are protected against overextending their credit affordability, which, at the same time, protects the company from possible long-term bad debt.
Retrieve bureau data
Pre-validation checks
Apply policy filters
Credit underwriting checks are done within 24 hours
Acquiring customers with good credit ratings, while promoting responsible lending and underwriting practices, protects the group’s risk of exposure to bad debt.
Customer need
Point of sale
In-store
Cell phone (SMS)
www(web)
Outbound sales
(PQ calls)
Direct mail (PQ mailer)
Personal selling
(Canvas calls)
Credit application through one of seven main channels

900 employees
6 and 12-month loan products
Application channels
Digital
35%
Retail stores
65%
CAPFIN IN NUMBERSResearch indicates that customers utilise Capfin loans for various reasons, including unforeseen expenses like funerals or car accidents, education, durable goods and regular household expenses in times of crisis.
Products and servicesCapfin provides unsecured loans to customers with repayment periods varying between six and 12 months. The 24-month lending product was discontinued in FY20 to reduce credit risk.
Strategic approachIn 2018, Capfin embarked on a brand repositioning strategy to build the Capfin brand and drive customer uptake through its new digital channels to diversify its traditional target market and appeal to a broader range of customers.
Performance overviewCapfin’s internally funded credit book increased to its peak of R2.6 billion (gross) in March 2020. The onset of the COVID-19 pandemic has resulted in increased credit risk and a significant reduction in credit granting. As a result of curtailed credit granting, approval rates dropped by 55% between the first and second half of the 2020 financial year. Focus shifted to collections and the gross credit book reduced to R1.9 billion at 30 September 2020. Credit loss provision levels were increased to 26% from historical levels of 15%, which substantially affected profitability. As a result, a consolidation process is underway to reduce Capfin’s operating cost structure and support profitability going forward.
OutlookCapfin will continue to manage credit risk with conservative credit granting. It is not expected that the credit book will expand substantially in the near future based on the anticipated deterioration in the credit health of consumers.
333 000
219 000
31 Mar2020
30 Sep2020
Number of customer accounts development
287 000
30 Sep2019
Assign scorecard
Assess affordability
Underwrite approved amount
Allocate credit limit
Transfer cash to customer
Credit rating is applied and approved with underwriting in place
Funds are allocated and made available to customers
PEPKOR INTEGRATED REPORT 2020 67

PEPKOR INTEGRATED REPORT 2020 GROUP PERFORMANCE CONTINUED
68
GROUP SERVICES CONTINUE TO SUPPORT THE GROUP AND LEVERAGE ITS SCALE
GROUP SERVICES
Group Services overview
3 000 employees
IntroductionPepkor Group Services manages the functions that support the brands and other operational businesses. Centralising many of these services and regulatory functions allows us to benefit from economies of scale, create centres of excellence, save costs and improve efficiencies, while providing a holistic approach to group compliance. The Pepkor central office supports operating divisions through finance and treasury, human resources, internal audit, investor relations, legal, marketing and tax functions.
Strategy and approachGroup Services’ primary role is to use the group’s scale to create efficiencies where services are needed across operating divisions. However, its purpose is to create strategic advantages through collaboration, synergy and scale. It looks critically at how the group operates and optimises the use of shared capabilities, platforms and systems, and taps into collective experience, expertise and talent to deliver more effectively to our customers.
Group Services has two areas of focus. On a day-to-day operational level, it provides services that may otherwise be outsourced to third-party service providers. On a strategic level, it works on projects to improve and develop new processes, systems and assets to benefit the group.
Group Services’ functional areas include Pepkor Properties, Pepkor Installations, Pepkor Sourcing and Services, Pepkor Logistics, Pepkor IT, Pepkor Data & Analytics and Tenacity. PepClo is a stand-alone manufacturing facility.
GROUP SERVICES IN NUMBERS

Performance review
PEP has been in the same head office in Parow since the 1960s. This campus is shared with PEP Africa, the PepClo factory and Pepkor.
Providing a complete property solution through expert knowledge and systemsPepkor Properties manages the largest retail lease portfolio in South Africa. It provides property management services to the group, which benefits from existing access, expertise and systems. It primarily negotiates property leases on behalf of the group’s divisions. As one of the largest ‘tenants’, it can leverage its scale as an anchor tenant to negotiate with landlords. In some instances, the group has up to 10 lease agreements in one shopping mall. It also has a financial and legal team that covers all aspects of property management.
During the year, 746 leases were renewed with an average reduction in rental cost of 12%.
Due to the impact of the COVID-19 pandemic on business and the economy, the properties division played a significant role to engage with landlords to protect and preserve group liquidity.
Pepkor Properties concluded the purchase of the land in the Hammarsdale area. This will be used to develop a new 140 000 m2 distribution centre facility for PEP. The development will be done by an external party and it is expected that the project will be completed in 2024. The Hammarsdale area has become a prime logistics node in KwaZulu-Natal with many large retailers establishing logistics operations there. Ackermans and Speciality already operate from a 90 000 m2 distribution centre in Hammarsdale, which commenced operations in 2018.
80 employees
5 725 property leases managed (2.2 million m2 under management)
746 leases renewed annually
Average of 12% saving achieved on lease renewals in FY20
Services � Identifying new locations
� Preparing feasibility studies
� Managing the existing property portfolio
� Payment of rent to landlords
� Negotiation of leases and contracts
� Facilities management
� Asset management
� Development management
� Multi-brand property analyses
PEPKOR INTEGRATED REPORT 2020 69

PEPKOR INTEGRATED REPORT 2020 GROUP PERFORMANCE CONTINUED
70
We create your storePepkor Installations services and assists Pepkor’s CFH brands in installing shop fittings, particularly for new store openings, refurbishments and maintenance. It also assists with the design and implementation of new-look stores. It provides brands with a lower cost of acquisition and lower services cost per account than any third-party service provider. By having this team and service in the group, the group’s culture of cost saving is embedded in store development.
Due to the group’s growth and focus on expanding our footprint, and despite the five-week lockdown, the division completed 141 refurbishments and maintenance actions and 147 new store developments.
The development and installation within 48 hours of a pop-up shop for Refinery for Black Friday in 2019 was a first for the group, and testament to the division’s collaborative and agile capability. It was also instrumental in the design and space planning of the new look and new brand implementation of PEP.
The division will continue to partner with the group’s retail brands and develop further value-added services.
100 employees
3 000 m2 manufacturing facility
34 teams across SA manage 2 000 maintenance service agreements
147 new stores rolled out in FY20
Manufactured more than 6 000 sanitiser stands and perspex screens to make stores COVID-19-compliant when lockdown restrictions were lifted.
Development of new PEP brand store and PEP brand application
Services � Research and development
� Procurement and sourcing
� Manufacturing
� Warehousing and logistics
� Shopfitting and installations
� Electrical works and maintenance
Pepkor Installations made and installed sanitiser stands and protective perspex screens to have the stores and offices COVID-19 ready after lockdown.
Main areas of activity
New stores and refurbishments
67%Electrical
installationsand
maintenance
33%

Enabling CFH retailers to build strategic sourcing and technical capabilitiesPepkor Sourcing & Services supports Pepkor’s CFH retailers in building strategic sourcing and technical capabilities for the procurement of retail products. A small central team works closely with brands’ buying and logistics teams to manage the product journey from procurement to arrival at the distribution centre.
The team works closely with international buying agents, including Pepkor Global Sourcing, which is situated in China. The Pepkor Sourcing & Services division is currently working on centralising more of the sourcing functions. Current focus areas are supplier compliance and exploring opportunities to increase local and regional sourcing.
The use of 3D technology has been a focus, with Refinery, PEP and PEP Africa executing digital 3D product design in certain categories. This is proving to provide a better and more consistent fit of garments for our customers. It has also helped in the COVID-19 lockdown, when digital product design and 3D sampling with suppliers proved to be beneficial. The 3D initiative forms part of the group’s digital transformation drive.
The lifeline of the businessPepkor Logistics (PKL) provides a product distribution service for Pepkor’s CFH brands. It is geared to provide the most cost-effective and efficient delivery services to stores that operate six days a week. To provide its extensive service across South Africa and the BLNE (Botswana, Lesotho, Namibia and eSwatini) countries, it relies on advanced technological infrastructure. PKL’s service is dedicated to removing as much cost as possible from the supply chain to maintain a low cost of doing business.
PKL consolidates the distribution between brands, routes and destinations, and uses volume to manage costs. Load density plays a significant role in managing costs and optimising packing according to product and box sizes. It also minimises cost and claims from damaged goods. Routes are mapped out daily, and a central IT system links stock to stores.
Although PKL draws on digitisation and data analysis to plan, track and map a parcel’s journey, human interaction is the golden thread that keeps the wheels turning. The right skills are critical to ensure that all aspects of the delivery process are executed correctly. Driver services are outsourced, yet PKL plays a direct role in managing the outsourced function. Good relationships with the drivers are critical, as they have route experience and are the interface with the stores.
Good progress made in implementation of 3D sampling
Increased focus on local procurement
Supporting the South African Retailer – Clothing, Textiles, Footwear and Leather Master Plan (SA R–CTFL) in job creation
Services � Using 3D in product development and other areas
� Local and regional sourcing opportunities
� Supplier and enterprise development
� Value-added sourcing
� Group contract negotiations and compliance
� Quality control, shipment tracking, buying support, supplier and trend tours
Services � Distribution efficiencies
� Long-haul DC connections (cross-dock)
� Daily store delivery
200 employees
10 DCs
3 primary hubs 15 secondary hubs
4 149 delivery points (daily deliveries to 3 800 stores)
24 million km distribution network managed centrally
24 million cartons distributed annually
2.34 deliveries per store per week (average)
PEPKOR INTEGRATED REPORT 2020 71

PEPKOR INTEGRATED REPORT 2020 GROUP PERFORMANCE CONTINUED
72
Enriching lives through innovationPepkor IT reduces operational costs and strengthens productivity of Pepkor’s retail businesses. Services, including IT strategy, engineering and development, play an important role in helping the group’s various brands to develop effective and bespoke technology solutions to operate in a competitive environment.
Technology-based protection, dedication of experts, and awareness of end-users are the foundations of the Pepkor IT approach to protection against cyberthreats. Various layers of protection are implemented on the network perimeter, at the end-user layer, application layer, and data security layer. International and industry approved frameworks are used as best practice for IT governance and security.
IT played a role in the group’s digital transformation by enabling office employee mobility through G Suite roll-outs, efficiency and insight gains, moving vast amounts of data to the fast-processing Google Cloud Platform, and supporting the retailers’ e-commerce strategies through integration of core retail solutions.
An important matter for the division is recruiting and retaining the right talent, because of the highly technical and advanced operating environment. There is a focus to develop employment equity candidates in IT. In the last three years, 33 interns were certified in IT, all of whom have been permanently employed, either at Pepkor IT, or in one of the group’s other operating divisions.
Pepkor IT continuously works on non-commissioned innovation projects that build internal capacity and enable technological advancement to enhance the capabilities of the brands to achieve their strategies.
The division plans to work closely with Pepkor clothing brands in the next year to roll out a new group point-of-sale system, while innovating various e-commerce, distribution centre and core enterprise resource planning solutions.
236 employees
Centralised IT across 4 112 stores
Logistics IT infrastructure solutions direct and track the delivery of 24 million cartons annually to stores and 1.9 million PAXI parcel deliveries
1 500 office employees and 32 store service desk agents moved into a work-from-home environment
Closed and reopened all stores through remote agents, and maintained system stability with record volume of traffic after stores reopened for trade
Zero breaches in IT security, while fending off more than 25 000 device attempts to gain entry or information
Services � Digital transformation
� Infrastructure development
� Design, development and implementation of systems
� Maintenance
All stores were closed and customer care agents moved out of call centres within 48 hours of the COVID-19 lockdown announcement.

The superpower of analytics is to get insights from data as quickly as possible. D&A developed a self-service basket analyser for the divisional brands that provides real-time basket information as customers transact at the point of sale. This tool is used in store and online.
D&A does customer analysis based on the information our customers share with us. This provides the group with information that our brands can use in their communication strategies, store location opportunities, merchandising planning and buying, and new product development.
Putting bespoke advanced analytics at the core of everyday decision-makingThe core function of Pepkor Data & Analytics (D&A) is to analyse customer, store and merchandise data, delivering insights that assist the group’s divisions in better decision-making, specifically around revenue optimisation and improved profitability. They also build predictive models based on analytics and machine learning to guide shopping behaviour. Data is used to provide an end-to-end solution for retail brands, delivering communication initiatives to their customers. Based on the data that customers share with the group, customer experience and communication are made more relevant by considering customer segments and individual preferences and attributes.
Due to the nature of the data that resides within the group’s divisions, and D&A being the main users of the data, this division has also been tasked with the group’s compliance with the Protection of Personal Information Act (POPIA).
22 data scientists and engineers
More than 20 million known customers interact with the group
6.2 million monthly communications with customers
38% of customers shop at more than one Pepkor brand
Advanced analytics directly contributed to retailers’ profitability
Services � Trusted and reliable customer and basket data considered as the single version of the truth throughout the group, continually enriched by external sources
� Single view of customer across the group and products
� Fast delivery of insights by providing an easily accessible information platform that promotes self-service analytics, thus increasing the ability to use data as an asset
� Fully integrated platform that enables brands to engage with our customers through various channels in a personalised manner
� Bespoke predictive and prescriptive models addressing specific business questions that deliver value to the group
� Prescriptive models delivering decision support through optimisation
� Data governance and protection framework in line with POPIA
PEPKOR INTEGRATED REPORT 2020 73

PEPKOR INTEGRATED REPORT 2020 GROUP PERFORMANCE CONTINUED
74
1 700 permanent employees
8.5 million garments produced annually
4.4 million flip-flops manufactured
R30 million invested in a new flip-flop manufacturing facility to create 40 new jobs
2 million face masks and 500 000 disposable protective gowns produced
People with heart making garments with heartPepClo is a low-cost, high-volume mass manufacturer of school clothes and basic footwear that supplies the group through six factory divisions. It is also the largest clothing manufacturing facility under one roof in South Africa.
PepClo will be expanding into a second facility, specifically for the production of flip-flops. Local procurement and employment are key priorities and, as such, Pepkor is committed to the South African government’s R-CTFL Master Plan to 2030. After two years of proven success of bringing flip-flop production on-shore, we have commissioned a new facility to provide more space for the increase in production demand. This investment is in line with efforts to help the South African economy, expand its production sectors and promote local procurement and employment. The new flip-flop facility will employ an additional 40 permanent employees.
Pepkor is also well-placed through its PepClo structures to participate in the other ‘Master Plan’ forums and activities, such as initiatives around measures to combat illegal imports of raw materials and apparel items, as well as import duty rebates for textile materials.
The COVID-19 lockdown period has impacted negatively the demand for consumer goods and clothing items, including school clothing. This resulted in a shortfall in PepClo’s turnover, which in turn caused production gaps. The impact on the business and employee earnings was minimised by the rapid response of the factory to convert to making much needed three-ply cloth masks in the early stages of the pandemic. Disposable protective gowns were also designed and manufactured, with the first 500 gowns sponsored by Pepkor.
Focus for the new financial year will be to lower PepClo’s cost of doing business, to lift production efficiency in order to lower the cost per unit produced, and to secure ongoing disposable gown production. This is particularly challenging in light of the COVID-19 pandemic, as absenteeism and social distancing have had a negative impact on productivity. Ongoing load-shedding remains an area of concern, as it results in loss of production, lower efficiencies, and an inability to deliver critical orders on time and in full. With advance notice and scheduling, PepClo is able to manage production to some extent.
Services � Manufacture of school clothes, basic underwear and disposable gowns
� Textile laboratory testing
� Flip-flop production
PepClo employs 2 000 people on average every year (1 700 permanent and 300 temporary employees), of whom 84% are women. Many of the employees are from single-income homes and their employment plays a crucial part in the economic sustainability of their families and communities.

600 employees
2 million inbound service calls per annum
Supports 6 clothing and general merchandise brands
1.6 million applications processed
250 000 new account activations
5 geographical jurisdictions
Tenacity’s services assist retailers with direct growth in turnover, and its call centre staff substantially enhance their customers’ retail experience and thereby customer relationships with continued customer support. Employees become an extension of the brands they represent, and are incentivised and continuously recognised for their level of service.
Experts in the management of private label credit cardsTenacity Financial Services has been part of Pepkor since 2007, and is a specialist in the management of in-store credit card programmes. It provides customer payment solutions for Refinery, Ackermans, Shoe City, Dunns, Tekkie Town and John Craig, with a value proposition that includes private label cards, lay-bys, gift cards, virtual vouchers, payment applications and payment options.
Tenacity Financial Services’ credit programmes are highly regarded for their simple pricing structures, quick time to market and ongoing professional support. The benefits to the group’s brands that have credit facilities are a lower cost of customer acquisition and low service cost per account. Tenacity manages the on-boarding of new credit clients through stringent credit granting procedures and the collection of payments.
The COVID-19 pandemic had an adverse effect on the business directly due to five-week store closures. Many of the group’s customers apply for and pay their accounts in store. The closure resulted in a dramatic reduction of active accounts and low payment numbers. There was also a dramatic decline in new account sign-ons, partly due to the store closures, but also because of stricter credit granting criteria.
During the most stringent lockdown period, we saw a decrease in payments due to store closures, despite considerable efforts to migrate customers to electronic payments. To support customers, we implemented a temporary book freeze for the March payment cycle. It was not a payment holiday, as we still billed the instalment. However, we effectively prevented the current customer base from rolling into ‘technical arrears’. This freeze was removed when stores reopened and payment could be accepted in stores. Payments from customers recovered towards the end of the year and exceeded expectations.
Tenacity implemented some short-term solutions by increasing and retraining call centre employees, and outsourced all non-South African interactions to local country external debt collectors to handle inbound collections calls.
Tenacity will continue to support retail brands to generate sales and will manage credit risk through conservative credit granting.
Services � Client relationships and customer feedback
� Complaints handling
� Digital transformation initiatives
PEPKOR INTEGRATED REPORT 2020 75

PEPKOR INTEGRATED REPORT 2020 GROUP PERFORMANCE CONTINUED
76
THE BUILDING COMPANY HAS DONE WELL TO RESTRUCTURE AND CONSOLIDATE
BUILDING MATERIALS: DISCONTINUED OPERATIONSTHE BUILDING
COMPANY
IntroductionThe Building Company (TBCo) is classified as a discontinued operation following Pepkor’s decision to dispose of the business and to focus on its core discount and value retail business. This transaction is expected to have a positive effect on the competitiveness of TBCo, as it will allow for mutual value-add opportunities with its purchaser. The disposal is subject to certain conditions and completion is expected in FY21.
TBCo is a leading southern African building materials retail and wholesale business, providing a full spectrum service offering to the construction industry, including residential, commercial and industrial markets, with a core competency of servicing building contractors. It operates across three divisions, incorporating numerous established and well-known trading and product brands.
OverviewTBCo brands
� Retail: BUCO, Timbercity and Chipbase
� Wholesale: MacNeil, Cachet, Citiwood and Brands4Africa
� Specialist: Buchel, W&B Hardware, Bildware, B-One, Tiletoria and Floors Direct
Throughout the lockdown, our teams supported our customers who provided essential services and contributed to projects that helped in the fight against the COVID-19 pandemic.
‘Their service is on point. Time is money, they don’t waste your time awaiting services.’ Admire Zvirime, TSK Construction site supervisor, BUCO customer.

THE BUILDING COMPANY IN NUMBERS
Products and servicesRetail divisionThe retail division offers a full range of building materials and value-adding services throughout southern Africa to public customers and contractors who make a living using its products and services in the construction industry.
Wholesale divisionA large portion of the division consists of cross-border distribution, break-bulk and logistics. The wholesale division specialises in the wholesale of mostly imported and value-add building materials and products. The customer portfolio includes stockists and building material retailers and the division has a 100% B2B value proposition.
Specialist divisionThis division predominantly serves the B2B market that includes mostly specialist products suppliers and specifiers. The majority of its goods are differentiated, imported products offering extensive choice per range.
Strategy and approachTBCo’s vision is to be the building material provider of choice in the markets it serves. Through its various brands, it provides quality building materials and services with customer-centricity being core to the business model. Each business division continues to develop its own value proposition that is complementary to the group’s vision.
115 stores
5 500 employees
4 countries
Wholesale
20%
Revenue contribution
Retail
71%
Specialist
9%
OPERATIONAL HIGHLIGHTS AND SUMMARY
Refined strategic roadmap
Digital transformation of business processes
� Restructured trading activities for:
• the retail division through improved and streamlined operational processes;
• the flooring category of the business through the consolidation of Tiletoria and Floors Direct; and
• the ironmongery cluster by establishing a monolithic brand value proposition and store optimisation.
� Centralised procurement through the establishment of a support office merchandise structure
� Launched a retail e-commerce platform
� Adopted digital and direct marketing activities
PEPKOR INTEGRATED REPORT 2020 77

PEPKOR INTEGRATED REPORT 2020 GROUP PERFORMANCE CONTINUED
78
Performance overviewRevenue and merchandise sales declined by 12.6% to R7.2 billion and like-for-like sales declined by 11.3%. Despite a very challenging environment, the business achieved break-even.
TBCo made good progress during the year in key focus areas, including margin management, working capital and cash flow. It streamlined the extensive brand portfolio of operating entities into its existing three divisions to reduce cost and to advance its digital transformation roadmap. While good progress was made in these areas, the COVID-19 pandemic impacted performance. During the lockdown period when only essential services could trade, TBCo experienced a dramatic slowdown in trading activity, particularly when only essential services could trade in the construction industry. While TBCo strategically supported its customers during this time by opening stores, it incurred the cost of operations with very little turnover. The COVID-19 lockdown also impacted TBCo’s suppliers, which led to product supply shortages that further weighed on performance.
Since trade started opening up in May 2020, business levels have normalised with good improvement in trading since July. The rural and informal sectors were the first to recover, followed by the formal contractor market, where trading volumes have almost returned to prior year levels.TBCo has embraced the COVID-19 lockdown as an opportunity to explore all aspects of the business and right-size the company to operate in a trading environment under a ‘new normal’ level of activity. This has resulted in all elements of the cost base being explored and restructured.
OutlookTBCo, like all businesses around the world, was severely affected by the COVD-19 pandemic. The government’s alert level model initially shut down all commercial construction activity and gradually leased the restrictions as the various levels of the model were adjusted. Generally, this period has had a dramatic impact on the southern African construction industry and all aspects of the value chain that are reliant on and operate in this environment.
As the pandemic is not yet over, TBCo remains cautious about future prospects of the industry and will focus on its customer value proposition.
Corporate responsibility
TBCo focuses its CSI initiatives on building, structural and aesthetic improvements, which have synergy with their core business – building materials.
To achieve this, TBCo is committed to making meaningful contributions to the communities in which it operates through assisting formally registered organisations that are focused on restoring, rebuilding and/or renovating spaces, or where the products they provide can be used to supplement projects. For FY20, TBCo partnered with Ranyaka Community Transformation, an NPO that works hand-in-hand with communities, local stakeholders, all levels of government, and investors to develop and implement transformation strategies for towns and communities across South Africa.
The total CSI contribution of building material to the value of R1.1 million from BUCO stores was donated to Ranyaka, towards the commitment to assist with four Fix My Space Projects. These projects are located around Cape Town, where BUCO has a relatively wide store footprint. This partnership will continue for the foreseeable future.
Ranyaka was established as a non-profit, urban planning consultancy in 2013 and does work in 13 communities and eight towns across seven provinces in South Africa.

All our employees worked together to adhere to the rules, keeping themselves, their colleagues and our customers safe. As we started trading again, work continued with the least amount of disruption, and the group’s sick days and absenteeism maintained average levels compared to previous years. Thank you to everyone.
PEPKOR INTEGRATED REPORT 2020 79

PEPKOR INTEGRATED REPORT 2020 80
IN THIS SECTION
Acronyms and terminologyPage 82
Pro forma financial informationPage 83
Retail footprintPage 91
ADDITIONAL INFORMATION
Accessibility. We serve our customers through our footprint and retail channels.

TEGEGNE AYELE LOMBESE, Flash trader
‘Success is for those who persevere the most.’
PEPKOR INTEGRATED REPORT 2020 81

PEPKOR INTEGRATED REPORT 2020 ADDITIONAL INFORMATION CONTINUED
82
ACRONYMS AND TERMINOLOGY
API Application programming interface
B-BBEE Broad-based black economic empowerment
B2B Business to business
BLNE Botswana, Lesotho, Namibia and eSwatini
BPL Best price leadership
CFH Clothing, footwear and homeware
CoCare CoCare is a digital voucher programme that works with local and regional non-governmental organisations (NGOs) to determine which communities are most at risk regarding food and economic security
COVID-19 Novel coronavirus (SARS-CoV-2)
DMTN Domestic Medium-Term Note
EBITDA Earnings before interest, income tax, depreciation and amortisation
ESG Environmental, social and governance
FMCG Fast-moving consumer goods
IFRS International Financial Reporting Standards
IIRC International Integrated Reporting Council
ILO International Labour Organisation
IT Information and technology
JSE Johannesburg Stock Exchange
KING IV™ King IV Code on Corporate Governance™ for South Africa, 2016, published as part of the King IV™ Report
KPI Key performance indicator
Lay-by A system of paying for goods in small amounts and receiving the goods after the full amount has been paid
NPO Non profit organisation
OECD Organisation for Economic Co-operation and Development
PAXI Parcel delivery service brand of PEP
PKL Pepkor Logistics
POPIA Protection of Personal Information Act
R-CTFL Retail – Clothing, Textile, Footwear and Leather
RLC Retailers’ Liaison Committee
SAICA South African Institute of Chartered Accountants
SASSA South African Social Security Agency
SEM Socio-economic measure (previously LSM)
SIM Subscriber identification module
SME Small and medium enterprise
STI Short-term incentive
tCO2e Tonnes of carbon dioxide equivalent
TERS Temporary Employer/Employee Relief Scheme
UNGC United Nations Global Compact
VAS Value-added service

Report on the assurance engagement on the compilation of pro forma financial information included in the Pepkor Holdings Limited results for the year ended 30 September 2020
PRO FORMA FINANCIAL INFORMATION ASSURANCE REPORT
To the Directors of Pepkor Holdings Limited We have completed our assurance engagement to report on the compilation of the pro forma financial information of Pepkor Holdings Limited (the company) and its subsidiaries (the group) by the directors. The pro forma financial information, as set out on pages 85 to 90 of the Pepkor Holdings Limited results for the year ended 30 September 2020, consist of the impact of the group’s pro forma constant currency disclosure and the impact of the reversal of the implementation of IFRS 16 on the condensed consolidated statement of financial position as at 30 September 2020, condensed consolidated income statement, condensed consolidated statement of cash flows for the year ended 30 September 2020, pro forma financial effects and related notes (Pro Forma Financial Information). The applicable criteria on the basis of which the directors have compiled the pro forma financial information are specified in the JSE Limited (JSE) Listings Requirements and described in the Pro Forma Financial Information section of the Pepkor Holdings Limited Results for the year ended 30 September 2020.
The pro forma financial information has been compiled by the directors to illustrate the impact of the group’s pro forma constant currency disclosure and the impact of the implementation of IFRS 16 on the condensed consolidated statement of financial position as at 30 September 2020, condensed consolidated income statement, condensed consolidated statement of cash flows for the year ended 30 September 2020, pro forma financial effects and related notes. As part of this process, information about the group’s financial position and financial performance has been extracted by the directors from the group’s financial statements for the year ended 30 September 2020, on which a review report has been published.
Directors’ responsibilityThe directors of the company are responsible for compiling the pro forma financial information on the basis of the applicable criteria specified in the JSE Listings Requirements and described in the Pro Forma Financial Information section
of the Pepkor Holdings Limited results for the year ended 30 September 2020.
Our independence and quality control We have complied with the independence and other ethical requirements of the Code of Professional Conduct for Registered Auditors, issued by the Independent Regulatory Board for Auditors (IRBA Code), which is founded on fundamental principles of integrity, objectivity, professional competence and due care, confidentiality and professional behaviour. The IRBA Code is consistent with the corresponding sections of the International Ethics Standards Board for Accountants’ International Code of Ethics for Professional Accountants (including International Independence Standards).
The firm applies International Standard on Quality Control 1 and, accordingly, maintains a comprehensive system of quality control, including documented policies and procedures regarding compliance with ethical requirements, professional standards and applicable legal and regulatory requirements.
Reporting accountant’s responsibilityOur responsibility is to express an opinion about whether the pro forma financial information has been compiled, in all material respects, by the directors on the basis of the applicable criteria specified in the JSE Listings Requirements and described in the Pro Forma Financial Information section of the Pepkor Holdings Limited financial results for the year ended 30 September 2020 based on our procedures performed.
We conducted our engagement in accordance with the International Standard on Assurance Engagements (ISAE) 3420, Assurance Engagements to Report on the Compilation of Pro Forma Financial Information Included in a Prospectus issued by the International Auditing and Assurance Standards Board. This standard requires that we plan and perform our procedures to obtain reasonable assurance about whether the pro forma financial information has been compiled, in all material respects, on the basis specified in the JSE Listings Requirements.
PEPKOR INTEGRATED REPORT 2020 83

PEPKOR INTEGRATED REPORT 2020 ADDITIONAL INFORMATION CONTINUED
84
For purposes of this engagement, we are not responsible for updating or reissuing any reports or opinions on any historical financial information used in compiling the pro forma financial information, nor have we, in the course of this engagement, performed an audit or review of the financial information used in compiling the pro forma financial information.
The purpose of pro forma financial information is solely to illustrate the impact of a significant event or transaction on unadjusted financial information of the company as if the event had occurred or the transaction had been undertaken at an earlier date selected for purposes of the illustration. Accordingly, we do not provide any assurance that the actual outcome of the event or transaction would have been as presented.
A reasonable assurance engagement to report on whether the pro forma financial information has been compiled, in all material respects, on the basis of the applicable criteria involves performing procedures to assess whether the applicable criteria used by the directors in the compilation of the pro forma financial information provide a reasonable basis for presenting the significant effects directly attributable to the event or transaction, and to obtain sufficient appropriate evidence about whether:
� the related pro forma adjustments give appropriate effect to those criteria; and
� the pro forma financial information reflects the proper application of those adjustments to the unadjusted financial information.
The procedures selected depend on our judgement, having regard to our understanding of the nature of the company, the event or transaction in respect of which the pro forma financial information has been compiled, and other relevant engagement circumstances.
Our engagement also involves evaluating the overall presentation of the pro forma financial information.
We believe that the evidence we have obtained is sufficient and appropriate to provide a basis for our opinion.
OpinionIn our opinion, the pro forma financial information has been compiled, in all material respects, on the basis of the applicable criteria specified by the JSE Listings Requirements and described in the Pro Forma Financial Information section of the Pepkor Holdings Limited Results for the year ended 30 September 2020.
PRICEWATERHOUSECOOPERS INC.Director: D de JagerRegistered auditor
Stellenbosch 23 November 2020

Pro forma condensed consolidated income statement
Notes
As reportedYear ended
30 Sep20201
ReviewedRm
IFRS 16adjustmentYear ended
30 Sep 2020
ReviewedRm
Pro formaafter
IFRS 16adjustmentYear ended
30 Sep 2020
ReviewedRm
As reportedYear ended
30 Sep 20191
ReviewedRm
% changeon prior
year
Revenue 63 679 – 63 679 61 454 3.6Cost of sales 3 (41 237) 26 (41 211) (39 055) (5.5)Gross profit 22 442 26 22 468 22 399 0.3Operating income 703 32 735 887 (17.1)Operating expenses 2 (11 323) (3 589) (14 912) (14 421) (3.4)Debtors’ costs (1 670) – (1 670) (1 126) (48.3)Operating profit before depreciation, amortisation and capital items 10 152 (3 531) 6 621 7 739 (14.4)Depreciation and amortisation 3 (3 628) 2 347 (1 281) (1 195) (7.2)Operating profit before capital items 6 524 (1 184) 5 340 6 544 (18.4)Capital items 4 (5 140) 235 (4 905) (60) (> 100)Operating profit 1 384 (949) 435 6 484 (93.3)Finance costs 5 (3 138) 1 553 (1 585) (1 704) 7.0Finance income 219 – 219 129 69.8(Loss)/profit before associated income (1 535) 604 (931) 4 909 (> 100)Share of net profit of associate 2 – 2 – 100.0(Loss)/profit before taxation (1 533) 604 (929) 4 909 (> 100)Taxation 6 (1 293) 21 (1 272) (1 674) 24.0(Loss)/profit from continuing operations (2 826) 625 (2 201) 3 235 (> 100)Loss from discontinued operations 7 (208) (181) (389) (1 074) 63.8(Loss)/profit for the year (3 034) 444 (2 590) 2 161 (> 100)
(Loss)/profit attributable to:Owners of the parent (3 034) 444 (2 590) 2 161 (> 100)Non-controlling interests – – – –(Loss)/profit for the year (3 034) 444 (2 590) 2 161 (> 100)
Earnings per share (cents) 12Total basic earnings per share from continuing operations (80.3) 17.8 (62.5) 93.8 (> 100)Total basic earnings per share from discontinued operations (5.9) (5.1) (11.0) (31.1) 64.5Total basic earnings per share (86.2) 12.6 (73.6) 62.6 (> 100)Total headline earnings per share from continuing operations 62.6 12.8 75.4 95.5 (21.0)Total headline earnings per share from discontinued operations 2.9 (4.5) (1.5) 1.3 (> 100)Total headline earnings per share 65.5 8.4 73.9 96.8 (23.7)Total diluted earnings per share from continuing operations (79.4) 17.6 (61.8) 93.2 (> 100)Total diluted earnings per share from discontinued operations (5.9) (5.1) (11.0) (30.9) 64.5Total diluted earnings per share (85.3) 12.5 (72.8) 62.2 (> 100)Total diluted headline earnings per share from continuing operations 62.0 12.7 74.7 94.9 (21.3)Total diluted headline earning per share from discontinued operations 2.9 (4.4) (1.5) 1.3 (> 100)Total diluted headline earnings per share 64.9 8.3 73.2 96.2 (23.9)¹ Extracted without modification from the group’s condensed consolidated financial statements for the year ended 30 September 2020.
PRO FORMA FINANCIAL INFORMATIONThe pro forma financial information excludes the impact of IFRS 16 presented in the condensed consolidated financial statements.
PEPKOR INTEGRATED REPORT 2020 85

PEPKOR INTEGRATED REPORT 2020 ADDITIONAL INFORMATION CONTINUED
86
Pro forma condensed consolidated income statement from discontinued operations
Notes
As reportedYear ended
30 Sep20201
ReviewedRm
IFRS 16adjustmentYear ended
30 Sep 2020
ReviewedRm
Pro formaafter
IFRS 16adjustmentYear ended
30 Sep 2020
ReviewedRm
As reportedYear ended
30 Sep 20191
ReviewedRm
% changeon prior
year
Revenue 7 247 – 7 247 8 227 (11.9)Cost of sales (5 764) – (5 764) (6 604) 12.7Gross profit 1 483 – 1 483 1 623 (8.6)Operating income 48 – 48 73 (34.2)Operating expenses 2 (1 018) (277) (1 295) (1 484) 12.7Debtors’ costs (63) – (63) (11) (> 100)
Operating profit before depreciation, amortisation and capital items 450 (277) 173 201 (13.9)Depreciation and amortisation 3 (266) 167 (99) (104) 4.8Operating profit before capital items 184 (110) 74 97 (23.7)Capital items 4 (301) (32) (333) (1 236) 73.1Operating loss (117) (142) (259) (1 139) 77.3Finance costs 5 (144) 90 (54) (76) 28.9Finance income 50 – 50 70 (28.6)Loss before taxation (211) (52) (263) (1 145) 77.0Taxation 6 7 (129) (122) 71 (> 100)Loss from discontinued operations (204) (181) (385) (1 074) 64.2
Loss attributable to:Owners of the parent (204) (181) (385) (1 074) 64.2Non-controlling interests (4) – (4) – (100.0)Loss for the year (208) (181) (389) (1 074) 63.8
Pro forma condensed consolidated segmental analysis
As reportedYear ended
30 Sep20201
ReviewedRm
IFRS 16adjustmentYear ended
30 Sep 2020
ReviewedRm
Pro formaafter
IFRS 16adjustmentYear ended
30 Sep 2020
ReviewedRm
As reportedYear ended
30 Sep 20191
ReviewedRm
% changeon prior
year
OPERATING PROFIT BEFORE CAPITAL ITEMS AND BVI-RELATED COSTSClothing and general merchandise2, 3 6 176 (916) 5 260 6 130 (14.2)Furniture, appliances and electronics (55) (246) (301) (85) (> 100)Building materials4 129 (129) – 153 (> 100)FinTech 458 (3) 455 483 (5.8)
6 708 (1 294) 5 414 6 681 (19.0)
1 Extracted without modification from the group’s condensed consolidated financial statements for the year ended 30 September 2020.2 Prior year segmental operating profit includes an adjustment of R40 million for BVI-related costs incurred. 3 Operating profit before capital items for this segment includes R55 million (pro forma R74 million) (2019: R56 million loss) relating to discontinued operations.4 Operating profit before capital items for this segment has been classified as discontinued operations.
PRO FORMA FINANCIAL INFORMATION continued

Pro forma condensed consolidated statement of financial position
Notes
As reportedAs at
30 September 20201
ReviewedRm
IFRS 16adjustment
As at30 September
2020Reviewed
Rm
Pro forma after
IFRS 16adjustment
As at30 September
20191
ReviewedRm
As reportedAs at
30 September 2019
ReviewedRm
ASSETSNon-current assetsGoodwill 37 280 – 37 280 41 865 Intangible assets 18 028 – 18 028 17 979 Property, plant and equipment 9 5 176 (77) 5 099 5 466 Right-of-use assets 8 10 770 (10 770) – –Interest in associated companies 52 – 52 50 Investments and loans 108 – 108 174 Loans to customers 81 – 81 154 Deferred taxation assets 6, 8 2 468 (967) 1 501 1 242
73 963 (11 814) 62 149 66 930
Current assetsInventories 10 729 – 10 729 13 825 Trade and other receivables 9 6 157 24 6 181 6 809 Loans to customers 1 335 – 1 335 1 669 Insurance and reinsurance receivables 9 – 9 –Current income taxation assets 284 – 284 363 Cash and cash equivalents 5 241 – 5 241 3 925
23 755 24 23 779 26 591 Non-current assets held for sale 10 4 060 (836) 3 224 –
27 815 (812) 27 003 26 591 Total assets 101 778 (12 626) 89 152 93 521
¹ Extracted without modification from the group’s condensed consolidated financial statements for the year ended 30 September 2020.
PRO FORMA FINANCIAL INFORMATION continued
PEPKOR INTEGRATED REPORT 2020 87

PEPKOR INTEGRATED REPORT 2020 ADDITIONAL INFORMATION CONTINUED
88
Pro forma condensed consolidated statement of financial position continued
Notes
As reportedAs at
30 September 20201
ReviewedRm
IFRS 16adjustment
As at30 September
2020Reviewed
Rm
Pro forma after
IFRS 16adjustment
As at30 September
20191
ReviewedRm
As reportedAs at
30 September 2019
ReviewedRm
EQUITY AND LIABILITIESCapital and reservesOrdinary stated capital 67 234 – 67 234 64 690 Reserves 8 (14 027) 2 891 (11 136) (8 098)Total equity attributable to equity holders of the parent 53 207 2 891 56 098 56 592 Non-controlling interests 9 – 9 6 Total equity 53 216 2 891 56 107 56 598
Non-current liabilitiesInterest-bearing loans and borrowings 12 520 – 12 520 15 508 Lease liabilities 8 13 021 (13 021) – –Employee benefits 86 – 86 89 Deferred taxation liabilities 3 933 – 3 933 4 037 Provisions 91 – 91 91 Trade and other payables 6 – 432 432 461
29 651 (12 589) 17 062 20 186
Current liabilitiesTrade and other payables 6, 9 10 754 178 10 932 11 792 Insurance and reinsurance payables 49 – 49 –Lease liabilities 8 2 064 (2 064) – –Employee benefits 794 – 794 942 Provisions 175 – 175 173 Current income taxation liabilities 2 018 – 2 018 1 480 Interest-bearing loans and borrowings – – – 1 510 Financial guarantees – – – 491 Bank overdrafts and short-term facilities 241 – 241 347
16 095 (1 886) 14 209 16 735 Liabilities associated directly with non-current assets classified as held for sale 10 2 816 (1 042) 1 774 2
18 911 (2 928) 15 983 16 737 Total equity and liabilities 101 778 (12 626) 89 152 93 521 Net asset value per ordinary share (cents) 1 453.6 79.0 1 532.6 1 640.4
Pro forma condensed consolidated statement of cash flows
As reportedAs at
30 September 20201
ReviewedRm
IFRS 16adjustment
As at30 September
2020Reviewed
Rm
Pro forma after
IFRS 16adjustment
As at30 September
20191
ReviewedRm
As reportedAs at
30 September 2019
ReviewedRm
Net cash inflow from operating activities 11 8 667 (2 033) 6 634 556 Net cash outflow from investing activities (2 187) – (2 187) (1 576)Net cash (outflow)/inflow from financing activities 11 (4 549) 2 033 (2 516) 1 306 ¹ Extracted without modification from the group’s condensed consolidated financial statements for the year ended 30 September 2020.
PRO FORMA FINANCIAL INFORMATION continued

Notes to the pro forma financial information1 The pro forma financial information, which is the responsibility of the group’s directors, has been prepared in order to illustrate the
impact should IFRS 16 not have been applied and is presented for illustrative purposes only. The pro forma financial information is presented in accordance with the JSE Listings Requirements and the SAICA Guide on Pro Forma Financial Information. Therefore, because of its nature, the pro forma financial information may not fairly present the group’s financial position, results of operations or cash flows. An assurance report (in terms of ISAE 3420: Assurance Engagements to Report on the Compilation of Pro Forma Financial Information included in a Prospectus issued by the International Auditing and Assurance Standards Board), has been issued by the group’s auditors, PricewaterhouseCoopers Inc., in respect of the pro forma financial information included in this announcement. The pro forma financial information, as set out below, should be read in conjunction with this assurance report.
2 The net effect of the following transactions in order to add back the IFRS 16 effect and reinstate the IAS 17 effect:
Effect of adopting IFRS 16As at 30 September 2020
Continuing operationsReviewed
Rm
Effect of adopting IFRS 16As at 30 September 2020
Discontinued operationsReviewed
Rm
Reinstate operating lease expense (3 390) (277)Reinstate equalisation of operating lease payments (9) –Reverse profit on modification (371) (9)Reverse foreign exchange losses 181 9
(3 589) (277)3 Right-of-use assets are depreciated on a straight-line basis over the period of the lease term in accordance with IFRS 16. These
adjustments reverse the depreciation on right-of-use assets.
4 Right-of-use assets are tested for impairment when impairment indicators are identified in accordance with IAS 36. These adjustments reverse the impairment (continuing operations) or reversal of impairment (discontinued operations) that was required due to the recognition of right-of-use assets in accordance with IFRS 16.
5 Lease liabilities are subsequently measured at amortised cost using the effective interest method and reduced by future lease payments net of interest charged in accordance with IFRS 16. These adjustments reverse the effective interest recognised during the year pertaining to the lease liability.
6 Effect of reversing the deferred taxation effect on the net right-of-use asset and liability under IFRS 16 and reinstatement of deferred taxation effect relating to the equalisation of operating lease payments under IAS 17 and onerous leases under IAS 37.
7 Net effect of reversing notes 2 to 6 to the pro forma financial information relating to discontinued operations.
8 Effect of reversing the right-of-use assets net of impairments and lease liabilities under IFRS 16 with the corresponding deferred taxation and net opening retained earnings effect.
9 Effect of reversing the reclassification of finance leases and lease incentives to the right-of-use asset and reinstating prepaid rentals.10 Net effect of reversing notes 8 and 9 to the pro forma financial information relating to discontinued operations.11 Reclassification of presentation within the cash flow due to the recognition of right-of-use assets and lease liabilities in accordance
with IFRS 16.12 Pro forma earnings per share, diluted earnings per share, headline earnings and diluted headline earnings per share are calculated on
the same basis and using the same weighted average number of ordinary shares and weighted average number of dilutive ordinary shares as per note 6 of the notes to the condensed consolidated financial statements.
Pro forma headline earnings are adjusted for the post-taxation (impairment)/impairment reversal effect of the right-of-use assets under IAS 36 as below:
Continuingoperations
Rm
Discontinuedoperations
Rm
Pro forma earnings attributable to ordinary shareholders (2 201) (385) Capital items (note 3) 5 140 301Taxation effect on capital items (note 6) (111) 10Right-of-use asset (impairment)/impairment reversal (note 3) (235) 32Taxation effect on (impairment)/impairment reversal of right-of-use assets 62 (9)Pro forma headline earnings attributable to ordinary shares 2 655 (51)
PRO FORMA FINANCIAL INFORMATION continued
PEPKOR INTEGRATED REPORT 2020 89

PEPKOR INTEGRATED REPORT 2020 ADDITIONAL INFORMATION CONTINUED
90
Pro forma constant currency disclosureThe Pepkor group discloses unaudited constant currency information to indicate PEP Africa’s performance in terms of sales growth, excluding the effect of foreign currency fluctuations. To present this information, current year turnover for PEP Africa reported in currencies other than ZAR is converted from local currency actuals into ZAR at the prior year’s actual average exchange rates. The table below sets out the percentage change in sales, based on the actual continuing results for the year, in reported currency and constant currency, for the basket of currencies in which PEP Africa operates:
Change in sales on prior year (%) Reported currency Constant currency
PEP Africa (16.2) (7.0)
The pro forma constant currency disclosure is presented in accordance with the JSE Listings Requirements and the Guide on Pro Forma Financial Information issued by SAICA. The pro forma constant currency disclosure has been prepared for illustrative purposes only. Because of its nature, the pro forma constant currency disclosure may not fairly present Pepkor’s financial position, changes in equity, results of operations or cash flows. The pro forma constant currency disclosure presented is the responsibility of the board and was reviewed by Pepkor’s auditors.

RETAIL FOOTPRINT30 September 2019 Openings Closures Net movement 30 September 2020
Retail stores
Retail area
’000 m2
Retail stores
Retail stores
Retail stores
Retail area
’000 m2
Retail stores
Retail area
’000 m2
Clothing and general merchandise 4 395 1 671 188 (97) 91 2 4 486 1 673
PEP 2 327 832 83 (26) 57 12 2 384 844
Ackermans 806 477 62 (7) 55 21 861 498
PEP Africa1 313 120 11 (23) (12) (6) 301 114
Speciality2 949 242 32 (41) (9) (25) 940 217
Furniture, appliances and electronics 900 429 46 (67) (21) (39) 879 390
Furniture and appliance retailers3 761 341 44 (54) (10) (28) 751 313
Appliance and electronics retailers4 139 88 2 (13) (11) (11) 128 77
Building materials5 120 334 – (5) (5) (6) 115 328
Pepkor 5 415 2 434 234 (169) 65 (43) 5 480 2 391
1 Excludes discontinued operations in Zimbabwe and includes six stores in Uganda.2 Includes Dunns, John Craig, Refinery, Shoe City and Tekkie Town brands.3 Includes Russells, Bradlows, Rochester and Sleepmasters brands.4 Includes Incredible Connection and HiFi Corp brands.5 Includes (retail and wholesale) BUCO, Timbercity, Tiletoria, Floors Direct, MacNeil, Cachet, B-One, Buchel, W&B Hardware, Bildware, Citiwood and Brands 4 Africa.
PEPKOR INTEGRATED REPORT 2020 91

PEPKOR INTEGRATED REPORT 2020 ADDITIONAL INFORMATION CONTINUED
92
SHAREHOLDER ANALYSISShareholder spread No. of shareholdings % No. of shares %
1 – 1 000 shares 5 508 48.47 1 458 384 0.041 001 – 10 000 shares 4 264 37.52 13 375 672 0.3710 001 – 100 000 shares 928 8.17 30 989 625 0.85100 001 – 1 000 000 shares 517 4.55 168 888 669 4.611 000 001 shares and over 147 1.29 3 445 638 531 94.13Total 11 364 100.00 3 660 350 881 100.00
Distribution of shareholders No. of shareholdings % No. of shares %
Banks/brokers 158 1.39 269 384 031 7.36Close corporations 64 0.56 255 120 0.01Endowment funds 96 0.84 6 710 012 0.18Government 3 0.03 528 089 0.01Individuals 8 881 78.15 17 222 533 0.47Insurance companies 73 0.64 39 069 812 1.07Investment companies 4 0.04 6 389 827 0.17Medical schemes 32 0.28 5 212 642 0.14Mutual funds 367 3.23 312 329 245 8.53Other corporations 30 0.26 94 012 0.00Private companies 207 1.82 12 150 401 0.33Public companies 2 0.02 70 194 0.00Retirement funds 467 4.11 194 310 292 5.31Strategic investors 2 0.02 2 786 136 033 76.12Trusts 978 8.61 10 488 638 0.29Total 11 364 100.00 3 660 350 881 100.00
Public/non-public shareholders No. of shareholdings % No. of shares %
Non-public shareholders 5 0.03 2 786 221 029 76.12Directors and associates 3 0.02 84 996 0.00Strategic holdings (more than 10%) 1 0.01 2 479 994 370 67.75Strategic holdings (company-related) 1 0.01 306 141 663 8.36
Public shareholders 11 359 99.96 874 129 852 23.88Total 11 364 100.00 3 660 350 881 100.00
Beneficial shareholders holding 1% or more No. of shares %
Steinhoff International Holdings Limited 2 479 994 370 67.75Lancaster 101 Proprietary Limited 306 141 663 8.36Allan Gray 66 926 795 1.83GIC Private Limited 45 782 933 1.25Alexander Forbes Investments 42 986 105 1.17Old Mutual 42 971 585 1.17Coronation Fund Managers 42 101 526 1.15Government Pension Fund – Norway 40 914 575 1.12Total 3 067 819 552 83.81
Fund managers holding 1% or more No. of shares %
Coronation Fund Managers 111 596 779 3.05Allan Gray Asset Management 110 189 273 3.01GIC Asset Management 44 869 933 1.23Old Mutual Investment Group 44 773 557 1.22Total 311 429 542 8.51
Data as at 25 September 2020.

SHARE PERFORMANCEAnalysis of trading
Month
High close
(cents)
Low close
(cents)Volume
(million)Value
(R billion)
31/10/2019 17.45 16.42 76.0 1.29
30/11/2019 18.10 16.23 200.2 3.53
31/12/2019 18.50 17.06 49.7 0.88
31/01/2020 18.24 16.42 81.4 1.38
29/02/2020 16.71 15.26 46.4 0.74
31/03/2020 15.80 10.14 100.2 1.27
30/04/2020 12.45 10.04 78.9 0.88
31/05/2020 12.00 9.57 136.3 1.48
30/06/2020 13.42 11.00 150.3 1.81
31/07/2020 11.15 10.06 128.6 1.37
31/08/2020 11.30 9.70 94.0 0.99
30/09/2020 12.04 9.70 135.2 1.48
Source: I-Net Bridge
Key statistics – 12 months to September 2020Traded price (cents per share) Close 11.14
High 18.75
Low 9.31Market capitalisation as of 30 September 2020 (R billion) 40.8
Value of shares traded (R billion) 17.10
Value traded as % of market capitalisation 41.9%
Volume of shares traded (million) 1 277.3
Volume traded as % of number of shares in issue 34.9%
PE ratio (statutory headline earnings) 17.0x
Dividend yield –
Earnings yield (statutory headline earnings) 5.9%
Period-end market price/NAV 0.8x
Shares in issue (million) 3 660
Average number of shares in issue (million) 3 522
Shares issued during the year 210 350 881
PPH vs All Share Index (Rebased to 100%)
40
60
80
100
120
1 Oct 2019
— PPH — All Share Index
1 Nov 2019 1 Dec 2019 1 Jan 2020 1 Feb 2020 1 Mar 2020 1 Apr 2020 1 May 2020 1 Jun 2020 1 Jul 2020 1 Aug 2020
(1.2%)
(35.2%)
PPH vs General Retail Index (Rebased to 100%)
40
60
80
100
120
1 Oct 2019
— PPH — General Retail Index
1 Nov 2019 1 Dec 2019 1 Jan 2020 1 Feb 2020 1 Mar 2020 1 Apr 2020 1 May 2020 1 Jun 2020 1 Jul 2020 1 Aug 2020
(32.3%)
(35.2%)
PEPKOR INTEGRATED REPORT 2020 93

PEPKOR INTEGRATED REPORT 2020 ADDITIONAL INFORMATION CONTINUED
94
SHAREHOLDERS’ DIARYAnnual general meeting 10 March 2021
Announcement of interim results May 2021
Financial year-end 30 September 2021
Announcement of annual results November 2021

CORPORATE INFORMATIONRegistration number 2017/221869/06Share code PPHDebt code PPHIISIN ZAE000259479
Registered address36 Stellenberg RoadParow Industria 7493PO Box 6100Parow East 7500Telephone 021 929 4800 E-mail [email protected]
Investor [email protected]
Press [email protected]
Company secretaryPepkor Proprietary Limited(Registration number 1965/007765/07)36 Stellenberg Road, Parow Industria 7493PO Box 6100, Parow East 7501
AuditorPricewaterhouseCoopers Inc.5 Silo Square, V&A WaterfrontCape Town 8012PO Box 2799, Cape Town 8000
Equity sponsorPSG Capital Proprietary Limited(Registration number 2006/015817/07)
Stellenbosch office1st Floor, Ou Kollege Building, 35 Kerk StreetStellenbosch 7600PO Box 7403, Stellenbosch 7599
Sandton office2nd Floor, Building 3, 11 Alice LaneSandhurst, Sandton 2196PO Box 650957, Benmore 2010
Debt sponsorRand Merchant Bank (A division of FirstRand Bank Limited)(Registration number 1929/001225/06)1 Merchant Place, Corner Fredman Drive and Rivonia RoadSandton 2196PO Box 786273, Sandton 2146
PEPKOR INTEGRATED REPORT 2020 95

www.pepkor.co.za