2020 annual report communities building impact
TRANSCRIPT

Communities Building Impact
2020 Annual Report

BEST STARTS FOR KIDS 2020 ANNUAL REPORT
PRIVACYThe stories in this report reflect the experiences of real people who accessed services through Best Starts for Kids community partners. They have consented to have their stories shared. Names and images may have been changed to respect their privacy.
FOR MORE INFORMATIONkingcounty.gov/BestStarts
ALTERNATE FORMATScall 206-263-9100 or TTY Relay 711
THANKS TO OUR PARTNERSBest Starts for Kids funds community partners across King County who lead, advise and implement work through this initiative. These partners are recognized by name on page 99.
WELCOME
Letter from the Executive .....................................................3Letter from the Director ........................................................4
INTRODUCTION
Best Starts in 2020 ............................................................... 5What we do ............................................................................ 6Who we serve ........................................................................ 8Our reach ................................................................................ 9
STRATEGIES
Investing Early .......................................................................11Sustaining the Gain ............................................................22Communities Matter ........................................................... 32Homelessness Prevention ................................................ 38Capacity Building and Technical Assistance .................41
EVALUATION
Overview ............................................................................... 432020 Modifications............................................................. 44Program changes ................................................................ 47Population indicators .........................................................55Performance measures ......................................................62
INVESTMENTS
Investment index .................................................................85Communities of Opportunity awards ..............................88
PARTNERS
Best Starts community partners.......................................99
CONTENTS
STRATEGIES INVESTMENTSWELCOME PARTNERSINTRODUCTION EVALUATION
Contents | Letter from the Executive | Letter from the Director
FOR BEST VIEWING EXPERIENCEThis report is intended to be read on screen and offers navigational links at the top of each page. For the best experience, we recommend using a PDF viewer rather than a web browser to navigate the report.
2

BEST STARTS FOR KIDS 2020 ANNUAL REPORT
To the King County community,Every day, our groundbreaking Best Starts for Kids initiative ensures King County’s children have equitable opportunities to thrive and achieve their full potential. As our region recovers from the health and economic crises brought on by the global COVID-19 pandemic, it is more important than ever to make sure every child and family is supported to share in that recovery.
Passed by King County voters in 2015, Best Starts for Kids has served more than 500,000 children, youth and families to date, providing comprehensive supports from pre-natal development all the way to young adulthood.
The pandemic significantly affected the health and well-being of King County residents, exacerbating long-standing inequities in health, housing and economic stability. At the same time, Best Starts for Kids service providers stepped up, responding to the needs of communities throughout King County with flexibility, creativity and compassion. I am so inspired by these partners and how they worked to meet the extraordinary challenge of COVID-19. Their deep community knowledge and expertise meant that they could engage more holistically with families, appropriately and effectively addressing basic needs, emotional health and well-being, and housing and home stability.
The past year highlighted the stark reality of racism as a root cause of generational inequities in health, wealth and opportunity among Black, Indigenous and communities of color. With Best Starts for Kids, we partner with communities through our programs and systems change efforts to dismantle those inequities and ensure every child has a chance to thrive.
I am proud to share the 2020 Best Starts for Kids Annual Report. It demonstrates the impact of our investments over time and shares stories of strength and resilience. Our partners showed up for their communities in a year like no other. Thank you to everyone who makes Best Starts for Kids a reflection of our vibrant community and an incredible asset to King County. Together, we will work to ensure all kids are healthy, happy, safe and thriving.
Sincerely,
Dow Constantine King County Executive
FROM THE KING COUNTY EXECUTIVE
STRATEGIES INVESTMENTSWELCOME PARTNERSINTRODUCTION EVALUATION
Contents | Letter from the Executive | Letter from the Director
3

BEST STARTS FOR KIDS 2020 ANNUAL REPORT
To our community,The first babies born in our county under Best Starts for Kids are now five years old. They’ve spent their critical first years in a county that is deeply committed to their health and well-being, from day one and throughout their lives. Best Starts for Kids is our community’s continued promise to support those babies, and every child born or raised in our county, as they continue to grow into happy, healthy, thriving adults.
Our work over the past year is a testament to the depth of that commitment. It has been a difficult year. From the COVID-19 pandemic to ongoing racial injustices, our communities are burdened, stressed and demanding something different. In the face of these challenges, I’ve seen people respond with strength, power and stamina. Our Best Starts community partners courageously adapted their services, defying limitations and often expanding reach by virtual engagement with program participants.
We know that the trauma, disconnection, and disruption our kids have experienced this past year will continue to have impacts on their mental health and emotional well-being for years to come. I am so grateful for our Best Starts for Kids family, who are already providing the critical social and emotional supports that kids and young people need to navigate this crisis. Our community's deep trust and connections with the kids and families most affected by this pandemic are invaluable as we begin to recover and heal.
Best Starts for Kids is a long-term investment in our young people, from their earliest years all the way to adulthood. I am proud to be part of the community we’ve built together. This 2020 Annual Report provides detailed information on our performance measures, outcomes and financials this year. While this report shares just one year, these outcomes reflect the momentum we’ve built over the past five years. Just as the babies born when Best Starts came into being are no longer babies, our initiative has grown and is now delivering impact across all investments. We know what is working and changed course when needed based on our learnings and data. We are excited to share impact and investment highlights through the report, with tables at the end and links to interactive data online.
I am deeply grateful to our leadership: Dow Constantine, King County Executive; Leo Flor, director of the King County Department of Community and Human Services; and Patty Hayes, director of Public Health — Seattle and King County. We also thank the Best Starts Children and Youth Advisory Board for their guidance and enthusiastic support.
Sincerely,
Sheila Capestany King County Strategic Advisor for Children and Youth Director, Children, Youth and Young Adult Division King County Department of Community and Human Services
FROM THE KING COUNTY STRATEGIC ADVISOR FOR CHILDREN AND YOUTH
STRATEGIES INVESTMENTSWELCOME PARTNERSINTRODUCTION EVALUATION
Contents | Letter from the Executive | Letter from the Director
4

A year of commitment and strength for King County’s communities In a year unlike any in recent history, the strength and resilience of communities across King County were critical to maintaining stability for the county’s children and families. King County’s investments through the Best Starts for Kids initiative have helped to seed and grow community-led and evidence-based solutions that were essential in 2020 — helping King County’s residents to respond in moments of crisis and to support every child, youth and young adult in reaching their full potential.
Best Starts’ foundation of trust and history of partnering with communities allowed the initiative to quickly adapt in a year of constant change. Best Starts pivoted to provide what communities said they needed most to navigate the COVID-19 crisis, including flexible emergency funds to support community partners in assessing and addressing basic needs; technology tools to deliver services virtually; and resources for the social emotional well-being and mental health of children, families and those who care for them.
Best Starts’ continued commitment to address the root causes of racism, and other inequities in the systems and structures that determine the health and well-being of King County’s residents, is at the core of this response. We are committed to a shared vision of our county as a place where a resident’s zip code, race or income does not predict their future potential.
As King County moves toward healing and recovery, Best Starts will continue building on the strength of the county’s communities and investing in their resilience. Our ongoing commitment to investing in community-designed and evidence-based approaches will guide how Best Starts works toward a better, more equitable King County, where every person can thrive.
BEST STARTS IN 2020
STRATEGIES INVESTMENTSWELCOME PARTNERSINTRODUCTION EVALUATION
Best Starts in 2020 | What we do | Who we serve | Our reach
BEST STARTS FOR KIDS 2020 ANNUAL REPORT 5
Photo: Jenjira Milan
Photo: Jenjira Milan
Photo: Erin Murphy

Giving kids the best start in lifeBest Starts for Kids builds on the strengths of families and communities so that babies are born healthy, children thrive and establish a strong foundation in life, and young people grow into happy, healthy adults. Best Starts for Kids promotes opportunities for kids to grow up healthy and happy and lifts up efforts to intervene early when families need more support. Since 2015, Best Starts has partnered with 628 programs serving more than 500,000 children, youth, young adults and families across King County.
These investments had a powerful impact in 2020. Best Starts centered the leadership and partnership of geographic, linguistic, cultural and other communities to support their vision of equity and progress in the face of the pandemic. More than 230 partners used Best Starts funding over the course of 2020 to address urgent needs related to the pandemic and to the racial disparities exacerbated by the crisis.
When families and communities have the resources and support to help their kids have the best possible start…
• Babies are born healthy and given the foundation for a happy, healthy life.
• People have equitable opportunities to be safe, healthy and thriving.
• Communities offer safe and welcoming environments for their kids.
• Children, teens and young adults thrive!
WHAT WE DO
The COVID-19 pandemic has disproportionately affected Black,
Indigenous and people of color
(BIPOC) in King County. Case and
hospitalization rates are higher for
BIPOC populations, as are death
rates, when adjusted for age. The
pandemic brought an acute and urgent
focus to addressing the longstanding
inequities and systemic racism
endured by BIPOC communities.
Best Starts responded by meeting
immediate needs while continuing to
build on our core values of centering
equity and reducing barriers to
culturally and linguistically relevant
programming. We listened to our
community partners, flexing our
investments to support the priorities
they identified. The Best Starts for
Kids COVID-19 Impacts Report offers
a comprehensive overview of our
response to the COVID-19 pandemic.
Photo: Jenjira Milan
STRATEGIES INVESTMENTSWELCOME PARTNERSINTRODUCTION EVALUATION
Best Starts in 2020 | What we do | Who we serve | Our reach
BEST STARTS FOR KIDS 2020 ANNUAL REPORT 6

In 2020, Best Starts invested $99.8 million in 558 programs delivering impact through strategies that reached more than 380,000 children, parents, caregivers and other community members in King County.
INVESTING EARLY Building a robust system of support for pregnant and parenting families, infants, very young children and caregivers that meets people where they are — at home, in the community and wherever children are cared for. In 2020, Best Starts supported community partners in meeting basic needs, connecting families to services, and caring for the well-being of young children and their families.
SUSTAINING THE GAIN
Ensuring progress continues with school- and community-based opportunities to learn, grow and develop through childhood and adolescence and into adulthood. In 2020, Best Starts flexed investments for community partners to help young people and families navigate remote learning, continue offering youth programming and expand access to mental health supports.
COMMUNITIES MATTER
Through Communities of Opportunity (COO), supporting communities as they build healthy, thriving places for children to grow up. In 2020, Best Starts invested in culturally rooted and place-based partnerships and organizations, building on community-driven policy and systems change under way. We also supported COVID-19 response efforts and Black-led organizing.
HOMELESSNESS PREVENTION
Complementing regional efforts to prevent and reduce homelessness by focusing on what each family needs to stay stably housed. Best Starts for Kids combined case management with financial assistance to prevent homelessness during the COVID-19 crisis. This support for families with children and young adults was an important element of county-wide efforts to maintain stability for households.
$47.0M
$36.0M
$9.9M
$3.8M
380,000+people reached
$99.8M*
invested throughout King County
238 community partners
558 new and continuing programs
41,427children and families received access to food and supplies
3,310 people remained housed
179,738** participants in COO events
7,200hours of technical assistance and capacity building leveraged by communities
Additional data on work funded through Best Starts for Kids are available at www.kingcounty.gov/BestStarts.
2020 PROGRESS
* Total includes evaluation and programming.** Duplicated number reflects high
virtual engagement
STRATEGIES INVESTMENTSWELCOME PARTNERSINTRODUCTION EVALUATION
Best Starts in 2020 | What we do | Who we serve | Our reach
BEST STARTS FOR KIDS 2020 ANNUAL REPORT 7

Darker blue = higher concentrationLighter blue = lower concentration
The Child Opportunity Index (COI) is a national index of neighborhood resources and conditions that help children develop in a healthy way. High-opportunity neighborhoods have quality schools, parks and playgrounds, clean air, access to healthy food, health care and safe housing. Low opportunity neighborhoods have few or none of these conditions.
DISTRIBUTION OF PARTICIPANTS SERVED DISTRIBUTION OF POPULATION UNDER AGE 18
WHO WE SERVE
CHILD OPPORTUNITY INDEX
Best Starts for Kids strategies are universal, serving children throughout King County Best Starts for Kids focuses investments to ensure equitable opportunity for all children.
1 2 3 4 5QUINTILE
Darker blue = lower opportunityLighter blue = higher opportunity
1 2 3 4 5QUINTILE
2020 BEST STARTS FOR KIDS DEMOGRAPHICS
Data are provided only for individuals for whom information is available and relevant. Individuals who are enrolled in more than one program may be duplicated in the demographic data. Totals may not add up to 100% due to rounding. Not all programs collect the “Middle Eastern or North African” race category or detailed gender identity data, which may lead to undercounting of these populations. See full results online for complete information.
GENDER IDENTITY
•• Female: 57%
• • Male: 43%
•• Another gender: <1%
Individuals who selected “Another gender” indicated their gender identity was not listed in the response options. This includes but is not limited to persons identifying as transgender, nonbinary, questioning, and/or gender-nonconforming.
AGE IN YEARS
•• <5: 51%
•• 5–17: 23%
•• 18–24: 8%
•• 25–54: 18%
• • 55+: <1%
RACE/ETHNICITY
•• American Indian/Alaska Native: 2%
•• Asian: 11%
• • Black/African American: 29%
• • Hispanic/Latinx: 18%
•• Middle Eastern or North African: 1%
•• Multiple races: 8%
•• Native Hawaiian/Pacific Islander: 2%
•• White: 26%
•• Another race/ethnicity: 2%
Race groups are mutually exclusive.
STRATEGIES INVESTMENTSWELCOME PARTNERSINTRODUCTION EVALUATION
Best Starts in 2020 | What we do | Who we serve | Our reach
BEST STARTS FOR KIDS 2020 ANNUAL REPORT 8

Best Starts across King County in 2020 The community partners highlighted here give a sense of the breadth of programming supported by Best Starts for Kids funding across King County.
DISTRICT 1
Child StrivePartnering with families and the community to support young children’s success through a virtual parent coaching model that centers strengths- and relationship-based approaches.
Urban Native Education AllianceProviding youth-directed and youth-focused opportunities centering on four pillars (life skills, leadership, language and literary) through the Clear Sky Native Program in places like North Seattle.
DISTRICT 2
Life Enrichment GroupOffering culturally relevant programs focused on academic achievement and social emotional support for youth across Seattle and King County.
Coalition for Refugees from BurmaPromoting positive and effective parenting to enhance healthy child development and school readiness in immigrant and refugee communities through home-based programs.
A
B
C
D
DISTRICT 3
A Supportive Community for AllBuilding an inclusive coalition of service providers and stakeholders to strengthen community around a shared vision for human services across the Snoqualmie Valley.
EncompassProviding tailored home- and community-based services in the North Bend region for children birth to 3 years who have developmental delays and disabilities and their families.
DISTRICT 4
The Arc of King CountyProviding case management and flexible assistance to maintain housing stability for individuals and families at imminent risk of homelessness throughout King County.
Westside Baby Distributing diapers, formula, car seats and hygiene products to community organizations that work directly with children and families.
F
G
H
E
(CONTINUED...)
OUR REACH
DISTRICT 5
Open Doors for MultiCultural FamiliesProviding high-quality, culturally responsive services for families of children with developmental and intellectual disabilities and special health care needs.
InterCultural Children & Family ServicesServing Black/African American and Latinx families in Renton and South King County with culturally matched home visiting, curriculum and parent education to improve parent–child relationships and promote kindergarten readiness.
I
J
J
B
D
P
H
C
G
O
M
FQ
I
KL
EE
N
A
R
Investing early
STRATEGY AREAS
Sustaining the gainCommunities of OpportunityHomelessness prevention
STRATEGIES INVESTMENTSWELCOME PARTNERSINTRODUCTION EVALUATION
Best Starts in 2020 | What we do | Who we serve | Our reach
BEST STARTS FOR KIDS 2020 ANNUAL REPORT 9

J
B
D
P
H
C
G
O
M
FQ
I
KL
EE
N
A
R
DISTRICT 6
Korean Community Services CenterProviding training and support for youth advocates and leaders in Shoreline, including on anti-racism, the school-to-prison pipeline and the model minority myth.
Eastside Pathways/NISO ProgramsBridging Latinx families and providers in East King County including Bellevue to increase knowledge of and access to resources and services.
DISTRICT 7
Auburn School District Ensuring the promotion of social emotional health and prevention of substance use across all middle schools in the district through the Student Success Team.
Global Perinatal ServicesConnecting underserved women to other women in their community who are trained to provide support during the critical months of pregnancy, birth and the early months of parenting.
DISTRICT 8
Southwest Youth and Family Services Offering after-school and summer programming in math and literacy, arts education and STEM in Burien, SeaTac, and West Seattle/White Center, in partnership with Arts Corps and Geeking out Kids of Color.
Neighborcare HealthStrengthening access to health facilities and immunization within the school setting for adolescents on Vashon Island.
DISTRICT 9
Progress House AssociationSupporting reunification for parents who have recently completed a work release program, who are within several weeks of release from incarceration and who are permitted to be with their children.
Greenplay Northwest Holding outdoor Kaleidoscope Play and Learn groups in places like Maple Valley where parents and caregivers can sing, read and play together in support of their children’s healthy growth and development.
Best Starts for Kids has effectively partnered with young leaders from across the County to define what well-being looks like, and centered youth voice at every step of the way.”— Hikma Sherka, Co-Chair, King County Children and Youth Advisory Board
Investing early
STRATEGY AREAS
Sustaining the gainCommunities of OpportunityHomelessness prevention
(...CONTINUED)
L
M
K O
Q
R
P
N
STRATEGIES INVESTMENTSWELCOME PARTNERSINTRODUCTION EVALUATION
Best Starts in 2020 | What we do | Who we serve | Our reach
BEST STARTS FOR KIDS 2020 ANNUAL REPORT 10

By investing early, Best Starts for Kids supports communities so that:
• Babies are born healthy.
• Children grow up in households where they are safe and cared for.
• Children grow up resilient, curious and content.
• Children are socially, intellectually and physically ready for kindergarten, the first step in a lifetime of learning.
• Children flourish and thrive!
Investing Earlyfrom prenatal care to the first day of kindergarten
Photo: Jenjira Milan
STRATEGIES INVESTMENTSWELCOME PARTNERSINTRODUCTION EVALUATION
Investing Early | Sustaining the Gain | Communities Matter | Homelessness Prevention | Capacity Building and Technical Assistance
BEST STARTS FOR KIDS 2020 ANNUAL REPORT 11

An inclusive environment for children flourish
Children thrive when they can form secure relationships, explore the world and experience autonomy. At Newport Children’s School in Bellevue, Director Tiffany Anglin understands that creating these conditions for children means equipping teachers with the support and tools they need.
“When a teacher comes to me and says ‘I’m having this challenge,’ I have a tool basket that I can pull from and give the teacher to take back and try in the classroom. If that doesn’t work, we can try another tool,” explains Tiffany. “But sometimes when the same issues and challenges keep coming up, we need outside support.”
In King County, as many as 22,000 families lack access to appropriate early learning options because few child care centers have the resources to support children with special health care needs or disabilities or who may need additional support. To support more providers in welcoming all children, Northwest Center launched Inclusion Mentorship Program for Increasing Access in Childcare Teams (IMPACT). Best Starts for Kids partners with this program through multiple strategies, including Social Emotional Well-being and Child Care Health Consultation, as part of our focus on quality of care.
IMPACT gives teachers a space to reflect on their practices and provides guidance on how to support children of different abilities in the classroom. For example, IMPACT helps bring teachers and parents on the same page about how to respond to challenging behaviors (common among kids with developmental issues). For parents and teachers, this means having allies in the child’s well-being. For the child, it means being able to continue to learn and grow alongside their peers.
“This model allows us to be in the communities on a much deeper level,” explains Michelle Duhon, inclusion consultant at Northwest Center. “We … support teachers in exploring [the] roots of challenging behaviors in children — and help them shift their perspective on how to create inclusive classrooms.”
IMPACT has helped teachers at Newport Children’s School work with families to figure out how to best support their children. “Having Michelle there as a third party really helps when we meet with families,” shares Beth Johnson, or “Ms. Beth,” a teacher at the school. “It helps parents realize that one, their child isn’t the only one to have this issue happening, and two, that we are on their child’s side and want to help them.”
Throughout the COVID-19 pandemic, schools have experienced more challenging behavioral issues, especially for kids with higher sensory needs, who are most affected by COVID-19 restrictions. Tiffany has also seen higher needs among children as they return to school and adjust to the new environment. Support from IMPACT has helped to navigate these transitions.
As Tiffany says, “IMPACT is a great resource for us. We all need someone letting us know that we are on the right track and it helps to focus and remember the tools that we do know.” Children, parents and teachers all benefit from a holistic and collaborative approach to promote positive relationships.
Photos: Erin Murphy
STRATEGIES INVESTMENTSWELCOME PARTNERSINTRODUCTION EVALUATION
Investing Early | Sustaining the Gain | Communities Matter | Homelessness Prevention | Capacity Building and Technical Assistance
12

$47.0M 187 new and continuing programs
total investments in 2020
Children have a strong start when their families and communities have the support they need to help kids develop trusting relationships; grow up healthy; and learn and thrive.
The COVID-19 pandemic magnified the impact of systemic racism for Black, Indigenous and people of color (BIPOC), including barriers to high-quality child care, health care and other essential resources. Led by and working with our community partners, Best Starts for Kids is reducing these disparities. Our emphasis on the promotion of positive elements over the prevention of negative factors keeps healthy children healthy — while providing additional support to children and families who need it. Backed by a growing body of evidence, the Best Starts approach leads to positive outcomes for all our region’s children from birth to age 5.
Best Starts for Kids’ Investing Early strategies have reached more than 490,000 children and families with programs that support healthy child development. Many of these programs intentionally reach communities that historically have lacked access to health and early learning services. These investments are yielding positive results across King County, including the creation of community-led systems to foster healthy childhood development for our youngest residents and those who care for them.
As of 2020, Best Starts is now delivering impact across all investments. All funded programs are actively delivering services, and there are at least two quarters of performance data to report for the year.
Photo: Erin Murphy
We pivoted our program to meet the emerging needs of parents and families during the current COVID-19 pandemic. With the support of [Best Starts] we have been able to transition our program, as needed, to fit the educational and resource needs of parents working from home or left without work.”— Sarah Loeffler, Voices of TomorrowSee outcomes of Best Starts for Kids “Investing Early”
investments across King County here.
STRATEGIES INVESTMENTSWELCOME PARTNERSINTRODUCTION EVALUATION
Investing Early | Sustaining the Gain | Communities Matter | Homelessness Prevention | Capacity Building and Technical Assistance
BEST STARTS FOR KIDS 2020 ANNUAL REPORT 13

We have found that screening and referring families to supports looks different in each cultural community based on the differing cultural experiences and practices. We are working to identify what works best in terms of outreach and referral so that families can benefit from our program.”— Faduma Mahamoud, Open Doors for Multicultural Families
Help Me Grow• Delivering impact• $1.8M invested in 2020• 27 community partners, 3 system partners
Raising safe, happy, healthy and thriving kids takes support. Help Me Grow connects families and caregivers with children under age 5 to community-based programs and services.
When Best Starts asked for input on building a stronger Help Me Grow system in King County, we heard families say they want a better connection to resources, and providers say they want improved coordination to better serve families. In 2020, Help Me Grow King County responded and expanded its reach, making it easier for families to move between systems of care to promote healthy child development.
Best Starts funded 27 organizations to build a system that connects families and providers to culturally, linguistically and geographically matched referrals and resources such as child care and health services. Help Me Grow also brought together 16 community-based organizations to collaborate and improve coordination. Partnerships with community organizations that had established relationships with families also helped meet COVID-19 related needs: Trusted partners helped families navigate resources, such as the Congolese Integration Network which ensured food distribution efforts included traditional Congolese foods and gift cards to stores with Congolese groceries.
Best Starts is partnering with WithinReach (the statewide affiliate for Help Me Grow), Cardea Services and Soar to develop a network in King County that aligns systems and services in collaboration with communities and families, with the goal of equitable, family-centered and culturally responsive supports.
2020 OUTCOMES
• Help Me Grow King County Partnership Network supported 245 parents/caregivers and 512 children between when it launched in August 2020 and the end of the year. 80 percent of children served were BIPOC and 71 percent of children received a developmental screening.
• The majority of these families reached out with concerns related to basic needs, developmental progress and parent/caregiver support. To address these concerns, partners interacted at least 900 times with families over video, text and phone and completed 490 referrals for related services or resources. Photo: Erin Murphy
STRATEGIES INVESTMENTSWELCOME PARTNERSINTRODUCTION EVALUATION
Investing Early | Sustaining the Gain | Communities Matter | Homelessness Prevention | Capacity Building and Technical Assistance
BEST STARTS FOR KIDS 2020 ANNUAL REPORT 14

5,262
13
Developmental Promotion and Early Support• Delivering impact• $7.4M invested in 2020• 35 community partners
Children reach developmental milestones in their own way and at their own pace. When developmental delays in young children are identified early, interventions can have the most impact with services that are right for each family and child. That’s why Best Starts provides a comprehensive approach — through early screening, social emotional development integration and resources for caregivers — to ensure the well-being and development of children across King County. These programs remove barriers to culturally relevant services and developmental screening so that all families can celebrate developmental milestones with their kids.
In 2020, Best Starts launched new strategies that we plan to build on to promote equitable access for all families. Best Starts is investing in nine innovative projects that offer cultural and linguistic adaptations to screening tools, practices and training for providers to reach more children and families.
2020 OUTCOMES
• 9 Universal Developmental Screening Pilot Projects and 15 Help Me Grow partners served children, families and providers representing 8 different race/ethnicity backgrounds and 24 languages. Services included training 370 community members, screening 767 children,
and engaging 76 community members in translation and adaptation of two screening tools into multiple languages.
• 13 community-based organizations served 5,262 children and their families through the Early Support for Infants and Toddlers (ESIT) program, which supports families whose children have developmental delays and disabilities, focusing on children up to age 3.
• 347 professionals (doulas, home visitors, child care providers and others) increased their skills to conduct screenings. Early screening helps identify the specific interventions and services that will best support a child and their family. 87 percent of these professionals reported increased confidence in their ability to discuss a developmental concern with a family.
• 137 providers started the Infant and Early Childhood Mental Health Endorsement process. Michelle, highlighted in our P-5 story, is one such provider. An additional 359 providers participated in reflective consultation meetings to transform their practice and improve connection to babies, children and families. 86 percent of providers reported that these sessions had a positive impact on their relationships with the babies, children and families they serve.
Creative approaches to maintaining services during COVID-19
During COVID-19 restrictions, with research showing that virtual services are as successful as in-person, community partners maintained ongoing programming for families. The Early Support for Infants and Toddlers program continued to accept referrals and work with families through video conferencing and/or phone calls. This minimized interruptions to child development services, including evaluations and parent coaching, to support children with developmental delays and disabilities.
Best Starts flexed funding for community partners to reduce families’ barriers to services. Through Home-Based Services and Community-Based Parenting and Peer Supports, over 1,300 tablets were distributed to families along with Wi-Fi hot spots and interpretation services. Community partners shared that these resources helped to keep families engaged and facilitated a smooth transition to virtual services. Best Starts also hosted regular webinars to ensure community partners received the most current COVID-19 information and encouraged peer learning and resource sharing. With a limited interruption in services, families could continue benefiting from these supports, social connection and stability during a time of uncertainty.
children and families received support from community-based organizations through Early Support for Infants and Toddlers
STRATEGIES INVESTMENTSWELCOME PARTNERSINTRODUCTION EVALUATION
Investing Early | Sustaining the Gain | Communities Matter | Homelessness Prevention | Capacity Building and Technical Assistance
BEST STARTS FOR KIDS 2020 ANNUAL REPORT 15

When I joined the Best Starts for Kids trainings, I can honestly say that was the most connected I have felt to a community in probably years. [The trainings] have been, by far, the most effective and interactive discussions I have ever been on virtually.”— Martha Stebbins-Aguiñina, Infant Mental Health clinician and workforce development workshop participant
Workforce Development• Delivering impact• $1.0M invested in 2020• 1 system coordinator, 6 capacity builders,
9 community partners that accessed supports
Professionals who work with children and families do their best work when they are supported with tools, resources and connection to a community. In 2020, Best Starts offered training opportunities for King County providers on a range of topics, including racial equity, infant and early childhood mental health, healthy child development and emergent needs related to COVID-19 response efforts. We successfully shifted to virtual training delivery with high levels of participation and positive feedback from attendees.
Best Starts fully launched a cohort model in 2020, offering tailored peer learning opportunities to nine workforce partners that share a workplace or a cultural, racial or geographic community. Best Starts will continue to strengthen these services by broadening the pool of trainers who support providers working with young children and enhancing their equity-driven practices.
2020 OUTCOMES
• 1,157 King County providers who work with young children attended 103 training opportunities.
• 87 percent of providers attending a large group training reported confidence in their ability to apply something new they learned to their work.
Home-Based Services• Delivering impact• $10.0M invested in 2020• 31 community partners, 9 technical
assistance partners
Through home-based services, families with babies and young children gain access to home visitors — a nurse, a doula or a trained community member — who can be a family resource throughout the first years of a child’s life. Home visitors develop relationships with multiple members of the family. They help families through the changes that come with a new baby, provide services that help the family nurture their child’s development, and navigate the systems such as housing and employment that promote family stability.
In 2020, Best Starts adapted how we support our community partners to continue delivering services virtually. Families relied on this stable, trusted, culturally responsive source of support to navigate the social isolation and other unprecedented challenges of this year. Best Starts has also increased our focus on offering community partners the tools and technical
assistance they need to strengthen their capacity, ensuring we tailor services to the communities where they are provided.
2020 OUTCOMES
• Evidence-based and evidence-informed home-based programs increased their caregiver reach by 74 percent over 2019, serving 1,085 caregivers, 67 percent of whom identified as BIPOC. Similarly, the programs increased their reach among children by 75 percent over 2019, serving 907 children, 70 percent of whom identified as BIPOC.
• 10 community-designed home-based programs served 930 caregivers (a 191 percent increase over 2019) and reached 878 children (a 185 percent increase over 2019) through 9,082 home visits (a 400 percent increase over 2019).
• 99 percent of families in community-designed home-based services had increased concrete support, and 96 percent of families had increased knowledge of parenting and child development.
• Through a partnership with United Way and the City of Seattle, ParentChild+ Program continued to deepen and expand its reach. The 16 funded programs made 44,413 visits to 1,291 children, and 91 percent of families were matched with culturally relevant staff.
STRATEGIES INVESTMENTSWELCOME PARTNERSINTRODUCTION EVALUATION
Investing Early | Sustaining the Gain | Communities Matter | Homelessness Prevention | Capacity Building and Technical Assistance
BEST STARTS FOR KIDS 2020 ANNUAL REPORT 16

Community-Based Parenting and Peer Supports• Delivering impact• $4.0M invested in 2020• 36 community partners
Through Community-Based Parenting and Peer Supports, community-based agencies and organizations support families with everything from food to information on child development. These Best Starts investments are led by communities, which is especially important for sensitive services like support for breastfeeding and for education and advocacy around maternal mortality. By standing behind these existing networks of support, Best Starts helps to build on community strengths, providing tools and resources a community can use to care for its kids and families.
In 2020, Best Starts launched new programs — designed through a community-driven planning process — to offer supportive pregnancy care and breastfeeding peer supports that prioritize BIPOC communities. Innovative ways to provide education and foster social connection, such as virtual lactation lounges, were received positively with high attendance rates in King County and beyond. Best Starts will continue to build on this momentum by prioritizing investments in community-based organizations that remove barriers to accessing tools and resources so families can best care for their kids.
2020 OUTCOMES
• 41,427 families and children accessed basic necessities — including diapers, clothes, baby formula and fresh fruits and vegetables — a 39 percent increase over 2019. 98 percent of all requested items were distributed.
• 2,560 families participated in Kaleidoscope Play and Learn groups, a 63 percent increase over the first year of services (2018).
• 32 people received supportive pregnancy services across King County. 100 percent of babies were carried to full term and 100 percent of new mothers were breastfeeding beyond initiation.
In the last year, WestSide
Baby reached an estimated
29,259 children by providing
monthly diaper allocations
to community access points
such as Seattle Public Schools
resource sites and Seattle
Housing Authority properties.
WestSide Baby distributed
2.4 million diapers in 2020 ...
which represents a more than
50 percent increase over the
previous year (2019).”— Toni Sarge, WestSide Baby
Community-centered support for parents and caregivers
Parent Caregiver Information and Supports (PCIS), an investment through Best Starts’ Community-Based Parenting and Peer Supports strategy, supports community-based organizations delivering information and services to parents and caregivers with young children. In 2020, the first full year of the program:
• 10 PCIS programs served 968 caregivers.
• 876 group meetings or services were held.
• 88 percent of these caregivers identified as BIPOC.
• 90 percent of families reported increased concrete support as a result of the program.
• Many PCIS partners accessed capacity building support to strengthen their organizational infrastructure.
View Denise Louie Education Center’s Play & Learn Virtual Video Library.
Photo: Shutterstock
STRATEGIES INVESTMENTSWELCOME PARTNERSINTRODUCTION EVALUATION
Investing Early | Sustaining the Gain | Communities Matter | Homelessness Prevention | Capacity Building and Technical Assistance
BEST STARTS FOR KIDS 2020 ANNUAL REPORT 17

Public Health Programs• Delivering impact• $10.0M invested in 2020
Managed by Public Health — Seattle & King County, Public Health programs build on proven practices and community-based solutions to support healthy outcomes at all ages. These programs provide a critical safety net for families, which was more essential than ever in 2020.
As a core component of Best Starts’ prenatal-to-five strategies, Public Health programs quickly adapted during the pandemic to ensure families had continued access to affordable and healthy food, reproductive health services and support with housing. Using a new electronic system,
Best Starts led the nation in adapting Special Supplemental Nutrition Program for Women, Infants and Children (WIC) services from in-person to remote. Best Starts will permanently adopt some of these changes, which effectively removed barriers to resources and services.
2020 OUTCOMES
• More than 52,000 people purchased more than $17 million in healthy, affordable food through the Special Supplemental Nutrition Program for Women, Infants, and Children (WIC).
• 100 percent of the babies enrolled in the Perinatal Hepatitis B Prevention Program who were tested in 2020 were negative for hepatitis B. Best Starts communicated with families facing confusion and fear about managing hepatitis B vaccination for their infants during the pandemic, encouraging them to keep or reschedule their appointments.
• More than 900 families teamed up with registered nurses who regularly visit them at home to help them raise happy, healthy children. All of these families initiated breastfeeding with their infants. In September, the launch of a successful Zoom for Healthcare pilot resulted in all nurses using Zoom to deliver video visits.
• 4,179 people accessed sexual and reproductive health services through King County’s Family Planning Program through telehealth services, combined with clinic visits. 76 percent of family planning clients now use more effective contraception methods. Additionally, community-based health educators delivered direct education to over 5,000 youth.
• 11,671 pregnant women and infants received pregnancy and parenting support, and families received 1,167 linkages to health prevention support services. The shift to video and phone visits for most clients increased accessibility.
• 290 children and caregivers were linked to health services and housing through a program for families housed in shelters who have significant health needs, 56 percent of whom are in permanent housing at completion.
Vroom• Delivering impact• $77K invested in 2020• 2 community partners
Vroom turns the science of brain development into simple, easy-to-use tips that parents and caregivers can incorporate into everyday life. Best Starts has deepened and expanded the reach of Vroom, with Latinx and Somali Vroom Community Connectors who make the information accessible and relevant for families to develop their child’s literacy, math and social skills.
Interest in Vroom increased in 2020 as Community Connectors adapted resources for virtual settings. Best Starts provided support on using Vroom remotely to encourage child development in the home environment. Vroom Community Connectors leveraged existing touchpoints with families, such as Centro Rendu’s food distribution site in Kent, where 150 to 200 Spanish-speaking families received Vroom materials each week.
Photo: Shutterstock
STRATEGIES INVESTMENTSWELCOME PARTNERSINTRODUCTION EVALUATION
Investing Early | Sustaining the Gain | Communities Matter | Homelessness Prevention | Capacity Building and Technical Assistance
BEST STARTS FOR KIDS 2020 ANNUAL REPORT 18

Enhanced child care support
Insufficient access to high-quality child care was already a crisis in our region before the COVID-19 pandemic. According to a Best Starts for Kids survey, in 2019, 34.2% of children lived in families that found it difficult to afford child care. Child care providers are consistently undercompensated, resulting in high turnover and financial instability for this critical workforce. The pandemic strained the child care system to a breaking point, further exposing inequities in accessing good, affordable care while highlighting the fundamental importance of child care work to our economy and communities.
Informed by Best Starts’ work, King County responded swiftly and awarded grants to child care facilities to keep their doors open and provided vouchers for families to afford care. Through a partnership with Child Care Resources, Best Starts allocated $526,000 toward COVID-19 prevention for child care facilities, such as personal protection equipment and cleaning supplies.
Best Starts also supported the work of King County’s Children and Families Strategy Task Force, which convened members from the community to create a long-term plan for an equitable, affordable and accessible child care infrastructure. The final report compiled by the Task Force will guide Best Starts as we partner with communities to build a stronger child care system in King County — one that supports the child care workforce and ensures families who most need high-quality child care can find it.
Vroom is now available in more than 15 languages. Best Starts for Kids plans to continue fully integrating Vroom into all our strategies for young children, as well as in other settings in King County, to support families with children from birth to age 5. Our approach serves as a model for how to use the tool at the state and national levels.
2020 OUTCOMES
• 8,400 parents and caregivers accessed Vroom as a result of community engagement, and 67 leaders were trained to be expert “Messengers” in using the tool.
• Vroom Community Connectors held 53 outreach events and activities, reaching 236 potential Vroom Messengers and 16 organizations.
Child Care Health Consultation• Delivering impact• $3.0M invested in 2020• 17 community partners
Child care professionals strive to provide the safest and healthiest setting for the children in their care — but they may not always know where to turn for recommendations and resources. Best Starts for Kids supported seven community-based organizations in providing Child Care Health Consultation services, putting the resources of nurses, nutritionists and child health specialists at the fingertips of both licensed child care providers and Family, Friend and Neighbor caregivers across King County.
Knowing that we are out here helping providers stay open and providing a safe place for children to come is wonderful. Without the support of these … cleaning supplies and PPE I would have been lost as it was impossible to find supplies in store[s] at the start of this.”— Fior Gonzalez, Child Care Resources, Family Child Care Program
Photo: Jenjira Milan
STRATEGIES INVESTMENTSWELCOME PARTNERSINTRODUCTION EVALUATION
Investing Early | Sustaining the Gain | Communities Matter | Homelessness Prevention | Capacity Building and Technical Assistance
BEST STARTS FOR KIDS 2020 ANNUAL REPORT 19

An interim evaluation of Child Care Health Consultation services completed by Cardea Services provides foundational evidence on the program’s effectiveness in supporting child care providers with more tools and resources to make the child care space safer and to promote children’s health. In 2020, virtual consultation and communication in the provider’s primary language were critical to following sanitation and hygiene best practices, understanding Centers for Disease Control guidelines on COVID-19 prevention and accessing information on financial assistance and grants.
In 2020, Best Starts partnered with Kindering Center to gather input through 50 engagement activities with over 600 racially and culturally diverse partners and community members. This effort builds on work launched in 2018 to jointly develop robust recommendations released in December of 2020 to create a stronger, more equitable and accessible county-wide Child Care Health Consultation system.
2020 OUTCOMES
• Child Care Health Consultation reached 989 providers completing a total of 3,877 consultation and training services — both at formal child care sites and informal sites where friends, families and neighbors are caregivers.
• 93 percent of child care providers served by Child Care Health Consultation teams reported satisfaction with the services they received, and 82 percent reported increased knowledge of community resources that enhance the health and safety of the child care environment.
Innovation Fund• Delivering impact• $2.5M invested in 2020• 14 community partners,
2 technical assistance partners
The Best Starts for Kids Innovation Fund fuels innovation by kick-starting community-designed programs and approaches through the beginning stages of development and early implementation. The Innovation Fund supports projects that meet community-identified priorities and are co-created with community, drawing on the skills and strengths of the community itself to meet its unique needs.
One example is Look, Listen and Learn (LL+L), a King County–based early learning television show designed for BIPOC children and families. LL+L partners with local venues to showcase resources available in our community while applying brain development knowledge to foster learning and enhance caregiver-child relationships. LL+L addresses representation in media for BIPOC communities, with a woman of color as the show’s lead and kids of color highlighted in the show. In 2020, LL+L offered age-appropriate mini-episodes to explore relevant and timely topics, such as What Does “Black Lives Matter” Mean? and It’s Okay to Feel Lonely! Best Starts’ partnership with LL+L helps to build greater confidence and pride among BIPOC children — essential elements in a child’s readiness to learn.
Through the Woven Together Project, another Innovation Fund investment, Best Starts
Reducing exposure to toxics across Best Starts strategies
Best Starts for Kids ensures healthy indoor and outdoor environments for children by reducing exposure to lead and other toxics through a range of strategies:
• Preventing exposure to lead and toxics among families and caregivers across multiple language groups through our network of community partners.
• Increasing blood-lead testing for children through partnerships with the health care system and free testing events.
• Improving access to effective, culturally relevant early childhood developmental services for lead-poisoned children.
• Reducing exposure by identifying current and emerging sources of lead and toxics in King County.
View the video from King County Medical Society Public Health Science Fair focusing on Lead & Lead Poisoning.
STRATEGIES INVESTMENTSWELCOME PARTNERSINTRODUCTION EVALUATION
Investing Early | Sustaining the Gain | Communities Matter | Homelessness Prevention | Capacity Building and Technical Assistance
BEST STARTS FOR KIDS 2020 ANNUAL REPORT 20

supported Open Doors for Multicultural Families in collaborating with Children’s Therapy Center to better serve Somali and Vietnamese families in South King County. Open Doors has established trusted relationships, and together with Children’s Therapy Center, offered holistic supports to address infant and early childhood developmental delays and disabilities. Through this project, the two organizations are creating new processes for staff to work together, with the shared goal of better supporting culturally and linguistically diverse families in caring for their young children.
2020 OUTCOMES
• 338 people participated in design or delivery of an Innovation Fund program or project.
• 670 caregivers, youth, providers and community members interacted with Innovation Fund programs, more than double the strategy’s reach in 2019.
• All 14 community partners adapted their approaches to ensure continued access to essential services, technology support and social connection during isolation.
INVESTING EARLY2020 DEMOGRAPHICS
Data are provided only for individuals for whom information is available and relevant. Individuals who are enrolled in more than one program may be duplicated in the demographic data. Totals may not add up to 100% due to rounding. Not all programs collect the “Middle Eastern or North African” race category or detailed gender identity data, which may lead to undercounting of these populations. See full results online for complete information.
GENDER IDENTITY
•• Female: 57%
• • Male: 43%
•• Another gender: <1 %
Individuals who selected “Another gender” indicated their gender identity was not listed in the response options. This includes but is not limited to persons identifying as transgender, nonbinary, questioning, and/or gender-nonconforming.
AGE IN YEARS
•• <5: 66%
•• 5–17: 9%
•• 18–24: 7%
•• 25–54: 18%
• • 55+: <1 %
RACE/ETHNICITY
•• American Indian/Alaska Native: 2%
•• Asian: 12%
• • Black/African American: 26%
• • Hispanic/Latinx: 18%
•• Middle Eastern or North African: 1%
•• Multiple races: 7%
•• Native Hawaiian/Pacific Islander: 3%
•• White: 29%
•• Another race/ethnicity: 2%
Race groups are mutually exclusive.
These data include children, parents and caregivers served.
View the video from Look, Listen and Learn, a King County–based early learning TV show designed for BIPOC children and families.
STRATEGIES INVESTMENTSWELCOME PARTNERSINTRODUCTION EVALUATION
Investing Early | Sustaining the Gain | Communities Matter | Homelessness Prevention | Capacity Building and Technical Assistance
BEST STARTS FOR KIDS 2020 ANNUAL REPORT 21

Sustaining the Gainfrom kindergarten through college and career
By sustaining early gains, Best Starts for Kids supports communities so that:
• Children learn math and reading skills that prepare them for a lifetime of success.
• Children and teens have the support to grow up curious, resilient and confident.
• Children and teens graduate high school with their peers and go on to college or a career.
• Children, teens and young adults are healthy and strong — and empowered to make healthy decisions about substance and alcohol use.
• Children grow into thriving teens, and teens grow into thriving adults.
Photo: Jenjira Milan
STRATEGIES INVESTMENTSWELCOME PARTNERSINTRODUCTION EVALUATION
Investing Early | Sustaining the Gain | Communities Matter | Homelessness Prevention | Capacity Building and Technical Assistance
BEST STARTS FOR KIDS 2020 ANNUAL REPORT 22

A group of middle-school students at Orca K-8 School in South Seattle eagerly wait as an elder begins sharing a story from the past. The words offer a powerful narrative that helps Black, Indigenous and youth of color (BIPOC) navigate school, relationships and the effects of persistent inequities in their lives. These students are part of Partners for Educational Reform and Student Success’ (PERSS) Bridging Wisdom, an intergenerational program where BIPOC and other youth learn from and enjoy experiences with elders in the community through weekly visits that spark joy, connection and healing.
Marjhae’ Nelson, now in high school, remembers how Bridging Wisdom was a foundational part of her middle-school experience. Marjhae’ looked forward to spending time every week with elders living at Esperanza House Apartments — a low-income senior housing community in Southeast Seattle’s New Holly Neighborhood — and together engage in conversation circles and fun activities that build authentic relationships.
“I knew all the elders by name. We would laugh together, listen to music, draw and paint,” shares Marjhae’. “I remember when we made blueberry waffles with the elders. It was fun to see their cooking point of view compared to what we know.”
PERSS is part of Best Starts for Kids’ Trauma-Informed and Restorative Practices (TIRP) Village — a community of 30 partners who are working together across 55 schools in ten school districts to confront systemic and racial trauma in classrooms and spaces where youth learn. By bringing students, families, teachers, school districts, community-based organizations and local government together, TIRP partners recognize that it takes a village to help children and youth succeed.
Marjhae’s parents have seen firsthand how Bridging Wisdom has added richness to her life. As her father Marcus explains, “For her, and for any kid, it’s good to learn from a completely different generation, from someone whose experiences were completely different from yours. Like the program is called, it’s bridging the wisdom between our elders and our teens.”
When public spaces shut down because of COVID-19, Bridging Wisdom could not continue regular programming. Virtual meetups presented additional challenges. However, although TIRP Village partners were not able to connect with one another and with families and young people in the same way, the relationships and trust they built together before the pandemic made it possible for the Village to respond quickly to families’ urgent needs.
As guidelines shift to allow for in-person gatherings, Bridging Wisdom will provide a healing space for elders and youth to reflect on the events of 2020 — a year that has magnified the importance of human connection. Marjhae’ now has her own stories from Bridging Wisdom, which will be part of her narrative as she works toward her goals and aspirations for the future.
An inter-generational approach to joy and healing
Photo: Erin Murphy
STRATEGIES INVESTMENTSWELCOME PARTNERSINTRODUCTION EVALUATION
Investing Early | Sustaining the Gain | Communities Matter | Homelessness Prevention | Capacity Building and Technical Assistance
BEST STARTS FOR KIDS 2020 ANNUAL REPORT 23

$36.0M 203 new and continuing programs
total investments in 2020
As children transition through adolescence and into adulthood, their futures are transformed by the opportunity to stay connected and engaged at school and in their communities.
In 2020, as young people’s lives were upended by school building closures, social isolation and increased feelings of depression and anxiety, Best Starts’ community partners responded to address the challenge. The high level of trust between our community partners and the young people they serve created safety nets of support that were critical to meeting changing needs throughout the year.
Best Starts for Kids’ funding for programs aimed at ages 5 to 24 sustains the gains from early childhood investments. Since the launch of Best Starts, approximately 40,000 young people have participated in programs that support them as they grow into healthy, happy thriving adults through Sustaining the Gain strategies. Community partners are building resilience in youth, encouraging youth voice and leadership, fostering a sense of belonging and deepening family engagement.
This work is essential to address young people’s increased mental health and social emotional needs associated with the pandemic. Best Starts’ continued focus on programs led and designed by Black, Indigenous and people of color (BIPOC) ensures that this support reaches those who are most affected.
As of 2020, Best Starts is now delivering impact across all investments. All funded programs are actively delivering services, and there are at least two quarters of performance data to report for the year.
Photo: to come
Photo: Any Lane, Pexels
Best Starts did not dictate that they want us to do it this way or that way. They asked us ‘what do you think would help your community of immigrants to navigate the school system?’ They allowed us to be authentic and do culturally appropriate work.”— Community-based organization staff
See outcomes of Best Starts for Kids “Sustaining the Gain” investments across King County here.
STRATEGIES INVESTMENTSWELCOME PARTNERSINTRODUCTION EVALUATION
Investing Early | Sustaining the Gain | Communities Matter | Homelessness Prevention | Capacity Building and Technical Assistance
BEST STARTS FOR KIDS 2020 ANNUAL REPORT 24

Thank you for providing students the chance to learn all this otherwise inaccessible awesome technology. There’s really nothing else like this program in the world! ”— Olisa Enrico, Arts Corps, Youth Development partner
Youth Development• Delivering impact• $4.1M invested in 2020• 31 community partners
Young people seek safe, supportive environments that provide a sense of belonging and purpose. Best Starts for Kids partners with schools and community-based organizations to invest in programs that meet those needs through mentoring, leadership, positive identity development and healthy relationships. Our community partners focus on engaging marginalized youth and young people who face challenging life experiences, offering a broad range of programs to develop skills, form lasting relationships and build self-confidence.
Already a growing concern before the pandemic, young people’s anxiety, depression, trauma and stress have reached high levels. Best Starts’ community partners nimbly adapted to offer services virtually and prioritized mental health support for BIPOC youth. Youth development programs are re-imagining how to maintain and strengthen connections as they shape the lives of young people in formative ways.
2020 OUTCOMES
• 3,584 young people participated in culturally responsive programs supporting leadership development, identity formation and healthy relationships, with 75 percent of young people actively engaging. In many instances, young people were part of co-creating curriculum, designing and facilitating workshops and elevating the voices of their peers.
• 31 community partners continued to invest in our young leaders. Participants led dialogues with their communities about environmental and social justice, hosted peer-to-peer training sessions on boundaries and healthy relationship skills, supported educators in understanding the needs of LGBTQ+ students and advised on program policies to better serve youth during the pandemic.
When communities lead, families win
As schools closed and other safety and health measures were put into place, the established trust and relationships between youth and families and Best Starts’ community partners were critical to navigating remote learning, providing technology access and meeting basic needs. Schools turned to community partners as a bridge to communicating with and engaging students and families. Best Starts flexed funding so that community partners could lead the way with innovative, community-driven solutions and responsive adaptations to program services that best support the evolving needs of youth and families. Despite the challenges of the COVID-19 pandemic, schools and community partners forged stronger partnerships that will benefit youth and families for the long term.
School PartnershipsA school environment should promote the positive growth and development of every child or young person, regardless of race, ability or family income. In 2020, the school environment shifted drastically with school closures and the transition to remote learning. Best Starts for Kids’ work to strengthen partnerships between schools, school districts, community-based organizations, young people and families provided a foundation for these partners to collectively identify how to continue offering services. Through our investments in Trauma-Informed and Restorative Practices in
Photo: Institute for Community Leadership
STRATEGIES INVESTMENTSWELCOME PARTNERSINTRODUCTION EVALUATION
Investing Early | Sustaining the Gain | Communities Matter | Homelessness Prevention | Capacity Building and Technical Assistance
BEST STARTS FOR KIDS 2020 ANNUAL REPORT 25

Photo: Alexander Suhorucov, Pexels
Schools, School-Based Health Centers, Out-of-School Time and School-Based Screening, Brief Intervention, and Referral To Services (School-Based SBIRT), Best Starts redefined how to maintain school-based services and partnerships in line with COVID-19 health and safety measures.
Trauma-Informed and Restorative Practices in School Environments• Delivering impact• $6.5M invested in 2020• 31 community partners
Best Starts works with 30 partners, including schools, school districts and community organizations, and more than 70 schools in 10 school districts to implement innovative trauma-informed and restorative practices. These partnerships strive to dismantle inequity in schools and focus on the impact of trauma and racism with practices that address, repair, restore and support relationship-building and healing among school personnel, students, families and community.
In 2020, Best Starts’ community partners built on the trust and rapport established with young people and their families to navigate changing educational and social emotional needs throughout the year. The challenges presented by remote learning elevated the importance of supporting community partners in their efforts to engage and train parents on how to be advocates and leaders in their child’s education. Best Starts also responded to community partners’ needs for healing and connection and for leveraging one another’s expertise by providing peer networking and learning opportunities.
2020 OUTCOMES
• Youth, teachers, school staff and parents participated in 9,170 Trauma-Informed and Restorative Practices events or sessions. For programs reporting these measures, 96 percent of participants from July to December increased their competencies, knowledge or skills.
• 3,218 people were served by Trauma-Informed and Restorative Practices from July to December. For programs reporting measures, 85 percent of youth strengthened their sense of self, identity and empowerment.
School-Based Screening, Brief Intervention and Referral To Services (SBIRT)• Delivering impact• $3.5M invested in 2020• 12 community partners
When youth have an opportunity to process their concerns and share their hopes for the future, it can transform their days into positive experiences. Best Starts partners with 12 school districts across King County to identify youth who may benefit from additional supports early, using a teen-friendly screening process designed for middle school students.
SBIRT shifted to remote screening and follow-up as schools closed in the spring of 2020. As a result, SBIRT reached more than 8,000 students in the 2019–2020 school year. A universal screening process has meant that whole classrooms or entire grade levels are screened to promote health and
well-being by giving students the opportunity to voice their concerns and find support early.
2020 OUTCOMES
• From September to December, 507 students were screened across six school districts conducting remote screening. Of these students, 231 engaged in a brief intervention and 75 were referred to services or resources.
• Among students who were provided with one or more referrals, 44 percent of referrals resulted in a successful connection to behavioral health or other type of service.
STRATEGIES INVESTMENTSWELCOME PARTNERSINTRODUCTION EVALUATION
Investing Early | Sustaining the Gain | Communities Matter | Homelessness Prevention | Capacity Building and Technical Assistance
BEST STARTS FOR KIDS 2020 ANNUAL REPORT 26

Amidst programming adjustments due to COVID-19, we were able to provide a wide range of support through in-person and virtual interactions. …. Our ability to properly assess and identify the needs of our youth amidst COVID-19 has proven to be crucial in creating stronger bonds with the families we serve and the community as a whole.”— Shamso Issak, Living Well Kent, Out-of-School Time partner
2020 OUTCOMES
• 1,527 children and youth participated in high-quality Out-of-School Time opportunities, both virtually and in-person. 5,120 hours of virtual programming were provided. Out-of-School Time awardees distributed 736 technology devices (e.g., laptops, tablets, Wi-Fi hotspots) to support youth in accessing Out-of-School Time programs and virtual schooling.
• 93 percent of partners reported gains for young people, including strengthening social emotional learning and academic skills.
School-Based Health Centers• Delivering impact• $1.5M invested in 2020• 8 community partners
School-based health centers meet students where they are by offering confidential medical and mental health services at school locations. In 2020, after school closures throughout the region, school-based health centers found ways to re-open, including putting health and safety measures in place for in-person services and offering care through telehealth, text messaging, house calls and online groups. Providers also saw a rise in
Out-of-School Time• Delivering impact• $4.9M invested in 2020• 30 community partners
High-quality Out-of-School Time programs directly correlate to children and youth’s academic gains, social emotional well-being and improved health. Best Starts partners with School’s Out Washington to fund 30 organizations that offer culturally relevant after-school and summer programs for youth in underserved areas of King County. School’s Out Washington also provides coaching and training opportunities to support Out-of-School Time partners in strengthening program quality and incorporating best practices for how they interact with and engage youth.
Through the distribution of technology resources and STEM and art learning kits, Out-of-School Time partners used creative methods of virtual and in-person programming to engage youth in hands-on learning opportunities, while continuing to offer homework help, academic and social emotional support, and cultural enrichment. Deepening family outreach and one-on-one relationships with youth helped partners to maintain important connections during a very challenging year.
demand for basic needs during the pandemic and shifted support to address this immediate concern, while continuing to provide students with medical and mental health services. Enhanced team collaboration and communication approaches led to quality care for students and school communities being served. While academic outcomes were affected by COVID-19 school closures, prior evidence demonstrates important improvement in mental, behavioral and physical health and academic outcomes.
2020 OUTCOMES
• Students made 4,122 visits to school-based health centers for primary care, behavioral health and preventive care.
• 979 people accessed services at school-based health centers.
Photo: Shutterstock
STRATEGIES INVESTMENTSWELCOME PARTNERSINTRODUCTION EVALUATION
Investing Early | Sustaining the Gain | Communities Matter | Homelessness Prevention | Capacity Building and Technical Assistance
BEST STARTS FOR KIDS 2020 ANNUAL REPORT 27

Family and Community Connections
Through the Healthy and Safe Environments, Family Engagement and Washington Child Health Improvement Partnership (formerly Adolescent Immunization) strategies, Best Starts for Kids builds connections between families, educators, health professionals and others working to provide young people with health care, healthy food and safe and secure places to live, learn and play. With support from Best Starts, communities are changing policies, sharing skills and best practices and forging new collaborations that help kids and teens flourish.
Healthy and Safe Environments• Delivering impact• $633K invested in 2020• 19 community partners
Best Starts works with community partners to create healthy and safe environments for children, youth and families, with a focus on improving policies and practices to increase access to healthy food and physical activity; reduce exposure to unhealthy substances; and give residents the best chance to be safe and secure in their homes, work and other places they spend time.
In 2020, Best Starts continued our investment with 19 community partners that in total created 46 systems-level changes benefiting 57 unique environments. Community partners prioritized equity and shifted resources to wherever the greatest needs emerged. From updating policies to serve children of essential workers while in child care, to empowering youth leadership in racial justice initiatives, partners worked to create community-driven structural and institutional change. Overall, 440 partners have successfully led projects affecting more than 76,723 youth and community members across all nine districts of King County.
2020 OUTCOMES
• Boys and Girls Clubs of King County changed their policies to give children of essential workers priority to attend the club’s programs, providing a safe place to eat and learn while their parents work.
• Auburn School District’s Physical Education program pivoted in the fall of 2020 to engage students in physical activity at home. They created exercise videos that promoted health and well-being and delivered simple exercise equipment to student homes.
• Young leaders in Healthy and Safe Environment programs affected by the Black Lives Matter movement and social uprisings reached out to stakeholders and decision makers to advocate for justice and racial equity in their communities.
Washington Child Health Improvement Partnership• Delivering impact• $230K invested in 2020• 1 community partner
Washington Child Health Improvement Partnership (CHIP; formerly Adolescent Immunizations) works to ensure young people have access to high-quality health care so they can grow into happy, healthy adults. CHIP facilitates structured learning activities with pediatric health care professionals aimed at improving care within clinic settings, while also bringing together key partners to address systemic barriers to health care.
Immunizations are a vital part of preventive care and a priority for this partnership. With a drop in adolescent immunizations in the spring of 2020 due to COVID-19, CHIP focused on strategies to assist clinics in outreach efforts to address potential missed vaccinations. Nine clinics engaged in this partnership, using the science of quality improvement to increase immunization
Photo: Shutterstock
STRATEGIES INVESTMENTSWELCOME PARTNERSINTRODUCTION EVALUATION
Investing Early | Sustaining the Gain | Communities Matter | Homelessness Prevention | Capacity Building and Technical Assistance
BEST STARTS FOR KIDS 2020 ANNUAL REPORT 28

with their parents and caregivers — can navigate changing relationships in a positive way.
2020 OUTCOMES
• 1,004 parents/caregivers and 355 young people participated in programming designed to foster healthy adult-youth relationships, communication and cultural connection.
• 78 percent of young people and 88 percent of parents/caregivers saw an increase in connection to family or culture.
Transitions to Adulthood• Delivering impact• $3.4M invested in 2020• 12 community partners
King County offers incredible opportunities for young adults just beginning their careers. To ensure those opportunities are accessible to all young people, Best Starts expands access to education, job training and other services for youth and young adults to help them prepare for employment. Communities leverage Best Starts to complement existing efforts that help young people with behavioral health services, peer support and programs focused on pathways to high school completion and post-secondary education.
Community-driven solutions to meet basic needs
The COVID-19 pandemic heightened food and economic insecurity for many families already experiencing poverty, BIPOC families and other vulnerable populations. Many faced layoffs by businesses that did not survive the pandemic; others may have jobs but are confronting future instability. Best Starts’ community partners said that meeting basic needs was urgent, and we listened. Best Starts provided more than $69,000 in gift cards that community partners distributed to 275 families so households could purchase healthy food specific to their cultural and dietary preferences.
84 percent of young people and 92 percent of parents/caregivers gained new skills or knowledge to help them navigate parenting and adolescent development.
Photo: Jenjira Milan
rates for a total of over 17,800 adolescent patients. CHIP also responded to the youth mental health crisis exacerbated by the pandemic by assisting primary care providers in improving their referral systems for patients in need of mental health support.
Family Engagement• Delivering impact• $2.3M invested in 2020• 21 community partners
Trusted adults in a young person’s life increase the likelihood that youth will experience academic success, get a job and make healthy choices. A consistent and supportive family presence can especially make a difference for a young person during times of transition.
Best Starts recognizes that “family” is broadly defined as the people who care for youth. In 2020, Best Starts launched Positive Family Connections and funded 21 community partners to strengthen relationships between middle and high school-aged youth and their parents and caregivers. With a focus on building protective and promotive factors, providing support in times of need, and increasing the knowledge of adolescent and social emotional development, youth — together
STRATEGIES INVESTMENTSWELCOME PARTNERSINTRODUCTION EVALUATION
Investing Early | Sustaining the Gain | Communities Matter | Homelessness Prevention | Capacity Building and Technical Assistance
BEST STARTS FOR KIDS 2020 ANNUAL REPORT 29

Jobs became scarce and entry-level positions became highly competitive
[due to] shutdowns ... [Our team] took the initiative to motivate and
encourage their clients to use this time to focus on building their pre-
employment skills and hone their interviewing techniques … [and as] a
result … 98 percent of our enrolled clients showed a measurable increase
in their employability score this quarter. Preparing our clients to be as
competitive, prepared and confident as possible when job opportunities
begin to open up is one of our greatest successes as a program.”— Tracy Grant, Employment Program Coordinator, Friends of Youth
Closing the digital divide
In King County, the pandemic highlighted existing inequities in access to technology tools, resources and Wi-Fi connectivity for communities in high-poverty areas and for BIPOC and immigrant and refugee communities. Best Starts responded with emergency funds that allowed our community partners to purchase and distribute technology equipment for youth and families.
Digital equity is not just about access; it’s also about knowing how to effectively use technology. To support young adults in their transition to post-secondary education, Northwest Education Access developed a Digital Literacy and Virtual Learning Toolkit. Topics include online meeting platforms, digital degree audits, the college financial aid process, and campus-specific online tools. This resource helped students manage a transition that can be challenging in the best of times, and is even more complex during social isolation and remote learning.
In 2020, Best Starts worked with our partners to survey young people and hear directly about their experiences and needs during the pandemic, pivoting services accordingly. In collaboration with community partners, Best Starts regularly updated social media platforms to include regional resources and offer information on education and job training programs. With innovative approaches like directly connecting young people to cash assistance programs like the Plate Fund for restaurant workers, and offering online entrepreneurship classes and internships, Best Starts and our partners provided relief and opportunities during a challenging year.
2020 OUTCOMES
• 361 young people accessed behavioral health or other services offered at re-engagement sites across King County to help them maintain stability while they complete post-secondary education.
• 540 young people enrolled in work-training education programs, a 9 percent increase over 2019 despite barriers due to the impact of COVID-19. Of those completing the program, 69 percent stayed in school, graduated or enrolled in higher education.
• 356 young people enrolled in employment programs that connected them with internship and employment opportunities. More than 40 percent of young people were placed into paid internship, apprenticeship or employment opportunities despite the economic challenges presented by COVID-19 and a lack of youth employment opportunities.
• 195 young people engaged with peer connectors from their communities who helped them connect with one of King County’s more than 30 education and employment programs for young adults. More than 50 re-engaged with school or employment.
Photo: Northwest Education Access
STRATEGIES INVESTMENTSWELCOME PARTNERSINTRODUCTION EVALUATION
Investing Early | Sustaining the Gain | Communities Matter | Homelessness Prevention | Capacity Building and Technical Assistance
BEST STARTS FOR KIDS 2020 ANNUAL REPORT 30

SUSTAINING THE GAIN 2020 DEMOGRAPHICS
Data are provided only for individuals for whom information is available and relevant. Individuals who are enrolled in more than one program may be duplicated in the demographic data. Totals may not add up to 100% due to rounding. Not all programs collect the “Middle Eastern or North African” race category or detailed gender identity data, which may lead to undercounting of these populations. See full results online for complete information.
GENDER IDENTITY
•• Female: 53%
• • Male: 44%
•• Another gender: 3%
Individuals who selected “Another gender” indicated their gender identity was not listed in the response options. This includes but is not limited to persons identifying as transgender, nonbinary, questioning, and/or gender-nonconforming.
AGE IN YEARS
•• <5: < 1 %
•• 5–17: 72%
•• 18–24: 14%
•• 25–54: 13%
• • 55+: 1%
RACE/ETHNICITY
•• American Indian/Alaska Native: 3%
•• Asian: 9%
• • Black/African American: 33%
• • Hispanic/Latinx: 18%
•• Middle Eastern or North African: 1%
•• Multiple races: 11%
•• Native Hawaiian/Pacific Islander: 2%
•• White: 21%
•• Another race/ethnicity: 3%
Race groups are mutually exclusive.
2020 OUTCOMES
• 1,295 young people — a 19 percent increase over 2019 — participated in services that helped connect them to resources, a healthy system of support for meeting their goals and advocates who can champion their voices. 62 percent of participants achieved one of their goals, such as increasing school attendance, improving academic performance or applying for and getting a job.
• 68 young people involved in the legal system accessed education and legal services through a partnership between Best Starts, the King County Prosecuting Attorney’s Office Truancy Team, Neighborhood House, Reconnect to Opportunity and Youth Source — increasing the likelihood that they will remain in school and graduate into employment.
• 33 young people participated in Theft 3 and Mall Safety (T3AMS), part of a pilot project at Westfield Southcenter. T3AMS directs young people who make the mistake of shoplifting into mentoring and other support and out of the legal system. Since the start of the program in 2017, 100 percent of those who completed the program achieved a service plan goal.
• 83 young people involved in the legal system participated in the Community Empowered Disposition Alternative and Resolution (CEDAR) program. Of those who have exited the program, 67 percent received a recommendation for a reduction in charges or case dismissal.
62% of participants in Community Supports achieved goals of increasing attendance, improving academic performance or applying for and getting a job.
Stopping the School-to-Prison Pipeline• Delivering impact• $4.9M invested in 2020• 20 community partners
Best Starts invests in efforts to support youth and young adults in King County who, as a result of systemic and institutional racism, are more likely to be excluded from higher education and employment and pushed into the criminal legal system. In 2020, Best Starts worked closely with communities to mobilize funds, partnerships and other resources to effectively respond to a pandemic that disproportionately affects many BIPOC youth and their families. Best Starts’ community partners offered culturally reflective and responsive strategies for families to deepen engagement in their child’s education and positive identity formation. Best Starts also created a weekly virtual space for our partners to process their own emotions and the effects of injustices at the root of the racial justice uprisings. Together, these opportunities help give young people equitable access to trusted resources and partners that provide pathways from school to life success.
STRATEGIES INVESTMENTSWELCOME PARTNERSINTRODUCTION EVALUATION
Investing Early | Sustaining the Gain | Communities Matter | Homelessness Prevention | Capacity Building and Technical Assistance
BEST STARTS FOR KIDS 2020 ANNUAL REPORT 31

Communities Matter
• Community connections and relationships are strengthened, and community members are heard, acknowledged and feel that they belong.
• Anti-racism and equity principles are integrated into systems, policies and practices at all levels.
• Children, youth and families have access to what they need to be safe, healthy and strong.
• Community members shape the solutions to issues that affect them and express it through civic engagement and leadership.
• All people in King County have safe and affordable housing and are healthy, economically resilient, and active participants in community and civic life.
By investing in community-identified priorities and leadership, Communities of Opportunity supports communities so that:
Photo: Chris Fitzgerald, Youth in Focus
STRATEGIES INVESTMENTSWELCOME PARTNERSINTRODUCTION EVALUATION
Investing Early | Sustaining the Gain | Communities Matter | Homelessness Prevention | Capacity Building and Technical Assistance
BEST STARTS FOR KIDS 2020 ANNUAL REPORT 32

A space to celebrate equity, food access and innovation
The aromas of foods from Senegal, Argentina, Afghanistan, Ethiopia, Philippines and more fill Spice Bridge food hall and commercial kitchen at Tukwila Village. In 2020, after years of relationship-building and community-led design, the Food Innovation Network (FIN), a program of Global to Local, opened Spice Bridge to enhance the local food system, increase access to healthy and culturally specific foods and support local food businesses in South King County.
Spice Bridge gives the talented chefs in FIN’s Food Business Incubator program access to affordable commercial kitchen space, retail food stalls and a dining area. The program also offers support for building successful businesses — from licensing to pricing to marketing.
“FIN is all about building each other up through healthy food and entrepreneurship,” shares Krizia Cherece, owner of Wengay’s Kitchen, one of eight women-owned food businesses that have made their home at Spice Bridge. “We’re all learning from each other. We’re all women business owners, and it’s just nice that we’ve been helping each other grow. It’s nice to build that family, that community within our program.”
Communities of Opportunity (COO) partners with FIN to support Spice Bridge and the engagement of Community Food Advocates, leaders from different communities of South King County who address racial inequity in food systems and advise FIN on community needs and ways to reach different cultural groups. “My role and my passion is to reach out to immigrant and refugee communities to create that sense of safety and trust,” explains Njambi Gishuru, Cultural Outreach Specialist with FIN.
To help with the economic pressures of COVID-19, FIN offered Spice Bridge businesses additional financial assistance in 2020. In turn, the chefs supported FIN’s community meals program, preparing more than 8,700 no-cost meals for seniors and families in need. Global to Local also expanded programs in partnership with COO to address urgent needs that emerged during the pandemic, including employment services, food and baby supplies and help with rent.
Spice Bridge food hall and the Food Incubator Business program embody a model of community resilience and innovation for the King County region and beyond. A space for sharing culture through food and connection, a focus on shifting policies and systems to support local economic development, and a network to promote equitable access to entrepreneurship for immigrant and refugee women — FIN promises to transform the business and food landscape in King County for years to come.
Photos: Denise Miller, Global to Local
View the video from American Planning Association highlighting Food Innovation Network’s Spice Bridge food hall.
STRATEGIES INVESTMENTSWELCOME PARTNERSINTRODUCTION EVALUATION
Investing Early | Sustaining the Gain | Communities Matter | Homelessness Prevention | Capacity Building and Technical Assistance
BEST STARTS FOR KIDS 2020 ANNUAL REPORT 33

3,356 capacity building, community and workforce development events brought communities together.
Communities matter if children, youth and families are going to be healthy and thrive.
Communities of Opportunity (COO) supports community-led efforts in King County to build safe, healthy and thriving environments for children, youth and families who are furthest from health, housing and economic justice. As a network of residents, communities, decision-makers and funders, COO approaches social change through partnerships that work to shift policies, systems and relationships toward a just and equitable future. Since its launch in 2014, COO has invested in community-led initiatives to change policies and conditions in communities through collaboration with more than 150 organizations to create more than 300 new community partnerships and develop leadership in more than 1,200 community members.
The pandemic and 2020’s racial justice movement brought new urgency to how communities respond to the immediate needs of those most affected by systemic inequities. Increasing the power within communities matters now more than ever to effectively respond to COVID-19 and the deepening health and economic disparities that affect marginalized communities, including Black, Indigenous and people of color (BIPOC). Despite the many hardships of this past year, 2020 demonstrated how Best Starts’ investments through COO have reinforced community strength and resilience — through robust partnerships that addressed community needs in new and different ways, solutions for furthering more equitable policies and practices, and flexible and meaningful support to our community partners.
As of 2020, Best Starts is now delivering impact across all investments. All funded programs are actively delivering services, and there are at least two quarters of performance data to report for the year.
1,269 capacity building events focused on skill building workshops, leadership development and meetings to educate policy and decision-makers
563 community members took on leadership positions within their communities.
141 new partnerships developed to support progress toward policy and/or systems change.
The resource from COO is the foundation of our partnership.Without it, I think our COVID-19 response would have been siloed and less impactful on our own. Pandemic aside, COO provides capacity to align our vision and goals for the community. It enables us to prioritize partnerships by supporting the time, effort, and patience that’s needed to nurture deep, long lasting relationships.”
— A.J. McClure, Global to Local
$9.9M total investments in 2020
COO is a unique community-public-private partnership funded jointly by Best Starts for Kids and Seattle Foundation that supports transformational change in communities through three interrelated strategies.
See outcomes of Best Starts for Kids “Communities Matter” investments across King County here.
* Duplicated number reflects high virtual engagement
179,738 community members participated in partner events.
*
STRATEGIES INVESTMENTSWELCOME PARTNERSINTRODUCTION EVALUATION
Investing Early | Sustaining the Gain | Communities Matter | Homelessness Prevention | Capacity Building and Technical Assistance
BEST STARTS FOR KIDS 2020 ANNUAL REPORT 34

Place-Based and Cultural Community Partnerships• Delivering impact• $4.4M invested in 2020• 74 community partners
Best Starts builds on the expertise of community partners to drive change locally through geographic and cultural community partnerships. COO works with coalition partnerships in neighborhoods and cultural communities to advance better health, safe and affordable housing, increased economic opportunity and stronger community connections for residents.
COO has invested in six place-based partnerships — White Center, Rainier Valley, SeaTac and Tukwila, Kent, Seattle’s Central District and the Snoqualmie Valley — and three culturally rooted partnerships, through the Comunidad Latina de Vashon, Transgender Economic Empowerment Coalition and the Seattle Urban Native Nonprofits.
2020 OUTCOMES
• Comunidad Latina de Vashon (CLV) worked with Vashon School District towards changes that promote equity in technology, language and race, including the hiring of a language liaison and a second counselor to support increased mental health needs. CLV also supported 10 parents and youth organizers to create videos in their native languages with English subtitles as part of their educational advocacy, and 40 community members with capacity building and leadership development to build local economic opportunities and respond to community needs.
• Transgender Economic Empowerment Coalition (TEEC) members addressed barriers to thriving for transgender and gender diverse people, including gaps in affordable housing and gender affirming care, while increasing opportunities to build stronger community connections. TEEC developed the Youth Equity Support (YES!) Toolkit — a series of guided self-reflection exercises to build the capacity of youth service providers to better support BIPOC LGBTQ youth
The publication of our Community Needs Assessment [CNA] marks the first time that data has been isolated to just the Valley. Thisprovides a baseline upon which future CNA’s can be compared.COO’s efforts to ensure the grantees have the flexibility to respond toevents that arise has created the conditions for us to respond to issues effectively. [Not] worrying about onerous approval processes has
allowed [us to] feel empowered to take some risks and be ambitious.”— Regina Kuzina, Sno-Valley Center Manager, Hopelink and Governance Board member, A Supportive Community For All
— and established the Youth Advocacy Council at Gay City and remote/digital community support programming for teens, reaching 1,442 LGBTQ youth and directly supporting 187 LGBTQ youth.
• Rainier Valley coalition partner, Healthy Othello Safer Through Environmental Design (HOSTED), supported 16 youth to improve community connections and health by sponsoring 22 summer community projects and workshops to engage in vegetable gardening, beautification and artistic expression, all while following COVID-19 protocols. Partners at Rainier Beach Action Coalition’s Corner Greeters and Farm Stand programs figured out how to continue operating safely, providing 6,000 pounds of free, fresh produce and activating and engaging with spaces and people in the Rainier Beach community.
Photo: Danielle Elliott
STRATEGIES INVESTMENTSWELCOME PARTNERSINTRODUCTION EVALUATION
Investing Early | Sustaining the Gain | Communities Matter | Homelessness Prevention | Capacity Building and Technical Assistance
BEST STARTS FOR KIDS 2020 ANNUAL REPORT 35

Policies and Systems Change• Delivering impact• $2.6M invested in 2020• 36 community partners
Best Starts works to achieve racial, economic and social justice so that all kids, youth, families and communities are healthy and thriving. COO’s policy and systems change investments help communities translate their ideas into actions through the promotion of equitable policies and practices that result in strong, inclusive communities.
In 2020, COO investments contributed to systems change efforts focused on COVID-19 response efforts and advancing racial equity by supporting Black-led organizations in leading policy change.
2020 OUTCOMES
• Front & Centered created a fellowship program and peer learning cohort to support BIPOC entrepreneurs in developing innovative enterprises that reflect a regenerative, community-focused approach to economic growth. The inaugural cohort included five Frontline Community Fellows and four New Economy Learning Peers. The group participated in a seven-session peer-learning curriculum and connected to government and philanthropic leaders, along with 90 other individuals, at the first Move The Money session. This session was a strategy of New Economy Washington to invest in systems change and community self-determination in a just transition toward a regenerative economy.
• Para Los Niños created a parent leadership team and began organizing with Latino parents in advocacy for themselves, their children and their community in addressing racism and the lack of support, representation and access for Latino families in the educational system, especially with the challenges of remote learning.
Learning Community• Delivering impact• $1.1M invested in 2020• 13 community partners
Best Starts invests in opportunities for communities to collaborate and coordinate efforts for the greater good. COO’s Learning Community strategy leverages the power of collective knowledge to accelerate change. COO provides resources to support experiences and activities that deepen a shared understanding and analysis of the root causes of inequity. The Learning Community also creates a space to collaborate and learn about approaches and models being developed across King County and across the country to promote healthy and sustainable communities.
2020 OUTCOMES
• Community Real Estate Stewardship Team (CREST), a learning circle of 13 community organizations led by and for low-income communities and communities of color, participated in 10 shared learning experiences. This opportunity focused on
View a video from Para Los Niños.
sharing models of community stewardship driven by community organizing, as well as strategies to shift power dynamics to improve material conditions for communities.
• COO’s COVID-19 Tech Fund provided essential infrastructure support for organizations to navigate the COVID-19 environment. 25 organizations were funded a total of $125,775 to purchase technology and resources essential for organizational operations and deliverables, while supporting community members and staff in practicing social distancing and working safely.
• COO sponsored new works by seven local artists offering creative ways of understanding the intersection of the COVID-19 pandemic with race, bias and culture. These works from artists and communities significantly impacted by the pandemic are a direct response to the bias and stigma that have grown out of the response to COVID-19. The art helps to reflect on the ways that community has come together to provide support and solidarity and suggests ways of creating a better future during this uncertain time.
STRATEGIES INVESTMENTSWELCOME PARTNERSINTRODUCTION EVALUATION
Investing Early | Sustaining the Gain | Communities Matter | Homelessness Prevention | Capacity Building and Technical Assistance
BEST STARTS FOR KIDS 2020 ANNUAL REPORT 36

Depicted here is a typical day at a PICA-WA food distribution site where several of our Pacific Islander young people and adults continuously show up to volunteer, support the livelihoods of our fellow Pasifika community members, and also connect and fellowship with each other. In times of hardship, our Pasifika communities have always responded by rallying to support each other and this weekly food distribution has come to personify what resilience looks like to me. The illustrated background also pays homage to the longevity of our traditions and customs that have survived generations of systemic aggression in efforts to erase our collective sense of self. This too is resilience and it all points back to the importance of uplifting the voices and leadership of our Pasifika communities who continue to steward their own self-determination.”— Toka Valu, COO Anti-Hate and Bias COVID-19 campaign artist partner
At the core of community-level transformative change is the understanding that it cannot happen in isolation — it happens through the accumulated and connected impact of our individual actions. The gift and purpose of the Learning Community has been harnessing and nourishing those critical connections — to share, to teach, to reflect and to evolve the brilliant work being generated by and for those most impacted in our communities.”— Sarah Tran, COO Capacity Building Lead, Communities Rise, and Sama Praxis LLC
— Njambi Gishuru, Cultural Outreach Specialist, Food Innovation Network
PHOTO TO COME
Photo: Toka Valu, Artwork from Anti-Hate and Bias COVID-19 Art Campaign.
Photo: Erin Murphy
STRATEGIES INVESTMENTSWELCOME PARTNERSINTRODUCTION EVALUATION
Investing Early | Sustaining the Gain | Communities Matter | Homelessness Prevention | Capacity Building and Technical Assistance
BEST STARTS FOR KIDS 2020 ANNUAL REPORT 37
Homelessness Prevention
Photo: Jenjira MIlan
STRATEGIES INVESTMENTSWELCOME PARTNERSINTRODUCTION EVALUATION
Investing Early | Sustaining the Gain | Communities Matter | Homelessness Prevention | Capacity Building and Technical Assistance
BEST STARTS FOR KIDS 2020 ANNUAL REPORT 38

9 of 10 households in the Youth and Family Homelessness Prevention Initiative programs are still stably housed.
The best opportunity to end homelessness in King County is to prevent it.
The COVID-19 crisis exacerbated inequities in housing and economic stability, straining many households already concerned with how to make ends meet. Best Starts for Kids’ Youth and Family Homelessness Prevention Initiative provides critical resources to help youth and families who are at risk of homelessness stay housed, with long-term benefits for the strength and stability of our communities.
Through Best Starts for Kids, King County is investing $21 million in homelessness prevention specifically for children, youth and their families. Of the more than 10,000 youth and families served by the Youth and Family Homelessness Prevention Initiative to date, 96 percent of those who completed the program were still housed one year later. This investment is vital to how we recover as a region, and together we will work toward a healthy, thriving King County where no young person or family is at risk of housing instability and homelessness.
As of 2020, Best Starts is now delivering impact across all investments. All funded programs are actively delivering services, and there are at least two quarters of performance data to report for the year.
96% of participants did not require homelessness services after 12 months from exiting to permanent housing.
82% of households served were households of color.
The most common reason families sought financial help was to pay rent so they could stay housed. It takes an average of $2,028 to meet that need for support.
Photo: Shutterstock
$3.8M total investments in 2020
See outcomes of Best Starts for Kids “Homelessness Prevention” investments across King County here.
STRATEGIES INVESTMENTSWELCOME PARTNERSINTRODUCTION EVALUATION
Investing Early | Sustaining the Gain | Communities Matter | Homelessness Prevention | Capacity Building and Technical Assistance
BEST STARTS FOR KIDS 2020 ANNUAL REPORT 39

Youth and Family Homelessness Prevention Initiative • Delivering impact• $3.4M invested in 2020• 25 community partners
The Youth and Family Homelessness Prevention Initiative works as part of a coordinated system to reduce the impact of homelessness on youth in King County by resolving housing crises before they result in housing loss. The initiative focuses on reaching communities at greatest risk, including families and youth from Black, Indigenous and people of color (BIPOC) communities, immigrant and refugee families and youth, LGBTQ+ youth, and victims of domestic violence, commercial exploitation and human trafficking.
The initiative intentionally funds partners that serve these communities such as:
• API Chaya, a domestic violence agency empowering survivors of gender-based violence and human trafficking
• The ARC of King County, serving people with intellectual and developmental disabilities
• Mother Africa, supporting African refugee and immigrant women and their families
• YouthCare, dismantling systems of oppression that push young people, particularly Black, Indigenous and people of color (BIPOC) youth, into homelessness
In collaboration with diverse community partners, the Youth and Family Homelessness Prevention Initiative identifies the needs and gaps in support
for families with children and young adults in crisis, then intervenes quickly to help them maintain housing. Professional case management that integrates equity and social justice into its delivery of services, combined with flexible financial assistance where needed, helps to resolve immediate housing crises.
In 2020, our community partners shifted to deliver services remotely, following COVID-19 health and safety measures and guidelines. Creative ways to connect — such as meeting socially distanced at a park, weekly phone check-ins and utilizing a variety of technology platforms — helped maintain critical services. As more and more households experienced job losses, economic insecurity and an uncertain future, case managers had to rethink how to help families navigate and access resources. Despite the challenges presented this year, the initiative was successful in maintaining housing stability for many households.
2020 OUTCOMES
• The Youth and Family Homelessness Prevention Initiative served 3,310 individuals in 2020. This support included assisting with housing searches, connecting to employment resources, language and cultural support, working directly with resolving conflicts with landlords, and budgeting and housing stability planning.
• From 2017 through 2020, 1,968 households have exited the Youth and Family Homelessness Prevention Initiative program and remained in or were placed in permanent housing.
• Over four years, this initiative has served 10,235 individuals, including 2,852 families and 699 unaccompanied youth.
HOMELESSNESS PREVENTION 2020 DEMOGRAPHICS
Data are provided only for individuals for whom information is available and relevant. Individuals who are enrolled in more than one program may be duplicated in the demographic data. Totals may not add up to 100% due to rounding. Demographic categories determined by federal guidelines.
See full results online for complete information.
GENDER IDENTITY
•• Female: 59%
• • Male: 40%
•• Another gender: <1%
Individuals who selected “Another gender” indicated their gender identity was not listed in the response options. This includes but is not limited to persons identifying as transgender, non- binary, questioning, and/or gender-nonconforming.
AGE IN YEARS
•• <5: 17%
•• 5–17: 38%
•• 18–24: 11%
•• 25–54: 32%
• • 55+: 2%
RACE/ETHNICITY
•• American Indian/Alaska Native: 4%
•• Asian: 5%
• • Black/African American: 51%
• • Hispanic/Latinx: 14%
•• Multiple races: 9%
•• Native Hawaiian/Pacific Islander: 3%
•• White: 14%
Race groups are mutually exclusive.
STRATEGIES INVESTMENTSWELCOME PARTNERSINTRODUCTION EVALUATION
Investing Early | Sustaining the Gain | Communities Matter | Homelessness Prevention | Capacity Building and Technical Assistance
BEST STARTS FOR KIDS 2020 ANNUAL REPORT 40

Capacity Building and Technical Assistance
Photo: Jenjira Milan
STRATEGIES INVESTMENTSWELCOME PARTNERSINTRODUCTION EVALUATION
Investing Early | Sustaining the Gain | Communities Matter | Homelessness Prevention | Capacity Building and Technical Assistance
BEST STARTS FOR KIDS 2020 ANNUAL REPORT 41
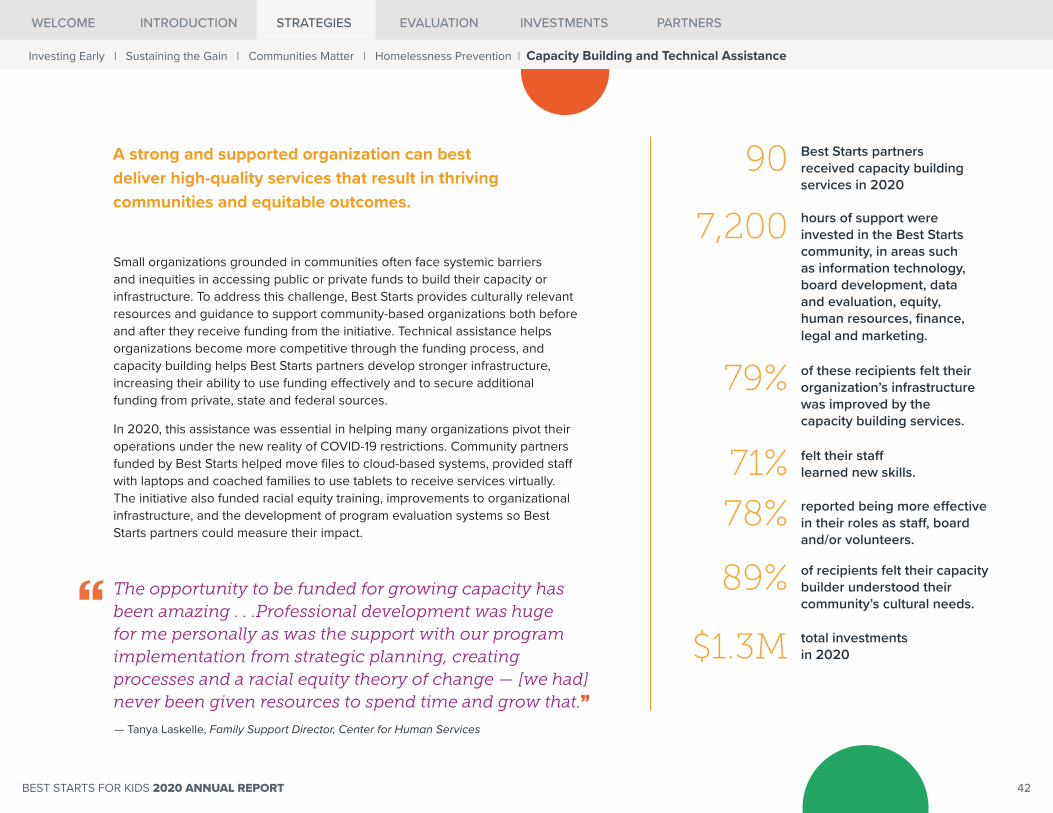
A strong and supported organization can best deliver high-quality services that result in thriving communities and equitable outcomes.
Small organizations grounded in communities often face systemic barriers and inequities in accessing public or private funds to build their capacity or infrastructure. To address this challenge, Best Starts provides culturally relevant resources and guidance to support community-based organizations both before and after they receive funding from the initiative. Technical assistance helps organizations become more competitive through the funding process, and capacity building helps Best Starts partners develop stronger infrastructure, increasing their ability to use funding effectively and to secure additional funding from private, state and federal sources.
In 2020, this assistance was essential in helping many organizations pivot their operations under the new reality of COVID-19 restrictions. Community partners funded by Best Starts helped move files to cloud-based systems, provided staff with laptops and coached families to use tablets to receive services virtually. The initiative also funded racial equity training, improvements to organizational infrastructure, and the development of program evaluation systems so Best Starts partners could measure their impact.
90 Best Starts partners received capacity building services in 2020
7,200 hours of support were invested in the Best Starts community, in areas such as information technology, board development, data and evaluation, equity, human resources, finance, legal and marketing.
The opportunity to be funded for growing capacity has been amazing . . .Professional development was huge for me personally as was the support with our program implementation from strategic planning, creating processes and a racial equity theory of change — [we had] never been given resources to spend time and grow that.”— Tanya Laskelle, Family Support Director, Center for Human Services
79% of these recipients felt their organization’s infrastructure was improved by the capacity building services.
71% felt their staff learned new skills.
78% reported being more effective in their roles as staff, board and/or volunteers.
89% of recipients felt their capacity builder understood their community’s cultural needs.
$1.3M total investments in 2020
STRATEGIES INVESTMENTSWELCOME PARTNERSINTRODUCTION EVALUATION
Investing Early | Sustaining the Gain | Communities Matter | Homelessness Prevention | Capacity Building and Technical Assistance
BEST STARTS FOR KIDS 2020 ANNUAL REPORT 42

Best Starts for Kids evaluation in 2020Best Starts for Kids is committed to evaluating all of our strategies and programs to ensure that we are moving toward our vision of happy, healthy, safe and thriving youth and families.
Results Based Accountability (RBA) is fundamental to Best Starts. RBA is a plain-language framework that starts with the vision we are trying to achieve and works backward toward the strategies for getting there. The framework tracks the performance of Best Starts strategies, so that we know what is working, and what may need adapting, through three types of performance measures.
1. How much did we do?
2. How well did we do it?
3. Is anyone better off?
Best Starts for Kids works together with all funded partners to identify performance measures.
Performance measures notes
When reviewing the following performance measure tables, it is important to note:
• Individuals may enroll in more than one program funded by Best Starts for Kids.
• Best Starts–funded programs often leverage funding from multiple sources.
Best Starts for Kids categorizes investments as “laying the groundwork,” “building momentum” and/or “delivering impact,” a reflection of both the life and complexity of the initiative. As of 2020, all programs funded by Best Starts are delivering impact.
☐ Laying the groundworkInternal work required to award funding and deliver services is under way, including hiring county staff, developing requests for proposal, running request for proposal processes and finalizing contracts with awardees.
▲ Building momentumAwardees have contracts with King County and are beginning their work. The program may have started delivering services, but performance data are not yet available.
★ Delivering impact In this phase, the program is actively delivering services, and there are at least two quarters of performance data to report for the year.
The COVID-19 pandemic had a substantial impact on Best Starts for Kids programs and performance measures in 2020. This is noted in the tables as follows:
Heavily affected by COVID-19 Not able to deliver services as planned for at least one quarter of 2020, or able to deliver services, but pivoted from planned performance measures to new measures based on emergency contract amendments in response to COVID-19.
Moderately affected by COVID-19 Able to deliver services but unable to collect some performance measures, or some grantees within a strategy were affected, but not all funded partners strategy-wide were affected.
STRATEGIES INVESTMENTSWELCOME PARTNERSINTRODUCTION EVALUATION
Overview | 2020 Modifications | Program changes | Population indicators | Performance measures
BEST STARTS FOR KIDS 2020 ANNUAL REPORT 43

Investing Early: prenatal to 5 years
Previous performance measure Revised performance measure Rationale
Developmental Promotion and Early Support
Social-Emotional Well-being: Endorsement ★ Delivering impact
Percent of grantees who experienced career benefits after earning their endorsement
Percent of grantees who reported the endorsement process increased their effectiveness in their role with families
Revised language to more clearly reflect the desired outcome.
Social-Emotional Well-being: Reflective Consultation ★ Delivering impact
Percent of participants who reported that reflective consultation encouraged them to further reflect on their practices
Percent of participants reporting increased confidence to talk about social and emotional development with families
Revised language to more clearly reflect the desired outcome.
Percent of participants who reported being more empathetic in their relationships with children and families as a result of participating in reflective consultation
Percent of participants who reported a positive impact on their relationship with children and families
Revised language to more clearly reflect the desired outcome.
Home-Based Services
Evidence-Based and Evidence-Informed programs ★ Delivering impact
Percent of families connected to services based on a referral
Percent of families referred and/or connected to services based on model requirements
Revised language to more clearly reflect the desired outcome.
Community-designed programs ★ Delivering impact
Number of families/caregivers served Separated into two measures: number of families served and number of caregivers served
Separated into two individual measures to more clearly reflect the desired outcome.
Percent of families with increased protective factors
Percent of families with increased parental resilience
Percent of families with increased social and emotional competence of children
Percent of families with increased concrete support
This measure was in development in 2019; in 2020, it was finalized, and specific performance measure were developed based on the Protective Factors Framework.
Percent of families with increased knowledge of parenting and child development
Percent of families with increased social connections
Implementation and evaluation require occasional modifications as information becomes available over time. Listed below are changes to previously reported performance measures. Newly implemented performance measures resulting from the impact of COVID-19 are noted in the performance measurement tables.
Changes to performance measures for this year’s report
STRATEGIES INVESTMENTSWELCOME PARTNERSINTRODUCTION EVALUATION
Overview | 2020 Modifications | Program changes | Population indicators | Performance measures
BEST STARTS FOR KIDS 2020 ANNUAL REPORT 44

Previous performance measure Revised performance measure Rationale
Community-Based Parenting and Peer Supports
Parenting Caregiver Information and Support ★ Delivering impact
Percent of families with increased protective factors Percent of families with increased parental resilience
Percent of families with increased social and emotional competence of children
Percent of families with increased concrete support
Percent of families with increased knowledge of parenting and child development
Percent of families with increased social connections
This measure was in development in 2019, and specific performance measures were developed based on the Protective Factors Framework.
Prenatal Support and Breastfeeding Peer Counseling Services ★ Delivering impact
Number of people trained in breastfeeding peer counseling
Number of unique clients served through lactation support services
Evaluation plan finalized in 2020, with new performance measures.
Number of people trained in the March of Dimes supportive pregnancy care model
Number of unique clients served with supportive pregnancy
Evaluation plan finalized in 2020, with new performance measures.
Number of Perinatal Collaborative members that participated in community outreach events
Number of educational engagements provided Evaluation plan finalized in 2020, with new performance measures.
Number of completed breastfeeding peer counseling trainings
Number of professional development opportunities Evaluation plan finalized in 2020, with new performance measures.
Number of organizations that received infrastructure development and capacity building support
Measure removed because the evaluation plan for the strategy was finalized
Evaluation plan finalized in 2020, with new performance measures.
New performance measure for 2020 Number of referrals between partners Evaluation plan finalized in 2020, with new performance measures.
STRATEGIES INVESTMENTSWELCOME PARTNERSINTRODUCTION EVALUATION
Overview | 2020 Modifications | Program changes | Population indicators | Performance measures
BEST STARTS FOR KIDS 2020 ANNUAL REPORT 45

Sustaining the Gain: 5 to 24 years
Previous performance measure Revised performance measure Rationale
Transitions to Adulthood
Washington Child Health Improvement Partnership ★ Delivering impact
Number of trainings Number of quality improvement trainings provided by the partnership
Not a performance measure but was reported for 2019 during "laying the groundwork" stage of development to show work in progress.
Transitioning to Post-secondary Education or Employment: Career Launchpad ★ Delivering impact
Percent of youth/young adults making $13 or more per hour
Percent of youth/young adults placed into employment who are earning more than Washington state minimum wage
Revised language to more clearly reflect the desired outcome.
STRATEGIES INVESTMENTSWELCOME PARTNERSINTRODUCTION EVALUATION
Overview | 2020 Modifications | Program changes | Population indicators | Performance measures
BEST STARTS FOR KIDS 2020 ANNUAL REPORT 46

Investing early (prenatal to 5 years) program changes, overall successes and challenges
What changes have Best Starts for Kids partners made to programs or organizations to better serve children, youth, families or communities?
What we heard What does it mean? Best Starts for Kids partners told us ...
Changed the way services are provided
Partners described both positive and negative experiences of changing services to remain accessible to families during the COVID-19 pandemic.
“Due to COVID-19, we have completely shifted to virtual trainings and meetings. To support access to these trainings for technologically under-resourced providers and parents, we applied for a capacity-building grant through Best Starts for Kids to purchase laptops/tablets to create a lending library for our program participants. In addition, to facilitate continued community connections and support throughout the pandemic, we have hosted virtual community workshops and physically distanced ‘pull-up’ resource events to provide opportunities for community members and stakeholders to connect, learn, share and receive support.”
— Developmental Promotion/Help Me Grow partner
Adapted to new community needs The pandemic exacerbated existing inequities, leaving many families unable to meet basic needs. Programs adapted to address complex needs and keep families connected.
"When COVID-19 began, many of the families we served lost their jobs and were extremely worried about rent, food and other basic necessities. Our programs and organization had to pause to quickly figure out how to support families. We were able to help families with ordering food, some minimal rental assistance and have connected families to COVID-19 resources in the community. This would not have been possible without the help and flexibility from Best Starts for Kids. The way we responded to our families during this difficult time is to put families first and what they prioritized."
—Home-Based Services partner
Incorporated new technology for virtual programs
Partners had varying levels of success with different technology platforms, which often required additional training and provision of devices.
"We provided IT support for our clients. Many of the grandparents in our program didn’t know how to make video calls via social media apps before the pandemic. After we changed our service to virtual visit, our community liaisons had to teach the grandparents to learn how to use those apps, including WeChat, YouTube and Zoom. Amazingly and finally, they not only can use WeChat to make video calls, but also can use Zoom now.”
— Child Care Health Consultation partner
Best Starts for Kids asks all partners to answer a standard set of questions in addition to providing performance measure data. This helps us understand the stories behind the numbers. These responses are analyzed through a rigorous process to identify common themes for each question. Below are the most common themes heard in 2020, along with quotes that illustrate each theme.
STRATEGIES INVESTMENTSWELCOME PARTNERSINTRODUCTION EVALUATION
Overview | 2020 Modifications | Program changes | Population indicators | Performance measures
BEST STARTS FOR KIDS 2020 ANNUAL REPORT 47

What did Best Starts for Kids partners feel were the main successes that helped to accomplish program goals?
What we heard What does it mean? Best Starts for Kids partners told us ...
Maintaining contact with families and keeping them engaged through technology
When programs were able to overcome systemic barriers to technology, many had success increasing access to services and keeping families engaged through innovative, tailored outreach strategies.
"Virtual [program] platforms include but not limited to Zoom, Facebook, Instagram, YouTube and the partners’ individual websites. Our focus communities — African American, American Indian/Alaska Native and Pacific Islander — are populations who thrive on in-person organizing, outreach and education, and our [staff] and partners are aware of this element of implementation. Using social media and creating culturally reflective art, pictures and language helped to bring attention to the programming activities available for King County residents."
— Community-Based Parenting and Peer Supports partner
Staff resilience and innovation Programs celebrated their staff's commitment and ability to serve families in turbulent times. Programs added staff capacity through training and by hiring those with similar lived experiences to the communities served.
"I was so proud of my team because they're doing it and they don't need me there any more to be there for every step of the way. It's well, well beyond what I ever did last year, to see all the hands that have helped this one person have their baby. And when they need help, it's a very simple phone call. The midwife feels like if she needs help, she knows who to call and when they really, really need help that's when I get the phone call. I'm always happy to do what I can to help out. It's just so nice to see that so many more people are watchful and helping these families have really good care and really individualized care."
— Innovation Fund partner
Quick pivots in service provision Many programs highlighted their success in quickly pivoting to virtual services, securing additional resources and assessing how to best make services work for families.
"[Our organization] is still continuing to conduct programming virtually due to COVID-19. For Vroom, we were able to utilize already-existing programs and integrate our work to reach parents with young children. We were able to provide training virtually to different programs. We were able to listen to the unique needs and different perspective[s]."
— Vroom Community Connector partner
STRATEGIES INVESTMENTSWELCOME PARTNERSINTRODUCTION EVALUATION
Overview | 2020 Modifications | Program changes | Population indicators | Performance measures
BEST STARTS FOR KIDS 2020 ANNUAL REPORT 48

What did Best Starts for Kids partners feel were the major challenges or barriers to accomplishing program goals?
What we heard What does it mean? Best Starts for Kids partners told us ...
Technology fatigue Over the year, interacting virtually took a toll on staff and families, especially those who thrive on in-person engagement.
"The major challenge that the program is continuing to face this year is supporting facilitators to adapt to the virtual space and new realization of not going back to in-person meetings this year. Facilitators had shown flexibility and creativity and have been doing an amazing work in their communities supporting the children and caregivers, but they are still facing new challenges every day and experiencing their own fatigue from the COVID-19 pandemic. Our team continues to support the facilitators — in a group setting, individually or by joining the virtual groups."
— Community-Based Parenting Supports partner
Staff support and retention Partners discussed the huge demands on staff capacity while simultaneously experiencing and fighting the pandemic.
"A huge challenge due to the pandemic has been pivoting, [meaning] a very steep and treacherous learning curve for the facilitators while going through their own personal experiences and battles. Each facilitator and core team member is really going above and beyond to be there for their community in these trying times."
— Innovation Fund partner
Complex and compounding community needs
In addition to losing family members, risk of contracting COVID-19 and conflicting messages, Black, Indigenous and other communities of color disproportionately faced unemployment, mental health challenges, food insecurity, schooling demands and overwhelming stress, anxiety and fatigue.
"We also recognize what we are losing by not being able to share space and in-person conversation with members of these organizations. We are hopeful that things may begin to change soon. The pandemic has also greatly affected our families ... the vast majority have suffered job losses, are currently behind on rent and utility payments, and many have been directly affected by COVID-19 themselves."
— Help Me Grow partner
STRATEGIES INVESTMENTSWELCOME PARTNERSINTRODUCTION EVALUATION
Overview | 2020 Modifications | Program changes | Population indicators | Performance measures
BEST STARTS FOR KIDS 2020 ANNUAL REPORT 49

In what ways did organizations make progress toward changing policies, systems, and environments as a result of their Best Starts for Kids–funded programs?
What we heard What does it mean? Best Starts for Kids partners told us ...
Systems working in new ways to achieve outcomes
Best Starts for Kids partners and King County have been able to leverage diverse types of partnerships to improve system connectedness.
"As a result of our partnership with Best Starts for Kids and [throughout] the pandemic, our team has been able to develop new ways of linking clients with extra referral and service supports. We have partnered with some African food markets in the community to provide culturally based foods to the families we serve. We have also been distributing masks and hand sanitizers to families for the last several months."
— Home-Based Services partner
Changes in policies and procedures
Many organizations made changes to policies internally or supported policy change work at the system level in response to new environments caused by the pandemic and in service to equity.
"The systemic change we are witnessing is our organization's approach to what is considered support, whether in child development, mental health or basic needs, and who decides what that support looks like. In traditional service-based systems, there is a hierarchy of power, with providers at the top, directing what they deem best for their patients. Our most important value is centering our community’s strengths and being truly community-led. We do this by offering community members opportunities for leadership where they are the co-creator of the programs they want to see at our organization."
— Help Me Grow partner
Making programs more equitable The combined effect of the pandemic and social uprising against racism led to a renewed prioritization of racial equity.
"One of the changes we have made during the past six months was a very intensive and agency-wide focus on racial equity. Significant resources have been allocated to improving our competence regarding our own biases, as well as identifying areas in our organizational culture that require change in order to be more inclusive and responsive . . . We began the process through a series of trainings with the leadership team and Board of Directors . . . We then expanded to our entire staff with the equity training being the focus of our annual fall all staff meeting . . . The curriculum will be completed in May of 2021. We will then continue to work within our departments on moving the work forward with our internal workplace processes as well as our work with the community."
— Early Support for Infants and Toddlers partner
STRATEGIES INVESTMENTSWELCOME PARTNERSINTRODUCTION EVALUATION
Overview | 2020 Modifications | Program changes | Population indicators | Performance measures
BEST STARTS FOR KIDS 2020 ANNUAL REPORT 50

Sustaining the Gain (5 to 24 years) program changes, overall successes and challenges
What changes have Best Starts for Kids partners made to programs or organizations to better serve children, youth, families or communities?
What we heard What does it mean? Best Starts for Kids partners told us ...
Changed the way services are provided
Partners described both positive and negative experiences of changing services to remain accessible to families during the pandemic.
“Amidst our programming adjustments due to COVID-19, we were still able to successfully provide a hybrid model of programming that included a wide range of support through in-person and virtual interactions. And this trend carried on into the school year, as we constantly strive to connect and assist our youth with resources and aid that better themselves and their families overall. Our ability to properly assess and identify the needs of our youth amidst COVID-19 has proven to be crucial in creating stronger bonds with the families we serve and the community as a whole.”
— Out-of-School Time partner
Adapted to new community needs The pandemic exacerbated existing inequities, leaving many families unable to meet basic needs. Programs adapted to address complex needs and keep families connected.
"Due to the pandemic, many youth and their families were facing challenges getting their basic needs met and finding support . . . We identified resources and adapted our curriculum to include various resources for students and their families. We developed a specific COVID-19 Resource Page that we continue to update to ensure our youth and their families can access the resources they need . . . Both students and our community [also] needed support navigating and accessing food due to the impacts of the pandemic. In response, we launched our groceries program, where we delivered fresh, healthy and culturally relevant food to families in the [local school districts].”
— Healthy and Safe Environments partner
Incorporated new technology for virtual programs
Partners pivoted to virtual services to meet youth and family's needs during the pandemic and supported participants in accessing technology where needed.
“The most important success we had during this reporting period was being able to develop and implement telehealth for our students so they could access services. So many of our students were dealing with anxiety, depression, grief and debilitating fear. Our team was able to create an online space for them to give them tools and support to move forward even with all of the uncertainty.”
— School-Based Health Centers partner
Best Starts for Kids asks all partners to answer a standard set of questions in addition to providing performance measure data. This helps us understand the stories behind the numbers. These responses are analyzed through a rigorous process to identify common themes for each question. Below are the most common themes heard in 2020, along with quotes that illustrate each theme.
STRATEGIES INVESTMENTSWELCOME PARTNERSINTRODUCTION EVALUATION
Overview | 2020 Modifications | Program changes | Population indicators | Performance measures
BEST STARTS FOR KIDS 2020 ANNUAL REPORT 51

What did Best Starts for Kids partners feel were the main successes that helped to accomplish program goals?
What we heard What does it mean? Best Starts for Kids partners told us ...
Participants achieved important milestones
Despite economic and educational challenges brought on by the pandemic, participants achieved important milestones with the support of program staff, including high school graduation and employment.
“Jobs became scarce and entry-level positions became highly competitive as shutdowns forced skilled workers to take many of the positions available. [Our team] took the initiative to motivate and encourage their clients to use this time to focus on building their pre-employment skills and hone their interviewing techniques so they are poised to successfully enter the job market when the economy begins to recover . . . 98% of our enrolled clients showed a measurable increase in their employability score this quarter. Preparing our clients to be as competitive, prepared and confident as possible when job opportunities begin to open up is one of our greatest successes.”
— Transitions to Adulthood partner
Leveraged organizational partnerships
Due to strong partnerships before the pandemic, programs were able to collaborate with other CBOs and institutions to provide timely services, including basic needs assistance, referrals, and school supports.
“[Our] success included our connection to the families and children we served that was impacted by COVID-19. Because of our relationships we were able to pivot quickly to respond to their needs and support the students’ continued growth and helping to fulfill the family’s needs while out of school. And we continued to support their needs as school systems determined how to do school while in the pandemic.”
— Trauma-Informed and Restorative Practices partner
Quick pivots in service provision Many programs highlighted their success in quickly pivoting to virtual services, securing additional resources, and assessing how to best to support youth and families.
“We gave our students accessible and comprehensive information about the virus, what is happening in the world . . . and how they can be safe. We provided emotional support for students who have struggled with abrupt and profound changes in their routine as well an inability to have their social and intimacy needs met. We discussed coronavirus from a Healthy Relationships lens. We used our existing frameworks and vocabulary around boundaries, group agreements, consent and harm reduction to help students understand the public health advisories being asked of them.”
— Youth Development partner
STRATEGIES INVESTMENTSWELCOME PARTNERSINTRODUCTION EVALUATION
Overview | 2020 Modifications | Program changes | Population indicators | Performance measures
BEST STARTS FOR KIDS 2020 ANNUAL REPORT 52

What did BSK Partners feel were the major challenges or barriers to accomplishing program goals?
What we heard What does it mean? Best Starts for Kids partners told us ...
Technology fatigue The need to interact virtually took a toll on youth, families, and staff, which was further exacerbated by inequitable access to technology and internet.
“As young folks no longer have access to the same resources that they did pre-pandemic, such as smartphones and computers, they no longer have the opportunity to join our online programing. For our youth who do access to computers and other technologies, they are expected to spend hours in front of a screen for school. These factor, along with the universal struggle of performing productivity during a pandemic, [mean] our youth do not have the same capacity to stay online for workshops and panels. We have been working to understand where the line between engagement, productivity and self-care is. We also realized that we needed to reassess what our meaning of productivity is.”
— Youth Development partner
Complex and compounding community needs
In addition to losing family members, risk of contracting COVID-19 and conflicting messages, Black, Indigenous and communities of color disproportionately faced unemployment, mental health challenges, food insecurity, schooling demands and overwhelming stress, anxiety and fatigue.
“As families faced financial distress and youth were faced with online learning without any framework for their social needs . . . many of the resources, pro-social activities, community programs and positive interactions were no longer available. This led to the case managers [providing] academic support, tutoring, counseling, resource delivery to most of their youth themselves. It also created a major problem for [high school] seniors in credit retrieval programs that closed down, leaving some seniors with no option to get their credits to graduate on time. Thankfully, [our staff] has been working with a number of [programs] and was able to help most of our seniors and see them graduate.”
— Stopping the School-to-Prison Pipeline partner
Disruptions to programming Disruptions resulting from the pandemic led to gaps in services or the inability to adequately engage with youth and their families. Staff also felt the strain of not maintaining face-to-face interactions with youth and families.
“Providing participants with an increased sense of ongoing community through a completely virtual group experience has been something we have struggled with. Though we have seen some success, partially due to our trial-and-error method with different online forums, it has been challenging to recreate the same environment provided by in-person meetings. One of the aspects of our pilot programming that made it such a successful experience was the comradery built by participants meeting every Sunday while their children played together, discussing weekly topics over meals and creating a space that was comfortable to share in. Removing the more human aspect of meeting with one another in person has extended the amount of time it takes for participants to achieve this sense of community. [Parents] are also being asked to participate without the added support of child care during each meeting, altering their overall group experience, as some of them are actively parenting while their group meets or feel they cannot share as much as they would like to in the presence of their child/ren.”
— Family Engagement partner
STRATEGIES INVESTMENTSWELCOME PARTNERSINTRODUCTION EVALUATION
Overview | 2020 Modifications | Program changes | Population indicators | Performance measures
BEST STARTS FOR KIDS 2020 ANNUAL REPORT 53

In what ways did organizations make progress toward changing policies, systems, and environments as a result of Best Starts–funded programs?
What we heard What does it mean? Best Starts for Kids partners told us ...
Systems working in new ways to achieve outcomes
Partnerships and collaboration between Best Starts partners and institutions allowed partners to influence systems, improve coordination and remove barriers for clients.
“[Our school] partnership has resulted in changes to several of the school’s practices and processes. For example, coordination of scholars’ goal-setting — administered by staff at the beginning of the school year — has been implemented and positively supports changes in [the school’s] practices. Prior practice regarding scholars’ initial, beginning-of-the-year goal-setting was usually administered and coordinated by the school’s academic counselor. [Our] staff support and assistance helped streamline these processes and practices.”
— Trauma-Informed and Restorative Practices partner
Partnerships influenced policies and systems
Relationships with schools and other community partners were more important than ever during an ongoing pandemic. Program staff worked with organizations to reduce access barriers for youth and improve communication.
“The steering committee has also been tremendously helpful in getting schools and providers to partner on behavioral health awareness and advocating for this issue to the point of getting disaster response resources for [behavioral health]. Members of the [committee] have been working in partnership with [the Washington Department of Health] to raise mental health awareness strategically through a mix of social media, videos, banners, streaming radio and paid search . . . [the committee also began] to strategize disaster response for children’s behavioral health needs, including how to increase outpatient capacity and responsiveness as well as inpatient capacity.”
— Washington Child Health Improvement Partnership (formerly Adolescent Immunizations) partner
Making programs more equitable Programs participated in community efforts to make systems more equitable and anti-racist, in addition to changing internal policies that better support Black, Indigenous and communities of color, LGBTQ+ communities, and others with marginalized identities.
“[Our organization brought] awareness of the need to recognize, defend and protect immigrants’ rights in Washington state, regardless of their immigration status, [including those who are undocumented and] immigrant women victims of gender based-violence . . . [Our efforts] on behalf of immigrant communities, together with other organizations’ efforts, have led service providers, local authorities and Washington residents to recognize the role of immigrants in their communities as well as the risks and threats they and their families face. This recognition paved the way to the implementation of measures and policies to protect immigrants’ rights in the state of Washington.”
— Healthy and Safe Environments partner
STRATEGIES INVESTMENTSWELCOME PARTNERSINTRODUCTION EVALUATION
Overview | 2020 Modifications | Program changes | Population indicators | Performance measures
BEST STARTS FOR KIDS 2020 ANNUAL REPORT 54

Long-term population indicators and supporting indicators assess the well-being of all children throughout King County
Investing early (prenatal to 5 years) indicators
IndicatorImprovement
direction expectedData
source 2014 2017 2018 2019 2020
Headline indicators
Babies with healthy birth outcomes: infant mortality rate Decrease VS 4.3a 3.3a 4.2a NA NA
Babies with healthy birth outcomes: preterm birth Decrease VS 8.9% 9.1% 8.9% 9.4% NA
Children who are flourishing and resilient Increase BSKHS NA 60% NA 63% NA
Children who are ready for kindergartenb,c Increase OSPI 42.3% 58.1% 57.1% 55.5% 62.2%
Child abuse or neglect rate Decrease CW 31.2d 32.3d 32.6d 32.2d NA
Secondary indicators
Babies who meet breastfeeding recommendations to feed exclusively to 6 months Increase BSKHS NA 38% NA 40% NA
Pregnant women receive recommended prenatal care Increase VS 71.6% 74.2% 72.8% 70.7% NA
Families who are supportedb Increase BSKHS NA 76% NA 72%* NA
Children are healthy Increase BSKHS NA 92% NA 92% NA
Parents have knowledge of child development Increase BSKHS NA 75% NA 73% NA
Child care/preschools are high qualityb Increase BSKHS NA 97% NA 98% NA
Children receive recommended health and developmental screeningsb Increase BSKHS NA 23% NA 17%* NA
Children receive needed mental and behavioral health services Increase BSKHS NA 57% NA 65% NA
Reading and singing to children dailyb Increase BSKHS NA 71% NA 72% NA
Free from adverse childhood experiencesb Increase BSKHS NA 92% NA 92% NA
Notes: Latest available data presented for all years. Some surveys are conducted every other year. Changes between 2014 and most recent year are not statistically significant unless denoted with an asterisk (*).
Abbreviations: BSKHS, Best Starts for Kids Health Survey (conducted in even years only); CW, child welfare data via Partners for Our Children Child Well-being data portal; OSPI, Office of the Superintendent of Public Instruction; VS, vital statistics data via Washington State Department of Health.
a Infant mortality is rate of deaths in the first year of life per 1,000 live births.b Components of safe, stable and nurturing relationships indicator.c Kindergarten readiness trends cannot be assessed because of the phased
implementation rollout.d Child abuse or neglect data are rates of investigations and assessments per
1,000 households.
Rate or percentage of identified population in King County
STRATEGIES INVESTMENTSWELCOME PARTNERSINTRODUCTION EVALUATION
Overview | 2020 Modifications | Program changes | Population indicators | Performance measures
BEST STARTS FOR KIDS 2020 ANNUAL REPORT 55

Long-term population indicators and supporting indicators assess the well-being of all children throughout King County
Sustaining the Gain (5 to 24 years) indicators
Rate or percentage of identified population in King CountyIndicator
Improvement direction expected
Data source 2014 2017 2018 2019 2020
Headline indicators
Third-graders who meet reading standard Increase OSPI 61.7% 62.7% 65.5% 63.5% NA
Fourth-graders who meet math standard Increase OSPI 63.9% 65.2% 64.2% 62.5% NA
Youth who are flourishing and resilient Increase BSKHS NA 29% NA 29% NA
Youth and young adults who are in excellent or very good health Increase BSKHS NA 87% NA 86% NA
Youth who graduate from high school on time Increase OSPI 79.0% 80.5% 82.2% 87.4% 85.1%*
Youth and young adults in school or working Increase ACS 89% 93% 93% 93%* NA
High school graduates who earn a college degree or career credentiala
Highest percent across all King County school districts Increase ERDC 77% 78% NA NA NALowest percent across all King County school districts Increase ERDC 37% 38% NA NA NA
Youth not using illegal substances Increase HYS 75% 76%b 76% NA NA
Secondary indicators
Lowering the rate of adolescent births Decrease VS 4.7 2.7 2.3 2.1* NA
Youth have supportive adults in their livesc Increase HYS 75% 75%b 74% NA NA
Increase BSKHS NA 84% NA 86% NA
Youth believe in their ability to succeedd Increase HYS (2016) 48% 49%b NA NA NA
Increase HYS (2018) NA NA 53% NA NA
Youth are not chronically absent from school Increase OSPI 86.5% 84.9% 85.7% NAc NAc
Youth are getting good grades in school Increase HYS 79% 80%b 81%* NA NA
Youth are completing ninth grade Increase OSPI 73.6% 79.4% 79.7% 78.0% NA
Youth feel safe at school Increase HYS 87% 86%b 83%* NA NA
STRATEGIES INVESTMENTSWELCOME PARTNERSINTRODUCTION EVALUATION
Overview | 2020 Modifications | Program changes | Population indicators | Performance measures
BEST STARTS FOR KIDS 2020 ANNUAL REPORT 56

Notes: Latest available data are presented for all years. Some surveys are conducted every other year. Year listed for academic data reflects the academic year. Changes between 2014 and most recent year are not statistically significant unless denoted with an asterisk (*).
Abbreviations: ACS, US Census Bureau, American Community Survey; BSKHS, Best Starts for Kids Health Survey (conducted in even years only); ERDC, Washington State Education Research Data Center; HYS, Healthy Youth Survey (conducted in even years only); JIMS, Juvenile Information Management System; NA, not available; OSPI, Office of the Superintendent of Public Instruction; VS, vital statistics data via Washington State Department of Health.
a 2014 data show percent of graduates of the class of 2006 who have earned credentials by 2014; 2017 data show rate of credentials earned by class of 2009. Data are available at only the statewide and school district level. Values show the range for school districts within King County.
b HYS 2016 data included in 2017 column; survey only conducted in even years. Because of COVID-19, the HYS was not administered in 2020. The next administration is planned for October 2021.
c HYS data for students in middle and high school. BSKHS data for children in elementary school or younger.
d Survey question on “youth believe in their ability to succeed” changed between 2016 and 2018; data are not comparable between years.
e Number denotes counts of filings per year.f Reflects all ages from 6 months through fifth grade.
Rate or percentage of identified population in King CountyIndicator
Improvement direction expected
Data source 2014 2017 2018 2019 2020
Secondary indicators (continued)
Youth have strong school relationships Increase HYS 52% 53%b 49%* NA NA
Young adults participate in civic activity and are engaged Increase King County Elections 53% 43% 75% 49% 86%
Youth are not justice system involved (number of filings)e Decrease JIMS 1,746 1,278 1,213 1,033 NA
Youth have positive social emotional development Increase BSKHS NA 72% NA 76% NA
Youth are not suspended/expelled from school Increase OSPI 3.1% 2.3% 2.5% 2.7% NA
Youth are physically active Increase HYS 22% 21%b 19%* NA NA
Youth live in supportive neighborhoodsf Increase BSKHS NA 49% NA 51% NA
STRATEGIES INVESTMENTSWELCOME PARTNERSINTRODUCTION EVALUATION
Overview | 2020 Modifications | Program changes | Population indicators | Performance measures
BEST STARTS FOR KIDS 2020 ANNUAL REPORT 57

Communities Matter (Communities of Opportunity) indicators
Indicator and expected direction of change
Data source
King County average Rainier Valley SeaTac/Tukwila White Center
2014 2017 2018 2019 2014 2017 2018 2019 2014 2017 2018 2019 2014 2017 2018 2019
Health
Self-reported health good to excellent ↑ BRFSS 87.8% 88.0% 88.0% 87.9% 81.0% 86.3% 85.4% 85.8% 82.2% 86.6% 87.6% 85.8% 81.4% 75.4% 75.2% 79.1%
Eating fruits/vegetables 4+ times/day (youth)a ↑ HYS 24.6% 22.8% 20.6%e NA 19.8% 21.7% 18.0% NA 24.1% 25.1% 19.5% NA 16.0% 29.5% 15.2% NA
Housing cost
Households paying less than 30% of income ↑ ACS 61.8% 65.4%e 64.7%e 65.2%e 53.0% 58.8% 60.8%e 62.4%e 51.6% 54.1% 55.4% 56.8% 50.1% 58.8% 58.2% 59.1%
Households paying less than 50% of income ↑ ACS 83.7% 85.4%e 83.8% 84.1% 77.1% 80.0% 78.9% 79.6% 79.8% 82.9% 81.4% 81.1% 75.3% 78.8% 78.7% 80.7%
Economic opportunity
Households with income <200% of FPL ↓ ACS 24.4% 22.0%e 20.7%e 19.5%e 40.1% 34.3% 30.3%e 27.8%e 46.7% 41.5% 35.7%e 33.9%e 45.5% 41.1% 36.7% 34.8%
Percent employed/in civilian labor force ↑ ACS 92.8% 95.0%e 95.5%e 95.8%e 89.8% 92.4%e 93.5%e 94.3%e 89.5% 93.2%e 93.9%e 93.3%e 90.4% 92.2% 93.7% 93.9%
Youth ages 16–24 years in school/employed ↑ PUMS 88.5% 91.2%e 91.9%e 92.6%e 88.1% 93.5% 95.9%e 96.2%e 80.6% 85.4% 88.2%e 87.0% 80.6% 85.4% 88.2%e 87.0%
Community connection
Adolescents with an adult they can talk witha ↑ HYS 74.9% 75.4% 74.4% NA 65.6% 65.0% 63.5% NA 63.0% 68.0% 65.9% NA 49.4% 70.8% 65.5%e NA
Long-term population indicators and supporting indicators assess the well-being of all children throughout King County. Additional information and findings from the Communities of Opportunity evaluation to date are available online.
Original place-based sitesCommunities of Opportunity launched the first place-based partnerships in 2015. For these partnerships and for King County overall, the table includes indicator data for 2014 as the baseline year.
STRATEGIES INVESTMENTSWELCOME PARTNERSINTRODUCTION EVALUATION
Overview | 2020 Modifications | Program changes | Population indicators | Performance measures
BEST STARTS FOR KIDS 2020 ANNUAL REPORT 58

Indicator and expected direction of change
Data source
King County average Rainier Valley SeaTac/Tukwila White Center
2014 2017 2018 2019 2014 2017 2018 2019 2014 2017 2018 2019 2014 2017 2018 2019
Communities of Opportunity compositeb
Composite of eight indicators ↓ Multiple 105.0 98.3 96.3 94.7 129.1 108.8 104.1 104.7 153.0 134.1 129.3 138.4 161.2 147.8 135.9 117.6
Residential migration (displacement)c
Percent of residents moved out during the yeard ↓ APCD 9.0% 7.7% 8.0% 7.5% 9.5% 7.8% 8.1% 7.6% 9.6% 7.8% 8.3% 7.7% 10.7% 8.3% 8.9% 8.4%
Notes: ACS, APCD, and Communities of Opportunity composite data reported in past Best Starts for Kids annual reports may differ slightly from the data presented in the 2020 Best Starts for Kids annual report. This reflects updates to the data and refinements to how geographic boundaries are defined.
Abbreviations: ACS, US Census Bureau, American Community Survey; APCD, All Payer Claims Database, Washington State Health Care Authority; BRFSS, Washington State Department of Health, Center for Health Statistics, Behavioral Risk Factor Surveillance System (supported in part by the Centers for Disease Control and Prevention, Cooperative Agreements); HYS, Washington State Healthy Youth Survey; PUMS, US Census Bureau, American Community Survey Public Use Microdata Sample files.
a HYS 2016 data included in 2017 column; survey only conducted in even years. Because of COVID-19, the Healthy Youth Survey was not administered in 2020. The next administration is planned for October 2021.
b This indicator is the sum of eight indicators included in the composite used to select Communities of Opportunity’s original geographies. The composite includes life expectancy at birth, rates of obesity, smoking, diabetes, frequent mental distress, unemployment, two or more poor housing conditions and household income <200% FPL. Statistical significance in the changes of the composite score is not assessed.
c Residential migration is standardized for the amount of time a person spent in an area that year. A move is defined as changing zip codes in a given year within Washington state. King County average is the weighted mean of neighborhood outmigration. Formula: Number of moves out of a neighborhood in a year/total amount of person time observed in that neighborhood. Statistical significance in the changes of the residential migration score is not assessed.
d We have included estimated data for 2015 in the 2014 column, reflecting limitations in APCD data in 2014.e Significant difference from baseline year.
STRATEGIES INVESTMENTSWELCOME PARTNERSINTRODUCTION EVALUATION
Overview | 2020 Modifications | Program changes | Population indicators | Performance measures
BEST STARTS FOR KIDS 2020 ANNUAL REPORT 59

Indicator and expected direction of change
Data source
King County average Central Seattle KentSnoqualmie/North Bend/Skykomish
2017 2018 2019 2017 2018 2019 2017 2018 2019 2017 2018 2019
HealthSelf-reported health good to excellent ↑ BRFSS 88.0% 88.0% 87.9% 85.0% 87.1% 89.1% 82.9% 82.6% 81.0% 88.1% 88.7% 86.8%
Eating fruits/vegetables 4+ times/day in youtha ↑ HYS 22.8% 20.6% NA 23.1% 17.8% NA 21.5% 18.5% NA 20.7% 23.1% NA
Housing costHouseholds paying less than 30% of income ↑ ACS 65.4% 64.7% 65.2% 63.5% 61.4% 63.5% 59.6% 59.9% 60.1% 72.5% 72.4% 71.7%
Households paying less than 50% of income ↑ ACS 85.4% 83.8% 84.1% 83.7% 81.0% 82.5% 82.9% 82.0% 82.6% 89.6% 88.2% 89.3%
Economic opportunityHouseholds with income <200% of FPL ↓ ACS 22.0% 20.7% 19.5% 27.2% 26.9% 22.7% 33.2% 32.7% 31.5% 9.8% 9.2% 7.9%
Percent employed/in civilian labor force ↑ ACS 95.0% 95.5% 95.8% 95.7% 95.4% 95.3% 93.5% 94.1% 94.5% 96.1% 96.2% 96.6%
Youth ages 16–24 years in school/employed ↑ PUMS 91.2% 91.9% 92.6% 93.5% 95.9% 96.2% 87.8% 88.7% 90.5% 90.0% 91.6% 94.6%
Community connectionAdolescents with an adult they can talk witha ↑ HYS 75.4% 74.4% NA 75.0% 75.3% NA 70.8% 68.2% NA 77.9% 80.3% NA
Communities of Opportunity compositeb
Composite of eight indicators ↓ Multiple 98.3 96.3 94.7 94.6 94.5 88.4 133.1 131.3 132.8 79.3 77.1 74.9
Residential migration (displacement)c
Percent of residents moved out during the year ↓ APCD 7.7% 8.0% 7.5% 10.7% 11.1% 10.5% 7.6% 8.2% 7.3% 6.1% 5.9% 5.3%
Additional place-based communitiesCommunities of Opportunity established additional place-based partnerships in early 2018. For these partnerships, the table includes data from 2017 as a baseline.
Notes: ACS, APCD, and Communities of Opportunity composite data reported in past Best Starts for Kids annual reports may differ slightly from the data presented in the 2020 Best Starts for Kids annual report. This reflects updates to the data and refinements to how geographic boundaries are defined.
Abbreviations: ACS, US Census Bureau, American Community Survey; APCD, All Payer Claims Database, Washington State Health Care Authority; BRFSS, Washington State Department of Health, Center for Health Statistics, Behavioral Risk Factor Surveillance System (supported in part by the Centers for Disease Control and Prevention, Cooperative Agreements); HYS, Washington State Healthy Youth Survey; PUMS, US Census Bureau, American Community Survey Public Use Microdata Sample files.
a HYS is administered on even years. We have included 2016 data in the 2017 column.
b This indicator is the sum of eight indicators included in the composite used to select Communities of Opportunity’s original geographies. The composite includes life expectancy at birth, rates of obesity, smoking, diabetes, frequent mental distress, unemployment, two or more poor housing conditions and household income <200% FPL. Statistical significance in the changes of the composite score is not assessed.
c Residential migration is standardized for the amount of time a person spent in an area that year. A move is defined as changing zip codes in a given year within Washington state. King County average is the weighted mean of neighborhood outmigration. Formula: Number of moves out of a neighborhood in a year/total amount of person time observed in that neighborhood. Statistical significance in the changes of the residential migration score is not assessed.
STRATEGIES INVESTMENTSWELCOME PARTNERSINTRODUCTION EVALUATION
Overview | 2020 Modifications | Program changes | Population indicators | Performance measures
BEST STARTS FOR KIDS 2020 ANNUAL REPORT 60

Indicator and expected direction of change
Data source
King County averageLatino in South
King CountyAmerican Indian/
Alaska Native
2017 2018 2019 2017 2018 2019 2017 2018 2019
Health
Self-reported health good to excellent ↑ BRFSS 88.0% 88.0% 87.9% 73.3% 72.5% 74.1% 76.2% 75.9% 76.4%
Eating fruits/vegetables 4+ times/day in youtha ↑ HYS 22.8% 20.6% NA 19.7% 17.9% NA 26.7% 27.0% NA
Housing cost
Households paying less than 30% of income ↑ ACS 65.4% 64.7% 65.2% 52.6% 54.8% 56.8% 61.3% 62.6% 63.0%
Households paying less than 50% of income ↑ ACS 85.4% 83.8% 84.1% 81.4% 81.7% 82.9% 79.2% 79.2% 79.7%
Economic opportunity
Households with income <200% of FPL ↓ ACS 22.0% 20.7% 19.5% 50.9% 54.7% 59.7% 59.3% 61.2% 61.9%d
Percent employed/in civilian labor force ↑ ACS 95.0% 95.5% 95.8% 94.8% 95.7% 96.0% 92.1% 92.2% 91.6%
Youth ages 16–24 years in school/employed ↑ PUMS 91.2% 91.9% 92.6% 86.6% 87.7% 88.1% 79.5% 79.4% 79.4%
Community connection
Adolescents with an adult they can talk witha ↑ HYS 75.4% 74.4% NA 62.4% 58.9% NA 69.4% 71.4% NA
COO compositeb
Composite of eight indicators ↓ Multiple 98.3 96.3 94.7 153.0 157.3 165.3 199.4 203.4 193.1
Residential migration (displacement)c
Percent of residents moved out during the year ↓ APCD 7.7% 8.0% 7.5% NA NA NA NA NA NA
Cultural communitiesCommunities of Opportunity launched cultural community partnerships in early 2018. For these partnerships, the table includes data from 2017 as a baseline.
Notes: ACS, APCD, and Communities of Opportunity composite data reported in past Best Starts for Kids annual reports may differ slightly from the data presented in the 2020 Best Starts for Kids annual report. This reflects updates to the data and refinements to how geographic boundaries are defined.
Abbreviations: ACS, US Census Bureau, American Community Survey; APCD, All Payer Claims Database, Washington State Health Care Authority; BRFSS, Washington State Department of Health, Center for Health Statistics, Behavioral Risk Factor Surveillance System (supported in part by the Centers for Disease Control and Prevention, Cooperative Agreements); HYS, Washington State Healthy Youth Survey; PUMS, US Census Bureau, American Community Survey Public Use Microdata Sample files.
a HYS is administered on even years. We have included 2016 data in the 2017 column.
b This indicator is the sum of eight indicators included in the composite used to select Communities of Opportunity’s original geographies. The composite includes life expectancy at birth, rates of obesity, smoking, diabetes, frequent mental distress, unemployment, two or more poor housing conditions and household income <200% FPL. Statistical significance in the changes of the composite score is not assessed.
c Residential migration is standardized for the amount of time a person spent in an area that year. A move is defined as changing zip codes in a given year within Washington state. King County average is the weighted mean of neighborhood outmigration. Formula: Number of moves out of a neighborhood in a year/total amount of person time observed in that neighborhood. Statistical significance in the changes of the residential migration score is not assessed.
d Significant difference from baseline year.
STRATEGIES INVESTMENTSWELCOME PARTNERSINTRODUCTION EVALUATION
Overview | 2020 Modifications | Program changes | Population indicators | Performance measures
BEST STARTS FOR KIDS 2020 ANNUAL REPORT 61

Help Me GrowKing County released the Help Me Grow King County RFP in early 2020. In response to the COVID-19 pandemic, Best Starts for Kids expanded the procurement and outreach process. Despite the pandemic, Best Starts identified and funded a dozen new coordinated access partners, and Help Me Grow King County partners began implementing or expanding services in August.
Help Me Grow King County: Core Team ★ Delivering impact
How much did we do? Number of Collaborators the Help Me Grow King County Core Team partnered back and forth with representing coalitions and organizations in different sectors
145
Number of large community events/gatherings the Help Me Grow King County Core Team hosted or attended 31
Number of participants engaged through meetings/gatherings the Help Me Grow King County Core Team hosted 197
How well did we do it? Percent of identified sectors engaged by Help Me Grow King County Core Team (Child Care and Family Support sectors were added in 2020)
85%
Is anyone better off? Percent of identified coordinated access partners contracted with finalized work plans 100%
Help Me Grow King County: Partnership Networka ★ Delivering impact
How much did we do? Total number caregivers/adults served by Help Me Grow King County Partnership Network 245
Total number of children served by Help Me Grow King County Partnership Network 512
Total number of children who received a developmental screening by Help Me Grow King County Partnership Network 361
Total number of concerns identified by Help Me Grow King County Partnership Network 434
Total number of events/groups by Help Me Grow King County Partnership Network 7
Total number of families served by Help Me Grow King County Partnership Network 178
Total number of interactions by Help Me Grow King County Partnership Network 944
Total number of service referrals completed by Help Me Grow King County Partnership Network 490
Developmental Promotion and Early Support
Universal Developmental Screening: Ages and Stages Questionnaire (ASQ)/Ages and Stages Questionnaire: ★ Delivering impact Social Emotional (ASQ:SE) Provider Trainingb
How much did we do? Number of providers trained to administer the ASQ and/or ASQ:SE 347
Percent of providers with increased confidence in their ability to discuss a developmental concern with a family 87%
How well did we do it? Percent of providers with increased confidence in their ability to explain why screening is important 94%
Investing Early (prenatal to 5 years) outcomes
STRATEGIES INVESTMENTSWELCOME PARTNERSINTRODUCTION EVALUATION
Overview | 2020 Modifications | Population indicators | Program changes | Performance measures
BEST STARTS FOR KIDS 2020 ANNUAL REPORT 62

Universal Developmental Screening: Developmental Screening: Language Access Pilotsc ★ Delivering impact
How much did we do? Number of meeting participants 76
Number of meetings held to support tool translation/adaptation 7
How well did we do it? Percent of meetings that were culturally and linguistically reflective of communities served 100%
Is anyone better off? Percent of participants who indicated the final translation/adaptation was culturally relevant 100%
Percent of participants who rated final translation/adaptation as a high-quality product 100%
Universal Developmental Screening: Developmental Screening: Screening Pilotsc ★ Delivering impact
How much did we do? Number of children screened 609
How well did we do it? Percent of families offered screening who accepted it 80%
Percent of screenings where person screening was a cultural/language match to child being screened 58%
Is anyone better off? Percent of families who reported screening process was a positive experience 80%
Percent of families who were identified as needing a referral through screening and received that referral 91%
Universal Developmental Screening: Developmental Screening: Training Pilotsc ★ Delivering impact
How much did we do? Number trained around developmental screening 319
How well did we do it? Percent reporting increased knowledge around developmental screening 97%
Is anyone better off? Percent reporting increased confidence in using a developmental screening tool 95%
Early Support for Infants and Toddlers (ESIT)d ★ Delivering impact In March 2020, ESIT rapidly shifted from in-person to 100% virtual services, while referrals for early intervention services declined as a result of COVID-19. King County ESIT funded tablets, hotspots and video interpretation to ensure access to services.
How much did we do? Number of children provided services 5,262
How well did we do it? Percent of children with evaluation and service plan in place within 45 days from initial contact 96%e
Percent of children with service start within 30 days 99%
Percent of children with transition meeting at least 90 days prior to child turning 3 to determine eligibility for school services 91%e
Is anyone better off? Percent of children with progress acquiring knowledge/skills 71%
Percent of children with progress in positive social emotional development 74%
Percent of children with progress in taking action to meet needs 76%
Social-Emotional Well-being: Infant Mental Health Endorsement ★ Delivering impact
How much did we do? Number of providers who initiated the endorsement process 137
How well did we do it? Percent of awardees who reported the endorsement process was responsive to their needs and experiences 94%
STRATEGIES INVESTMENTSWELCOME PARTNERSINTRODUCTION EVALUATION
Overview | 2020 Modifications | Population indicators | Program changes | Performance measures
BEST STARTS FOR KIDS 2020 ANNUAL REPORT 63

Social-Emotional Well-being: Infant Mental Health Endorsement (continued) ★ Delivering impact
Is anyone better off? Percent of awardees who reported an increase in confidence in their roles as an IECMH provider 88%
Percent of awardees who reported the endorsement process increased their effectiveness in their role with families 57%
Percent of awardees who reported the endorsement process increased their preparedness to work with families 80%
Social-Emotional Well-being: Infant Mental Health Reflective Consultation ★ Delivering impact
How much did we do? Number of reflective consultants 19
Number of reflective consultation participants 359
How well did we do it? Percent of participants reporting increased confidence to talk about social and emotional development with families 75%
Percent of participants who reported that reflective consultation was respectful of their community's needs and experiences 94%
Is anyone better off? Percent of participants who reported a positive impact on their relationship with children and families 86%Percent of participants who reported an increase in awareness of their own implicit biases as a result of participating in reflective consultation
76%
Help Me Grow King County: Screening and Referral Servicesf ★ Delivering impact King County released the Help Me Grow King County RFP in early 2020. In response to the COVID-19 pandemic, Best Starts for Kids expanded the procurement and outreach process. Despite the pandemic, Best Starts identified and funded a dozen new coordinated access partners, and Help Me Grow King County partners began implementing or expanding services in August.
How much did we do? Number of children screened for developmental progress 158
Number of families who received a referral that go on to establish connections to evaluation and supportive services 69
Number of referrals made post-screening by type 162
Help Me Grow King County: Workforce Improvementsf ★ Delivering impact King County released the Help Me Grow King County RFP in early 2020. In response to the COVID-19 pandemic, Best Starts for Kids expanded the procurement and outreach process. Despite the pandemic, Best Starts identified and funded a dozen new coordinated access partners, and Help Me Grow King County partners began implementing or expanding services in August.
How much did we do? Number of workshop/event participants 51
Number of workshops/events focused on early childhood development topics 16
Workforce Development
Capacity Building ★ Delivering impact
How much did we do? Number of Best Starts learning community meetings for trainers and reflective consultants 12
Large Group Trainings ★ Delivering impact
How much did we do? Number of large group trainings 25
Number of providers who participated in one or more large group trainings (duplicated) 1,544
Number of providers who participated in one or more large group trainings (unduplicated) 899
Number of trainers 11
STRATEGIES INVESTMENTSWELCOME PARTNERSINTRODUCTION EVALUATION
Overview | 2020 Modifications | Population indicators | Program changes | Performance measures
BEST STARTS FOR KIDS 2020 ANNUAL REPORT 64

How well did we do it? Percent of participants who reported the training considered equity related to participants' diverse needs and experiences 90%
Percent of participants who reported training content was meaningful to their work with children and families 92%
Is anyone better off? Percent of participants who reported an increase in knowledge related to equity as a result of the training 88%
Percent of participants who reported an increase in knowledge related to the promotion of infant and early childhood mental health as a result of the training
92%
Percent of participants who reported confidence in their ability to apply something new they learned from the training to their work
87%
Workforce Collaboratives ★ Delivering impact
How much did we do? Number of providers who were members of a workforce collaborative 190
How well did we do it? Percent of members who reported the training content met a need of their workforce collaborative 81%
Is anyone better off? Percent of members who reported increased confidence that they have the skills to help families support their child's development as a result of the workforce collaborative
93%
Percent of members who reported increased peer support as a result of the workforce collaborative 77%
Percent of members who reported they have been able to apply learnings from the workforce collaborative to their work 84%
Home-Based Services
Evidence-Based and Evidence-Informed Home Visiting ★ Delivering impact | Moderately affected by COVID-19 Programs pivoted to provide virtual home visits and meet other basic needs like food and rental assistance.
How much did we do? Number of caregivers served 1,085i
Number of children screened using the ASQ 348i
Number of children served 907i
Number of families served 826i
How well did we do it? Percent of caregivers who receive an observation of caregiver–child interaction using a validated tool 33%i
Percent of children enrolled in home visiting with a timely screen for developmental delays using ASQ 47%i
Percent of enrolled clients that received the model recommended number of home visits during the reporting period 67%i
Percent of families enrolled from focus populations 99%i
Is anyone better off? Percent of caregivers who show greater positive interaction with children than at baseline 77%i
Percent of families referred and/or connected to services based on model requirements 42%i
Percent of mothers who initiated breastfeeding 57% i
STRATEGIES INVESTMENTSWELCOME PARTNERSINTRODUCTION EVALUATION
Overview | 2020 Modifications | Population indicators | Program changes | Performance measures
BEST STARTS FOR KIDS 2020 ANNUAL REPORT 65

ParentChild+ ★ Delivering impact Programs pivoted to provide virtual home visits, adapt to staff transitions, and meet other basic needs, such as food and rental assistance.
How much did we do? Number of children served by ParentChild+ 1,291
Number of families served by ParentChild+ 1,291
Number of referrals to support services 866
Number of visits completed by ParentChild+ 44,413
How well did we do it? Percent of ParentChild+ children transitioning to other early learning settings 94%
Percent of ParentChild+ families completing year 1 77%
Percent of ParentChild+ families completing year 2 74%
Percent of ParentChild+ families enrolled from focus populations 100%
Percent of ParentChild+ families matched with culturally relevant staff 91%
Percent of ParentChild+ families receiving required dosage of visits 94%
Percent of ParentChild+ partner organizations maintaining appropriate supervisor-to-staff ratios 90%
Percent of ParentChild+ staff receiving twice-annual coordinator observations and debriefs 79%
Is anyone better off? Percent of children who met target Child Behavior Traits score of 3 or higher at beginning of the program 43%
Percent of children who met target CBT score of 3 or higher at the end of the program 69%
Percent of parents who met target Parent and Child Together assessment score of 3 or higher at beginning of the program 54%
Percent of parents who met target PACT score of 3 or higher at the end of the program 80%
Community-Designed Home-Based Programs and Practices ★ Delivering impact Programs pivoted to provide virtual home visits and meet other basic needs like food and rental assistance.
How much did we do? Number of caregivers served 930g
Number of children served 878
Number of families served 790g
Number of home visits completed 9,082h
How well did we do it? Percent of caregivers who achieve their goals 97%
Percent of caregivers who are utilizing information from the program 77%
Percent of caregivers who were satisfied with services or would recommend services to a friend 72%
Percent of children enrolled in home visiting with a screen for developmental delays using a validated parent-completed tool (ASQ) 81%
STRATEGIES INVESTMENTSWELCOME PARTNERSINTRODUCTION EVALUATION
Overview | 2020 Modifications | Population indicators | Program changes | Performance measures
BEST STARTS FOR KIDS 2020 ANNUAL REPORT 66

Is anyone better off? Percent of families with increased concrete support 99%g,i
Percent of families with increased knowledge of parenting and child development 96%g,i
Percent of families with increased parental resilience 93%g,i
Percent of families with increased social and emotional competence of children 93%g,i
Percent of families with increased social connections 98%g,i
Percent of mothers with positive birth outcomes 98%i
Community-Based Parenting and Peer Supports
Basic Needs Resource Brokering: Basic Needs Resources: Food ★ Delivering impact COVID-19 has significantly affected food access, and more families have been requesting additional resources to meet that basic need. One partner has expanded services to meet the needs of families by creating new partnerships.
How much did we do? Number of families receiving Good Food Bags 2,690
Number of Good Food Bags distributed 6,833
Number of sites participating in Good Food Bag program 3
How well did we do it? Percent of survey respondents who rate overall experience with Good Food Bags as excellent 64%
Percent of survey respondents who report being food insecure in the past 12 months 7%
Percent of survey respondents who report usually using all fruits and vegetables in Good Food Bag 57%
Percent of survey respondents who think program is a good way to increase healthy food access 89%
Is anyone better off? Percent of survey respondents who report eating more fruits and vegetables 96%
Percent of survey respondents who report positive effects of Good Food Bags for their children 100%
Basic Needs Resource Brokering: Basic Needs Resources: Goods ★ Delivering impact COVID-19 has affected Basic Needs Resource Brokers. Demand has significantly increased, even while available resources (e.g., volunteer time) have decreased. However, they have been able to continue and even expand their services to meet this demand.
How much did we do? Number of children and youth for whom partners request and receive resources 38,737
Number of different types of program sites requesting and receiving resources 295
Number of households for whom partners request and receive resources 9,104
Number of partner agencies, programs and program sites requesting and receiving resources 144
How well did we do it? Number of individual items/products distributed in King County 3,357,861
Percent of items/products distributed to South Region zip codes/focus communities 38%
Percent of partner agencies sustaining partnership with resource broker over one year 80%
Percent of requested items distributed 98%
STRATEGIES INVESTMENTSWELCOME PARTNERSINTRODUCTION EVALUATION
Overview | 2020 Modifications | Population indicators | Program changes | Performance measures
BEST STARTS FOR KIDS 2020 ANNUAL REPORT 67

Is anyone better off? Percent of provider partners who agreed or strongly agreed that the provided goods have helped to reduce the number of missed client visits
71%j,k
Percent of provider partners who agreed or strongly agreed that the provided goods have kept clients in their program longer 81%j,k
Percent of provider partners who agreed or strongly agreed that the provided goods increased communication by clients between scheduled visits
93%j,k
Percent of provider partners who agreed or strongly agreed that the provided goods positively influenced their organization and program budgets
89%j,k
Kaleidoscope Play and Learn ★ Delivering impact | Moderately affected by COVID-19Because of COVID-19, providers offered Kaleidoscope Play and Learn sessions virtually. The program was not able to conduct its end-of-year survey because of COVID-19, which affected data collection for a few measures.
How much did we do? Number of children attending Kaleidoscope Play and Learn groups 3,617
Number of children, parents and caregivers attending Kaleidoscope Play and Learn Groups 6,846
Number of Family, Friend and Neighbor caregivers attending Kaleidoscope Play and Learn groups 507
Number of parents attending Kaleidoscope Play and Learn groups 2,722
How well did we do it? Percent increase in access (number of groups available) in Kaleidoscope Play and Learn groups 55%i
Percent increase in participation (number of people attending) in Kaleidoscope Play and Learn groups 63%i
Is anyone better off? Percent of parents and caregivers who read, look at books or tell stories more often with the child in their care Unable to measure due to COVID-19
Percent of parents and caregivers who feel more supported as a parent or caregiver in their community Unable to measure due to COVID-19
Percent of parents and caregivers who increased understanding of their role in helping the child in their care be ready for kindergarten
Unable to measure due to COVID-19
Parenting Caregiver Information and Support (PCIS) ★ Delivering impact | Moderately affected by COVID-19Awardees had to shift to virtual programming during COVID-19. Staff turnover affected four out of nine PCIS programs. As a result, they had to pause programming and prepare to relaunch their PCIS classes.
How much did we do? Number of caregivers served 968
Number of families served 960
Number of group meetings/services held 876
How well did we do it? Percent of caregivers enrolled from focus populations 92%
Percent of caregivers who are satisfied with services or activities, or would recommend services or activities to friends 66%
Percent of caregivers who completed program according to program design 80%
Percent of children enrolled from focus populations 100%
STRATEGIES INVESTMENTSWELCOME PARTNERSINTRODUCTION EVALUATION
Overview | 2020 Modifications | Population indicators | Program changes | Performance measures
BEST STARTS FOR KIDS 2020 ANNUAL REPORT 68

Is anyone better off? Percent of families with increased concrete support 90%g,i
Percent of families with increased knowledge of parenting and child development 99%g,i
Percent of families with increased parental resilience 98%g,i
Percent of families with increased social and emotional competence of children 87%g,i
Percent of families with increased social connections 97%g,i
Prenatal Support and Breastfeeding Peer Counseling Services ★ Delivering impact These services shifted to a virtual platform, which has allowed providers to expand services and reach a broader audience.
How much did we do? Number of completed Breastfeeding Peer Counseling trainings 2l
Number of educational engagements provided 69g,i
Number of organizations that received infrastructure development and capacity building support 4l
Number of people trained in Breastfeeding Peer Counseling 67l
Number of people trained in the March of Dimes Supportive Pregnancy Care Model 31l
Number of Perinatal Collaborative members that participated in community outreach events 7l
Number of professional development opportunities 25g,i
Number of referrals between partners 101g,i
Number of unique clients served through lactation support services 9g,i
Number of unique clients served with supportive pregnancy 32g,i
How well did we do it? Percent of clients who found lounge participation helpful to support breastfeeding 100%i,k
Percent of participants who attended the model recommended number of supportive pregnancy care sessions 47%i
Percent of partners who report increase in their capacity to provide perinatal services as a result of technical assistance and capacity building support
57%i
Is anyone better off? Percent of babies carried to full term 100%i
Percent of clients breastfeeding beyond initiation 100%i
Percent of lactation support peer counseling–enrolled clients who receive multiple (at least two) services over the perinatal period
78%i
STRATEGIES INVESTMENTSWELCOME PARTNERSINTRODUCTION EVALUATION
Overview | 2020 Modifications | Population indicators | Program changes | Performance measures
BEST STARTS FOR KIDS 2020 ANNUAL REPORT 69

Public Health Programs
Perinatal Hepatitis B Prevention Program ★ Delivering impact The Perinatal Hepatitis B Prevention Program continued to identity and serve infants at risk of contracting hepatitis B, despite disruptions in workforce as staff were deployed to support the COVID-19 response.
How much did we do? Number of infants completing post-vaccination serology testing 130
Number of outreach sessions held with partners 3
Number of pregnant persons enrolled 153
Number of pregnant persons enrolled before delivery 136
Number of pregnant persons identified through enhanced lab reporting 104
How well did we do it? Percent of infants completing post-vaccination serology testing 74%
Percent of pregnant persons enrolled before delivery 89%
Percent of pregnant persons identified through enhanced lab reporting 68%
Is anyone better off? Number of infants completing postexposure prophylaxis 148
Percent of infants completing postexposure prophylaxis 90%
Percent of infants who tested negative for hepatitis B 100%
Maternity Support Services and Infant Case Management (MSS/ICM) ★ Delivering impact With the onset of COVID-19, MSS/ICM adapted previous in-person services to remote delivery options, primarily by phone.
How much did we do? Number of clients served by MSS/ICM 11,671
Visits delivered by MSS/ICM 28,405
How well did we do it? Number of linkages to ancillary support services 1,167
Percent of total MSS/ICM provided by King County Public Health Not available
Is anyone better off? Birth outcome: low birth weight (<2,500 grams) 6%
Nurse-Family Partnership (NFP) ★ Delivering impact The COVID-19 pandemic has affected low-income populations and people of color, including NFP clients. NFP is well designed to help our clients who have been hit hard by the mental, economic, and physical impacts of COVID-19.
How much did we do? Number of children served by NFP 657
Number of pregnant people and mothers served by NFP 908
STRATEGIES INVESTMENTSWELCOME PARTNERSINTRODUCTION EVALUATION
Overview | 2020 Modifications | Population indicators | Program changes | Performance measures
BEST STARTS FOR KIDS 2020 ANNUAL REPORT 70

How well did we do it? Average number of service linkages Not available
Avg visit length (minutes) 59
Number of attempted visits to the mother 477
Number of completed visits to the mother 9,998
Number of telephone calls to the mother 1,221
Number of visits to the mother cancelled by the client Not available
Number of visits to the mother cancelled by the nurse Not available
Referrals to other assistance (service linkages) 512
Total visit contact time (hours) Not available
Is anyone better off? Birth outcomes: low birth weight (<2,500 grams) 13%
Birth outcomes: preterm birth 12%
Child health and development outcomes: child hospitalized 1+ times for injury or ingestion (among children 0–6 months) 0
Child health and development outcomes: child visited emergency room 1+ times for injury or ingestion (among children 0–6 months)
0
Child health and development outcomes: child visited urgent care 1+ times for injury or ingestion (among children 0–6 months)
0
Child health and development outcomes: current with immunizations 32%
Child health and development outcomes: developmental screening 100%
Child health and development outcomes: initiated breastfeeding 100%
Child health and development outcomes: number of children who may need further evaluation 7%
Women, Infants and Children (WIC) supplemental nutrition program ★ Delivering impact With the onset of COVID-19, WIC sites adapted previous in-person services to remote delivery options to ensure clients could still receive benefits electronically.
How much did we do? Number of clients receiving WIC 52,110
How well did we do it? Number of nutrition education services 27,674
Number of referrals to preventive services Not available
Is anyone better off? Breastfeeding duration >6 months Not available
Children BMI 95%+ (among children ages 2–4 years old)Unable to measure
due to COVID-19
Total food dollars for fresh fruits and vegetables $1,568,928
Total food dollars for WIC farmers market nutrition program $195,614
Total food dollars redeemed $17,368,250
STRATEGIES INVESTMENTSWELCOME PARTNERSINTRODUCTION EVALUATION
Overview | 2020 Modifications | Population indicators | Program changes | Performance measures
BEST STARTS FOR KIDS 2020 ANNUAL REPORT 71

Family Planning: Family Planning Education ★ Delivering impact With the onset of COVID-19, the Family Planning Health Education and Outreach team adopted new platforms for education and outreach and delivering virtual community outreach.
How much did we do? Number of clients reached through direct education an outreach to youth 28,863
Number of direct education sessions and outreach activities 295
Number of technical assistance and professional development services sessions 66
Number of youth-serving professionals provided technical assistance and professional development services 947
How well did we do it? Percent of training participants that report health education trainers “created an effective learning environment” 100%
Is anyone better off? Training participants increase skills 100%
Family Planning: Family Planning Services ★ Delivering impact With the onset of COVID-19, Family Planning Clinics implemented new service delivery options and maintained community access during the pandemic, including offering phone visits, medication pick-up, lab specimen drop-off and telehealth video visits, while maintaining in-clinic appointments for services that required limited in-person contact.
How much did we do? Number of clients served by Family Planning Services 4,179
How well did we do it? Percent of clients on a more effective contraceptive method 100%
Percent of contraceptive users 100%
Is anyone better off? Number of abortions prevented 240
Number of chlamydia infections prevented 50
Number of unintended pregnancies prevented 720
Number of unplanned births prevented 340
Total dollars of net savings $3,832,660
Kids Plus ★ Delivering impact With the onset of COVID-19, Kids Plus continued all their outreach and case management services for families experiencing homeless and transitioned to a remote model.
How much did we do? Number of adults served by Kids Plus 110
Number of children served by Kids Plus 180
Number of clients (adults and children) served by Kids Plus 290
Number of households served by Kids Plus 86
How well did we do it? Percent of children receiving a developmental screening or linked to early intervention 35%
Is anyone better off? Number of children and adults in permanent housing/positive destination 56%
STRATEGIES INVESTMENTSWELCOME PARTNERSINTRODUCTION EVALUATION
Overview | 2020 Modifications | Population indicators | Program changes | Performance measures
BEST STARTS FOR KIDS 2020 ANNUAL REPORT 72

Vroom
Community Connectors ★ Delivering impact Community Connector activities moved to virtual and social media platforms, which presented both challenges and conveniences. The Vroom survey was not feasible in 2020 because of the impact of COVID-19 on both staffing and organizational capacity.
How much did we do? Number of outreach events led by Latinx and Somali Vroom Community Connectors 53
Number of parents and caregivers introduced to Vroom as a result of community engagement 8,400
How well did we do it? Percent of outreach participants reached who became Vroom Messengers 28%
Percent of organizations engaged through outreach who became Vroom Partners 38%
Percent of Vroom Messengers or parents sharing Vroom with families of different racial/ethnic groups Unable to measure due to COVID-19
Percent of Vroom Messengers or parents using different strategies to share Vroom Unable to measure due to COVID-19
Percent of Vroom Messengers or parents who have a positive perception of Vroom Unable to measure due to COVID-19
Child Care Health Consultation (CCHC)CCHC teams pivoted from on-site to virtual work to support child care providers experiencing challenges during the COVID-19 pandemic. Providers were faced with adhering to varied health and safety guidelines, changes in enrollment, lack of resources and emotional stress and grief, and few had capacity to participate in evaluation activities. Thus, Best Starts streamlined data collection and did not collect a few performance measures.
Service Delivery ★ Delivering impact
How much did we do? Number of child care sites served by CCHC teams 695
Number of providers served by CCHC teams 989
Number of services provided by CCHC teams 3,877
How well did we do it? Percent of child care providers and administrative staff served by CCHC teams that are satisfied with the services they received
93%
Is anyone better off? Percent of child care providers that report an increase in their ability to implement strategies that enhance the health and safety of the child care environment
Unable to measure due to COVID-19
Percent of child care providers that report increased knowledge of community resources 82%
Percent of child care providers that report increased knowledge of consultation and training topicsUnable to measure
due to COVID-19
STRATEGIES INVESTMENTSWELCOME PARTNERSINTRODUCTION EVALUATION
Overview | 2020 Modifications | Population indicators | Program changes | Performance measures
BEST STARTS FOR KIDS 2020 ANNUAL REPORT 73

System Development ★ Delivering impact
How much did we do? Number of CCHC System Development engagement activities 58
Number of participants in CCHC System Development surveys 105g
Number of participants in engagement activities 626
Number of recommendations identified through engagement activities and shared with stakeholders 113
Is anyone better off? Percent of early win and LEAN projects completed 80%g
Percent of participants who rate experience highly 92%
Innovation Fund
Innovation Fund ★ Delivering impact
How much did we do? Number of people who helped to design or deliver one or more innovation strategy 338
Number of people who participated in and/or received services through an innovation strategy 670
a Data cover July through December 2020.b ASQ training for the month of July 2020 was provided in collaboration with the Workforce Development Strategy.c Pilot projects ended in June 2020 as planned. Beginning in August 2020, funding for Screening and Referral and Workforce Improvement services shifted to Help Me Grow King County.d Best Starts for Kids funding was a portion of total King County funding for Early Supports for Infants and Toddlers services to children and families in 2020.e Methodology for this measure changed in 2020, and caution should be used when comparing to previous years.f Strategy began in Q4 2020.g New measure for 2020.h Awardees had to shift to virtual home visits during COVID-19.i Data for Q3–Q4 2020.j Data are only available for one out of two resource brokers as a result of COVID-19.k Moderately affected by COVID-19.l Data for Q1–Q2 2020.
STRATEGIES INVESTMENTSWELCOME PARTNERSINTRODUCTION EVALUATION
Overview | 2020 Modifications | Population indicators | Program changes | Performance measures
BEST STARTS FOR KIDS 2020 ANNUAL REPORT 74

Youth DevelopmentGrantees pivoted to adapt to the COVID-19 pandemic, providing virtual programming, additional mental health supports and financial assistance for basic needs such as food and rent. This shift was made possible with flexible funding and guidance from Best Starts program staff.
Youth Development: General ★ Delivering impact
How much did we do? Number of youth/young adults enrolled 3,228
How well did we do it? Percent of youth/young adults who completed services 93%
Percent of youth/young adults who engaged in programming 81%
Is anyone better off? Percent of youth/young adults who feel hopeful and optimistic in the future, based on at least a one-unit increase on the Youth Development Executives of King County Future Orientation Scale between program enrollment and exit 23%
Percent of youth/young adults with improved knowledge or skills 33%
Youth Development: Relationships ★ Delivering impact
How much did we do? Number of youth/young adults enrolled 356
How well did we do it? Percent of youth/young adults who completed services 79%
Percent of youth/young adults who engaged in programming 69%
Is anyone better off? Percent of youth/young adults with improved knowledge or skills related to healthy relationships 65%
School Partnerships
Trauma-Informed and Restorative Practices (TIRP) in School Environmentsa ★ Delivering impact | Heavily affected by COVID-19Schools were closed to in-person teaching in March 2020. The TIRP collective pivoted to meet new needs while at the same time adjusting strategies to continue ongoing work. As a result of school closures and the resulting shift in programming, some data collection activities were interrupted.
How much did we do? Number of people participating in TIRP programs 3,138
Number of TIRP events or sessions for youth, teachers/school staff and parents 9,170
How well did we do it? Percent of participants who adopted trauma-informed practices/behavior 87%
Percent of participants who assess the program positively Unable to measure due to COVID-19
Percent of participants who feel more connected, valued and/or safe 75%
Percent of participants who increased their competencies, knowledge or skills 96%
Is anyone better off? Percent of participants reporting improved school climate and culture 76%
Percent of students with improved attendance Unable to measure due to COVID-19
Percent of youth with strengthened sense of self, identity and empowerment 85%
Sustaining the Gain (5 to 24 years) outcomes
STRATEGIES INVESTMENTSWELCOME PARTNERSINTRODUCTION EVALUATION
Overview | 2020 Modifications | Population indicators | Program changes | Performance measures
BEST STARTS FOR KIDS 2020 ANNUAL REPORT 75

School-Based Screening, Brief Intervention, and Referral To Services (SBIRT)b ★ Delivering impact | Heavily affected by COVID-19Schools were closed to in-person teaching in March 2020. Beginning in September 2020, the School-Based SBIRT program was implemented remotely. Six of the twelve school districts participating in School-Based SBIRT were able to navigate remote implementation early in the school year. The rest were not able to begin screening until 2021 as a result of the shift to remote implementation and other impacts of COVID-19.
How much did we do? Number of middle school students referred to services or resources 75
Number of youth screened at School-Based SBIRT middle schools 507Number of youth who received at least one brief intervention meeting 231
How well did we do it? Percent of referrals provided with a status of "connected" 44% Percent of Tier 2 middle school students who received at least one brief intervention meeting 68%c
Percent of Tier 3 middle school students who received at least one brief intervention meeting 86%d
Is anyone better off? Percent of students with a new need identified as part of School-Based SBIRT 18%
Out-of-School Time (OST) ★ Delivering impact Schools and many program sites were closed to in-person programming in March 2020, so many OST programs shifted to virtual and on-demand programming. As a result of this transition, quality assessment staff were unable to conduct in-person assessments of staff practices, and outcomes data collection was interrupted at many sites.
How much did we do? Average number of youth served daily 843a,e
Number of hours of virtual programming offered 5,120f
Number of learning kits (e.g., STEM, art, cooking) distributed to youth 4,478f
Number of technology devices distributed to youth to support learning (e.g., laptops, tablets, hotspots) 736f
Number of youth served by program 1,527a
How well did we do it? Percent of OST awardees participating in quality supports 97%g
Is anyone better off? Percent of OST awardees who improved in one or more of their goals around social-emotional learning staff practices Unable to measure due to COVID-19
School-Based Health Centers (SBHCs) ★ Delivering impact | Heavily affected by COVID-19Schools were closed to in-person teaching in March 2020, leading to a reduction in SBHC services. Staff were able to creatively implement telehealth and in-person services to reach students and families. SBHCs have also seen an increase in demand for mental health services and other acute needs, leading to fewer preventative visits. Schools did not collect academic data systematically, so those data are not reported. While academic outcomes were impacted because of COVID-19 school closures, prior evidence shows important improvement in mental, behavioral and physical health and academic outcomes.
How much did we do? Number of SBHC visits for medical and mental health services 4,122Number of students who used SBHC medical and mental health services 979
How well did we do it? Percent of SBHC users who received a standardized risk assessment 22% Percent of SBHC users with depression receiving mental health counseling 26% Percent of SBHC users with drug/alcohol issues receiving a brief intervention and/or referral 13%
Is anyone better off? Percent of SBHC users who are passing all classes Unable to measure due to COVID-19
Percent of SBHC users with less than 10 absences per school year Unable to measure due to COVID-19
STRATEGIES INVESTMENTSWELCOME PARTNERSINTRODUCTION EVALUATION
Overview | 2020 Modifications | Population indicators | Program changes | Performance measures
BEST STARTS FOR KIDS 2020 ANNUAL REPORT 76

Family and Community Connections
Healthy and Safe Environments ★ Delivering impact COVID-related school closures in early March affected performance measurements for two Healthy and Safe Environments awardees.
How much did we do? Number of people trained 2,080
Number of trainings, workshops 126
How well did we do it? Number of connections made or strengthened 440
Number of systems and environments improved 103
Is anyone better off? Number of people affected 76,723h
Number of policies changed 11
Washington Child Health Improvement Partnership (formerly Adolescent Immunizations) ★ Delivering impact The Washington Child Health Improvement Partnership pivoted when primary care services paused, then focused on helping families catch up on childhood immunizations when it was safe to resume.
How much did we do? Number of adolescent patients 17,869
Number of clinics participating in a learning collaborative 9
How well did we do it? Percent of participants who agreed their participation in the project will lead to lasting improvement in patient care 100%
Percent of participating clinics who complete trainings 100%
Is anyone better off? Percent of adolescent patients up to date on their recommended immunizations 42%
Percent of adolescent patients who have completed HPV vaccination 38%
Percent of adolescent patients who have received at least one dose of HPV vaccination 78%
Percent of adolescent patients who have received their meningococcal vaccine 80%
Percent of adolescent patients who have received their Tdap (tetanus, diphtheria, and pertussis) vaccine 89%
Percent of adolescent patients who were eligible for a recommended vaccine when they saw their health care provider and did not receive one (also called "missed opportunities") 23%
Family Engagement: Kinship Care ★ Delivering impact
How much did we do? Number of caregivers enrolled 226
How well did we do it? Percent of caregivers who felt the kinship services improved their situation “a lot” 72%
Percent of caregivers who rated staff’s sensitivity to their culture as “good” or “excellent” 97%
Is anyone better off? Percent of caregivers who felt their familiarity with resources “improved a lot” as a result of their contact with kinship services 66%
STRATEGIES INVESTMENTSWELCOME PARTNERSINTRODUCTION EVALUATION
Overview | 2020 Modifications | Population indicators | Program changes | Performance measures
BEST STARTS FOR KIDS 2020 ANNUAL REPORT 77

Family Engagement: Positive Family Connectionsi,j ★ Delivering impact Awardees pivoted to adapt to the COVID-19 pandemic, providing virtual programming, technology supports and food assistance.
How much did we do? Number of parents/caregivers enrolled 778
Number of youth/young adults enrolled 355
How well did we do it? Percent of parents/caregivers engaged in programming 97%
Percent of parents/caregivers satisfied with programming 68%
Percent of youth/young adults engaged in programming 100%
Percent of youth/young adults satisfied with programming 48%
Is anyone better off? Percent of parents/caregivers increasing connection to peers, family, culture and/or community 88%
Percent of parents/caregivers increasing their knowledge or skills related to strengthening family relationships 92%
Percent of youth/young adults increasing connection to peers, family, culture and/or community 78%
Percent of youth/young adults increasing their knowledge or skills related to strengthening family relationships 84%
Transitions to Adulthood
Behavioral Health Services at Youth Re-engagement Centers ★ Delivering impact As a result of COVID-19, many students experienced additional barriers to accessing education and employment, including financial instability and limited access to technology. Awardees stepped in to mitigate those barriers, providing virtual programming, technology access, additional mental health supports and financial assistance for basic needs.
How much did we do? Number of youth/young adults screened 361
How well did we do it? Percent of youth/young adults making progress toward their service plan 96%
Percent of youth/young adults with an individual service plan within 30 days of enrolling in the program 72%
Is anyone better off? Percent of youth/young adults with reduced substance use and/or clinically improved depression and anxiety 18%
Transitioning to Post-secondary Education or Employment: Career Launch Pad ★ Delivering impact Awardees pivoted to adapt to the COVID-19 pandemic, providing virtual programming, additional mental health supports and financial assistance for basic needs such as food and rent. High levels of unemployment due to COVID-19 disproportionately affected young people and people without advanced training or experience, which includes participants in this program. Some employment services were unable to adapt to a virtual setting because of the fundamental nature of their work, such as hand-on apprenticeship programs and internships.
How much did we do? Number of youth/young adults enrolled 101
How well did we do it? Percent of youth/young adults who completed job readiness training 64%
Is anyone better off? Percent of youth/young adults placed into employment 46%h
Percent of youth/young adults placed into employment who are earning more than Washington state minimum wage 96%
STRATEGIES INVESTMENTSWELCOME PARTNERSINTRODUCTION EVALUATION
Overview | 2020 Modifications | Population indicators | Program changes | Performance measures
BEST STARTS FOR KIDS 2020 ANNUAL REPORT 78

Transitioning to Post-secondary Education or Employment: Clear Path to Employment ★ Delivering impact Awardees pivoted to adapt to the COVID-19 pandemic, providing virtual programming, additional mental health supports and financial assistance for basic needs such as food and rent. High levels of unemployment due to COVID-19 disproportionately affected young people and people without advanced training or experience, which includes participants in this program. Some employment services were unable to adapt to a virtual setting because of the fundamental nature of their work, such as hand-on apprenticeship programs and internships.
How much did we do? Number of youth/young adults enrolled 218
How well did we do it? Number of youth/young adults completing subsidized employment 31
Number of youth/young adults who completed pre-employment activities 126
Is anyone better off? Number of youth/young adults placed into unsubsidized employment at program completion 92
Transitioning to Post-secondary Education or Employment: Work Training Education ★ Delivering impact Awardees pivoted to adapt to the COVID-19 pandemic, providing virtual programming, additional mental health supports and financial assistance for basic needs such as food and rent. High levels of unemployment due to COVID-19 disproportionately affected young people and people without advanced training or experience, which includes participants in this program. Some employment services were unable to adapt to a virtual setting because of the fundamental nature of their work, such as hand-on apprenticeship programs and internships.
How much did we do? Number of youth/young adults enrolled 540
How well did we do it? Percent of youth/young adults assessed within 30 days of enrollment 49%
Is anyone better off? Percent of youth/young adults who enroll into college or advanced training on completing the program 32%
Percent of youth/young adults who stay in school or graduate on completing the program 37%
Transitioning to Post-secondary Education or Employment: Work Training Employment ★ Delivering impact Awardees pivoted to adapt to the COVID-19 pandemic, providing virtual programming, additional mental health supports and financial assistance for basic needs such as food and rent. High levels of unemployment due to COVID-19 disproportionately affected young people and people without advanced training or experience, which includes participants in this program. Some employment services were unable to adapt to a virtual setting because of the fundamental nature of their work, such as hand-on apprenticeship programs and internships.
How much did we do? Number of youth/young adults enrolled 37
How well did we do it? Percent of youth/young adults gaining employment who make $20 or more per hour 40%
Percent of youth/young adults who completed job readiness training 81%
Is anyone better off? Percent of youth/young adults gaining employment or entering postsecondary education on completing the program 8%
Peer Connectors Project ★ Delivering impact Awardees pivoted to adapt to the COVID-19 pandemic, providing virtual programming, additional mental health supports and financial assistance for basic needs such as food and rent. High levels of unemployment due to COVID-19 disproportionately affected young people and people without advanced training or experience, which includes participants in this program. Some employment services were unable to adapt to a virtual setting because of the fundamental nature of their work, such as hand-on apprenticeship programs and internships.
How much did we do? Number of youth/young adults referred to the program 195
How well did we do it? Percent of youth/young adults who re-engaged in school or employment 26%
STRATEGIES INVESTMENTSWELCOME PARTNERSINTRODUCTION EVALUATION
Overview | 2020 Modifications | Population indicators | Program changes | Performance measures
BEST STARTS FOR KIDS 2020 ANNUAL REPORT 79

Stopping the School-to-Prison Pipeline
Project SCOPE ★ Delivering impact Programming was significantly affected by school closures and the stay-at-home order during the COVID-19 pandemic. School absences increased and participation decreased for Black, Indigenous, and youth of color as a result of a number of technological, financial and domestic barriers. While the number of eligible youth increased, the program had limited capacity to support them.
How much did we do? Number of youth/young adults enrolled 68
How well did we do it? Number of youth/young adults making progress toward their high school diploma or GED 35
Number of youth/young adults placed in an internship or summer program 18
Is anyone better off? Number of youth/young adults completing internships or summer program placements 15
Number of youth/young adults gaining employment and/or attending college at program completion 7
Truancy Education Re-engagement Programk ★ Delivering impact | Moderately affected by COVID-19Programming was significantly affected by school closures and the stay-at-home order during the COVID-19 pandemic. School absences increased and participation decreased for Black, Indigenous, and youth of color due to a number of technological, financial and domestic barriers. While the number of eligible youth increased, the program had limited capacity to support this.
How much did we do? Number of youth/young adults attending education re-engagement workshops 27
Number of youth/young adults referred to mentoring programs 8
Community Supports ★ Delivering impact Awardees pivoted to adapt to the COVID-19 pandemic, providing virtual programming and technology access, community capacity building, increased mental health supports and financial assistance for basic needs such as food and rent.
How much did we do? Number of youth/young adults enrolled 1,295
How well did we do it? Percent of enrolled youth/young adults who were assessed within three sessions after enrollment 79%
Percent of enrolled youth/young adults with a service plan within six sessions after enrollment 98%
Is anyone better off? Percent of youth/young adults achieving goal upon program completion 62%
Theft 3 and Mall Safety Project (T3AMS) ★ Delivering impact | Moderately affected by COVID-19Programming was significantly affected by mall closures and the stay-at-home order during the COVID-19 pandemic, resulting in fewer youth referrals and reduced mall presence.
How much did we do? Number of youth/young adults contacted through outreach services 323
Number of youth/young adults offered outreach services that subsequently enrolled in the program 33
How well did we do it? Percent of all enrolled youth/young adults who made progress towards their service plan 100%
Is anyone better off? Percent of youth/young adults who achieved a service plan goal upon exit 65%
STRATEGIES INVESTMENTSWELCOME PARTNERSINTRODUCTION EVALUATION
Overview | 2020 Modifications | Population indicators | Program changes | Performance measures
BEST STARTS FOR KIDS 2020 ANNUAL REPORT 80

Community Empowered Disposition Alternative and Resolution (CEDAR Program) ★ Delivering impact Disruptions in the juvenile legal system due to the COVID-19 pandemic significantly affected programming, resulting in fewer filings, court delays and fewer law enforcement referrals.
How much did we do? Number of youth/young adults enrolled 83
Number of youth/young adults referred to the program 210
How well did we do it? Percent of youth/young adults with 45 days or less between referral and case plan date 9%
Is anyone better off? Percent of youth/young adults with a lower disposition recommendation upon exiting the program 67%
a Data are July through December 2020.b Data are September through December 2020.c Tier 2 includes students who had at least one yellow flag, but no red flags, identified during screening.d Tier 3 includes students who had at least one red flag identified during screening.e Daily attendance at virtual and in-person programming.f New measure from COVID emergency scope of work.g Program quality supports include coaching, professional development, and assessments designed to strengthen the quality of OST programs and increase positive outcomes for youth.h Moderately affected by COVID-19.i Contracts began May 2020.j Not all programs report all performance measures.k Contracts ended August 2020.
STRATEGIES INVESTMENTSWELCOME PARTNERSINTRODUCTION EVALUATION
Overview | 2020 Modifications | Population indicators | Program changes | Performance measures
BEST STARTS FOR KIDS 2020 ANNUAL REPORT 81

Communities Matter (Communities of Opportunity) outcomes
Communities of Opportunity
Communities of Opportunity ★ Delivering impact | Moderately affected by COVID-19Communities of Opportunity partners indicated that COVID-19 significantly affected their work, including the need to cancel activities, change from in-person to virtual settings and/or shift priorities to meet immediate community needs (e.g., food assistance, COVID-19 testing). Some partners were highly successful in shifting activities to virtual events and social media platforms, which increased access, reach and participation.
How much did we do? Number of events that Communities of Opportunity partners held or participated in 3,356a
Number of people participating in Communities of Opportunity events 179,738b
How well did we do it? Number of resident leaders developed through Communities of Opportunity 563c
Is anyone better off? Number of new partnerships developed in progress toward policy and/or systems change 141d
Number of new relationships or connections made in progress toward policy and/or systems change 150e,f
Number of policies changed 3g
Number of people hired into jobs as a result of Communities of Opportunity activities 546
a Capacity-building events include workshops, trainings, seminars and other learning or skills-building opportunities. Community events include volunteering, community organizing, celebrations, mentoring and civic engagement activities like town hall meetings.
b Number of people participating may include duplicates across events.c Adult and youth community leaders are residents who are supported by Communities of Opportunity partner organizations to participate in work groups, boards, school leadership, advocacy or
organization or as issue experts or who are supported in their roles as community liaisons or mentors.d Partnerships are formal relationships made with individuals or organizations involving an explicit commitment to mutually agreed-upon outcomes or goals.e Moderately affected by COVID-19.f Relationships are informal connections made with individuals or organizations intended to further Communities of Opportunity goals.g Reflects policy change efforts of Communities of Opportunity’s Seattle Foundation–funded partners.
STRATEGIES INVESTMENTSWELCOME PARTNERSINTRODUCTION EVALUATION
Overview | 2020 Modifications | Population indicators | Program changes | Performance measures
BEST STARTS FOR KIDS 2020 ANNUAL REPORT 82

Homelessness Prevention (Youth and Family Homelessness Prevention Initiative) outcomes
Youth and Family Homelessness Prevention Initiative
Preventions ★ Delivering impact | Moderately affected by COVID-19Fewer households and individuals enrolled in the Youth and Family Homelessness Prevention Initiative in 2020. Demand for homelessness prevention services may have decreased as a result of COVID-19 pandemic response policies and supports (for example, Washington state’s eviction moratorium, King County’s Eviction Prevention and Rental Assistance Program and other temporary stimulus and unemployment supports).
How much did we do? Number of households enrolled in Preventions 1,224
Number of individuals enrolled in Preventions 3,310
How well did we do it? The amount of financial assistance a household received to help with past rent $1,362,910
The average amount of financial assistance a household received $2,294
Is anyone better off? Percent of households who enrolled in Preventions and stayed in stable housing 96%
STRATEGIES INVESTMENTSWELCOME PARTNERSINTRODUCTION EVALUATION
Overview | 2020 Modifications | Population indicators | Program changes | Performance measures
BEST STARTS FOR KIDS 2020 ANNUAL REPORT 83

Capacity Building and Technical Assistance outcomes
Capacity Building and Technical Assistancea
Capacity Building Many capacity building projects were paused due to COVID-19, and capacity builders supported partners in adapting to new needs during the pandemic.
How much did we do? Number of hours of capacity building services provided 7,054
Number of partners receiving capacity building 90
How well did we do it? Percent of capacity building recipients who felt their capacity builder understood their cultural needs 89%b
Percent of capacity building recipients who met their project goals 75%b
Percent of capacity building recipients who were satisfied with the services they received 81%b
Is anyone better off? Percent of capacity building recipients whose organizational infrastructure was improved 79%b
Percent of capacity building recipients whose staff learned new skills 71%b
Percent of capacity building recipients whose staff, board, or volunteers were able to be more effective 78%b
a All measures new for 2020.b Numbers reflect capacity building recipients who participated in a follow-up survey and may not reflect the views of all recipients.
STRATEGIES INVESTMENTSWELCOME PARTNERSINTRODUCTION EVALUATION
Overview | 2020 Modifications | Population indicators | Program changes | Performance measures
BEST STARTS FOR KIDS 2020 ANNUAL REPORT 84

Investment indexOver six years, Best Starts for Kids will invest more than $400 million across four investment areas that promote health and well-being for King County’s children, youth, families and communities. Responding to community input, Best Starts made multiyear investments in each strategy within these investment areas. Below is an accounting of those multiyear commitments, as well as investment actualities in 2020. Given the impact of COVID-19, Best Starts was able to repurpose underspend in some programs to support community-identified impacts in other programs. For example, Transitions to Adulthood switched to virtual models and developed new curricula, spending additional dollars that were allocated to their budget from another strategy.
Investments, by investment area and strategy Amount investeda Years of investment 2020 budget 2020 expenditures
Invest early: Prenatal to 5 years $159,602,850 — $49,862,547 $46,907,387
Help Me Growb $5,152,038 1/2016–12/2021 $2,440,422 $1,746,350
Developmental Promotion/Early Supports $23,487,722 — $7,522,380 $7,393,279
Universal Developmental Screening $7,821,470 11/2018–12/2021 $2,540,548 $2,552,437
Early Support for Infants and Toddlers $12,024,948 7/2016–06/2021 $3,988,241 $3,999,159
Social-Emotional Well-being $3,641,304 11/2017–12/2021 $993,591 $841,683
Workforce Developmentb $4,867,960 01/2019-12/2021 $1,444,981 $1,008,524
Home-Based Services $36,273,681 — $10,793,170 $10,024,167
Community-Designed Home-Based Programs and Practices $5,991,670 9/2018–5/2021 $2,772,917 $2,467,958
Evidence-Based and Evidence-Informed Home Visiting $11,045,634 1/2018–12/2021 $3,286,609 $3,231,609
ParentChild+ $16,376,090 1/2018–12/2021 $3,754,600 $3,754,600
Capacity Building (for Home-Based programs only)b $2,860,287 7/2018–12/2021 $979,044 $570,000
Community-Based Parenting and Peer Supports $12,807,063 — $4,681,045 $3,949,054
Basic Needs Resource Brokering $1,826,983 3/2018–12/2021 $725,562 $742,585
Kaleidoscope Play and Learnb $1,795,680 7/2018–12/2021 $655,346 $453,197
Parenting Caregiver Information and Support $2,993,250 11/2018–5/2021 $1,100,046 $1,098,917
Prenatal Support and Breastfeeding Peer Counseling Servicesb $6,191,150 11/2018–12/2021 $2,200,091 $1,654,355
Public Health Programs $32,604,533 — $10,170,713 $9,927,396
Maternal and Child Health — PHSKC $31,536,134 1/2016–12/2021 $9,884,713 $9,764,567
Perinatal Hepatitis B Prevention Programb $1,068,399 1/2017–12/2021 $286,000 $162,829
Vroomb $464,500 7/2018–11/2021 $150,000 $77,250
STRATEGIES INVESTMENTSWELCOME PARTNERSINTRODUCTION EVALUATION
Investment index | Communities of Opportunities awards
BEST STARTS FOR KIDS 2020 ANNUAL REPORT 85

Investments, by investment area and strategy Amount investeda Years of investment 2020 budget 2020 expenditures
Invest early: Prenatal to 5 years (continued)Child Care Health Consultation $9,311,294 5/2018–12/2021 $2,856,078 $2,969,146
Service Delivery $8,561,316 5/2018–12/2021 $2,660,177 $2,774,146
Systems Development $749,978 5/2018–12/2021 $195,901 $195,000
Innovation Fund $7,858,252 10/2018–12/2021 $2,306,232 $2,535,052
Prenatal to Five Direct Program Staff $14,056,810 1/2016–12/2021 $3,429,993 $3,354,752
Prenatal to Five Administration $12,718,998 1/2016–12/2021 $4,067,533 $3,922,418
Sustaining the gain: 5 to 24 years $134,755,613 — $37,106,808 $35,667,346
Youth Developmentc $15,957,398 1/2018–12/2021 $4,105,004 $4,074,807
School Partnerships $58,222,180 8/2017–12/2021 $16,873,165 $16,323,132
Trauma-Informed and Restorative Practices in School Environments $22,896,433 9/2017–8/2021 $7,065,822 $6,356,018
Timely Response to Adverse Childhood Experiencesb $611,130 2/2018–12/2021 $280,862 $117,286
School-Based Screening, Brief Intervention, and Referral To Services (SBIRT) $10,072,366 10/2017–12/2021 $3,082,000 $3,495,120
Out-of School-Time $17,434,867 8/2017–12/2021 $4,595,753 $4,862,819
School-Based Health Centers $7,207,383 9/2017–8/2021 $1,848,728 $1,491,889
Family and Community Connections $11,806,210 — $3,453,641 $3,160,465
Healthy and Safe Environmentsb $5,102,153 7/2017–12/2021 $1,095,302 $633,224
Washington Child Health Improvement Partnership $1,122,472 11/2017–10/2021 $391,943 $230,275
Family Engagement $5,581,584 9/2018–12/2021 $1,966,396 $2,296,966
Transitions to Adulthood $14,842,969 — $3,070,999 $3,388,657
Helping Young Adults Transition to Adulthood $6,557,530 1/2018–12/2021 $1,270,999 $1,567,513
Clear Path to Employment $3,426,919 7/2017–6/2021 $400,000 $369,082
Career Launchpad $3,549,715 8/2018–12/2021 $900,000 $1,155,575
Peer Connectors Projectb $1,308,805 8/2018–12/2021 $500,000 $296,487
Stopping the School to Prison Pipeline $17,317,509 — $5,387,495 $4,851,052
Community Supports $12,941,271 2/2018–12/2021 $3,887,826 $4,071,360
Project SCOPEb $740,781 6/2017–12/2021 $308,483 $164,624
Theft 3 and Mall Safety Project (T3AMS)b $3,245,647 2/2017–12/2021 $991,185 $534,826
Community Empowered Disposition Alternative and Resolution (CEDAR) Programb $389,809 1/2019–12/2021 $200,000 $80,242
STRATEGIES INVESTMENTSWELCOME PARTNERSINTRODUCTION EVALUATION
Investment index | Communities of Opportunities awards
BEST STARTS FOR KIDS 2020 ANNUAL REPORT 86

Investments, by investment area and strategy Amount investeda Years of investment 2020 budget 2020 expenditures
Sustaining the gain: 5 to 24 years (continued)Five to 24 Direct Program Staff $5,319,930 1/2016–12/2021 $919,987 $1,164,254
Five to 24 Administrationb $7,295,063 1/2016–12/2021 $1,848,669 $1,362,979
Technical Assistance and Capacity Building (PN-5 & 5-24)d $3,994,356 9/2017–12/2021 $1,447,849 $1,342,001
Communities Matter $36,816,139 — $10,336,652 $9,888,901
Communities of Opportunity $31,103,132 9/2017–12/2021 $9,172,251 $8,148,933
Place-Based and Cultural Community Partnerships $17,557,645 9/2017–12/2021 $5,044,738 $4,437,166
Policies and Systems Change $8,297,000 2/2018–12/2021 $2,659,953 $2,637,500
Learning Community $5,248,487 1/2019–12/2021 $1,467,560 $1,074,267
Communities of Opportunity Direct Program Staffe $4,135,097 1/2016–12/2021 $789,364 $1,416,438
Communities of Opportunity Administration $1,577,910 1/2016–12/2021 $375,037 $323,531
Homelessness Prevention $20,592,820 — $4,467,000 $3,771,936
Youth and Family Homelessness Prevention Initiative $19,079,943 10/2016–12/2021 $3,900,000 $3,436,106
Youth and Family Homelessness Prevention Initiative Direct Program Staff
$1,512,877 6/2016–12/2021 $567,000 $335,830
Evaluation $16,727,410 10/2016–12/2021 $3,986,000 $3,583,100
TOTAL INVESTMENT through December 31, 2020 $368,494,831 — $105,759,008 $99,818,671
a Amount invested includes current and previous years expenditures and amounts awarded in contracts.b Contract expenditures were lower than budgeted due to timing of start-up, roll-out of programming, procurement of services and lower administration costs resulting from salary savings and temporary
reassignment of staff.c Programs include Mentoring, Youth Leadership, Positive Identity Development, and Healthy Relationships and Domestic Violence Prevention. d Technical Assistance and Capacity Building funding was blended between Investing Early and Sustaining the Gain with most service providers.e Given the impact of COVID-19, Best Starts was able to repurpose underspend in some program areas to support needs identified by community and staff in other program areas.
STRATEGIES INVESTMENTSWELCOME PARTNERSINTRODUCTION EVALUATION
Investment index | Communities of Opportunities awards
BEST STARTS FOR KIDS 2020 ANNUAL REPORT 87

Communities of Opportunities awardsAll Best Starts for Kids annual reports are required to include a chart with information on any awards made under Communities of Opportunity (COO) since the last reporting cycle. In accordance with the requirements of the Best Starts for Kids Implementation Plan, this funding chart provides the name of each award recipient, the amount of the award, a description of the work for which the award was granted and the source of the award. With respect to the award source, if public funds are blended with any other fund source, then the chart also includes a breakdown of the multiple sources and amounts.
King County Best Starts for Kids funds are restricted from use in political campaigns, state lobbying or any non-charitable or illegal purpose.
Place-based partnership awardsAwardee Amount awarded
Rainier Valley PartnershipThe Rainier Valley Partnership includes more than 70 groups working collaboratively in four coalitions. Partners are working towards increasing access to healthy and locally grown food; reducing crime rates in Rainier Beach; developing a community vision and plans for equitable transit-oriented development; addressing environmental causes of violent crime; increasing access to nutrition and supporting integration of cultural, education, employment, health, and well-being programs and projects.
Partners: HomeSight, HOSTED, Multicultural Community Coalition, On Board Othello, Rainier Beach Action Coalition (RBAC), South Communities Organizing for Racial & Regional Equity, Puget Sound Sage, The Beet Box
Best Starts $1,149,390
SeaTac-Tukwila Community CoalitionThe SeaTac-Tukwila Community Coalition is focused on empowering communities and developing local leaders around health, housing and economic opportunity, and extending more opportunities for community leaders to engage in issues of education, cultural leadership, policy and systems change and community building. Their work focuses on health and affordable food access, supporting emerging food businesses, workforce development training and support areas, further development of a cultural food hall in the Tukwila Village, and the placement of immigrant and refugees in sustainable, living wage jobs.
Partners: Global to Local, Congolese Integration Network, Food Innovation Network, Partner in Employment, Somali Health Board, Somali Youth and Family Club
Best Starts $789,041
White Center PartnershipThe White Center Partnership’s vision for success centers on creating a strong and vibrant community led by voices of residents and families; increasing access to healthy food for all residents; leadership development of community including youth, ultimately obtaining leadership and decision-making roles in systems and institutions; increased capacity for culturally relevant systems reform to better meet the needs of communities of color; strengthening community mobilizing for systems change in housing, health, economic development and community building; and addressing institutionalized racism and removing barriers to services and supports that communities need.
Partners: White Center Community Development Association, Cham Refugees Community, Cambodian Cultural Alliance of Washington, Education for All, FEEST, Southwest Youth and Family Services, Trusted Advocates, Village of Hope, YES! Foundation of White Center, YWCA
Best Starts $849,363
STRATEGIES INVESTMENTSWELCOME PARTNERSINTRODUCTION EVALUATION
Investment index | Communities of Opportunities awards
BEST STARTS FOR KIDS 2020 ANNUAL REPORT 88

Awardee Amount awarded
Kent Community Development CollaborativeThe Kent Community Development Collaborative (KCDC) focus is on improving the overall health and well-being of Kent residents most impacted by inequities by increasing their access to culturally responsive health care services, increasing economic opportunity for small businesses, strengthening tenants’ ability to advocate for safe affordable housing, and fostering civic engagement by building the capacity of residents to advocate for change.
Partners: Community Network Council, Living Well Kent, Coalition for Refugees from Burma, Mother Africa, Communities in Schools of Kent, Iraqi Community Center, Somali Youth and Family Club, Being Empowered Through Supportive Transitions, Centro Rendu/St. Vincent DePaul
Best Starts $605,000
A Supportive Community for AllThe A Supportive Community for All (SCFA) partnership continues to strengthen community connections through its inclusive coalition of service providers and key community stakeholders to coordinate human services across the Snoqualmie Valley. Through adaptive leadership facilitation and project management, the SCFA Workgroup and Partner Team is designing a multifaceted Community Services Navigator Program that will create a network of contact points throughout the Snoqualmie Valley to enable community members to more easily access human services.
Partners: Hopelink, Snoqualmie Valley Community Network, Mt. Si Senior Center, Snoqualmie Valley Food Bank, Encompass
Best Starts $660,000
Transgender Economic Empowerment CoalitionThe Transgender Economic Empowerment Coalition (TEEC) focus is on implementing a model employment policy with local governments, businesses and organizations and building a LGBTQ youth advisory group to ensure their policies and programs address the challenges youth are facing. TEEC is also advocating for policies and building programs that support transgender and gender-diverse people returning from prison to address a lack of housing stability.
Partners: Ingersoll Gender Center, Greater Seattle Business Administration (GSBA), UTOPIA Washington, POCAAN, Gay City, Seattle Counseling Services, Transform Washington, Pride Foundation, Gender Odyssey, Business Impact NW, Ventures NW
Best Starts $660,000
Comunidad Latina de VashonComunidad Latina de Vashon continues to build partnership capacity and engage the Latinx community of Vashon Island to implement projects that contribute to better health, economic opportunity and stronger community connections among the Latinx community of Vashon Island.
Partners: Latino Community Fund, Comunidad Latina de Vashon, Geeking Out Kids of Color, Latinos in Tech, Alianza, Puentes
Best Starts $330,000
Community partnership awardsPlace-based and cultural community awards
STRATEGIES INVESTMENTSWELCOME PARTNERSINTRODUCTION EVALUATION
Investment index | Communities of Opportunities awards
BEST STARTS FOR KIDS 2020 ANNUAL REPORT 89

Awardee Amount awarded
Seattle Urban Native NonprofitsThe goal of the Seattle Urban Native Nonprofit (SUNN) partnership is to build the capacity to advocate for the Seattle Native community in the public and philanthropic sectors. SUNN is accomplishing this through leadership development, training, advocacy and collective strategic planning.
Partners: Potlatch Fund, Seattle Indian Health Board, Na’ah Illahee Fund, Chief Seattle Club & Native Women’s Dialog on Infant Mortality, Longhouse Media, Mother Nation, National Urban Indian Family Coalition, Native Action Network, Red Eagle Soaring, United Indians of All Tribes Foundation, Urban Native Education Alliance, Duwamish Tribal Services, Northwest Justice Project
Best Starts $660,000
Replanting Roots, Rebuilding CommunityThe Replanting Roots, Rebuilding Community partnership continues to build on their first stage of research and planning and is focusing on placemaking within Seattle’s Central District by stabilizing and developing cornerstone institutions and assets to anchor the historic and current Black community. The partnership continues in their work to develop a holistic portfolio of culturally appropriate and responsive resources and services for the Black community in King County to heal and thrive.
Partners: Umoja PEACE Center, Village Spirit Center/Black Community Impact Alliance, Africatown Center for Education & Innovation, Africatown Central District Preservation & Development Association, Cultural Reconnections, Institute for African Centered Thought
Best Starts $660,000
Systems and policy change awards
Awardee Amount awarded
Africatown Community Land TrustAfricatown and the King County Equity Now coalition are working to support community priorities for effective public and private investments needed to effectively respond to COVID-19 and for greater equity for the Black King County community.
Best Starts $100,000Seattle Foundation $25,000
Total award $125,000
Casa LatinaCasa Latina is improving economic conditions for domestic workers in Seattle, King County and Washington state by changing the policies that affect their working conditions. This project is focused on implementing and completing the work Casa Latina led to win a Domestic Worker Bill of Rights in Washington.
Best Starts $120,000Seattle Foundation $80,000
Total award $200,000
Chief Seattle ClubChief Seattle Club is working toward equitable responses related to COVID-19 in health, housing, community and economic protections, including Indigenous-designed contact tracing for more accurate data collection.
Best Starts $25,000Seattle Foundation $25,000
Total award $50,000
(continued...)
STRATEGIES INVESTMENTSWELCOME PARTNERSINTRODUCTION EVALUATION
Investment index | Communities of Opportunities awards
BEST STARTS FOR KIDS 2020 ANNUAL REPORT 90

Awardee Amount awarded
Chief Seattle Club (continued)
The Chief Seattle Club’s Coalition to End Urban Indigenous Homelessness advocates to include American Indian/Alaska Native representation in the region’s response to homelessness. and to ensure that community preference policy includes American Indian/Alaska Native individuals as displaced people.
Partners: United Indians of All Tribes Foundation, Labateyah Youth Home, Seattle Indian Health Board, Urban Indian Health Institute, Native American Women’s Dialog on Infant Mortality, Mother Nation, Seattle Indian Services Commission, Seattle Public Schools Huchoosedah Indian Education
Best Starts $28,000Seattle Foundation $80,000
Total award $360,000
CHOOSE 180 and Community PassagewaysCHOOSE 180 and Community Passageways is working in partnership for the development of a sustainable advocacy strategy led by those most impacted by mass incarceration, ensuring the health and well-being of incarcerated or court-involved young people, and that equitable public health and systemic changes made in response to COVID-19 are expanded and sustained.
Best Starts $100,000Seattle Foundation $25,000
Total award $125,000
CHOOSE 180CHOOSE 180 is developing a community-grounded approach to restorative community pathways that would divest resources from a juvenile legal system and reinvest those resources in programs that support youth, community, healing and racial justice.
Partners: Collective Justice, Creative Justice, Community Passageways
Best Starts $115,000Seattle Foundation $30,000
Total award $145,000
Church Council of Greater SeattleThe Church Council is working with local faith leaders to connect and mobilize their communities for housing justice and tenant protections across King County.
Best Starts $120,000Seattle Foundation $80,000
Total award $200,000
Collective JusticeCollective Justice is strengthening their systems and policy work to build a survivor-led movement in King County to transform the criminal legal system and promote policies that support the people most impacted by violence.
Best Starts $120,000Seattle Foundation $80,000
Total award $200,000
Community Health Board CoalitionThe Community Health Board Coalition is addressing the disparate impact of COVID-19 among Black, Indigenous and people of color communities by focusing on addressing the causes of mental health issues that are rooted in structural racism and are manifesting more vividly because of the pandemic.
Best Starts $125,000Seattle Foundation $8,000
Total award $133,000
STRATEGIES INVESTMENTSWELCOME PARTNERSINTRODUCTION EVALUATION
Investment index | Communities of Opportunities awards
BEST STARTS FOR KIDS 2020 ANNUAL REPORT 91

Awardee Amount awarded
Crescent CollaborativeThe Crescent Collaborative is pursuing a multi-pronged, community-driven anti-displacement strategy that unites and elevates communities’ voices for: affordable housing; economic opportunity (small business); healthful, safe communities; and community capacity to engage in equitable community development; and is extending the push for equity in policies and systems that govern how communities function, who gets to live or work in them, and how they can be made safe, healthy and welcoming.
Partners: Seattle Chinatown-International District Preservation and Development Authority, Capitol Hill Housing, Byrd Barr Place, Africatown Community Land Trust, Friends of Little Saigon
Best Starts $340,000Seattle Foundation $60,000
Total award $400,000
Dare2Be ProjectDare2BE is working on effective strategies to empower communities and identify, document and execute a community action plan to disrupt health inequities by creating an equitable and sustainable urban food system.
Partners: Urban Food Systems Pact, Skyway Community Advocates Cohort, New Birth Center for Community Inclusion
Best Starts $115,000Seattle Foundation $30,000
Total award $145,000
FEESTFEEST youth leaders are building a movement for better student health by organizing for increased access to fresh, free and culturally relevant school breakfasts and lunches.
Best Starts $160,000Seattle Foundation $40,000
Total award $200,000
ForFortyTwoForFortyTwo is combating systemic racism impacting education, law enforcement, politics and youth investment.
Partners: Glover Empower Mentoring, Kent Black Action Committee
Best Starts $90,000Seattle Foundation $55,000
Total award $145,000
Freedom ProjectThe Freedom Project is working to see through the implementation of a new state policy mandating resentencing and release for people who were tried and sentenced as adults when they were children.
Partners: Beyond the Blindfold Project, Freedom Project East
Best Starts $85,000Seattle Foundation $60,000
Total award $145,000
Gender Justice LeagueGender Justice League and partners are activating and advocating for trans and non-binary people who are experiencing significant barriers to safe housing (permanent and non-permanent) due to the intersection of transphobia, misogyny and the COVID-19 crisis.
Partners: Black Trans Task Force, Heartspark Press
Best Starts $105,000Seattle Foundation $20,000
Total award $125,000
STRATEGIES INVESTMENTSWELCOME PARTNERSINTRODUCTION EVALUATION
Investment index | Communities of Opportunities awards
BEST STARTS FOR KIDS 2020 ANNUAL REPORT 92

Awardee Amount awarded
Got GreenGot Green is working to build community power for Seattle’s Green New Deal, which outlines a vision of decarbonization by 2030 and addresses historic injustices, creates thousands of unionized green jobs and invests in climate-resilient communities (improving health, housing, economic opportunity and community connections).
Best Starts $100,000Seattle Foundation $100,000
Total award $200,000
Got Green is working to advance its emergency justice platform in response to COVID-19 via education, narrative development and community action.
Best Starts $20,000
Ingersoll Gender CenterIngersoll Gender Center is developing and implementing an advocacy strategy for Apple Health improvements with the Coalition for Inclusive Healthcare, educating their provider consult group and building more partnerships with community health clinics.
Best Starts $100,000Seattle Foundation $100,000
Total award $200,000
King County Equity NowKing County Equity Now is developing research, technology and data management capacity in order to collect community data while building trust and deepening relationships among Black community members and Black-led organizations and toward effective policies that support Black communities.
Best Starts $115,000Seattle Foundation $130,000
Total award $145,000
The Maternal CoalitionThe Maternal Coalition is supporting birth rights, birth advocacy and perinatal mental health advocacy for communities of color in King County.
Best Starts $125,000
Muslim Community & Neighborhood AssociationThe Muslim Community & Neighborhood Association is advocating for policies in east King County that protect low-income immigrant and refugee renters from eviction during and after the COVID-19 crisis.
Best Starts $42,000
New Economy WashingtonThe New Economy Washington project is building infrastructure and supporting leaders for a more just and democratic economy, including through the Frontline Community Fellowship program designed to support entrepreneurs from communities of color who are integrating the principles and practice of a “Just Transition” in projects that demonstrate core principles of democracy and self-determination, environmental sustainability and equity, and create shared economic well-being for communities.
Partners: Front and Centered, People’s Economy Lab
Best Starts $340,000Seattle Foundation $60,000
Total award $400,000
STRATEGIES INVESTMENTSWELCOME PARTNERSINTRODUCTION EVALUATION
Investment index | Communities of Opportunities awards
BEST STARTS FOR KIDS 2020 ANNUAL REPORT 93

Awardee Amount awarded
Northwest Health Law AdvocatesNorthwest Health Law Advocates is working to maintain and strengthen immigrant health coverage and access beyond the pandemic emergency period.
Best Starts $63,000Seattle Foundation $20,000
Total award $83,000
Not This Time!Not This Time! is addressing the reformation of the criminal justice system, modernizing state law through the implementation of Initiative 940 and engaging with city youth through their “Conversation with the Streets” initiative.
Best Starts $100,000Seattle Foundation $50,000
Total award $150,000
OneAmericaOneAmerica is mobilizing communities in shaping a just, community-led recovery from the COVID-19 pandemic.
Best Starts $25,000Seattle Foundation $25,000
Total award $50,000
Open Doors for Multicultural FamiliesOpen Doors for Multicultural Families is building community knowledge about advocacy and civic engagement strategies to promote meaningful communication between families and schools so that all students and families with developmental/intellectual disabilities and special health care needs have equal access to culturally and linguistically appropriate information, resources and services.
Best Starts $138,000Seattle Foundation $62,000
Total award $200,000
Para Los NiñosPara Los Niños is educating and supporting Latinx families in engagement and leadership work that supports students’ academic success from birth on. Their Parent Leadership Team is surveying Latinx parents and children across south King County on issues impacting their children and families’ success and safety.
Best Starts $160,000Seattle Foundation $40,000
Total award $200,000
Puget Sound SagePuget Sound Sage is organizing with Black and Indigenous communities and communities of color in Seattle and King County toward a just COVID-19 recovery framework that centers policies that prevent further displacement and gentrification and promote resiliency through community stewardship of land.
Best Starts $125,000
Seattle Indian Health BoardSeattle Indian Health Board is focusing policy and systems change to stop gender-based violence and the missing and murdered Indigenous women crisis; and is creating tribally driven behavioral health systems with culturally attuned and sustainable programming that will engage tribal, community and government partners to build community connections that sustain a framework for local and state health efforts and address the chronic underfunding by the federal government.
Best Starts $62,000Seattle Foundation $138,000
Total award $200,000
Seattle Indian Health Board is engaging in advocacy efforts to ensure adequate funding for the Indian health care system, community health centers and public health in coordination with tribes and tribal organizations in response to the impacts from COVID-19.
Best Starts $25,000Seattle Foundation $25,000
Total award $50,000
STRATEGIES INVESTMENTSWELCOME PARTNERSINTRODUCTION EVALUATION
Investment index | Communities of Opportunities awards
BEST STARTS FOR KIDS 2020 ANNUAL REPORT 94

Awardee Amount awarded
Skyway CoalitionSkyway Coalition is addressing the historic lack of investment, inequitable policies and systems that have impacted the urban unincorporated King County community by advocating for policies and funding that support anti-displacement strategies, affordable housing and economic development.
Partners: Skyway Solutions, West Hill Community Association, the Renton Innovation Zone Partnership, Renton Area Youth and Family Services), Renton School District, Urban Family, Somali Parent Education Board
Best Starts $300,000Seattle Foundation $100,000
Total award $400,000
Statewide Poverty Action NetworkThe Statewide Poverty Action Network is supporting the creation of, and access to, direct cash assistance for low-income communities and communities of color in response to the COVID-19 pandemic and in COVID-19 recovery.
Best Starts $47,000Seattle Foundation $10,000
Total award $57,000
Surge Reproductive JusticeSurge is establishing a policy table comprising individuals and organizations that represent women of color and queer and trans people of color to establish policies that meaningfully and effectively address reproductive health injustices. The work will address Black maternal health and maternal health disparities for people of color through their 10-week Ella Baker Summer Leadership program.
Best Starts $160,000Seattle Foundation $40,000
Total award $200,000
Surge is launching a Black maternal and perinatal health campaign to create a community-directed strategy for policy and advocacy solutions to health inequities.
Partners: Families of Color Seattle, Black Birth Workers Collective
Best Starts $115,000Seattle Foundation $30,000
Total award $145,000
Tenants Union of Washington StateThe Tenants Union is supporting the leadership development of low-income tenants in King County in advocating for essential tenant rights and eviction protections.
Best Starts $160,000Seattle Foundation $40,000
Total award $200,000
UTOPIA WashingtonUTOPIA (United Territories of Pacific Islanders Alliance) is developing a leadership cohort of queer and trans Pacific Islanders (QTPI) working for the health, safety, well-being, empowerment and economic stability of QTPI, for the sake of liberation for all queer and trans People of Color.
Best Starts $150,000
Seattle Foundation $40,000
Total award $190,000
UTOPIA is supporting the leadership of QTPI in King County working for essential safety protections for those whose lives and livelihoods are being severely jeopardized by the COVID-19 crisis.
Best Starts $85,000
STRATEGIES INVESTMENTSWELCOME PARTNERSINTRODUCTION EVALUATION
Investment index | Communities of Opportunities awards
BEST STARTS FOR KIDS 2020 ANNUAL REPORT 95

Awardee Amount awarded
Wa Na WariWa Na Wari is continuing their anti-displacement organizing work with Black homeowners in Seattle’s Central District to broaden community use of properties in single family residential zones, and increase opportunities for Black homeowners as a response to the housing affordability crisis impacting families, artists and small organizations.
Best Starts $140,000
Seattle Foundation $60,000
Total award $200,000
Wa Na Wari is conducting participatory research and organizing Central District Black homeowners and cultural workers to engage in land use policy education and organizing for systems change.
Partners: CD Brothers and Sisters, Keep Your Habitat, King County Equity Now, Africatown
Best Starts $50,000
YES! Foundation of White CenterYES! Foundation of White Center is actively supporting Pacific Islander youth and their families to engage in the process of raising awareness, identifying solutions and leading change in addressing health disparities highlighted and exacerbated by COVID-19.
Best Starts 50,000
Learning community awards
Awardee Amount awarded
BDS Planning and Urban DesignBDS is co-designing with Communities of Opportunity staff a peer learning “Community of Practice” group for members of Communities of Opportunity partnerships. The Community of Practice is a space to engage in peer learning and facilitated activities to develop, learn and practice effective techniques and skills to build partnerships with deeper relationships, trust and conflict resolution skills.
Best Starts $55,000
Cascadia ConsultingCascadia Consulting is providing administrative and logistics support across learning community activities.
Best Starts $211,000
Centro Cultural MexicanoCentro Cultural Mexicano is focusing on the direct and estimated long-term effects of COVID-19 on low-income Latino children in King County, including housing stability, education, food security, physical health and social-emotional well-being as part of their COVID-19 Storytelling work.
Best Starts $97,000
Coalicion de Pueblos Originarios Coalicion de Pueblos Originarios is engaging south King County youth and adults who are from Indigenous communities of the P’urhepecha, Ñuu Savi and Kichwa Otavalo as part of their COVID-19 Storytelling work.
Best Starts $100,000
STRATEGIES INVESTMENTSWELCOME PARTNERSINTRODUCTION EVALUATION
Investment index | Communities of Opportunities awards
BEST STARTS FOR KIDS 2020 ANNUAL REPORT 96

Awardee Amount awarded
Communities Rise Communities Rise and Sama Praxis/Sarah Tran are providing consultation and co-designing and facilitating capacity building activities — working with consultants and practitioners on organizational stability, skill-building and knowledge sharing, sustainable partnerships and power-building.
Partner: Sama Praxis LLC
Best Starts $790,000
Contacto Consulting Contacto Consulting is providing foundational communications skill-building activities in communications plans, crisis communications strategies, audience segmentation and brand strategy and development.
Partner: Sama Praxis LLC
Best Starts $30,000
Headwater People Headwater People is creating and coordinating a learning and technical assistance series for COO community-based organizations to develop and strengthen communications skills and strategies. A series of interactive sessions is being offered in 2021.
Best Starts $78,000
King County Equity Now King County Equity Now is focusing on solutions to improve the on-the-ground, lived experiences of Black communities in King County experiencing disproportionate impacts of the COVID-19 related health and economic crisis as part of their COVID-19 Storytelling work.
Best Starts $100,000
La Roxay Productions La Roxay Productions is co-designing and presenting a speaker series to highlight COO partners’ work and spark a strategic set of conversations for COO stakeholders with leaders in the field.
Partner: BDS Planning & Urban Design
Best Starts $75,000
Puget Sound Sage Puget Sound Sage is hosting, designing and coordinating the second Community Real Estate Stewardship Team learning cohort, designed to support and train grassroots organizations led by and for low-income communities and communities of color in pursuing community driven development, land stewardship and strategies for long-term affordability.
Best Starts $250,000
National Development Council The National Development Council is designing and coordinating a commercial affordability pilot program to assist micro/small businesses to remain open and contribute to economic stability and resiliency in their communities and supporting local job creation and retention.
Partners: Craft3, BDS Planning & Urban Design, Moving Beyond, Darren Medina
Best Starts $1,500,000
STRATEGIES INVESTMENTSWELCOME PARTNERSINTRODUCTION EVALUATION
Investment index | Communities of Opportunities awards
BEST STARTS FOR KIDS 2020 ANNUAL REPORT 97

Awardee Amount awarded
Tesfa Program Tesfa Program is uplifting experiences of Amharic-speaking Ethiopian community members throughout King County as part of their COVID-19 Storytelling work.
Best Starts $100,000
Washington Dream Coalition Washington Dream Coalition is engaging members of undocumented communities throughout King County to explore research questions relevant to community needs and resilience and systemic changes for long-term impacts as part of their COVID-19 Storytelling work.
Best Starts $100,000
STRATEGIES INVESTMENTSWELCOME PARTNERSINTRODUCTION EVALUATION
Investment index | Communities of Opportunities awards
BEST STARTS FOR KIDS 2020 ANNUAL REPORT 98

Best Starts for Kids encourages collaboration and partnership between organizations. While this list reflects the primary agencies holding contracts with Best Starts for Kids, many others carry out the work in partnership with these organizations.
Asian Counseling and Referral ServiceAssociated Recreation Council (ARC)The Athena Group, LLCAtlantic Street CenterAuburn School DistrictAuburn Youth ResourcesAustin FoundationBalance In Breath, LLCBDS Planning & Urban DesignBella’s Creative Learning CenterBellevue School DistrictBellevue School District CollaborativeBellevue Schools FoundationBig Picture Middle SchoolBirth to Three Developmental CenterBlack Star Line African FamilyBoyer Children’s ClinicBoys & Girls Club King CountyBoys & Girls Club of BellevueBoys & Girls Club of Rainier VistaBRAVE- Building Resilience Awareness & Variations of ExcellenceBriana Herman-BrandBridging Cultural GapsBulle ConsultingCanyon Park Middle SchoolThe Capacity CollectiveCardea ServicesCasa LatinaCascade Middle SchoolCascadia ConsultingCedar Heights Middle SchoolCenter for Ethical LeadershipCenter for Human ServicesCentral Area Youth AssociationCentro Cultural MexicanoCham Refugees Community
Chief Kanim Middle SchoolChief Seattle ClubChildhavenChildren’s Home Society of WashingtonChildren’s Therapy CenterChildStriveChinese Information and Service CenterChinook Middle SchoolCHOOSE 180 Church Council of Greater SeattleCity of Renton–Recreation and Neighborhoods DivisionCity of ShorelineCity of TukwilaCity Year Seattle/King CountyCoalicion de Pueblos OriginariosCoalition for Refugees from BurmaCollective Justice Comunidad Latina de Vashon
- Latino Community Fund - Comunidad Latina de Vashon - Geeking out Kids of Color - Latinos in Tech - Alianza - Puentes
Communities in ActionCommunities In Schools of RentonCommunities In Schools of SeattleCommunities RiseCommunity Health Board Coalition
- African-American Health Board - Cambodian Health Board - Eritrean Health Board - Ethiopian Health Council Health Board - Iraqi/Arab Health Board - LatinX Health Board - Pacific Islander Health Board - Somali Health Board - Vietnamese Health Board
Community Network CouncilCommunity PassagewaysComunidad Latina de VashonCongolese Integration NetworkContacto ConsultingCrescent Collaborative (formerly Yesler Community Collaborative)Crisis ConnectionsDAWN - Domestic Abuse Women’s NetworkDare2Be ProjectDelridge Neighborhoods Development AssociationDenise Louie Education CenterDimmitt Middle SchoolDispute Resolution Center of King CountyDivine Alternatives for Dads ServicesThe DOVE ProjectEast African Community ServicesEastside Baby CornerEastside PathwaysEl Centro de la RazaEmerging DesignEmPowerEmpowering Youth & Families OutreachEncompassEnumclaw School DistrictEritrean Association in Greater SeattleExperimental Education Unit, Haring CenterFamilies of Color SeattleFamily Conversations at NWSDHHFamilyWorksFederal Way Black CollectiveFederal Way Public SchoolsFederal Way Youth Action TeamFEESTFilipino Community of SeattleFirst Five Years & Beyond
4 Culture/Creative JusticeA Collaborative Systems Approach to Prenatal to Five Workforce DevelopmentA Supportive Community for All
- Hopelink - Snoqualmie Valley Community Network - Mt. Si Senior Center - Snoqualmie Valley Food Bank - Encompass
ACE AcademyAfrican Community Housing & DevelopmentAfricatown Community Land TrustAlliance for Gun ResponsibilityAllison Metz LLCALR Grant Writing ServicesAlterNATIVE ConsultingAmaraANEWAPI ChayaAPICATThe Arc of King CountyArt with HeartArts Corps
Community Partners
STRATEGIES INVESTMENTSWELCOME PARTNERSINTRODUCTION EVALUATION
BEST STARTS FOR KIDS 2020 ANNUAL REPORT 99

ForFortyTwoFreedom ProjectFriends of the ChildrenFriends of YouthGage Academy of ArtGender DiversityGender Justice LeagueGIRLSThrive ProgramGlobal Perinatal Services (formerly Somali Doulas Northwest)Global to LocalGlover Empower MentoringGood Shepherd Youth OutreachGot GreenGreater Maple Valley Community CenterGreenplay NWHazelwood Elementary SchoolHeadwater PeopleHealthPointHearing, Speech and Deaf CenterHighland Middle SchoolHighline Public SchoolsHopeCentralHorn of Africa ServicesIllahee Middle SchoolThe Imagine InstituteIndia Association of Western WashingtonInspirational WorkshopsInstitute for Community LeadershipInterCultural Children & Family ServicesInterIm Community Development AssociationInternational Community Health ServicesInternational Community SchoolIraqi Community Center of WashingtonIslander Middle SchoolJ.J. Smith Birth To Five Center, Enumclaw School DistrictJane Addams Middle SchoolThe Joseph ProjectJourneymen Institute
Kaiser Permanente WashingtonKandeliaKenmore Middle SchoolKent Community Development Collaborative
- Community Network Council - Coalition for Refugees from Burma - Mother Africa - Communities in Schools of Kent - Somali Youth and Family Club - Being Empowered Through Supportive
Transitions - Centro Rendu/St. Vincent DePaul
Kent School DistrictKent Youth and Family ServicesKent Youth and Family Services CollaborativeKids Co.Kilo Middle SchoolKindering CenterKing County Equity NowKing County Sexual Assault Resource CenterKorean Community Services CenterLa Roxay ProductionsLake Washington School DistrictLakota Middle SchoolLambert HouseLeota Middle SchoolLife Enrichment GroupLifeWireListen and TalkLittle Red School House DBA ChildStriveLiving Well Kent Luther MemorialMadison Middle SchoolMaple View Middle SchoolThe Maternal CoalitionMattson Middle SchoolMcMurray Middle SchoolMuslim Community & Neighborhood Association (MCNA)
Meeker Middle SchoolMentoring Urban Students and TeensMercy Housing NorthwestMeridian Middle SchoolMill Creek Middle SchoolThe Mockingbird SocietyMother AfricaMount Baker Middle SchoolMulti-Service Center–RAP in Federal WayMuslim Girl Identity Mapping ProjectNa’ah Illahee FundNational Center for Restorative JusticeNational Development CouncilNative Women in NeedNavosNeighborCare HealthNeighborhood HouseNeighborhood House CollaborativeNew Economy WashingtonNew Hope Lutheran ChurchNew HorizonsNonprofit Assistance CenterNorth Seattle CollegeNorthshore Middle SchoolNorthshore School DistrictNorthwest CenterNorthwest Health Law AdvocatesThe Northwest NetworkNorthwood Middle SchoolNot This Time!Odessa Brown Children’s ClinicOdle Middle SchoolOlympic Middle SchoolOneAmericaOpen Arms Perinatal ServicesOpen Doors for Multicultural FamiliesOrca K-8Pacific Middle SchoolPara Los Niños Parent Trust for Washington Children
Partner in Employment (PIE)Partners at LowellPartners for Our Children/University of WA School of Social WorkPartners In Education ReformPerinatal Support WashingtonPhenomenal ShePlanned Parenthood of the Great Northwest and the Hawaiian IslandsPOCAANPowerful VoicesPrenatal to Five Systems CoordinationProgram for Early Parent SupportProgress House AssociationPuentes Puget Sound Educational Service DistrictPuget Sound Sage Rainier Beach Action Coalition (RBAC)Rainier Middle SchoolRainier Valley Partnership
- HomeSight - HOSTED - Multicultural Community Coalition - On Board Othello - Rainier Beach Action Coalition (RBAC) - South Communities Organizing for
Racial & Regional Equity - Puget Sound Sage - The Beet Box
Rainier Valley MidwivesRefugee Women’s AllianceRenton Innovation Zone PartnershipRenton School DistrictReplanting Roots, Rebuilding Community
- Umoja PEACE Center - Village Spirit Center/Black Community
Impact Alliance - Africatown Center for Education &
Innovation - Africatown Central District Preservation
& Development Association - Cultural Reconnections - Institute for African Centered Thought
STRATEGIES INVESTMENTSWELCOME PARTNERSINTRODUCTION EVALUATION
BEST STARTS FOR KIDS 2020 ANNUAL REPORT 100

Restore, Assemble, ProduceRethinking Schools – Garfield High SchoolRiverton Park United Methodist ChurchRoxanne Hood Lyons Consulting (RHL)RVCRytherSacajawea Middle SchoolSaghalie Middle SchoolSama Praxis LLCScholarship Junkies (Washington Dream Coaliton)School’s Out Washington (SOAR)SeaMar Community Health CentersSeaTac-Tukwila Community Coalition
- Congolese Integration Network - Food Innovation Network - Global to Local - Partner in Employment (PIE) - Somali Health Board - Somali Youth and Family Club
Seattle CARES Mentoring MovementSeattle Children’s HospitalSeattle Children’s PlaygardenSeattle Education AccessSeattle FoundationSeattle Indian Health Board Seattle King County NAACPSeattle Parks and RecreationSeattle Public SchoolsSeneca Family of AgenciesSequoyah Middle SchoolShoreline School DistrictShowalter Middle SchoolShunpike Sisters In CommonSkykomish School DistrictSkyview Middle SchoolSkyway SolutionsSkyway-Westhill CoalitionSnoqualmie Valley Community Network
Snoqualmie Valley School DistrictSnoValley TilthSociety of St. Vincent de PaulSomali Family Safety Task ForceSomali Health BoardSomali Youth and Family ClubSound DisciplineSound Mental Health, WELS & CHILLS FoundationSouth King County Discipline CoalitionSoutheast Seattle Education Coalition (Tesfa Program)Southeast Youth and Family ServicesSouthwest Youth and Family ServicesSt. Vincent de Paul/Centro Rendu Statewide Poverty Action NetworkStay and PlaySTEM Paths Innovation NetworkStreet YogaSummit Trail Middle SchoolSeattle Urban Native Nonprofits (SUNN)
- Potlatch Fund - Seattle Indian Health Board - Na’ah Illahee Fund - Chief Seattle Club & Native Women’s
Dialog on Infant Mortality - Longhouse Media - National Urban Indian Family Coalition - Native Action Network - Red Eagle Soaring - United Indians of All Tribes Foundation - Urban Native Education Alliance - Duwamish Tribal Services - Northwest Justice Project
Surge Reproductive JusticeSylvester Middle SchoolTahoma School DistrictTeamChildTenants Union of Washington StateTesfa ProgramTherapeutic Health ServicesTillicum Middle School
Tilth AllianceTimbercrest Middle SchoolTiny Trees PreschoolTotem Middle SchoolTrail YouthTransgender Economic Empowerment Coalition (TEEC)
- Gender Diversity - Greater Seattle Business Administration
(GSBA) - Ingersoll Gender Center - POCAAN - UTOPIA Washington
TreehouseTwin Falls Middle SchoolTyee Middle SchoolUnited Indians of All Tribes Foundation University of WashingtonUniversity of Washington School of NursingUniversity of Washington School of Social WorkUniversity of Washington Survey Research DivisionUnkitawaUnleash The BrillianceUpowerUrban Family Center AssociationUrban League of Metropolitan SeattleUrban Native Education AllianceUTOPIA Washington Vashon School DistrictVashon Youth and Family ServicesVerrenti ConsultingVietnamese Friendship AssociationVoices of TomorrowWa Na WariWA-BLOCWalk Away City CollaborativeWAPI Community ServicesWashington Autism Alliance
Washington Dream CoalitionWashington State Charter School AssociationWe.APP (We Act. Present. Perform)Wellspring Family ServicesWest African Community CouncilWestEdWestSide BabyWhite Center Partnership
- Cham Refugees Community - Cambodian Cultural Alliance of
Washington - Education for All - FEEST - Partner in Employment (PIE) - Southwest Youth and Family Services - Trusted Advocates - Village of Hope - White Center Community Development
Association - White Center Food Bank - YES! Foundation of White Center - YWCA
Whitewater Aquatics ManagementWhitman Middle SchoolWithinReachWonderland Child & Family ServicesWorld Mind Creation AcademyWorld ReliefYMCA of Greater SeattleYMCA of Greater Seattle (CCORS)Young Women EmpoweredYouth Eastside ServicesYouthCareYWCAZeno
STRATEGIES INVESTMENTSWELCOME PARTNERSINTRODUCTION EVALUATION
BEST STARTS FOR KIDS 2020 ANNUAL REPORT 101

Making King County a welcoming community where every person can thrive.
401 Fifth Avenue, Suite 500, Seattle, WA 98104
Phone: 206-263-9100 kingcounty.gov/BestStarts
Best Starts for KidsBest Starts for Kids strengthens families and communities so that babies are born healthy, children thrive and establish a strong foundation for life, and young people grow into happy, healthy adults.
MIDD Behavioral Health Sales Tax FundMIDD supports equitable opportunities for health, wellness, connection to community, and recovery for King County residents living with or at risk of behavioral health conditions, through a continuum of care that includes prevention, early intervention, crisis diversion, recovery, and reentry.
Veterans, Seniors and Human Services LevyThe Veterans, Seniors and Human Services Levy connects veterans and servicemembers, residents age 55 or older, and vulnerable populations to affordable housing, employment, behavioral health treatment, and other programs and services that help them, their families, and their caregivers live healthy, productive, and meaningful lives.