2020 annual report - aehr test systems
TRANSCRIPT

2020 Annual Report
Aehr Test Systems
FOX-XP Wafer Level Test & Burn-in System
Production Test and Burn-in of Silicon Carbide Devices for
Electric Vehicles and Silicon Photonics Devices for Data
Center and 5G Infrastructure at Full Wafer Level

(in thousands, except per share data) For the years ended May 31,
2020 2019 2018
Net sales $22,291 $21,056 $29,555
(Loss) income from operations (2,765) (5,000) 915
Net (loss) income attributable to common shareholders (2,802) (5,235) 528
Net (loss) income per share - diluted (0.12) (0.23) 0.02
Cash and cash equivalents 5,433 5,428 16,848
Working capital 13,786 14,522 18,308
Shareholders’ equity 14,056 15,453 19,285
The ABTSTM Advanced Burn-In and Test System is Aehr Test’s family of Test During Burn-In
systems for packaged parts. It is being used for many applications in the mobility and automotive
markets. It can be configured with up to 320 I/O channels and up to 72 Burn-in boards for
testing and burning-in advanced logic devices. It offers an individual device temperature control
option for higher-power applications such as applications processors.
Aehr Test’s patented WaferPak Contactor and DiePak® Carriers connect electrical test
resources from Aehr’s FOX systems to the customer’s wafer or singulated die/modules to be
tested or burned-in. Both products contain micro-miniature probes to contact all the
die/modules in a single insertion.
The FOX-P platform can be used in a wide range of test and reliability screening (burn-in)
applications for high reliability applications, such as automotive, mobile devices, networking,
telecommunications, sensors, photonics and laser devices. The FOXTM-XP Burn-in and Test
System is designed for single-touchdown testing of up to 18 wafers at a time and for testing
singulated die or small modules. The FOX-NP is a low-cost entry-level system to provide a
configuration and price point for companies to do initial production qualification and new
product introduction, enabling an easier transition to the FOX-XP system for high volume
production test. The FOX-CP is a new low-cost single-wafer compact test and reliability
verification solution for logic, memory and photonic devices where test times ranging from
minutes to a few hours or where multiple touchdowns are required to test the entire wafer. It
complements the capabilities of the FOX-XP and FOX-NP systems, which are optimal when
the test time is measured in hours or days and the full wafer can be tested in a single
touchdown.
PRODUCTS
This Annual Report contains certain “forward-looking” statements based on current expectations, forecasts and assumptions that involve risks and
uncertainties. Forward-looking statements include statements relating to future market opportunities and conditions, industry growth and customer
demand for Aehr Test's products. Actual results may differ materially from those stated or implied due to risks and uncertainties. See Aehr Test's recent
10-K report that is part of this Annual Report for a more detailed description of the risks facing our business. Aehr Test disclaims any obligation to
update information contained in any forward-looking statement to reflect events or circumstances occurring after the date of this Annual Report.
FINANCIAL HIGHLIGHTS
The FOX-1P Full Wafer Parallel Test System is designed for massively parallel testing in
wafer sort. By utilizing Design for Testability (DFT) or Built-In Self-Test (BIST) all devices
on a wafer are tested at one time, test costs can be decreased significantly due to the high
throughput of the system, enabling the user to significantly reduce the capital investment
required for high-volume production test.

Dear Shareholders, Customers, Partners, and Employees,
We made substantial progress in fiscal 2020 with our new FOX products for wafer and singulated die test and burn-in. We saw multiple key customers transition to full production using our wafer level burn-in solutions, expanded into additional high growth markets that significantly increase our growth opportunities, and added multiple new Tier 1 customers for our solutions that strengthen our customer base. We also completed a restructuring that streamlined our operations, strengthened our sales and operations capabilities and positioned us to capitalize on the significant market opportunities we see ahead.
We saw multiple silicon photonics customers move to volume production for wafer level and singulated die/module burn-in using our FOX systems for 100% stabilization and/or infant mortality reliability screening of devices. We saw our lead customer for silicon photonics move to full volume production early in the year. We expect them to purchase additional systems in fiscal 2021 and into the future as they continue to maintain or grow their market share and add additional silicon photonics devices. We also saw three different silicon photonics customers move from engineering testing to high volume production test and burn-in of their devices using our FOX-P systems. We expect all three of these customers to ramp production during fiscal 2021, adding capacity in both systems and consumables. Near fiscal year end, we added another new silicon photonics customer that is deploying our FOX-NP system for initial production burn-in and stabilization of their high-performance silicon photonic devices. We expect them to transition to our FOX-XP multi-wafer systems in fiscal 2021 to meet their volume production forecast.
Our solutions are being commercially adopted across multiple high-growth market segments that include silicon photonics, silicon carbide, mobile and automotive sensors. This past fiscal year, we added a significant new customer and expanded our market opportunity with initial orders and successful installation of our first production capacity for silicon carbide devices, adding to the list of key high-growth markets that have recognized the value and feasibility of using our FOX solutions to address their needs. This new silicon carbide application with a Fortune 500 market leader utilizes our FOX multi-wafer system and proprietary WaferPaks for high volume production burn-in and infant mortality screening of silicon carbide devices at wafer level for electric vehicle power modules. This customer forecasts additional capacity needs for our FOX-XP systems during this fiscal year and years into the future.
We see an increasing awareness and adoption rate that we believe could drive the majority of the market for silicon carbide and silicon photonics to move to wafer level or singulated die burn-in within the next few years. The silicon carbide semiconductor device market is growing rapidly, with unit growth of high-power devices at over a 50% CAGR from 2019 to 2025 per a recent report from Yole Développement research. We estimate the total available opportunity for silicon carbide and silicon photonics wafer level and singulated die test markets to be approximately $250 million of needed capacity, including consumables. We are currently engaged with over a dozen potential significant customers for both silicon photonics and silicon carbide applications. We expect several of these potential customers to place initial orders this fiscal year, with ramps into production later this fiscal year or next.
We also see renewed activity and interest for our FOX systems and consumables for several new applications in the 2D and 3D sensor markets, particularly for mobile devices. These sensors are becoming ubiquitous in smartphones and tablets and are forecasted to be adopted in laptops and computers as well. The level of security associated with facial recognition far exceeds fingerprint-
LETTER
T
O
O
U
R
S
H
A
R
E
H
O
L
D
E
R
S

based biometrics and is certainly greater than traditional keyboard entry passwords. These new opportunities in 2D and 3D sensing could add significant upside to our revenue for this fiscal year and next. We added three new Tier 1 customers this past fiscal year, giving us six significantly large customers with applications and market sizes that are each capable of driving sales of $6 million to $10 million or more per year of our FOX wafer level and singulated die test systems and consumables. We also have another seven Tier 2 customers capable of FOX product sales typically within $1 million to $3 million per year each. We are currently working with well over a dozen additional Tier 1 and Tier 2 customers who are considering using our products for high market growth applications, including Silicon Photonics, Silicon Carbide, automotive, and memory devices production burn-in. Several of these companies are expected to place their initial orders this year, with ramps into production later in this fiscal year and/or the following fiscal year. Shipments of our consumables were a significant percentage of revenue this year. As we continue to build our installed base of FOX systems, our WaferPak and DiePak business continues to grow and is becoming a much more significant part of our business. Shipments of our high margin proprietary WaferPak contactors and DiePak carrier consumables for our FOX systems accounted for nearly half of our total revenue in fiscal 2020. For the reliability and burn-in markets we address, we estimate consumables can be up to four times the annual sales of systems. The systems typically are used for longer periods, with annual needs for new contactors and consumables. This is why we are confident that our consumable business is likely to exceed our overall systems business over time, even though both will grow in absolute dollars. We completed our planned restructuring and shifted to higher-margin products. These activities included closing our Japan subsidiary, transitioning our European sales to third party sales representatives, adding key marketing directors, and making additional structural changes to enhance our sales force. We also moved our product offering toward our much higher margin, highly differentiated FOX systems and consumables during the fiscal year. We believe these enhancements improve our efficiency and materially increase our sales activity and bookings going forward, as well as increase our penetration of key customers in our targeted markets. With these changes, we are profitable at much lower revenue numbers and have greater leverage to achieve higher profitability moving forward. We believe we will emerge from the COVID-19 pandemic a stronger company with more customers and markets. While the challenging operating environment and ongoing uncertainties around the COVID pandemic had some adverse impacts on our supply chain and created caution and/or delays with some customer production ramp during the second half of our fiscal 2020, we believe there will be no long term negative impact to our business, the demand for our products, or the potential of the key markets that we serve. We firmly believe we will emerge from this challenging period a stronger company with more production customers, more applications, and higher value products with higher margins. We expect to grow our list of customers this fiscal year in both wafer level, singulated die, and package part markets, and believe we can significantly grow these and new customers in the markets we are already serving. In addition, we are also planning to add new products and enhancements this fiscal year to address some significantly large new markets. Our key customers’ products are being used to build out new data centers, improve data rates and increase storage in data centers, build-out of the 5G infrastructure, enable the newest sensors and technology in smartphones and tablets, enable the widespread adoption of electric and hybrid electric vehicles

and charging stations, and address the insatiable demand for memory and data storage in computing, data centers, mobile devices and hundreds of applications that are keeping the world connected.
With the increase in the number of customers in production using our systems, the new market opportunities we added with new customers this past fiscal year, our move to our higher-margin FOX systems and consumables, and the enhancements we made to our operations and sales capabilities this past year, we believe we are well-positioned to address our new market opportunities going forward. As we move into fiscal 2021, we remain optimistic about growth in systems and consumables within our installed base of customers, as well as expanding the number of customers with our family of FOX-P solutions. And with much lower fixed operating expenses and significantly higher-margin products and services, we expect significant growth in both our top and bottom lines in the coming year.
I continue to be grateful to our employees, customers, partners and shareholders for their support.
Gayn Erickson, President and CEO

1
UNITED STATES SECURITIES AND EXCHANGE COMMISSION
Washington, D. C. 20549
FORM 10-K (Mark One) [X] Annual report pursuant to Section 13 or 15(d) of the Securities Exchange Act of 1934
For the fiscal year ended May 31, 2020 or
[ ] Transition report pursuant to Section 13 or 15(d) of the Securities Exchange Act of 1934 For the transition period from ________________ to ________________
Commission file number: 000-22893.
AEHR TEST SYSTEMS (Exact name of registrant as specified in its charter)
CALIFORNIA 94-2424084 (State or other jurisdiction of (IRS Employer Identification Number) incorporation or organization) 400 KATO TERRACE, FREMONT, CA 94539 (Address of principal executive offices) (Zip Code) Registrant’s telephone number, including area code: (510) 623-9400
Securities registered pursuant to Section 12(b) of the Act:
Title of each class Trading Name of each exchange on which registered
Symbol(s)
Common Stock,
par value $0.01 per share AEHR The NASDAQ Capital Market
Securities registered pursuant to Section 12(g) of the Act: None
Indicate by check mark if the registrant is a well-known seasoned issuer, as defined in Rule 405 of the Securities Act. Yes [ ] No [X] Indicate by check mark if the registrant is not required to file reports pursuant to Section 13 or Section 15(d) of the Securities Act. Yes [ ] No [X] Indicate by check mark whether the registrant (1) has filed all reports required to be filed by Section 13 or 15(d) of the Securities Exchange Act of 1934 during the preceding 12 months (or for such shorter period that the registrant was required to file such reports), and (2) has been subject to such filing requirements for the past 90 days.
Yes [X] No [ ] Indicate by check mark whether the registrant has submitted electronically every Interactive Data File required to be submitted pursuant to Rule 405 of Regulation S-T (§232.405 of this chapter) during the preceding 12 months (or for such shorter period that the registrant was required to submit such files).
Yes [X] No [ ]

2
Indicate by check mark whether the registrant is a large accelerated filer, an accelerated filer, a non-accelerated filer, a smaller reporting company, or an emerging growth company. See the definitions of “large accelerated filer,” “accelerated filer,” “smaller reporting company,” and “emerging growth company” in Rule 12b-2 of the Exchange Act: Large accelerated filer [ ] Accelerated filer [ ] Non-accelerated filer [X] Smaller reporting company [X]
Emerging growth company [ ] If an emerging growth company, indicate by check mark if the registrant has elected not to use the extended
transition period for complying with any new or revised financial accounting standards provided pursuant to Section 13(a) of the Exchange Act. [ ] Indicate by check mark whether the registrant is a shell company (as defined in Rule 12b-2 of the Exchange Act). Yes [ ] No [X] The aggregate market value of the registrant’s common stock, par value $0.01 per share, held by non-affiliates of the registrant, based upon the closing price of $1.89 on November 29, 2019, as reported on the NASDAQ Capital Market, was $38,433,844. For purposes of this disclosure, shares of common stock held by persons who hold more than 5% of the outstanding shares of common stock (other than such persons of whom the Registrant became aware only through the filing of a Schedule 13G filed with the Securities and Exchange Commission) and shares held by officers and directors of the Registrant have been excluded because such persons may be deemed to be affiliates. This determination of affiliate status is not necessarily conclusive for other purposes. The number of shares of registrant’s common stock, par value $0.01 per share, outstanding at July 31, 2020 was 23,291,146.
DOCUMENTS INCORPORATED BY REFERENCE:
Portions of registrant’s Definitive Proxy Statement relating to the Annual Meeting of Stockholders are incorporated by reference into Part III of this Annual Report on Form 10-K where indicated. Such Definitive Proxy Statement will be filed with the Securities and Exchange Commission within 120 days after the end of the registrant’s fiscal year ended May 31, 2020.

3
AEHR TEST SYSTEMS
FORM 10-K FISCAL YEAR ENDED MAY 31, 2020
TABLE OF CONTENTS
PART I
Item 1. Business ................................................................................................................................................................ 4 Item 1A. Risk Factors .......................................................................................................................................................... 10 Item 1B. Unresolved Staff Comments ............................................................................................................................. 17 Item 2. Properties .............................................................................................................................................................. 17 Item 3. Legal Proceedings ............................................................................................................................................... 17 Item 4. Mine Safety Disclosures ..................................................................................................................................... 17
PART II Item 5. Market for Registrant’s Common Equity, Related Stockholder Matters and Issuer Purchases of Equity Securities ..................................................................................................................... 18 Item 6. Selected Consolidated Financial Data ............................................................................................................. 19 Item 7. Management’s Discussion and Analysis of Financial Condition and Results of Operations ................ 21 Item 7A. Quantitative and Qualitative Disclosures about Market Risk ..................................................................... 27 Item 8. Financial Statements and Supplementary Data ............................................................................................. 29 Item 9. Changes in and Disagreements with Accountants on Accounting and Financial Disclosure ............... 57 Item 9A. Controls and Procedures .................................................................................................................................... 57 Item 9B. Other Information ............................................................................................................................................. 57
PART III Item 10. Directors, Executive Officers and Corporate Governance .......................................................................... 58 Item 11. Executive Compensation .................................................................................................................................... 58 Item 12. Security Ownership of Certain Beneficial Owners and Management and Related Stockholder Matters ................................................................................................................................................................ 58 Item 13. Certain Relationships and Related Transactions, and Director Independence ......................................... 58 Item 14. Principal Accountant Fees and Services ........................................................................................................... 58
PART IV Item 15. Exhibits, Financial Statement Schedules .......................................................................................................... 59 Signatures ............................................................................................................................................................... 62

4
This Annual Report on Form 10-K contains forward-looking statements within the meaning of the Section 27A of the Securities Act of 1933, as amended (the Securities Act), and Section 21E of the Securities Exchange Act of 1934, as amended (the Exchange Act). All statements contained in this Annual Report on Form 10-K other than statements of historical fact, including statements regarding our future results of operations and financial position, our business strategy and plans, and our objectives for future operations, are forward-looking statements. The words “believe,” “may,” “will,” “estimate,” “continue,” “anticipate,” “plan,” “intend,” “expect,” “could,” “target,” “project,” “should,” “predict,” “potential,” “would,” “seek” and similar expressions and the negative of those expressions are intended to identify forward-looking statements. These forward-looking statements are subject to a number of risks, uncertainties and assumptions that are difficult to predict. Therefore, actual results may differ materially and adversely from those expressed in any forward-looking statements. These risks include but are not limited to those factors identified in “Risk Factors” beginning on page 10 of this Annual Report on Form 10-K, those factors that we may from time to time identify in our periodic filings with the Securities and Exchange Commission, as well as other factors beyond our control. We undertake no obligation to revise or update publicly any forward-looking statements for any reason. Unless the context requires otherwise, references in this Form 10-K to “Aehr Test,” the “Company,” “we,” “us” and “our” refer to Aehr Test Systems. Investors and others should note that we announce material financial information to our investors using our investor relations website (https://www.aehr.com/investor-relations/), SEC filings, press releases, public conference calls and webcasts. We use these channels to communicate with our investors and the public about our company, our products and services and other issues. It is possible that the information we post on our investor relations website could be deemed to be material information. Therefore, we encourage investors, the media, and others interested in our company to review the information we post on our investor relations website.
PART I
Item 1. Business THE COMPANY Aehr Test was incorporated in the state of California on May 25, 1977. We develop, manufacture and sell systems that are designed to reduce the cost of testing and to perform reliability screening and stress testing, burn-in or cycling, of homogeneous and heterogenous logic and memory integrated circuits (ICs), sensors and optical devices. These systems can be used to simultaneously perform parallel testing and burn-in of packaged ICs, singulated bare die or ICs still in wafer form. The expanding automotive, mobility, networking, and telecommunications markets require ICs that meet increased quality and reliability specifications. To meet these needs, IC manufacturers are increasing capacity and performing additional testing and burn-in of their products, creating opportunities for Aehr Test products in package and wafer-level testing. Leveraging its expertise as a long-time leading provider of burn-in equipment, and having installed over 2,500 systems worldwide, the Company has developed and introduced several innovative product families, including the ABTSTM and FOXTM systems, the WaferPakTM contactor and the DiePak® carrier. The latest ABTS family of packaged part burn-in and test systems can perform test during burn-in of complex devices, such as digital signal processors, microprocessors, microcontrollers, memory and systems-on-a-chip, and offers individual temperature control for high-power advanced logic devices. The FOX systems are full wafer contact parallel test and burn-in systems designed to make contact with all pads of a wafer simultaneously, thus enabling full wafer parallel test and burn-in. They are also used for parallel test and burn-in of singulated die or very small multi-IC modules. The WaferPak contactor includes a full-wafer probe card for use in testing wafers in FOX systems. The DiePak carrier is a reusable, temporary package that enables IC manufacturers to perform cost-effective test and burn-in of singulated bare die or very small multi-IC modules. INDUSTRY BACKGROUND Semiconductor manufacturing is a complex, multi-step process, and defects or weaknesses that may result in the failure of an IC may be introduced at any process step. Failures may occur immediately or at any time during the operating life of an IC, sometimes after several months of normal use. Semiconductor manufacturers rely on testing and reliability screening to identify and eliminate defects that occur during the manufacturing process. Testing and reliability screening involve multiple steps. The first set of tests is typically performed by IC manufacturers before the processed semiconductor wafer is cut into individual die, in order to avoid the cost of packaging defective die into their packages. This “wafer probe” testing can be performed on one or many die at a time, including testing the entire wafer at once. Most leading-edge microprocessors, microcontrollers, digital signal processors, memory ICs, sensors and optical devices (such as vertical-cavity surface-emitting lasers, or VCSELs) then undergo an extensive reliability screening and stress testing procedure known as burn-in or cycling, depending on the application. This can either be done at the wafer level, before the die are packaged, or at the package level, after the die are packaged. The burn-in process screens for early failures by operating the IC at elevated voltages and temperatures, at

5
up to 150 degrees Celsius (302 degrees Fahrenheit) or higher. Depending upon the application, the burn-in times can range anywhere from minutes and hours to days. A typical burn-in system can process thousands of ICs simultaneously. After burn-in, the ICs undergo a final test process using automatic test equipment, or testers. For example, this cycling process screens flash memory devices for failure to meet write/erase cycling endurance requirements. PRODUCTS The Company manufactures and markets full wafer contact test systems, test during burn-in systems, test fixtures and related accessories. All of the Company’s systems are platform-based systems with a portfolio of current, voltage, digital and thermal capabilities, allowing them to be configured with optional features to meet customer requirements. Systems can be configured for use in production applications, where capacity, throughput and price are most important, or for reliability engineering and quality assurance applications, where performance and flexibility, such as extended temperature ranges, are essential. FULL WAFER CONTACT SYSTEMS The FOX-XP test and burn-in system, introduced in July 2016, is designed for devices in wafer, singulated die, and module form that require test and burn-in times typically measured in hours to days. The FOX-XP system can test and burn-in up to 18 wafers at a time. For high reliability applications, such as automotive, mobile devices, networking, telecommunications, sensors, and solid-state devices, the FOX-XP system is a cost-effective solution for producing tested and burned-in die for use in multi-chip packages. Using Known-Good Die, or KGD, which are fully burned-in and tested die, in multi-chip packages helps assure the reliability of the final product and lowers costs by increasing the yield of high-cost multi-chip packages. Wafer-level burn-in and test enables lower cost production of KGD for multi-chip modules, 3-D stacked packages and systems-in-a-package. The FOX-P platform has been extended for burn-in and test of small multi-die modules by using DiePak carriers. The DiePak carrier with its multi-module sockets and high wattage dissipation capabilities has a capacity of hundreds of die or modules, much higher than the capacity of a traditional burn-in system with traditional single-device sockets and heat sinks. This capability was introduced in March 2017. The FOX-NP was introduced in January 2019 and is a low-cost entry-level system to provide a configuration and price point for companies to do initial production qualification and new product introduction, enabling an easier transition to the FOX-XP system for high volume production test. The FOX-NP system is 100% compatible with the FOX-XP system and is configurable with up to two slot assemblies per system compared to up to 18 slot assemblies in the FOX-XP system. The FOX-CP was introduced in February 2019 and is a new low-cost single-wafer compact test and reliability verification solution for logic, memory and photonic devices. The FOX-CP reduces test cost by functionally testing wafers during reliability screening to identify failing logic, memory or photonic die before the die are integrated into their final package, and is optimal for test times ranging from minutes to a few hours or where multiple touchdowns are required to test the entire wafer. The FOX-CP includes an integrated prober which is equipped with optics for automatic pattern recognition so that the wafer is aligned properly for the testing process. It complements the capabilities of the FOX-XP and FOX-NP systems, which are optimal when the test time is measured in hours or days and the full wafer can be tested in a single touchdown. The FOX-1P full wafer parallel test system, introduced in October 2014, is designed for massively parallel test of devices at wafer level. The FOX-1P system is designed to make electrical contact to and test all of the die on a wafer in a single touchdown. The FOX-1P test head and WaferPak contactor are compatible with industry-standard 300 mm wafer probers, which provide the wafer handling and alignment automation for the FOX-1P system. The FOX-1P pattern generator is designed to functionally test industry-standard memory devices such as flash and DRAMs, plus it is optimized to test memory or logic ICs that incorporate design for testability, or DFT, and built-in self-test, or BIST. The FOX-1P universal per-pin architecture is designed to provide per-pin electronics and per-device power supplies and is tailored to full-wafer functional test. The Company believes that the FOX-1P system can significantly reduce the cost of testing IC wafers. The Company’s FOX-1P system was partially funded through a development agreement with a leading semiconductor manufacturer. The Company received the first production order of this new system and shipped the first system in July 2016. The FOX-15 full wafer parallel test system, the predecessor to the FOX-XP system, was introduced in October 2007 and was designed for full-wafer test and burn-in. The FOX-15 system is nearing the end of its lifecycle and limited shipments are expected in the future.

6
One of the key components of the FOX systems is the patented WaferPak contactor system. The WaferPak contactor contains a full-wafer single-touchdown probe card which is easily removable from the system. Traditional probe cards contact only a portion of the wafer, requiring multiple touchdowns to test the entire wafer. The unique design is intended to accommodate a wide range of contactor technologies so that the contactor technology can evolve along with the changing requirements of the customer’s wafers. The WaferPak contactors are custom designed for each device type, each of which has a typical lifetime of 2 to 7 years, depending on the device life cycle. Therefore, multiple sets of WaferPak contactors could be purchased over the life of a FOX system. A key new component of the FOX-XP and FOX-NP systems is the patented DiePak carrier system. The DiePak carrier contains many multi-module or die sockets with very fine-pitch probes which are easily removable from the system. Traditional sockets contact only a single device, requiring multiple large numbers of sockets and burn-in boards to test a production lot of devices. The unique design accommodates a wide range of socket sizes and densities so that the DiePak carrier technology can evolve along with the changing requirements of the customer’s devices. The DiePak carriers are custom designed for each device type, each of which has a typical lifetime of 2 to 7 years, depending on the device life cycle. Therefore, multiple sets of DiePak carriers could be purchased over the life of a FOX-XP or FOX-NP system. Another key component of our FOX-XP, FOX-NP and FOX-15 test cell is the WaferPak Aligner. The WaferPak Aligner performs alignment of the customer’s wafer to the WaferPak contactor so that the wafer can be tested and burned-in by the FOX-XP, FOX-NP and FOX-15 systems. The Company offers an automated aligner for high volume production applications, which can support several FOX-XP, FOX-NP or FOX-15 systems, and a manual aligner for low volume production or engineering applications. Similar to the WaferPak Aligner for WaferPak contactors, the Company offers the DiePak Loader for DiePak carriers. The DiePak Loader performs automatic loading of the customer’s modules to the DiePak carrier so that the modules can be tested and burned-in by the FOX-XP and FOX-NP system. Typically, one DiePak Loader can support several FOX-XP or FOX-NP systems. Net sales of full wafer contact product lines, systems, WaferPak contactors, DiePaks and services for fiscal 2020, 2019 and 2018 were $19.8 million, $14.6 million, and $13.1 million, respectively, and accounted for approximately 89%, 69% and 44% of the Company’s net sales in fiscal 2020, 2019 and 2018, respectively. SYSTEMS FOR PACKAGED PARTS Test during burn-in, or TDBI, systems consist of several subsystems: pattern generation and test electronics, control software, network interface and environmental chamber. The test pattern generator allows duplication of most of the functional tests performed by a traditional tester. Pin electronics at each burn-in board, or BIB, position are designed to provide accurate signals to the ICs being tested and detect whether a device is failing the test. Devices being tested are placed on BIBs and loaded into environmental chambers which typically operate at temperatures from 25 degrees Celsius (77 degrees Fahrenheit) up to 150 degrees Celsius (302 degrees Fahrenheit). Using our optional chambers, our systems can produce temperatures as low as -55 degrees Celsius (-67 degrees Fahrenheit). A single BIB can hold up to several hundred ICs, and a production chamber holds up to 72 BIBs, resulting in thousands of memory or logic devices being tested in a single system. The Advanced Burn-in and Test System, or ABTS, was introduced in fiscal 2008. Several updates to the ABTS system have been made since its introduction, including the ABTS-P system released in 2012. The ABTS family of products is based on a hardware and software architecture that is intended to address not only today’s devices, but also future devices for many years to come. The ABTS system can test and burn-in both high-power logic and low-power ICs. It can be configured to provide individual device temperature control for devices up to 70W or more and with up to 320 I/O channels. Net sales of packaged part product lines, systems and services for fiscal 2020, 2019 and 2018 were $2.5 million, $6.4 million, and $16.5 million, respectively, and accounted for approximately 11%, 31% and 56% of the Company’s net sales in fiscal 2020, 2019 and 2018, respectively. TEST FIXTURES The Company sells, and licenses others to manufacture and sell, custom-designed test fixtures for its systems. The test fixtures include BIBs for its packaged part burn-in systems. These test fixtures hold the devices undergoing test or burn-in and electrically connect the devices under test to the system electronics. The capacity of each test fixture depends on the type of device being tested or burned-in, ranging from several hundred in memory production to as few as eight for high pin-count complex Application Specific Integrated Circuits, or ASICs, or microprocessor devices. Test

7
fixtures are sold both with new Aehr Test systems and for use with the Company’s installed base of systems. Test fixtures are also available from third-party suppliers. The Company has received patents or applied for patents on certain features of the FOX and ABTS test fixtures. The Company has licensed or authorized several other companies to provide BIBs from which the Company receives royalties. Royalties and revenue for the test fixtures product category accounted for less than 1% of net sales in fiscal 2020, 2019 and 2018. CUSTOMERS The Company markets and sells its products throughout the world to semiconductor manufacturers, semiconductor contract assemblers, electronics manufacturers and burn-in and test service companies. Sales to the Company’s five largest customers accounted for approximately 87%, 80%, and 86% of its net sales in fiscal 2020, 2019 and 2018, respectively. During fiscal 2020, Intel Corporation, or Intel, ON Semiconductor Korea, Ltd., or ON Semiconductor and STMicroelectronics, Inc., or STMicroelectronics, accounted for approximately 43%, 16% and 15%, respectively, of the Company’s net sales. During fiscal 2019, Intel, Texas Instruments Incorporated, or Texas Instruments, Cypress Semiconductor Corporation, or Cypress Semiconductor, and STMicroelectronics, Inc. accounted for approximately 36%, 14%, 12% and 10%, respectively, of the Company’s net sales. During fiscal 2018, Texas Instruments, STMicroelectronics, and Astronics Test Systems, Inc., or Astronics Test Systems, accounted for approximately 34%, 26% and 13%, respectively, of the Company’s net sales. No other customers accounted for more than 10% of the Company’s net sales for any of these periods. The Company expects that sales of its products to a limited number of customers will continue to account for a high percentage of net sales for the foreseeable future. In addition, sales to particular customers may fluctuate significantly from quarter to quarter. Such fluctuations may result in changes in utilization of the Company’s facilities and resources. The loss of or reduction or delay in orders from a significant customer or a delay in collecting or failure to collect accounts receivable from a significant customer could materially and adversely affect the Company’s business, financial condition and operating results. MARKETING, SALES AND CUSTOMER SUPPORT The Company has sales and service operations in the United States and Taiwan, dedicated service resources in Germany, China, South Korea, and the Philippines, and has established a network of distributors and sales representatives in certain key parts of the world. In fiscal 2020, the Company moved to a sales representative distributorship model for sales in Japan and Germany, substantially closing its subsidiary in Japan, see Note 16, “Restructuring,” of the Notes to Consolidated Financial Statements, and eliminating the direct sales staff at its Germany subsidiary. See “REVENUE RECOGNITION” in Item 7 under “Management’s Discussion and Analysis of Financial Condition and Results of Operations” for a further discussion of the Company’s relationship with distributors, and its effects on revenue recognition. The Company’s customer service and support program includes system installation, system repair, applications engineering support, spare parts inventories, customer training and documentation. The Company has applications engineering and field service personnel located near and sometimes co-located at our customers and includes resources at the corporate headquarters in Fremont, California, at customer locations in Texas, at the Company’s subsidiary in Germany, at its branch office in Taiwan, and also through 3rd party agreements in China, South Korea, and the Philippines. The Company’s distributors provide applications and field service support in other parts of the world. The Company customarily provides a warranty on its products. The Company offers service contracts on its systems directly and through its subsidiaries, distributors and representatives. The Company believes that maintaining a close relationship with customers and providing them with ongoing engineering support improves customer satisfaction and will provide the Company with a competitive advantage in selling its products to the Company’s customers. BACKLOG At May 31, 2020, the Company’s backlog was $2.5 million compared with $7.5 million at May 31, 2019. The Company’s backlog consists of product orders for which confirmed purchase orders have been received and which are scheduled for shipment within 12 months. Due to the possibility of customer changes in delivery schedules or cancellations and potential delays in product shipments or development projects, the Company’s backlog as of a particular date may not be indicative of net sales for any succeeding period. RESEARCH AND PRODUCT DEVELOPMENT The Company historically has devoted a significant portion of its financial resources to research and development programs and expects to continue to allocate significant resources to these efforts. Certain research and development expenditures related to non-recurring engineering milestones have been transferred to cost of goods sold, reducing

8
research and development expenses. The Company’s research and development expenses during fiscal 2020, 2019 and 2018 were $3.4 million, $4.2 million and $4.2 million, respectively. The Company conducts ongoing research and development to design new products and to support and enhance existing product lines. Building upon the expertise gained in the development of its existing products, the Company has developed the FOX family of systems for performing test and burn-in of entire processed wafers, and burn-in of devices in singulated die and module form, including the FOX-NP and FOX-CP systems released during fiscal 2019. The Company is developing enhancements to the ABTS and FOX families of products, intended to improve the capability and performance for testing and burn-in of future generation devices and provide the flexibility in a wide variety of applications. MANUFACTURING The Company assembles its products from components and parts manufactured by others, including environmental chambers, power supplies, metal fabrications, printed circuit assemblies, ICs, burn-in sockets, high-density interconnects, wafer contactors and interconnect substrates. The Company’s strategy is to use in-house manufacturing only when necessary to protect a proprietary process or when a significant improvement in quality, cost or lead time can be achieved and relies on subcontractors to manufacture many of the components and subassemblies used in its products. Final assembly and testing are performed at the Company’s principal manufacturing facility located in Fremont, California. COMPETITION The semiconductor equipment industry is intensely competitive. Significant competitive factors in the semiconductor equipment market include price, technical capabilities, quality, flexibility, automation, cost of ownership, reliability, throughput, product availability and customer service. In each of the markets it serves, the Company faces competition from established competitors and potential new entrants, many of which have greater financial, engineering, manufacturing and marketing resources than the Company. The Company’s FOX full wafer contact systems face competition from larger systems manufacturers that have significant technological know-how and manufacturing capability. Competing suppliers of full wafer contact systems include Advantest Corporation, Chroma ATE Inc., Teradyne Inc., Micronics Japan Co., Ltd., and Tokyo Electron Limited. The Company’s ABTS TDBI systems face increasingly severe competition, especially from several regional, low-cost manufacturers and from systems manufacturers that offer higher power dissipation per device under test. Some users of such systems, such as independent test labs, build their own burn-in systems, while others, particularly large IC manufacturers in Asia, acquire burn-in systems from captive or affiliated suppliers. The market for burn-in systems is highly fragmented, with many domestic and international suppliers. Competing suppliers of burn-in and functional test systems that compete with ABTS systems include Dong-Il Corporation, Micro Control Company, Incal Technology and Advantest Corporation. The Company’s WaferPak products are facing and are expected to face increasing competition. Several companies have developed or are developing full-wafer and single-touchdown probe cards. As the full-wafer test market develops, the Company expects that other competitors will emerge. The primary competitive factors in this market are cost, performance, reliability and assured supply. Competing suppliers of full-wafer probe cards include FormFactor, Inc., Japan Electronic Materials Corporation and Micronics Japan Co., Ltd. The Company’s test fixture products face numerous regional competitors. There are limited barriers to entry into the BIB market, and as a result, many companies design and manufacture BIBs, including BIBs for use with the Company’s packaged part systems. The Company has granted royalty-bearing licenses to several companies to make BIBs for use with the Company’s packaged part systems and the Company may grant additional licenses as well. Sales of BIBs by licensees result in royalties to the Company. The Company expects that its DiePak products for burning-in and testing multiple singulated die and small modules face significant competition. The Company believes that several companies have developed or are developing products which are intended to enable test and burn-in of multiple bare die, and small modules. The Company expects that other competitors will emerge. The Company expects that the primary competitive factors in this market will be cost, performance, reliability and assured supply. Suppliers with products that compete with our single die DiePak products include Chroma ATE Inc. The Company expects its competitors to continue to improve the performance of their current products and to introduce new products with improved price and performance characteristics. New product introductions by the

9
Company’s competitors or by new market entrants could cause a decline in sales or loss of market acceptance of the Company’s products. The Company has observed price competition in the systems market, particularly with respect to its less advanced products. Increased competitive pressure could also lead to intensified price-based competition, resulting in lower prices which could adversely affect the Company’s operating margins and results. The Company believes that to remain competitive it must invest significant financial resources in new product development and expand its customer service and support worldwide. There can be no assurance that the Company will be able to compete successfully in the future. PROPRIETARY RIGHTS The Company relies primarily on the technical and creative ability of its personnel, its proprietary software, and trade secrets and copyright protection, rather than on patents, to maintain its competitive position. The Company’s proprietary software is copyrighted and licensed to the Company’s customers. At May 31, 2020, the Company held 54 issued United States patents with expiration date ranges from 2022 to 2038 and had several additional United States patent applications and foreign patent applications pending. The Company’s ability to compete successfully is dependent in part upon its ability to protect its proprietary technology and information. Although the Company attempts to protect its proprietary technology through patents, copyrights, trade secrets and other measures, there can be no assurance that these measures will be adequate or that competitors will not be able to develop similar technology independently. Further, there can be no assurance that claims allowed on any patent issued to the Company will be sufficiently broad to protect the Company’s technology, that any patent will be issued to the Company from any pending application or that foreign intellectual property laws will protect the Company’s intellectual property. Litigation may be necessary to enforce or determine the validity and scope of the Company’s proprietary rights, and there can be no assurance that the Company’s intellectual property rights, if challenged, will be upheld as valid. Any such litigation could result in substantial costs and diversion of resources and could have a material adverse effect on the Company’s business, financial condition and operating results, regardless of the outcome of the litigation. In addition, there can be no assurance that any of the patents issued to the Company will not be challenged, invalidated or circumvented or that the rights granted thereunder will provide competitive advantages to the Company. Also, there can be no assurance that the Company will have the financial resources to defend its patents from infringement or claims of invalidity. There are currently no pending claims against the Company regarding infringement of any patents or other intellectual property rights of others. However, the Company may, from time to time, receive communications from third parties asserting intellectual property claims against the Company. Such claims could include assertions that the Company’s products infringe, or may infringe, the proprietary rights of third parties, requests for indemnification against such infringement or suggest the Company may be interested in acquiring a license from such third parties. There can be no assurance that any such claim made in the future will not result in litigation, which could involve significant expense to the Company, and, if the Company is required or deems it appropriate to obtain a license relating to one or more products or technologies, there can be no assurance that the Company would be able to do so on commercially reasonable terms, or at all. EMPLOYEES As of May 31, 2020, the Company, including its foreign subsidiaries and one branch office, employed 71 persons collectively, on a full-time basis, of whom 17 were engaged in research, development and related engineering, 25 were engaged in manufacturing, 21 were engaged in marketing, sales and customer support and 8 were engaged in general administration and finance functions. In addition, the Company from time to time employs a number of contractors and part-time employees, particularly to perform customer support and manufacturing. The Company’s success is in part dependent on its ability to attract and retain highly skilled workers, who are in high demand. None of the Company’s employees are represented by a union and the Company has never experienced a work stoppage. The Company’s management considers its relations with its employees to be good. BUSINESS SEGMENT DATA AND GEOGRAPHIC AREAS The Company operates in a single business segment, the designing, manufacturing and marketing of advanced test and burn-in products to the semiconductor manufacturing industry in several geographic areas. Selected financial information, including net sales and property and equipment, net for each of the last three fiscal years, by geographic area is included in Part II, Item 8, Note 2 “REVENUE” and Note 15 “SEGMENT INFORMATION” and certain risks related to such operations are discussed in Part I, Item 1A, Risk Factors, under the heading “We sell our products and services worldwide, and our business is subject to risks inherent in conducting business activities in geographic regions outside of the United States.”

10
AVAILABLE INFORMATION The Company’s common stock trades on the NASDAQ Capital Market under the symbol “AEHR.” The Company’s annual report on Form 10-K, quarterly reports on Form 10-Q, current reports on Form 8-K and amendments to these reports that are filed with the United States Securities and Exchange Commission, or SEC, pursuant to Section 13(a) or 15(d) of the Exchange Act, are available free of charge through the Company’s website at www.aehr.com as soon as reasonably practicable after we electronically file them with, or furnish them to the SEC. The public may read and copy any materials filed by the Company with the SEC at the SEC’s Public Reference Room at 100 F Street, NE, Washington, DC 20549. The public may obtain information on the operations of the Public Reference Room by calling the SEC at 1-800-SEC-0330. The SEC maintains an Internet site, www.sec.gov, that contains reports, proxy and information statements and other information regarding issuers that file electronically with the SEC. In addition, information regarding the Company’s code of conduct and ethics and the charters of its Audit, Compensation and Nominating and Governance Committees, are available free of charge on the Company’s website listed above. Item 1A. Risk Factors You should carefully consider the risks described below. These risks are not the only risks that we may face. Additional risks and uncertainties that we are unaware of, or that we currently deem immaterial, also may become important factors that affect us. If any of the following risks occur, our business, financial condition or results of operations could be materially and adversely affected which could cause our actual operating results to differ materially from those indicated or suggested by forward-looking statements made in this Annual Report on Form 10-K or presented elsewhere by management from time to time. The effects of the COVID-19 pandemic have disrupted, and may continue to significantly disrupt, our operations, including our ability to manufacture and supply products and perform research and development activities, and our customers’ usage of our products, all of which have had and are expected to continue to have a material and adverse effect on our business, future revenues and financial condition. We are unable to predict the extent to which the pandemic and related impacts will continue to adversely impact our business operations, financial performance, results of operations and the achievement of our strategic objectives. Our business, results of operation and financial performance have been negatively impacted by the COVID-19 pandemic and related public health responses, such as shelter-in-place orders, social distancing protocols, and travel restrictions in many of the countries and regions in which we have operations or manufacturing partners. Due to these impacts and measures, we have experienced and may continue to experience significant and unpredictable reductions in the demand for our products. In addition, our customers may delay, cancel or redirect planned capital expenditures in order to focus resources differently during or as a result of the COVID-19 pandemic. The effects of this outbreak on our business has included and could continue to include disruptions or restrictions on our employees’ ability to travel in affected regions, as well as temporary closures of the facilities of our suppliers, customers, or other vendors in our supply chain, which could impact our business, interactions and relationships with our customers, third-party suppliers and contractors, and results of operations. As a result of the COVID-19 outbreak around the world, we implemented certain travel restrictions, temporarily limited the number of employees permitted onsite in our offices and implemented work-from-home rules. This has caused disruption and delays in our ability to operate and manufacture, test and assemble products in our internal facilities, and has limited our ability to continue certain research and development activities which could materially and adversely affect our ability to develop or deliver products on the timelines we previously anticipated.
The COVID-19 pandemic has created economic uncertainty and volatility in the financial markets around the world, resulting in an economic downturn that has affected and will likely continue to affect demand for our products and impact our results of operations. As a result, this may lead to a period of regional, national, and global economic slowdown or regional, national, or global recessions that would curtail or delay spending by semiconductor manufacturers and contract assemblers and affect demand for our products as well as increase the risk of customer defaults or delays in payments. Our customers may delay or cancel orders for our products due to bankruptcy, lack of liquidity, lack of funding, operational failures, or other reasons. The ultimate impact of the COVID-19 pandemic on our operations and financial performance depends on many factors that are not within our control, including, but not limited, to: government’s, business’ and individuals’ actions that have been and continue to be taken in response to the pandemic (including restrictions on travel and transport and workforce pressures); the impact of the pandemic and actions taken in response to global and regional economies, travel, and economic activity; the availability of federal, state, local or non-U.S. funding programs; general economic uncertainty in key global markets and financial market volatility;

11
global economic conditions and levels of economic growth; and the pace of recovery when the COVID-19 pandemic subsides. Although the magnitude of the impact of COVID-19 on our business operations remains uncertain and difficult to predict, and this remains a highly dynamic situation, we have experienced and will continue to experience in subsequent periods, disruptions to our business that will likely continue to impact our business, financial condition and results of operations. We have incurred indebtedness under the CARES Act which may be subject to audit, may not be forgivable and may eventually have to be repaid. Any repayment of such indebtedness may limit the funds available to us and may restrict our flexibility in operating our business or otherwise adversely affect our results of operations. On April 23, 2020, we received proceeds of $1,679,000 from a loan (the PPP Loan) pursuant to the Paycheck Protection Program (PPP), established under the Coronavirus Aid, Relief, and Economic Security Act (CARES Act). The proceeds were used to retain employees, maintain payroll and make lease and utility payments. All or a portion of the PPP Loan may be forgiven by the Small Business Administration (the SBA). We may submit a loan forgiveness application any time on or before the maturity date of the loan if we have used all of the loan proceeds for which we are requesting forgiveness. Under the CARES Act and pursuant to the note agreement, loan forgiveness is available for the sum of documented payroll costs, covered rent payments, covered mortgage interest and covered utilities during the eight week or twenty-four week periods beginning on the date of loan approval. Not more than 25% of the forgiven amount may be for non-payroll costs. The amount of the PPP Loan eligible to be forgiven is reduced if our full-time headcount declines or if salaries and wages for employees with salaries of $100,000 or less annually are reduced by more than 25%. Under the CARES Act, we will be required to repay any portion of the outstanding principal that is not forgiven, along with accrued interest, and we cannot provide any assurance that we will be eligible for loan forgiveness or that any amount of the PPP Loan will ultimately be forgiven by the SBA. Any such repayment of the PPP Loan will reduce the funds available to us for working capital, capital expenditures, and other corporate purposes and may limit our ability to obtain additional financing for working capital, capital expenditures, expansion plans, and other investments or divert funds that are otherwise necessary to run our business. The SBA has the right to audit our eligibility for and compliance with the requirements of the PPP and we cannot predict the outcome of any such audit despite our belief that we were eligible for the PPP Loan and entitled to forgiveness. On April 23, 2020, the SBA issued guidance stating that it is unlikely that a public company with substantial market value and access to capital markets will be able to make the required certification in good faith. The lack of clarity regarding loan eligibility under the CARES Act PPP has resulted in significant media coverage and controversy with respect to public companies applying for and receiving loans. If, despite our good-faith belief that we satisfied all eligible requirements for the PPP Loan, we are later determined to have violated any of the laws or governmental regulations that apply to us in connection with the PPP Loan, such as the False Claims Act, or it is otherwise determined that we were ineligible to receive the PPP Loan, we may be subject to penalties, including significant civil, criminal and administrative penalties, and could be required to repay the PPP Loan in its entirety. In addition, our receipt of the PPP Loan may result in adverse publicity and damage to our reputation, and a review or audit by the SBA or other government entity or claims under the False Claims Act could consume significant financial and management resources. We generate a large portion of our sales from a small number of customers. If we were to lose one or more of our large customers, operating results could suffer dramatically. The semiconductor manufacturing industry is highly concentrated, with a relatively small number of large semiconductor manufacturers and contract assemblers accounting for a substantial portion of the purchases of semiconductor equipment. Sales to our five largest customers accounted for approximately 87%, 80%, and 86% of our net sales in fiscal 2020, 2019 and 2018, respectively. During fiscal 2020, Intel, ON Semiconductor and STMicroelectronics, accounted for approximately 43%, 16% and 15%, respectively, of the Company’s net sales. During fiscal 2019, Intel, Texas Instruments, Cypress Semiconductor and STMicroelectronics, accounted for approximately 36%, 14%, 12% and 10%, respectively, of the Company’s net sales. During fiscal 2018, Texas Instruments, STMicroelectronics, and Astronics Test Systems, accounted for approximately 34%, 26% and 13%, respectively, of the Company’s net sales. No other customers accounted for more than 10% of our net sales for any of these periods. We expect that sales of our products to a limited number of customers will continue to account for a high percentage of our net sales for the foreseeable future. In addition, sales to particular customers may fluctuate significantly from quarter to quarter. The loss of, or reduction or delay of, an order or orders from a significant customer or customers, or a delay in collecting or failure to collect accounts receivable from a significant customer or customers, could adversely affect our business, financial condition and operating results.

12
The semiconductor equipment industry is intensely competitive. In each of the markets we serve, we face competition from established competitors and potential new entrants, many of which have greater financial, engineering, manufacturing and marketing resources than us. Our FOX wafer-level and singulated die/module test and burn in systems face competition from larger systems manufacturers that have significant technological know-how and manufacturing capability. Our ABTS TDBI systems have faced and are expected to continue to face increasingly severe competition, especially from several regional, low-cost manufacturers and from systems manufacturers that offer higher power dissipation per device under test. Some users of such systems, such as independent test labs, build their own burn-in systems, while others, particularly large IC manufacturers in Asia, acquire burn-in systems from captive or affiliated suppliers. Our WaferPak products are facing and are expected to face increasing competition. Several companies have developed or are developing full-wafer and single-touchdown probe cards. We expect our competitors to continue to improve the performance of their current products and to introduce new products with improved price and performance characteristics. New product introductions by our competitors or by new market entrants could cause a decline in sales or loss of market acceptance of our products. We have observed price competition in the systems market, particularly with respect to its less advanced products. Increased competitive pressure could also lead to intensified price-based competition, resulting in lower prices which could adversely affect our operating margins and results. We believe that to remain competitive we must invest significant financial resources in new product development and expand our customer service and support worldwide. There can be no assurance that we will be able to compete successfully in the future. We rely on increasing market acceptance for our FOX system, and we may not be successful in attracting new customers or maintaining our existing customers. A principal element of our business strategy is to increase our presence in the test equipment market through system sales in our FOX wafer-level and singulated die/module test and burn-in product family. The market for the FOX systems is in the early stages of development. Market acceptance of the FOX system is subject to a number of risks. Before a customer will incorporate the FOX system into a production line, lengthy qualification and correlation tests must be performed. We anticipate that potential customers may be reluctant to change their procedures in order to transfer burn-in and test functions to the FOX system. Initial purchases are expected to be limited to systems used for these qualifications and for engineering studies. Market acceptance of the FOX system also may be affected by a reluctance of IC manufacturers to rely on relatively small suppliers such as us. As is common with new complex products incorporating leading-edge technologies, we may encounter reliability, design and manufacturing issues as we begin volume production and initial installations of FOX systems at customer sites. The failure of the FOX system to achieve increased market acceptance would have a material adverse effect on our future operating results, long-term prospects and our stock price. We rely on continued market acceptance of our ABTS system and our ability to complete certain enhancements. Continued market acceptance of the ABTS family is subject to a number of risks. It is important that we achieve customer acceptance, customer satisfaction and increased market acceptance as we add new features and enhancements to the ABTS product. To date, we have shipped ABTS systems to customers worldwide for use in both reliability and production applications. We have had a strengthening of ABTS product sales in fiscal 2018 and 2017. In fiscal 2019 and 2020, our ABTS product sales decreased significantly from fiscal 2018, which adversely affected our operating results. The failure to grow revenues of the ABTS family above current levels could have a material adverse effect on our future operating results. A substantial portion of our net sales is generated by relatively small volume, high value transactions. We derive a substantial portion of our net sales from the sale of a relatively small number of systems which typically range in purchase price from approximately $300,000 to well over $1 million per system. As a result, the loss or deferral of a limited number of system sales could have a material adverse effect on our net sales and operating results in a particular period. Most customer purchase orders are subject to cancellation or rescheduling by the customer with limited penalties, and, therefore, backlog at any particular date is not necessarily indicative of actual sales for any succeeding period. From time to time, cancellations and rescheduling of customer orders have occurred, and delays by our suppliers in providing components or subassemblies to us have caused delays in our shipments of our own products. There can be no assurance that we will not be materially adversely affected by future cancellations or rescheduling by our customers or other delays in our shipments. For non-standard products where we have not effectively demonstrated the ability to meet specifications in the customer environment, we defer revenue until we have met such customer specifications. Any delay in meeting customer specifications could have a material adverse effect on our operating results. A substantial portion of net sales typically are realized near the end of each quarter. A delay or reduction in

13
shipments near the end of a particular quarter, due, for example, to unanticipated shipment rescheduling, cancellations or deferrals by customers, customer credit issues, unexpected manufacturing difficulties experienced by us or delays in deliveries by suppliers, could cause net sales in a particular quarter to fall significantly. We may experience increased costs associated with new product introductions. As is common with new complex products incorporating leading-edge technologies, we have encountered reliability, design and manufacturing issues as we began volume production and initial installations of certain products at customer sites. Some of these issues in the past have been related to components and subsystems supplied to us by third parties who have in some cases limited the ability of us to address such issues promptly. This process in the past required and in the future is likely to require us to incur un-reimbursed engineering expenses and to experience larger than anticipated warranty claims which could result in product returns. In the early stages of product development there can be no assurance that we will discover any reliability, design and manufacturing issues or, that if such issues arise, that they can be resolved to the customers’ satisfaction or that the resolution of such problems will not cause us to incur significant development costs or warranty expenses or to lose significant sales opportunities. We sell our products and services worldwide, and our business is subject to risks inherent in conducting business activities in geographic regions outside of the United States. Approximately 39%, 36%, and 71% of our net sales for fiscal 2020, 2019 and 2018, respectively, were attributable to sales to customers for delivery outside of the United States. We operate sales and service in Taiwan, a service organization in Germany, as well as direct support through 3rd party agreements in China, South Korea, and the Philippines. We expect that sales of products for delivery outside of the United States will continue to represent a substantial portion of our future net sales. Our future performance will depend, in significant part, upon our ability to continue to compete in foreign markets which in turn will depend, in part, upon a continuation of current trade relations between the United States and foreign countries in which semiconductor manufacturers or assemblers have operations. A change toward more protectionist trade legislation in either the United States or such foreign countries, such as a change in the current tariff structures, export compliance or other trade policies, could adversely affect our ability to sell our products in foreign markets. In addition, we are subject to other risks associated with doing business internationally, including longer receivable collection periods and greater difficulty in accounts receivable collection, the burden of complying with a variety of foreign laws, difficulty in staffing and managing global operations, the impact of the COVID-19 pandemic on the global economy and financial markets, risks of civil disturbance or other events which may limit or disrupt markets, international exchange restrictions, changing political conditions and monetary policies of foreign governments. Approximately 100%, 0% and 0% of our net sales for fiscal 2020 were denominated in U.S. Dollars, Euros and Japanese Yen, respectively. Although the percentages of net sales denominated in Euros and Japanese Yen were immaterial in fiscal 2020, they have been larger in the past and could become significant again in the future. A large percentage of net sales to European customers are denominated in U.S. Dollars, but sales to many Japanese customers are denominated in Japanese Yen. Because a substantial portion of our net sales is from sales of products for delivery outside the United States, an increase in the value of the U.S. Dollar relative to foreign currencies would increase the cost of our products compared to products sold by local companies in such markets. In addition, since the price is determined at the time a purchase order is accepted, we are exposed to the risks of fluctuations in the U.S. Dollar exchange rate during the lengthy period from the date a purchase order is received until payment is made. This exchange rate risk is partially offset to the extent our foreign operations incur expenses in the local currency. To date, we have not invested in any instruments designed to hedge currency risks. Our operating results could be adversely affected by fluctuations in the value of the U.S. Dollar relative to other currencies. We purchase materials from suppliers worldwide, which subjects the Company to increased risk. We purchase components, sub-assemblies, and chambers from suppliers outside the United States. Increases in tariffs, additional taxes, disruptions due to the COVID-19 pandemic or trade barriers may result in an increase in our manufacturing costs. A decrease in the value of the U.S. Dollar relative to foreign currencies would increase the cost of our materials. Should the Company increase its sales prices to recover the increase in costs, this could result in a decrease in the competitiveness of our products. In addition, we are subject to other risks associated with purchasing materials from suppliers worldwide. Government authorities may also implement protectionist policies or impose limitations on the transfer of intellectual property. This may limit our ability to obtain products from certain geographic regions and require us to identify and qualify new suppliers. The process of qualifying suppliers could be lengthy, and no assurance can be given that any additional sources would be available to us on a timely basis. Changes in trade relations, currency fluctuations, or protectionist policies could have a material adverse effect on our business, financial condition or results of operations.

14
The Company is exposed to cybersecurity threats or incidents. We collect, maintain, and transmit data on information systems. These systems include those owned and maintained by the Company or by third parties. In addition, we use cloud-based enterprise resource planning, ERP, software to manage the business integrating all facets of operations, including manufacturing, finance, and sales and marketing. The data maintained on these systems includes confidential and proprietary information belonging to us, our customers, suppliers, and others. While the Company devotes significant resources to protect its systems and data from unauthorized access or misuse, we are exposed to cybersecurity risks. Our systems are subject to computer viruses, data breach, phishing schemes, and other malicious software programs or attacks. We have experienced cyber threats and incidents in the past. Although past threats and incidents have not resulted in a material adverse effect, cybersecurity incidents may result in business disruption, loss of data, or unauthorized access to intellectual property which could adversely affect our business. Our industry is subject to rapid technological change and our ability to remain competitive depends on our ability to introduce new products in a timely manner. The semiconductor equipment industry is subject to rapid technological change and new product introductions and enhancements. Our ability to remain competitive depends in part upon our ability to develop new products and to introduce them at competitive prices and on a timely and cost-effective basis. Our success in developing new and enhanced products depends upon a variety of factors, including product selection, timely and efficient completion of product design, timely and efficient implementation of manufacturing and assembly processes, product performance in the field and effective sales and marketing. Because new product development commitments must be made well in advance of sales, new product decisions must anticipate both future demand and the technology that will be available to supply that demand. Furthermore, introductions of new and complex products typically involve a period in which design, engineering and reliability issues are identified and addressed by our suppliers and by us. There can be no assurance that we will be successful in selecting, developing, manufacturing and marketing new products that satisfy market demand. Any such failure would materially and adversely affect our business, financial condition and results of operations. Because of the complexity of our products, significant delays can occur between a product’s introduction and the commencement of the volume production of such product. We have experienced, from time to time, significant delays in the introduction of, and technical and manufacturing difficulties with, certain of our products and may experience delays and technical and manufacturing difficulties in future introductions or volume production of our new products. Our inability to complete new product development, or to manufacture and ship products in time to meet customer requirements would materially adversely affect our business, financial condition and results of operations. Our dependence on subcontractors and sole source suppliers may prevent us from delivering our products on a timely basis and expose us to intellectual property infringement. We rely on subcontractors to manufacture many of the components or subassemblies used in our products. Our FOX and ABTS systems, WaferPak contactors and DiePak carriers contain several components, including environmental chambers, power supplies, high-density interconnects, wafer contactors, module contactors, signal distribution substrates, WaferPak Aligners, DiePak Loaders and certain ICs that are currently supplied by only one or a limited number of suppliers. Our reliance on subcontractors and single source suppliers involves a number of significant risks, including the loss of control over the manufacturing process, the potential absence of adequate capacity and reduced control over delivery schedules, manufacturing yields, quality and costs. In the event that any significant subcontractor or single source supplier is unable or unwilling to continue to manufacture subassemblies, components or parts in required volumes, we would have to identify and qualify acceptable replacements. The process of qualifying subcontractors and suppliers could be lengthy, and no assurance can be given that any additional sources would be available to us on a timely basis. Any delay, interruption or termination of a supplier relationship could adversely affect our ability to deliver products, which would harm our operating results. Our suppliers manufacture components, tooling, and provide engineering services. During this process, our suppliers are allowed access to our intellectual property. While we maintain patents to protect from intellectual property infringement, there can be no assurance that technological information gained in the manufacture of our products will not be used to develop a new product, improve processes or techniques which compete against our products. Litigation may be necessary to enforce or determine the validity and scope of our proprietary rights, and there can be no assurance that our intellectual property rights, if challenged, will be upheld as valid.

15
Periodic economic and semiconductor industry downturns could negatively affect our business, results of operations and financial condition. Periodic global economic and semiconductor industry downturns have negatively affected and could continue to negatively affect our business, results of operations, and financial condition. Financial turmoil in the banking system and financial markets has resulted, and may result in the future, in a tightening of the credit markets, disruption in the financial markets and global economy downturn. These events may contribute to significant slowdowns in the industry in which we operate. Difficulties in obtaining capital and deteriorating market conditions can pose the risk that some of our customers may not be able to obtain necessary financing on reasonable terms, which could result in lower sales. Customers with liquidity issues may lead to additional bad debt expense. Turmoil in the international financial markets has resulted, and may result in the future, in dramatic currency devaluations, stock market declines, restriction of available credit and general financial weakness. In addition, flash memory and other similar device prices have historically declined and will likely do so again in the future. These developments may affect us in several ways. The market for semiconductors and semiconductor capital equipment has historically been cyclical, and we expect this to continue in the future. The uncertainty of the semiconductor market may cause some manufacturers in the future to further delay capital spending plans. Economic conditions may also affect the ability of our customers to meet their payment obligations, resulting in cancellations or deferrals of existing orders and limiting additional orders. In addition, some governments have subsidized portions of fabrication facility construction, and financial turmoil may reduce these governments’ willingness to continue such subsidies. Such developments could have a material adverse effect on our business, financial condition and results of operations. The current economic conditions and uncertainty about future economic conditions make it challenging for us to forecast our operating results, make business decisions, and identify the risks that may affect our business, financial condition and results of operations. If such conditions recur, and we are not able to timely and appropriately adapt to changes resulting from the difficult macroeconomic environment, our business, financial condition or results of operations may be materially and adversely affected. Future changes in semiconductor technologies may make our products obsolete. Future improvements in semiconductor design and manufacturing technology may reduce or eliminate the need for our products. For example, improvements in semiconductor process technology and improvements in conventional test systems, such as reduced cost or increased throughput, may significantly reduce or eliminate the market for one or more of our products. If we are not able to improve our products or develop new products or technologies quickly enough to maintain a competitive position in our markets, our business may decline. If we are not able to reduce our operating expenses sufficiently during periods of weak revenue, or if we utilize significant amounts of cash to support operating losses, we may erode our cash resources and may not have sufficient cash to operate our business. In recent years, in the face of a downturn in our business and a decline in our net sales, we implemented a variety of cost controls and restructured our operations with the goal of reducing our operating costs to position ourselves to more effectively meet the needs of the then weak market for test and burn-in equipment. In February 2019, we adopted a restructuring plan in order to streamline our operations and better align our structure with our objectives going forward. While we took significant steps to minimize our expense levels and to increase the likelihood that we would have sufficient cash to support operations during the downturn, from fiscal 2009 through fiscal 2020, with the exception of fiscal 2014 and 2018, we experienced operating losses. We anticipate that our existing cash balance together with income from operations, collections of existing accounts receivable, revenue from our existing backlog of products, the sale of inventory on hand, and deposits and down payments against significant orders will be adequate to meet our working capital and capital equipment requirements. Depending on our rate of growth and profitability, and our ability to obtain significant orders with down payments, we may require additional equity or debt financing to meet our working capital requirements or capital equipment needs. There can be no assurance that additional financing will be available when required, or if available, that such financing can be obtained on terms satisfactory to us. Our stock price may fluctuate. The price of our common stock has fluctuated in the past and may fluctuate significantly in the future. We believe that factors such as announcements of developments related to our business, fluctuations in our operating results, general conditions in the semiconductor and semiconductor equipment industries as well as the worldwide economy, announcement of technological innovations, new systems or product enhancements by us or our competitors, fluctuations in the level of cooperative development funding, acquisitions, changes in governmental regulations, developments in patents or other intellectual property rights and changes in our relationships with customers and suppliers could cause the price of our common stock to fluctuate substantially. In addition, in recent years the stock

16
market in general, and the market for small capitalization and high technology stocks in particular, have experienced extreme price fluctuations which have often been unrelated to the operating performance of the affected companies. Such fluctuations could adversely affect the market price of our common stock. We depend on our key personnel and our success depends on our ability to attract and retain talented employees. Our success depends to a significant extent upon the continued service of Gayn Erickson, our President and Chief Executive Officer, as well as other executive officers and key employees. We do not maintain key person life insurance for our benefit on any of our personnel, and none of our employees are subject to a non-competition agreement with us. The loss of the services of any of our executive officers or a group of key employees could have a material adverse effect on our business, financial condition and operating results. Our future success will depend in significant part upon our ability to attract and retain highly skilled technical, management, sales and marketing personnel. There are a limited number of personnel with the requisite skills to serve in these positions, and it has become increasingly difficult for us to hire such personnel. Competition for such personnel in the semiconductor equipment industry is intense, and there can be no assurance that we will be successful in attracting or retaining such personnel. Changes in management could disrupt our operations and adversely affect our operating results. We may be subject to litigation relating to intellectual property infringement which would be time-consuming, expensive and a distraction from our business. If we do not adequately protect our intellectual property, competitors may be able to use our proprietary information to erode our competitive advantage, which could harm our business and operating results. Litigation may be necessary to enforce or determine the validity and scope of our proprietary rights, and there can be no assurance that our intellectual property rights, if challenged, will be upheld as valid. Such litigation could result in substantial costs and diversion of resources and could have a material adverse effect on our operating results, regardless of the outcome of the litigation. In addition, there can be no assurance that any of the patents issued to us will not be challenged, invalidated or circumvented or that the rights granted thereunder will provide competitive advantages to us. There are no pending claims against us regarding infringement of any patents or other intellectual property rights of others. However, in the future we may receive communications from third parties asserting intellectual property claims against us. Such claims could include assertions that our products infringe, or may infringe, the proprietary rights of third parties, requests for indemnification against such infringement or suggestions that we may be interested in acquiring a license from such third parties. There can be no assurance that any such claim will not result in litigation, which could involve significant expense to us, and, if we are required or deem it appropriate to obtain a license relating to one or more products or technologies, there can be no assurance that we would be able to do so on commercially reasonable terms, or at all. While we believe we have complied with all applicable environmental laws, our failure to do so could adversely affect our business as a result of having to pay substantial amounts in damages or fees. Federal, state and local regulations impose various controls on the use, storage, discharge, handling, emission, generation, manufacture and disposal of toxic and other hazardous substances used in our operations. We believe that our activities conform in all material respects to current environmental and land use regulations applicable to our operations and our current facilities, and that we have obtained environmental permits necessary to conduct our business. Nevertheless, failure to comply with current or future regulations could result in substantial fines, suspension of production, alteration of our manufacturing processes or cessation of operations. Such regulations could require us to acquire expensive remediation equipment or to incur substantial expenses to comply with environmental regulations. Any failure to control the use, disposal or storage of or adequately restrict the discharge of, hazardous or toxic substances could subject us to significant liabilities. If we fail to maintain effective internal control over financial reporting in the future, the accuracy and timing of our financial reporting may be adversely affected. We are required to comply with Section 404 of the Sarbanes-Oxley Act of 2002. The provisions of the act require, among other things, that we maintain effective internal control over financial reporting and disclosure controls and procedures. Preparing our financial statements involves a number of complex processes, many of which are done manually and are dependent upon individual data input or review. These processes include, but are not limited to, calculating revenue, deferred revenue and inventory costs. While we continue to automate our processes and enhance our review and put in place controls to reduce the likelihood for errors, we expect that for the foreseeable future, many of our processes will remain manually intensive and thus subject to human error.

17
Our common stock may be delisted from The NASDAQ Capital Market if we cannot maintain compliance with NASDAQ’s continued listing requirements. In order to maintain our listing on The NASDAQ Capital Market, we are required to maintain compliance with NASDAQ’s continued listing requirements. The continued listing requirements include, among others, a minimum bid price of $1.00 per share and any of: (i) a minimum stockholders’ equity of $2.5 million; (ii) a market value of listed securities of at least $35 million; or (iii) net income from continuing operations of $500,000 in the most recently completed fiscal year or in two of the last three fiscal years. There are no assurances that we will be able to sustain long-term compliance with NASDAQ’s continued listing requirements. If we fail to maintain compliance with the applicable NASDAQ continued listing requirements, our stock may be delisted. If we are delisted, we would expect our common stock to be traded in the over-the-counter market, which could make trading our common stock more difficult for investors, potentially leading to declines in our share price and liquidity. In addition, delisting could result in negative publicity and make it more difficult for us to raise additional capital. Item 1B. Unresolved Staff Comments
None. Item 2. Properties The Company’s principal administrative and production facilities are located in Fremont, California, in a 51,289 square foot building. The Company’s lease was renewed in February 2018 and expires in July 2023. The Company maintained a facility in Japan located in a 418 square foot office in Tokyo under a lease which expired in June 2020. The Company also maintained a 1,585 square foot warehouse in Yamanashi under a lease which expired in June 2020. The Company substantially closed its subsidiary Aehr Test Systems Japan K.K. in March 2020, completing the liquidation of the legal entity in July 2020, see Note 16, “Restructuring,” of the Notes to Consolidated Financial Statements. The Company leases a 492 square foot sales and support office in Utting, Germany. The lease, which began February 1, 1992 and expires on January 31, 2022, contains an automatic twelve months renewal, at rates to be determined, if no notice is given prior to six months from expiry. The Company periodically evaluates its global operations and facilities to bring its capacity in line with demand and to provide cost efficient services for its customers. In prior years, through this process, the Company has moved from certain facilities that exceeded the capacity required to satisfy its needs. The Company believes that its existing facilities are adequate to meet its current and reasonably foreseeable requirements. The Company regularly evaluates its expected future facilities requirements and believes that alternate facilities would be available if needed. Item 3. Legal Proceedings None. Item 4. Mine Safety Disclosures Not Applicable

18
PART II Item 5. Market for Registrant’s Common Equity, Related Stockholder Matters and Issuer Purchases of Equity Securities The Company’s common stock is publicly traded on the NASDAQ Capital Market under the symbol “AEHR”. The following table sets forth, for the periods indicated, the high and low sale prices for the common stock on such market. These quotations represent prices between dealers and do not include retail markups, markdowns or commissions and may not necessarily represent actual transactions.
High Low
Fiscal 2020: First quarter ended August 31, 2019. . . . . . . . . . . . . . . . . . . . . . . . . . . . . . . . . . . . . . . . . $1.87 $1.27
Second quarter ended November 30, 2019. . . . . . . . . . . . . . . . . . . . . . . . . . . . . . . . . . . . 2.33 1.28
Third quarter ended February 29, 2020. . . . . . . . . . . . . . . . . . . . . . . . . . . . . . . . . . . . . . . 2.78 1.75
Fourth quarter ended May 31, 2020 . . . . . . . . . . . . . . . . . . . . . . . . . . . . . . . . . . . . . . . . . 2.24 1.10
Fiscal 2019: First quarter ended August 31, 2018. . . . . . . . . . . . . . . . . . . . . . . . . . . . . . . . . . . . . . . . . $2.94 $2.21
Second quarter ended November 30, 2018. . . . . . . . . . . . . . . . . . . . . . . . . . . . . . . . . . . . 2.57 1.80
Third quarter ended February 28, 2019. . . . . . . . . . . . . . . . . . . . . . . . . . . . . . . . . . . . . . . 1.97 1.03
Fourth quarter ended May 31, 2019 . . . . . . . . . . . . . . . . . . . . . . . . . . . . . . . . . . . . . . . . . 2.19 1.27 At August 3, 2020, the Company had 135 holders of record of its common stock. A substantially greater number of holders of the Company’s common stock are “street name” or beneficial holders whose shares are held by banks, brokers and other financial institutions. The Company has not paid cash dividends on its common stock or other securities. The Company currently anticipates that it will retain its future earnings, if any, for use in the expansion and operation of its business and does not anticipate paying any cash dividends on its common stock in the foreseeable future. The Company did not repurchase any of its common stock during the fiscal year ended May 31, 2020. PERFORMANCE MEASUREMENT COMPARISON The following graph shows a comparison of total shareholder return for holders of the Company's common stock for the last five fiscal years ended May 31, 2020, compared with the NASDAQ Composite Index and the Philadelphia Semiconductor Index. The graph assumes that $100 was invested in the Company's common stock, in the NASDAQ Composite Index and the Philadelphia Semiconductor Index on May 31, 2015, and that all dividends were reinvested. The Company believes that while total shareholder return can be an important indicator of corporate performance, the stock prices of semiconductor equipment companies like us are subject to a number of market-related factors other than company performance, such as competitive announcements, mergers and acquisitions in the industry, the general state of the economy and the performance of other semiconductor equipment company stocks. Stock prices and shareholder returns over the indicated period should not be considered indicative of future stock prices or shareholder returns.

19
Item 6. Selected Consolidated Financial Data The selected consolidated financial data set forth below should be read in conjunction with “Management’s Discussion and Analysis of Financial Condition and Results of Operations” and the consolidated financial statements and related notes included elsewhere in this Annual Report on Form 10-K. The selected consolidated financial data in this section are not intended to replace the consolidated financial statements and are qualified in their entirety by the consolidated financial statements and related notes thereto included elsewhere in this Annual Report on Form 10-K.
We derived the statements of operations data for the fiscal years ended May 31, 2020, 2019 and 2018 and the balance sheet data as of May 31, 2020 and 2019 from our audited consolidated financial statements and related notes, which are included elsewhere in this Annual Report on Form 10-K. We derived the statements of operations data for the fiscal years ended May 31, 2017 and 2016 and the balance sheet data as of May 31, 2018, 2017 and 2016 from our audited consolidated financial statements and related notes which are not included in this Annual Report on Form 10-K. We have not declared or distributed any cash dividends.

20
Fiscal Year Ended May 31,
2020 2019 2018 2017 2016
(In thousands, except per share data) CONSOLIDATED STATEMENTS OF OPERATIONS:
Net sales. . . . . . . . . . . . . . . . . . . . . . . . . . . .
$22,291 $21,056 $29,555 $18,898 $14,501
Cost of sales. . . . . . . . . . . . . . . . . . . . . . . . . 13,920 13,454 17,169 12,118 9,356
Gross profit. . . . . . . . . . . . . . . . . . . . . . . . . 8,371
7,602 12,386 6,780 5,145
Operating expenses: Selling, general and administrative. . . . . . . 7,530 7,724 7,290 7,052 6,975 Research and development. . . . . . . . . . . . . 3,386 4,153 4,181 4,657 4,324
Restructuring. . . . . . . . . . . . . . . . . . . . . . . 220 725 -- -- --
Total operating expenses . . . . . . . . . . . . 11,136 12,602 11,471 11,709 11,299
(Loss) income from operations. . . . . . . . . . . (2,765) (5,000) 915 (4,929) (6,154)
Interest income (expense), net. . . . . . . . . . . . 10 (252) (399) (678) (605)
Other (expense) income, net . . . . . . . . . . . . . (11) 44 (61) (21) (16)
(Loss) income before income tax (expense) benefit . . . . . . . . . . . . . . . . . . . . . . . . . . (2,766) (5,208) 455 (5,628) (6,775)
Income tax (expense) benefit. . . . . . . . . . . . (36) (27) 73 (25) (10)
Net (loss) income. . . . . . . . . . . . . . . . . . . . . (2,802) (5,235) 528 (5,653) (6,785) Less: Net income attributable to the
noncontrolling interest . . . . . . . . . . . . -- -- -- -- --
Net (loss) income attributable to Aehr
Test Systems common shareholders. . . . $(2,802) $(5,235) $ 528 $ (5,653) $(6,785)
Net (loss) income per share: Basic . . . . . . . . . . . . . . . . . . . . . . . . . . . . $ (0.12) $(0.23) $0.02 $(0.35) $(0.52)
Diluted . . . . . . . . . . . . . . . . . . . . . . . . . . $ (0.12) $(0.23) $0.02 $(0.35) $(0.52)
Shares used in per share calculations: Basic . . . . . . . . . . . . . . . . . . . . . . . . . . . . 22,882 22,387 21,732 16,267 13,091
Diluted. . . . . . . . . . . . . . . . . . . . . . . . . . 22,882 22,387 22,782 16,267 13,091 May 31,
2020 2019 2018 2017 2016
CONSOLIDATED BALANCE SHEETS:
Cash and cash equivalents. . . . . . . . . . . . . . . $5,433 $ 5,428 $ 16,848 $17,803 $ 939
Working capital. . . . . . . . . . . . . . . . . . . . . . . 13,786 14,522 18,308 21,494 4,068
Total assets . . . . . . . . . . . . . . . . . . . . . . . . . . 20,574 21,307 30,955 30,892 10,046
Long-term obligations, less current portion . 2,653 342 522 6,214 6,089
Total shareholders' equity (deficit) . . . . . . . . 14,056 15,453 19,285 16,794 (723)

21
Item 7. Management’s Discussion and Analysis of Financial Condition and Results of Operations The following discussion and analysis of the financial condition and results of operations should be read in conjunction with our “Selected Consolidated Financial Data” and our consolidated financial statements and related notes included elsewhere in this Annual Report on Form 10-K. COVID-19 PANDEMIC RESPONSE The Company has been impacted by the recent outbreak of the novel coronavirus, known as COVID-19, which has spread to many countries throughout the world. We experienced a significant drop in customer orders and revenues in the last quarter of fiscal year ended May 31, 2020. In response to the ongoing COVID-19 pandemic, we have implemented cost reduction initiatives including mandatory vacation days and shutdown days to mitigate operating losses. On April 23, 2020, we received proceeds of $1,679,000 from a PPP loan, under the CARES Act, a portion of which may be forgiven, which we intend to use to retain employees, maintain payroll and make lease and utility payments. Our business’ top priority during the COVID-19 pandemic is protecting the health and safety of its employees and their families, customers and community. We introduced workplace flexibility such as working remotely where possible to reduce the number of people who are on campus each day. As a global supplier of Critical Infrastructure Sectors we are continuing to support customers during the pandemic. In the interest of public health, all onsite operations are utilizing the minimum number of people to safely execute tasks and following enhanced safety and health protocols including screenings, social distancing, and use of personal protective equipment. We will continue to monitor the situation. As of the date of this report, we cannot predict with certainty the potential effects the COVID-19 may have on our business and our operating results. While the overall environment remains uncertain, we continue to aggressively invest in priority areas with the objective of driving profitable growth over the long term. OVERVIEW We were founded in 1977 to develop and manufacture burn-in and test equipment for the semiconductor industry. Since our inception, we have installed over 2,500 systems at semiconductor manufacturers, semiconductor contract assemblers and burn-in and test service companies worldwide. Our principal products currently are the Advanced Burn-in and Test System, or ABTS, the FOX full wafer contact and singulated die/module parallel test and burn-in system, WaferPak Aligner, WaferPak contactors, DiePak Loader, DiePak carriers and test fixtures. Our net sales consist primarily of sales of systems, WaferPak Aligners and DiePak Loaders, WaferPak contactors, DiePak carriers, test fixtures, upgrades and spare parts, revenues from service contracts, and engineering development charges. Our selling arrangements may include contractual customer acceptance provisions, which are mostly deemed perfunctory or inconsequential, and installation of the product occurs after shipment and transfer of title. CRITICAL ACCOUNTING POLICIES AND ESTIMATES Our discussion and analysis of our financial condition and results of operations are based upon our consolidated financial statements, which have been prepared in accordance with accounting principles generally accepted in the United States of America. The preparation of these consolidated financial statements requires us to make estimates and judgments that affect the reported amounts of assets, liabilities, revenues and expenses, and related disclosure of contingent assets and liabilities. On an ongoing basis, we evaluate our estimates, including those related to customer programs and incentives, product returns, bad debts, inventories, investments, income taxes, financing operations, warranty obligations, and long-term service contracts, among others. Our estimates are derived from historical experience and on various other assumptions that are believed to be reasonable under the circumstances. Those results form the basis for making judgments about the carrying values of assets and liabilities that are not readily apparent from other sources. Actual results may differ from these estimates under different assumptions or conditions. We believe the following critical accounting policies affect our more significant judgments and estimates used in the preparation of our consolidated financial statements. REVENUE RECOGNITION In May 2014, the Financial Accounting Standards Boards (FASB) issued ASC Topic 606, Revenue from Contracts with Customers (Topic 606), which was subsequently updated (collectively “ASC 606”). We adopted the standard as of June 1, 2018, using the modified retrospective method. Under this method, we applied ASC 606 to contracts that were not complete as of June 1, 2018 and recognized the cumulative effect of initially applying the standard as an adjustment to

22
the opening balance of retained earnings. Results for reporting periods beginning after June 1, 2018 are presented in accordance with ASC 606. Under the modified retrospective adoption method, prior period amounts are not adjusted and are reported in accordance with the accounting standards in effect for those periods per FASB ASC Topic 605, Revenue Recognition, which is also referred to herein as “legacy GAAP.”
The adoption of ASC 606 did not have a material impact on our consolidated financial statements as of June 1, 2018. No adjustment was recorded to accumulated deficit as of the adoption date and reported revenue would not have been different under legacy GAAP. Additionally, we do not expect the adoption of the revenue standard to have a material impact to our net income on an ongoing basis.
We sell our products primarily through a direct sales force. In certain international markets, we sell our products through independent distributors. We consider revenue to be earned when all of the following criteria are met:
• We have a contract with a customer that creates enforceable rights and obligations,
• Promised performance obligations are identified,
• The transaction price, or the amount we expect to receive, is determinable and
• We have satisfied the performance obligations to the customer.
Transfer of control is evidenced upon passage of title and risk of loss to the customer unless we are required to provide additional services.
ALLOWANCE FOR DOUBTFUL ACCOUNTS
We maintain an allowance for doubtful accounts to reserve for potentially uncollectible trade receivables. We also review our trade receivables by aging category to identify specific customers with known disputes or collection issues. We exercise judgment when determining the adequacy of these reserves as we evaluate historical bad debt trends, general economic conditions in the United States and internationally and changes in customer financial conditions. Uncollectible receivables are recorded as bad debt expense when all efforts to collect have been exhausted and recoveries are recognized when they are received.
WARRANTY OBLIGATIONS
We provide and record the estimated cost of product warranties at the time revenues are recognized on products shipped. While we engage in extensive product quality programs and processes, including actively monitoring and evaluating the quality of our component suppliers, our warranty obligation is affected by product failure rates, material usage and service delivery costs incurred in correcting a product failure. Our estimate of warranty reserve is based on management’s assessment of future warranty obligations and on historical warranty obligations. Should actual product failure rates, material usage or service delivery costs differ from our estimates, revisions to the estimated warranty liability would be required.
INVENTORY OBSOLESCENCE
In each of the last three fiscal years, we have written down our inventory for estimated obsolescence or unmarketable inventory by an amount equal to the difference between the cost of inventory and the estimated market value based upon assumptions about future demand and market conditions. If future market conditions are less favorable than those projected by management, additional inventory write-downs may be required.
INCOME TAXES
Income taxes have been provided using the liability method whereby deferred tax assets and liabilities are determined based on differences between financial reporting and tax bases of assets and liabilities and net operating loss and tax credit carryforwards measured using the enacted tax rates and laws that will be in effect when the differences are expected to reverse or the carryforwards are utilized. Valuation allowances are established when it is determined that it is more likely than not that such assets will not be realized.
A full valuation allowance was established against all deferred tax assets, as management determined that it is more likely than not that deferred tax assets will not be realized, as of May 31, 2020 and 2019.
We account for uncertain tax positions consistent with authoritative guidance. The guidance prescribes a “more likely than not” recognition threshold and measurement attribute for the financial statement recognition and measurement of

23
a tax position taken or expected to be taken in a tax return. We do not expect any material change in its unrecognized tax benefits over the next twelve months. We recognize interest and penalties related to unrecognized tax benefits as a component of income taxes. Although we file U.S. federal, various state and foreign tax returns, our only major tax jurisdictions are the United States, California, Germany and Japan. Tax years 1996 – 2019 remain subject to examination by the appropriate governmental agencies due to tax loss carryovers, research and development tax credits, or other tax attributes from those years. On March 27, 2020, the CARES Act was passed into law. The CARES Act includes several significant business tax provisions including modification to the taxable income limitation for utilization of net operating losses (NOLs) incurred in 2018, 2019 and 2020 and the ability to carry back NOLs from those years for a period of up to five years, an increase to the limitation on deductibility of certain business interest expense, bonus depreciation for purchases of qualified improvement property and special deductions on certain corporate charitable contributions. We are currently analyzing the impact of these changes and therefore an estimate of the impact to income taxes is not yet available. On June 29, 2020, California Governor Gavin Newsom signed Assembly Bill 85 (AB 85) into law as part of the California 2020 Budget Act, which temporarily suspends the use of California net operating losses and imposes a cap on the amount of business incentive tax credits that companies can utilize against their net income for tax years 2020, 2021, and 2022. We analyzed the provisions of AB 85 and determined there was no impact on our provision for income taxes for the current period and will continue to evaluate the impact, if any, AB 85 may have on our condensed consolidated financial statements and disclosures. STOCK-BASED COMPENSATION EXPENSE Stock-based compensation expense consists of expenses for stock options, restricted stock units, or RSUs, and employee stock purchase plan, or ESPP, purchase rights. Stock-based compensation cost for stock options and ESPP purchase rights is measured at each grant date, based on the fair value of the award using the Black-Scholes option valuation model, and is recognized as expense over the employee’s requisite service period. This model was developed for use in estimating the value of publicly traded options that have no vesting restrictions and are fully transferable. Our employee stock options have characteristics significantly different from those of publicly traded options. For RSUs, stock-based compensation cost is based on the fair value of our common stock at the grant date. All of our stock-based compensation is accounted for as an equity instrument. The fair value of each option grant and the right to purchase shares under our ESPP are estimated on the date of grant using the Black-Scholes option valuation model with assumptions concerning expected term, stock price volatility, expected dividend yield, risk-free interest rate and the expected life of the award. See Note 11 to our consolidated financial statements for detailed information relating to stock-based compensation and the stock option plan and the ESPP. RESTRUCTURING We record a charge for restructuring when management commits to a restructuring plan, the restructuring plan identifies all significant actions, the period of time to complete the restructuring plan indicates that significant changes to the plan are not likely, and individuals who are impacted have been notified of the pending involuntary termination. Restructuring charges include severance payments, legal fees, and write-off of assets. For employees that are not required to render services beyond a minimum retention period, the severance expense is recognized at the communication date based upon its fair value. For employees who are required to render service until they are terminated in order to receive the severance, the severance costs are measured initially at the communication date based upon its fair value, and recognized ratably over the future service period. In the fiscal year ended May 31, 2020, we recognized $220,000 in restructuring charges related to the dissolution of Aehr Test Systems Japan K.K (“ATS-Japan”), a majority owned subsidiary. The restructuring charges included severance payments for individuals impacted in this reduction, legal fees associated with the dissolution process, and write-off of assets. Restructuring charges for the fiscal year ended May 31, 2019 were related to a restructuring plan implemented in order to streamline our operations and better align our structure with our objectives going forward. We recognized $725,000 of employee termination expenses for the fiscal year ended May 31, 2019.

24
RESULTS OF OPERATIONS
The following table sets forth statements of operations data as a percentage of net sales for the periods indicated.
Year Ended May 31,
2020 2019 2018
Net sales . . . . . . . . . . . . . . . . . . . . . . . . . . . . . . . . . . . . 100.0% 100.0% 100.0%
Cost of sales . . . . . . . . . . . . . . . . . . . . . . . . . . . . . . . . . 62.4 63.9 58.1
Gross profit . . . . . . . . . . . . . . . . . . . . . . . . . . . . . . . . . . 37.6 36.1 41.9
Operating expenses:
Selling, general and administrative . . . . . . . . . . . . . . . . 33.8 36.7 24.7
Research and development . . . . . . . . . . . . . . . . . . . . . 15.2 19.7 14.1
Restructuring . . . . . . . . . . . . . . . . . . . . . . . . . . . . . . . . 1.0 3.4 --
Total operating expenses. . . . . . . . . . . . . . . . . . . . . . 50.0 59.8 38.8
(Loss) income from operations. . . . . . . . . . . . . . . . . . . (12.4) (23.7) 3.1
Interest income (expense), net . . . . . . . . . . . . . . . . . . . . -- (1.2) (1.4)
Other (expense) income, net. . . . . . . . . . . . . . . . . . . . . . -- 0.2 (0.2)
(Loss) income before income tax (expense) benefit . . . (12.4) (24.7) 1.5
Income tax (expense) benefit. . . . . . . . . . . . . . . . . . . . . . (0.2) (0.2) 0.3
Net (loss) income. . . . . . . . . . . . . . . . . . . . . . . . . . . . . . . (12.6) (24.9) 1.8
Less: Net income attributable
to the noncontrolling interest. . . . . . . . . . . . . . . . . . . -- -- --
Net (loss) income attributable to Aehr Test Systems
common shareholders. . . . . . . . . . . . . . . . . . . . . . . . . . . (12.6)% (24.9)% 1.8%
FISCAL YEAR ENDED MAY 31, 2020 COMPARED TO FISCAL YEAR ENDED MAY 31, 2019
NET SALES. Net sales increased to $22.3 million for the fiscal year ended May 31, 2020 from $21.1 million for the fiscal year ended May 31, 2019, an increase of 5.9%. The increase in net sales in fiscal 2020 resulted primarily from the increase in net sales of our wafer-level products, partially offset by the decrease in net sales of our Test During Burn-in (TDBI) products. Net sales of our wafer-level products for fiscal 2020 were $19.8 million, and increased approximately $5.2 million from fiscal 2019. Net sales of our TDBI products for fiscal 2020 were $2.5 million, and decreased approximately $3.9 million from fiscal 2019.
GROSS PROFIT. Gross profit increased to $8.4 million for the fiscal year ended May 31, 2020 from $7.6 million for the fiscal year ended May 31, 2019, an increase of 10.1%. Gross profit margin increased to 37.6% for the fiscal year ended May 31, 2020 from 36.1% for the fiscal year ended May 31, 2019. The increase in gross profit margin was primarily the result of change in product mix in net sales which wafer-level products revenues, contributing higher margins, accounted for 89% of revenues in fiscal year ended May 31, 2020 compared to 69% of revenues in fiscal year ended May 31, 2019. The increase was partially offset by the impact of excess and obsolete charges mainly related to ABTS products reaching the end of product life.
SELLING, GENERAL AND ADMINISTRATIVE. SG&A expenses were $7.5 million for the fiscal year ended May 31, 2020, compared with $7.7 million for the fiscal year ended May 31, 2019, a decrease of 2.5%. The decrease in SG&A expenses was primarily due to decreases in employment related expenses as a result of cost reduction initiatives implemented in fiscal 2019.
RESEARCH AND DEVELOPMENT. R&D expenses were $3.4 million for the fiscal year ended May 31, 2020, compared with $4.2 million for the fiscal year ended May 31, 2019, a decrease of 18.5%. The decrease in R&D expenses was primarily due to decreases in employment related expenses of $500,000 and project expenses of $267,000.
RESTRUCTURING. Restructuring charges for the fiscal year ended May 31, 2020 were related to the dissolution of Aehr Test Systems Japan K.K (ATS-Japan), a majority owned subsidiary. In connection with the dissolution plan, the

25
Company recognized approximately $220,000 related to severance payments for individuals impacted in this reduction and legal fees associated with the dissolution process in the fourth quarter of fiscal 2020. Restructuring charges for the fiscal year ended May 31, 2019 were related to a restructuring plan implemented in February 2019 in order to streamline our operations and better align our structure with our objectives going forward. We recognized $725,000 of employee termination expenses for the fiscal year ended May 31, 2019. INTEREST INCOME (EXPENSE), NET. Interest income, net was $10,000 for the fiscal year ended May 31, 2020 compared with interest expense, net was $252,000 for the fiscal year ended May 31, 2019. The decrease in interest expense, net was primarily due to the repayment of the Convertible Notes on the maturity date of April 10, 2019, partially offset by a decrease in interest income due to a decrease in our investment portfolio. OTHER (EXPENSE) INCOME, NET. Other expense, net was $11,000 for the fiscal year ended May 31, 2020 compared with other income, net of $44,000 for the fiscal year ended May 31, 2019. The change in other (expense) income, net was due primarily to losses or gains realized in connection with the fluctuation in the value of the dollar compared to foreign currencies during the referenced periods. INCOME TAX (EXPENSE) BENEFIT. Income tax expense was $36,000 and $27,000 for the fiscal year ended May 31, 2020 and 2019, respectively. FISCAL YEAR ENDED MAY 31, 2019 COMPARED TO FISCAL YEAR ENDED MAY 31, 2018 NET SALES. Net sales decreased to $21.1 million for the fiscal year ended May 31, 2019 from $29.6 million for the fiscal year ended May 31, 2018, a decrease of 28.8%. The decrease in net sales in fiscal 2019 resulted primarily from the decrease in net sales of our Test During Burn-in (TDBI) products, partially offset by the increase in net sales of our wafer-level products. Net sales of our TDBI products for fiscal 2019 were $6.4 million, and decreased approximately $10.0 million from fiscal 2018. The decrease was primarily due to our customers utilizing the significant capacity that they added in the prior year and lower sales to OEM manufacturers. Net sales of our wafer-level products for fiscal 2019 were $14.6 million, and increased approximately $1.5 million from fiscal 2018. GROSS PROFIT. Gross profit decreased to $7.6 million for the fiscal year ended May 31, 2019 from $12.4 million for the fiscal year ended May 31, 2018, a decrease of 38.6%. Gross profit margin decreased to 36.1% for the fiscal year ended May 31, 2019 from 41.9% for the fiscal year ended May 31, 2018. The decrease in gross profit margin was primarily the result of manufacturing inefficiencies due to a decrease in net sales, product mix, and the impact of reserves taken on excess and obsolete inventory. SELLING, GENERAL AND ADMINISTRATIVE. SG&A expenses were $7.7 million for the fiscal year ended May 31, 2019, compared with $7.3 million for the fiscal year ended May 31, 2018, an increase of 6.0%. The increase in SG&A expenses was primarily due to increases in employment related expenses. RESEARCH AND DEVELOPMENT. R&D expenses were flat at $4.2 million for the fiscal year ended May 31, 2019 compared with the fiscal year ended May 31, 2018. RESTRUCTURING. Restructuring charges for the fiscal year ended May 31, 2019 were related to a restructuring plan implemented in February 2019 in order to streamline our operations and better align our structure with our objectives going forward. We recognized $725,000 of employee termination expenses for the fiscal year ended May 31, 2019. There were no restructuring charges incurred for the fiscal year ended May 31, 2018. INTEREST EXPENSE. Interest expense decreased to $252,000 for the fiscal year ended May 31, 2019 from $399,000 for the fiscal year ended May 31, 2018. The decrease in interest expense for the fiscal year ended May 31, 2019 was primarily due to the repayment of the 9.0% Convertible Secured Notes (the “Convertible Notes”) on the maturity date of April 10, 2019, and the impact of an increase in interest income due to an increase in interest rates on our investment portfolio. OTHER INCOME (EXPENSE), NET. Other income, net was $44,000 for the fiscal year ended May 31, 2019 compared with other expense, net of $61,000 for the fiscal year ended May 31, 2018. The change in other income (expense), net was due primarily to gains or losses realized in connection with the fluctuation in the value of the dollar compared to foreign currencies during the referenced periods. INCOME TAX (EXPENSE) BENEFIT. Income tax expense was $27,000 for the fiscal year ended May 31, 2019 compared with income tax benefit of $73,000 for the fiscal year ended May 31, 2018. The income tax benefit in the fiscal year ended May 31, 2018 was primarily due to the impact of the “Tax Cuts and Jobs Act” enacted on December 22, 2017, specifically, the provision which made our alternative minimum tax credit refundable by 2022.

26
LIQUIDITY AND CAPITAL RESOURCES We consider cash and cash equivalents as liquid and available for use. As of May 31, 2020 and 2019, respectively, we had $5.4 million in cash and cash equivalents. Net cash used in operating activities was $2.0 million and $5.6 million for the fiscal years ended May 31, 2020 and 2019, respectively. For the fiscal year ended May 31, 2020, net cash used in operating activities was primarily the result of the net loss of $2.8 million, as adjusted to exclude the effect of non-cash charges of stock-based compensation expense of $910,000 and depreciation and amortization of $384,000. Net cash used in operations was also impacted by decreases in customer deposits and deferred revenue of $1.5 million and in accounts payable of $1.0 million, partially offset by decreases in inventories and accounts receivable of $1.2 million each. The decrease in customer deposits and deferred revenue was primarily due to the decrease in backlog of customer orders with down payments. The decrease in accounts payable was primarily due to a reduction in inventory purchases. The decrease in inventories was primarily due to the increase in inventory reserves related to older products. The decrease in accounts receivable was primarily due to lower shipment activities toward the end of fiscal year ended May 31, 2020. For the fiscal year ended May 31, 2019, net cash used in operating activities was primarily the result of the net loss of $5.2 million, as adjusted to exclude the effect of non-cash charges of stock-based compensation expense of $905,000 and depreciation and amortization of $431,000, an increase in accounts receivable of $2.0 million, and a decrease in customer deposits and deferred revenue of $355,000, partially offset by an increase in accrued expenses of $402,000. The increase in accounts receivable was primarily due to large shipments toward the end of fiscal 2019. The decrease in customer deposits and deferred revenue was primarily due to the decrease in backlog of customer orders with down payments. The increase in accrued expenses was primarily due to severance expenses accrued as a result of our restructuring plan implemented in February 2019. Net cash used in investing activities was $163,000 and $173,000 for the fiscal years ended May 31, 2020 and 2019, respectively. Net cash used in investing activities for the fiscal years ended May 31, 2020 and 2019 was due to the purchases of property and equipment. Net cash provided by financing activities was $2.2 million for the fiscal year ended May 31, 2020 as compared to net cash used in financing activities of $5.6 million for the fiscal year ended May 31, 2019. Net cash provided by financing activities during the fiscal year ended May 31, 2020 was primarily due to the proceeds of approximately $1.7 million from the PPP Loan, and the net proceeds from issuance of common stock under employee plans of $493,000. Net cash used in financing activities during the fiscal year ended May 31, 2019 was primarily due to the repayment of the Convertible Notes of $6.1 million on the maturity date of April 10, 2019, partially offset by proceeds from issuance of common stock under employee plans of $559,000. The effect of fluctuation in exchange rates increased cash by $20,000 for the fiscal year ended May 31, 2020 and decreased cash by $59,000 for the fiscal year ended May 31, 2019. The changes were due to the fluctuation in the value of the dollar compared to foreign currencies. As of May 31, 2020 and 2019, we had working capital of $13.8 million and $14.5 million, respectively. For the fiscal year ended May 31, 2018, net cash used in operating activities was primarily the result of the net income of $528,000, as adjusted to exclude the effect of non-cash charges of stock-based compensation expense of $996,000 and depreciation and amortization of $417,000, and a decrease in accounts receivable of $1.3 million. Other changes in cash from operations primarily resulted from an increase in inventories of $2.1 million, a decrease in customer deposits and deferred revenue of $1.5 million, as well as the decrease in accounts payable of $1.1 million. The decrease in accounts receivable was primarily due to improvements in customer payment terms. The increase in inventories is to support future shipments for customer orders. The decrease in customer deposits and deferred revenue was primarily due to the decrease in backlog of customer orders with down payments. The decrease in accounts payable was primarily due to the down payments applied toward vendor invoices. Net cash used in investing activities was $572,000 for the fiscal year ended May 31, 2018 was due to the purchase of property and equipment.
Net cash provided by financing activities of $925,000 for the fiscal year ended May 31, 2018 was primarily due to the proceeds from issuance of common stock under employee plans. The effect of fluctuation in exchange rates increased cash by $43,000 for the fiscal year ended May 31, 2018 due to the fluctuation in the value of the dollar compared to foreign currencies. As of May 31, 2018, we had working capital of $18.3 million.

27
We lease our manufacturing and office space under operating leases. We entered into a non-cancelable operating lease agreement for our United States manufacturing and office facilities, which was renewed in February 2018 and expires in July 2023. Under that lease agreement, we are responsible for payments of utilities, taxes and insurance. From time to time, we evaluate potential acquisitions of businesses, products or technologies that complement our business. If consummated, any such transactions may use a portion of our working capital or require the issuance of equity. We have no present understandings, commitments or agreements with respect to any material acquisitions. We anticipate that the existing cash balance together with income from operations, collections of existing accounts receivable, revenue from our existing backlog of products, the sale of inventory on hand, deposits and down payments against significant orders, and anticipated loan forgiveness of the PPP Loan will be adequate to meet our liquidity requirements for the next 12 months. OFF-BALANCE SHEET FINANCING We have not entered into any off-balance sheet financing arrangements and have not established any special purpose or variable interest entities. OVERVIEW OF CONTRACTUAL OBLIGATIONS The following table provides a summary of such arrangements, or contractual obligations.
Payments Due by Period (in thousands)
Less than 1-3 3-5 More than
Total 1 year years years 5 years
Lease obligations . . . . . . . . . . . . . . . . . . $2,473 $ 765 $1,574 $ 134 $ --
Long-term debt . . . . . . . . . . . . . . . . . . 1,679 653 1,026 -- --
Interest on long-term debt (1) . . . . . . . 21 16 5 -- --
Purchases (2) . . . . . . . . . . . . . . . . . . . . 2,196 2,196 -- -- --
Total . . . . . . . . . . . . . . . . . . . . . . . . . . $6,369 $3,630 $2,605 $ 134 $ --
(1) Based on 1% interest rate of PPP Loan. See Note 10, “LONG-TERM DEBT.” (2) Shown above are our binding purchase obligations. The large majority of our purchase orders are cancelable by either party, which if canceled may result in a negotiation with the vendor to determine if there shall be any restocking or cancellation fees payable to the vendor.
In the normal course of business to facilitate sales of our products, we indemnify other parties, including customers,
with respect to certain matters. We have agreed to hold the other party harmless against losses arising from a breach of
representations or covenants, or from intellectual property infringement or other claims. These agreements may limit
the time period within which an indemnification claim can be made and the amount of the claim. In addition, we have
entered into indemnification agreements with our officers and directors, and our bylaws contain similar indemnification
obligations to our agents.
It is not possible to determine the maximum potential amount under these indemnification agreements due to the limited history of prior indemnification claims and the unique facts and circumstances involved in each particular agreement. To date, our payments under these agreements have not had a material impact on our operating results, financial position or cash flows. RECENT ACCOUNTING PRONOUNCEMENTS For a description of recent accounting pronouncements, including the expected dates of adoption and estimated effects, if any, on our consolidated financial statements, see Note 1, “Organization and Summary of Significant Accounting Policies,” of the Notes to Consolidated Financial Statements. Item 7A. Quantitative and Qualitative Disclosures about Market Risk We had no holdings of derivative financial or commodity instruments at May 31, 2020. We are exposed to financial market risks, including changes in interest rates and foreign currency exchange rates. We only invest our short-term excess cash in government-backed securities with maturities of 18 months or less. We do not use any financial instruments for speculative or trading purposes. Fluctuations in interest rates would not have a material effect on our financial position, results of operations or cash flows.

28
A majority of our revenue and capital spending is transacted in U.S. Dollars. We, however, enter into transactions in other currencies, primarily Euros and Japanese Yen. Since the price is determined at the time a purchase order is accepted, we are exposed to the risks of fluctuations in the foreign currency-U.S. Dollar exchange rates during the lengthy period from purchase order to ultimate payment. This exchange rate risk is partially offset to the extent that our subsidiaries incur expenses payable in their local currency. To date, we have not invested in instruments designed to hedge currency risks. In addition, our subsidiaries typically carry debt or other obligations due to us that may be denominated in either their local currency or U.S. Dollars. Since our subsidiaries’ financial statements are based in their local currency and our condensed consolidated financial statements are based in U.S. Dollars, our subsidiaries and we recognize foreign exchange gains or losses in any period in which the value of the local currency rises or falls in relation to the U.S. Dollar. A 10% decrease in the value of the subsidiaries’ local currency as compared with the U.S. Dollar would not be expected to result in a significant change to our net income or loss. There have been no material changes in our risk exposure since the end of the last fiscal year, nor are any material changes to our risk exposure anticipated.

29
Item 8. Financial Statements and Supplementary Data INDEX Consolidated Financial Statements of Aehr Test Systems
Report of Independent Registered Public Accounting Firm . . . . . . . . . . . . . . . . . . . . . . . . . . . . . . . . . . . . . . . . . 30
Consolidated Balance Sheets at May 31, 2020 and 2019. . . . . . . . . . . . . . . . . . . . . . . . . . . . . . . . . . . . . . . . . . . . . 31
Consolidated Statements of Operations for the years ended May 31, 2020, 2019 and 2018. . . . . . . . . . . . . . . . . . 32
Consolidated Statements of Comprehensive (Loss) Income for the years ended May 31, 2020, 2019 and 2018 . . 33
Consolidated Statements of Shareholders' Equity for the years ended May 31, 2020, 2019 and 2018 . . . . . . . . . . 34
Consolidated Statements of Cash Flows for the years ended May 31, 2020, 2019 and 2018. . . . . . . . . . . . . . . . . . 35
Notes to Consolidated Financial Statements. . . . . . . . . . . . . . . . . . . . . . . . . . . . . . . . . . . . . . . . . . . . . . . . . . . . . . 36 Financial statement schedules not listed above are either omitted because they are not applicable or the required information is shown in the Consolidated Financial Statements or in the Notes thereto.

30
REPORT OF INDEPENDENT REGISTERED PUBLIC ACCOUNTING FIRM
To the Stockholders and Board of Directors of Aehr Test Systems
Opinion on the Consolidated Financial Statements
We have audited the accompanying consolidated balance sheets of Aehr Test Systems and its subsidiaries (the “Company”) as of May 31, 2020 and 2019, the related consolidated statements of operations, comprehensive (loss) income, shareholders’ equity, and cash flows for each of the three years in the period ended May 31, 2020, and the related notes (collectively referred to as the “consolidated financial statements”). In our opinion, the consolidated financial statements present fairly, in all material respects, the financial position of the Company as of May 31, 2020 and 2019, and the results of its operations and its cash flows for each of the three years in the period ended May 31, 2020, in conformity with accounting principles generally accepted in the United States of America.
Change in Accounting Principle
As discussed in Note 1 to the consolidated financial statements, the Company changed its method of accounting for leases in 2020 due to the adoption of the new lease standard.
Basis for Opinion
These consolidated financial statements are the responsibility of the Company’s management. Our responsibility is to express an opinion on the Company’s consolidated financial statements based on our audits. We are a public accounting firm registered with the Public Company Accounting Oversight Board (United States) (“PCAOB”) and are required to be independent with respect to the Company in accordance with the U.S. federal securities laws and the applicable rules and regulations of the Securities and Exchange Commission and the PCAOB.
We conducted our audits in accordance with the standards of the PCAOB. Those standards require that we plan and perform the audit to obtain reasonable assurance about whether the consolidated financial statements are free of material misstatement, whether due to error or fraud. The Company is not required to have, nor were we engaged to perform, an audit of its internal control over financial reporting. As part of our audits, we are required to obtain an understanding of internal control over financial reporting but not for the purpose of expressing an opinion on the effectiveness of the Company’s internal control over financial reporting. Accordingly, we express no such opinion.
Our audits included performing procedures to assess the risks of material misstatement of the consolidated financial statements, whether due to error or fraud, and performing procedures that respond to those risks. Such procedures included examining, on a test basis, evidence regarding the amounts and disclosures in the consolidated financial statements. Our audits also included evaluating the accounting principles used and significant estimates made by management, as well as evaluating the overall presentation of the consolidated financial statements. We believe that our audits provide a reasonable basis for our opinion.
/s/ BPM LLP
We have served as the Company’s auditor since 2005.
San Jose, California August 28, 2020
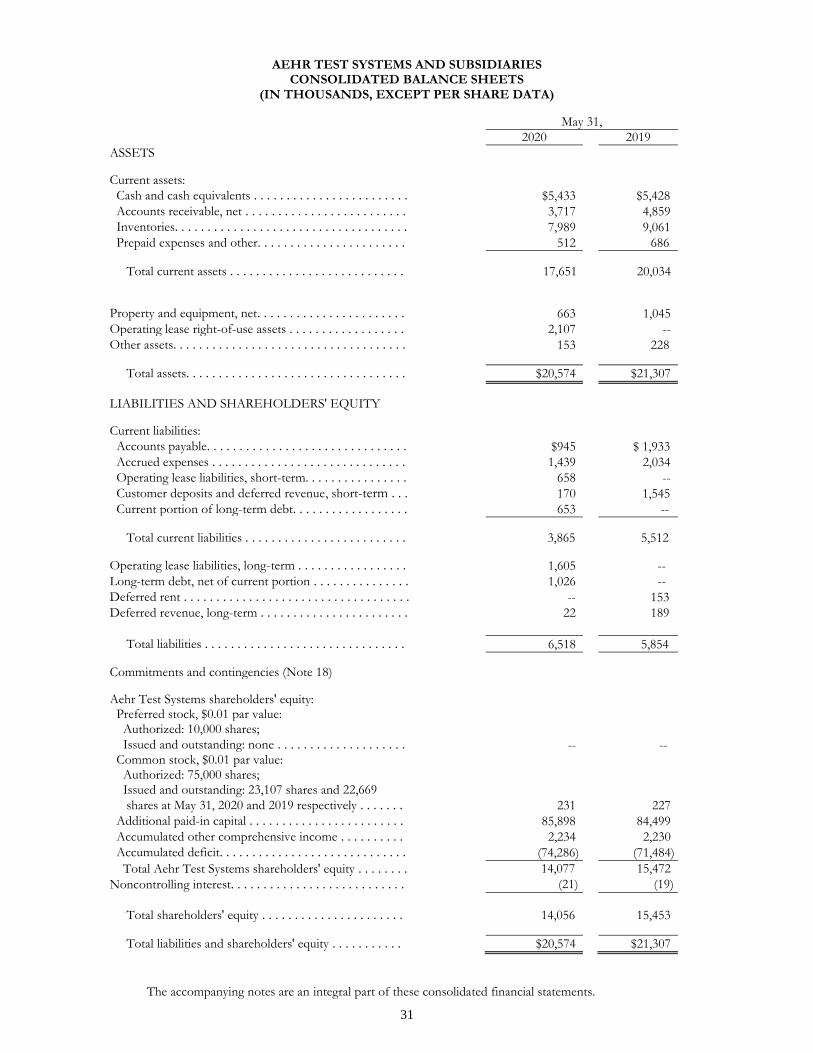
31
AEHR TEST SYSTEMS AND SUBSIDIARIES CONSOLIDATED BALANCE SHEETS
(IN THOUSANDS, EXCEPT PER SHARE DATA)
May 31,
2020 2019
ASSETS Current assets: Cash and cash equivalents . . . . . . . . . . . . . . . . . . . . . . . . $5,433 $5,428
Accounts receivable, net . . . . . . . . . . . . . . . . . . . . . . . . . 3,717 4,859
Inventories. . . . . . . . . . . . . . . . . . . . . . . . . . . . . . . . . . . . 7,989 9,061
Prepaid expenses and other. . . . . . . . . . . . . . . . . . . . . . . 512 686
Total current assets . . . . . . . . . . . . . . . . . . . . . . . . . . . 17,651 20,034
Property and equipment, net. . . . . . . . . . . . . . . . . . . . . . . 663
1,045
Operating lease right-of-use assets . . . . . . . . . . . . . . . . . . 2,107 --
Other assets. . . . . . . . . . . . . . . . . . . . . . . . . . . . . . . . . . . . 153 228
Total assets. . . . . . . . . . . . . . . . . . . . . . . . . . . . . . . . . . $20,574 $21,307
LIABILITIES AND SHAREHOLDERS' EQUITY Current liabilities: Accounts payable. . . . . . . . . . . . . . . . . . . . . . . . . . . . . . . $945 $ 1,933
Accrued expenses . . . . . . . . . . . . . . . . . . . . . . . . . . . . . . 1,439 2,034
Operating lease liabilities, short-term. . . . . . . . . . . . . . . . 658 --
Customer deposits and deferred revenue, short-term . . . 170 1,545
Current portion of long-term debt. . . . . . . . . . . . . . . . . . 653 --
Total current liabilities . . . . . . . . . . . . . . . . . . . . . . . . . 3,865 5,512
Operating lease liabilities, long-term . . . . . . . . . . . . . . . . . 1,605 --
Long-term debt, net of current portion . . . . . . . . . . . . . . . 1,026 --
Deferred rent . . . . . . . . . . . . . . . . . . . . . . . . . . . . . . . . . . . -- 153
Deferred revenue, long-term . . . . . . . . . . . . . . . . . . . . . . . 22 189
Total liabilities . . . . . . . . . . . . . . . . . . . . . . . . . . . . . . . 6,518 5,854
Commitments and contingencies (Note 18) Aehr Test Systems shareholders' equity: Preferred stock, $0.01 par value: Authorized: 10,000 shares; Issued and outstanding: none . . . . . . . . . . . . . . . . . . . . -- -- Common stock, $0.01 par value: Authorized: 75,000 shares; Issued and outstanding: 23,107 shares and 22,669 shares at May 31, 2020 and 2019 respectively . . . . . . . 231 227
Additional paid-in capital . . . . . . . . . . . . . . . . . . . . . . . . 85,898 84,499
Accumulated other comprehensive income . . . . . . . . . . 2,234 2,230
Accumulated deficit. . . . . . . . . . . . . . . . . . . . . . . . . . . . . (74,286) (71,484)
Total Aehr Test Systems shareholders' equity . . . . . . . . 14,077 15,472
Noncontrolling interest. . . . . . . . . . . . . . . . . . . . . . . . . . . (21) (19)
Total shareholders' equity . . . . . . . . . . . . . . . . . . . . . . 14,056
15,453
Total liabilities and shareholders' equity . . . . . . . . . . . $20,574 $21,307
The accompanying notes are an integral part of these consolidated financial statements.

32
AEHR TEST SYSTEMS AND SUBSIDIARIES CONSOLIDATED STATEMENTS OF OPERATIONS
(IN THOUSANDS, EXCEPT PER SHARE DATA)
Year Ended May 31,
2020 2019 2018
Net sales . . . . . . . . . . . . . . . . . . . . . . . . . . . . . . . . . . . . . . . $22,291 $21,056 $29,555
Cost of sales . . . . . . . . . . . . . . . . . . . . . . . . . . . . . . . . . . . . 13,920 13,454 17,169
Gross profit . . . . . . . . . . . . . . . . . . . . . . . . . . . . . . . . . . . . 8,371 7,602 12,386
Operating expenses: Selling, general and administrative . . . . . . . . . . . . . . . . . . 7,530 7,724 7,290
Research and development . . . . . . . . . . . . . . . . . . . . . . . 3,386 4,153 4,181
Restructuring . . . . . . . . . . . . . . . . . . . . . . . . . . . . . . . . . . 220 725 --
Total operating expenses . . . . . . . . . . . . . . . . . . . . . . . . 11,136 12,602 11,471
(Loss) income from operations . . . . . . . . . . . . . . . . . . . . . (2,765) (5,000) 915
Interest income (expense), net. . . . . . . . . . . . . . . . . . . . . . . 10 (252) (399)
Other (expense) income, net . . . . . . . . . . . . . . . . . . . . . . . . (11) 44 (61)
(Loss) income before income tax (expense) benefit. . . . . . . (2,766) (5,208) 455
Income tax (expense) benefit . . . . . . . . . . . . . . . . . . . . . . . (36) (27) 73
Net (loss) income . . . . . . . . . . . . . . . . . . . . . . . . . . . . . . . . (2,802) (5,235) 528 Less: Net income attributable
to the noncontrolling interest. . . . . . . . . . . . . . . . . . . . . -- -- --
Net (loss) income attributable to Aehr Test Systems
common shareholders . . . . . . . . . . . . . . . . . . . . . . . . . . . $(2,802) $(5,235) $ 528
Net (loss) income per share – basic and diluted . . . . . . . . $ (0.12) $ (0.23) $ 0.02
Shares used in per share calculation – basic. . . . . . . . . . . . 22,882 22,387 21,732
Shares used in per share calculation – diluted . . . . . . . . . . 22,882 22,387 22,782
The accompanying notes are an integral part of these consolidated financial statements.

33
AEHR TEST SYSTEMS AND SUBSIDIARIES
CONSOLIDATED STATEMENTS OF COMPREHENSIVE (LOSS) INCOME (IN THOUSANDS)
Year Ended May 31,
2020 2019 2018
Net (loss) income. . . . . . . . . . . . . . . . . . . . . . . . . . . . . $(2,802) $(5,235) $ 528 Other comprehensive income (loss), net of tax:
Foreign currency translation income (loss) . . . . . . . . 2 (61) 42
Total comprehensive (loss) income. . . . . . . . . . . . . . . . (2,800) (5,296) 570 Less: Comprehensive (loss) income attributable to
noncontrolling interest . . . . . . . . . . . . . . . . . . . . . (2) 1 (1) Comprehensive (loss) income, attributable to
Aehr Test Systems. . . . . . . . . . . . . . . . . . . . . . . . . . . . $(2,798) $(5,297) $ 571 The accompanying notes are an integral part of these consolidated financial statements.

34
AEHR TEST SYSTEMS AND SUBSIDIARIES CONSOLIDATED STATEMENTS OF SHAREHOLDERS' EQUITY (IN THOUSANDS)
Total Aehr
Accumulated Test
Additional Other Systems Total
Common Stock Paid-in Comprehensive Accumulated Shareholders’ Noncontrolling Shareholders'
Shares Amount Capital Income Deficit Equity Interest Equity
Balances, May 31, 2017 21,340 $213 $81,128 $2,249 $(66,777) $ 16,813 $(19) $ 16,794
Issuance of common stock
under employee plans . . . . . . . 803 8 917 -- -- 925 -- 925
Stock-based compensation. . . . . . -- -- 996 -- -- 996 -- 996
Net income . . . . . . . . . . . . . . . . . . -- -- -- -- 528 528 -- 528
Foreign currency translation adjustment . . . . . . . -- -- -- 43 -- 43 (1) 42
Balances, May 31, 2018 22,143 221 83,041 2,292 (66,249) 19,305 (20) 19,285
Issuance of common stock
under employee plans. . . . . . . 526 6 553 -- -- 559 -- 559
Stock-based compensation. . . . . -- -- 905 -- -- 905 -- 905
Net loss . . . . . . . . . . . . . . . . . . . . -- -- -- -- (5,235) (5,235) -- (5,235)
Foreign currency
translation adjustment. . . . . . -- -- -- (62) -- (62) 1 (61)
Balances, May 31, 2019 22,669 227 84,499 2,230 (71,484) 15,472 (19) 15,453
Issuance of common stock
under employee plans. . . . . . . . 444 4 499 -- -- 503 -- 503
Shares repurchased for tax
withholdings on vesting of RSUs (6) -- (10) -- -- (10) -- (10)
Stock-based compensation. . . . . -- -- 910 -- -- 910 -- 910
Net loss . . . . . . . . . . . . . . . . . . . . -- -- -- -- (2,802) (2,802) -- (2,802)
Foreign currency
translation adjustment. . . . . . . -- -- -- 4 -- 4 (2) 2
Balances, May 31, 2020 23,107 $231 $85,898 $2,234 $(74,286) $14,077 $(21) $14,056
The accompanying notes are an integral part of these consolidated financial statements.

35
AEHR TEST SYSTEMS AND SUBSIDIARIES CONSOLIDATED STATEMENTS OF CASH FLOWS
(IN THOUSANDS)
Year Ended May 31,
2020 2019 2018
Cash flows from operating activities: Net (loss) income. . . . . . . . . . . . . . . . . . . . . . . . . . . . . . . . . . . . $(2,802) $ (5,235) $ 528 Adjustments to reconcile net (loss) income to net cash used in operating activities: Stock-based compensation expense . . . . . . . . . . . . . . . . . . . . 910 905 996
Recovery of doubtful accounts. . . . . . . . . . . . . . . . . . . . . . . . -- (3) (58)
Depreciation and amortization . . . . . . . . . . . . . . . . . . . . . . . . 384 431 417
Loss on disposal of assets. . . . . . . . . . . . . . . . . . . . . . . . . . . . 45 -- -- Changes in operating assets and liabilities: Accounts receivable . . . . . . . . . . . . . . . . . . . . . . . . . . . . . . . 1,161 (2,043) 1,260
Inventories . . . . . . . . . . . . . . . . . . . . . . . . . . . . . . . . . . . . . . 1,164 (112) (2,073)
Prepaid expenses and other. . . . . . . . . . . . . . . . . . . . . . . . . . 271 84 59
Accounts payable. . . . . . . . . . . . . . . . . . . . . . . . . . . . . . . . . . (1,024) 210 (1,095)
Accrued expenses . . . . . . . . . . . . . . . . . . . . . . . . . . . . . . . . . (589) 402 62
Customer deposits and deferred revenue. . . . . . . . . . . . . . . . (1,542) (355) (1,482)
Deferred rent. . . . . . . . . . . . . . . . . . . . . . . . . . . . . . . . . . . . . -- 90 63
Income taxes payable. . . . . . . . . . . . . . . . . . . . . . . . . . . . . . . (2) (11) (28)
Net cash used in operating activities. . . . . . . . . . . . . . . . . . . (2,024) (5,637) (1,351) Cash flows from investing activities: Purchases of property and equipment. . . . . . . . . . . . . . . . . . . . (163) (173) (572)
Net cash used in investing activities . . . . . . . . . . . . . . . . . . . (163) (173) (572) Cash flows from financing activities: Repayment of convertible notes. . . . . . . . . . . . . . . . . . . . . . . . -- (6,110) --
Proceeds from long-term debt. . . . . . . . . . . . . . . . . . . . . . . . . 1,679 -- -- Proceeds from issuance of common stock
under employee plans . . . . . . . . . . . . . . . . . . . . . . . . . . . . . . . 503 559 925 Shares repurchased for tax withholdings on vesting
of restricted stock units. . . . . . . . . . . . . . . . . . . . . . . . . . . . . . (10) -- --
Net cash provided by (used in) financing activities. . . . . . . . . 2,172 (5,551) 925 Effect of exchange rates on cash, cash equivalents and
restricted cash. . . . . . . . . . . . . . . . . . . . . . . . . . . . . . . . . . . . . . . . 20 (59) 43 Net increase (decrease) in cash, cash equivalents and
restricted cash. . . . . . . . . . . . . . . . . . . . . . . . . . . . . . . . . . . 5 (11,420) (955) Cash, cash equivalents and restricted cash, beginning of year. . . . . 5,508 16,928 17,883
Cash, cash equivalents and restricted cash, end of year. . . . . . . . . . $ 5,513 $ 5,508 $ 16,928
Supplemental cash flow information: Cash paid during the year for: Income taxes. . . . . . . . . . . . . . . . . . . . . . . . . . . . . . . . . . . . . . $ 42 $ 37 $ 37
Interest . . . . . . . . . . . . . . . . . . . . . . . . . . . . . . . . . . . . . . . . . . $ -- $ 610 $ 550 Supplemental disclosure of non-cash flow information: Net transfer of equipment between inventory
and property and equipment. . . . . . . . . . . . . . . . . . . . . . . . . $112 $ 119 $ --
The accompanying notes are an integral part of these consolidated financial statements.

36
AEHR TEST SYSTEMS AND SUBSIDIARIES NOTES TO CONSOLIDATED FINANCIAL STATEMENTS
1. ORGANIZATION AND SUMMARY OF SIGNIFICANT ACCOUNTING POLICIES: BUSINESS: Aehr Test Systems (the “Company”) was incorporated in California in May 1977 and primarily designs, engineers and manufactures test and burn-in equipment used in the semiconductor industry. The Company’s principal products are the Advanced Burn-In and Test System, or ABTS, the FOX full wafer contact parallel test and burn-in systems, the MAX burn-in system, the WaferPak full wafer contactor, the DiePak carrier and test fixtures. LIQUIDITY: Since inception, the Company has incurred substantial cumulative losses and negative cash flows from operations. In response, the Company took steps to minimize expense levels, entered into credit arrangements, and raised capital through public and private equity offerings, to increase the likelihood that it will have sufficient cash to support operations. At May 31, 2020, the Company had $5.4 million in cash and cash equivalents. The Company anticipates that the existing cash balance together with income from operations, collections of existing accounts receivable, revenue from its existing backlog of products, the sale of inventory on hand, deposits and down payments against significant orders will be adequate to meet its working capital and capital equipment requirements. The Company believes its existing cash and cash equivalents will be sufficient to meet its anticipated cash needs over the next 12 months. The Company’s future capital requirements will depend on many factors, including the Company’s growth rate, the timing and extent of its spending to support research and development activities, the timing and cost of establishing additional sales and marketing capabilities, the timing and cost to introduce new and enhanced products and the timing and cost to implement new manufacturing technologies. In the event that additional financing is required from outside sources, the Company may not be able to raise it on terms acceptable to the Company or at all. Any additional debt financing obtained by the Company in the future could also involve restrictive covenants relating to the Company’s capital-raising activities and other financial and operational matters, which may make it more difficult for the Company to obtain additional capital and to pursue business opportunities, including potential acquisitions. Additionally, if the Company raises additional funds through further issuances of equity, convertible debt securities or other securities convertible into equity, its existing stockholders could suffer significant dilution in their percentage ownership of the Company, and any new equity securities the Company issue could have rights, preferences and privileges senior to those of holders of the Company’s common stock. If the Company is unable to obtain adequate financing or financing on terms satisfactory to the Company when the Company requires it, the Company’s ability to continue to grow or support its business and to respond to business challenges could be significantly limited. CONSOLIDATION: The consolidated financial statements include the accounts of the Company and both its wholly-owned and majority-owned foreign subsidiaries. Intercompany accounts and transactions have been eliminated. FOREIGN CURRENCY TRANSLATION AND TRANSACTIONS: Assets and liabilities of the Company’s foreign subsidiaries and a branch office are translated into U.S. Dollars from their functional currencies of Japanese Yen, Euros and New Taiwan Dollars using the exchange rate in effect at the balance sheet date. Additionally, their net sales and expenses are translated using exchange rates approximating average rates prevailing during the fiscal year. Translation adjustments that arise from translating their financial statements from their local currencies to U.S. Dollars are accumulated and reflected as a separate component of shareholders’ equity. Transaction gains and losses that arise from exchange rate changes denominated in currencies other than the local currency are included in the Consolidated Statements of Operations as incurred. See Note 13, Other (Expense) Income, Net for the detail of foreign exchange transaction gains and losses for all periods presented. USE OF ESTIMATES: The preparation of financial statements in conformity with accounting principles generally accepted in the United States of America requires management to make estimates and assumptions that affect the reported amounts of assets and liabilities, disclosure of contingent assets and liabilities at the date of the financial statements and the reported amounts of revenues and expenses during the reporting period. Actual results could differ from those estimates.

37
Significant estimates in the Company’s consolidated financial statements include allowance for doubtful accounts, valuation of inventory at the lower of cost or net realizable value, and warranty reserves. CASH EQUIVALENTS: Cash equivalents consist of money market instruments purchased with an original maturity of three months or less. These investments are reported at fair value. ACCOUNTS RECEIVABLE AND ALLOWANCE FOR DOUBTFUL ACCOUNTS:
Accounts receivable are derived from the sale of products throughout the world to semiconductor manufacturers, semiconductor contract assemblers, electronics manufacturers and burn-in and test service companies. Accounts receivable are recorded at the invoiced amount and are not interest bearing. The Company maintains an allowance for doubtful accounts to reserve for potentially uncollectible trade receivables. The Company also reviews its trade receivables by aging category to identify specific customers with known disputes or collection issues. The Company exercises judgment when determining the adequacy of these reserves as the Company evaluates historical bad debt trends, general economic conditions in the United States and internationally, and changes in customer financial conditions. Uncollectible receivables are recorded as bad debt expense when all efforts to collect have been exhausted and recoveries are recognized when they are received. No significant adjustments to the allowance for doubtful accounts were recorded during the fiscal year ended May 31, 2020, 2019 or 2018.
CONCENTRATION OF CREDIT RISK:
The Company sells its products primarily to semiconductor manufacturers in North America, Asia, and Europe. As of May 31, 2020, approximately 13%, 62% and 25% of gross accounts receivable were from customers located in North America, Asia and Europe, respectively. As of May 31, 2019, approximately 49%, 25% and 26% of gross accounts receivable were from customers located in North America, Asia and Europe, respectively. Two customers accounted for 45% and 18% of gross accounts receivable as of May 31, 2020. Three customers accounted for 44%, 25% and 21% of gross accounts receivable as of May 31, 2019. Three customers accounted for 43%, 16% and 15% of net sales in fiscal 2020. Four customers accounted for 36%, 14%, 12% and 10% of net sales in fiscal 2019. The Company performs ongoing credit evaluations of its customers and generally does not require collateral. The Company uses letter of credit terms for some of its international customers. The Company’s cash and cash equivalents are generally deposited with major financial institutions in the United States, Japan, Germany and Taiwan. The Company invests its excess cash in money market funds and U.S. Treasury securities. The money market funds bear the risk associated with each fund. The money market funds have variable interest rates. The Company has not experienced any material losses on its money market funds or short-term cash deposits. CONCENTRATION OF SUPPLY RISK: The Company relies on subcontractors to manufacture many of the components and subassemblies used in its products. Quality or performance failures of the Company’s products or changes in its manufacturers’ financial or business condition could disrupt the Company’s ability to supply quality products to its customers and thereby have a material and adverse effect on its business and operating results. Some of the components and technologies used in the Company’s products are purchased and licensed from a single source or a limited number of sources. The loss of any of these suppliers may cause the Company to incur additional transition costs, result in delays in the manufacturing and delivery of its products, or cause it to carry excess or obsolete inventory and could cause it to redesign its products. INVENTORIES: Inventories include material, labor and overhead, and are stated at the lower of cost (first-in, first-out method) or net realizable value. Net realizable value is the estimated selling prices in the ordinary course of business, less costs of completion, disposal and transportation. Provisions for excess, obsolete and unusable inventories are made after management’s evaluation of future demand and market conditions. The Company adjusts inventory balances to approximate the lower of its manufacturing costs or net realizable value. If actual future demand or market conditions become less favorable than those projected by management, additional inventory write-downs may be required, and would be reflected in cost of sales in the period the revision is made. PROPERTY AND EQUIPMENT: Property and equipment are stated at cost less accumulated depreciation and amortization. Major improvements are capitalized, while repairs and maintenance are expensed as incurred. Leasehold improvements are amortized over the

38
lesser of their estimated useful lives or the term of the related lease. Furniture and fixtures, machinery and equipment, and test equipment are depreciated on a straight-line basis over their estimated useful lives. The ranges of estimated useful lives are generally as follows:
Furniture and fixtures . . . . . . . . . . . . . . . . . . . . . . . . . . . . . . . . 2 to 6 years
Machinery and equipment. . . . . . . . . . . . . . . . . . . . . . . . . . . . . 3 to 6 years
Test equipment . . . . . . . . . . . . . . . . . . . . . . . . . . . . . . . . . . . . . 4 to 6 years REVENUE RECOGNITION: In May 2014, the Financial Accounting Standards Board (“FASB”) issued FASB Accounting Standards Code (“ASC”) Topic 606, Revenue from Contracts with Customers (Topic 606), which was subsequently updated (collectively “ASC 606”). We adopted the standard as of June 1, 2018, using the modified retrospective method. Under this method, we applied ASC 606 to contracts that were not complete as of June 1, 2018 and recognized the cumulative effect of initially applying the standard as an adjustment to the opening balance of retained earnings. Results for reporting periods beginning after June 1, 2018 are presented in accordance with ASC 606. Under the modified retrospective adoption method, prior period amounts are not adjusted and are reported in accordance with the accounting standards in effect for those periods per FASB ASC Topic 605, Revenue Recognition, which is also referred to herein as “legacy GAAP.” The adoption of ASC 606 did not have a material impact on our consolidated financial statements as of June 1, 2018. No adjustment was recorded to accumulated deficit as of the adoption date and reported revenue would not have been different under legacy GAAP. Additionally, we do not expect the adoption of the revenue standard to have a material impact to our net income on an ongoing basis. We sell our products primarily through a direct sales force. In certain international markets, we sell our products through independent distributors. We consider revenue to be earned when all of the following criteria are met: • We have a contract with a customer that creates enforceable rights and obligations, • Promised performance obligations are identified, • The transaction price, or the amount we expect to receive, is determinable and • We have satisfied the performance obligations to the customer. Transfer of control is evidenced upon passage of title and risk of loss to the customer unless we are required to provide additional services. PRODUCT DEVELOPMENT COSTS AND CAPITALIZED SOFTWARE: Costs incurred in the research and development of new products or systems are charged to operations as incurred. Costs incurred in the development of software programs for the Company’s products are charged to operations as incurred until technological feasibility of the software has been established. Generally, technological feasibility is established when the software module performs its primary functions described in its original specifications, contains features required for it to be usable in a production environment, is completely documented and the related hardware portion of the product is complete. After technological feasibility is established, any additional costs are capitalized. Capitalization of software costs ceases when the software is substantially complete and is ready for its intended use. Capitalized costs are amortized over the estimated life of the related software product using the greater of the units of sales or straight-line methods over ten years. No system software development costs were capitalized or amortized in fiscal 2020, 2019 and 2018. IMPAIRMENT OF LONG-LIVED ASSETS: In the event that facts and circumstances indicate that the carrying value of assets may be impaired, an evaluation of recoverability would be performed. If an evaluation is required, the estimated future undiscounted cash flows associated with the asset would be compared to the asset’s carrying value to determine if a write-down is required. ADVERTISING COSTS: The Company expenses all advertising costs as incurred and the amounts were not material for all periods presented.

39
SHIPPING AND HANDLING OF PRODUCTS: Amounts billed to customers for shipping and handling of products are included in net sales. Costs incurred related to shipping and handling of products are included in cost of sales. INCOME TAXES: Income taxes have been provided using the liability method whereby deferred tax assets and liabilities are determined based on differences between financial reporting and tax bases of assets and liabilities and net operating loss and tax credit carryforwards measured using the enacted tax rates and laws that will be in effect when the differences are expected to reverse or the carryforwards are utilized. Valuation allowances are established when it is determined that it is more likely than not that such assets will not be realized. A full valuation allowance was established against all deferred tax assets, as management determined that it is more likely than not that deferred tax assets will not be realized, as of May 31, 2020 and 2019. The Company accounts for uncertain tax positions consistent with authoritative guidance. The guidance prescribes a “more likely than not” recognition threshold and measurement attribute for the financial statement recognition and measurement of a tax position taken or expected to be taken in a tax return. The Company does not expect any material change in its unrecognized tax benefits over the next twelve months. The Company recognizes interest and penalties related to unrecognized tax benefits as a component of income taxes. Although the Company files U.S. federal, various state, and foreign tax returns, the Company’s only major tax jurisdictions are the United States, California, Germany and Japan. Tax years 1996 – 2019 remain subject to examination by the appropriate governmental agencies due to tax loss carryovers, research and development tax credits, or other tax attributes from those years.
On March 27, 2020, the Coronavirus Aid, Relief, and Economic Security Act (CARES Act) was passed into law. The CARES Act includes several significant business tax provisions including modification to the taxable income limitation for utilization of net operating losses (NOLs) incurred in 2018, 2019 and 2020 and the ability to carry back NOLs from those years for a period of up to five years, an increase to the limitation on deductibility of certain business interest expense, bonus depreciation for purchases of qualified improvement property and special deductions on certain corporate charitable contributions. The Company is currently analyzing the impact of these changes and therefore an estimate of the impact to income taxes is not yet available.
On June 29, 2020, California Governor Gavin Newsom signed Assembly Bill 85 (AB 85) into law as part of the California 2020 Budget Act, which temporarily suspends the use of California net operating losses and imposes a cap on the amount of business incentive tax credits that companies can utilize against their net income for tax years 2020, 2021, and 2022. The Company analyzed the provisions of AB 85 and determined there was no impact on its provision for income taxes for the current period and will continue to evaluate the impact, if any, AB 85 may have on its condensed consolidated financial statements and disclosures. COMPREHENSIVE (LOSS) INCOME: Comprehensive (loss) income generally represents all changes in shareholders’ equity except those resulting from investments or contributions by shareholders. Unrealized gains and losses on foreign currency translation adjustments are included in the Company’s components of comprehensive (loss) income, which are excluded from net (loss) income. Comprehensive (loss) income is included in the statements of comprehensive (loss) income. RECENT ACCOUNTING PRONOUNCEMENTS: Accounting Standards Adopted Financial Instruments In January 2016, the FASB issued an accounting standard update related to the recognition and measurement of financial assets and financial liabilities. This standard changes accounting for equity investments and financial liabilities under the fair value option and the presentation and disclosure requirements for financial instruments. In addition, this standard clarifies guidance related to the valuation allowance assessment when recognizing deferred tax assets resulting from unrealized losses on available-for-sale debt securities. The Company adopted this new standard in fiscal year 2020. The adoption of this standard did not have a significant impact on the Company’s consolidated financial statements.

40
Leases In February 2016, the FASB issued ASC Update No. 2016-02, Leases (FASB ASC Topic 842, Leases). The Company adopted the standard as of June 1, 2019, using the modified retrospective approach and the transition method provided by ASC Update No. 2018-11, Leases (Topic 842): Targeted Improvements. Under this method, the Company applied the new leasing rules on the date of adoption and recognized the cumulative effect of initially applying the standard as an adjustment to its opening balance sheet, rather than at the earliest comparative period presented in the financial statements. Prior periods presented are in accordance with the previous lease guidance under FASB ASC Topic 840, Leases. In addition, the Company applied the package of practical expedients permitted under FASB ASC Topic 842 transition guidance to its entire lease portfolio at June 1, 2019. As a result, the Company was not required to reassess (i) whether any expired or existing contracts are or contain leases, (ii) the classification of any expired or existing leases or (iii) the treatment of initial direct costs for any existing leases. Furthermore, the Company elected not to separate lease and non-lease components for the majority of its leases. Instead, for all applicable classes of underlying assets, the Company accounted for each separate lease component and the non-lease components associated with that lease component as a single lease component. As a result of adopting FASB ASC Topic 842, Leases, on June 1, 2019, the Company recognized right-of-use assets of $2.7 million and corresponding liabilities of $2.8 million for its existing operating lease portfolio on its consolidated balance sheet. Operating lease right-of-use assets are presented as long-term assets and corresponding liabilities are presented within Operating lease liabilities, short-term and Operating lease liabilities, long-term on the Company’s consolidated balance sheet. There was no material impact to the Company’s consolidated statements of operations or consolidated statements of cash flows as a result of FASB ASC Topic 842, Leases. Please refer to Note “8. LEASES” for information regarding the Company’s lease portfolio as of May 31, 2020 as accounted for under FASB ASC Topic 842, Leases. Accounting Standards Not Yet Adopted Financial Instruments In June 2016, the FASB issued an accounting standard update (“ASU”) that requires measurement and recognition of expected credit losses for financial assets held based on historical experience, current conditions, and reasonable and supportable forecasts that affect the collectability of the reported amount. Due to a subsequent ASU in November 2019, the accounting standard will be effective for the Company beginning in the first quarter of fiscal 2024 on a modified retrospective basis, and early adoption in fiscal 2020 is permitted. The Company does not expect a material impact of this accounting standard on its consolidated financial statements. 2. REVENUE: Revenue recognition The Company recognizes revenue when promised goods or services are transferred to customers in an amount that reflects the consideration to which the Company expects to be entitled in exchange for those goods or services by following a five-step process: (1) identify the contract with a customer, (2) identify the performance obligations in the contract, (3) determine the transaction price, (4) allocate the transaction price, and (5) recognize revenue when or as the Company satisfies a performance obligation, as further described below. Performance obligations include sales of systems, contactors, spare parts, and services, as well as installation and training services included in customer contracts. A contract’s transaction price is allocated to each distinct performance obligation. In determining the transaction price, the Company evaluates whether the price is subject to refund or adjustment to determine the net consideration to which the Company expects to be entitled. The Company generally does not grant return privileges, except for defective products during the warranty period. For contracts that contain multiple performance obligations, the Company allocates the transaction price to the performance obligations on a relative standalone selling price basis. Standalone selling prices are based on multiple factors including, but not limited to, historical discounting trends for products and services and pricing practices in different geographies. Revenue for systems and spares are recognized at a point in time, which is generally upon shipment or delivery. Revenue from services is recognized over time as services are completed or ratably over the contractual period of generally one year or less.

41
The Company has elected the practical expedient to not assess whether a contract has a significant financing component as the Company’s standard payment terms are less than one year. Disaggregation of revenue The following tables show revenues by major product categories. Within each product category, contract terms, conditions and economic factors affecting the nature, amount, timing and uncertainty around revenue recognition and cash flow are substantially similar. The Company’s revenues by product category are as follows (in thousands):
Year Ended May 31,
2020 2019 2018
Type of good / service: Systems. . . . . . . . . . . . . . . . . . . . $ 8,099 $9,566 $18,174
Contactors . . . . . . . . . . . . . . . . . 10,784 6,154 6,500
Services . . . . . . . . . . . . . . . . . . . 3,408
5,336
4,881
$22,291 $21,056 $29,555
Product lines: Wafer-level. . . . . . . . . . . . . . . . . $19,768 $14,618 $13,080
Test During Burn-In. . . . . . . . . 2,523 6,438 16,475
$22,291 $21,056 $29,555
The following presents information about the Company’s operations in different geographic areas. Net sales are based upon ship-to location (in thousands):
Year Ended May 31,
2020 2019 2018
Geographic region: United States . . . . . . . . . . . . . . . $13,544 $13,468 $ 8,446
Asia. . . . . . . . . . . . . . . . . . . . . . . 7,556 5,648 19,973
Europe . . . . . . . . . . . . . . . . . . . . 1,191 1,940 1,136
$22,291 $21,056 $29,555
With the exception of the amount of service contracts and extended warranties, the Company’s product category revenues are recognized at point in time when control transfers to customers. The following presents revenue based on timing of recognition (in thousands):
Year Ended May 31,
2020 2019 2018
Timing of revenue recognition (in thousands): Products and services transferred at a point in time. . . . . . . . . . . . . . . . . $19,948 $18,473 $27,337 Services transferred over time . . . . . . 2,343 2,583 2,218
$22,291 $21,056 $29,555 Contract balances A receivable is recognized in the period the Company delivers goods or provides services or when the Company’s right to consideration is unconditional. The Company usually does not record contract assets because the Company has an unconditional right to payment upon satisfaction of the performance obligation, and therefore, a receivable is more commonly recorded than a contract asset. Contract liabilities include payments received in advance of performance under a contract and are satisfied as the associated revenue is recognized. Contract liabilities are reported on the Condensed Consolidated Balance Sheets at the

42
end of each reporting period as a component of deferred revenue. Contract liabilities as of May 31, 2020 and 2019 were $192,000 and $1,734,000, respectively. During the fiscal years ended May 31, 2020 and 2019, the Company recognized $1,545,000 and $1,273,000 of revenues that were included in contract liabilities as of May 31, 2019 and 2018, respectively. Remaining performance obligations On May 31, 2020, the Company had $192,000 of remaining performance obligations, which were comprised of deferred service contracts and extended warranty contracts not yet delivered. The Company expects to recognize approximately 88% of its remaining performance obligations as revenue in fiscal 2021, and an additional 12% in fiscal 2022 and thereafter. The foregoing excludes the value of other remaining performance obligations as they have original durations of one year or less, and also excludes information about variable consideration allocated entirely to a wholly unsatisfied performance obligation. Costs to obtain or fulfill a contract The Company generally expenses sales commissions when incurred as a component of selling, general and administrative expense as the amortization period is typically less than one year. Additionally, the majority of the Company’s cost of fulfillment as a manufacturer of products is classified as inventory and fixed assets, which are accounted for under the respective guidance for those asset types. Other costs of contract fulfillment are immaterial due to the nature of the Company’s products and their respective manufacturing process. 3. EARNINGS PER SHARE (“EPS”): Basic EPS is determined using the weighted average number of common shares outstanding during the period. Diluted EPS is determined using the weighted average number of common shares and potential common shares (representing the dilutive effect of stock options, RSUs and ESPP shares) outstanding during the period using the treasury stock method. The following table presents the computation of basic and diluted net (loss) income per share attributable to Aehr Test Systems common shareholders (in thousands, except per share data):
Year Ended May 31,
2020 2019 2018
Numerator: Net (loss) income. . . . . . . . . . . . . . . . . . . . . . . . . $ (2,802) $ (5,235) $ 528
Denominator for basic net (loss) income per share: Weighted-average shares outstanding . . . . . . . . . . . . . . . . . . 22,882 22,387 21,732
Shares used in basic net (loss) income per share calculation . . 22,882 22,387 21,732
Effect of dilutive securities. . . . . . . . . . . . . . . . . . . . . . . . . . . . -- -- 1,050
Denominator for diluted net (loss) income per share . . . . . . . . 22,882 22,387 22,782
Basic net (loss) income per share . . . . . . . . . . . . . . . . . . . . . . . $ (0.12) $ (0.23) $ 0.02
Diluted net (loss) income per share . . . . . . . . . . . . . . . . . . . . . . $ (0.12) $ (0.23) $ 0.02
For the purpose of computing diluted earnings per share, the weighted average number of potential common shares does not include stock options with an exercise price greater than the average fair value of the Company’s common stock for the period, as the effect would be anti-dilutive. In the fiscal years ended May 31, 2020 and 2019, potential common shares have not been included in the calculation of diluted net loss per share as the effect would be anti-dilutive. As such, the numerator and the denominator used in computing both basic and diluted net loss per share for these periods are the same. Stock options to purchase 3,153,000 and 3,107,000 shares of common stock were outstanding on May 31, 2020 and 2019, respectively, but were not included in the computation of diluted net loss per share, because the inclusion of such shares would be anti-dilutive. Stock options to purchase 1,313,000 shares of common stock were outstanding as of May 31, 2018 but were not included in the computation of diluted net income per share, because the inclusion of such shares would be anti-dilutive. ESPP rights to purchase 192,000 and 297,000 ESPP shares were outstanding on May 31, 2020 and 2019, respectively, but were not included in the computation of diluted net loss per share, because the inclusion of such shares would be anti-dilutive. RSUs for 10,000 shares and 23,000 shares were outstanding on May 31, 2020 and 2019, respectively, but were not included in the computation of diluted net loss

43
per share, because the inclusion of such shares would be anti-dilutive. The 2,657,000 shares convertible under the Convertible Notes outstanding on May 31, 2018 were not included in the computation of diluted net income (loss) per share, because the inclusion of such shares would be anti-dilutive. 4. FAIR VALUE OF FINANCIAL INSTRUMENTS: The Company’s financial instruments are measured at fair value consistent with authoritative guidance. This authoritative guidance defines fair value, establishes a framework for using fair value to measure assets and liabilities, and disclosures required related to fair value measurements. The guidance establishes a fair value hierarchy based on inputs to valuation techniques that are used to measure fair value that are either observable or unobservable. Observable inputs reflect assumptions market participants would use in pricing an asset or liability based on market data obtained from independent sources while unobservable inputs reflect a reporting entity’s pricing based upon their own market assumptions. The fair value hierarchy consists of the following three levels: Level 1 - instrument valuations are obtained from real-time quotes for transactions in active exchange markets involving identical assets. Level 2 - instrument valuations are obtained from readily-available pricing sources for comparable instruments. Level 3 - instrument valuations are obtained without observable market values and require a high level of judgment to determine the fair value. The following table summarizes the Company’s financial assets measured at fair value on a recurring basis as of May 31, 2020 (in thousands):
Balance as of
May 31, 2020 Level 1 Level 2 Level 3
Money market funds. . . . . $ 80 $ 80 $ -- $ --
Assets. . . . . . . . . . . . . . . . $ 80 $ 80 $ -- $ --
The following table summarizes the Company’s financial assets measured at fair value on a recurring basis as of May 31, 2019 (in thousands):
Balance as of
May 31, 2019 Level 1 Level 2 Level 3
Money market funds. . . . . $3,017 $3,017 $ -- $ --
Assets. . . . . . . . . . . . . . . . $3,017 $3,017 $ -- $ --
Included in Money market funds as of May 31, 2020 and 2019 is $80,000 restricted cash representing a security deposit for the Company’s United States manufacturing and office space lease. There were no financial liabilities measured at fair value as of May 31, 2020 and 2019. There were no transfers between Level 1 and Level 2 fair value measurements during the fiscal years ended May 31, 2020 and 2019. The carrying amounts of financial instruments including cash, cash equivalents, receivables, accounts payable and certain other accrued liabilities, approximate fair value due to their short maturities. Based on the borrowing rates currently available to the Company for loans with similar terms, the carrying value of the debt approximates the fair value.

44
5. ACCOUNTS RECEIVABLE: Accounts receivable comprise (in thousands):
May 31,
2020 2019
Accounts receivable. . . . . . . . . . . . . . . . . . . . $3,717 $4,859
Less: Allowance for doubtful accounts . . . . . -- --
$3,717 $4,859
Additions
Balance at charged to Balance
beginning costs and at end
of year expenses Deductions* of year
Allowance for doubtful accounts receivable: May 31, 2020 . . . . . . . . . . . . . . . $ 0 $ -- $ (0) $ --
May 31, 2019 . . . . . . . . . . . . . . . $ 4 $ -- $ (4) $ --
* Deductions include write-offs of uncollectible accounts, collections of amounts previously reserved, and releases of allowance for doubtful accounts credited to expense. 6. BALANCE SHEET DETAIL: INVENTORIES:
May 31,
(In Thousands) 2020 2019
Raw materials and sub-assemblies. . . . . . $5,055 $5,471
Work in process. . . . . . . . . . . . . . . . . . . . 2,917 3,580
Finished goods. . . . . . . . . . . . . . . . . . . . . 17 10
$7,989 $9,061
During the year ended May 31, 2020 and 2019, the Company wrote down $1,669,000 and $1,168,000 of inventory, respectively. PROPERTY AND EQUIPMENT, NET:
May 31,
(In Thousands) 2020 2019
Leasehold improvements. . . . . . . . . . . . . $1,201 $1,154
Furniture and fixtures . . . . . . . . . . . . . . . 612 983
Machinery and equipment. . . . . . . . . . . . 3,038 3,097
Test equipment. . . . . . . . . . . . . . . . . . . . 2,516 2,604
7,367 7,838 Less: Accumulated depreciation and amortization. . . . . . . . . . . . . . . . . . (6,704) (6,793)
$663 $ 1,045
Depreciation expense was $384,000, $431,000 and $417,000 for fiscal 2020, 2019, and 2018, respectively.

45
ACCRUED EXPENSES:
May 31,
(In Thousands) 2020 2019
Payroll related. . . . . . . . . . . . . . . . . . . . . . . $ 791 $ 990
Warranty. . . . . . . . . . . . . . . . . . . . . . . . . . . 246 154
Professional services. . . . . . . . . . . . . . . . . . 173 162
Commissions and bonuses. . . . . . . . . . . . . 139 168
Taxes payable . . . . . . . . . . . . . . . . . . . . . . . 30 29
Investor relations . . . . . . . . . . . . . . . . . . . . 19 19
Restructuring . . . . . . . . . . . . . . . . . . . . . . . 8 408
Material purchases . . . . . . . . . . . . . . . . . . . -- 65
Other . . . . . . . . . . . . . . . . . . . . . . . . . . . . . 33 39
$1,439 $2,034
CUSTOMER DEPOSITS AND DEFERRED REVENUE, SHORT-TERM:
May 31,
(In Thousands) 2020 2019
Customer deposits. . . . . . . . . . . . . . . . . . . . . . . $ -- $ 1,003
Deferred revenue . . . . . . . . . . . . . . . . . . . . . . . 170 542
$170 $1,545
7. INCOME TAXES: Domestic and foreign components of (loss) income before income tax (expense) benefit are as follows (in thousands):
Year Ended May 31,
2020 2019 2018
Domestic. . . . . . . . . . . . . . . . . . . . . . . . . . . $ (2,751) $(5,273) $ 433
Foreign . . . . . . . . . . . . . . . . . . . . . . . . . . . . (15) 65 22
$ (2,766) $(5,208) $ 455
The income tax (expense) benefit consists of the following (in thousands):
Year Ended May 31,
2020 2019 2018
Federal income taxes: Current . . . . . . . . . . . . . . . . . . . . . . . . . . $ -- $ -- $ 99
Deferred . . . . . . . . . . . . . . . . . . . . . . . . . -- -- -- State income taxes: Current . . . . . . . . . . . . . . . . . . . . . . . . . . (30) (6) (22)
Deferred . . . . . . . . . . . . . . . . . . . . . . . . . -- -- -- Foreign income taxes: Current . . . . . . . . . . . . . . . . . . . . . . . . . . (6) (21) (4)
Deferred . . . . . . . . . . . . . . . . . . . . . . . . . -- -- -- $ (36) $ (27) $ 73

46
The Company’s effective tax rate differs from the U.S. federal statutory tax rate, as follows:
Year Ended May 31,
2020 2019 2018
U.S. federal statutory tax rate. . . . . . . . . . . 21.0 % 21.0 % 28.6 %
State taxes, net of federal tax effect. . . . . . 1.4 (1.0) (16.7)
Foreign rate differential. . . . . . . . . . . . . . . (21.5) (0.7) 39.4
Stock-based compensation . . . . . . . . . . . . (4.0) (2.8) 39.9
Research and development credit . . . . . . . -- 1.5 5.9
Change in valuation allowance. . . . . . . . . . 4.3 (15.6) (1,349.2)
Federal rate change impact . . . . . . . . . . . -- -- 1,419.7
Federal AMT refund . . . . . . . . . . . . . . . . -- -- (20.0)
ASU 2016-09 adoption . . . . . . . . . . . . . . . -- -- (169.1)
Other. . . . . . . . . . . . . . . . . . . . . . . . . . . . . (2.5) (2.9) 5.4
Effective tax rate. . . . . . . . . . . . . . . . . . . . (1.3)% (0.5)% (16.1)%
The components of the net deferred tax assets and liabilities are as follows (in thousands):
Year Ended May 31,
2020 2019
Deferred tax assets:
Net operating losses. . . . . . . . . . . . . . . . . $13,634 $13,475
Lease Liability . . . . . . . . . . . . . . . . . . . . . 483 --
Credit carryforwards. . . . . . . . . . . . . . . . . 5,089 4,995
Inventory reserves . . . . . . . . . . . . . . . . . . 1,005 790
Reserves and accruals. . . . . . . . . . . . . . . . 739 1,379
Other. . . . . . . . . . . . . . . . . . . . . . . . . . . . 319 298
21,269 20,937
Deferred tax liabilities:
Operating lease right-of-use assets. . . . . . (449) --
Less: Valuation allowance . . . . . . . . . . . . (20,820) (20,937)
Net deferred tax assets (liabilities). . . . . . $ -- $ --
The valuation allowance decreased by $118,000 during fiscal 2020, increased by $813,000 during fiscal 2019, and decreased by $6,139,000 during fiscal 2018. As of May 31, 2020 and 2019, the Company concluded that it is more likely than not that the deferred tax assets will not be realized and therefore provided a full valuation allowance against the deferred tax assets. The Company will continue to evaluate the need for a valuation allowance against its deferred tax assets on a quarterly basis. At May 31, 2020, the Company had federal and state net operating loss carryforwards of $54,601,000 and $29,386,000, respectively. The federal and state net operating loss carryforwards will begin to expire in 2024. Federal net operating losses of $3.7 million will carryforward indefinitely. At May 31, 2020, the Company also had federal and state research and development tax credit carryforwards of $2,026,000 and $5,825,000, respectively. The federal credit carryforward will begin to expire in 2022, and the California credit will carryforward indefinitely. These carryforwards may be subject to certain limitations on annual utilization in case of a change in ownership, as defined by tax law. The Company also has alternative minimum tax credit carryforwards of $34,000 for state purposes. The credits may be used to offset regular tax and do not expire. The Company has made no provision for U.S. income taxes on undistributed earnings of certain foreign subsidiaries because it is the Company’s intention to permanently reinvest such earnings in its foreign subsidiaries. If such earnings were distributed, the Company would be subject to additional U.S. income tax expense. Determination of the amount of unrecognized deferred income tax liability related to these earnings is not practicable. Foreign net operating loss carryforwards of $378,000 are available to reduce future foreign taxable income. The foreign net operating losses will expire starting fiscal year 2021.

47
The Company maintains liabilities for uncertain tax positions. These liabilities involve considerable judgment and estimation and are continuously monitored by management based on the best information available. The aggregate changes in the balance of gross unrecognized tax benefits are as follows (in thousands):
Beginning balance as of May 31, 2017. . . . . . . . . . . . . $ 789
Increases related to prior year tax positions. . . . . . . . . 889
Increases related to current year tax positions. . . . . . . 107
Balance at May 31, 2018 . . . . . . . . . . . . . . . . . . . . . . . $1,785
Decreases related to prior year tax positions. . . . . . . . (41)
Increases related to current year tax positions. . . . . . . 65
Balance at May 31, 2019 . . . . . . . . . . . . . . . . . . . . . . . $1,809
Decreases related to prior year tax positions. . . . . . . . (11)
Increases related to current year tax positions. . . . . . 54
Balance at May 31, 2020 . . . . . . . . . . . . . . . . . . . . . . . $1,852
The ending balance of $1,852,000 of unrecognized tax benefits as of May 31, 2020, if recognized, would not impact the effective tax rate. On December 22, 2017, the U.S. government enacted comprehensive tax legislation commonly referred to as the Tax Cuts and Jobs Act (the “Tax Act”). On December 22, 2017, the SEC staff issued Staff Accounting Bulletin No. 118 (“SAB 118”), which provides guidance on accounting for the tax effects of the Tax Act. SAB 118 provides a measurement period that should not extend beyond one year from the Tax Act enactment date for companies to complete the accounting under ASC 740, Income taxes. In accordance with SAB 118, a company must reflect the income tax effects of those aspects of the Tax Act for which the accounting under ASC 740 is complete. To the extent that a company’s accounting for certain income tax effects of the Tax Act is incomplete but it is able to determine a reasonable estimate, it must record a provisional estimate in the financial statements. As part of the transition to the new territorial tax system, the Tax Act imposes a one-time repatriation tax on deemed repatriation of historical earnings of foreign subsidiaries. The company is not subject to the transition tax. The one-time transition tax is based on post-1986 earnings and profits that were previously deferred from U.S. income tax. During fiscal 2020 the Company finalized its calculation of the transition tax and due to carryover losses and the valuation allowance the Company determined there was no impact to the financial statements as a result of the completion of the analysis. The Company also finalized its adjustment to the deferred tax assets and offset to the valuation allowance for the reduction in the U.S. corporate tax rate to 21% with no financial statement impact. The tax reform repealed the corporate alternative minimum tax, or AMT, effective December 31, 2017. The minimum tax credit is refundable for any tax year beginning after December 31, 2017 and before December 31, 2020 in an amount equal to 50% of the excess of the minimum tax credit over the allowable credit for the year against the regular tax liability. Any unused minimum tax credit carryforward is refundable in the following year. The company recorded a $91,000 benefit for its federal refundable AMT credit in Q3 fiscal 2018. 50% of the refundable credit was claimed through the fiscal year 2019 federal income tax return and received by the end of fiscal year 2020. The remaining 50% of the refundable credit will be claimed through the fiscal year 2020 federal income tax return. On December 18, 2019, the FASB issued Accounting Standards Update ASU 2019-12 on Simplifying the Accounting for Income Taxes. The board decided to remove the exception to the incremental approach for intra-period tax allocation when there is a loss from continuing operations and income or gain from other items (for example discontinued operations or other comprehensive income). There are also provisions related to state taxes and calculating income taxes in an interim period when a year-to-date loss exceeds the anticipated loss for the year. The Company has not yet adopted ASU 2019-12 and believes upon adoption there would be no material impact. On March 27, 2020, the CARES Act was signed into law. The CARES Act includes provisions relating to refundable payroll tax credits, deferment of the employer portion of certain payroll taxes, net operating loss carryback periods, alternative minimum tax credit refunds, modifications to the net interest deduction limitations and technical corrections to tax depreciation methods for qualified improvement property. The Company is currently analyzing the impact of these changes and therefore an estimate of the impact to income taxes is not yet available.

48
Although the Company files U.S. federal, various state, and foreign tax returns, the Company’s only major tax jurisdictions are the United States, California, Germany and Japan. Tax years 1996 – 2019 remain subject to examination by the appropriate governmental agencies due to tax loss carryovers, research and development tax credits, or other tax attributes from those years. 8. LEASES The Company leases most of its manufacturing and office space under operating leases. The Company entered into non-cancelable operating lease agreements for its United States manufacturing and office facilities and maintains equipment under non-cancelable operating leases in Germany. The Company’s principal administrative and production facilities are located in Fremont, California, in a 51,289 square foot building. The Company’s lease was renewed in February 2018 and expires in July 2023. The Company maintained a facility in Japan located in a 418 square foot office in Tokyo under a lease which expired in June 2020. The Company also maintained a 1,585 square foot warehouse in Yamanashi under a lease which expired in June 2020. The Company substantially closed its subsidiary Aehr Test Systems Japan K.K. in March 2020, completing the liquidation of the legal entity in July 2020, see Note 16, “Restructuring,” of the Notes to Consolidated Financial Statements. The Company leases a 492 square foot sales and support office in Utting, Germany. The lease, which began February 1, 1992 and expires on January 31, 2022, contains an automatic twelve months renewal, at rates to be determined, if no notice is given prior to six months from expiry. Under the lease agreements, the Company is responsible for payments of utilities, taxes and insurance. The Company has only operating leases for real estate including corporate offices, warehouse space and certain equipment. A lease with an initial term of 12 months or less is generally not recorded on the condensed consolidated balance sheet, unless the arrangement includes an option to purchase the underlying asset, or renew the arrangement that the Company is reasonably certain to exercise (short-term leases). The Company recognizes lease expense on a straight-line basis over the lease term for short-term leases that the Company does not record on its balance sheet. The Company’s operating leases have remaining lease terms of 4 months to 3 years. The Company determines whether an arrangement is or contains a lease based on the unique facts and circumstances present at the inception of the arrangement. Operating lease liabilities and their corresponding right-of-use assets are recorded based on the present value of lease payments over the expected lease term. The interest rate implicit in lease contracts is typically not readily determinable. As such, the Company utilizes the appropriate incremental borrowing rate, which is the rate incurred to borrow on a collateralized basis over a similar term at an amount equal to the lease payments in a similar economic environment. Certain adjustments to the right-of-use asset may be required for items such as initial direct costs paid or incentives received. The weighted-average remaining lease term for the Company’s operating leases was 3.2 years at May 31, 2020 and the weighted-average discount rate was 5.5%. The Company’s operating lease cost under FASB ASC Topic 842 was $734,000 for the year ended May 31, 2020. Rent expense under FASB ASC Topic 840 was $787,000 for the year ended May 31, 2019. The following table presents supplemental cash flow information related to the Company’s operating leases (in thousands):
Year Ended May 31, 2020
Cash paid for amounts included in the measurement of operating lease liabilities
Operating cash flows from operating leases $737

49
The following table presents the maturities of the Company’s operating lease liabilities as of May 31, 2020 (in thousands):
Fiscal year Operating Leases
2021 $ 765
2022 779
2023 795
2024 134
2025 --
Thereafter --
Total future minimum operating lease payments $2,473
Less: imputed interest 210
Present value of operating lease liabilities $2,263
9. BORROWING AND FINANCING ARRANGEMENTS: On January 16, 2020, the Company entered into a Loan and Security Agreement (the “Loan Agreement”) with Silicon Valley Bank (“SVB”). Pursuant to the Loan Agreement, the Company may borrow up to (a) the lesser of (i) the revolving line of $4.0 million or (ii) the amount available under the borrowing base minus (b) the outstanding principal balance of any advances, under a revolving line of credit which is collateralized by all the Company’s assets except intellectual property. The borrowing base is 80% of eligible accounts, as determined by SVB from the Company’s most recent borrowing base statement; provided, however, SVB has the right to decrease the foregoing percentage in its good faith business judgment to mitigate the impact of certain events or conditions, which may adversely affect the collateral or its value. Subject to an event of default, the principal amount outstanding under the revolving line of credit will accrue interest at a floating per annum rate equal to the greater of (a) the prime rate plus an additional percentage of up to 1%, which additional percentage depends on the Company’s adjusted quick ratio, and (b) 4.75%. Interest is payable monthly on the last calendar day of each month and the outstanding principal amount, the unpaid interest and all other obligations are due on the maturity date, which is 364 days from the effective date of January 13, 2020. At May 31, 2020, the Company had not drawn against the credit facility and was in compliance with all covenants related to obligations to meet reporting requirements. The balance available to borrow under the line at May 31, 2020 was $263,000. There are no financial covenants in the agreement. 10. LONG-TERM DEBT: On April 23, 2020, the Company obtained the PPP Loan in the aggregate amount of $1,678,789 from SVB. The PPP Loan was evidenced by a promissory note dated April 23, 2020 (the “Note”) that matures on April 23, 2022 and bears interest at a rate of 1% per annum, payable monthly commencing on November 23, 2020. The PPP Loan proceeds were used for payroll, health care benefits, rent and utilities. Under the terms of the CARES Act, PPP loan recipients can apply for and be granted forgiveness for all or a portion of loans granted under the PPP. Such forgiveness will be determined, subject to limitations, based on the use of loan proceeds for payment of payroll costs, covered rent and mortgage obligations, and covered utility payments incurred by the Company. The Company intends to apply for forgiveness of the PPP Loan with respect to these covered expenses. No assurance can be given that the Company will obtain forgiveness of the amount due under the loan in whole or in part. 11. STOCKHOLDERS’ EQUITY, COMPREHENSIVE INCOME AND STOCK-BASED COMPENSATION: STOCK-BASED COMPENSATION: Stock-based compensation expense consists of expenses for stock options, restricted stock units, or RSUs, and employee stock purchase plan, or ESPP, purchase rights. Stock-based compensation expense for stock options and ESPP purchase rights is measured at each grant date, based on the fair value of the award using the Black-Scholes option valuation model, and is recognized as expense over the employee’s requisite service period. This model was developed for use in estimating the value of publicly traded options that have no vesting restrictions and are fully transferable. The Company’s employee stock options have characteristics significantly different from those of publicly traded options.

50
For RSUs, stock-based compensation expense is based on the fair value of the Company’s common stock at the grant date. All of the Company’s stock-based compensation is accounted for as equity instruments. The following table summarizes the stock-based compensation expense for the fiscal years ended May 31, 2020, 2019 and 2018 (in thousands, except per share data):
Year Ended May 31,
2020 2019 2018
Stock-based compensation in the form of stock options, RSUs, and ESPP purchase rights, included in: Cost of sales. . . . . . . . . . . . . . . . . . . . . . . . . . . . . . . . $80 $104 $148
Selling, general and administrative. . . . . . . . . . . . . . . 631 545 592
Research and development . . . . . . . . . . . . . . . . . . . . 199 256 256 Net effect on net (loss) income. . . . . . . . . . . . . . . . . $910 $905 $996 Effect on net (loss) income per share: Basic. . . . . . . . . . . . . . . . . . . . . . . . . . . . . . . . . . . . . $0.04 $0.04 $0.05
Diluted. . . . . . . . . . . . . . . . . . . . . . . . . . . . . . . . . . . $0.04 $0.04 $0.04 As of May 31, 2020, 2019 and 2018, there were no stock-based compensation expenses capitalized as part of inventory. During fiscal 2020, 2019 and fiscal 2018, the Company recorded stock-based compensation related to stock options and restricted stock units of $751,000, $650,000 and $706,000, respectively. As of May 31, 2020, the total compensation expense related to unvested stock-based awards under the Company’s 2016 Equity Incentive Plan, but not yet recognized, was $1,131,000 which is net of estimated forfeitures of $3,000. This expense will be amortized on a straight-line basis over a weighted average period of approximately 2.6 years. During fiscal 2020, 2019 and fiscal 2018, the Company recorded stock-based compensation related to its ESPP of $159,000, $255,000 and $290,000, respectively. The increase in fiscal 2018 is primarily due to employees increasing their ESPP elections during the fiscal year. As of May 31, 2020, the total compensation expense related to purchase rights under the ESPP but not yet recognized was $59,000. This expense will be amortized on a straight-line basis over a weighted average period of approximately 0.8 years. Valuation Assumptions Valuation and Amortization Method. The Company estimates the fair value of stock options granted using the Black-Scholes option valuation method and a single option award approach. The fair value under the single option approach is amortized on a straight-line basis over the requisite service periods of the awards, which is generally the vesting period. Expected Term. The Company’s expected term represents the period that the Company’s stock-based awards are expected to be outstanding and was determined based on historical experience, giving consideration to the contractual terms of the stock-based awards, vesting schedules and expectations of future employee behavior as evidenced by changes to the terms of its stock-based awards. Volatility. Volatility is a measure of the amounts by which a financial variable such as stock price has fluctuated (historical volatility) or is expected to fluctuate (expected volatility) during a period. The Company uses the historical volatility for the past five years, which matches the expected term of most of the option grants, to estimate expected volatility. Volatility for each of the ESPP’s four time periods of six months, twelve months, eighteen months, and twenty-four months is calculated separately and included in the overall stock-based compensation expense recorded. Risk-Free Interest Rate. The Company bases the risk-free interest rate used in the Black-Scholes option valuation method on the implied yield in effect at the time of option grant on U.S. Treasury zero-coupon issues with a remaining term equivalent to the expected term of the stock awards including the ESPP. Fair Value. The fair values of the Company’s stock options granted to employees in fiscal 2020, 2019 and 2018 were estimated using the following weighted average assumptions in the Black-Scholes option valuation method:

51
Year Ended May 31,
2020 2019 2018
Expected term (in years) . . . . . . . . . . . . . . . . . . . . . . . 5 5 4
Volatility . . . . . . . . . . . . . . . . . . . . . . . . . . . . . . . . . . . 0.72 0.72 0.77
Risk-free interest rates. . . . . . . . . . . . . . . . . . . . . . . . . 1.56% 2.83% 1.95%
Weighted-average grant date fair value. . . . . . . . . . . . . $0.95 $1.33 $2.07 The fair value of our ESPP purchase rights for the fiscal 2020, 2019 and 2018 was estimated using the following weighted-average assumptions:
Year End May 31,
2020 2019 2018
Expected term (in years) . . . . . . . . . . . . . . . . . . . . . . . 0.5 – 2.0 0.5 – 2.0 0.5 – 2.0
Volatility. . . . . . . . . . . . . . . . . . . . . . . . . . . . . . . . . . . . 0.62 – 0.77 0.48 – 0.78 0.56 – 0.81
Risk-free interest rates. . . . . . . . . . . . . . . . . . . . . . . . . 0.14%–1.81% 2.33%–2.82% 1.92%–2.25%
Weighted-average grant date fair value. . . . . . . . . . . . . $0.79 $1.14 $1.01 EQUITY INCENTIVE PLAN: In October 2006, the Company’s 2006 Equity Incentive Plan was approved by the shareholders, which provides for granting of incentive stock options, non-statutory stock options, restricted stock, restricted stock units, stock appreciation rights, performance units, performance shares and other stock or cash awards as the Company’s Board of Directors may determine. In October 2016, the Company’s 2016 Equity Incentive Plan was approved by the Company’s shareholders. The 2016 Equity Incentive Plan replaced our 2006 Equity Incentive Plan, which was scheduled to expire in October 2016, and will continue in effect until 2026. A total of 3,435,000 shares of common stock have been reserved for issuance under the Company’s 2016 Equity Incentive Plan, which includes 1,835,000 shares that remained available for issuance under the 2006 Equity Incentive Plan. See the Company’s Registration Statement on Form S-8 filed with the Securities and Exchange Commission on November 22, 2019 for further information regarding the 2016 Equity Incentive Plan. As of May 31, 2020, out of the 4,813,000 shares authorized for grant under the 2016 Equity Incentive Plan, 3,163,000 stock options and RSUs were outstanding. As of May 31, 2019, out of the 4,277,000 shares authorized for grant under the 2016 Equity Incentive Plan, 3,129,000 stock options and RSUs were outstanding.
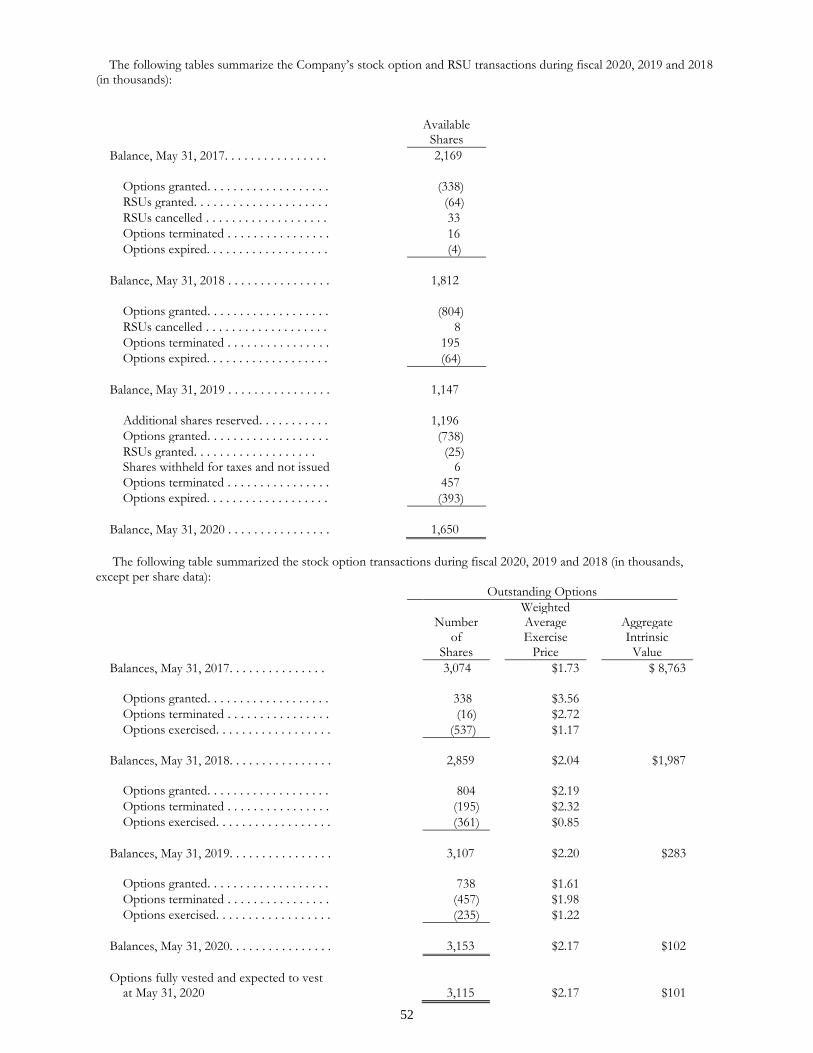
52
The following tables summarize the Company’s stock option and RSU transactions during fiscal 2020, 2019 and 2018 (in thousands):
Available Shares
Balance, May 31, 2017. . . . . . . . . . . . . . . . 2,169
Options granted. . . . . . . . . . . . . . . . . . . (338)
RSUs granted. . . . . . . . . . . . . . . . . . . . . (64)
RSUs cancelled . . . . . . . . . . . . . . . . . . . 33
Options terminated . . . . . . . . . . . . . . . . 16
Options expired. . . . . . . . . . . . . . . . . . . (4)
Balance, May 31, 2018 . . . . . . . . . . . . . . . . 1,812
Options granted. . . . . . . . . . . . . . . . . . . (804)
RSUs cancelled . . . . . . . . . . . . . . . . . . . 8
Options terminated . . . . . . . . . . . . . . . . 195
Options expired. . . . . . . . . . . . . . . . . . . (64)
Balance, May 31, 2019 . . . . . . . . . . . . . . . . 1,147
Additional shares reserved. . . . . . . . . . . 1,196
Options granted. . . . . . . . . . . . . . . . . . . (738)
RSUs granted. . . . . . . . . . . . . . . . . . . (25) Shares withheld for taxes and not issued 6
Options terminated . . . . . . . . . . . . . . . . 457
Options expired. . . . . . . . . . . . . . . . . . . (393)
Balance, May 31, 2020 . . . . . . . . . . . . . . . . 1,650
The following table summarized the stock option transactions during fiscal 2020, 2019 and 2018 (in thousands, except per share data):
Outstanding Options
Weighted Number Average Aggregate
of Exercise Intrinsic Shares Price Value
Balances, May 31, 2017. . . . . . . . . . . . . . . 3,074 $1.73 $ 8,763
Options granted. . . . . . . . . . . . . . . . . . . 338 $3.56
Options terminated . . . . . . . . . . . . . . . . (16) $2.72
Options exercised. . . . . . . . . . . . . . . . . . (537) $1.17
Balances, May 31, 2018. . . . . . . . . . . . . . . . 2,859 $2.04 $1,987
Options granted. . . . . . . . . . . . . . . . . . . 804 $2.19
Options terminated . . . . . . . . . . . . . . . . (195) $2.32
Options exercised. . . . . . . . . . . . . . . . . . (361) $0.85
Balances, May 31, 2019. . . . . . . . . . . . . . . . 3,107 $2.20 $283
Options granted. . . . . . . . . . . . . . . . . . . 738 $1.61
Options terminated . . . . . . . . . . . . . . . . (457) $1.98
Options exercised. . . . . . . . . . . . . . . . . . (235) $1.22
Balances, May 31, 2020. . . . . . . . . . . . . . . . 3,153 $2.17 $102
Options fully vested and expected to vest at May 31, 2020 3,115 $2.17 $101

53
The options outstanding and exercisable at May 31, 2020 were in the following exercise price ranges (in thousands, except per share data):
Options Outstanding Options Exercisable
at May 31, 2020 at May 31, 2020
Range of Exercise Prices
Number Outstanding
Shares
Weighted Average
Remaining Contractual Life (Years)
Weighted Average Exercise
Price
Number Exercisable
Shares
Weighted Average
Remaining Contractual Life (Years)
Weighted Average Exercise
Price
Aggregate Intrinsic
Value
$1.22-$1.28 248 2.10 $1.26 176 0.19 $1.28 $1.64-$1.77 945 5.35 $1.66 487 4.66 $1.68 $2.03-$2.46 1,223 3.70 $2.21 858 3.03 $2.19 $2.63-$2.81 511 1.29 $2.70 510 1.28 $2.70 $3.46-$3.93 226 4.16 $3.84 172 4.18 $3.82
$1.22-$3.93 3,153 3.71 $2.17 2,203 2.85 $2.25 $67
The total intrinsic values of options exercised were $160,000, $338,000 and $1,058,000 during fiscal 2020, 2019 and 2018, respectively. The weighted average contractual life of the options exercisable and expected to be exercisable at May 31, 2020 was 3.69 years. Options to purchase 2,203,000, 2,314,000 and 2,312,000 shares were exercisable at May 31, 2020, 2019 and 2018, respectively. These exercisable options had weighted average exercise prices of $2.25, $2.14 and $1.89 as of May 31, 2020, 2019 and 2018, respectively. During the fiscal year ended May 31, 2020, RSUs for 10,000 shares, net of 6,000 shares withheld to settle payroll taxes, were granted and fully vested to employees. The market value on the date of the grant of these RSUs was $1.64 per share. During the fiscal year ended May 31, 2020, 13,000 RSUs became fully vested and there was no cancellation. 10,000 RSUs were outstanding and unvested at May 31, 2020. The intrinsic value of the outstanding and unvested RSUs at May 31, 2020 was $16,000. During the fiscal year ended May 31, 2019, there were no RSUs granted to employees. During the fiscal year ended May 31, 2019, 16,000 RSUs became fully vested and 8,000 RSUs were cancelled. 23,000 RSUs were outstanding and unvested at May 31, 2019. The intrinsic value of the outstanding and unvested RSUs at May 31, 2019 was $40,000. During the fiscal year ended May 31, 2018, RSUs for 64,000 shares were granted to employees. The market value on the date of the grant of these RSUs was $3.93 per share. During the fiscal year ended May 31, 2018, 16,000 RSUs became fully vested and 33,000 RSUs were cancelled. 47,000 RSUs were outstanding and unvested at May 31, 2018. The intrinsic value of the outstanding and unvested RSUs at May 31, 2018 was $122,000. During the fiscal year ended May 31, 2020, RSUs for 9,000 shares were granted and fully vested to members of the Company’s Board of Directors. The weighted average market value on the date of the grant of these RSUs was $1.64 per share. There were no RSUs granted to members of the Board of Directors during fiscal 2019 and 2018. EMPLOYEE STOCK PURCHASE PLAN: In October 2006, the Company’s shareholders approved the 2006 Employee Stock Purchase Plan. In October 2016, the Company’s shareholders approved the Company’s Amended and Restated 2006 Employee Stock Purchase Plan (the “Purchase Plan”), which amended and restated the 2006 Employee Stock Purchase Plan. The Purchase Plan extended the term of the 2006 Employee Stock Purchase Plan indefinitely. See the Company’s Registration Statements on Form S-8 filed with the Securities and Exchange Commission on November 14, 2016 and November 21, 2018 for further information regarding the Purchase Plan. The Purchase Plan has consecutive, overlapping, twenty-four month offering periods. Each twenty-four-month offering period includes four six-month purchase periods. The offering periods generally begin on the first trading day on or after April 1 and October 1 each year. All employees who work a minimum of 20 hours per week and are customarily employed by the Company (or an affiliate thereof) for at least five months per calendar year are eligible to participate. Under the Purchase Plan, shares are purchased through employee payroll deductions at exercise prices equal to 85% of the lesser of the fair market value of the Company’s common stock at either the first day of an offering period or the last day of the purchase period. If a participant’s rights to purchase stock under all employee stock purchase plans of the Company accrue at a rate which exceeds $25,000 worth of stock for a calendar year, such participant may not be granted an option to purchase stock under the Purchase Plan. The maximum number of shares a participant may purchase during a single purchase period is 3,000 shares. In October 2018, the Company’s shareholders approved an amendment to the Purchase Plan to increase the number of shares authorized for issuance thereunder by an additional 350,000 shares of the Company’s common stock. After such amendment, a total of 1,850,000 shares of the Company’s common stock have been authorized for issuance under the Purchase Plan. During the fiscal years ended May 31, 2020, 2019 and 2018, ESPP purchase rights of 55,000, 379,000, and 359,000 shares, respectively, were granted. For the fiscal years ended May 31, 2020, 2019 and 2018, approximately

54
136,000, 125,000 and 237,000 shares of common stock, respectively, were issued under the Purchase Plan. As of May 31, 2020, a total of 1,617,000 shares have been issued under the Purchase Plan, and 233,000 ESPP shares remain available for issuance. 12. EMPLOYEE BENEFIT PLANS: EMPLOYEE STOCK OWNERSHIP PLAN: The Company has a non-contributory, trusteed employee stock ownership plan for full-time employees who have completed three consecutive months of service and for part-time employees who have completed one year of service and have attained an age of 21. The Company can contribute either shares of the Company’s stock or cash to the plan . The contribution is determined annually by the Company and cannot exceed 15% of the annual aggregate salaries of those employees eligible for participation in the plan. On May 31, 2007, the Company converted the Aehr Test Systems Employee Stock Bonus Plan into the Aehr Test Systems Employee Stock Ownership Plan (the “Plan”). The stock bonus plan was converted to an employee stock ownership plan (“ESOP”) to enable the Plan to better comply with changes in the law regarding Company stock. Individuals’ account balances vest at a rate of 20% per year commencing upon completion of two years of service. Non-vested balances, which are forfeited following termination of employment, are allocated to the remaining employees in the Plan. Under the Plan provisions, each employee who reaches age fifty-five (55) and has been a participant in the Plan for ten years will be offered an election each year to direct the transfer of up to 25% of his/her ESOP account to the employee self-directed account in the Savings and Retirement Plan. For anyone who met the above prerequisites, the first election to diversify holdings was offered after May 31, 2008. In the sixth year, employees will be able to diversify up to 50% of their ESOP accounts. Contributions of $60,000 per year were authorized for the plan during fiscal 2020, 2019 and 2018. The contribution amounts are recorded as compensation expense, in the period authorized and included in accrued expenses, in the period authorized. Contributions of 34,000 shares were made to the ESOP during fiscal 2020 for fiscal 2019. Contributions of 23,000 shares were made to the ESOP during fiscal 2019 for fiscal 2018. Contributions of 13,000 shares were made to the ESOP during fiscal 2018 for fiscal 2017. The contribution for fiscal 2020 will be made in fiscal 2021. Shares held in the ESOP are included in the EPS calculation. 401(K) PLAN: The Company maintains a defined contribution savings plan (the “401(k) Plan”) to provide retirement income to all qualified employees of the Company. The 401(k) Plan is intended to be qualified under Section 401(k) of the Internal Revenue Code of 1986, as amended. The 401(k) Plan is funded by voluntary pre-tax contributions from employees. Contributions are invested, as directed by the participant, in investment funds available under the 401(k) Plan. The Company is not required to make, and did not make, any contributions to the 401(k) Plan during fiscal 2020, 2019 and 2018. 13. OTHER (EXPENSE) INCOME, NET: Other (expense) income, net comprises the following (in thousands):
Year Ended May 31, 2020 2019 2018
Foreign exchange (loss) gain. . . . . . . . . . . . . . . . . . $(12) $43 $(63)
Other income, net. . . . . . . . . . . . . . . . . . . . . . . . . . 1 1 2 $(11) $44 $(61)
14. PRODUCT WARRANTIES: The Company provides for the estimated cost of product warranties at the time revenues are recognized on the products shipped. While the Company engages in extensive product quality programs and processes, including actively monitoring and evaluating the quality of its component suppliers, the Company’s warranty obligation is affected by product failure rates, material usage and service delivery costs incurred in correcting a product failure. Should actual product failure rates, material usage or service delivery costs differ from the Company’s estimates, revisions to the estimated warranty liability would be required. The standard warranty period is one year for systems and ninety days for parts and service. Following is a summary of changes in the Company’s liability for product warranties during the fiscal years ended May 31, 2020 and 2019 (in thousands):

55
May 31,
2020 2019
Balance at the beginning of the year. . . . . . . . . . . . . . . $ 154 $ 135
Accruals for warranties issued during the year . . . . . . . 299 214
Consumption of reserves . . . . . . . . . . . . . . . . . . . . . . . (207) (195) Balance at the end of the year. . . . . . . . . . . . . . . . . . . . $ 246 $ 154
The accrued warranty balance is included in accrued expenses on the consolidated balance sheets. 15. SEGMENT INFORMATION: The Company has only one reportable segment. The information for revenue category by type, product line, geography and timing of revenue recognition, is summarized in Note “2. REVENUE.” Property and equipment information is based on the physical location of the assets. The following table presents property and equipment information for geographic areas (in thousands):
May 31,
2020 2019
United States. . . . . . . . . . . . . . . . . . . . . . . $662 $1,005
Asia . . . . . . . . . . . . . . . . . . . . . . . . . . . . . . 1 40
Europe. . . . . . . . . . . . . . . . . . . . . . . . . . . . -- --
$663 $1,045
There were no revenues through distributors for the fiscal years ended May 31, 2020 and 2019. The Company’s Japanese and German subsidiaries primarily comprise the foreign operations. Substantially all of the sales of the subsidiaries are made to unaffiliated Japanese or European customers. Net sales from outside the United States include those of Aehr Test Systems Japan K.K. and Aehr Test Systems GmbH. 16. RESTRUCTURING: During the fiscal year ended May 31, 2020, the Company approved the dissolution of Aehr Test Systems Japan K.K (“ATS-Japan”), a majority owned subsidiary. In connection with the dissolution plan, the Company recognized approximately $220,000 in the fourth quarter of fiscal 2020 related to severance payments for individuals impacted in this reduction, legal fees associated with the dissolution process, and write-off of assets. The ATS-J subsidiary was dissolved in March 2020. The liquidation process occurred from March 2020 through the final liquidation in July 2020, allowing creditors time to submit claims and time for ATS-J to wind down and disposition any assets. The Company expects the dissolution of ATS-Japan will result in a cost saving of approximately $90,000 each quarter beginning in fiscal 2021. During the fiscal year ended May 31, 2019, the Company implemented a restructuring plan in order to streamline its operations and better align its structure with its objectives going forward. In connection with the restructuring plan, the Company recognized $725,000 of restructuring charges related to employee termination expenses during the fiscal year ended May 31, 2019. The Company paid $317,000 of the restructuring charge during fiscal year ended May 31, 2019. At May 31, 2019, the balance of $408,000 of the restructuring charge was included in accrued expenses on the accompanying condensed consolidated balance sheets and is expected to be paid in fiscal year 2020. The Company does not expect to incur any further expenses in connection with this restructuring plan. There were no restructuring charges incurred for the fiscal years ended May 31, 2018. 17. RELATED PARTY TRANSACTIONS: Mario M. Rosati, one of the Company’s directors, was also a member of Wilson Sonsini Goodrich & Rosati, Professional Corporation, which has served as the Company’s outside corporate counsel and has received compensation at normal commercial rates for these services. Mario M. Rosati retired from Wilson Sonsini Goodrich & Rosati on January 31, 2020. The amounts of transactions during fiscal years ended May 31, 2020, 2019 and 2018 were $78,000, $90,000, and $64,000, respectively. At May 31, 2020 the Company had a prepayment to Wilson Sonsini Goodrich & Rosati of $14,000 and at May 31, 2019 had a payable to Wilson Sonsini Goodrich & Rosati of $13,000.

56
18. COMMITMENTS AND CONTINGENCIES:
COMMITMENTS
At both May 31, 2020 and 2019, the Company had restricted cash of $80,000 held by a financial institution, representing a security deposit for its United States manufacturing and office space lease. This amount is included in other assets on the consolidated balance sheets.
PURCHASE OBLIGATIONS
The Company has purchase obligations to certain suppliers. In some cases the products the Company purchases are unique and have provisions against cancellation of the order. At May 31, 2020, the Company had $2,196,000 of purchase obligations which are due within the following 12 months. This amount does not include contractual obligations recorded on the consolidated balance sheets as liabilities.
CONTINGENCIES
The Company may, from time to time, be involved in legal proceedings arising in the ordinary course of business. While there can be no assurances as to the ultimate outcome of any litigation involving the Company, management does not believe any pending legal proceedings will result in judgment or settlement that will have a material adverse effect on the Company’s consolidated financial position, results of operations or cash flows.
In the normal course of business to facilitate sales of its products, the Company indemnifies other parties, including customers, with respect to certain matters, for example, including against losses arising from a breach of representations or covenants, or from intellectual property infringement or other claims. These agreements may limit the time within which an indemnification claim can be made and the amount of the claim. In addition, the Company has entered into indemnification agreements with its officers and directors, and the Company’s bylaws contain similar indemnification obligations to the Company’s agents.
It is not possible to determine the maximum potential amount under these indemnification agreements due to the limited history of prior indemnification claims and the unique facts and circumstances involved in each particular agreement. To date, payments made by the Company under these agreements have not had a material impact on the Company’s operating results, financial position or cash flows.
19. SELECTED QUARTERLY CONSOLIDATED FINANCIAL DATA (UNAUDITED):
The following tables (presented in thousands, except per share data) sets forth selected unaudited condensed consolidated statements of operations data for each of the four quarters of the fiscal years ended May 31, 2020 and 2019. The unaudited quarterly information has been prepared on the same basis as the annual information presented elsewhere herein and, in the Company’s opinion, includes all adjustments (consisting only of normal recurring entries) necessary for a fair statement of the information for the quarters presented. The operating results for any quarter are not necessarily indicative of results for any future period and should be read in conjunction with the audited consolidated financial statements of the Company’s and the notes thereto included elsewhere herein.
Three Months Ended
Aug. 31, Nov. 30, Feb. 29, May 31,
2019 2019 2020 2020
Net sales. . . . . . . . . . . . . . . . . . . . . . . . . . . . . . . $ 5,533 $ 6,874 $ 6,111 $ 3,773
Gross profit (loss). . . . . . . . . . . . . . . . . . . . . . . . $ 2,271 $ 3,202 $ 2,991 $ (93)
Net (loss) income . . . . . . . . . . . . . . . . . . . . . . . . $ (413) $ 251 $ 245 $(2,885)
Net (loss) income per share basic and diluted. . . $ (0.02) $ 0.01 $ 0.01 $ (0.13)
Three Months Ended
Aug. 31, Nov. 30, Feb. 28, May 31, 2018 2018 2019 2019
Net sales. . . . . . . . . . . . . . . . . . . . . . . . . . . . . . . $ 4,740 $ 5,911 $ 3,163 $ 7,242
Gross profit . . . . . . . . . . . . . . . . . . . . . . . . . . . . $ 1,553 $ 2,398 $ 272 $ 3,379
Net (loss) income . . . . . . . . . . . . . . . . . . . . . . . . $(1,515) $ (629) $(3,201) $ 110
Net (loss) income per share basic and diluted. . . $ (0.07) $ (0.03) $ (0.14) $ 0.00

57
Item 9. Changes in and Disagreements with Accountants on Accounting and Financial Disclosure None. Item 9A. Controls and Procedures
(a) Evaluation of disclosure controls and procedures. Our management evaluated, with the participation of our Chief Executive Officer and Chief Financial Officer, the effectiveness of our disclosure controls and procedures, as defined in Rules 13a-15(e) and 15d-15(e) under the Exchange Act, as of the end of the period covered by this Annual Report on Form 10-K. Based on this evaluation, our Chief Executive Officer and our Chief Financial Officer have concluded that our disclosure controls and procedures are effective to ensure that information we are required to disclose in reports that we file or submit under the Securities Exchange Act of 1934 is recorded, processed, summarized and reported within the time periods specified in Securities and Exchange Commission rules and forms, and that such information is accumulated and communicated to management, including our Chief Executive Officer and Chief Financial Officer, as appropriate to allow for timely decisions regarding required disclosure.
(b) Management’s report on internal control over financial reporting. Our management is responsible for establishing and maintaining adequate internal control over financial reporting as defined in Rule 13a-15(f) of the Exchange Act. Under the supervision and with the participation of our Chief Executive Officer and Chief Financial Officer, our management conducted an evaluation of the effectiveness of our internal control over financial reporting based upon the framework in “Internal Control – Integrated Framework” (2013 Framework) issued by the Committee of Sponsoring Organizations of the Treadway Commission. Based on that evaluation, management has concluded that the Company’s internal control over financial reporting was effective as of May 31, 2020. This annual report does not include an attestation report of the Company’s registered public accounting firm regarding internal control over financial reporting. Management’s report was not subject to attestation by the Company’s registered public accounting firm pursuant to rules of the Securities and Exchange Commission that permit the Company to provide only management’s report in this Annual Report.
(c) Changes in internal controls over financial reporting. There were no changes in our internal controls over financial reporting that occurred during the period covered by this Annual Report on Form 10-K that have materially affected, or are reasonably likely to materially affect, our internal controls over financial reporting. Item 9B. Other Information None.

58
PART III Item 10. Directors, Executive Officers and Corporate Governance The information required by this item is incorporated by reference to our Proxy Statement to be filed with the Securities and Exchange Commission in connection with our 2020 Annual Meeting of Shareholders. Item 11. Executive Compensation The information required by this item is incorporated by reference to our Proxy Statement to be filed with the Securities and Exchange Commission in connection with our 2020 Annual Meeting of Shareholders. Item 12. Security Ownership of Certain Beneficial Owners and Management and Related Stockholder Matters The information required by this item is incorporated by reference to our Proxy Statement to be filed with the Securities and Exchange Commission in connection with our 2020 Annual Meeting of Shareholders. Item 13. Certain Relationships and Related Transactions, and Director Independence The information required by this item is incorporated by reference to our Proxy Statement to be filed with the Securities and Exchange Commission in connection with our 2020 Annual Meeting of Shareholders. Item 14. Principal Accountant Fees and Services The information required by this item is incorporated by reference to our Proxy Statement to be filed with the Securities and Exchange Commission in connection with our 2020 Annual Meeting of Shareholders.

59
PART IV Item 15. Exhibits, Financial Statement Schedules (a) The following documents are filed as part of this Report: 1. Financial Statements
See Index under Item 8. 2. Financial Statement Schedule See Index under Item 8. 3. Exhibits See Item 15(b) below. (b) Exhibits The following exhibits are filed as part of or incorporated by reference into this Report:

60
Exhibit No. Description ----------- ------------------------------------------------------------------------------------------------------------ 3.1(1) Restated Articles of Incorporation of Registrant. 3.2(2) Amended and Restated Bylaws of Registrant. 4.1(3) Form of Common Stock certificate. 4.2(4) Registration Rights Agreement by and among the Company and the Investors (as defined therein), dated as of September 22, 2016. 4.3 Description of Securities (filed herewith) 10.1(5) 2006 Equity Incentive Plan.* 10.2(6) Amended and Restated 2006 Employee Stock Purchase Plan.* 10.3(7) 2016 Equity Incentive Plan.* 10.4(8) Form of Indemnification Agreement entered into between Registrant and its directors and executive officers.* 10.5(9) Form of Change of Control Agreement.* 10.6(10) Lease dated August 3, 1999 for facilities located at Building C, 400 Kato Terrace, Fremont, California. 10.7(11) First Amendment dated May 06, 2008 for facilities located at 400 Kato Terrace, Fremont, California. 10.8(12) Second Amendment dated November 7, 2014 for facilities located at 400 Kato Terrace, Fremont, California. 10.9(13) Third Amendment dated February 27, 2018 for facilities located at 400 Kato Terrace, Fremont, California. 10.10(14) Offer Letter dated January 3, 2012, between the Company and Gayn Erickson.* 10.11(15) Offer Letter dated March 5, 2013, between the Company and Rhea Posedel.* 10.12(16) Change of Control Severance Agreement dated January 3, 2012, between the Company and Gayn Erickson.* 10.13(17) Amended and Restated Change of Control Severance Agreement dated March 5, 2013, between the Company and Rhea J. Posedel.* 10.15(18) Form of 2006 Equity Incentive Plan Stock Option Award Agreement.* 10.16(19) Form of 2006 Equity Incentive Plan Restricted Stock Unit Award.* 10.17(20) Form of 2016 Equity Incentive Plan Stock Option Award Agreement.* 10.18(21) Form of 2016 Equity Incentive Plan Restricted Stock Unit Award.* 10.19(22) Purchase Agreement by and among the Company and the Investors (as defined therein), dated as of September 22, 2016. 10.20(23) Loan and Security Agreement, dated as of January 13, 2020 and effective on January 16, 2020, by and between Silicon Valley Bank and Aehr Test Systems. 10.21(24) Promissory Note, dated April 23, 2020, with Silicon Valley Bank as Lender and Aehr Test Systems as
Borrower. 21.1 Subsidiaries of the Company (filed herewith). 23.1 Consent of BPM LLP - Independent Registered Public Accounting Firm (filed herewith). 24.1 Power of Attorney (incorporated by reference to the signature page of this Annual Report on Form 10-K). 31.1 Certification Statement of Chief Executive Officer pursuant to Section 302(a) of the Sarbanes-Oxley Act of 2002 (filed herewith). 31.2 Certification Statement of Chief Financial Officer pursuant to Section 302(a) of the Sarbanes-Oxley Act of 2002 (filed herewith). 32.1 Certification of Chief Executive Officer and Chief Financial Officer pursuant to 18 U.S.C. Section 1350, as adopted pursuant to Section 906 of the Sarbanes-Oxley Act of 2002 (furnished herewith). 101.INS XBRL Instance Document 101.SCH XBRL Taxonomy Extension Schema Document 101.CAL XBRL Taxonomy Extension Calculation Linkbase Document 101.DEF XBRL Taxonomy Extension Definition Linkbase Document 101.LAB XBRL Taxonomy Extension Label Linkbase Document 101.PRE XBRL Taxonomy Extension Presentation Linkbase Document ------------------------ (1) Incorporated by reference to the same-numbered exhibit previously filed with the Company’s Registration Statement on Form S-1 filed June 11, 1997 (File No. 333-28987). (2) Incorporated by reference to the same-numbered exhibit previously filed with the Company’s Current Report on Form 8-K filed September 11, 2019 (File No. 000-22893). (3) Incorporated by reference to the same-numbered exhibit previously filed with Amendment No.1 to the Company’s Registration Statement on Form S-1 filed July 17, 1997 (File No. 333-28987).

61
(4) Incorporated by reference to Exhibit 10.2 previously filed with the Company’s Current Report on Form 8-K filed September 28, 2016 (File No. 000-22893). (5) Incorporated by reference to Exhibit 4.1 previously filed with the Company’s Registration Statement on Form S-8 filed October 27, 2006 (File No. 333-138249). (6) Incorporated by reference to Exhibit 4.2 previously filed with the Company’s Registration Statement on Form S-8 filed November 14, 2016 (File No. 333-214589). (7) Incorporated by reference to Appendix A of the Company’s Definitive Proxy Statement filed September 26, 2019 (File No. 333-214589). (8) Incorporated by reference to Exhibit 10.4 previously filed with Amendment No.1 to the Company’s Registration Statement on Form S-1 filed July 17, 1997 (File No. 333-28987). (9) Incorporated by reference to Exhibit 10.14 previously filed with the Company’s Form 10-K for the year ended May 31, 2001 filed August 29, 2001 (File No. 000-22893). (10) Incorporated by reference to Exhibit 10.12 exhibit previously filed with the Company’s Form 10-K for the year ended May 31, 1999 filed August 30, 1999 (File No. 000-22893). (11) Incorporated by reference to Exhibit 10.15 previously filed with the Company’s Current Report on Form 8-K filed May 9, 2008 (File No. 000-22893). (12) Incorporated by reference to Exhibit 10.1 previously filed with the Company’s Current Report on Form 8-K filed November 12, 2014 (File No. 000-22893). (13) Incorporated by reference to Exhibit 10.1 previously filed with the Company’s Current Report on Form 8-K filed March 2, 2018 (File No. 000-22893). (14) Incorporated by reference to Exhibit No. 10.1 previously filed with the Company's Current Report on Form 8-K filed January 9, 2012 (File No. 000-22893). (15) Incorporated by reference to Exhibit No. 10.1 previously filed with the Company's Current Report on Form 8-K filed March 8, 2013 (File No. 000-22893). (16) Incorporated by reference to Exhibit No. 10.3 previously filed with the Company's Current Report on Form 8-K filed January 9, 2012 (File No. 000-22893). (17) Incorporated by reference to Exhibit No. 10.2 previously filed with the Company's Current Report on Form 8-K filed March 8, 2013 (File No. 000-22893). (18) Incorporated by reference to Exhibit 10.17 previously filed with the Company’s Annual Report on Form 10-K filed August 29, 2016 (File No. 000-22893). (19) Incorporated by reference to Exhibit 10.18 previously filed with the Company’s Annual Report on Form 10-K filed August 29, 2016 (File No. 000-22893). (20) Incorporated by reference to Exhibit 10.19 previously filed with the Company’s Annual Report on Form 10-K filed August 29, 2017 (File No. 000-22893). (21) Incorporated by reference to Exhibit 10.20 previously filed with the Company’s Annual Report on Form 10-K filed August 29, 2017 (File No. 000-22893). (22) Incorporated by reference to Exhibit 10.1 previously filed with the Company’s Current Report on Form 8-K filed September 28, 2016 (File No. 000-22893). (23) Incorporated by references to Exhibit 10.1 previously filed with the Company’s Current Report on Form 8-K filed January 1, 2020 (File No. 000-22893). (24) Incorporated by reference to Exhibit 10.1 previously filed with the Company’s Current Report on Form 8-K filed April 28, 2020 (File No. 000-22893). * Management contracts or compensation plans or arrangements in which directors or executive officers are eligible to
participate.
62
SIGNATURES Pursuant to the requirements of Section 13 or 15(d) of the Securities Exchange Act of 1934, the Registrant has duly caused this Annual Report on Form 10-K to be signed on its behalf by the undersigned, thereunto duly authorized.
Dated: August 28, 2020 AEHR TEST SYSTEMS By: /s/ GAYN ERICKSON ---------------------------------------
Gayn Erickson PRESIDENT AND CHIEF EXECUTIVE OFFICER
POWER OF ATTORNEY
KNOW ALL PERSONS BY THESE PRESENTS, that each person whose signature appears below constitutes and appoints Gayn Erickson and Kenneth B. Spink, jointly and severally, his attorneys-in-fact, each with the power of substitution, for him in any and all capacities, to sign any and all amendments to this Annual Report on Form 10-K, and to file the same, with exhibits thereto and other documents in connection therewith, with the Securities and Exchange Commission, hereby ratifying and confirming all that each of said attorneys-in-fact, or his substitute or substitutes, may do or cause to be done by virtue hereof.
Pursuant to the requirements of the Securities Act of 1934, this Annual Report on Form 10-K has been signed below by the following persons on behalf of the Registrant and in the capacities and on the dates indicated. Signature Title Date -------------------------- ----------------------------------- -----------------
President, Chief Executive Officer, and Director /s/ GAYN ERICKSON (Principal Executive Officer) August 28, 2020 -------------------------- -----------------
Gayn Erickson Vice President of Finance and Chief Financial Officer /s/ KENNETH B. SPINK (Principal Financial and August 28, 2020 -------------------------- Accounting Officer) ----------------- Kenneth B. Spink /s/ LAURA OLIPHANT Director August 28, 2020 -------------------------- -----------------
Laura Oliphant /s/ RHEA J. POSEDEL Chairman August 28, 2020 -------------------------- -----------------
Rhea J. Posedel /s/ MARIO M. ROSATI Director August 28, 2020 -------------------------- -----------------
Mario M. Rosati /s/ JOHN M. SCHNEIDER Director August 28, 2020 -------------------------- -----------------
John M. Schneider /s/ HOWARD T. SLAYEN Director August 28, 2020 -------------------------- -----------------
Howard T. Slayen

63
Exhibit 4.3
DESCRIPTION OF SECURITIES
The following summary of the terms of our capital stock is based upon our Restated Articles of Incorporation (the “Articles of Incorporation”)
and our Amended and Restated Bylaws (the “Bylaws”). The summary is not complete, and is qualified by reference to our Articles of
Incorporation and Bylaws which are filed as exhibits to this Annual Report on Form 10-K and are incorporated by reference herein. We
encourage you to read our Articles of Incorporation, our Bylaws and the applicable provisions of the California Corporations Code for additional
information.
Authorized Shares of Capital Stock
Our authorized capital stock consists of 75 million shares of common stock, $0.01 par value, and 10 million shares of
preferred stock, $0.01 par value.
Listing
Our common stock is listed and principally traded on The Nasdaq Capital Market under the symbol “AEHR.”
Voting Rights
Each holder of shares of our common stock is entitled to one vote for each share held of record by such holder on the
applicable record date on all matters submitted to a vote of shareholders. At a shareholders' meeting at which directors
are to be elected, no shareholder shall be entitled to cumulate votes unless the candidates' names have been placed in
nomination prior to commencement of the voting and a shareholder has given notice prior to commencement of the
voting of the shareholder's intention to cumulate votes. If any shareholder has given such a notice, then every shareholder
entitled to vote may cumulate votes for candidates placed in nomination and give one candidate a number of votes equal
to the number of directors to be elected multiplied by the number of votes to which that shareholder's shares are entitled,
or distribute the shareholder's votes on the same principle among any or all of the candidates, as the shareholder thinks
fit. The candidates receiving the highest number of votes, up to the number of directors to be elected, shall be elected. On
all other matters submitted to the shareholders, the affirmative vote of the majority of the voting power of the shares
present in person or represented by proxy and entitled to vote shall be the act of the shareholders.
Dividend Rights
Subject to any preferential dividend rights granted to the holders of any shares of our preferred stock that may at the time
be outstanding, holders of our common stock are entitled to receive dividends as may be declared from time to time by
our board of directors out of funds legally available therefor.
Rights upon Liquidation
Subject to any preferential rights of outstanding shares of preferred stock, holders of our common stock are entitled to
share pro rata, upon any liquidation or dissolution of Aehr, in all remaining assets legally available for distribution to
shareholders.
Other Rights and Preferences
Our common stock has no sinking fund, redemption provisions, or preemptive, conversion, or exchange rights. Special
meetings of shareholders may be called by shareholders holding shares representing not less than 10% of the outstanding
votes entitled to vote at the meeting. Holders of our common stock may also act by unanimous written consent.
Transfer Agent and Registrar
Computershare Trust Company, N.A. is the transfer agent and registrar for our common stock.
Certain Anti-Takeover Effects As a California corporation, Aehr is subject to the provisions of Section 1203 of the California General Corporation Law, which requires it to provide a fairness opinion to its shareholders in connection with their consideration of any proposed “interested party” reorganization transaction.

64
Exhibit 21.1
SUBSIDIARIES OF AEHR TEST SYSTEMS
1. Aehr Test Systems Japan K.K., incorporated in Japan
2. Aehr Test Systems GmbH, incorporated in Germany

65
Exhibit 23.1
CONSENT OF INDEPENDENT REGISTERED PUBLIC ACCOUNTING FIRM
We hereby consent to the incorporation by reference in the Registration Statements on Form S-3 (No. 333-216792, 333-214218 and 333-204008) and the Registration Statements on Form S-8 (No. 333-235105, 333-228509, 333-214589, 333-208130, 333-200442, 333-184865, 333-177954, 333-163100, 333-155389, 333-138249, 333-119636, 333-52592 and 333-40577) of Aehr Test Systems of our report dated August 28, 2020 relating to the consolidated financial statements, which appears in this Form 10-K.
/s/ BPM LLP
San Jose, California
August 28, 2020

66
Exhibit 31.1
CERTIFICATION OF CHIEF EXECUTIVE OFFICER PURSUANT TO SECTION 302(a) OF THE SARBANES-OXLEY ACT
I, Gayn Erickson, certify that: 1. I have reviewed this annual report on Form 10-K of Aehr Test Systems; 2. Based on my knowledge, this report does not contain any untrue statement of a material fact or omit to state a material fact necessary to make the statements made, in light of the circumstances under which such statements were made, not misleading with respect to the period covered by this report; 3. Based on my knowledge, the financial statements, and other financial information included in this report, fairly present in all material respects the financial condition, results of operations and cash flows of the registrant as of, and for, the periods presented in this report; 4. The registrant’s other certifying officer(s) and I are responsible for establishing and maintaining disclosure controls and procedures (as defined in Exchange Act Rules 13a-15(e) and 15d-15(e)) and internal control over financial reporting (as defined in Exchange Act Rules 13a-15(f) and 15d-15(f)) for the registrant and have:
a) Designed such disclosure controls and procedures, or caused such disclosure controls and procedures to be designed under our supervision, to ensure that material information relating to the registrant, including its consolidated subsidiaries, is made known to us by others within those entities, particularly during the period in which this report is being prepared;
b) Designed such internal control over financial reporting, or caused such internal control over financial reporting to be designed under our supervision, to provide reasonable assurance regarding the reliability of financial reporting and the preparation of financial statements for external purposes in accordance with generally accepted accounting principles;
c) Evaluated the effectiveness of the registrant’s disclosure controls and procedures and presented in this report our conclusions about the effectiveness of the disclosure controls and procedures, as of the end of the period covered by this report based on such evaluation; and
d) Disclosed in this report any change in the registrant’s internal control over financial reporting that occurred during the registrant’s most recent fiscal quarter (the registrant’s fourth fiscal quarter in the case of an annual report) that has materially affected, or is reasonably likely to materially affect, the registrant’s internal control over financial reporting; and 5. The registrant’s other certifying officer(s) and I have disclosed, based on our most recent evaluation of internal control over financial reporting, to the registrant’s auditors and the audit committee of the registrant’s board of directors (or persons performing the equivalent functions): a) All significant deficiencies and material weaknesses in the design or operation of internal control over financial reporting which are reasonably likely to adversely affect the registrant’s ability to record, process, summarize and report financial information; and b) Any fraud, whether or not material, that involves management or other employees who have a significant role in the registrant’s internal control over financial reporting. Date: August 28, 2020 /s/ GAYN ERICKSON
----------------------------------------------- Gayn Erickson
President and Chief Executive Officer (Principal Executive Officer)

67
Exhibit 31.2
CERTIFICATION OF CHIEF FINANCIAL OFFICER PURSUANT TO SECTION 302(a) OF THE SARBANES-OXLEY ACT
I, Kenneth B. Spink, certify that: 1. I have reviewed this annual report on Form 10-K of Aehr Test Systems; 2. Based on my knowledge, this report does not contain any untrue statement of a material fact or omit to state a material fact necessary to make the statements made, in light of the circumstances under which such statements were made, not misleading with respect to the period covered by this report; 3. Based on my knowledge, the financial statements, and other financial information included in this report, fairly present in all material respects the financial condition, results of operations and cash flows of the registrant as of, and for, the periods presented in this report; 4. The registrant’s other certifying officer(s) and I are responsible for establishing and maintaining disclosure controls and procedures (as defined in Exchange Act Rules 13a-15(e) and 15d-15(e)) and internal control over financial reporting (as defined in Exchange Act Rules 13a-15(f) and 15d-15(f)) for the registrant and have:
a) Designed such disclosure controls and procedures, or caused such disclosure controls and procedures to be designed under our supervision, to ensure that material information relating to the registrant, including its consolidated subsidiaries, is made known to us by others within those entities, particularly during the period in which this report is being prepared;
b) Designed such internal control over financial reporting, or caused such internal control over financial reporting to be designed under our supervision, to provide reasonable assurance regarding the reliability of financial reporting and the preparation of financial statements for external purposes in accordance with generally accepted accounting principles;
c) Evaluated the effectiveness of the registrant’s disclosure controls and procedures and presented in this report our conclusions about the effectiveness of the disclosure controls and procedures, as of the end of the period covered by this report based on such evaluation; and
d) Disclosed in this report any change in the registrant’s internal control over financial reporting that occurred during the registrant’s most recent fiscal quarter (the registrant’s fourth fiscal quarter in the case of an annual report) that has materially affected, or is reasonably likely to materially affect, the registrant’s internal control over financial reporting; and 5. The registrant’s other certifying officer(s) and I have disclosed, based on our most recent evaluation of internal control over financial reporting, to the registrant’s auditors and the audit committee of the registrant’s board of directors (or persons performing the equivalent functions): a) All significant deficiencies and material weaknesses in the design or operation of internal control over financial reporting which are reasonably likely to adversely affect the registrant’s ability to record, process, summarize and report financial information; and b) Any fraud, whether or not material, that involves management or other employees who have a significant role in the registrant’s internal control over financial reporting. Date: August 28, 2020 /s/ KENNETH B. SPINK
-------------------------------------------------------------------- Kenneth B. Spink
Vice President of Finance and Chief Financial Officer (Principal Financial and Accounting Officer)

68
Exhibit 32.1
CERTIFICATION OF CHIEF EXECUTIVE OFFICER AND CHIEF FINANCIAL OFFICER PURSUANT TO
18 U.S.C. SECTION 1350, AS ADOPTED PURSUANT TO
SECTION 906 OF THE SARBANES-OXLEY ACT OF 2002
I, Gayn Erickson, certify, pursuant to 18 U.S.C. Section 1350, as adopted pursuant to Section 906 of the Sarbanes-Oxley Act of 2002, that the Annual Report of Aehr Test Systems on Form 10-K for the period ending May 31, 2020 fully complies with the requirements of Section 13(a) or 15(d) of the Securities Exchange Act of 1934 and that information contained in such Annual Report on Form 10-K fairly presents in all material respects the financial condition and results of operations of Aehr Test Systems. Date: August 28, 2020 By: /s/ GAYN ERICKSON ---------------------------------------------------------------- Gayn Erickson
President and Chief Executive Officer
(Principal Executive Officer)
I, Kenneth B. Spink, certify, pursuant to 18 U.S.C. Section 1350, as adopted pursuant to Section 906 of the Sarbanes-Oxley Act of 2002, that the Annual Report of Aehr Test Systems on Form 10-K for the period ending May 31, 2020 fully complies with the requirements of Section 13(a) or 15(d) of the Securities Exchange Act of 1934 and that information contained in such Annual Report on Form 10-K fairly presents in all material respects the financial condition and results of operations of Aehr Test Systems. Date: August 28, 2020 By: /s/ KENNETH B. SPINK ----------------------------------------------------------------- Kenneth B. Spink Vice President of Finance and Chief Financial Officer
(Principal Financial and Accounting Officer) The foregoing certifications are not deemed filed with the Securities and Exchange Commission for purposes of Section 18 of the Securities Exchange Act of 1934, as amended (Exchange Act), and are not to be incorporated by reference into any filing of Aehr Test Systems under the Securities Act of 1933, as amended, or the Exchange Act, whether made before or after the date hereof, regardless of any general incorporation language in such filing.

DIRECTORS
Rhea J. Posedel Chairman
Gayn Erickson President Chief Executive Officer
Laura Oliphant (1) (2) (3)
Independent consultant and investor
Mario M. Rosati (3)
Retired Member Wilson Sonsini Goodrich & Rosati, Professional Corporation
Geoffrey Scott (1) (3) Private Investor
Howard T. Slayen (1) (2)
Retired Partner PricewaterhouseCoopers
(1) Member of the Audit Committee (2) Member of the Compensation Committee (3) Member of the Corporate Governance and
Nominating Committee
OFFICERS
Gayn Erickson President Chief Executive Officer
Kenneth B. Spink Vice President of Finance Chief Financial Officer
Michael Brannan Vice President of Operations
David S. Hendrickson Chief Technology Officer
Donald P. Richmond II Vice President of Engineering
Vernon Rogers Executive V.P. of Sales and Marketing
CORPORATE HEADQUARTERS
400 Kato Terrace Fremont, CA 94539 Telephone: 510.623.9400 Fax: 510.623.9450 Website: www.aehr.com
SUBSIDIARIES
Aehr Test Systems Japan Hashikan Bldg., 1-14 Azuma-Cho Hachioji Tokyo, Japan 192-0082 Telephone: 81.42.642.3530 Fax: 81.42.642.3531 Email: [email protected]
Aehr Test Systems GmbH Industriestrasse 9 D-86919 UttingGermanyTelephone: 49.8806.2021Fax: 49.8806.2024Email: [email protected]
SHAREHOLDER INFORMATION
Legal Counsel Wilson Sonsini Goodrich & Rosati, Professional Corporation Palo Alto, CA
Independent Registered Public Accounting Firm BPM LLP San Jose, CA
Transfer Agent and Registrar Computershare Trust Company, N.A. P. O. Box 505000 Louisville, KY 40233-5000 Toll free: 800.962.4284 (US, Canada, Puerto Rico) 781.575.3100 (non-US)
Investor Relations MKR Group, Inc. Telephone: 323.468.2300 Email: [email protected]
Annual Meeting The annual meeting of shareholders will be held at 4:00 p.m. on October 20, 2020 at the Company’s Corporate Headquarters.
CORPORATE INFORMATION
Aehr Test Systems’ corporate headquarters has been certified to the International Standards Organization (ISO) 9001 standard since 1997.


CORPORATE HEADQUARTERS
400 KATO TERRACE
FREMONT, CA 94539
TELEPHONE: 510.623.9400
FAX: 510.623.9450
WEB: WWW.AEHR.COM