2020-2021 preliminary end-of- year results
TRANSCRIPT
2020-2021 Preliminary End-of-Year Results
September 1, 2021

Performance Summary
• The impact of the Covid-19 pandemic on student performance is clear and dramatic. Our recovery will require a multi-year effort.
• The percentage of students scoring College and Career Ready (CCR) in every grade, in every subject (with the exception of Math 3) for every subgroup of students, has greatly declined.
• However, our four-year cohort graduation rate declined only slightly to 83.6%.
• The percentage of students who were CCR increased in Math 3 compared to 2018-2019.
• Performance on the ACT improved in the aggregate and for each student group.
• Performance on the WorkKeys assessment improved in the aggregate and for several student groups.
2

4-year Graduation Rate

CMS 4-Year Cohort Graduation Rate
88.0 89.6 89.485.4 85.5 85.5 83.6
2015 2016 2017 2018 2019 2020 2021
Note: In 2017-18, the calculation rules were changed to include students who
entered high school “off track” in the denominator for the school and the district.
4

81
77
79
9293
90
9392
87
85 85 85
82
79 80
79
7475 74
74
90 89 89
88
9089
85
9495 95
9392
9493
2015 2016 2017 2018 2019 2020 2021
Two or
More Races
American
Indian
Hispanic
White
Asian
Black
5
Graduation Rates Over Time
Note: In 2017-18, the calculation rules were changed to include students who
entered high school “off track” in the denominator for the school and the district.

Graduation Rates Over Time
8890 89
85 86 8684
6463
59
65
69 68
63
66 66
6364
5860
2015 2016 2017 2018 2019 2020 2021
SWD
EL
All
students
LEP
6
Note: In 2017-18, the calculation rules were changed to include students who
entered high school “off track” in the denominator for the school and the district.

College and Career Readiness Rates on End-of-Grade (EOG) and End-of-Course (EOC) Tests
7

Testing and Reporting Changes
• In 2018-19, the North Carolina Department of Public Instruction (NCDPI) implemented new academic achievement standards in mathematics grades 3-8 and Math 1 assessments, and introduced a new EOC test, Math 3. Thus, scores on mathematics assessments are only compared to 2018-19.
• In 2020-21, NCDPI implemented new academic achievement standards in reading assessments in grades 3-8. Thus, scores on the Reading tests should not be compared to prior years. English II was renormed in 2019-20, with the new cut scores applied only to the 2019-20 EOC data from Semester 1 since testing was canceled in Spring 2020.
• The NCDPI sought and received a waiver from the U.S. Department of Education from certain accountability elements. Thus, in 2020-21 there will be no School Performance Grades and no School Accountability Growth.
• End-of-year (EOY) testing was not conducted in 2019-20 due to the COVID-19 pandemic.
• The 2020-21 school year began remotely for all students, but students returned to schools
for EOY testing.
8

The State Redefined Achievement Levels
In 2018-19, the State Board of Education adopted a new methodology for
determining achievement levels for Math only. In 2020-21, the other tests now use
these same achievement levels:
Old Levels: Level 1 Level 2 Level 3 Level 4 Level 5
New Levels: Combined: Not Proficient Level 3 Level 4 Level 5
Grade Level
Proficiency● ● ●
College and
Career Ready● ●
9

Reading Grades 3-8 and English II

College and Career Readiness Rates in Grades 3-8
Reading and English II
* Note: Reading EOG tests were re-normed in 2020-21 and English II was re-normed in 2019-20 (although it was only
applied to fall testing since spring testing was canceled). Due to these changes in the assessments, CCR rates from 2018-
19 should not be compared to the 2020-21 results.
44.0
52.5
28.5
38.6
Reading 3-8 English II
2018-19* 2020-21
11

College and Career Readiness Rates across student groups in Grades 3-8 Reading
* Note: Reading EOG tests were re-normed in 2020-21 and English II was re-normed in 2019-20 (although it was only
applied to fall testing since spring testing was canceled). Due to these changes in the assessments, CCR rates from 2018-
19 should not be compared to the 2020-21 results.
29.3 30.536.8
52.7
65.3
72.1
11.9 12.3
94.3
14.8 16.2
32.1 33.2
53.2 54.3
<5 <5
81.2
Hispanic Black AmericanIndian
Two or More Asian White EL SWD AIG
Reading 3-8 EOGs
2018-19* 2020-21
12

College and Career Readiness Rates across student groups in English II
*Note: Reading EOG tests were re-normed in 2020-21 and English II was re-normed in 2019-20 (although it was only
applied to fall testing since spring testing was canceled). Due to these changes in the assessments, CCR rates from 2018-
19 should not be compared to the 2020-21 results.
**The size of the American Indian student group is very small (<30 students).
37.5 39.4
57.0
37.5
69.6
78.6
7.0
14.1
>95
23.7 25.0
43.7
53.8
63.4 65.7
<56.3
90.8
Black Hispanic Two or More AmericanIndian**
Asian White EL SWD AIG
English II EOC
2018-19* 2020-21
13

Math Grades 3-8, Math 1, and Math 3

College and Career Readiness Rates in Grades 3-8 Math,
Math 1 (9-12), and Math 3 (9-12)
2019
Note: As of 2017-18, Grade 8 students take the test for the course they are enrolled in: either NC Math 1 or Grade 8 Math EOG, but not both.
The Grade 8 rate is the percentage of students who score CCR in either Grade 8 EOG or Math 1. 3-8 Math includes the Math I EOC for Grade
8 students who took it as their Math exam. In 2018-19, new math assessment scales were created, so rates cannot be compared to previous
years.
47.4
16.4
29.826.0
<5
32.3
Math 3-8 Math 1 (9-12) Math 3 (9-12)
2018-19 2020-21
15
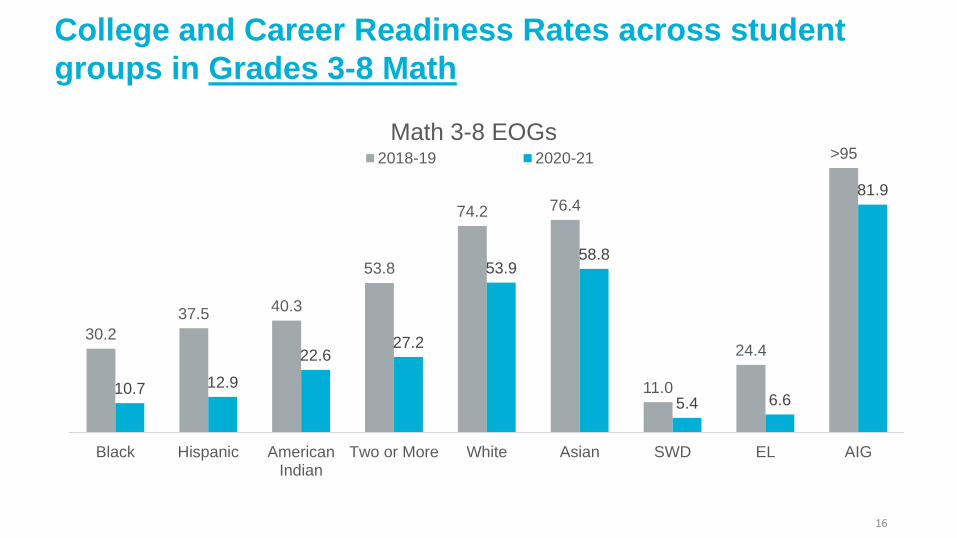
College and Career Readiness Rates across student
groups in Grades 3-8 Math
30.2
37.540.3
53.8
74.2 76.4
11.0
24.4
>95
10.7 12.9
22.627.2
53.958.8
5.4 6.6
81.9
Black Hispanic AmericanIndian
Two or More White Asian SWD EL AIG
Math 3-8 EOGs2018-19 2020-21
16

College and Career Readiness Rates across student groups in Math 1 (Grades 9-12)
*The size of the American Indian student group is very small (<30 students).
10.2 11.5
20.0 18.5
36.7
28.9
<5
8.5
63.9
<5 <5 <5*
7.3
14.5 16.8
<5 <5
26.6
Black Hispanic AmericanIndian
Two or More White Asian SWD EL AIG
Math 1 (9-12)2018-19 2020-21
17

College and Career Readiness Rates across student groups in Math 3 (Grades 9-12 – all students)
*The size of the American Indian student group is very small (<30 students).
12.8
19.2
32.7
8.0
53.3
59.4
<5
7.0
82.5
15.120.1
30.8
36.8*
55.2
64.1
6.0 7.7
83.1
Black Hispanic Two or More AmericanIndian
White Asian SWD EL AIG
Math 3 (9-12)2018-19 2020-21
18

College and Career Readiness Rates in Math 3A (Math 3 scores for students who took Math 1 in 8th grade or earlier)
66.862.7
All Students
Math 3A2018-19 2020-21
19

College and Career Readiness Rates across student groups in Math 3A (Math 3 scores for students who took Math 1 in 8th grade or earlier)
* The size of the American Indian student group is too small to be reported (<10 students).
**The size of the American Indian student group is very small (<30 students).
45.5
53.3
*
65.4
76.6
84.8
40.6 41.7
87.7
41.546.2
60.0**66.7
73.8
86.2
37.5 38.5
87.9
Black Hispanic AmericanIndian
Two or More White Asian EL SWD AIG
Math 3A2018-19 2020-21
20

Science Grades 5 & 8 and Biology
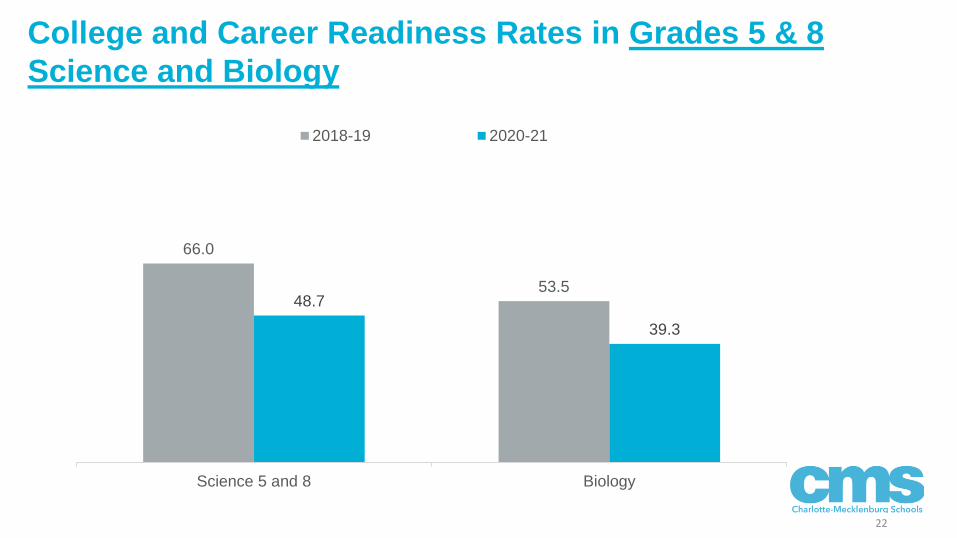
College and Career Readiness Rates in Grades 5 & 8
Science and Biology
66.0
53.548.7
39.3
Science 5 and 8 Biology
2018-19 2020-21
22

College and Career Readiness Rates across student groups in Grades 5 & 8 Science
*The size of the American Indian student group is very small (<35 students).
53.9 55.5
62.9
73.1
84.389.5
31.827.6
>95
33.8 35.2
54.8*57.9
74.377.0
11.714.7
94.4
Black Hispanic AmericanIndian
Two or More Asian White EL SWD AIG
Science 5 and 82018-19 2020-21
23
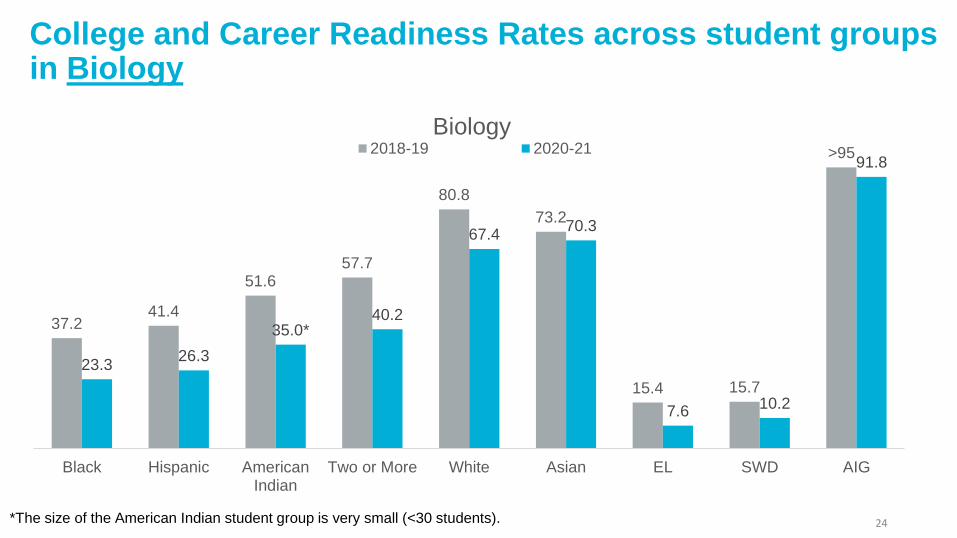
College and Career Readiness Rates across student groups in Biology
*The size of the American Indian student group is very small (<30 students).
37.241.4
51.657.7
80.8
73.2
15.4 15.7
>95
23.326.3
35.0*40.2
67.470.3
7.610.2
91.8
Black Hispanic AmericanIndian
Two or More White Asian EL SWD AIG
Biology2018-19 2020-21
24

Comparisons to the State and Other Districts

CMS Compared to the State and Other Large Districts in
North Carolina in Reading, Math, and Science
3-8 Math CCR3-8 Reading CCR
Percentage of students College and Career Ready on the
Reading, Math, and Science EOG tests by district and NC
28.9 28.524.0 24.0
27.2
41.7
23.9 26.0
14.718.5 20.6
34.2
52.048.7
40.844.4
50.2
59.6
NC CMS Durham Forsyth Guilford Wake NC CMS Durham Forsyth Guilford Wake NC CMS Durham Forsyth Guilford Wake
5 & 8 Science CCR
26

CMS Compared to the State and Other Large Districts in
North Carolina in English II and Biology
English II CCR
Percentage of students College and Career Ready on the
English II and Biology EOC tests by district and NC
Biology CCR
34.938.6
27.2
36.230.0
45.838.5 39.3
30.037.2
32.6
46.7
NC CMS Durham Forsyth Guilford Wake NC CMS Durham Forsyth Guilford Wake
27

CMS Compared to the State and Other Large Districts
in North Carolina in Math 1 and Math 3
Math 1 (9-12) CCR
6.5<5 <5 <5 <5 <5
25.132.3
15.1
23.516.4
31.7
NC CMS Durham Forsyth Guilford Wake NC CMS Durham Forsyth Guilford Wake
Percentage of students College and Career Ready on the
Math 1 and Math 3 EOC tests by district and NC
Math 3 (9-12) CCR
28

Description of Group Percent Tested
3-8 Reading 3-8 Math 5 & 8 Science English II Math 1 Math 3 Biology
State of North Carolina 93 93 93 92 90 92 92
Charlotte-Mecklenburg Schools 92 92 91 91 87 93 91
American Indian 86 87 91 * * * *
Asian 94 94 95 >95 88 >95 95
Black 89 89 88 89 86 91 88
Hispanic 93 93 92 89 86 90 89
Two or More Races 90 90 91 94 88 92 93
White 95 95 95 >95 94 >95 >95
English Learners 94 94 93 85 83 88 84
Students with Disabilities 88 87 86 88 86 90 86
Academically or Intellectually
Gifted95 95 95 >95 91 >95 >95
Participation rates
*The size of the student group is too small to report (<30 students). 29

ACT and ACT WorkKeys

31
54.6 55.861.0
55.2
CMS North Carolina
Percentage of Students with Composite Score of 17 or Higher on the ACT
2018-19 2020-21
ACT Composite Score of 17 or Higher
2020-21 North Carolina

ACT Composite Score of 17 or Higher
35.8 36.9
63.2
70.8
27.3
84.1
9.014.3
>95
39.842.3
66.4
76.880.0*
87.2
10.6
19.9
>95
Black Hispanic Two or More Asian AmericanIndian
White EL SWD AIG
ACT2018-19 2020-21
*The size of the American Indian student group is very small (<30 students). 32

33
64.3 65.5
74.2
63.3
CMS North Carolina
Percentage of Students with Silver or Higher on WorkKeys
2018-19 2020-21 CMS
2020-21 North Carolina
WorkKeys Silver or Higher

WorkKeys Silver or Higher
Note that data for the American Indian student group are not reported in either year.
50.7
62.7
72.4
84.3
77.7
13.2 13.9
>95
64.3 65.9
72.7
84.288.9
17.9
33.3
93.5
Black Hispanic Two or More White Asian EL SWD AIG
WorkKeys2018-19 2020-21
34

Description of Group Percent Tested
ACT WorkKeys
State of North Carolina 86 67
Charlotte-Mecklenburg Schools 76 28
American Indian * *
Asian 84 28
Black 69 25
Hispanic 71 28
Two or More Races 75 21
White 88 34
English Learners 67 25
Students with Disabilities 61 20
Academically or Intellectually Gifted 91 38
Participation rates
*The size of the student group is too small to report (<30 students). 35

Next Steps

Where We Go From Here
Getting Students Back Face-to-Face Safely• Improve ventilation and air quality.
• Continue providing PPE & sanitation supplies.
• Continue school health support with nurse extenders.
• Establish a mask mandate.
• Hire COVID-19 response coordinators (one in each learning community).
Understanding and quantifying student needs, individually and district-wide• Administer universal screener in grades K-8 in ELA and mathematics,
complemented by curriculum embedded assessments in all subjects.
• Administer universal screener of social-emotional learning (SEL) in grades K-12.
37

Where We Go From Here
Strengthening Our Core Instruction: Strong Standards Aligned Teaching
• Move forward with our ELA and mathematics curriculum adoption and implementation in grades K-9.
• Embed just-in-time support within core instruction for acceleration.
Emphasizing Foundational Reading Skills in the Early Grades
• Systematically include at least forty-five (45) minutes of additional reading instruction daily in grades K-3 (Skills Block), now and moving forward.
• Provide all K-3 teachers with professional development on the use of multi-sensory instructional strategies in the teaching of reading.
38

Where We Go From Here
Investing in Student Academic Supports in Out-of-School Time
• We will allocate up to $50 million over three years from our federal American Rescue Plan (ARP) funds to form partnerships with local and national academic service providers to offer students extra help in ELA and mathematics in our 42 “low performing schools.”
Broadening Social-Emotional Supports for Students
• Prioritize social-emotional supports for students in every school.
• Adopt a new social-emotional learning (SEL) curriculum in grades K-12.
• Hire & deploy 20 additional school counselors, social workers & psychologists to add to the 35 previously deployed using CARES Act funds.
• Sustain school-based mental health centers at 130 campuses. 39

Where We Go From Here
Increasing Supports to our Families that Don’t Speak English
• Deploy bilingual school advocates in 34 targeted language diverse schools.
• Provide full-time translators at 5 targeted language diverse schools.
• Create a CMS Language Assistance Line.
Deepening Student Absenteeism Response Efforts
• Expand partnerships to broaden school-wide efforts with 3 high schools.
• Review and revise practices for students that miss extended amounts of instructional time.
40
Where We Go From Here
Implementing a Continuous Improvement Approach
• Review and respond to results during the year to adjust course as needed to accelerate improvement.
• Align that work from schools to the Board to foster improvement throughout the system.
• Increase transparency by sharing progress updates with the public quarterly.
• Place an added emphasis on monitoring the student academic experience, with the understanding that “victory is in the classroom.”
41