2019 water quality report - irvine ranch water district · 2019-09-12 · ed surface water; and...
TRANSCRIPT

2019 WATER QUALITY REPORT

IRWD 2019 Water Quality Report
This report contains important information
about your drinking water. Translate it,
or speak with someone who understands it.
Arabic Chinese French
German Italian Japanese
Korean Spanish Vietnamese
Ce rapport contient desinformations importantes survotre eau potable. Traduisez-leou parlez en avec quelqu’unqui le comprend bien.
Der Bericht enthält wichtigeinformationen über die Wasser -qualität in Ihrer Umgebung. DerBericht sollte entweder offizielluebersetzt werden, odersprechen Sie mit Freundenoder Bekannten, die guteEnglischkenntnisse besitzen.
Este informe contiene informa ciónmuy importante sobre su aguapotable. Para mas información ótraducción, favor de contactar aCustomer Service Repre senta tive.Telefono: 949-453-5300.
Questo rapporto contieneinformazioni inportanti cheriguardano la vostra aquapotabile. Traducetelo, o parlatecon una persona qualificata ingrado di spiegarvelo.
Questions about your water?
Contact us for answers.
If you have questions about this report,please call Lars Oldewage, IRWD water
quality manager, at 949-453-5858.To reach IRWD Customer Service
and for other infor mation,please call 949-453-5300,
or email [email protected].
Community participation
The IRWD Board of Directors meets thesecond and fourth Monday of each monthbeginning at 5 p.m. at IRWD, 15600 SandCanyon Avenue, Irvine, California 92618.
A copy of this report is also available onour website: irwd.com. For more informa -tion about the health effects of the listedcontami nants in the following tables, callthe U.S. EPA Safe Drinking Water Hotline at800-426-4791.
~ 2 ~
of Southern California (MWD), which supplies imported treat -
ed surface water; and IRWD, which operates a local surface
water treatment plant and several ground water treatment
plants, all test for unregu lated chemicals in our water supply.
Unregulated chemical monitoring helps U.S. EPA and DDW
deter mine where certain chemicals occur
and whether new standards need to be
established for those chemicals.
Through drinking water quality
compliance testing programs carried out
by OCWD (groundwater), MWD (treated
surface water) and IRWD (treatment
plants and the distribution system), your
drinking water is constantly monitored
from source to tap for regulated and unregulated constituents.
The state allows drinking water agencies to monitor for some
contaminants less than once per year because the concen tra -
tions of these contaminants do not change frequently. Some
data, though represen tative, is more than one year old.
Since 1990, California public water utilities have provided
an annual water quality report to their customers. This year’s
report covers calendar year 2018 drinking water quality
testing and reporting. Irvine Ranch Water District (IRWD)
vigilantly safe guards its water supply and, as in years past, the
water delivered to your home meets
the quality standards required by federal
and state regulatory agencies. The U.S.
Environ mental Protection Agency
(U.S. EPA) and the State Water Resources
Control Board, Division of Drinking Water
(DDW) are the agencies responsible
for establishing and enforcing drinking
water quality standards.
IRWD and other regional water suppliers frequently go beyond
what is required by testing for unregulated chemicals that may
have health risks, but do not have drinking water standards.
For example, the Orange County Water District (OCWD), which
manages the groundwater basin; the Metro politan Water District

Sources of supply
IRWD is committed to providing a clean and reliablewater supply for its customers. Our drinking water is ablend of ground water from the Orange County GroundwaterBasin and surface water import ed by the Metropolitan WaterDistrict. MWD’s imported water sources come from theState Water Project and the Colorado River Aqueduct. Localground water is pumped from a natural under groundreservoir that stretches from the Prado Dam and fans acrossthe north western portions of Orange County, stretching asfar south as the El Toro “Y.” Additional groundwater comesfrom the Harding Canyon Dam watershed in the ClevelandNational Forest. Local ground water comprises approxi mately65% of the total IRWD drink ing water supply.
After a five-year drought ended in 2017, Californiaexperienced record levels of rain and snow. Key reservoirswere replenished and many areas of the state had moreopportunities to store water in critical groundwater aquifers.While a couple of wet winter years have been welcome,conserving water in our homes and businesses remainsvitally important.
There are many areas where we can save water, particularlyoutdoors, where our gardens and lawns receive almost 60%of all the water we use. IRWD and its customers havealways understood that smart water use needs to be ourway of life. Visit RightScapeNow.com to learn how, together,we can make this happen.
Basic information about
drinking water contaminants
Drinking water sources (both tap and bottled water) mayinclude rivers, lakes, streams, ponds, reservoirs, springs andwells. As water travels over the surface of land or throughthe layers of the ground, it dissolves naturally occur ringminerals and, in some cases, radio active material, and canpick up substances resulting from the presence of animaland human activity.
Contaminants that may be present in source water include:
• Microbial contaminants, such as viruses and bacteria,which may come from sewage treatment plants, septicsystems, agricultural livestock operations and wildlife.
The quality of your water is our primary concern
• Pesticides and herbi cides, which may come from a varietyof sources such as agriculture, urban stormwater runoffand residential uses.
• Radioactive contaminants, which can be naturally occurringor be the result of oil and gas production or mining activities.
• Inorganic contaminants, such as salts and metals, whichcan be natur ally occurring or result from urban stormwaterrunoff, industrial or domestic sewage discharges, oil andgas production, mining and farming.
• Organic chemical contaminants, including synthetic andvolatile organic chemicals, which are by-products ofindustrial processes and petroleum production, and canalso come from gasoline stations, urban storm waterrunoff, agricultural application and septic systems.
To ensure that tap water is safe to drink, the U.S. EPA andDDW prescribe regulations that limit the amount of certaincontami nants in water provided by public water systems.U.S. Food and Drug Administration regulations andCalifornia law also establish limits for contami nants inbottled water that provide the same protection for publichealth. Drinking water, including bottled water, may reason -ably be expected to contain at least small amounts of somecontaminants. The presence of contaminants does notnecessarily indicate that water poses a health risk.
More information about contaminants and potential healtheffects can be obtained by calling the U.S. EPA Safe DrinkingWater Hotline at 800-426-4791.
~ 3 ~
The Eastern Branch of the California Aqueduct,part of the California State Water Project,wends its way past the City of Palmdale.

Information the U.S. EPA would like you to know
Drinking water fluoridation
Fluoride has been added to U.S. drinking water suppliessince 1945. In Decem ber 2007, MWD joined a majority ofthe nation’s public water suppliers in adding fluo ride todrinking water to help prevent tooth decay. In line withrecommen da tions from the DDW, as well as the U.S. Centersfor Disease Control and Preven tion, MWD adjusted thenatural fluoride level in imported treated water from theColorado River and State Project water to the optimal rangefor dental health of 0.6 to 1.2 parts per million.
IRWD’s local ground water contains naturally occurringfluoride, but is not supplemented with fluoride. Fluoridelevels in drinking water are limited under California stateregulations at a maximum dosage of 2 parts per million.
There are many places to go for additional infor mationabout the fluoridation of drinking water:
U.S. Centers for Disease Control and Prevention800-232-4636 • cdc.gov/fluoridation
State Water Resources Control Board,Division of Drinking Water
waterboards.ca.gov/drinking_water/certlic/drinkingwater/Fluoridation.html
American Water Works Association: awwa.org
For more information about MWD’s fluoridation program,please contact Edgar G. Dymally at 213-217-5709 or [email protected].
Cryptosporidium
Crypto sporidium is a micro scopic organism that, wheningested, can cause diarrhea, fever, and other gastro intestinalsymptoms.
The organism comes from animal and/or human wasteand may be in surface water. MWD and IRWD tested thesource waters and treated surface waters for Crypto sporidium
in 2018 and did not detect it.If detected, Crypto sporidium is eliminated by an effective
treatment combination including sedi men tation, filtrationand disinfection.
The U.S. EPA and the federal Centers for Disease Controlguidelines on appropriate means to lessen the risk ofinfection by Crypto sporidium and other microbial con tami -nants are available from the U.S. EPA Safe Drinking WaterHotline at 800-426-4791.
Immuno-compromised people
Some people may be more vulnerable to contaminantsin drinking water than the general population. Immuno-compro mised people, such as those with cancer who areundergoing chemo therapy, people who have had organtrans plants, people with HIV/AIDS or other immune systemdisorders, some elderly people and infants can be particularlyat risk from infections. These people should seek adviceabout drinking water from their health care providers.
Total coliform rule
This Consumer Confidence Report (CCR) reflects changesin drinking water regula tory requirements instituted during2016. All water systems are required to comply with thestate Total Coliform Rule. Effective April 1, 2016, all watersystems are also required to comply with the federal RevisedTotal Coliform Rule.
The new federal rule protects public health by ensuringthe integrity of the drinking water distribution system bymonitoring for the presence of microbials (i.e., total coliformand E. coli bacteria). U.S. EPA anticipates greater publichealth protection as the new rule requires water systemsthat are vulnerable to microbial contamination to identifyand resolve potential issues. Water systems that exceed aspecified frequency of total coliform occurrences arerequired to conduct an assessment to determine if anysanitary defects exist. If found, these must be corrected bythe water system.
Chloramines
Water imported from MWD and locally produced ground -water contains chloramines, a combination of chlorine andammonia, as a drinking water disinfectant. Chloramineseffectively kill bacteria and other micro organisms that maycause disease.
Chloramines have no odor when used properly.People who use kidney dialysis machines may want to
take special precautions and consult their physician for theappro priate type of water treatment.
Customers who maintain fish ponds, tanks or aquariumsshould also make necessary adjust ments in water qualitytreatment, as these disinfectants are toxic to fish.
For further informa tion or if you have any questions aboutchlora mines please visit irwd.com or call 949-453-5300.
~ 4 ~

Want additional information? Explore water online.
Enjoy keeping in the know via social media? Follow IRWD’s water updates here:
Like Us:
Irvine Ranch Water District
Twitter Follow us:
@IRWDnews
Follow us:
@IRWDnews
YouTube
Watch us:
youtube.com/IrvineRanchWD
About lead in tap water
IRWD meets all standards for lead in the U.S. EPA Leadand Copper Rule. If present, elevated levels of lead cancause serious health problems,especially for pregnant women andyoung children. Lead in drinking wateris primarily from materials andcomponents associated with servicelines and home plumbing.
IRWD is responsible for providinghigh quality drinking water, but cannotcontrol the variety of materials usedin plumbing compo nents. When yourwater has been sitting for severalhours, you can minimize the potentialfor lead exposure by flushing your tapfor 30 seconds to 2 minutes beforeusing water for drinking or cooking. IRWD encourages youto collect the flushed water and reuse it for anotherbeneficial purpose, such as watering potted plants.
Informa tion on lead in drinking water, testing methods, and
Water quality issues that could affect your health
steps you can take to minimize exposure is available from theSafe Drinking Water Hotline or at epa.gov/safewater/lead.
If you are concerned about lead in your water, you may wishto have your water tested.
Nitrate advisory
Nitrate in drinking water atlevels above 10 mg/L is a healthrisk for infants of less than sixmonths old. Such nitrate levels indrinking water can interfere withthe capacity of the infant’s blood tocarry oxygen, resulting in a seriousillness; symptoms includeshortness of breath and blueness ofthe skin.
Nitrate levels above 10 mg/Lmay also affect the ability of the
blood to carry oxygen in other individuals, such as pregnantwomen and those with certain specific enzyme deficiencies.
If you are caring for an infant or are pregnant, you shouldask advice from your health care provider.
~ 5 ~
There’s a wealth of information on the internet aboutdrinking water quality, water reliability and water issuesin general. A good place to begin your research isIRWD.com/water-report.
In addition to extensive information about your localwater and the support and services we offer, you’ll findlinks to many other regional, statewide and nationalwater resources.
You can also view “Journey of a Water Sample: HowWe Safeguard Your Water,” a short video depicting thesteps IRWD staff take to ensure the high quality of ourdrinking water.

Irvine Ranch Water District Local and Imported Drinking Water Quality Results for 2018 PHG Average Average Average MRDLG Local Treated Local Treated Imported MWD Range of MCL Typical Source Chemical MCL MRDL (MCLG) Groundwater Surface Water Treated Water Detections Violation? of Contaminant
Radiologicals – Tested in 2014 to 2018
Alpha Radiation (pCi/L) 15 (0) <3 4.5 ND ND – 5.2 No Erosion of Natural DepositsUranium (pCi/L) 20 0.43 <1 2.4 ND ND – 2.7 No Erosion of Natural Deposits
Inorganic Chemicals – Tested in 2016 to 2018
Aluminum (ppm) 1 0.6 ND ND 0.12 (RAA) ND – 0.31 No Treatment Process Residue, Natural DepositsArsenic (ppb) 10 0.004 <2 ND ND ND – 3.1 No Erosion of Natural DepositsBarium (ppm) 1 2 ND 0.12 0.12 0.12 – 0.13 No Erosion of Natural DepositsBromate (ppb) 10 0.1 NR NR 2.0 ND – 4.7 No Byproduct of Drinking Water OzonationChlorine (ppm) 4.0 4 NR 2.2 NR 0.28 – 3.1 No Drinking water disinfectant added for treatmentChlorine Dioxide (ppb) 800 800 NR 100 NR ND – 730 No Drinking water disinfectant added for treatmentChlorite (ppm) 1 0.05 NR 0.16 NR 0.04 – 0.23 No Erosion of Natural DepositsFluoride (ppm) naturally-occurring 2 1 0.39 0.31 NR ND – 1.5 No Erosion of Natural DepositsFluoride (ppm) treatment-related Control Range 0.6 – 1.2 ppm NR NR 0.7 0.6 – 0.9 No Water Additive for Dental Health Optimal Level 0.7 ppmNitrate (ppm as N) 10 10 1.4 ND ND ND – 9.8 No Fertilizers, Septic TanksNitrate+Nitrite (ppm as N) 10 10 1.4 ND ND ND – 9.8 No Fertilizers, Septic TanksSelenium (ppb) 50 30 <5 ND ND ND – 6.2 No Fertilizers, Septic Tanks
Secondary Standards* – Tested in 2016 to 2018
Aluminum (ppb) 200* 600 ND ND 124 (RAA) ND – 310 No Treatment Process Residue, Natural DepositsChloride (ppm) 500* n/a 31 92 94 14 – 109 No Leaching from Natural Deposits; Seawater InfluenceColor (color units) 15* n/a <3 <3 <1 ND – 5 No Naturally-Occurring Organic SubstancesOdor (TON) 3* n/a <1 1 2 1 – 8 No Naturally-Occurring Organic MaterialsIron (ppb) 300* n/a <100 ND ND ND – 205 No Leaching from natural deposits; industrial wastesSpecific Conductance (µmho/cm) 1,600* n/a 430 1,056 906 303 – 1110 No Ions in Water; Seawater InfluenceSulfate (ppm) 500* n/a 70 256 199 3.0 – 349 No Runoff or Leaching from Natural DepositsTotal Dissolved Solids (ppm) 1,000* n/a 265 682 565 140 – 726 No Runoff or Leaching from Natural DepositsTurbidity (NTU) 5* n/a <0.10 0.22 ND ND – 0.45 No Erosion of Natural Deposits
Unregulated Contaminants – Tested in 2016 to 2018
Alkalinity, Total (ppm as CaCO3) Not Regulated n/a 150 150 106 56 – 229 n/a Runoff or Leaching from Natural DepositsBicarbonate (ppm as HCO3) Not Regulated n/a 178 180 NR 116 – 214 n/a Runoff or Leaching from Natural DepositsBoron (ppm) NL = 1 n/a <0.1 0.14 0.13 ND – 0.51 n/a Runoff or Leaching from Natural DepositsBromide (ppm) Not Regulated n/a <0.1 NR NR ND – 0.22 n/a Runoff or Leaching from Natural DepositsCalcium (ppm) Not Regulated n/a 42 77 58 2.4 – 124 n/a Runoff or Leaching from Natural DepositsCarbonate (ppm) Not Regulated n/a 3.7 0.6 NR ND – 31 n/a Runoff or Leaching from Natural DepositsChlorate (ppb) NL = 800 n/a NR NR 30 30 n/a Byproduct of Drinking Water ChlorinationCorrosivity (Aggressiveness) Not Regulated n/a 11.71 12.45 12.30 10.87 – 12.94 n/a Elemental Balance in WaterCorrosivity (Langlier Index) Not Regulated n/a (-)0.04 0.44 0.49 (-)0.87 – 1.2 n/a Elemental Balance in WaterHardness, Total (ppm as CaCO3) Not Regulated n/a 144 320 240 6.6 – 439 n/a Runoff or Leaching from Natural DepositsHardness, Total (grains/gal) Not Regulated n/a 8.4 19 14 0.4 – 26 n/a Runoff or Leaching from Natural DepositsHexavalent Chromium (ppb) Not Regulated 0.02 <1 ND ND ND – 1.4 No Erosion of Natural Deposits; Industrial DischargeMagnesium (ppm) Not Regulated n/a 17 31 23 ND – 36 n/a Runoff or Leaching from Natural Depositsortho-Phosphate (ppm) Not Regulated n/a 0.24 NR NR ND – 8.6 n/a Drinking Water Treatment Chemical for Aesthetic QualitypH (pH units) Not Regulated n/a 8.2 8.0 8.1 7.4 – 8.8 n/a Acidity, Hydrogen IonsPotassium (ppm) Not Regulated n/a 1.6 5.0 4.4 0.6 – 5.2 n/a Runoff or Leaching from Natural DepositsSodium (ppm) Not Regulated n/a 58 92 92 30 – 121 n/a Runoff or Leaching from Natural DepositsTotal Organic Carbon (ppm) TT n/a 0.79 3.0 2.4 ND – 7.3 TT Various Natural and Man-Made sourcesVanadium (ppb) NL = 50 n/a 2.6 ND ND ND – 8.0 n/a Runoff or Leaching from Natural Deposits
Additional Parameters That Are Not Required, But May Be Of Interest To Customers – Tested in 2018
1,4-Dioxane (ppb) NL = 1 n/a <1 NR NR ND – 1.3 n/a Industrial Waste Discharge
Turbidity – combined filter effluent Treatment Technique Turbidity Measurements TT Violation? Typical Source of Contaminant
Baker Water Treatment Plant 1) Highest single turbidity measurement 0.1 NTU 0.066 No Soil Run-Off 2) Percentage of samples less than 0.3 NTU 95% 100% No Soil Run-OffMetropolitan Water District Diemer Filtration Plant 1) Highest single turbidity measurement 0.3 NTU 0.07 No Soil Run-Off 2) Percentage of samples less than 0.3 NTU 95% 100% No Soil Run-Off
Unregulated Chemicals Requiring Monitoring at Entry Points to the Distribution SystemChemical Notification Level PHG Average Local and Imported Range of Detections Most Recent Sampling
1,4-Dioxane (ppb) 1 n/a 0.1 ND – 0.45 2014Bromochloromethane (ppb) n/a n/a <0.06 ND – 0.12 2014Chlorate (ppb) 800 n/a 169 ND – 710 2014Chromium, Hexavalent (ppb) n/a 0.02 0.22 ND – 0.72 2014Chromium, Total (ppb)** MCL = 50 MCLG = 100 0.2 ND – 0.7 2014Germanium, Total (ppb) n/a n/a <0.30 ND – 0.40 2018Manganese, Total (ppb)*** SMCL = 50 n/a 1.8 0.8 – 2.7 2018Molybdenum, Total (ppb) n/a n/a 6.4 1.3 – 19 2014Strontium, Total (ppb) n/a n/a 536 163 – 1100 2014Vanadium, Total (ppb) 50 n/a 2.6 0.7 – 4.3 2014
Your water has been tested for many more chemicals than are listed above, including metals (such as mercury),pesticides and volatile organic compounds. Chemicals not detected in any water sources are not included inthe table.*Contaminant is regulated by a secondary standard to maintain aesthetic qualities (taste, odor, color).
ppb = parts-per-billion; ppm = parts-per-million; pCi/L = picoCuries per liter; NTU = nephelometric turbidity units; ND = not detected; n/a = not applicable; NR = not required to be tested; NL = Notification Level; < = average is less than the detection limit for reporting purposes;MCL = Maximum Contaminant Level; (MCLG) = federal MCL Goal; PHG = California Public Health Goal; µmho/cm = micromho per centimeter; TT = Treatment Technique; RAA = Highest Running Annual Average
Turbidity is a measure of the cloudiness of the water, an indication of particulate matter, some of which might include harmful microorganisms.Low turbidity in Metropolitan’s treated water is a good indicator of effective filtration. Filtration is called a “treatment technique” (TT).
A treatment technique is a required process intended to reduce the level of contaminants in drinking water that are difficultand sometimes impossible to measure directly.
~ 6 ~
SMCL = Secondary MCL**Total chromium is regulated with an MCL of 50 ppb but was not detected, based on the detection limit for purposes of reporting of 10 ppb.
Total chromium was included as part of the unregulated chemicals requiring monitoring.***Total manganese is regulated with an secondary MCL of 50 ppb but was not detected, based on the detection limit for purposes
of reporting of 20 ppb. Total manganese was included as part of the unregulated chemicals requiring monitoring.
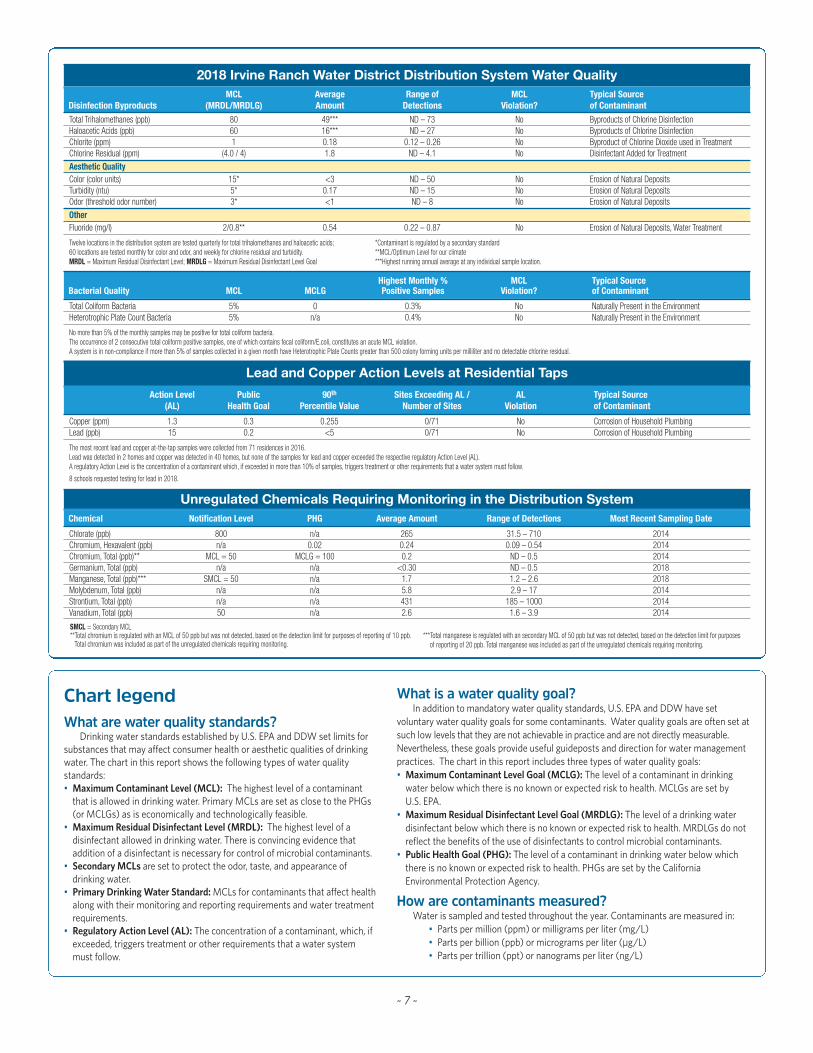
2018 Irvine Ranch Water District Distribution System Water Quality MCL Average Range of MCL Typical Source
Disinfection Byproducts (MRDL/MRDLG) Amount Detections Violation? of Contaminant
Total Trihalomethanes (ppb) 80 49*** ND – 73 No Byproducts of Chlorine DisinfectionHaloacetic Acids (ppb) 60 16*** ND – 27 No Byproducts of Chlorine DisinfectionChlorite (ppm) 1 0.18 0.12 – 0.26 No Byproduct of Chlorine Dioxide used in TreatmentChlorine Residual (ppm) (4.0 / 4) 1.8 ND – 4.1 No Disinfectant Added for Treatment
Aesthetic Quality
Color (color units) 15* <3 ND – 50 No Erosion of Natural DepositsTurbidity (ntu) 5* 0.17 ND – 15 No Erosion of Natural DepositsOdor (threshold odor number) 3* <1 ND – 8 No Erosion of Natural Deposits
Other
Fluoride (mg/l) 2/0.8** 0.54 0.22 – 0.87 No Erosion of Natural Deposits, Water Treatment
Twelve locations in the distribution system are tested quarterly for total trihalomethanes and haloacetic acids; *Contaminant is regulated by a secondary standard 60 locations are tested monthly for color and odor, and weekly for chlorine residual and turbidity. **MCL/Optimum Level for our climateMRDL = Maximum Residual Disinfectant Level; MRDLG = Maximum Residual Disinfectant Level Goal ***Highest running annual average at any individual sample location.
Highest Monthly % MCL Typical Source Bacterial Quality MCL MCLG Positive Samples Violation? of Contaminant
Total Coliform Bacteria 5% 0 0.3% No Naturally Present in the EnvironmentHeterotrophic Plate Count Bacteria 5% n/a 0.4% No Naturally Present in the Environment
No more than 5% of the monthly samples may be positive for total coliform bacteria. The occurrence of 2 consecutive total coliform positive samples, one of which contains fecal coliform/E.coli, constitutes an acute MCL violation. A system is in non-compliance if more than 5% of samples collected in a given month have Heterotrophic Plate Counts greater than 500 colony forming units per milliliter and no detectable chlorine residual.
Lead and Copper Action Levels at Residential Taps Action Level Public 90th Sites Exceeding AL / AL Typical Source
(AL) Health Goal Percentile Value Number of Sites Violation of Contaminant
Copper (ppm) 1.3 0.3 0.255 0/71 No Corrosion of Household PlumbingLead (ppb) 15 0.2 <5 0/71 No Corrosion of Household Plumbing
The most recent lead and copper at-the-tap samples were collected from 71 residences in 2016. Lead was detected in 2 homes and copper was detected in 40 homes, but none of the samples for lead and copper exceeded the respective regulatory Action Level (AL). A regulatory Action Level is the concentration of a contaminant which, if exceeded in more than 10% of samples, triggers treatment or other requirements that a water system must follow.
8 schools requested testing for lead in 2018.
Unregulated Chemicals Requiring Monitoring in the Distribution SystemChemical Notification Level PHG Average Amount Range of Detections Most Recent Sampling Date
Chlorate (ppb) 800 n/a 265 31.5 – 710 2014Chromium, Hexavalent (ppb) n/a 0.02 0.24 0.09 – 0.54 2014Chromium, Total (ppb)** MCL = 50 MCLG = 100 0.2 ND – 0.5 2014Germanium, Total (ppb) n/a n/a <0.30 ND – 0.5 2018Manganese, Total (ppb)*** SMCL = 50 n/a 1.7 1.2 – 2.6 2018Molybdenum, Total (ppb) n/a n/a 5.8 2.9 – 17 2014Strontium, Total (ppb) n/a n/a 431 185 – 1000 2014Vanadium, Total (ppb) 50 n/a 2.6 1.6 – 3.9 2014
Chart legend
What are water quality standards?Drinking water standards established by U.S. EPA and DDW set limits for
substances that may affect consumer health or aesthetic qualities of drinkingwater. The chart in this report shows the following types of water qualitystandards:• Maximum Contaminant Level (MCL): The highest level of a contaminant
that is allowed in drinking water. Primary MCLs are set as close to the PHGs(or MCLGs) as is economically and technologically feasible.
• Maximum Residual Disinfectant Level (MRDL): The highest level of adisinfectant allowed in drinking water. There is convincing evidence thataddition of a disinfectant is necessary for control of microbial contaminants.
• Secondary MCLs are set to protect the odor, taste, and appearance ofdrinking water.
• Primary Drinking Water Standard: MCLs for conta mi nants that affect healthalong with their monitoring and reporting requirements and water treatmentrequirements.
• Regulatory Action Level (AL): The concen tra tion of a contaminant, which, ifexceeded, triggers treatment or other requirements that a water systemmust follow.
What is a water quality goal?In addition to mandatory water quality standards, U.S. EPA and DDW have set
voluntary water quality goals for some con tami nants. Water quality goals are often set atsuch low levels that they are not achievable in practice and are not directly measur able.Nevertheless, these goals provide useful guide posts and direction for water managementpractices. The chart in this report includes three types of water quality goals:• Maximum Contaminant Level Goal (MCLG): The level of a contaminant in drinking
water below which there is no known or expected risk to health. MCLGs are set byU.S. EPA.
• Maximum Residual Disinfectant Level Goal (MRDLG): The level of a drinking waterdisinfectant below which there is no known or expected risk to health. MRDLGs do notreflect the benefits of the use of disinfectants to control microbial contaminants.
• Public Health Goal (PHG): The level of a con tami nant in drinking water below whichthere is no known or expected risk to health. PHGs are set by the CaliforniaEnvironmental Protection Agency.
How are contaminants measured?Water is sampled and tested throughout the year. Contaminants are measured in:
• Parts per million (ppm) or milligrams per liter (mg/L)• Parts per billion (ppb) or micrograms per liter (µg/L)• Parts per trillion (ppt) or nanograms per liter (ng/L)
~ 7 ~
SMCL = Secondary MCL**Total chromium is regulated with an MCL of 50 ppb but was not detected, based on the detection limit for purposes of reporting of 10 ppb.
Total chromium was included as part of the unregulated chemicals requiring monitoring.***Total manganese is regulated with an secondary MCL of 50 ppb but was not detected, based on the detection limit for purposes
of reporting of 20 ppb. Total manganese was included as part of the unregulated chemicals requiring monitoring.

Source water assessments
(IRWD) Baker Water Treatment Plant
water assessment
The Baker Water Treatment Plant receives untreatedsurface water from MWD (see MWD waterassessment above) and untreated surface waterfrom Irvine Lake (Santiago Reservoir). The surfacewater assessment of Santiago Reservoir isprovided by Serrano Water District, which alsouses source water from Santiago Reservoir.
The most recent watershed sanitary survey for SantiagoReservoir was updated in 2014. Water supplies fromSantiago Reservoir are most vulnerable to septic tank,landfill and dump activities. The Source Water Assessmentfor Santiago Reservoir was completed in April 2001. Theassessment was conducted for the Serrano Water Districtby Boyle Engineering Corporation with assistance fromthe Serrano Water District staff.
A copy of the complete assessment may be viewed atthe IRWD Water Quality Department, 3512 MichelsonDrive, Irvine. You may request a summary of the assessmentby writing to District Secretary, Irvine Ranch Water District,15600 Sand Canyon Avenue, Irvine, California 92618.
Groundwater assessment
An assessment of the groundwater sources in the LakeForest service area of IRWD was completed in December2002. This groundwater is considered most vulnerable tocontamination from dry cleaners and sewer collectionsystems.
An assessment of the groundwater sources in the Dyer
Road Well Field was completed in July 2003. This ground -water is considered most vulner able to contaminationfrom gas stations, historic gas stations, metal plating/
finishing/fabrication facilities, military installationsand plastics/synthetics producers.
An assessment of the groundwater sources inthe Wells 21-22 Desalter Project was completed inMay 2009. This ground water is considered mostvulnerable to contami nation from sewer collection
systems, automobile (gas stations), historic gas stationsand underground storage tanks (confirmed leaking tanks).
An assessment of the groundwater sources in theIrvine Desalter Project was completed in March 2006.This groundwater is considered most vulnerable tocontami nation from crop irrigation and fertilizers.
An assessment of the ground water source in theOrange Park Acres service area of IRWD was completed inMarch 2003. This ground water is consid ered most vulner -able to contamination from sewer collection systems.
An assessment of the ground water in the SantiagoCanyon service area of IRWD was completed in January2003. There have been no contami nants detected in thewater supply, however the source is still considered vulner -able to conta mination from historical mining operations.
Copies of the complete assess ments may be viewedat the IRWD Water Quality Depart ment, 3512 MichelsonDrive, Irvine. You may request a summary of the assess -ments by writing to District Secretary, Irvine Ranch WaterDistrict, 15600 Sand Canyon Avenue, Irvine, California92618.
Imported (MWD) water assessment
Every five years, MWD is required by DDW toexamine possible sources of drinking water contami -nation in its State Water Project andColorado River source waters.
The most recent watershed sanitarysurveys of its source water suppliesfrom the Colorado River was updated in2015 and the State Water Project was updated in 2016.Both source waters are exposed to stormwater runoff,recreational activities, wastewater discharges, wildlife,fires, and other watershed-related factors that couldaffect water quality.
Water from the Colorado River is consider ed to bemost vulner able to contamination from recreation,urban/stormwater runoff, increasing urbanization in thewatershed, and wastewater. Water supplies fromNorthern California’s State Water Project are mostvulnerable to contamination from urban/storm waterrunoff, wildlife, agriculture, recreation, and wastewater.
U.S. EPA also requires MWD to complete one SourceWater Assess ment (SWA) that uses infor mationcollected in the watershed sanitary surveys. MWDcompleted its SWA in December 2002. The SWA is usedto evaluate the vulnerability of water sources to contami -nation and helps determine whether more protectivemeasures are needed.
A copy of the most recent summary of either Water -shed Sanitary Survey or the SWA can be obtained bycalling MWD at 800-CALL-MWD (800-225-5693).
~ 8 ~