2019 preqin global real estate report · 2019 preqin global real estate report sample pages. isbn:...
TRANSCRIPT

2019 Preqin Global Real Estate
Report
Sample Pages
ISBN: 978-1-912116-16-4$175 / £125 / €150www.preqin.com

2 © P r e q i n L t d . / w w w . p r e q i n . c o m
2 0 1 9 P R E Q I N G L O B A L R E A L E S T A T E R E P O R T
CONTENTS
CEO's Foreword – Mark O'Hare 3
1. 2019 PREQIN GLOBAL REAL ESTATE REPORT
Evolution in the Real Estate Market – Mike Sales, Nuveen Real Estate
6
Key Trends of 2018 9
2. FUNDRAISING IN 2018
Increasing Competition in an Uncertain Market
12
Fundraising in 2018 14
Regional Fundraising 16
Funds in Market 18
3. FUND MANAGERS & AUM
Distributions Continue as Assets Grow 20
Assets under Management 22
Fund Managers 24
4. INVESTORS
Cyclical and Secular Attractions to Secondary US Markets – Greg MacKinnon, Pension Real Estate Association (PREA)
29
Fresh Investor Capital in an Evolving Market 30
Investors 32
Future Investments 34
Alternative Structures 36
5. PERFORMANCE
Strong Performance Satisfies Investors 38
Performance Overview 40
Private vs. Public 43
A View on Performance 44
6. DEALS & EXITS
PERE Deals in 2018: Competition and Cycles 46
Deals 48
Exits 50
7. OUTLOOK
Finding the Optimum Strategy for 2019 52
Outlook for Real Estate 54
DATA PACK FOR 2019 PREQIN GLOBAL REAL ESTATE REPORTThe data behind all of the charts and infographics featured in this report, plus additional datasets for each of the chapters in the book, is available to purchase in Excel format. Ready-made charts and graphs are also available, and can be used in marketing materials, presentations or company reports.
To purchase the data pack, please contact your Preqin representative or download an order form here:
www.preqin.com/grer

2 0 1 9 P R E Q I N G L O B A L R E A L E S T A T E R E P O R T
6 © P r e q i n L t d . / w w w . p r e q i n . c o m
You have recently rebranded. What prompted the decision to change your name?By rebranding from TH Real Estate to Nuveen Real Estate, we aim to bring greater clarity and consistency to our brand across the globe. It represents the next step in our corporate evolution, in which we will continue to develop our vision to be a top-tier real estate manager investing in Tomorrow’s World for the enduring benefit of our clients and society.
We have benefitted from the support and scale of Nuveen’s investment platform and services for the past few years. It made sense to consolidate the offering to our clients and partners worldwide. Nuveen offers a broad array of traditional equity and fixed income assets, and access to a wide range of liquid and illiquid alternative strategies in asset classes such as real assets (farmland, timber, infrastructure), private equity and debt. We can now more easily discuss cross-asset-class solutions with clients, tailored to their specific risk/return appetite.
How has your business grown geographically over the past year?We continue to expand our local footprint across the key regions of the globe. The past 12 months have seen new office openings across the US and key strategic hires across the US, Europe and Asia-Pacific. Asia is a particular growth focus for the business. We see a lot of emerging opportunities in that region and would like to help our clients take advantage of those. Over the next 10 years Asia is going to account for half of the world’s output, 30% of global consumption and about 60% of the increase in the urbanization rate. We are in the process of opening an office in Tokyo and have recently appointed a partner in Korea to enhance our access to investment stock in its key cities such as Seoul.
How does investment philosophy guide your investment decisions?Our investment philosophy is guided, first and foremost, by our global cities strategy. We believe it is the smart selection of global cities, that are considered secularly resilient and sustainable from an economic and environmental perspective, that may help to underpin a robust real estate investment strategy over the long term. In doing so, we aim to
deliver attractive, risk-adjusted portfolio returns to investors.
We use a proprietary research process to identify the top 2% of global cities. This methodical and balanced approach takes into account a wide range of factors: scale, transparency, stability and, most importantly, structural megatrends, helping to future-proof a portfolio for long-term relevance and growth.
Overlaying and complementing our cities strategy is a clear tactical understanding of market fundamentals, which aims to deliver alpha to a portfolio at different points of the cycle. This involves a broader appreciation of sector dynamics across the whole city, as well as a deep dive into sub-market conditions to supplement our house view of the broader economic and capital market environment.
How are you responding to investors’ needs for varying outcomes?We provide clients access to our series of solutions through a range of products and structures, tailored to their requirements. We also co-invest alongside investors on a range of assets and products.
We focus on three investor objectives which we believe best address current concerns:
■ Generating income and capital growth, despite the low-rate environment, by focusing on demographic needs to grow assets and match liabilities;
■ Managing risk in a world of ongoing uncertainty by focusing on structural trends to insulate against short-lived market cycles;
EVOLUTION IN THE REAL ESTATE MARKET
MIKE SALESCEO, Nuveen Real Estate

1 . 2 0 1 9 P R E Q I N G L O B A L R E A L E S T A T E R E P O R T
7
■ Managing assets cost-effectively via optimal scale and access by leveraging our global scale to bring like-minded investors together.
We have developed our range of real estate solutions to offer the resilient, enhanced and debt series. Each is tailored to help address additional bespoke investor requirements.
■ Our resilient series is designed for investors that are focused on diversification, income and long-term capital growth. Our strategies focus on investing in high-quality assets in leading cities that are well positioned in terms of long-term structural trends, including demographic change, urbanization and technology.
■ Our enhanced series applies strategies that work within market cycles, use a more active asset management and repositioning approach and/or invest in emerging sectors and locations. These strategies are designed for investors that are looking for an enhanced level of capital growth.
■ Our debt series is designed to provide investors with access to secure, income-focused returns. Our strategies may suit cautious investors seeking attractive levels of income with a measure of downside protection against short-term capital cycles.
What are the main challenges that real estate must overcome in reacting to technology, innovation and disruption? The industry faces two main challenges: the first is navigating the short-term, technology-driven shift in the purpose of real estate. A major task will be understanding what people want from real estate,
particularly in the two largest sectors: retail and office. The digital world allows people to work and shop remotely if they choose to, and real estate must differentiate itself by providing an experience, or at least prioritize efficiency. The second is adapting to a heightened pace of obsolescence. In order to do this, real estate must do more to encourage and reward creativity, forward-thinking and innovation. The industry must also think strategically by applying research around the nature of demand for real estate and the potential impact of key technological trends over the next 10 years.
Do you see ESG investing becoming more important to the real estate market?Yes, absolutely. This is most notable from the increased focus on sustainability from institutional investors, in particular those across the Netherlands, Scandinavia and Australia. These investors are setting carbon reduction targets and are mandating that the real estate funds that they invest in are taking meaningful steps to reduce carbon and improve the energy efficiency of buildings. It is now very common that investors require funds to participate in the Global Real Estate Sustainability Benchmark (GRESB), and in some cases a minimum performance score is specified. Investors are not only interested in energy efficiency. They are also focusing on climate change resilience, fair wages in the supply chain, tenant activity (e.g. screening out tenants that manufacture weapons) and the impact of buildings on the health, wellbeing and productivity of occupants.
We do also see some evidence of tenants placing more emphasis on the sustainability of buildings
IN PROFILE: EDINBURGH ST JAMESWe identified Edinburgh as a top global city; as well as being one of the fastest-growing and youngest cities in the UK, Edinburgh is also the UK’s second most popular tourist destination after London.
A world-class example of city-enhancing placemaking, with sustainability at its core, Edinburgh St James is one of the UK’s largest and most significant regeneration projects, of which we are proud to be a part-owner and developer. With an estimated investment value of over $1.3bn, the development will create a 1,700,000ft2 retail and leisure centre. It will comprise 850,000ft2 of retail space, anchored by John Lewis, a multi-screen cinema and a world-class W Hotel, which represents their debut in Scotland, comprising 214 rooms. In addition, 150 private apartments, offering breathtaking views over the city, set a gold standard for prime residential accommodation. Edinburgh St James will also create up to 3,000 permanent jobs.

2 0 1 9 P R E Q I N G L O B A L R E A L E S T A T E R E P O R T
8 © P r e q i n L t d . / w w w . p r e q i n . c o m
ABOUT NUVEEN REAL ESTATENuveen’s real estate platform is one of the largest in the world with $125bn in AUM. Managing a suite of funds and mandates, across both public and private investments, and spanning both debt and equity, across diverse geographies and investment styles, we provide access to every aspect of real estate investing. With over 80 years of real estate investing experience and more than 500 real estate professionals located across over 20 cities throughout the US, Europe and Asia-Pacific, the platform offers unparalleled geographic reach, which is married with deep sector expertise.
www.nuveen.com
when selecting real estate and we expect this to increase in the future as more and more corporate occupiers and retailers set their own carbon reduction targets. In the US, 70% of our office tenants reported that an ENERGY STAR Rating was important or very important in their search for office space.
How do you incorporate ESG factors into your investment strategies?Fundamentally, we believe that by incorporating ESG into investment strategies we are future-proofing the value of our real estate assets. Focusing on a wide range of ESG issues means that our property portfolio is better protected from risk and better placed to take advantage of opportunity. We assess the climate change vulnerability, energy efficiency and exposure to environmental risk at the point of acquisition; then our Sustainable Property Management Requirements are in place to ensure that we improve the sustainability performance of the buildings that we own. We have a target to reduce the energy intensity of our real estate equity portfolio by 30% by 2030 (based on a 2015 baseline). The majority of our funds take part in GRESB and outperform their peer group average in almost all instances.
How does incorporating ESG factors into investment strategies impact returns?For core funds, incorporating ESG factors into investment strategy helps to protect return. This is most obviously the case for long-term investment where the low carbon economy transition and the impacts of climate change are most likely to have an impact. For shorter-term and value-add investment, we believe ESG factors can be used to enhance return. For example, value can be added by sustainable refurbishment and by achieving sustainability certification such as LEED, BREEAM or Energy Star. Research that we have recently undertaken on our US office portfolio has shown
that sustainability certification is correlated with a significant decrease in vacancy.
What do you see being the main challenges of investing successfully in the real estate market in 2019?One of the biggest challenges in 2019 will be ensuring real estate investors are getting paid for the risk taken on. For example, the US real estate market is entering the ninth year of its recovery and the cycle is, by any measure, considered to be mature. Typically during the mature stages of a cycle, investors need to take on more risk to compensate for lower yields.
Successful investors will have to find assets with long-term growth prospects, which go beyond the current cycle, and with severe shortage of stock in some of the key European growth markets it may mean developing prime stock themselves, as we are doing in a number of key cities.
Another challenge will be managing the transition from real estate less in demand to those emerging sectors such as student housing or logistics. Investors will need to sell assets with weaker prospects, before values decline and get a foot in the door with new sectors without overpaying or choosing the wrong partner.
What do you see being the major drivers of change in the real estate market over 2019 and beyond? One of the biggest drivers of change beyond 2019, from a values and fundamentals perspective, will ultimately be the economic cycle since economic growth typically determines how well real estate performs. But another key driver will be technology and the disrupters this technology begets in the coming decade(s). The management of real estate will also become more crucial for value creation and preservation.

1 . 2 0 1 9 P R E Q I N G L O B A L R E A L E S T A T E R E P O R T
9
KEY TRENDS OF 2018
Despite uncertainty surrounding a potential market correction, private real estate experienced another strong year of fundraising in 2018; that being said, capital was more concentrated in the largest funds. The private real estate industry grew further, with total assets under management (AUM) surpassing $900bn for the first time, while investors continued to see high capital distributions.
STRONG FUNDRAISING CONTINUES ASSETS REACH ALL-TIME HIGH
CAPITAL BECOMES MORE CONCENTRATED POSITIVE CASH FLOW FOR INVESTORS
PERE DEAL ACTIVITY SETS RECORD CONCERNS OVER INTEREST RATES AND VALUATIONS
In 2018,
300funds raised an aggregate$124bn
This marks the sixth consecutive year in which fundraising has surpassed $100bn
Industry AUM surpassed $900bn for the first time in 2018, reaching$909bnas at the end of H1 2018
The 10 largest funds accounted for
35%of total capital raisedin 2018
$100bnwas distributed to investors in H1 2018, surpassing the $80bn in capital calls
$496mnAverage size of funds closed in 2018
$212bnwas distributed to investors in 2017, slightly below the record $270bn in 2016
A record
6,418 PERE deals were completed in 2018 for a record-high aggregate value of$325bn
Across our November 2018 surveys, the largest proportions of investor and fund manager respondents see asset valuations and rising interest rates as key challenges for return generation in 2019
85%of surveyed fund managers predict the industry will grow further in 2019
$

2 0 1 9 P R E Q I N G L O B A L R E A L E S T A T E R E P O R T
12 © P r e q i n L t d . / w w w . p r e q i n . c o m
INCREASING COMPETITION IN AN UNCERTAIN MARKET
Real estate investors and fund managers hoping for a reprieve in 2018 from 2017’s challenging market conditions were left disappointed. High valuations and concerns of a potential market correction pressured
fundraising in 2018. In addition, the atmosphere of general market uncertainty encouraged capital to flock to options perceived as safer in the form of larger vehicles and established brands.
Such an environment appears likely to persist in 2019 as managers predict increases in interest rates, and valuations will present challenges for return generation. However, while investors acknowledge the challenges of investing in real estate, four in five institutions surveyed by Preqin in November 2018 will maintain or increase their level of investment in 2019. So, with vast levels of capital still being deployed in private real estate, which locations, strategies and structures have LPs been targeting in these uncertain times?
NORTH AMERICA: THE CAPITAL HUBAs in previous years, North America was the dominant geographic focus in terms of both number of funds raised (203, representing 68% of the global total) and aggregate capital secured ($78bn, 63%) in 2018 (Fig. 2.3). There was relatively little change in the proportion of total capital secured by funds focused on each region compared with 2017. Capital focused on Asia represented the greatest increase, accounting for 8% of total capital raised in 2017 and 12% in 2018.
Europe-focused funds were responsible for one-quarter of capital secured in 2018 and raised an average of $59mn more than funds targeting North America. The average fund size increases again for vehicles focused on Asia, with six of the 21 funds closed securing more than $1bn, including Blackstone Real Estate Partners Asia II ($7.1bn). The increasing concentration of capital in larger Asia-focused funds is likely because investors are generally looking to known brands when allocating to unfamiliar markets.
DEBT RISES AMID HIGHER RISK DOMINANCEA distinctive trend in recent private real estate fundraising has been the rise of real estate debt funds. Investors continued to seek exposure to the lower risk/return strategy over 2018, with 2018’s total of $26bn marking the fifth time in the past six years that capital raised for debt strategies has surpassed $20bn, despite not reaching the record $33bn secured in 2017. However, it is not only the risk/return profile that attracted investors to debt strategies. Investors likely have one eye looking out for a potential change in the cycle, and the downside risk protection that debt investments offer at the top of the capital structure makes them more secure than low-yield equity investments in the event of a price shift. Higher-risk strategies continue to attract the largest amounts of capital; value-added and opportunistic strategies raised 69% of capital secured in 2018.
INVESTORS KNOW WHAT THEY WANTThe average amount of time spent on the road by managers looking to close their funds continues to increase, with just 27% of funds closed in 2018 spending 12 months or less on the road, a decrease from 35% of those closed in 2017. The longer a fund stays in market, the less likely it is to hold a close on or above its target. Among funds closed in 2018 that held a final close within 12 months, 71% reached or exceeded their fundraising target. This figure decreases to 48% for funds on the road for over two years.
It seems that investors are clear in what they are seeking from their real estate holdings, and they are quick to allocate when the correct opportunity hits the market. The challenge for fund managers raising capital is to determine how best to engage potential LPs in an increasingly competitive market.
CAPITAL CONCENTRATION INCREASESThe fundraising environment for emerging managers is ever more challenging. As investors look to established brands amid market uncertainty, capital concentration increases. The proportion of total annual capital secured by the 10 largest vehicles had been decreasing in recent years; however, among
2 0 1 9 P R E Q I N G L O B A L R E A L E S T A T E R E P O R T
32 © P r e q i n L t d . / w w w . p r e q i n . c o m
INVESTORS
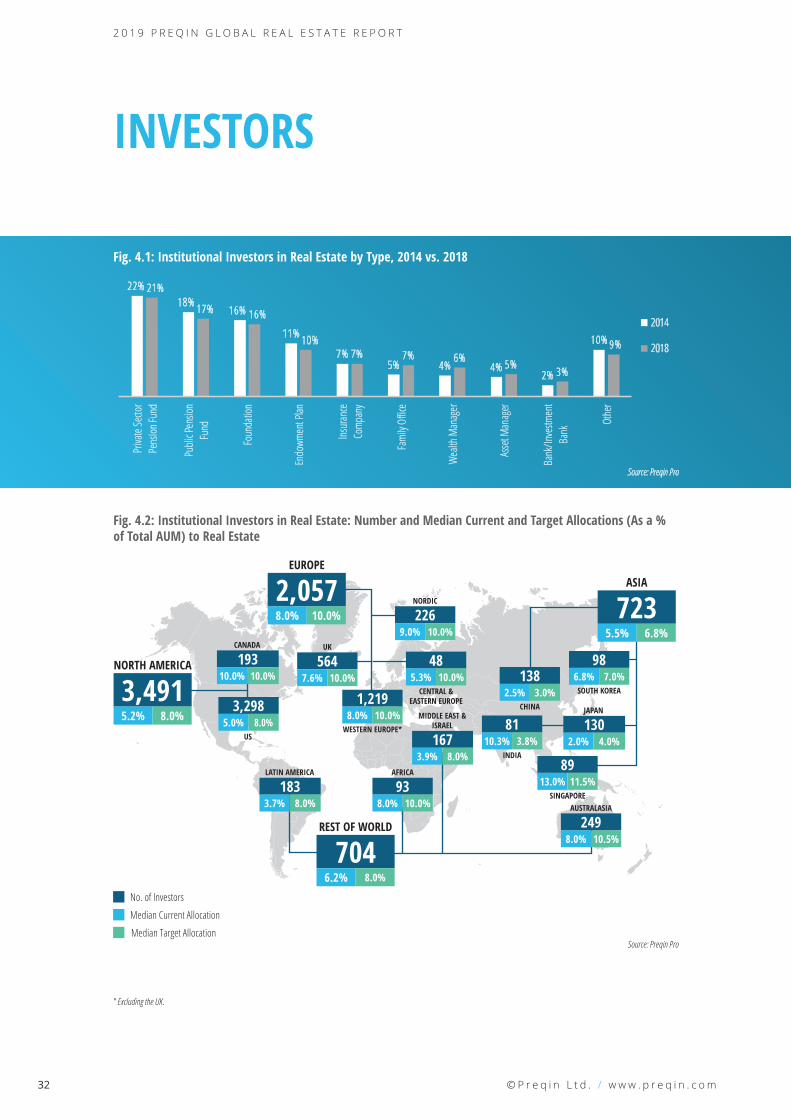
Fig. 4.1: Institutional Investors in Real Estate by Type, 2014 vs. 2018
22%18%
16%
11%
7%5% 4% 4%
2%
10%
21%
17% 16%
10%7% 7% 6% 5%
3%
9%
Priva
te Se
ctor
Pens
ion Fu
nd
Publi
c Pen
sion
Fund
Foun
datio
n
Endo
wmen
t Plan
Insur
ance
Comp
any
Fami
ly Of
fice
Wea
lth M
anag
er
Asse
t Man
ager
Bank
/Inve
stmen
tBa
nk
Othe
r
2014
2018
Source: Preqin Pro
Fig. 4.2: Institutional Investors in Real Estate: Number and Median Current and Target Allocations (As a % of Total AUM) to Real Estate
No. of Investors
Median Current Allocation
Median Target AllocationSource: Preqin Pro
US
3,298
NORTH AMERICA
3,4915.2% 8.0%
CANADA
19310.0% 10.0%
5.0% 8.0%
EUROPE
2,0578.0% 10.0%
UK
5647.6% 10.0%
NORDIC
2269.0% 10.0%
CENTRAL &EASTERN EUROPE
485.3% 10.0%
WESTERN EUROPE*
1,2198.0% 10.0%
ASIA
7235.5% 6.8%
SOUTH KOREA
986.8% 7.0%
CHINA
1382.5% 3.0%
SINGAPORE
8913.0% 11.5%
AUSTRALASIA
2498.0% 10.5%
JAPAN
1302.0% 4.0%
INDIA
8110.3% 3.8%
MIDDLE EAST & ISRAEL
1673.9% 8.0%
AFRICA
938.0% 10.0%
LATIN AMERICA
1833.7% 8.0%
REST OF WORLD
7046.2% 8.0%
* Excluding the UK.

2 0 1 9 P R E Q I N G L O B A L R E A L E S T A T E R E P O R T
56 © P r e q i n L t d . / w w w . p r e q i n . c o m
Fig. 7.7: Intentions for Targeted Markets in the Next 12 Months: Investors vs. Fund Managers
7%
4%
9%
15%
65%
3%
2%
10%
21%
63%
Only Emerging Markets
Mainly Emerging Markets,Some Developed Markets
Mix of Developedand Emerging Markets
Mainly Developed Markets,Some Emerging Markets
Only Developed Markets
Investors Fund ManagersSource: Preqin Fund Manager and Investor Surveys, November 2018
Fig. 7.8: Developed Markets Viewed as Presenting the Best Opportunities in Real Estate: Investors vs. Fund Managers
5%
12%
9%
3%
9%
13%
18%
33%
61%
4%
5%
6%
7%
14%
15%
27%
45%
56%
Singapore
Canada
Australia & New Zealand
South Korea
Japan
Nordic
UK
Western Europe (Excl. UK)
US
Investors Fund ManagersSource: Preqin Fund Manager and Investor Surveys, November 2018

The 2019 Preqin Global Alternatives Reports are the most detailed and comprehensive reviews of the alternative assets industry available, offering exclusive insight into the latest developments in the private equity, hedge fund, real estate, infrastructure, private debt and natural resources asset classes.
Access in-depth analysis and comprehensive statistics to understand the latest trends in fundraising, performance, investors, deals and fund managers.■ View historical data alongside the most important industry developments. Read contributions from
some of the industry’s leading igures.■ Improve your presentations, marketing materials and company reports.
■ Answer key questions: Who is investing? How much has been raised? Where are the centres of activity? Where is the capital going? What are the biggest deals? What is the outlook for the industry?
2019 PREQIN GLOBAL ALTERNATIVES REPORTS
For more information visit: www.preqin.com/reports
PAYMENT DETAILS: SHIPPING DETAILS:
Cheque enclosed (cheque payable to ‘Preqin’) Name:_______________________________________
Telephone:_______________________________________
Charge my: Visa Firm:_______________________________________
Email:_______________________________________
Mastercard Job Title:_______________________________________
Amex Address:_______________________________________
Please invoice me _______________________________________
Currency: USD GBP EUR _______________________________________
Card Number:_______________________________________
City:_______________________________________
Name on Card:_______________________________________
State:_______________________________________
Expiration Date:_______________________________________
Post/Zip:_______________________________________
Security Code:_______________________________________
Country:_______________________________________
COMPLETED ORDER FORMSPost (to Preqin):
NEW YORKOne Grand Central Place60 E 42nd StreetSuite 630New YorkNY 10165Tel: +1 212 350 0100Fax: +1 440 445 9595
LONDON3rd FloorVintners’ Place68 Upper Thames StreetLondonEC4V 3BJTel: +44 (0)20 3207 0200Fax: +44 (0)870 330 5892
SINGAPOREOne Finlayson Green#11-02Singapore049246
Tel: +65 6305 2200Fax: +65 6491 2240
SAN FRANCISCOOne Embarcadero CenterSuite 2850San FranciscoCA 94111
Tel: +1 415 316 0580 Fax: +1 440 445 9595
HONG KONGLevel 9, Central Building1-3 Pedder StreetCentral, Hong Kong
Tel: +852 3892 0200
American Express, four-digit code printed on the front of the card.
Visa and Mastercard, last three digits printed on the signature strip.
I would like to purchase:
PRINTName First Copy Each Additional Copy Quantity Data Pack* Private Equity & Venture Capital $175/£125/€150 $90/£65/€75 $300/£215/€260Hedge Funds $175/£125/€150 $90/£65/€75 $300/£215/€260Real Estate $175/£125/€150 $90/£65/€75 $300/£215/€260Infrastructure $175/£125/€150 $90/£65/€75 $300/£215/€260Private Debt $175/£125/€150 $90/£65/€75 $300/£215/€260Natural Resources $175/£125/€150 $90/£65/€75 $300/£215/€260All Six Titles (25% Saving!) $785/£560/€675 $395/£280/€340 $1,350/£965/€1,160Shipping Costs: $40/£10/€25 for single publication
$20/£5/€12 for additional copies(Shipping costs will not exceed a maximum of $60/£15/€37 per order when all shipped to same address. If shipped to multiple addresses then full postage rates apply for additional copies.)
If you would like to order more than 10 copies of one title, please contact us for a special rate
DIGITALName Single-User Licence Each Additional
Copy Quantity Enterprise Licence** Data Pack*
Private Equity & Venture Capital $175/£125/€150 $90/£65/€75 $1,000/£715/€860 $300/£215/€260Hedge Funds $175/£125/€150 $90/£65/€75 $1,000/£715/€860 $300/£215/€260Real Estate $175/£125/€150 $90/£65/€75 $1,000/£715/€860 $300/£215/€260Infrastructure $175/£125/€150 $90/£65/€75 $1,000/£715/€860 $300/£215/€260Private Debt $175/£125/€150 $90/£65/€75 $1,000/£715/€860 $300/£215/€260Natural Resources $175/£125/€150 $90/£65/€75 $1,000/£715/€860 $300/£215/€260All Six Titles (25% Saving!) $785/£560/€675 $395/£280/€340 $4,500/£3,215/€3,860 $1,350/£965/€1,160*Data packs feature all the chart and league table data in an Excel file. Must be purchased alongside the associated report.**Enterprise Licence allows for team-wide digital access.Please note all prices quoted throughout are exclusive of sales taxes.