2019 european semester: assessment of progress on ... · croatia, building on the analysis of...
TRANSCRIPT

EN EN
EUROPEAN COMMISSION
Brussels, 27.2.2019
SWD(2019) 1010 final
COMMISSION STAFF WORKING DOCUMENT
Country Report Croatia 2019
Including an In-Depth Review on the prevention and correction of macroeconomic
imbalances
Accompanying the document
COMMUNICATION FROM THE COMMISSION TO THE EUROPEAN
PARLIAMENT, THE EUROPEAN COUNCIL, THE COUNCIL, THE EUROPEAN
CENTRAL BANK AND THE EUROGROUP
2019 European Semester: Assessment of progress on structural reforms, prevention and
correction of macroeconomic imbalances, and results of in-depth reviews under
Regulation (EU) No 1176/2011
{COM(2019) 150 final}

1
Executive summary 4
1. Economic situation and outlook 8
2. Progress with country-specific recommendations 14
3. Overall findings regarding imbalances, risks and adjustment issues 18
4. Reform priorities 23
4.1. Public finances and taxation* 23
4.2. Private sector debt and financial sector* 30
4.3. Labour market, education and social policies* 36
4.4. Competitiveness reforms and investment* 47
Annex A: Overview Table 58
Annex B: Commission Debt Sustainability Analysis and fiscal risks 62
Annex C: Standard Tables 63
Annex D: Investment Guidance on Cohesion Policy Funding 2021-2027 for Croatia 69
References 74
LIST OF TABLES
Table 1.1: Key economic and financial indicators - Croatia 13
Table 2.1: 2018 country-specific recommendations (CSRs) assessment 15
Table 3.1: MIP matrix 21
Table 4.2.1: Financial soundness indicators, all domestic and foreign banks 33
Table A.1: 2018 country-specific recommendations (and subparts) assessment 58
Table C.1: Financial market indicators 63
Table C.2: Headline Social Scoreboard indicators 64
Table C.3: Labour market and education indicators 65
Table C.4: Social inclusion and health indicators 66
Table C.5: Product market performance and policy indicators 67
Table C.6: Green growth 68
CONTENTS

2
LIST OF GRAPHS
Graph 1.1: Real GDP growth by demand component 8
Graph 1.2: Private and public investment 9
Graph 1.3: Current account composition, gross external debt and net international investment
position 9
Graph 1.4: Labour market developments 10
Graph 1.5: Nominal wage growth: actual and predicted based on economic fundamentals 11
Graph 1.6: Potential output and components, 2017 11
Graph 1.7: Regional convergence 12
Graph 2.1: Overall multiannual implementation of 2014-2018 CSRs to date 14
Graph 4.1.1: Drivers of change in the debt ratio 23
Graph 4.1.2: Structure of public debt 23
Graph 4.1.3: Drivers of change in government balance 24
Graph 4.1.4: Active government guarantees by companies, 2017 25
Graph 4.1.5: Public debt ratio baseline and scenarios 25
Graph 4.1.6: Distributional effects of changes to the PIT and contributions by income quintiles 26
Graph 1: Tax rates on income by sources (lhs) and tourist beds per inhabitant by municipalities
(rhs), 2017 27
Graph 4.2.1: Trading volumes at Zagreb Stock Exchange 32
Graph 4.2.2: Growth of new business loans (in annual volumes) 33
Graph 4.2.3: Asset quality evolution 34
Graph 4.2.4: Evolution of NPL flows 34
Graph 4.3.1: Activity rate by age and educational attainment level, 2017 36
Graph 4.3.2: Reasons for inactivity by age and sex, 2016 36
Graph 4.3.3: Relative dispersion of employment rates of different skills groups in EU 37
Graph 4.3.4: Share of employers reporting labour shortages as the main factor limiting their activity
by sector 37
Graph 4.3.5: Evolution (% change) of the population by municipalities, 2012-2017 38
Graph 4.3.6: Population migration 39
Graph 4.3.7: At-risk-of-poverty or social exclusion rate and its components (AROP, SMD, LWI) 40
Graph 4.4.1: Labour productivity (GVA per worker) by sector, 2017 47
Graph 4.4.2: Real labour productivity in manufacturing and construction by firm size 47
Graph 4.4.3: Business and public R&D intensity 49
Graph 4.4.4: Final energy consumption in 2015 52
Graph 4.4.5: Registered unemployment rate (%) by county, 2017 54
Graph 4.4.6: Employment, unemployment and tertiary education rates, by level of urbanisation,
2015-2017 54

3
LIST OF BOXES
Box 2.1: EU funds and programmes contribute to addressing structural challenges and fostering
growth and competitiveness in Croatia 16
Box 4.1.1: Taxation of labour, capital and property income of households 27
Box 4.3.1: Monitoring performance in light of the European Pillar of Social Rights 41
Box 4.3.2: The 2018 Pension System Reform 43
Box 4.4.1: Investment challenges and reforms in Croatia 50
4
Ensuring durable economic growth is becoming
a key challenge for Croatia. While still above the
EU average, the pace of economic growth is
moderating and gradually nearing its potential rate,
which is only slowly increasing. The stock of
macroeconomic imbalances continued to be
reduced, largely driven by the positive economic
environment and prudent management of
government finances. Using the still favourable
economic outlook to step up structural reform
efforts would help boost potential growth. Reforms
need to be focused on sustaining the positive
trends on the labour market, and on creating a
business environment conducive to investment and
higher productivity gains (1).
The economic recovery has continued, largely
driven by robust domestic demand. In 2018
GDP growth is projected to have moderated
slightly to 2.8 %, from 2.9 % the year before.
Private consumption remained strong as
households enjoyed higher disposable incomes on
account of the continued growth in employment
and wages. Public capital formation remained
subdued, dragging on the overall investment
activity. Exports of both goods and services
continued to grow at record levels, but with signs
of slowing and outpaced by the increase in
imports.
A full decade after the financial crisis, the
economy is set to fully regain the output lost
during the recession. Employment is expected to
continue growing steadily. Coupled with
continuing low inflation, also thanks to cuts in
consumption taxes in 2019 and 2020, GDP growth
is expected to remain driven largely by household
consumption. However, investment will play a
(1) This report assesses Croatia’s economy in light of the
European Commission’s Annual Growth Survey published on 21 November 2018 (European Commission, 2018d). In
the survey, the Commission calls on EU Member States to implement reforms to make the European economy more
productive, resilient and inclusive. In so doing, Member
States should focus their efforts on the three elements of the virtuous triangle of economic policy — delivering
high-quality investment, focusing reforms efforts on productivity growth, inclusiveness and institutional quality
and ensuring macroeconomic stability and sound public
finance. At the same time, the Commission published the Alert Mechanism Report (AMR; European Commission,
2018b) that initiated the eighth round of the
macroeconomic imbalance procedure. The AMR found that
Croatia warranted an in-depth review, which is presented in
this report.
gradually increasing role. In particular, the private
sector is expected to continue benefiting from
ample liquidity and declining interest rates. In the
public sector, greater use of EU funding is
expected as the end of the programming period
nears. As a result of the continued deterioration of
the balance of trade in goods, the contribution of
the external sector to growth is projected to grow
increasingly negative. In all, real GDP growth is
forecast to moderate further to 2.7 % in 2019, and
2.6 % in 2020.
Boosting the economy’s growth potential
requires investments in transport, energy and
environmental infrastructure, skills and
research and innovation. Croatia’s low level of
capital investment, i.e. in equipment and
infrastructure, affects the growth potential. The
quality of service and connectivity of the transport
infrastructure, in particular railways, are
underdeveloped. Improving energy efficiency,
water management and facilitating the transition to
a circular economy also require infrastructure
investment. Investment in public and private R&D
and digitalisation would help to support the
economy’s capacity to innovate, if acting in
synergy with investment in the education system to
improve people’s skills. Finally, there is a need for
resources to get people into work and promote
social inclusion. Annex D identifies key priorities
for support by the European Regional
Development Fund, the European Social Fund Plus
and the Cohesion Fund for the 2021-2027 period in
Croatia, building on the analysis of investment
needs and challenges outlined in this report.
Croatia has made some progress in addressing
the 2018 country-specific recommendations.
There has been substantial progress in the
following areas:
Prudent government spending and borrowing
continued to support a fast decrease in the debt
ratio. After a long delay, there has been
progress in adopting measures to strengthen the
institutional framework governing the public
finances.
An important pension reform, aimed at
promoting longer working lives and addressing
EXECUTIVE SUMMARY

Executive summary
5
structural inconsistencies in the system, entered
into force in January 2019.
There has been some progress in the following
areas:
Education and training reforms, long in the
planning, have now been set in motion, while
participation of vulnerable groups in policy
measures to help them find or stay in work
remains low.
Some measures to make public administration
more efficient have been initiated but await
implementation. The reduction of
administrative burden is progressing, while the
reduction of ‘parafiscal charges’ (non-tax
charges) has stalled.
Court backlogs have been reduced, and
measures are being gradually implemented to
improve the quality of the justice system.
There has been limited progress in the following
areas:
The introduction of a recurrent property tax is
no longer planned, leaving in place the system
of municipal fees.
The consolidation of social benefits remains in
preparation, while new legislation setting
wages for civil servants has been postponed
until 2019.
Measures to improve corporate governance in
state-owned enterprises have been
implemented, but less progress has been made
to dispose of minority shares and other assets.
Some unjustified barriers in the regulation of
professional services have been removed, but
many remain in place.
Regarding progress towards the targets under the
Europe 2020 strategy, Croatia has reached its
national targets in renewables (except in transport),
energy efficiency, the employment rate, early
school leaving, and poverty and social exclusion.
Croatia is on track to reaching its target for
lowering greenhouse gas emissions, while it
appears unlikely it will reach the target for
increasing higher education attainment. The
country is still farthest from reaching the target for
investment in research and development.
Croatia faces several challenges with regards to
a number of indicators of the Social Scoreboard
supporting the European Pillar of Social Rights.
The proportion of people of working age who are
in employment remains low. In addition, there are
still challenges with ensuring the quality of
education, both for young people and adults. The
percentage of people at risk of poverty or social
exclusion is declining but still above the EU
average, and the capacity of social benefits to
reduce poverty is limited.
The main findings of the in-depth review
contained in this report and the related policy
challenges are as follows.
In 2018, the public debt ratio is projected to
have declined further.
During the protracted recession, the general
government debt more than doubled, driven by
deficits and costs related to state-owned
enterprises. The debt ratio started falling in
2015, and has declined by more than 12
percentage points since then, to a projected
73.5 % of GDP in 2018. Its decrease has been
driven by economic growth but also by
restraint in spending. Croatia does not appear
to face immediate risks of ʻfiscal stressʼ,
despite remaining vulnerability to foreign
exchange movements, and the lower sovereign
risk has been reflected in the declining cost of
servicing the debt. However, beyond a short
term perspective sustainability risks increase,
under the impact of population ageing.
The level of corporate debt in proportion to
GDP is decreasing and associated risks are
moderating.
Private debt continued to go down despite the
strong recovery in lending. Economic growth
was the main driver of the decrease in the
private debt-to-GDP ratio, but a significant
contribution also came from the appreciation of
the domestic currency. The high share of debt
denominated in foreign currency points to still
significant exchange rate risks. The reduction
of private sector debt slowed in 2018 due to a
pickup in net credit flows. Both household and

Executive summary
6
corporate debt are within prudential levels,
though still above the levels suggested by
economic fundamentals. Corporate sector debt
remains heavily concentrated and burdened
with a high share of non-performing loans.
Furthermore, it is high relative to corporate
financial assets and equity, pointing to potential
solvency risks for companies.
Economic growth and sustained current
account surpluses are facilitating further
reduction of liabilities to foreign creditors
and investors.
Croatia's net liabilities to foreign creditors and
investors declined significantly since their peak
in 2011 but remain above prudential level and
the level suggested by economic fundamentals.
They are expected to move closer to more
sustainable levels by 2020, on account of
expected current account surpluses. In addition,
their composition, in particular the large share
of direct foreign investments, significantly
mitigates the refinancing risk.
There has been a rapid fall in the
unemployment rate, but still too few people
are working or looking for work.
On the back of dynamic economic activity, the
unemployment rate fell further below pre-crisis
levels, but remains above the EU average.
Long-term and youth unemployment also fell,
but remain significant. What is more, the
working age population continues to contract
due to emigration and population ageing.
Despite some improvement, still too few
people in this age group are active in the labour
market, mainly because of early retirement and
care responsibilities. Many perform undeclared
work. Despite still relatively high
unemployment, labour shortages have appeared
in some sectors of the economy, also because
of skills gaps. The involvement of social
partners in the preparation and implementation
of policies remains limited.
A cumbersome business environment and a
strong presence of the state in the economy
hinder competitiveness and investment.
Although more state owned companies have
been made eligible for sale and some measures
to put non-productive assets to use have been
introduced, no clear privatisation strategy is in
place. The suboptimal performance of the
research, development and innovation system
represents an additional barrier to increasing
the competitiveness of Croatian businesses.
Progress, even if modest, is being made in
liberalising regulated professions and reducing
administrative burden. However, ‘parafiscal
charges’ remain a burden, especially for
smaller businesses. Substantial backlogs in
courts reduce legal certainty, while
inefficiencies in criminal justice hamper
effective fight against economic and financial
offences. Corruption is perceived to be
widespread and effective tools to prevent and
sanction it are lacking, particularly at local
level.
Other key structural issues analysed in this report,
which point to particular challenges for Croatia’s
economy, are as follows.
A well-capitalised and profitable financial
sector, despite the remaining large stock of
non-performing loans, is facilitating the
recovery in lending to the private sector.
Profitability of the banking sector in Croatia
improved in 2018, as loan provisioning
declined. Banks’ capital levels remain
significantly above regulatory requirements.
Ample liquidity provided by an expansionary
monetary policy has allowed for a further
lowering of interest rates. Furthermore, strong
competition in the banking sector has eased
lending conditions across the board. This has
spurred growth in new loans to both
households and corporations. The share of
non-performing loans has been reduced
significantly. While this share remains high and
its reduction seems to be slowing, overall risks
to the financial sector appear to be low.
Territorial fragmentation of the public
administration affects its efficiency and
exacerbates regional disparities.
The powers granted to local government units
often do not match their administrative and
financial capacities. This results in an uneven

Executive summary
7
provision of public services, including social
services, across financially strong and
financially weak local units. Also, the capacity
at central government level to design and
implement policy and to use EU funding need
to be strengthened. The wage-setting
framework still lacks consistency across the
public administration and public services.
Poverty and social exclusion are declining
but remain above the EU average, while
ensuring adequate pensions is a challenge.
Having someone in the household engaged in
paid work offers strong protection against the
risk of poverty or social exclusion, whereas the
capacity of social benefits to reduce poverty is
limited. Age, gender and disability are also
factors that influence poverty levels. Ensuring
that the pension system is adequate is a
significant challenge, in part because people’s
working lives are among the shortest in the EU.
This is partly being addressed by the recent
reform of the pension system.
Structural weaknesses, in part addressed by
ongoing reforms, impact people’s skills and
health.
The region where people live and their
socio-economic background influence the
extent to which they have access to early
childhood education and care and attain a given
level of education. Vocational education and
training and higher education are not
sufficiently aligned with the needs of the labour
market. The school curriculum is being
reformed on a pilot basis to improve the overall
quality of education and teaching. Measures to
rationalise hospitals are progressing slowly.
With higher employment, more people are
paying into the health system, but inadequate
financing of hospitals continues to generate
arrears in the system, albeit at a slower pace
than in previous years.
Challenges in network industries impact the
environment and raise costs for consumers.
Far too much waste is put on landfills and too
little is recycled. There is further potential to
increase the share of renewable energy. Losses
in the water supply increase the use of
resources and costs for consumers.
Competition is low in retail electricity and gas
markets, which remain highly regulated.
Inadequate urban transport systems in most
cities and the underdeveloped railway network
hinder worker mobility and have negative
effects on the competitiveness of businesses
and the environment.
The reliability of statistics remains a matter
of concern.
Croatia has taken some steps towards
improving the production of macroeconomic
and government finance statistics, but issues
with their completeness, accuracy and
timeliness persist.

8
GDP growth
Growth moderates as output finally approaches
pre-crisis level. Having peaked at the rate of
3.5 % in 2016, real GDP growth slowed to 2.9 %
in 2017 and is projected to have edged down to
2.8 % in 2018. Domestic demand was bolstered by
strong household consumption as well as dynamic
private investment, as financing conditions
remained favourable and the uncertainties
surrounding the restructuring of Agrokor
(European Commission, 2018e) wound down
substantially (2). By contrast, the 2018 data
available so far suggest the start of a slowing trend
in exports of goods and services. At the same time,
imports of goods and services, while also slowing
somewhat, continue to perform strongly, reducing
further the contribution of net exports to growth
(see Graph 1.1).
Graph 1.1: Real GDP growth by demand component
Year-on-year contributions are obtained as the moving
average of four quarters GDP component compared to the
moving average of the respective components in the same
quarters of previous year.
Source: European Commission.
Growth is expected to remain solid, while
slowing gradually over the forecast period. The
strong momentum in consumer spending is
expected to moderate only mildly, supported by
steadily rising disposable incomes as households
(2) On 26 October the High Commercial Court in Zagreb
confirmed the settlement agreed by Agrokor's creditors in
July 2018, clearing way for the process of the Group's
financial and operational restructuring to start.
continue benefitting from increasing employment,
rising wages and subdued inflation, also thanks to
consumption tax cuts in 2019 and 2020.
Investment activity is expected to continue
intensifying, mainly driven by a pick-up of public
investment as the uptake of EU funding improves
towards the end of the programming period. On
the external side, export growth is set to moderate
further, in line with a slowing pace of market share
gains, while strong domestic demand is projected
to continue to sustain import growth. Overall, the
Commission’s 2019 Winter Forecast (European
Commission, 2019c) sees real GDP growth
slightly down at 2.7 % in 2019, and 2.6 % in 2020.
Investment
Gross fixed capital formation in proportion to
GDP remains well below pre-crisis levels.
Leading up to the crisis, investment was the key
driver of growth, peaking at 28.1 % of GDP in
2008 (see Graph 1.2). In that year, public
investment, driven by large infrastructure projects
(mainly motorways), made up more than 20 % of
total investment. Financed by relatively expensive
borrowing, public investment contributed to the
build-up of sizeable external liabilities. In the 2
years of the sharp adjustment that followed,
investment activity contracted by almost a third,
down to only 21 % of GDP in 2010. It continued
declining even as the economy started recovering
at the end of 2014. A mild recovery in investment,
driven by the private sector, started in 2015 and
intensified the following year. In 2017 gross fixed
capital formation stood at around 20 % of GDP,
and public investment accounted for some 13.5 %
of it, with no clear sign of recovery. Since EU
accession, Croatia has increasingly relied on EU
funding for public investment, containing the
build-up of external liabilities. However, the
take-up of EU funds remains limited (see
Section 4.4).
-15
-10
-5
0
5
10
15
07Q
1
08Q
1
09Q
1
10Q
1
11Q
1
12Q
1
13Q
1
14Q
1
15Q
1
16Q
1
17Q
1
18Q
1
19Q
1
20Q
1
pps
Imports of goods and services InvestmentPublic consumption Private consumptionExports of services Exports of goodsGDP
forecast
1. ECONOMIC SITUATION AND OUTLOOK

1. Economic situation and outlook
9
Graph 1.2: Private and public investment
Source: Eurostat, own calculations.
External position
A weakening trade balance is set to decrease the
current account surplus. In the absence of
temporary effects on the primary income balance
in 2018, such as loss of profits in the largely
foreign-owned banking sector seen in previous
years, the reduction of the current account surplus
has been and is projected to continue being largely
driven by the deteriorating trade balance. The
current account balance is nevertheless forecast to
remain positive, decreasing from a projected
surplus of 2.5 % of GDP in 2018 to just below 2 %
in 2020. In cyclically adjusted terms, the current
account surplus is much higher, at 4 % of GDP in
2018.
External imbalances narrow further, supported
by the positive, albeit declining, current account
balance. Deleveraging of both the public and
private sector continued in 2018. By June 2018,
gross external debt declined by 1.8 pps to 80 % of
GDP, while the net international investment
position (NIIP) rose by 1.6 pps to -60.3 % of GDP
(see Graph 1.3). The net external debt ratio is
projected to remain on a declining path, thanks to
solid GDP growth and current account surpluses.
Graph 1.3: Current account composition, gross external
debt and net international investment position
Gross external debt is expressed in absolute terms.
Source: Eurostat, Croatian National Bank.
Inflation and interest rates
Rising energy prices pushed inflation up in
2018. Despite continued strong growth in
employment and rising wages, core inflation has
remained subdued. However, with unemployment
shrinking steadily and demand for labour
intensifying in some sectors, wage pressures are
expected to grow stronger in 2019 and 2020. At
the same time, the Value Added Tax (VAT) rate
reduction on several products (mostly unprocessed
food) in 2019 and the 1 pp. reduction of the
standard VAT rate in 2020 are expected to exert
downward pressure on prices. Energy prices are
also expected to stabilise in mid-2019. As a result,
after averaging 1.6 % in 2018, inflation is expected
to moderate slightly after that. Core inflation is
expected to pick up towards the end of the forecast
period.
Interest rates continue declining amid abundant
liquidity in the financial system and the
improving country risk profile. Interest rates on
all new loans to households and non-financial
corporations are decreasing, most notably on loans
indexed in euros. The trend is expected to continue
as Croatia's risk premium continues declining amid
a positive economic and budgetary outlook. It has
significantly improved in recent years, as reflected
in the declining spread between the yield on
Croatia’s sovereign debt and the German bund,
which, while still higher than for most EU
0
5
10
15
20
25
30
0
20
40
60
80
100
08 09 10 11 12 13 14 15 16 17
Share of private investment (% of tot. inv.)Share of public investment (% of tot. inv.)Total investment (% of GDP) (rhs)
% of tot. inv. % of GDP
-120
-100
-80
-60
-40
-20
0
-15
-10
-5
0
5
10
08Q
1
09Q
1
10Q
1
11Q
1
12Q
1
13Q
1
14Q
1
15Q
1
16Q
1
17Q
1
% of GDP% of GDP
Balance of primary and secondary incomes (other) (lhs)Net investment income (lhs)Balance of trade (goods and services) (lhs)Current account balance (lhs)NIIP (rhs)Gross external debt (rhs)

1. Economic situation and outlook
10
countries, stayed below 200 basis points
throughout 2018, as compared to 390 in mid-2016.
Private indebtedness
Private sector debt further decreased despite
the recovery of bank lending, especially to
households. Consolidated corporate and
household debt continued decreasing throughout
the first three quarters of 2018. In September 2018
corporate debt stood at 63.2 % and household debt
at 34.1 % of GDP — some 20 and 8 pps below the
peaks registered in 2010. The private sector debt
ratio decreased on account of GDP growth and, to
a lesser extent, valuation effects, as continued kuna
appreciation reduced the value of outstanding
liabilities indexed to or denominated in foreign
currency. New lending to the non-bank private
sector (adjusted for sales and securitisation) from
domestic credit institutions remained positive in
2018 but declined by 3.2 % compared to 2017
despite a sharp pick-up in new loans to
households. However, households continued
decreasing their exposure to foreign currency and
variable interest rate risk significantly. The private
debt ratio is expected to keep decreasing.
Public finances
The general government balance improved
further thanks to dynamic revenue growth and
expenditure containment. It recorded a surplus of
0.9 % of GDP in 2017, a notable increase from a
deficit of 0.9 % the year before. Revenues grew
largely on account of dynamic household
consumption and an improving labour market.
Expenditure growth was flat in nominal terms,
largely through cuts in investment and declining
interest expenditure, benefiting from the low
interest rate environment. The headline balance in
2018 is expected to decline under the impact of the
materialisation of contingent liabilities, but remain
in surplus. It would slightly increase in 2019,
despite the impact of the planned cuts in taxes and
social contributions, before decreasing again in
2020 on account of investment and the reduction in
the general VAT rate. In turn, continued mild
surpluses and economic growth are expected to
support the further reduction of general
government debt. The ratio is expected to have
declined to below 73.5 % in 2018, and should fall
to 68.2 % by 2020.
Labour market
Croatia’s labour market continues to improve
on the back of the economic recovery. Since
2015, robust and broad-based economic growth
has been accompanied by sustained employment
growth. As a result of job creation, as well as
emigration and ageing, the unemployment rate has
been declining rapidly over the same period. From
11.0 % in 2017, it fell to 8.5 % in the first three
quarters of 2018, and is expected to continue
decreasing to 7.6 % in 2019. Nevertheless, the
activity rate (20-64) remains very low (71.2 % in
2017 vs 78.0 % for the EU) (see Graph 1.4). The
share of temporary employees in total employment
remains well above the EU average (17.5 % vs EU
11.3 %), despite the increase in the share of
permanent contracts in new hiring.
Graph 1.4: Labour market developments
Source: Eurostat.
After years of moderation, wage growth is
resuming. The different data sources offer a mixed
picture on wage dynamics (3). According to
national accounts, nominal compensation per
employee continued to decrease by 1.1 %, in 2017.
By contrast, administrative figures show the
growth of average nominal gross wages resuming.
The Commission’s 2018 Autumn Forecast projects
compensation per employee to have risen by 2 %
in 2018, and to grow by a further 1.7 % in 2019,
(3) The difference between administrative data (on nominal
gross wages) and national accounts (nominal compensation
per employee) is due to inconsistency between (survey
based) employment data and administrative records.
(4) For the assessment of other reforms implemented in the past, see in particular Section 4.
0
10
20
30
40
50
60
70
80
08 09 10 11 12 13 14 15 16 17
Activity rate 20-64
Unemployment rate 15-74
Long-term unemployment rate 15-74
Youth unemployment rate 15-24
NEET rate 15-24
%

1. Economic situation and outlook
11
driven by the negotiated increases in the public
sector wages and the decline in unemployment.
Nominal wage growth is projected to remain
below the level consistent with the labour market
conditions and slightly above that for cost
competitiveness (see Graph 1.5). In real terms
(GDP deflated), compensation per employee is
projected to have declined by a further 0.3 % in
2018, and is expected to stabilise in 2019.
Graph 1.5: Nominal wage growth: actual and predicted
based on economic fundamentals
Source: Eurostat, own calculations.
Social developments
The share of people at risk of poverty or social
exclusion remains high. Although it has been
declining since 2013, it remained high at 26.4 % of
the resident population in 2017 (EU 22.5 %). The
elderly, low-skilled and people with disabilities are
particularly affected. Poverty in Croatia is closely
related to the absence of work income in the
household, as in-work poverty is well below the
EU average (see Section 4.3). Inequality, as
measured by the S80/S20 income quintile share
ratio, was just below the EU average in 2017 for
those under 65, but higher for older persons.
Potential growth
Croatia's real GDP growth is moving closer to
its gradually increasing potential. Following five
years of negative rates, potential growth turned
positive in 2014, and has been gradually increasing
since. It is estimated to reach 2.4 % by 2020.
Labour utilisation remains chronically low despite
some positive developments on the labour market.
Moreover, the working age population (15 – 64
years) shrank by 4.8 pps between 2010 and 2017
due to ageing and emigration. It is estimated that in
2018 the negative contribution of labour to
potential growth will have turned marginally
positive thanks to the projected higher
participation rates. Total factor productivity (TFP)
remains at relatively low levels, reflecting a
below-par performance on measures of goods and
service market efficiency and public sector
governance. Overall, Croatia's potential growth,
while gradually increasing, remains modest for a
catching-up economy, and lowest among peer
Member States (see Graph 1.6).
Graph 1.6: Potential output and components, 2017
Potential output: production function approach.
Source: European Commission, own calculation.
Statistical issues
Concerns remain regarding the completeness,
accuracy and timeliness of macroeconomic and
government finance statistics. Reliable statistics
are a precondition to economic and budgetary
surveillance and informed economic policy
making. While close cooperation between the
Croatian Bureau of Statistics and Eurostat has led
to some progress in producing national accounts
and ensuring consistency between government
finance statistics and national accounts, sector
accounts have yet to be published.
-6
-4
-2
0
2
4
6
8
10
12
00 02 04 06 08 10 12 14 16 18
Prediction based on inflation, productivity andunemployment
Actual nominal compensation growth
Nominal compensation growth consistent with constantUCL-based REER
% annual change
-1
0
1
2
3
4
5
RO PL BG CZ HU SK SI HR
TFP Contribution
Capital Accumulation Contribution
Total Labour (Hours) Contribution
PF Potential Growth
% annual change
1. Economic situation and outlook
12
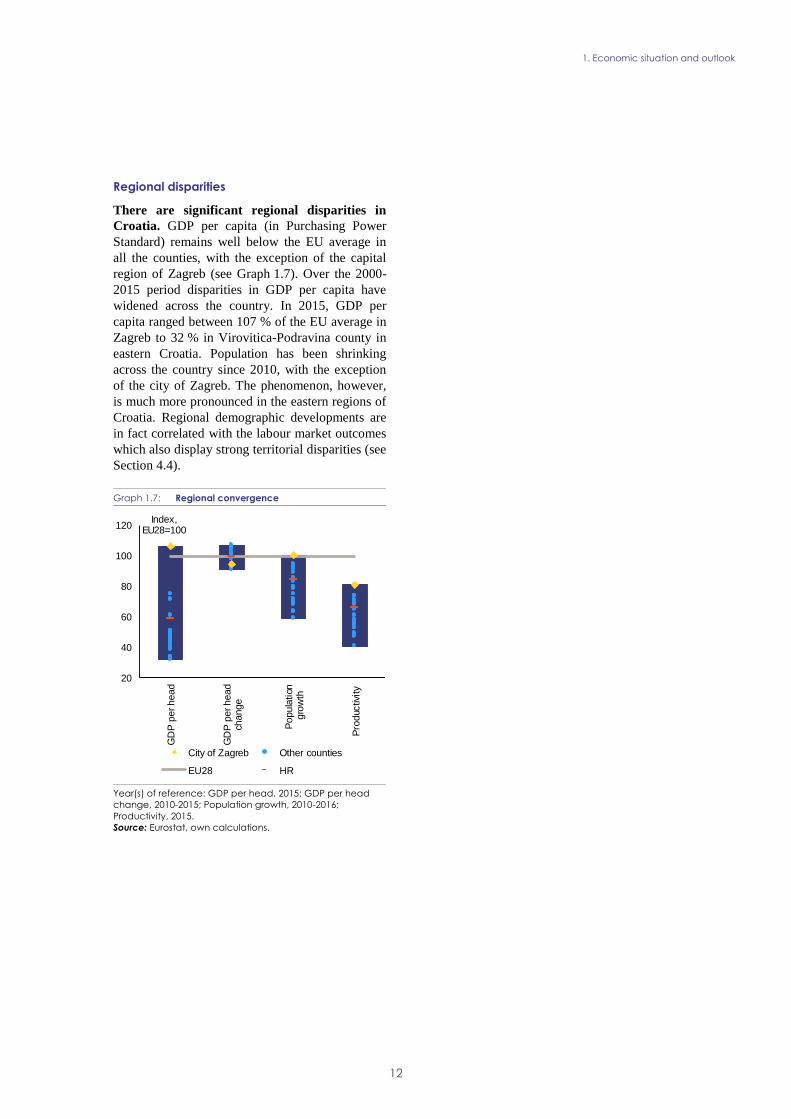
Regional disparities
There are significant regional disparities in
Croatia. GDP per capita (in Purchasing Power
Standard) remains well below the EU average in
all the counties, with the exception of the capital
region of Zagreb (see Graph 1.7). Over the 2000-
2015 period disparities in GDP per capita have
widened across the country. In 2015, GDP per
capita ranged between 107 % of the EU average in
Zagreb to 32 % in Virovitica-Podravina county in
eastern Croatia. Population has been shrinking
across the country since 2010, with the exception
of the city of Zagreb. The phenomenon, however,
is much more pronounced in the eastern regions of
Croatia. Regional demographic developments are
in fact correlated with the labour market outcomes
which also display strong territorial disparities (see
Section 4.4).
Graph 1.7: Regional convergence
Year(s) of reference: GDP per head, 2015; GDP per head
change, 2010-2015; Population growth, 2010-2016;
Productivity, 2015.
Source: Eurostat, own calculations.
20
40
60
80
100
120
GD
P p
er head
GD
P p
er head
change
Popula
tion
gro
wth
Pro
duc
tivity
Index, EU28=100
City of Zagreb Other counties
EU28 HR

1. Economic situation and outlook
13
Table 1.1: Key economic and financial indicators - Croatia
(1) NIIP excluding direct investment and portfolio equity shares.
(2) Domestic banking groups and stand-alone banks, EU and non-EU foreign-controlled subsidiaries and EU and non-EU
foreign-controlled branches.
(3) The tax-to-GDP indicator includes imputed social contributions and hence differs from the tax-to-GDP indicator used in the
section on taxation
Source: Eurostat and ECB as of 31-1-2019, where available; European Commission for forecast figures (Winter forecast 2019 for
real GDP and HICP, Autumn forecast 2018 otherwise).
2004-07 2008-12 2013-15 2016 2017 2018 2019 2020
Real GDP (y-o-y) 4.5 -1.9 0.6 3.5 2.9 2.8 2.7 2.6
Potential growth (y-o-y) 3.0 0.0 0.2 1.6 1.7 1.8 2.1 2.4
Private consumption (y-o-y) 4.4 -2.1 -0.8 3.5 3.6 . . .
Public consumption (y-o-y) 4.5 -0.1 0.4 0.7 2.7 . . .
Gross fixed capital formation (y-o-y) 6.6 -5.7 0.8 6.5 3.8 . . .
Exports of goods and services (y-o-y) 4.9 -1.3 6.2 5.6 6.4 . . .
Imports of goods and services (y-o-y) 6.2 -4.3 5.1 6.2 8.1 . . .
Contribution to GDP growth:
Domestic demand (y-o-y) 5.2 -2.6 -0.2 3.4 3.3 . . .
Inventories (y-o-y) 0.3 -0.7 0.3 0.3 0.2 . . .
Net exports (y-o-y) -0.9 1.3 0.5 -0.1 -0.6 . . .
Contribution to potential GDP growth:
Total Labour (hours) (y-o-y) 0.5 -0.6 -0.9 -0.1 0.0 0.1 0.3 0.5
Capital accumulation (y-o-y) 2.0 1.2 0.6 0.7 0.7 0.8 0.9 1.0
Total factor productivity (y-o-y) 0.5 -0.6 0.5 1.0 1.0 0.9 0.9 0.8
Output gap 3.1 -0.8 -3.5 -0.7 0.6 1.6 2.3 2.5
Unemployment rate 12.1 11.8 16.9 13.4 11.0 9.0 7.5 6.5
GDP deflator (y-o-y) 3.8 2.5 0.3 -0.1 1.1 2.3 1.7 1.6
Harmonised index of consumer prices (HICP, y-o-y) 2.8 2.9 0.8 -0.6 1.3 1.6 1.4 1.4
Nominal compensation per employee (y-o-y) 4.8 2.1 -2.0 1.3 -1.1 2.0 1.7 1.5
Labour productivity (real, person employed, y-o-y) 2.5 0.1 0.2 3.2 0.7 . . .
Unit labour costs (ULC, whole economy, y-o-y) 2.3 2.0 -2.2 -1.8 -1.8 1.5 0.9 0.2
Real unit labour costs (y-o-y) -1.5 -0.4 -2.4 -1.8 -2.8 -0.8 -0.8 -1.3
Real effective exchange rate (ULC, y-o-y) 1.9 -1.0 -3.2 -1.8 -1.1 1.2 -1.5 -1.9
Real effective exchange rate (HICP, y-o-y) 0.8 -0.7 0.1 1.2 0.4 2.6 -1.3 -1.0
Savings rate of households (net saving as percentage of net disposable
income) . 6.0 . . . . . .
Private credit flow, consolidated (% of GDP) 14.8 3.6 -0.6 -0.1 1.2 . . .
Private sector debt, consolidated (% of GDP) 86.5 119.5 116.2 105.3 98.4 . . .
of which household debt, consolidated (% of GDP) 32.6 40.7 39.6 35.1 34.1 . . .
of which non-financial corporate debt, consolidated (% of GDP) 53.9 78.9 76.7 70.1 64.3 . . .
Gross non-performing debt (% of total debt instruments and total loans
and advances) (2) . . 12.4 10.1 8.4 . . .
Corporations, net lending (+) or net borrowing (-) (% of GDP) . -1.0 . . . . . .
Corporations, gross operating surplus (% of GDP) . 19.3 . . . . . .
Households, net lending (+) or net borrowing (-) (% of GDP) . 3.5 . . . . . .
Deflated house price index (y-o-y) 9.8 -5.1 -3.1 2.1 2.8 . . .
Residential investment (% of GDP) 0.0* 0.0* 0.0* .0* .0* . . .
Current account balance (% of GDP), balance of payments -5.9 -3.3 2.4 2.5 3.9 2.5 2.0 1.8
Trade balance (% of GDP), balance of payments -6.6 -2.4 1.5 2.8 2.1 . . .
Terms of trade of goods and services (y-o-y) 1.3 0.5 0.3 1.4 0.2 1.1 0.3 0.5
Capital account balance (% of GDP) 0.0 0.1 0.4 1.4 0.6 . . .
Net international investment position (% of GDP) -66.5 -87.3 -83.3 -69.9 -62.4 . . .
NIIP excluding non-defaultable instruments (% of GDP) (1) -29.3 -47.5 -42.8 -25.5 -17.3 . . .
IIP liabilities excluding non-defaultable instruments (% of GDP) (1) 68.7 88.8 92.2 77.5 69.2 . . .
Export performance vs. advanced countries (% change over 5 years) 37.3 -4.3 -12.6 5.0 14.6 . . .
Export market share, goods and services (y-o-y) . . 2.7 7.9 2.5 . . .
Net FDI flows (% of GDP) -4.7 -3.1 -1.4 -4.1 -2.4 . . .
General government balance (% of GDP) -3.7 -5.6 -4.6 -0.9 0.9 0.2 0.4 0.1
Structural budget balance (% of GDP) . . -3.1 -0.8 0.7 -0.5 -0.7 -1.1
General government gross debt (% of GDP) 39.3 55.6 82.7 80.2 77.5 73.5 70.1 68.2
Tax-to-GDP ratio (%) (3) 36.7 36.0 36.8 37.8 37.8 37.9 37.4 36.9
Tax rate for a single person earning the average wage (%) . . 29.9 . . . . .
Tax rate for a single person earning 50% of the average wage (%) . . 22.7 . . . . .
forecast

14
Since the start of the European Semester in
2014, 51 % of all country-specific
recommendations addressed to Croatia have
recorded at least ‘some progress’ (4). The
remaining 49 % of these CSRs recorded ‘limited’
or ‘no progress’ (see Graph 2.1). Reform action in
key structural policy areas stalled over the past
years, also in the context of a protracted period of
political instability. Most progress has been seen in
the areas of fiscal policy, labour market and,
recently, the pension system.
Graph 2.1: Overall multiannual implementation of 2014-
2018 CSRs to date
(1) The overall assessment of the country-specific
recommendations related to fiscal policy excludes
compliance with the Stability and Growth Pact.
(2) The multiannual CSR assessment looks at the
implementation until 2019 Country Report since the CSRs
were first adopted.
Source: European Commission.
Having fully corrected its excessive general
government deficit, Croatia continued with a
prudent fiscal policy. It exited the Excessive
Deficit Procedure in June 2017 after having
durably corrected its excessive deficit in 2016,
with respect to both the general government deficit
and the debt rule. Prudent fiscal policy needed to
decrease the public debt ratio continued in 2017.
Croatia has taken measures to enhance
flexibility of the labour market, while
weaknesses in the promotion of employability
and social protection remain. Two successive
reforms, implemented in 2013 and 2014, facilitated
the use of fixed-term contracts and flexible types
(4) For the assessment of other reforms implemented in the
past, see in particular Section 4.
of work (distance work, part-time work, seasonal
work and agency work), and simplified the
procedures for terminating employment contracts.
The coverage and effectiveness of active labour
market policies however remains low. In 2015, the
assessment of disability claims was harmonised
and moved to a new Single Expert Evaluation
Body. There has been limited progress in
consolidating social benefits and improving their
poverty reduction capacity.
Some steps have been taken to improve the
judiciary, business environment and resilience
of the financial sector. Insolvency procedures
have been thoroughly revised, and the reformed
judicial map is improving the efficiency of the
system. Backlogs in the courts are decreasing,
especially those of oldest cases, but remain sizable.
The reduction of parafiscal charges has been slow
while the administrative burden on businesses
from other impediments was reduced more
significantly. In 2014, the comprehensive portfolio
screening of the banking sector confirmed its
robustness, and some identified weaknesses have
been addressed. The Croatian Bank for
Reconstruction and Development has undergone
an asset quality review indicating several areas in
need of improvement, some of which are being
addressed.
Reforms of healthcare, state-owned enterprises
and the implementation of EU funded projects
have progressed slowly. The long-planned
functional integration of hospitals, aimed at
rationalising operations and improving access to
healthcare, has started, while their inadequate
financing has yet to be addressed. Some measures
to improve corporate governance in state-owned
enterprises have been implemented, but activation
and sale of assets have advanced only slowly,
without a clear privatisation strategy in place.
Constrained administrative capacity and
insufficient strategic planning hinder a more
efficient implementation of projects co-funded
from EU funds, although there have been
improvements over the past years, especially in
terms of increased staffing.
No Progress19%
Limited Progress
30%
Some Progress32%
Substantial Progress
12%
Full Implementation
7%
2. PROGRESS WITH COUNTRY-SPECIFIC RECOMMENDATIONS

2. Progress with country-specific recommendations
15
Croatia has made some (5) progress in
addressing the 2018 country-specific
recommendations (see Table 2.1). After a
protracted period of reform standstill, policy action
has picked up in 2018. Most notably the
Parliament adopted a package of important pension
(5) Information on the level of progress and actions taken to
address the policy advice in each respective subpart of a
CSR is presented in the Overview Table in the Annex.
system reforms, which came into force in 2019.
Similarly, the fiscal framework was strengthened
at the end of 2018. Other policy measures in the
area of public sector governance and the business
environment have been initiated and are at
different stages of progress, awaiting full
parliamentary adoption or effective
implementation.
Table 2.1: 2018 country-specific recommendations (CSRs) assessment
Source: European Commission.
Commitments Summary assessment
CSR 1: Strengthen the fiscal framework, including
by strengthening the mandate and independence of
the Fiscal Policy Commission. Introduce a recurrent
property tax. (MIP relevant)
Croatia has made Some Progress in addressing
CSR 1:
Substantial progress in strengthening the fiscal
framework
No progress introducing a recurrent property tax
CSR 2: Discourage early retirement, accelerate the
transition to a higher statutory retirement age and
align pension provisions for specific categories with
the rules of the general scheme. Deliver on the
reform of the education and training system to
improve its quality and labour market relevance for
both young people and adults. Consolidate social
benefits and improve their poverty reduction
capacity. (MIP relevant)
Croatia has made Some Progress in addressing
CSR 2:
Substantial in pensions system reform measures
Some progress in delivering on the reform of
the education and training system
Limited progress in consolidating social
benefits
CSR 3: Reduce the territorial fragmentation of the
public administration, streamline the functional
distribution of competencies and enhance the
capacity to design and implement public policies. In
consultation with social partners, introduce
harmonised wage-setting frameworks across the
public administration and public services. (MIP
relevant)
Croatia has made Limited Progress in addressing
CSR 3:
Some progress in the public administration
reform
Limited progress harmonising wage-setting
frameworks in the public sector
CSR 4: Improve corporate governance in state-
owned enterprises and intensify the sale of state-
owned enterprises and non-productive assets.
Significantly reduce the burden on businesses
arising from parafiscal charges and from
cumbersome administrative and legislative
requirements. Enhance competition in business
services and regulated professions. Reduce the
duration of court proceedings and improve
electronic communication in courts. (MIP relevant)
Croatia has made Some Progress in addressing
CSR 4:
Limited progress in improving corporate
governance and divestment in state-owned
enterprises
Some progress in reducing the burden on
businesses
Limited progress in enhancing competition in
business services and regulated professions
Some progress in the judicial system reform

2. Progress with country-specific recommendations
16
Box 2.1: EU funds and programmes contribute to addressing structural challenges and
fostering growth and competitiveness in Croatia
Croatia is one of the largest beneficiaries of EU solidarity. The financial allocation from the EU funds,
aiming to support Croatia in facing development challenges, amounts to up to EUR 10.7 billion for 2014-
2020, potentially equivalent to above 3 % of GDP annually. The additional national co-financing will be
approximately EUR 2 billion, so the country budget amounts to almost EUR 12.6 billion. As of the end of
2018, some EUR 6.8 billion (around 64 % of the total EU funds) was already allocated to specific projects.
In addition to ESIF, EUR 424 million was allocated to specific projects on strategic transport networks
through a dedicated EU funding instrument, the Connecting Europe Facility. Furthermore, numerous
Croatian research institutions, innovative firms and individual researchers benefited from other EU funding
instruments, notably Horizon 2020 which provided EUR 62 million.
EU funding is helping to address policy challenges identified in the 2018 CSRs. Primarily by investing
in the establishment of VET centres of competence and providing support to the implementation of the
integral curricular reform, ESI funds (including the European Social Fund) will further improve a link
between vocational education and labour market needs. Through the pilot project e-Schools, elementary
schools in Croatia have been equipped with LAN and two digital classrooms, with the intention of covering
all elementary schools with the second phase of the project and establishing a system of digitally mature
schools. In addition, ESIF also contributed to improving innovative performance of Croatia by supporting
projects selected under the smart specialisation strategy. In environmental services, around half million
people received access to newly built waste-management centres and around half million people already
gained access to modern water treatment and supply services, all amounting to a cleaner and healthier
environment for citizens. In transport, new sections of the road and rail network on the TEN-T are being
developed alongside the improved island connectivity.
In addition, the Commission can provide tailor-made technical support upon Member State's request
via the Structural Reform Support Programme to help implement growth-sustaining reforms to
address challenges identified in the European Semester process or other national reforms. Croatia for
example is receiving support to implement a curriculum reform. The Commission is also assisting the
authorities in their efforts to remove unnecessary restrictions to regulated professions, to harmonise
terminology and improve transparency of social benefits, and to monitor the implementation of restructuring
plans for state-owned enterprises. In addition, in 2018, work has started on enhancing the administrative
capacity of the tax authorities to detect fraud and conduct audits, on improving human resources
management in the public administration and contributing to the efficient implementation of the public
administration reform, and on developing a strategy for Croatia's Bank for Reconstruction and Development
(HBOR).
EU funding contributes to mobilisation of private investment through both grants and financial
instruments. Around EUR 522 million (8.3 % of the total) is earmarked to be delivered in the form of loans,
microloans, portfolio guarantees and equity. The investments carried out via Financial instruments will be
focused on SMEs and energy efficiency. Furthermore, the overall volume of approved operations by the EIB
with the European Fund for Strategic Investment backing amounts to EUR 203 million, which is set to
trigger a total of EUR 903 million in additional private and public investments. Croatia ranks 12th as to the
overall volume of approved operations as a share of GDP. Under the Infrastructure and Innovation window,
8 projects financed by the EIB with EFSI backing were approved, for a value of about EUR 109 million in
total financing set to trigger EUR 571 million in total investment. Under the SMEs component, 8 agreements
were approved with intermediary banks financed by the EIF with EFSI backing, for a total of EUR 94
million set to trigger approximately EUR 332 million in investments. Some 1 178 SMEs and mid-cap
companies are expected to benefit from improved access to finance. An example of EFSI-backed project in
Croatia is "EL TO Zagreb", for which the EIB is lending Hrvatska Elektroprivreda DD EUR 150 million to
build a new combined cycle gas turbine, heat and electricity cogeneration plant to replace less
environmentally-friendly plants in Zagreb.
EU actions strengthen national, regional and local authorities and the civil society. EUR 522.6 million
(from ESIF) has been allocated for strengthening capacity of public administrations at different levels by

2. Progress with country-specific recommendations
17
prompting close cooperation with stakeholders. The Catching up Regions Initiative delivers targeted
technical assistance and financing for developing five counties in the Eastern Croatia – Slavonija, Baranja
and Srijem Project. The importance of this project is twofold, on the one hand, it enables a more focused use
of EU funds in the Slavonian counties, and on the other hand, it helps strengthening administrative capacity
on local and regional level in order to prepare and implement projects needed for socio-economic
development in the current programming period.
More information at: https://cohesiondata.ec.europa.eu/countries/HR
18
The 2019 Alert Mechanism Report concluded
that a new in-depth review should be
undertaken for Croatia to assess the persistence
or unwinding of the imbalances (European
Commission, 2018b). In spring 2018, Croatia was
identified as having excessive macroeconomic
imbalances (European Commission, 2018a). The
imbalances identified related to high levels of
public, private and external debt, all largely
denominated in foreign currency, in a context of
low potential growth. This chapter summarises the
findings of the analyses in the context of the
Macroeconomic Imbalances Procedure in-depth
review that is contained in various sections in this
report (6).
Imbalances and their gravity
Government debt continues decreasing. During
the protracted recession, large budget deficits and
costs induced by state-owned enterprises
contributed to a significant accumulation of
government debt, which peaked in 2014 at 84 % of
GDP. Following that, robust growth and a prudent
fiscal stance gradually reduced government debt to
77.5 % of GDP in 2017. The steady kuna
appreciation since 2014 also facilitated debt
reduction by depressing the value of the significant
portion of debt denominated in foreign currency.
The decrease of public debt resulted in improved
debt sustainability (see Section 4.1) and was
picked up by credit agencies, which rate Croatia’s
long-term prospects with BB+, a rating just below
investment grade, with positive outlook.
Nevertheless, public debt remains high and
exposed to interest and exchange rate risks.
Private sector debt keeps decreasing despite the
recovery in lending. In the second quarter of
2018, consolidated corporate and household debt
amounted to 63.2 % and 34.1 % of GDP,
respectively – some 20 and 8 percentage points
below the peak registered in 2010. By mid-2018,
(6) Analyses relevant for the in-depth review can be found in
the following sections: Government debt (Section 4.1; Private sector debt and the financial sector (Section 4.2);
Labour market (Section 4.3); and Business environment,
investment and public sector governance (Section 4.4). An asterisk indicates that the analysis in that section
contributes to the in-depth review under the Macroeconomic Imbalances Procedure.
both household and non-financial corporations
debt were below their respective prudential
thresholds, but still above the levels suggested by
fundamentals, indicating scope for further
deleveraging. Furthermore, non-financial
corporations’ debt is high relative to their gross
financial assets or equity, signalling solvency risks
for the corporate sector. Exposure to the exchange
and interest rate risk are moderating. The share of
private sector debt exposed to foreign exchange
rate risk decreased from 78 % in 2012 to 64.5 % in
Q2 2018, as both corporates and households took
advantage of high liquidity in the domestic
financial sector to partially refinance their
liabilities denominated in foreign currencies in
national currency. Similarly, lower interest rates
and non-interest charges due to strong competition
in the domestic banking sector allowed corporates
and households to refinance their variable interest
rate loans with cheaper loans of longer interest rate
fixation periods.
The ongoing deleveraging of both the public
and private sector is reflected in Croatia's
continued current account surplus. The current
account surplus increased significantly in 2017 to
3.9 % of GDP. This resulted largely from a one-off
increase in the primary income balance as banking
sector profitability was affected by higher
provisioning associated with the Agrokor crisis.
With strong domestic demand supporting import
growth, the trade surplus declined slightly in the
first half of 2018. In turn, the current account
surplus also decreased to 3.3 % of GDP (7). The
net international investment position improved
to -61.9 % of GDP in 2017 and declined further
to -58.3 % by the second quarter of 2018, almost
40 percentage points above its record low in the
third quarter of 2011. By mid-2018, gross external
debt decreased to 80 % of GDP, over
32 percentage points below its peak in 2015. While
declining rapidly, in 2017 Croatia's net external
liabilities were still significantly in excess of their
prudential and fundamentals based benchmarks (8).
(7) 4-quarter moving average
(8) The country-specific prudential threshold denotes the NIIP level beyond which an external crisis becomes likely. The
NIIP level explained by fundamentals represents the NIIP
that would result if a country had run its current account in line with fundamentals since 1995. For Croatia, the
prudential and fundamental-based benchmarks are
3. OVERALL FINDINGS REGARDING IMBALANCES, RISKS AND
ADJUSTMENT ISSUES

3. Overall findings regarding imbalances, risks and adjustment issues
19
However, the net external position excluding
non-defaultable instruments was only -15 % of
GDP, similar to some of the peer countries and
above its respective benchmarks.
Croatia's potential growth is increasing, but
remains relatively low for a catching-up
economy. After plummeting during the crisis
years, potential output growth increased to an
estimated 1.8 % in 2018, just above the EU
average but well below that for other catching-up
economies. Labour is no longer detracting from
potential growth, mainly thanks to the decline in
the structural unemployment rate, but adverse
demographic trends and low activity rates continue
to restrain it. The contribution of total factor
productivity remains relatively low compared to
that recorded by the economies of Central and
Eastern Europe. This is largely explained by low
allocative efficiency, which is also related to the
strong presence of state-owned enterprises in the
economy (see Section 4.4.1). Furthermore, Croatia
does not perform well on indicators of efficiency
of goods and service markets, and public sector
governance (see Section 4.4).
Evolution, prospects, and policy responses
Fiscal surpluses are expected to support the
further reduction in public debt. Public debt is
projected to dip to 68.2 % of GDP by 2020. The
government balance is expected to remain in
surplus in both 2019 and 2020 despite the expected
shift towards a pro-cyclical fiscal stance and the
materialisation of some contingent liabilities. A
continued low interest rate environment should
continue supporting the refinancing of maturing
debt at lower interest rates and with longer
maturities. The adoption of the new Fiscal
Responsibility Act is expected to improve
Croatia's fiscal framework by giving more
autonomy to the Fiscal Policy Commission,
prescribing numerical fiscal rules and
strengthening the short and mid-term budgetary
framework at central and local level.
Private sector debt is expected to continue
decreasing despite the expected stronger credit
growth. Debt reduction in the private sector in
estimated to have been around -38 % and -23 % of GDP in 2017, respectively.
2017 and throughout 2018 was driven by nominal
GDP growth and the moderate appreciation of the
kuna. Write-offs also contributed to debt reduction.
At the same time, credit flows turned positive in
2016 for households and further strengthened in
2017 and 2018. New lending was driven by
kuna-denominated non-housing loans. Credit flows
to non-financial corporates have resumed as well,
whereby some firms have been partially
refinancing their external debt through domestic
borrowing. Non-financial sector credit growth will
likely remain moderate given the still high
debt-to-gross financial assets and the
debt-to-equity ratios of Croatian corporates.
Furthermore, many corporates remain burdened
with high non-performing loans (20.5 % of total
loans to non-financial corporations), especially in
the construction sector (47.6 %). The agreement
between Agrokor's creditors, confirmed by the
High Commercial Court in Zagreb in October
2018, should lead to an orderly restructuring of the
conglomerate. Large risks to the financial and
private sector from Agrokor thus appear to be
contained. The operational and financial stability
of the company and its suppliers now depend on
the successful implementation of the agreement.
Croatia's current account surplus is expected to
continue supporting the reduction in external
imbalances. According to the Commission 2018
Autumn Forecast, the current account surplus is
projected to gradually decline to 1.8 % of GDP by
2020. The trade surplus is expected to narrow, with
strong domestic demand fuelling imports and
export market share gains declining. Nevertheless,
the expected current account balances will remain
significantly above the level suggested by
fundamentals –estimated at around -0.6 % of GDP
in 2017. This should enable the continued rapid
reduction of external imbalances. Even with
gradually slowing growth, the net international
investment position is expected to rise
above -50 % of GDP by 2020, and move closer to
more sustainable levels e.g. the levels suggested by
the prudential and fundamentals-based benchmarks
(-39 % of GDP and -22 % of GDP, respectively, in
2018).
Potential growth remains relatively low to
support fast convergence. Since peaking in
mid-2013, the unemployment rate is estimated to
have fallen to its pre-crisis levels, 9.1 % in 2018. It
is expected to decline further to 6.6 % by 2020,

3. Overall findings regarding imbalances, risks and adjustment issues
20
also due to persistent employment growth.
However, ageing and emigration will continue to
detract from the labour contribution to potential
growth. The ageing impact should be partially
offset by the adopted pension reform, which will
extend working lives. The contribution of total
factor productivity to potential growth remains low
compared to peers (9). However, the proposed
streamlining of government agencies, the reduction
in the backlog of court cases and improvements in
the management of state-owned assets could
contribute to higher productivity gains. Overall,
the positive output gap is projected to further
expand by 2020, supported by pro-cyclical tax cuts
and an expected recovery of public investment
towards the end of the multiannual programming
period for EU funds.
Overall assessment
The private and public sectors are continuing to
reduce their debt and its exposure to currency
and interest rate risks. High debt levels still
burden the economy, although the situation has
been improving substantially with private debt
falling below prudential levels and public debt
following a sustained declining path. However, the
corporate sector remains over-leveraged and
burdened by non-performing loans. External
imbalances narrowed due to high current account
surplus. Overall foreign currency denominated
liabilities are decreasing, implying lower exposure
to exchange rate risk. The unemployment rate has
reduced sharply, also but not exclusively due to
employment growth. However, labour market
participation lags significantly behind the EU
average.
Low potential growth hampers a durable
adjustment of imbalances. Economic growth is
projected to be robust over the forecast horizon.
Nevertheless, low potential growth limits Croatia’s
shock absorption capacity. To increase its growth
potential, Croatia needs to increase labour
utilisation and address its weak productivity
growth.
Recent policy actions should help to address
Croatia's structural weaknesses but their
implementation remains crucial. The adopted
pension reform could contribute to higher labour
(9) Slovenia, Hungary, the Czech Republic, Slovakia, Poland
utilisation while several policy initiatives, in
different stages or preparation, aim at improving
public sector governance and the business
environment. The ambitious reform agenda
presented by the authorities could help increase
potential growth, although thorough
implementation of the planned reforms remains
crucial to achieving growth rates and accelerating
the process of real economic convergence.

3. Overall findings regarding imbalances, risks and adjustment issues
21
Table 3.1: MIP matrix
(Continued on the next page)
Gravity of the challenge Evolution and prospects Policy response
Imbalances (unsustainable trends, vulnerabilities and associated risks)
Public debt In 2017 the government debt ratio decreased to 77.5 % of GDP, which is still above the Treaty reference value of 60 %. A large portion of the debt is exposed to foreign currency risk. The debt sustainability analysis indicates low risks in the short term but medium risks in the medium and long term.
Between 2008 and 2014, public debt rose from 39 to 84 % of GDP on account of large government deficits and changes in the scope of general government. The debt ratio started declining in 2015, thanks to substantial improvements in the government balance and recovering GDP growth.
The general government balance recorded a surplus of 0.9 % of GDP in 2017. The budget balance is expected to remain mildly positive throughout 2020, allowing the debt ratio to continue decreasing.
The Commission 2018 autumn forecast expects the debt-to-GDP ratio to decline to 73.5 % of GDP in 2018 and to reach 68.2 % of GDP by 2020.
In 2018 debt continued to be refinanced at lower rates, lowering debt servicing costs. Maturities were extended and the share of debt issued in foreign currency declined.
Household and corporate debt and the financial sector
In 2017, consolidated corporate and household debt stood at 64.3 % and 34.1 % of GDP, respectively, down from 70.1% and 35.1% in 2016. Both decreased further in the first half of 2018 and stand below prudential thresholds but still above the levels suggested by fundamentals
Around 48 % of household debt and approximately 76 % of (domestic and external) corporate debt was exposed to foreign currency risk (predominantly EUR) in mid-2018.
In the second quarter of 2018, the NPL rate in the Croatian banking sector reached 8.7 %, down from 11.7% one year earlier and slightly below 8.9% in the previous quarter. The rate is still relatively high in both the corporate and household sector – 20.7 % and 7.6 % respectively.
The pace of deleveraging in both the household and corporate sector is set to continue but abate, as credit flows turned positive.
Despite improvements, the still high exposure to currency risks and interest rate hikes may put at risk the repayment capacity of some households and non-financial corporations and translate into credit risk for the banking sector.
Non-performing loans in the corporate sector decreased markedly in 2017, thanks to their sales and improving economic conditions. However, figures by the Croatian National Bank for September 2018 show a slowdown in NPL sales compared to 2017 and a lower reduction of overall NPLs.
The revised corporate insolvency legislation led to the closure of thousands of illiquid companies without assets. The authorities also plan to enhance the monitoring of the reformed personal insolvency framework.
In July 2018 a settlement between Agrokor's creditors was reached and on 26 October 2018, the Croatian High Commercial Court dismissed all of the appeals lodged by several of the remaining debtholders, effectively removing the final obstacle on the implementation of the deal. A smooth implementation of the agreement remains crucial for the operational and financial recovery of the firm and its suppliers.

3. Overall findings regarding imbalances, risks and adjustment issues
22
Table (continued)
Source: European Commission.
External liabilities and trade performance
The NIIP improved to -62.4 % of GDP in 2017, but remained well below its fundamental level and prudential thresholds. However, the stock of foreign liabilities net of less risky financial instruments (NENDI) is estimated at only - 15 % of GDP in 2018, above both benchmarks. The current account balance stood at 3.9 % of GDP in 2017. It decreased to 3.3 % of GDP in the first half of 2018. Gross external debt declined below 80 % of GDP by June 2018.
The NIIP continued improving in the first half of 2018, rising to —58.3 % of GDP, more than 30 pps above its record low in 2010. The NIIP is projected to keep improving on account of continued current account surpluses and GDP growth.
The current account has moved from a record deficit of 9 % of GDP in 2008 to a surplus in 2013. After reaching 3.9 % of GDP in 2017 it is expected to start declining again to 2.5 % of GDP in 2018. Nevertheless, it should remain in a surplus throughout the forecast horizon, also thanks to continued strong performance of exports.
The economy has more than recovered the previously lost market shares, while tourism boasts record physical indicators year after year despite signs of capacity constraints.
Croatian firms still have to bear a high administrative burden.
Persisting weaknesses in the business environment result in limited attractiveness of Croatia for FDIs and high costs of doing business for Croatian enterprises.
Many reform initiatives aimed at improving the business environment are in the pipeline.
Potential output The unemployment rate has contracted to 9.1 % in 2018. However, at 70.9 % and 65.4 % in Q2 2018, activity and employment rates remain among the lowest in the EU.
The contribution of total factor productivity to potential growth remains low for a catching-up economy.
Low potential growth undermines the durability of the adjustment process.
After having attained a record high of 17.6 % in early 2014, unemployment continues to reduce rapidly. Until 2018, part of the reduction was driven by the shrinking population of working age, due to negative migration flows and population aging. Following the rapid growth rates in pre-crisis years, wages stagnated or decreased in the post-crisis period. They have started growing again in 2017, under the impact of the stipulated increase of public wages. They are expected to continue growing as the labour market tightens.
A comprehensive pension system reform entered into force in 2019, which among others, will extend working lives thus contributing to higher labour utilisation. Active labour market measures remain largely underutilised.
Some measures addressing the efficiency of the public administration have been initiated, while the harmonisation of the wage-setting system across the public administration is planned for early 2019.
Some steps have been taken to simplify the business environment, with regards to the administrative burden and regulated professions, while the reduction of parafiscal charges has stalled.
Conclusions from IDR analysis
Private sector debt declined substantially, however some corporates are still overleveraged and burdened with NPLs. Also Government debt is also on a downward path, thanks to sustained GDP growth and a prudent fiscal policy, but sustainability risks in the medium and long term remain at medium level. Vulnerabilities to potential currency and interest rate shocks are being contained due to an increasing share of fixed interest rate loans and domestic currency loans. A well-capitalised financial sector with improved profitability facilitates the recovery of lending to the private sector. The net international investment position is improving, but remains at levels that exceed the prudential threshold, although net of less risky financial instruments it reached prudential levels. Persistently low activity rates and the shrinking labour force hold back the growth potential.
The robust economic growth is expected to contribute to a further reduction in the private and public debt-to-GDP ratios. The pace of private sector deleveraging is set to abate as credit activity intensifies, supporting investment. The current account is expected to remain in surplus, supporting a further narrowing of external liabilities. In the medium term, low potential growth limits Croatia's shock absorption capacity.
Recently undertaken policy actions and planned measures in the areas of business environment, public administration and the pension system should help increase potential growth. A thorough implementation of reforms remains crucial for supporting the process of real economic convergence.

23
Croatia's public debt ratio has been decreasing
strongly for 3 years in a row as a result of a
prudent fiscal policy and robust GDP growth.
The debt-to-GDP ratio reached 74.5 % in the third
quarter of 2018, from a 2015-Q1 high of 86.2 %.
The decrease was mainly driven by a combination
of GDP growth and significant improvements in
the general government balance (see Graph 4.1.1).
With a structural surplus of 0.7 % of GDP in 2017,
Croatia remained well above its medium term
budgetary objective (-1.75 % of GDP). However,
the activation of contingent liabilities is expected
to have a strong (in excess of 1 % of GDP) yet
temporary negative effect on the government
balance over 2018 and 2019, adding also to the
debt. In addition, as the government uses fiscal
space to cut taxes, fiscal policy is expected to shift
towards a pro-cyclical stance. Still, the decrease in
the debt ratio is expected to continue – albeit at a
slower pace – dipping to 68.2 % in 2020, driven by
small surpluses and GDP growth.
Graph 4.1.1: Drivers of change in the debt ratio
Stock-flow adjustments include differences between cash
and accrual recording, the (net) accumulation of financial
assets, valuation effects and some remaining statistical
adjustments (e.g. sector reclassifications).
Source: AMECO, European Commission 2018 autumn
forecast, own calculations.
The structure of Croatia’s debt has improved in
many respects. In recent years, Croatia used the
low interest rate environment to refinance
maturing bonds and loans at lower interest rates. In
2017, the implicit interest rate on public debt was
at a record low of 3.4 %, down from 4.2 % in
2015. In addition, an extension of the average
maturity of outstanding debt and increased
issuances of debt in national currency have
somewhat decreased the vulnerabilities associated
with government debt. Similarly, the share of
fixed-rate debt increased, reducing exposure to
interest-rate shocks.
Graph 4.1.2: Structure of public debt
(1) Other CG (central government) includes mainly PPPs.
(2) EB users = extra-budgetary users classified under central
government.
Source: Croatian National Bank, Ministry of Finance, own
calculations.
Expenditure restraint was driven by cuts in
investment and savings in interest spending.
The improvement in the general government
balance in 2017 was achieved by a combination of
growing revenues and a minor decrease in total
expenditure in nominal terms, in spite of public
sector wage hikes. Most notably, public investment
was cut by more than 12 % while savings in
interest paid amounted to almost 10 % compared
to 2016. Since public investment as a share of
GDP is at a record low of 2.7 % and interest rates
are projected to rise, creating fiscal space through
these categories in the coming years is unlikely to
be possible.
-8
-6
-4
-2
0
2
4
6
8
10
12
11 12 13 14 15 16 17 18
% of GDP
Stock-flow
adjustment
Denominator -
inflation
Denominator -
real GDP growth
Interest
Primary surplus
Tota l change
forecast
Domestic
External
State budget
users
SOEs
EB users
HBOROther CGLocal gov 't
LT securities
ST securities
LT loans
ST loans
EUR
HRK
USD
0
20
40
60
80
100
15 17 15 17 15 17 15 17
By debtholderresidence
Bygovernment
level
By maturityand
instrument
By currency
%
4. REFORM PRIORITIES
4.1. PUBLIC FINANCES AND TAXATION*

4.1. Public finances and taxation*
24
Graph 4.1.3: Drivers of change in government balance
Source: AMECO, own calculations.
Long delayed measures aimed at strengthening
the fiscal framework are progressing. In
December 2018, the Parliament adopted the Fiscal
Responsibility Act while the State Audit Office
Act was passed for the second reading in January
2019. The new Fiscal Responsibility Act is aimed
mainly at reinforcing the set-up and mandate of the
Fiscal Policy Commission and laying down
numerical fiscal rules, including a structural
budget balance rule. The new State Audit Office
Act aims to address the low implementation of its
instructions and recommendations by introducing
sanctioning mechanisms. It also increases the
scope of the State Audit Office audits, including
the Croatian National Bank. The Budget Act —
aimed at specifying the short and mid-term
budgetary framework at central and local level —
is scheduled for adoption by the government in
early 2019.
Budgetary control is set to tighten at the central
level and ease at the local level. The planned
rationalisation of government agencies and
harmonization of wage setting (see section 4.4.4)
have the potential to strengthen budgetary control
at central government level. On the local level, the
fiscal capacity of government units was
strengthened by the new law on the financing of
local government units, which streamlined the
system of central government transfers and
introduced a new system of fiscal equalisation. The
new system is no longer based on geographical
criteria, but on the fiscal capacities of the local
units. However, it no longer ties revenue allocation
for decentralised functions to the number of
functions a unit commits to perform.
Debt sustainability analysis and fiscal risks
Croatia faces low fiscal sustainability risks in
the short term in spite of the expected calls on
government guarantees. Based on the S0
indicator (10
), Croatia faces low fiscal risks mainly
due to its solid primary balance, declining debt and
financing needs (see Annex B). The sovereign
yield spread, although higher than in most member
states at 150-200 basis points, has been decreasing
steadily. The improved perception of Croatia’s
sovereign credit risk was also reflected in rating
agencies’ reports. Although the ratings remain a
notch below investment grade, the outlook is
deemed positive by most agencies.
While significant, the expected materialisation
of contingent liabilities in the shipbuilding
industry should not substantially increase
short-term risk. (11
) However, the fact that also
the guarantees pertaining to projects still in the
early stages were called, points to flaws in the
monitoring of the proper use of issued guarantees.
As a result of these guarantee calls, the stock of
active guarantees is expected to halve in 2019
compared to 2017 (see Graph 4.1.4), thereby also
reducing the concentration of remaining
guarantees (12
).
(10) An early-detection indicator of short-term fiscal stress
stemming from the financial-competitiveness or the fiscal side of the economy.
(11) The S0 indicator takes into account the Commission's 2018 Autumn Forecast (European Commission, 2018j), which
projects the materialisation of contingent liabilities to occur
in both 2018 and 2019. The S0 indicator by design captures the effect in 2018, but not 2019. Nevertheless, Croatia's
performance across indicators leaves substantial margin. (12) The Herfindahl–Hirschman concentration index should
improve to around 0.14 in 2019 from 0.28 in 2017. The
index is calculated as the sum of the squares of shares and ranges from 0 to 1, where lower values mean less
concentration.
-1.5
-1.0
-0.5
0.0
0.5
1.0
1.5
2.0
2.5
3.0
3.5
14 15 16 17 18
% of GDP
Revenue growth
Interest
Public
investment
Social benefits
Capital transfers
Other
expenditure
Tota l change
forecast

4.1. Public finances and taxation*
25
Graph 4.1.4: Active government guarantees by companies,
2017
(1) ‘Uljanik (total)’ does not include guarantees issued to the
‘3. Maj shipyard’
Source: Ministry of Finance, 2017 Budget execution report.
In the medium and long term, Croatia faces
medium fiscal sustainability risks. The medium-
term sustainability gap indicator S1 (13
) has a value
just above the medium risk threshold (0.2 % of
GDP), which means that a small additional effort
would be needed on top of current policies to bring
the debt ratio down to 60 % of GDP in 2033. The
sustainability gap indicator S2 (14
) indicates low
risks in the long term on account of the projected
decrease in ageing-related expenditure, in
particular pension benefits. The debt sustainability
analysis also points to medium risk, mainly related
to the high stock of debt and the unfavourable debt
projections under alternative scenarios, in
particular historical (see graph 4.1.5). Therefore,
the DSA confirms the medium risk assessment
produced by the S1 indicator for the medium term
and drives the overall assessment of medium risk
in the long term.
(13) The medium-term indicator which shows the cumulative
improvement in the structural primary balance over five years (starting from 2021) required to reach a 60 % debt-
to-GDP ratio by 2033.
(14) The long-term fiscal sustainability indicator which shows the upfront adjustment of the current structural primary
balance (kept constant thereafter) required to stabilise the debt-to-GDP ratio.
Graph 4.1.5: Public debt ratio baseline and scenarios
(1) SCP scenario is based on the projections presented in
Croatia's 2018 Convergence programme.
(2) SGP scenario is based on the provisions of the Stability
and Growth Pact.
Source: European Commission, Debt Sustainability Monitor
2019.
The pension reform is set to improve pension
adequacy while not endangering long-term
sustainability. While the aforementioned S2
indicator does not take into account the 2018
pension reform, based on a preliminary
assessment, the reform does not involve severe
risks to Croatia’s long-term fiscal sustainability.
Namely, the 2018 Ageing report’s baseline
scenario projected a steady decrease in public
pension expenditure by as much as 3.8 % of GDP
in 2070 compared to 2016. Although the
supplement granted to multi-pillar perspective
pensioners will increase public pension spending
compared to that baseline, the long-term
downward trend appears confirmed. At the same
time, the supplement is projected to somewhat
improve the low pension adequacy, which should
also improve as longer working lives result in
higher benefits (see Section 4.3).
Taxation
After the tax reform that entered into force in
2017, the authorities will enforce further tax
cuts effective largely as of 2019. The cuts are
projected to cost roughly 0.6 % of GDP in
foregone revenue. Most notably, they entail a shift
of several foodstuffs from the standard (25 %) to
the reduced (13 %) VAT rate, a slight decrease
(-0.7 pp) in social insurance contributions and a
Uljanik (total)
PlinacroPort
authority
Zadar
0.0
0.2
0.4
0.6
0.8
1.0
1.2
1.4
1.6 % of GDP
55
60
65
70
75
80
85
16 17 18 19 20 21 22 23 24 25 26 27 28 29BaselineSGP scenarioSCP scenarioLower interest rate scenarioHigher interest rate scenarioLower GDP growth scenarioHigher GDP growth scenario
% of GDP
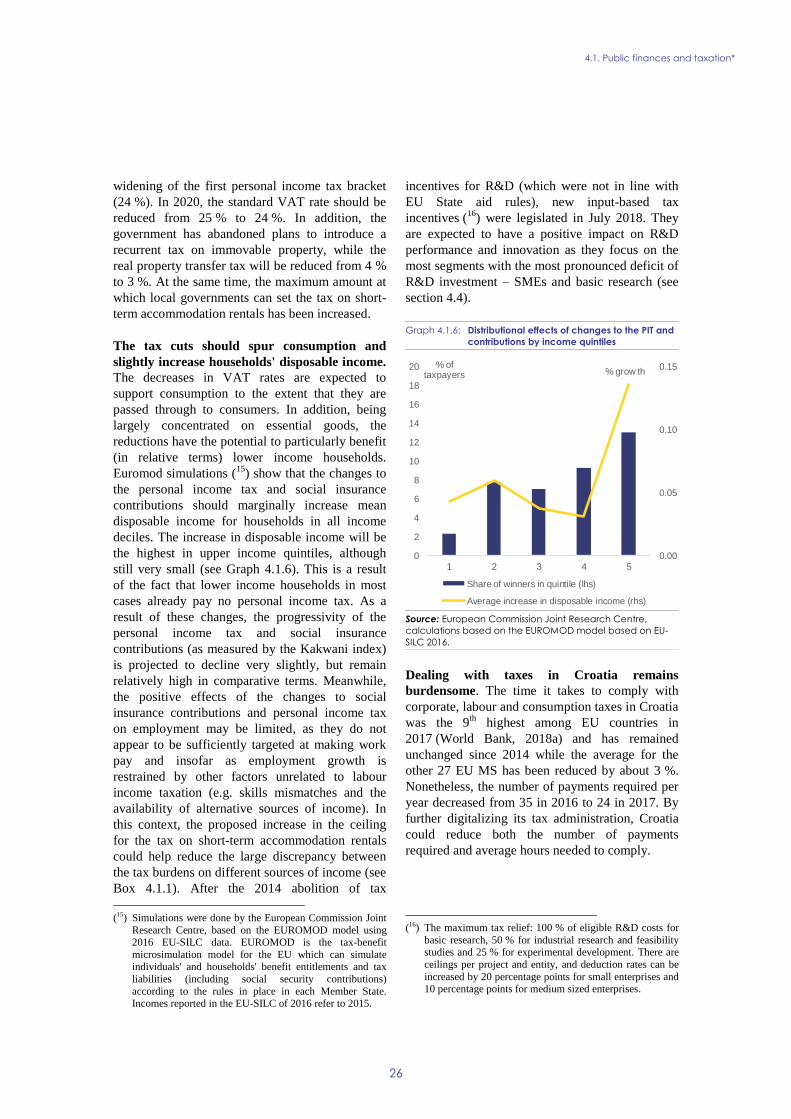
4.1. Public finances and taxation*
26
widening of the first personal income tax bracket
(24 %). In 2020, the standard VAT rate should be
reduced from 25 % to 24 %. In addition, the
government has abandoned plans to introduce a
recurrent tax on immovable property, while the
real property transfer tax will be reduced from 4 %
to 3 %. At the same time, the maximum amount at
which local governments can set the tax on short-
term accommodation rentals has been increased.
The tax cuts should spur consumption and
slightly increase households' disposable income.
The decreases in VAT rates are expected to
support consumption to the extent that they are
passed through to consumers. In addition, being
largely concentrated on essential goods, the
reductions have the potential to particularly benefit
(in relative terms) lower income households.
Euromod simulations (15
) show that the changes to
the personal income tax and social insurance
contributions should marginally increase mean
disposable income for households in all income
deciles. The increase in disposable income will be
the highest in upper income quintiles, although
still very small (see Graph 4.1.6). This is a result
of the fact that lower income households in most
cases already pay no personal income tax. As a
result of these changes, the progressivity of the
personal income tax and social insurance
contributions (as measured by the Kakwani index)
is projected to decline very slightly, but remain
relatively high in comparative terms. Meanwhile,
the positive effects of the changes to social
insurance contributions and personal income tax
on employment may be limited, as they do not
appear to be sufficiently targeted at making work
pay and insofar as employment growth is
restrained by other factors unrelated to labour
income taxation (e.g. skills mismatches and the
availability of alternative sources of income). In
this context, the proposed increase in the ceiling
for the tax on short-term accommodation rentals
could help reduce the large discrepancy between
the tax burdens on different sources of income (see
Box 4.1.1). After the 2014 abolition of tax
(15) Simulations were done by the European Commission Joint
Research Centre, based on the EUROMOD model using 2016 EU-SILC data. EUROMOD is the tax-benefit
microsimulation model for the EU which can simulate individuals' and households' benefit entitlements and tax
liabilities (including social security contributions)
according to the rules in place in each Member State. Incomes reported in the EU-SILC of 2016 refer to 2015.
incentives for R&D (which were not in line with
EU State aid rules), new input-based tax
incentives (16
) were legislated in July 2018. They
are expected to have a positive impact on R&D
performance and innovation as they focus on the
most segments with the most pronounced deficit of
R&D investment – SMEs and basic research (see
section 4.4).
Graph 4.1.6: Distributional effects of changes to the PIT and
contributions by income quintiles
Source: European Commission Joint Research Centre,
calculations based on the EUROMOD model based on EU-
SILC 2016.
Dealing with taxes in Croatia remains
burdensome. The time it takes to comply with
corporate, labour and consumption taxes in Croatia
was the 9th
highest among EU countries in
2017 (World Bank, 2018a) and has remained
unchanged since 2014 while the average for the
other 27 EU MS has been reduced by about 3 %.
Nonetheless, the number of payments required per
year decreased from 35 in 2016 to 24 in 2017. By
further digitalizing its tax administration, Croatia
could reduce both the number of payments
required and average hours needed to comply.
(16) The maximum tax relief: 100 % of eligible R&D costs for
basic research, 50 % for industrial research and feasibility studies and 25 % for experimental development. There are
ceilings per project and entity, and deduction rates can be
increased by 20 percentage points for small enterprises and 10 percentage points for medium sized enterprises.
0.00
0.05
0.10
0.15
0
2
4
6
8
10
12
14
16
18
20
1 2 3 4 5
% grow th% of
taxpayers
Share of winners in quintile (lhs)
Average increase in disposable income (rhs)

4.1. Public finances and taxation*
27
Box 4.1.1: Taxation of labour, capital and property income of households
There is a substantial variation in the tax burden on Croatian households depending on the source of their
income. With one of the highest home ownership rates in the EU (1), Croatian households appear heavily
skewed towards owning and investing in immovable property at the expense of more liquid and tradable
asset classes. This may be partly linked to historical causes and low financial literacy, but it may also owe to
the relatively low costs of property ownership. Tax rates on income earned from immovable property are
substantially lower than on capital or labour (see Graph 1).
In particular, revenue from short-term accommodation rental is only subject to a lump sum per-bed tax, and
is not added to the base for standard personal income tax or contributions. In addition to being highly
regressive, it may provide a disincentive to work. Such a framework further narrows the already constrained
long-term property rental market, particularly in the coastal areas. This disproportionately affects
lower-income households and young families, and harms worker mobility. Furthermore, it incentivises the
already booming private accommodation sector, crowding out investment in hotels (2), the segment with
higher added value and lower seasonality. Similarly, the design of this tax provides a disincentive to scaling
up (3).
Graph 1: Tax rates on income by sources (lhs) and tourist beds per inhabitant by municipalities (rhs), 2017
Effective tax rate on short-term accommodation rental equals the sum of flat-rate tax per bed and the sojourn tax,
divided by gross revenue.
Source: EUROMOD simulation 2017, Croatian Tourist Board, Ministry of Finance, Croatian Bureau of Statistics, own
calculations.
In addition to addressing the aforementioned drawbacks, a more balanced approach in the taxation of income
from immovable property (compared to labour and capital) could also help reduce regional disparities in the
taxation of household income and housing prices. The tax reform passed in 2018 brought some changes, but
retained the lump-sum approach: since 2019, local government units are allowed to establish the per-bed tax
on their own, albeit within broadly pre-set limits, which makes the effects of this change difficult to forecast.
(1) In 2016, 89.9 % of Croatian nationals residing in the country lived in their own home, equal to Slovakia, and second only to Romania (95.6 %)
(2) In 2017, households accounted for almost two thirds of all tourist accommodation capacity in Croatia. The share of
tourist overnight stays in hotels is by far lower than in any of Croatia’s competitors in the Mediterranean, and is
decreasing. (3) If a taxpayer registers more than 20 beds, the lump sum per-bed tax is replaced with the standard personal income tax,
i.e. the income adds to the tax base.

4.1. Public finances and taxation*
28
Healthcare
The healthcare system remains a source of risk
for public finances. While the number of
contributing individuals is increasing steadily, still
only around one third of those entitled to use the
public health system pay full premiums, which
reflects the low employment rate. Insurance for
non-paying individuals (some 42 % of all insured)
is covered through state budget transfers, which,
however, have been consistently below the levels
required for full coverage, adding to accumulation
of debt in the healthcare system. In September
2018, the total debt was some 4 % higher than the
year before, with roughly half classified as arrears.
A higher health insurance premium is expected
to improve the financial situation of the health
care system. Since January 2019, the health
contribution rate has increased by 1 percentage
point, increasing the reliance of the system’s
financing on the working population. According to
the authorities’ estimates, this should raise
contribution revenue by 0.4 % of GDP (an increase
of roughly 6 % of the Croatian Health Insurance
Fund’s total revenue). No measures are currently
planned to broaden the base of paying users.
Similarly, no specific plans have been disclosed to
address the current stock of arrears.
Expenditure on health care in Croatia remains
well below the EU average. In 2016, total health
expenditure in the country was 7.2 % of GDP,
compared to 9.9 % on average in the EU. When
considering only public expenses, the amounts
were 5.6 % vs 7.9 % of GDP. In recent years, the
decreasing trend in total per-capita spending on
health was reversed, but, at EUR 1 307 in 2017,
the level remains less than half the EU average.
Health outcomes are generally below average in
the EU. At 78.2, life expectancy in Croatia is
substantially shorter than the EU average (81).
Healthy life expectancy at the age of 65 is 5 years,
which is one of the lowest in the EU. Smoking and
alcohol consumption are above the EU average,
which is reflected in cardiovascular and cancer
mortalities being responsible for around 75 % of
all deaths in the country. In access to health care,
Croatia fares better than many other Member
States. In 2017, the proportion of reported unmet
medical needs due to waiting times, cost or
distance was at the EU average. However, the high
proportion of unmet needs only due to distance
(much greater than the EU average) remains a
concern.
The system’s structure appears misaligned with
the needs of the population. Expenditure on
outpatient pharmaceuticals and other medical
goods is well above the EU average (25 % vs 19 %
of total health expenditure), which contradicts the
relatively high number of patients referred to
hospitals. By contrast, inpatient care accounts for
25 % of total expenditure, 5 percentage points
lower than the EU average, but the number of
hospital beds per inhabitant is higher (European
Commission, 2018e). Some hospitals in the
country provide services in excess of the limits set
by the Croatian Health Insurance Fund, while
some maintain capacities greater than the needs of
the population they serve. While the authorities
have announced plans to increase the spending
limits in hospitals across the board, the system is
likely to remain prone to accumulation of arrears
as long as the spending limits are not brought
closer in line with types and amounts of services
provided in each of the hospitals.
The National Hospital Development Plan was
finally adopted in September 2018. Building on
a previous document for 2015-2016, it sets
functional integration as one of the main principles
in facilitating modernisation and restructuring of
hospitals, as well as in improving the quality of
care they provide. Initiated already in 2017, the
functional integration has progressed slowly and is
set to continue without a specific timeline.
Furthermore, this reform of the hospital system
does not take full consideration of the parallel
initiatives in strengthening outpatient care (see
below). The two processes do not appear to be well
coordinated, posing risks of unsatisfactory
outcomes.
The primary care strengthening is on the
government’s agenda. Recent amendments to the
Health Care Act give the counties possibility to
buy certain types of equipment for the health
centres on their territories. The intention is to give
these centres a crucial role in the health care
system in Croatia. Other measures include
increasing the number of general practitioners,
which is currently below the EU average (17 % of
all medical doctors vs 23 % in the EU).
4.1. Public finances and taxation*
29
Specialisation will be paid for general practitioners
who remain in specified locations in the country
for at least 5 years. This should contribute to
addressing the problem of uneven distribution of
health resources in Croatia and the resulting
difficult geographical access.
E-health solutions have the potential to improve
the efficiency of the health care system in
Croatia. There are projects like e-prescriptions,
which have been already operational and
successful — 80 % of prescriptions in community
pharmacies are electronic. On the other hand,
e-referrals or electronic health records (the latter
used by only 3 % of general practitioners) are still
under development. Investment in equipment
planned in the health centres is expected to
improve the system’s capacity for further
development of e-health services.
Croatia lacks a long-term care strategy that
would cater to the needs of older people. The
currently low public expenditure (0.88 % of GDP
in 2016) on long-term care is projected to rise to
1.22 % in 2070 (European Commission, 2017h), as
a result of the rapidly aging population. The
number of people experiencing problems in
everyday life increases with age. In the younger
elderly group (65-74 years) the share is 38.4 %,
while in the older elderly group (85+) this share is
as high as 67.9 %. Taking into account all state and
county homes for the elderly, other homes and
foster care, there are places for only 3.68 % of
those older than 65. In addition to long waiting
lists, differing prices in state, county and private
homes, there is an uneven regional distribution of
available places. Since 2012, the main ’assistance
at home’ service has been steadily decreasing (17
).
As a result, the burden of care falls mainly on
family members, both as a financial cost and a
barrier to gainful employment.
(17) In 2015 it was provided to 3 300 persons older than 65,
compared to 15 500 beneficiaries in 2012.

30
Corporate debt
The consolidated debt-to-GDP ratio of the
corporate sector has declined by more than 20
percentage points since 2010. Following a sharp
contraction by 5.9 percentage points in 2017, the
corporate debt-to-GDP ratio further decreased by
1.1 percentage points in the first half of 2018, to
63.2 % of GDP, still highest among peer countries.
Since 2016, the reduction has been driven
primarily by a significant contraction of the
external debt of both private and public
non-financial corporations (by 4.2 percentage
points of GDP and 1.4 percentage points, of GDP
respectively). With an improved sovereign risk
premium and the credible exchange rate
management and stabilisation policies pursued by
the Croatian National Bank, reduced overall
exposure to external financing has mitigated the
foreign exchange rate risk of the non-financial
corporations.
Several other factors have contributed to the
reduction in corporate debt since 2016.
Economic growth continued facilitating the
reduction in corporate debt, supported by the
pick-up in inflation, along with stock-flow
adjustments, in the form of debt write-offs and the
continued appreciation of the domestic currency.
Sales of non-performing loans reduced the
indebtedness of non-financial corporations towards
the domestic banking sector. However,
non-performing loans sales seem to have slowed in
2018 due to both supply and demand factors.
Lending transactions by the domestic banking
sector to non-financial corporations turned positive
in 2016 and throughout 2017 and 2018. A large
roll-up loan to Agrokor agreed during the
settlement preparation process and the widespread
refinancing of the external debt of non-financial
corporations in the domestic market supported
recovery of debt transactions.
Financing conditions for enterprises continued
improving in 2018 and are expected to remain
favourable. Ample liquidity provided by an
expansionary monetary policy allowed for further
reduction of interest rates on new loans to
enterprises. In September 2018, interest rates on
new loans to non-financial corporations across
almost all maturities, loan sizes and currency
denominations were on average 50 basis points
lower than at the end of 2017. However, owing to
the still relatively high-risk premium for Croatia,
interest rates for non-financial corporations remain
above those in some peer countries, despite the
gradual reduction in country spreads for both
long-term and short-term loans. Furthermore,
reduction in bank margins and non-interest charges
due to strong competition in the banking sector led
to a strong increase in new business loans. Overall,
the volume of new business loans to non-financial
corporations grew by 12 % year-on-year in the
12-months up to September 2018, driven primarily
by foreign currency loans and the loans
denominated in a foreign currency. A significant
share of these loans was used to refinance older
loans, now under more favourable terms. This
partially explains the negative nominal growth of
the total non-financial corporation loan-stock of
2.0 % in the same period.
Corporate debt level is decreasing, but remains
high with a number of vulnerabilities. Overall,
by mid-2018 the corporate debt ratio was 6.8
percentage points below its prudential threshold
but 18.2 percentage points above the level
suggested by fundamentals (18
), indicating
remaining risks. Foreign currency exposure of
non-financial corporations remains significant;
around 76 % of overall corporate debt (48.2 % of
GDP) is either contracted abroad, or denominated
in foreign currency. However, given ample loan
refinancing options due to currently favourable
financing conditions this risk should be
manageable even for non-exporting firms with
larger open foreign currency positions. Interest rate
risk further subsided as average fixation periods
for new loans increased in 2017 and throughout
2018. The share of new loans issued with a
variable interest rate or with a fixation period up to
3 months fell from 93 % in 2012 to 67 % during
the first three quarters of 2018. However, the
‘debt-to-gross financial assets’ and the
‘debt-to-equity’ ratios of the non-financial
corporate sector remain relatively high,
highlighting potential solvency risks.
(18) Fundamentals-based benchmarks are derived from
regressions capturing the main determinants of credit growth and taking into account a given initial stock of debt.
Prudential thresholds represent the debt threshold beyond
which the probability of a banking crisis is relatively high,
minimising the probability of missed crisis and that of false
alerts. Methodologies are describe in European Commission (2017b) and updates to the methodology have
been subsequently proposed in European Commission
(2018l).
4.2. PRIVATE SECTOR DEBT AND FINANCIAL SECTOR*
4.2. Private sector debt and financial sector*
31
Household debt
Household debt as a percentage of GDP
stagnated in 2018 as new borrowing picks up.
By June 2018, the debt-to-GDP ratio of the
household sector stood at 34.2 %, 7.7 percentage
points below its 2010 peak value. Since 2017, the
debt level has largely stagnated despite strong
economic activity, due to a moderate upswing in
credit flows. In the first 9 months of 2018, new
credit to households increased by 3 %. Unlike in
2017, credit standards for granting housing and
consumer loans tightened in 2018, because of
legislative changes to the enforcement framework.
However, strong competition in the banking sector,
decreasing costs of bank financing, and growth
expectations still facilitate credit supply. Demand
for household loans remained strong in 2017 and
throughout 2018 as the improving labour market
and rising wages helped to strengthen consumer
confidence.
The foreign exchange and variable interest rate
exposure of households has substantially
changed in the last 5 years. In September 2018,
the share of outstanding kuna denominated loans
stood at 51 % of total loans, double their share at
the end of 2013. During the same period, the share
of kuna loans in new loans rose from around 40 %
in 2013 to 73 % in 2018. The shift started
following the Swiss franc loan conversion, when
many clients refinanced their newly converted euro
denominated loans with kuna denominated ones.
With the overall fall in interest rates, households
seem to be less willing to take on exchange rate
risk. This is especially noticeable for non-house
purchase loans. Interest rate spreads for such loans
between loans in kuna and those denominated in
foreign currency were around 30 basis points
higher in 2018 than in 2013. On the other hand,
availability of kuna financing for banks, due to
expansionary monetary policy, and a noticeable
shift in the composition of deposits towards
short-term kuna deposits, allowed banks to
increase the supply of kuna loans significantly.
Households also reduced their exposure to interest
rate risk. Average interest rate fixation periods for
new house purchases loans are estimated to have
increased by around 32 months between 2013 and
2018. Similarly, the share of new long-term
consumer and other purpose loans with interest
rate fixation periods of up to 1 year fell from 46 %
to 29 %.
The household debt ratio is not particularly
high and its risk profile is improving. In
mid-2018, the household debt ratio was almost 20
percentage points below the prudential
country-specific threshold (54 % of GDP), but was
still around 8 percentage points above the
fundamentals-based benchmark (26 % of GDP),
suggesting that risks are limited, although there
remains scope for some deleveraging. Despite
improvements, a significant share of the stock of
loans is still exposed to exchange rate shocks or
interest rate hikes. Following recommendations to
credit institutions issued by the Croatian National
Bank in September 2017, banks have been
extending their offer of loans at fixed rates and
minimising the cost for consumers of refinancing
existing loans at variable rates into loans with
fixed rates. Interest rates have been decreasing
since the end of 2015 and are expected to stay at
low levels. Credit risk remains moderate given the
relatively low level of households’ non-performing
loans and still moderate aggregate credit growth.
However, consumer lending, especially kuna cash
loans, have been growing at a much higher rate.
Housing market
Despite a strong recovery in 2017, real housing
prices remain significantly below the peak in
2007. Because of strong growth since 2016, real
housing prices recovered to 2012 levels, but in
June 2018, they were still more than 25 % below
the peak in 2007. Average real house prices in
Croatia grew by 6.6 % in 2017. However, in the
first half of 2018 prices stagnated, despite a
continued drop in interest rates for housing loans.
Prices of existing dwellings have grown
significantly faster since 2016 than prices of newly
built ones, 7.4 % and 2 % respectively. According
to the price-to-rental indicator, housing prices are
still significantly below their long-term average in
Croatia. This can partly be explained by a
combination of negative demographic trends and
an already high rate of home ownership.
There are significant regional disparities in
housing price developments. In the 18 months up
to June 2018, housing prices in Zagreb grew by
11.8 %, followed by prices along the Adriatic
coast, which grew 5.9 %. The rest of the country
recorded an average 1.1 % decline in housing
prices. The number of recorded housing purchase
transactions also confirms large regional

4.2. Private sector debt and financial sector*
32
disparities, as more than 76 % of transactions
occurred within only five counties and the city of
Zagreb (Tkalec and al., 2018). Furthermore, the
analysis of housing affordability suggests higher
housing prices relative to income in the coastal
areas and the city of Zagreb. This is in line with
expectations given the large share of housing used
for renting to tourists along the coast (see Box
4.1).
Access to finance
Access to bank loans is improving, also for
small and medium-sized enterprises. Bank
lending traditionally represents the most important
source of external financing for enterprises in
Croatia. However, it remains subdued, especially
for small and medium-sized enterprises, despite
improvements in lending conditions. According to
the bank lending survey, credit standards on loans
to enterprises have continued to ease throughout
2018, especially for short-term loans and loans to
small and medium-sized enterprises. According to
the latest findings from the Survey on the Access
to Finance of Enterprises, access to finance
remained a challenge for enterprises in Croatia in
2018. Around 11 % of small and medium-sized
enterprises in Croatia reported access to finance as
their most important problem, compared to the EU
average of 7 %. Around 67 % of the companies
that applied for a bank loan were granted a loan of
a full requested amount, compared with the EU
average of 73 %. Furthermore, 7 % of all surveyed
small and medium-sized enterprises did not apply
for a bank loan due to fear of rejection, compared
to the EU average of 5 %. The Croatian Bank for
Reconstruction and Development and the Croatian
Agency for small and medium-sized enterprises,
Innovations and Investments help improve access
to finance by providing credit lines with subsidised
interest and specific loans for innovation and
innovation commercialisation.
Croatian bond markets remain underdeveloped
and the stock market has been characterised by
relatively low turnover. The corporate bond
market remains very small, limited to a few large
issuers. At the end of 2018, there were seven
active corporate issuers, including financial
institutions, which had bond listing on the on the
Zagreb Stock Exchange, with an average market
capitalization of about 1 % of GDP. The
outstanding government bonds, in turn, had a
market capitalization of around 25 % of GDP. The
average market capitalization of the local stock
exchange represents a healthy share of 35 % of
GDP in 2018, despite Agrokor related losses.
However, average turnover was low, around
0.75 % and investors held only one third of the
listed shares as portfolio investments.
Graph 4.2.1: Trading volumes at Zagreb Stock Exchange
Source: Zagreb Stock Exchange, own calculations.
Other sources of financing for companies are
being developed. In 2018, the Zagreb Stock
Exchange launched a new market, with less
restrictive listing and reporting requirements, for
small and medium sized enterprises. This market
enables small and medium-sized enterprises to
make initial public offerings in order to finance
inclusive, long-term growth and development.
With the establishment of the equity crowdfunding
platform for small firms and start-ups, the Zagreb
Stock Exchange has become a company-financing
hub providing its services to companies at all
stages of development.
Several new initiatives should help increase the
availability of venture capital financing. Over
the past few years, there has been little progress in
developing new venture capital funds in Croatia.
This could be explained in part by the small size of
the Croatian market, as well as the financial crisis.
However, raising funds on the capital markets is
particularly relevant for innovative start-ups with
high growth potential. The recently established
Venture Capital Fund supported by EUR 35
million from the European Regional Development
0
5
10
15
20
25
30
35
08 09 10 11 12 13 14 15 16 17 18
Total value of transactions
billion HRK
0
1
2
3
4
5
6
7
8
08 09 10 11 12 13 14 15 16 17 18
Total volume
billion
0
20
40
60
80
100
120
140
160
08 09 10 11 12 13 14 15 16 17 18
Market capitalisation(shares)
billion HRK
0
1
2
3
08 09 10 11 12 13 14 15 16 17 18
Average daily number oftransactions (shares)
thousand transactions

4.2. Private sector debt and financial sector*
33
Fund, should help improve access to the equity
funding for start-ups (19
). However, the selection
of the fund manager was delayed. The recently
adopted pension reform allows mandatory pension
funds (Pillar II) to invest part of their managed
assets into funds supporting small and medium
enterprises and start-ups. Exposure to such
investments is limited to 0.2 % and 0.1 % of the
total assets of A and B-risk category funds
respectively. This should free up around 100
million kuna for investment in venture capital.
Moreover, EU funding from COSME has recently
supported two private equity fund initiatives that
are currently raising funds focusing on small and
medium enterprises in Croatia and the region.
Financial sector
Croatian banks' profitability and solvency have
continued to improve since 2015. With a return
on equity of 5.9 % at end-2017, banks' profitability
was lower than in end-2016, largely because of
losses on exposures to the Agrokor Group (see
Table 4.2.1). Profitability increased again in the
first half of 2018, as provisioning levels are
returning to levels comparable to those of 2016.
While healthy profits and local rules continue to
help banks maintain relatively high solvency
ratios, the ending of the preferential 0 % risk
weighting for the non-kuna exposures to the
Republic of Croatia at end-2017 led to a one-off
reduction in capital ratios in early 2018. The share
of direct bank financing from mother banks,
predominantly in Italy and Austria, is low and
(19) Croatia is in 20th position in the EU (Cyprus, Malta not
included) for Venture Capital as a % of GDP (Invest
Europe, 2018).
decreasing while domestic sources of financing,
mostly deposits, increase. Lending to the private
sector, excluding financial corporations, grew in
the 12 months up to September 2018 on a
year-on-year basis, reversing its downward trend
since 2017. In particular, the overall annual credit
growth rate was driven by renewed growth in new
loans to non-financial corporations; especially
non-kuna loans (see Graph 4.2.2).
Graph 4.2.2: Growth of new business loans (in annual
volumes)
New business loans only cover all contracts that specify for
the first time the interest rate of the loan, including
renegotiations of the terms and conditions of existing loan
contracts. The data includes all loans other revolving loans,
overdrafts, and credit card claims.
Source: Croatian National Bank.
Progress in reducing non-performing loans has
been significant. In September 2018, the stock of
-15
-10
-5
0
5
10
15
14Q1 15Q1 16Q1 17Q1 18Q1
HH NFC HH+NFC
% y-o-y
Table 4.2.1: Financial soundness indicators, all domestic and foreign banks
(1) Defined as accumulated impairments / NPLs.
(2) For comparability reasons, annualized values are presented.
Source: ECB - CBD2 - Consolidated Banking data; own calculations.
2014 2015 2016 2017q1 2017q2 2017q3 2017q4 2018q1
NPL ratio (all sectors) 13.6 13.0 10.7 12.1 11.7 10.8 8.8 8.9
NPL ratio (NFC and households sectors) 20.0 19.1 16.0 17.3 16.5 15.8 13.6 13.6
NPL ratio (NFC sector) 31.2 29.9 24.2 26.7 26.3 25.0 21.2 21.1
NPL ratio (household sector) 12.0 11.8 9.7 9.9 8.8 8.4 7.7 8.0Coverage ratio
(1)54.3 59.1 65.8 62.7 60.5 61.3 62.6 61.2
Return on equity(2)
3.9 -6.8 8.9 3.5 4.3 6.1 5.9 11.0Return on assets
(2)0.5 -0.9 1.2 0.5 0.6 0.8 0.8 1.5
Total capital ratio 20.4 19.2 20.8 21.0 20.9 20.2 21.4 20.7
CET 1 ratio 19.4 17.7 19.4 19.7 19.6 19.1 20.2 19.6
Tier 1 ratio 19.4 17.7 19.4 19.7 19.6 19.1 20.2 19.6
Loan to deposit ratio 92.0 89.2 85.3 85.2 85.0 84.8 82.1 82.4
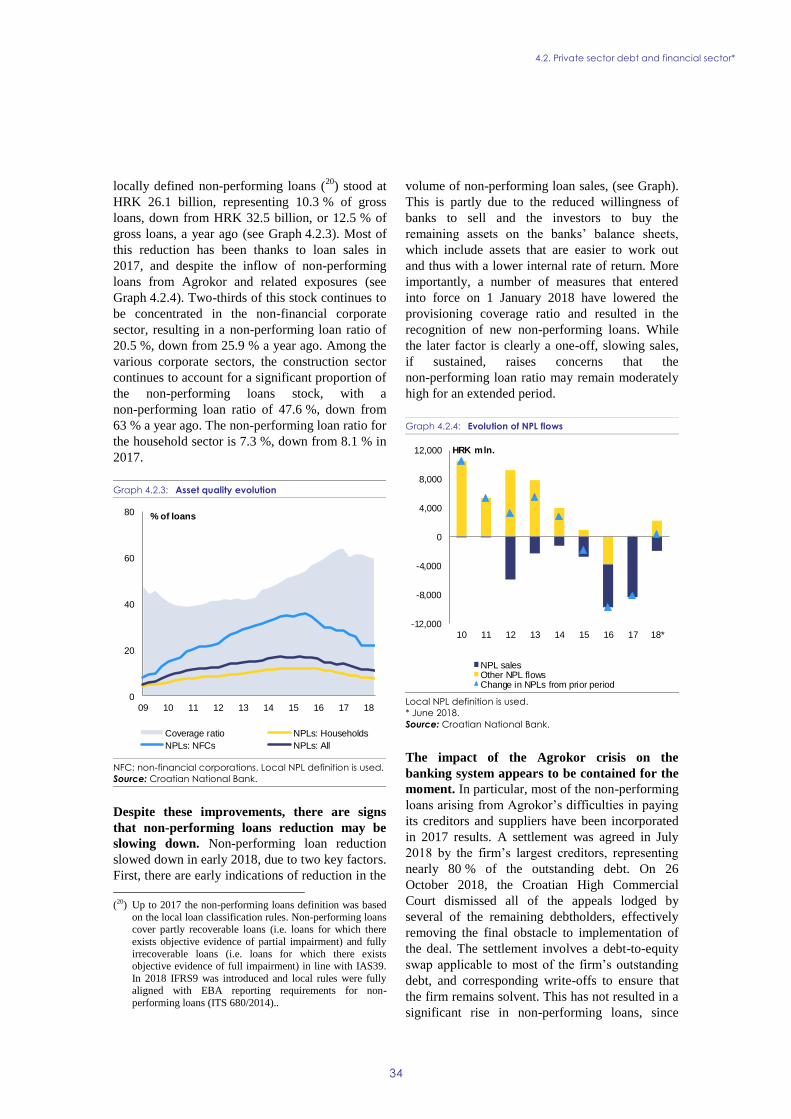
4.2. Private sector debt and financial sector*
34
locally defined non-performing loans (20
) stood at
HRK 26.1 billion, representing 10.3 % of gross
loans, down from HRK 32.5 billion, or 12.5 % of
gross loans, a year ago (see Graph 4.2.3). Most of
this reduction has been thanks to loan sales in
2017, and despite the inflow of non-performing
loans from Agrokor and related exposures (see
Graph 4.2.4). Two-thirds of this stock continues to
be concentrated in the non-financial corporate
sector, resulting in a non-performing loan ratio of
20.5 %, down from 25.9 % a year ago. Among the
various corporate sectors, the construction sector
continues to account for a significant proportion of
the non-performing loans stock, with a
non-performing loan ratio of 47.6 %, down from
63 % a year ago. The non-performing loan ratio for
the household sector is 7.3 %, down from 8.1 % in
2017.
Graph 4.2.3: Asset quality evolution
NFC: non-financial corporations. Local NPL definition is used.
Source: Croatian National Bank.
Despite these improvements, there are signs
that non-performing loans reduction may be
slowing down. Non-performing loan reduction
slowed down in early 2018, due to two key factors.
First, there are early indications of reduction in the
(20) Up to 2017 the non-performing loans definition was based
on the local loan classification rules. Non-performing loans cover partly recoverable loans (i.e. loans for which there
exists objective evidence of partial impairment) and fully
irrecoverable loans (i.e. loans for which there exists objective evidence of full impairment) in line with IAS39.
In 2018 IFRS9 was introduced and local rules were fully aligned with EBA reporting requirements for non-
performing loans (ITS 680/2014)..
volume of non-performing loan sales, (see Graph).
This is partly due to the reduced willingness of
banks to sell and the investors to buy the
remaining assets on the banks’ balance sheets,
which include assets that are easier to work out
and thus with a lower internal rate of return. More
importantly, a number of measures that entered
into force on 1 January 2018 have lowered the
provisioning coverage ratio and resulted in the
recognition of new non-performing loans. While
the later factor is clearly a one-off, slowing sales,
if sustained, raises concerns that the
non-performing loan ratio may remain moderately
high for an extended period.
Graph 4.2.4: Evolution of NPL flows
Local NPL definition is used.
* June 2018.
Source: Croatian National Bank.
The impact of the Agrokor crisis on the
banking system appears to be contained for the
moment. In particular, most of the non-performing
loans arising from Agrokor’s difficulties in paying
its creditors and suppliers have been incorporated
in 2017 results. A settlement was agreed in July
2018 by the firm’s largest creditors, representing
nearly 80 % of the outstanding debt. On 26
October 2018, the Croatian High Commercial
Court dismissed all of the appeals lodged by
several of the remaining debtholders, effectively
removing the final obstacle to implementation of
the deal. The settlement involves a debt-to-equity
swap applicable to most of the firm’s outstanding
debt, and corresponding write-offs to ensure that
the firm remains solvent. This has not resulted in a
significant rise in non-performing loans, since
0
20
40
60
80
09 10 11 12 13 14 15 16 17 18
% of loans
Coverage ratio NPLs: Households
NPLs: NFCs NPLs: All
-12,000
-8,000
-4,000
0
4,000
8,000
12,000
10 11 12 13 14 15 16 17 18*
HRK mln.
NPL salesOther NPL flowsChange in NPLs from prior period
4.2. Private sector debt and financial sector*
35
most banks had already provisioned for such
losses. However, the refinancing of Agrokor’s
remaining debt, which was issued after the Law on
Emergency Administration in Companies of
Systemic Importance for the Republic of Croatia in
April 2017, nevertheless remains a concern.
The interest rate exposure of households
remains high, but continues to subside as
fixed-rate loans become increasingly common.
The share of loans with fixed rates is increasing.
At end-2017, 39 % of outstanding loans granted to
households were loans with fixed interest rates, up
from 25 % 3 years ago. This is in line with
recommendations published by the Croatian
National Bank in October 2017 to mitigate the
exposures of consumers to interest rate risk by
offering them the possibility to switch to fixed-rate
loans. The wider use of fixed-rate loans, however,
has shifted the interest rate risk to banks. Some
banks are hedging against potential losses from
higher interest rates. However, interest rate
hedging derivatives in kuna remain scarce and
costly.
Banks are exposed to indirect credit risk,
stemming from the significant currency
mismatches in the private sector balance sheets.
While the earnings of most households are in kuna,
in June 2018 nearly half (49 %) of their
outstanding loans was either in a foreign currency
or indexed to a foreign currency, mostly euro.
Households do have significant foreign currency
deposits, representing two-thirds of the total,
which, if matched, could lower risks. However,
foreign currency deposits have been declining;
down from 75 % at end-2014, sight kuna deposits
have become increasingly popular as a result of
lower interest rates on term and savings accounts.
In turn, the open financial positions of
non-financial corporations are quite large, with
non-kuna loans and deposits amounting to 67 %
and 36 %, respectively.
The Croatian Bank for Reconstruction and
Development is taking a number of measures to
implement recommendations from the 2017
Asset Quality Review
(PricewaterhouseCoopers, 2017) exercise, but
there are no immediate plans to address
deficiencies in its supervisory framework. The
management of the Croatian Bank for
Reconstruction and Development is currently
implementing some of the issues identified as
operational inefficiencies during last year’s ‘asset
quality review’ exercise. Along these lines, the
Croatian Bank for Reconstruction and
Development has taken a number of measures to
improve its core IT system, implement
International Financial Reporting Standard 9 and
the European Banking Authority guidelines on
non-performing loans, and introduce a new credit
risk management procedures, including collateral
valuation. The ongoing project, which was kicked
off in early October 2018, also aims to help
produce a mid-term strategy and ensure that the
institution has tools to identify market gaps and
prevent any competition with commercial
institutions. Despite these developments,
authorities have not yet engaged in any concrete
plan to subject the Croatian Bank for
Reconstruction and Development to prudential
supervision.
The conversion of CHF-loans remains subject
to legal challenges. Following Croatia's Supreme
Court ruling in October 2017, the High
Commercial Court upheld in July 2018 the ruling
on the legal nullity of: (i) unilateral interest rate
increases, and (ii) the foreign currency clause in
the case of the Swiss franc-indexed loans.
Questions arise as to how lower-instance courts
will interpret the ruling. For example, it is not clear
whether it applies only to non-converted Swiss
franc-indexed loans or more broadly. Moreover, it
is not clear whether the decision covers only the
outstanding or also the paid out loans. These
sources of uncertainty may affect the operating
environment for banks.

36
4.3.1. LABOUR MARKET DEVELOPMENTS
The labour market has further improved with a
rapid fall of the unemployment rate. On the
back of solid GDP growth, the unemployment rate
in Croatia fell further over the past year – to 7.8 %
in Q4 2018 – almost reaching its pre-crisis level. In
2018, long-term unemployment dropped compared
to the previous year, reaching 3.3 % in Q3 2018.
The youth unemployment rate and the share of
young people (aged 15-24 years) not in
employment, education or training also decreased
considerably, but remain high (at 22.7 % in Q4
2018 and 15.4 % in 2017, respectively). Overall,
despite the recent positive developments, Croatia
still displays high unemployment rates relative to
the EU average, especially for young people.
Graph 4.3.1: Activity rate by age and educational
attainment level, 2017
Low reliability of data for low-skilled between the ages 20-29
in Croatia.
Source: Eurostat.
Activity and employment rates in Croatia
remain low, especially for certain groups. In
2017, the overall activity and employment rates
(for people aged 20-64 years) were at 71.2 % and
63.6 % (64.9 % in Q3 2018), respectively, well
below the corresponding EU averages of 78.0 %
and 72.1 % (73.2 % in Q3 2018). Labour market
participation is low among both men and women,
with a gender activity gap of 10.6 percentage
points in 2017, which is still below the EU average
(12.1 percentage points). High-skilled workers are
more active in the labour market than on average
in the EU. By contrast, at 43.4 % in 2017, the
activity rate of low-skilled workers is one of the
lowest in the EU and has even declined over the
period 2014-2017. Low-skilled workers have
significantly lower participation rates than medium
and high-skilled workers across all age groups.
Among medium skilled workers, those aged over
40 years display much lower activity rates
compared to the EU average. Since the medium
skilled represent a much larger share of the
working-age population than on average in the EU,
this largely drives the overall lower activity rate in
Croatia, as well as the much lower activity rate of
older workers (55-64), which remains at 43.6 %
(compared to an EU average of 60.6 %), despite
some improvement in recent years. There are also
marked differences in employment rates of the
low-skilled as compared to medium- and high-
skilled, and this gap keeps increasing (21
) (see
Graph 4.3.3).
Graph 4.3.2: Reasons for inactivity by age and sex, 2016
Source: LFS, own calculations.
Early labour market exits and care
responsibilities play an important role for
inactivity. According to Labour Force Survey data
on self-declared reasons for not seeking work, the
main reason for low activity of older inactive
people (55-64 years) in 2016 was early retirement
(see Graph 4.3.2). For older women, personal,
family or care responsibilities also played a role
(22 %). Disability or illness is a frequent reason
across all age groups for both sexes, while
(21) The employment rate of low-skilled was at 34.7 % in 2017
significantly lower than the employment rates of medium-
(64.1 %) and in particular high-skilled persons (81.5 %).
0
10
20
30
40
50
60
70
80
90
100
20-24 25-29 30-34 35-39 40-44 45-49 50-54 50-54 60-64
EU28 Low EU28 Medium EU28 High
HR Low* HR Medium HR High
%
0
20
40
60
80
100
M. W. M. W. M. W. M. W.
25-34 35-44 45-54 55-64
Other Disability or illness
Perso., fam. or care resp. Education
Retirement Discouraged
%
4.3. LABOUR MARKET, EDUCATION AND SOCIAL POLICIES*

4.3. Labour market, education and social policies*
37
personal, family or care responsibilities are the
main reason for inactivity of women in the age
group 25-54. At 35 %, the employment rate of
people with disabilities is well below EU average
(48.1 %).
Graph 4.3.3: Relative dispersion of employment rates of
different skills groups in EU
(1) Annual indicator based on the average of four quarters.
(2) The relative dispersion of employment rates is equal to
the ratio of the absolute dispersion and the overall
employment rate. The absolute dispersion of employment
rates is measured as the sum of the differences of
employment rates for each skill group from the overall
employment rate, weighted by the size of each group.
Source: Eurostat, own calculations.
Undeclared work absorbs part of the labour
input. Estimates of the size of the shadow
economy in Croatia vary across studies (22
). A
substantial share of the shadow economy is related
to a rather large incidence of undeclared work,
which refers to wages that workers and businesses
do not declare to avoid taxes and social
contributions or labour market regulation.
Undeclared work not only negatively affects
government revenues (in terms of uncollected
taxes and social contributions) and businesses by
affecting the level playing field, but also
individuals through breaches of workers’ rights (23
)
(22) According to Stefanov et al. (2017), the shadow economy
accounted to 27.7 % of GDP in 2015, the third highest
share in the EU. Medina and Schneider (2018) estimate the shadow economy to account for between 17.2 % and
26.5 % of GDP in 2017, the second highest share among EU members.
(23) 61 % of employees receiving envelope wages in 2015 were
asked to accept additional work conditions to those stated in the written contract or terms of employment, such as
longer working hours (34 %), additional tasks (27 %) and
(Williams and Horodnić, 2017). It ranges from
work with partly undeclared pay (envelope wages
(24
)) to fully undeclared employment. Despite
efforts by the authorities to address the issue (25
),
in the private sector undeclared work accounted
for 14.2 % of total labour input in 2013, of which
66 % referred to employees and 34 % to the self–
employed (Williams and Horodnić, 2017).
Graph 4.3.4: Share of employers reporting labour shortages
as the main factor limiting their activity by
sector
Source: European Business and Consumer Survey, European
Commission.
Employers increasingly report labour
shortages, despite the still relatively high
unemployment rate. The share of employers
reporting labour shortages as a major factor
constraining their production has increased
substantially (European Business and Consumer
Survey). In 2017, this share was 16.9 %, compared
to only 1.9 % in 2013, but it is broadly in line with
the EU average of 16.8 % (in 2017) (26
). Over the
same period, the number of vacancies recorded by
underutilisation of statutory entitlement to annual leave
(19 %). (24) In Croatia, in 2015 at least 6.6 % of declared employees
received an additional undeclared ('envelope') wage from their formal employer. The officially declared wage of
nearly half of these workers was the minimum wage
(Stefanov et al. 2017). (25) Targeted incentives to register employees, seasonal work
vouchers, awareness-raising campaigns on the harmful effects of undeclared work on the economy and
simplification of registration procedures (European
Commission, 2016e; Williams et al. 2017b). (26) Average of three sectors (industry, construction and
services sector), weighted by their share in employment.
0.00
0.05
0.10
0.15
0.20
0.25
0.30
PT
NL
DK
EE
AT
DE
LV
CZ SI
FI
SE
CY
LU
EL
MT
ES
RO
PL
HU
LT
FR
SK IE IT
BG
HR
BE
2017 2010 2014
0
10
20
30
40
50
13 14 15 16 17 18
Industry Construction Services
% of employers

4.3. Labour market, education and social policies*
38
the Croatian Employment Service also increased
substantially, from 143 000 to more than 250 000.
As illustrated by Graph 4.3.4, labour shortages are
most pronounced in the construction sector and in
industry. Within services, evidence points at
shortages in tourism and IT.
Graph 4.3.5: Evolution (% change) of the population by
municipalities, 2012-2017
The population estimates are based on administrative data.
Source: Croatian Bureau of Statistics, own calculations
Various factors contribute to the increase of
labour shortages. The increased labour demand
induced by the pickup in economic activity is not
matched by labour force growth, also due to
combined effects of ageing and emigration. Skills
gaps also appear to be an important driver of the
shortages. Finally, low job quality may also play a
role in discouraging labour supply. Indeed, Croatia
has the highest share of employees in the EU with
a contract not exceeding a duration of three months
(7.1 % vs EU28: 2.3 % in 2017), likely reflecting
also the relevance of the (very seasonal) tourism
sector in the economy. The emerging labour
shortages are expected to contribute to upward
pressure on wages (see Chapter 1). Addressing
these challenges calls for prioritising investment
aimed at improving access to employment for all
jobseekers and to anticipate skills needs.
Increasing emigration flows contribute to the
challenges in the labour market. The negative
net migration flows over the last decade (see
Graph 4.3.6) have become more pronounced after
Croatia's accession to the EU in 2013, as it
happened for other Central and Eastern European
Countries in the early 2000s. This phenomenon
appears to affect the country unevenly (see Graph
4.3.5). Between 2012 and 2017, most counties
recorded negative population change, presumably
also as a result of emigration. Some parts of inland
Croatia and the eastern counties lost 25 % or more
of their resident population. By contrast, some
municipalities from the coastal counties and the
city of Zagreb recorded an increase in their
population. Labour Force Survey data show that in
2017 Croatians living abroad had a higher
employment rate than Croatian residents (79.8 %
and 63.6 %, respectively); they also had a lower
share of tertiary educational attainment (17.4 %
and 22.4 % respectively), which is not a common
feature among migrants from other Member States.
A combination of factors influences mobility
flows, including differences in per capita income
levels, quality of institutions, and employment
prospects (Atoyan and al. 2016). In addition,
Croatia has one of the highest shares of its working
age population (20-64) living in another EU
Member State (14 % vs 3.8 % average of EU
Member States, in 2017), which may also play as a
pull factor. The migration outflows clearly
contribute to, and are set to aggravate if they
continue, the emerging labour shortages discussed
in the paragraphs above. While there is awareness
at political level of the challenges posed by the
current migration trends and demographic
developments, a coordinated policy response is
still missing, with current measures mostly focused
towards improving the situation of young families
and their children.
Concerns remain on the efficiency of active
labour market policy measures in reaching
vulnerable groups. In 2016, the coverage of
active labour market policies remained low, at just
7 % of persons wanting to work. Similarly, the
coverage of unemployed youth remains very low
and worsened in 2017, when the share of people
not in employment, education or training (aged
under 25 years) supported by the Croatian Youth
Guarantee scheme declined to 45 %, 9 percentage
points less than the previous year. The 2018
package of active labour market policies
introduced a number of improvements, including
increased subsidies for employment and self-
employment and simplifications in procurement
procedures for the provision of education and
training. Access to "occupational training for work
without commencing employment", originally
designed for young people aged 18-29 years, has

4.3. Labour market, education and social policies*
39
been extended to people aged 30+ without work
experience targeting occupations in social care,
education, health and culture. Overall, however,
some of the most used measures (such as public
works), as well as the underutilised
reskilling/upskilling measures, have not yet proven
to significantly increase the employability of their
participants, which may indicate lack of efficient
targeting (27
) (Munta, 2018). The capacity of the
Croatian Employment Service to provide adequate
assistance to vulnerable groups remains limited
(28
). There is no structured cooperation between
employment and social services in the provision of
integrated support. Further support to active labour
market policy measures and investments in
modernising labour market institutions have a
potential to improve access to employment for
vulnerable groups.
While showing signs of improvement, the
impact of social dialogue on policy preparation
and implementation exhibits weaknesses. Social
dialogue within the framework of the National
Economic and Social Council is an established and
gradually developing practice. However, it appears
of mostly formalistic nature, with low impact of
social partners on design and implementation of
legislative proposals (Eurofound, 2018). Not all
relevant regulations and policies are included in
the work plan of this Council and social partners
are sometimes excluded from working groups on
topics of interest (e.g. legislation on student
employment). The fragmentation of trade unions
also poses a challenge and limits their capacity to
engage efficiently in social dialogue.
(27) For example, in 2017 public works, which are primarily
intended for the low-skilled and the long term unemployed, saw increased participation by medium skilled unemployed
persons and by people with shorter unemployment spells. (28) Croatia has one of the highest rates of registration and
utilization of job searching services offered by the Public
Employment Service (PES). Still, the percentage of total PES staff directly servicing clients is low (at 64 %). Next
to that, there are large regional disparities in the capacity of local PES offices and quality of services offered by them.
Graph 4.3.6: Population migration
The migrations are registered at local level. Emigrants
include persons who left permanently the country or who
were absent for more than one year from their permanent
residence and who reported their absence. However,
based on data collected in the main recipient countries, it
appears that the figures provided by the CBS probably
underrepresent the actual migration numbers, even taking
into account the differences between nationality and
country of previous residence.
Source: Croatian Bureau of Statistics, own calculations.
4.3.2. SOCIAL PROTECTION SYSTEM
The proportion of the population at-risk-of
poverty or social exclusion is declining, but
remains above the EU average. In 2017, it stood
at 26.4 %, compared to 22.5 % in the EU,
following improvements in the two sub-indicators
on severe material deprivation and people working
in low work intensity households (see Graph
4.3.7). The poverty gap (29
) and the persistent at-
risk-of poverty rate (30
) remain steadily high (in
2016, at 30.7 % and 14.5 %, respectively). The
capacity of social transfers (other than pensions) to
reduce poverty decreased from 35.5 % in 2015 to
24.8 % in 2017. As labour market conditions
improved, household incomes and their relative
poverty threshold increased, whereas social
benefits remained largely unchanged over the
period. Government spending on social protection
amounted to 15.3 % of GDP in 2015 (EU average:
(29) The poverty gap measures 'how poor' the poor actually are.
It is calculated as the difference between the median
equalized disposable income of people below the at-risk-of-poverty threshold and the at-risk-of-poverty threshold.
(30) Share of people who are currently poor and were poor also
two out of the three previous years.
-50000
-40000
-30000
-20000
-10000
0
10000
20000
08 09 10 11 12 13 14 15 16 17
Immigrants Emigrants Net migration
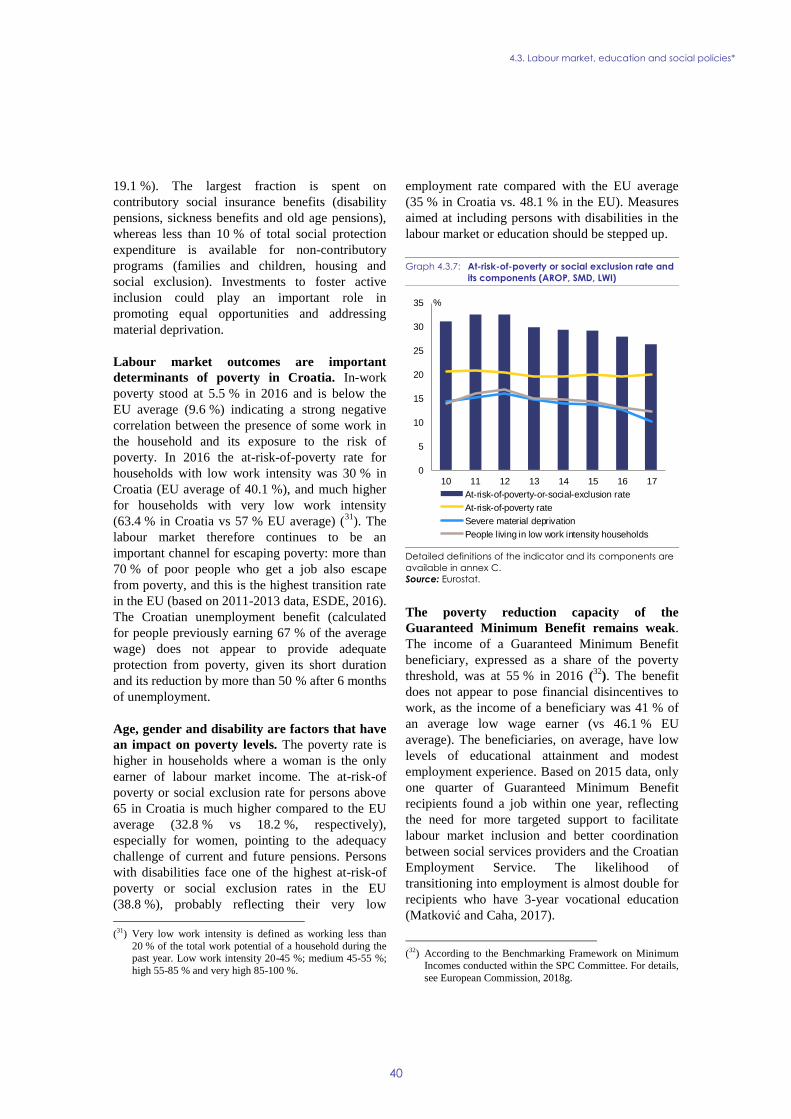
4.3. Labour market, education and social policies*
40
19.1 %). The largest fraction is spent on
contributory social insurance benefits (disability
pensions, sickness benefits and old age pensions),
whereas less than 10 % of total social protection
expenditure is available for non-contributory
programs (families and children, housing and
social exclusion). Investments to foster active
inclusion could play an important role in
promoting equal opportunities and addressing
material deprivation.
Labour market outcomes are important
determinants of poverty in Croatia. In-work
poverty stood at 5.5 % in 2016 and is below the
EU average (9.6 %) indicating a strong negative
correlation between the presence of some work in
the household and its exposure to the risk of
poverty. In 2016 the at-risk-of-poverty rate for
households with low work intensity was 30 % in
Croatia (EU average of 40.1 %), and much higher
for households with very low work intensity
(63.4 % in Croatia vs 57 % EU average) (31
). The
labour market therefore continues to be an
important channel for escaping poverty: more than
70 % of poor people who get a job also escape
from poverty, and this is the highest transition rate
in the EU (based on 2011-2013 data, ESDE, 2016).
The Croatian unemployment benefit (calculated
for people previously earning 67 % of the average
wage) does not appear to provide adequate
protection from poverty, given its short duration
and its reduction by more than 50 % after 6 months
of unemployment.
Age, gender and disability are factors that have
an impact on poverty levels. The poverty rate is
higher in households where a woman is the only
earner of labour market income. The at-risk-of
poverty or social exclusion rate for persons above
65 in Croatia is much higher compared to the EU
average (32.8 % vs 18.2 %, respectively),
especially for women, pointing to the adequacy
challenge of current and future pensions. Persons
with disabilities face one of the highest at-risk-of
poverty or social exclusion rates in the EU
(38.8 %), probably reflecting their very low
(31) Very low work intensity is defined as working less than
20 % of the total work potential of a household during the past year. Low work intensity 20-45 %; medium 45-55 %;
high 55-85 % and very high 85-100 %.
employment rate compared with the EU average
(35 % in Croatia vs. 48.1 % in the EU). Measures
aimed at including persons with disabilities in the
labour market or education should be stepped up.
Graph 4.3.7: At-risk-of-poverty or social exclusion rate and
its components (AROP, SMD, LWI)
Detailed definitions of the indicator and its components are
available in annex C.
Source: Eurostat.
The poverty reduction capacity of the
Guaranteed Minimum Benefit remains weak.
The income of a Guaranteed Minimum Benefit
beneficiary, expressed as a share of the poverty
threshold, was at 55 % in 2016 (32
). The benefit
does not appear to pose financial disincentives to
work, as the income of a beneficiary was 41 % of
an average low wage earner (vs 46.1 % EU
average). The beneficiaries, on average, have low
levels of educational attainment and modest
employment experience. Based on 2015 data, only
one quarter of Guaranteed Minimum Benefit
recipients found a job within one year, reflecting
the need for more targeted support to facilitate
labour market inclusion and better coordination
between social services providers and the Croatian
Employment Service. The likelihood of
transitioning into employment is almost double for
recipients who have 3-year vocational education
(Matković and Caha, 2017).
(32) According to the Benchmarking Framework on Minimum
Incomes conducted within the SPC Committee. For details,
see European Commission, 2018g.
0
5
10
15
20
25
30
35
10 11 12 13 14 15 16 17
At-risk-of-poverty-or-social-exclusion rate
At-risk-of-poverty rate
Severe material deprivation
People living in low work intensity households
%

4.3. Labour market, education and social policies*
41
Box 4.3.1: Monitoring performance in light of the European Pillar of Social Rights
The European Pillar of Social Rights is designed as a compass for a renewed process of upward convergence
towards better working and living conditions in the European Union (1) . It sets out twenty essential principles
and rights in the areas of equal opportunities and access to the labour market; fair working conditions; and
social protection and inclusion.
Croatia faces several challenges with regards
to a number of indicators of the Social
Scoreboard supporting the European Pillar of
Social Rights. Despite improvements in the
labour market as reflected by a decreasing (long-
term) unemployment rate, challenges related to
equal opportunities, access to the labour market
and social protection and inclusion remain. The
employment rate is still critically low, in
particular for youth, older workers, low skilled
and people with disabilities. This reflects the
widespread use of early retirement and challenges
regarding the efficiency of active labour market
policies. Although the share of early school
leavers in Croatia is well below the EU average,
challenges remain with regard to the quality of
education, both for young people and adults.
While improving, the share of people at-risk-of
poverty or social exclusion is still above the EU
average, partly related to the limited poverty
reduction capacity of social benefits.
Although improving, the rate of young people
(15-24) not in employment, education or
training (NEET) remains very high. The share
of NEETs increased between 2014 and 2017,
further distancing this population from the labour
market. The majority of NEETs in Croatia have
secondary education, in particular from vocational
schools. There is no national tracking system for
VET graduates which could help analyse the
performance of new graduates in the labour
market, identify skills needed and ultimately help
improving the quality and labour market
relevance of VET programmes. The introduction
of such system, together with the already established Career Guidance Centres (CISOK centres) and the local
level youth organizations would allow designing prevention activities and targeting specific interventions.
The implementation of the curricular reform takes first steps with the pilot initiative School for Life in
the year 2018/2019. The experimental implementation of the curricular reform was launched in March 2018
with the selection of 74 pilot schools (around 6 % of all schools in Croatia). During the pilot period, Croatia
will invest around EUR 25 million in school equipment upgrades, part of which comes from EU funds, and
the reform rollout will include new textbooks to be delivered in both paper and digital format. The new
curricula, developed through a comprehensive drafting and assessment process, adopt the 'learning outcomes
approach', which shifts the classroom focus to the pupils’ experience.
(1) The European Pillar of Social Rights was proclaimed on 17 November 2017 by the European Parliament, the Council
and the European Commission: https://ec.europa.eu/commission/priorities/deeper-and-fairer-economic-and-monetary-union/european-pillar-social-rights/european-pillar-social-rights-20-principles_en

4.3. Labour market, education and social policies*
42
The authorities have taken steps to categorise
social benefits provided at the local level. Social
protection expenditure of sub-central government
units, at local and county level, accounted for less
than 0.9 % of GDP in 2017. However, there are
large differences in per capita social spending
across counties, reflecting different fiscal
capacities of the local government units. Around
60 % of total expenditure was allocated to finance
pre-school education, whereas less than 20 % was
spent on cash or means-tested benefits. The
authorities are aligning the classification of data on
social benefits at the local level with the
nomenclature of the European System of
integrated Social Protection Statistics. This would
result in an improved information flow and more
efficient monitoring of the benefits administered at
the local and the central level, in turn allowing a
more efficient distribution of funds and better
targeted social policies.
The move from a model based on institutional
care to one relying on support for family- and
community-based care for children who cannot
stay with their families and the disabled faces
challenges. In 2017, there was an increase in the
number of children deprived of a family
environment or with families in socio-economic
hardship who were living in residential care
institutions, as the number of adoptions
decreased (33
). The newly adopted Act on Foster
Care is expected to improve the situation. Some
progress has been made in the
deinstitutionalisation of adults, including of those
with disabilities. However, relevant legislative
initiatives such as the Family Act and the Act on
Social Welfare have not yet been adopted. The
main concerns with respect to the
deinstitutionalisation process relate to the co-
operation between health, education and social
services (in particular at the local government
level) and the long-term sustainability of
community-based care services, which require a
more efficient funding model. Further challenges
(33) This refers also to the age category below 3, despite the
law stating that children below the age of 3 should be placed in institutions only exceptionally and for the
shortest period of time. The average duration of placement for children lasts four years.
relate to establishing a systematic approach to
deinstitutionalisation, rather than implementing
individual projects, and to the need for increased
investments.
The Croatian pension system faces a significant
adequacy challenge, partly addressed by the
recent pension system reform. According to the
Croatian Pension Insurance Institute, the ratio of
contributing workers to pension beneficiaries was
very low, at 1.2 in August 2018. This reflects the
unfavourable demographic trends (ageing and
emigration) as well as the existence of many
pathways to early retirement (34
). Around 41 % of
pensioners have less than 30 years of service,
whereas less than 15 % of them in 2016 received a
pension based on 40 or more qualifying years. The
benefit ratio (average pension as a share of the
average wage) is set to decline from 32 % in 2016
to 22 % in 2070 (European Commission, 2017h).
Moreover, in 2017, the aggregate replacement ratio
(35
) stood at 41 %, one of the lowest in the EU.
This results in a significant drop in pensioners'
living standards upon retirement, as reflected in a
high risk of poverty or social exclusion. The net
theoretical replacement rate of pensions is
expected to further decrease by 2056 (36
). For an
average earner with as many as 40 years of
contributions, their rate will have fallen by 16.4 pp
(from 56.6 %). Two additional working years
would increase the theoretical replacement rate by
1.6 percentage points. Therefore, an increase in
retirement age and career length results in higher
pension entitlements. The pension system reform
adopted in December 2018, among other
objectives, aims at increasing the length of
working lives – see Box 4.3.2.
(34) Employment rate of older workers (55-64) at 40.3 % in
2017 is far below the EU average of 57.1 %. (35) The ratio of income from pensions of persons aged
between 65 and 74 years and income from work of persons aged between 50 and 59 years.
(36) Theoretical replacement rates are calculated as the level of
pension income in the first year after retirement as a percentage of individual earnings at the moment of take-up
of pensions. For further details, see European Commission, 2018m.

4.3. Labour market, education and social policies*
43
Box 4.3.2: The 2018 Pension System Reform
In December 2018, the parliament adopted an important package of pension system reforms
that entered into force in 2019. The purpose of the reforms is multifaceted and can be
summarised in three main objectives: first, addressing structural design inconsistencies, which
resulted in an unfair treatment of certain cohorts of pensioners; second, improving pension system
adequacy through longer working lives; and third, strengthening the institutional setup and
performance of the 2nd
pillar. On the first objective, the government proposes to extend the 27 %
supplement of the pension entitlement (that is currently paid out to individuals receiving a pension
from the 1st pillar only) to all pensioners in a proportional way (
1), while retaining the possibility
for all to opt-out of the 2nd
pillar and shift savings to the 1st pillar at retirement. The aim of the
authorities was to find an equitable solution that would avoid severely undermining the 2nd
pillar.
According to government's estimates, mainly low-wage earners would find it convenient to move
back to the 1st pillar, as well as workers that have a short contributory period under the 2
nd pillar.
The authorities also plan to increase the minimum pension by 3.13 % from mid-2019, and enable
the accumulation of a supplementary contribution period of six months per child for the
calculation of the pension entitlement of the parent. On the second objective, the reform proposal
includes: (i) accelerating the planned increase in the statutory retirement age to 67, bringing it
forward from 2038 to 2033; (ii) accelerating the equalisation of retirement age for men and
women, brought forward to year 2027; (iii) increasing penalties for early-retirement and bonuses
for deferred retirement, while retaining the relatively large gap of five years between early and
statutory retirement age; (v) widening the possibility to work part-time while receiving a pension;
and (vi) streamlining the list of arduous and hazardous professions benefitting from more
favourable pension entitlements, while preserving a number of special pension schemes (e.g. for
military personnel and police).
A dedicated set of measures addresses the design of the compulsory funded 2nd
pillar. The
measures aim at increasing the efficiency and performance of the compulsory funded 2nd
pillar, as
well as the voluntary 3rd
pillar. The legislative acts introduce more stringent rules to tackle
potential conflict of interest arising in the private funds and lower caps on membership
management fees paid by 2nd
pillar members. The amended Acts also modify some of the
investment rules, introducing a new investment category, which allows pension funds to invest in
infrastructural projects in Croatia within prescribed limits. Furthermore, all 2nd
pillar members can
choose the risk profile of their pension fund (2), though a new default option is foreseen for those
who do not express their choice upon first employment. The amended Acts enable the Croatian
Pension Insurance Institute to establish a public pension insurance company that would be in
charge of the payout of annuities from the 2nd
and 3rd
pillar. On pension insurance companies, the
proposed legislation also introduces new governance rules for cross-border transactions and for
managers (in terms of fitness and probity), new requirements in terms of capital shares and
technical reserves, a cap on certain administrative costs and the obligation for the insurance
companies to adjust the annuity payments to the consumer inflation rate twice a year. The new
legislation allows life insurance companies to pay-out 3rd
pillar annuities (under certain conditions
of compliance with the relevant legislative rules). Furthermore, among other measures, 2nd
pillar
pensioners can request a lump-sum payment of 15 % of their 2nd
pillar savings upon retirement,
provided their pension is at least 15 % higher than the 1st pillar minimum pension.
(1) Pensioners covered by both the 1st and 2nd pillar would receive a supplement 27 % for the contribution period until December 2001 and a supplement of 20.25 % for the years after 2002 when they started paying also into the 2nd pillar.
For an explanation of how the 27 % supplement in the current system works, see European Commission 2018e and 2018f.
(2) Under the 2nd pillar, pension funds in Croatia are required to offer three different funds knowns as A, B and C
categories. They differ by their investment and risk profile with A-funds having the highest risk level and C-funds the lowest.

4.3. Labour market, education and social policies*
44
4.3.3. EDUCATION, TRAINING AND SKILLS
There are pronounced systemic regional
differences in the coverage of early childhood
education and care in Croatia. In the period
between 2014 and 2016, 7.2 % of all kindergarten-
aged children in Croatia lived in municipalities
that did not have a kindergarten programme, and
this was the case for 17.4 % of all nursery-aged
children (Dobrotić et al. 2018). In 2016, formal
childcare enrolment in Croatia for the 0-3 age
group stood at 15.6 %, one of the lowest in the EU
(29.9 % EU average), and for children 4-6 years
old it was 75.1 % (EU average of 95.5 %). Croatia
has earmarked investments in the area of early
childhood education and care from both national
and EU funds. Yet, the challenge will be to ensure
a lasting effect of these investments, particularly in
areas that do not have sufficient resources to
provide early childhood education and care to all
children in need. Given the current trends, in the
absence of a review of the early childhood
education and care funding model, Croatia is likely
to remain below the 95 % Education and Training
2020 benchmark (37
).
Educational attainment in Croatia is influenced
by socio-economic differences as well as by
disabilities. The variation in scores in science of
Croatian 15-year-olds, by the educational
background of parents, was relatively limited,
according to the OECD’s Programme for
International Student Assessment. However, a
number of other indicators show a significant link
between the socio-economic status and educational
attainment (European Commission, 2018h). In the
assessment, the share of pupils who had
participated in early childhood education and care
is 20 pp. lower for families with low education
levels compared to that of families with at least
one highly-educated parent (the gap at the EU
average is 7 pp) (European
Commission/EACEA/Eurydice/Eurostat, 2014).
The gap between the at-risk-of-poverty or social
(37) Kindergarten costs account for, on average, more than
80 % of the expenditures under the relevant function in cities and municipalities. However, there are significant
differences in kindergarten expenditures, particularly among municipalities from developed and less developed
counties. In the most developed counties, municipalities
spend more than 90 % of their Family/Children expenditures on kindergartens, while this share drops to
less than 30 % in municipalities from the poorest counties.
exclusion rate for children by educational
attainment of their parents, at 70.9 pp. in 2016, is
one of the highest in the EU, indicating substantial
inequality of opportunity (38
). The early school
leavers' gap between people with and without
disabilities remains higher than the EU average
(15.7 %. vs the EU average of 12.6 %). In higher
education, students from better-educated family
backgrounds tend to be overrepresented in the
student population (Doolan et al. 2018). However,
the number of students with lower socio-economic
status has increased and measures to increase it
further have been outlined for 2019-21 in
‘National Plan for Promoting the Social
Dimension in Higher Education adopted by the
Government on 3 January 2019. Further funding of
e.g. scholarships, transportation or infrastructure
for tertiary education would support access that is
more equal. Additional investments would be
required, in particular for vulnerable groups and in
less developed areas to ensure equal access to and
provision of quality education at all levels.
The implementation of the curricular reform
has been launched in the form of a pilot project.
In order to increase the overall quality of education
and teaching, a set of reformed general education
curricula have been introduced in 74 schools in
Croatia as part of the pilot project ‘School for
Life’, and 36,000 teachers have already received
online and face-to-face training. The results of the
pilot phase are monitored and evaluated on the
‘School for Life’ website and the national rollout
of the reform is planned for autumn 2019.
Investing in teachers’ training and increasing the
attractiveness of the profession is needed to ensure
their engagement in planned school reforms, and
especially to enable the necessary increase of
teaching staff where needed. In terms of digital
skills, Croatia ranks as one of the lowest in the EU.
Despite recent improvements and government
initiatives (39
), further efforts will be needed in this
area.
(38) The gap is calculated as the percentage point difference
between the AROPE for children of low-skilled parents (less than primary, primary and lower secondary education)
and of children whose parents are high-skilled (have tertiary education). This calculation is affected also by the
employment levels of parents, which are lower for the low-
skilled. (39) According to LFS data, the proportion of ICT specialists in
total employment remained stable at 3.3 % in 2017 after having increased from 2.7 % in 2015. The share of

4.3. Labour market, education and social policies*
45
Fragmentation and lack of transparency hinder
the efficiency of the tertiary education system.
Croatia has among the highest numbers of tertiary
education institutions per capita in the EU
(European Commission/EACEA/Eurydice, 2018).
Despite the efforts made through the Croatian
Qualifications Framework, the link between labour
market needs and tertiary education enrolment
remains weak. The legal framework that regulates
admissions grants autonomy to universities, which
have an incentive to keep enrolment quotas high
because of tuition fees revenues. In addition,
faculties and universities have no obligation to
report the use of their budgets beyond what is
needed for national accounts reporting, which
reduces the capacity of the government to target
investments in tertiary education and reduces the
systems’ efficiency, despite the efforts made
through the performance agreements and
scholarship schemes.
Vocational education and training is not aligned
with labour market needs. In 2016, the share of
vocational education and training students at upper
secondary level remained stable at 70 %, 20 pp.
above the EU average. However, the employment
rate of vocational education and training graduates
decreased from 70.3 % in 2016 to 59.4 % in 2017
(despite an overall improvement of the labour
market in this period), pointing to the need of
modernising the vocational education and training
sector in Croatia. In 2016, the percentage of
students undertaking programs, which included
work based learning was at 27.3 %, in comparison
to the 43.8 % EU average. Amendments to the
Vocational Education and Training Act were
adopted in March 2018. They introduced a new
national framework for Vocational Education and
Training curricula, foreseeing the National
curriculum for vocational education and training,
adopted in July 2018, the development of modular
and outcome-based sectorial curricula and greater
autonomy for vocational education and training
schools in the design of school-level curricula. The
establishment of 25 sectoral councils is supporting
the implementation of the Croatian Qualifications
Framework. In particular, stepping up the adoption
graduates in Science, Technology, Engineering and Mathematics (STEM) in the 20-29 years old cohort went
up, (17.1 graduates per 1000 individuals (CBS, 2016),
compared to EU average of 19.1 (2015)). To improve further, Croatia plans to offer 17 000 STEM scholarships
by the end of 2021.
of occupation and qualification standards should
lead to the creation of new programmes better
aligned with labour market needs.
Reform efforts in vocational education and
training include the establishment of regional
competences centres and a pilot project of dual
vocational education and training. In May 2018,
the authorities established a national Network of
Regional Centres of Competences in vocational
education and training. Their objective is to
designate places of excellence that will offer
regular vocational education and training
programmes, but also lifelong learning and other
forms of formal and non-formal education.
Following adoption of the Network, in July 2018,
25 vocational education and training schools were
appointed to the Regional Centres of Competences
(40
). A strong cooperation with vocational
education and training schools from the regular
network and employers at the local level will be
important to ensure the long-term sustainability of
the centres. In addition, the authorities have also
presented a new model for the Croatian dual
education and an experimental programme called
"Dual Education in VET". The programme is to be
delivered in 11 vocational education and training
schools across Croatia and aims at addressing
challenges related to inadequate practical training
and insufficient attention to entrepreneurial
competences.
Challenges related to the quality and access to
adult education have not been addressed.
Croatia performs below the EU average within the
benchmarking framework on adult skills and
learning. The participation rate in adult education
is steadily decreasing, at 2.3 % in 2017, compared
to the EU average of 10.9 %. In particular, there
are extremely low participation rates for those
most in need of additional education, such as low-
qualified (0.6 %) and unemployed persons (1.5 %).
In line with the objectives of the EU Council
Recommendation on Upskilling Pathways, there is
a need in Croatia to establish a framework for the
assessment, provision and validation of skills
aligned with labour market needs, including a clear
re-definition of responsibilities across public
(40) They will cover the following sectors / sub-sectors Tourism
and Hospitality, Mechanical Engineering, Electrical Engineering and Computing, Agriculture and Health, the
aim being to achieve a balance between regional presence and high levels of quality.

4.3. Labour market, education and social policies*
46
institutions. However, the adoption of the Adult
Education Act, aimed at addressing some of these
challenges, has been further postponed. It is
foreseen for the Act to regulate the self-assessment
and external evaluation of adult education
institutions, the professional licensing system for
teaching staff, the development of adult education
programmes (in line with the Croatian
Qualifications Framework), and non-formal and
informal learning programmes.
4.3.4. INVESTMENT NEEDS
Increased investment in skills, education and
training, aimed at promoting employability and
social inclusion are important for raising
Croatia’s productivity and long-term inclusive
growth. Employment rates remain low, especially
for vulnerable groups, pointing to the need to
improve access to employment for all jobseekers
and to anticipate skills needs. This also includes
aligning education and training with the labour
market needs. The share of the population at risk
of poverty or social exclusion remains high
emphasising the need to foster policies of active
inclusion with a view to reducing poverty and
promoting equal opportunities with regard to child
and long-term care services.
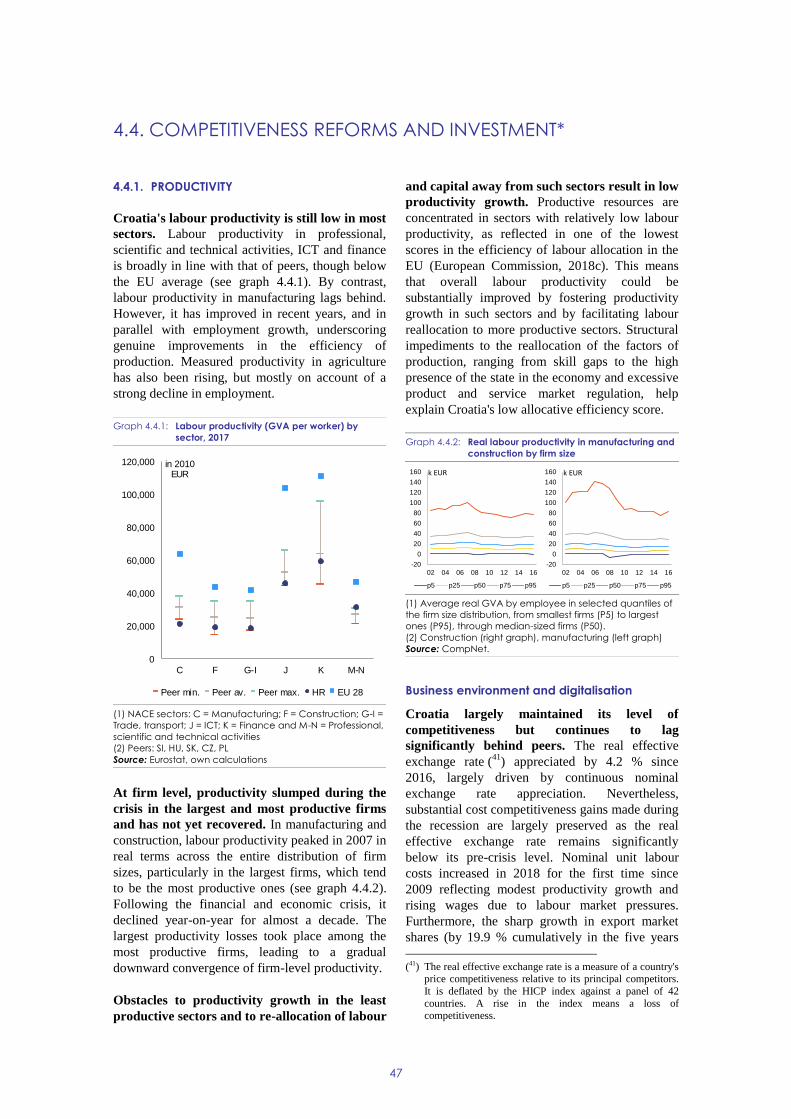
47
4.4.1. PRODUCTIVITY
Croatia's labour productivity is still low in most
sectors. Labour productivity in professional,
scientific and technical activities, ICT and finance
is broadly in line with that of peers, though below
the EU average (see graph 4.4.1). By contrast,
labour productivity in manufacturing lags behind.
However, it has improved in recent years, and in
parallel with employment growth, underscoring
genuine improvements in the efficiency of
production. Measured productivity in agriculture
has also been rising, but mostly on account of a
strong decline in employment.
Graph 4.4.1: Labour productivity (GVA per worker) by
sector, 2017
(1) NACE sectors: C = Manufacturing; F = Construction; G-I =
Trade, transport; J = ICT; K = Finance and M-N = Professional,
scientific and technical activities
(2) Peers: SI, HU, SK, CZ, PL
Source: Eurostat, own calculations
At firm level, productivity slumped during the
crisis in the largest and most productive firms
and has not yet recovered. In manufacturing and
construction, labour productivity peaked in 2007 in
real terms across the entire distribution of firm
sizes, particularly in the largest firms, which tend
to be the most productive ones (see graph 4.4.2).
Following the financial and economic crisis, it
declined year-on-year for almost a decade. The
largest productivity losses took place among the
most productive firms, leading to a gradual
downward convergence of firm-level productivity.
Obstacles to productivity growth in the least
productive sectors and to re-allocation of labour
and capital away from such sectors result in low
productivity growth. Productive resources are
concentrated in sectors with relatively low labour
productivity, as reflected in one of the lowest
scores in the efficiency of labour allocation in the
EU (European Commission, 2018c). This means
that overall labour productivity could be
substantially improved by fostering productivity
growth in such sectors and by facilitating labour
reallocation to more productive sectors. Structural
impediments to the reallocation of the factors of
production, ranging from skill gaps to the high
presence of the state in the economy and excessive
product and service market regulation, help
explain Croatia's low allocative efficiency score.
Graph 4.4.2: Real labour productivity in manufacturing and
construction by firm size
(1) Average real GVA by employee in selected quantiles of
the firm size distribution, from smallest firms (P5) to largest
ones (P95), through median-sized firms (P50).
(2) Construction (right graph), manufacturing (left graph)
Source: CompNet.
Business environment and digitalisation
Croatia largely maintained its level of
competitiveness but continues to lag
significantly behind peers. The real effective
exchange rate (41
) appreciated by 4.2 % since
2016, largely driven by continuous nominal
exchange rate appreciation. Nevertheless,
substantial cost competitiveness gains made during
the recession are largely preserved as the real
effective exchange rate remains significantly
below its pre-crisis level. Nominal unit labour
costs increased in 2018 for the first time since
2009 reflecting modest productivity growth and
rising wages due to labour market pressures.
Furthermore, the sharp growth in export market
shares (by 19.9 % cumulatively in the five years
(41) The real effective exchange rate is a measure of a country's
price competitiveness relative to its principal competitors.
It is deflated by the HICP index against a panel of 42
countries. A rise in the index means a loss of competitiveness.
0
20,000
40,000
60,000
80,000
100,000
120,000
C F G-I J K M-N
Peer min. Peer av. Peer max. HR EU 28
in 2010EUR
-20
0
20
40
60
80
100
120
140
160
02 04 06 08 10 12 14 16
p5 p25 p50 p75 p95
k EUR
-20
0
20
40
60
80
100
120
140
160
02 04 06 08 10 12 14 16
p5 p25 p50 p75 p95
k EUR
4.4. COMPETITIVENESS REFORMS AND INVESTMENT*

4.4. Competitiveness reforms and investment*
48
since 2012), slowed to 0.4 % in 2018, reflecting
the fading impact of Croatia’s EU accession. The
World Economic Forum's Global Competitiveness
Index, which looks at the broader non-cost
competitiveness of countries, shows Croatia is
significantly less competitive compared to peers.
This implies that Croatia’s institutions, labour
market and business dynamism are particularly in
need of improvement.
Croatia's business environment remains
burdensome, but the identified best practices
within the country offer scope for improvement.
When looking at the subnational indicator of
Doing Business in Croatia, there are substantial
differences in regulatory performance among the
five studied cities (Zagreb, Rijeka, Split, Varaždin
and Osijek). Therefore there is potential to lift the
national average by replicating good identified
practices within the country, such as starting a
business in Split or dealing with construction
permits in Varaždin (42
). As part of the efforts to
facilitate doing business in Croatia, the authorities
have committed to reducing the administrative
burden on companies. Based on the Standard Cost
Model, the burden in the economy is estimated to
correspond to 3 % of GDP. The completion of the
burden reduction in 2019 is expected to lift around
20 % of the cost-equivalent burden.
Croatian enterprises are slowly integrating
digital technologies. With 15.5 % of enterprises at
a high and very high level of digital intensity,
Croatia is behind the EU average of 18 %.
However, Croatian companies are above-average
users of cloud technologies and take advantage of
the opportunities offered by online commerce:
17.1 % of small and medium-sized enterprises sell
online, similar to the EU average of 17.2 %
(European Commission, 2019a). Croatia is taking
several initiatives that will help small and medium-
sized enterprises digitise further (such as eBusiness
and eFees), for example by enabling electronic
payment of administrative fees and charges and
access to tax administration files, health insurance,
the pension system. More investment efforts could
be made to foster digitisation among small and
medium-sized enterprises, including by ensuring
that the education and training system responds to
(42) Doing Business in the European Union 2018 (Subnational
series): Croatia, the Czech Republic, Portugal and Slovakia (World Bank, 2018a). See also Section 4.4.3.
the growing need for information technology
specialists expressed by small and medium-sized
enterprises (European Commission, 2019a) (see
Section 4.3).
State-owned enterprises
Slow progress in management and disposal of
state-owned enterprises entails their continued
strong impact on the economy. Their large
presence in many sectors of the economy
continues hampering allocative efficiency and
productivity growth (European Commission,
2017c). The new act on the management of
state-owned assets was adopted in June 2018.
However, the substantial delay in its adoption
postponed the planned introduction of measures
aimed at speeding up the activation of assets and
disposal of minority shares in state-owned
enterprises. In 2018, the sale of assets has thus
continued mostly through standard public
tendering procedures, with fewer successfully
completed calls and lower revenue than the year
before.
The list of companies ineligible for privatisation
has been reduced and streamlined. These
companies are now included in a single list of 39
entities of special interest. Most of them maintain
strong presence, and even dominant positions, in
their sectors. In particular, state-owned companies
fully dominate the rail sector; where there is large
scope to improve efficiency, productivity and
quality of services (see Section 4.4). The number
of companies eligible for privatisation continues
expanding, but no clear privatisation strategy is in
place. This has resulted in companies being
privatised only as a measure of last resort at times
of severe financial distress or need for
recapitalisation.
Measures to improve corporate governance in
state-owned enterprises are progressing slowly.
The new Code of Corporate Governance has been
adopted in all majority state-owned enterprises,
and mid-term planning and performance reporting
have been made obligatory. Yet, a clearer
commitment to improving governance in
state-owned enterprises is needed, as their
performance remains weak.

4.4. Competitiveness reforms and investment*
49
Research and development
Croatia’s R&D intensity is low and its small
and medium-sized enterprises are weak
innovators. The overall R&D intensity in 2017
amounted to 0.86 % of GDP, equally split between
the public and private sectors. Based on recent
trends, Croatia will not reach its national target of
1.4 % of GDP by 2020, though the reintroduction
of tax breaks for R&D in 2018 (see section 4.1)
may contribute to filling the gap. Business
investment in R&D is low and largely
concentrated in large companies in pharmaceutical,
telecommunications, agriculture and food
industries. Meanwhile, the 2018 European
Innovation Scoreboard shows a decline between
2010 and 2017 in all three aspects of small and
medium-sized enterprises innovation: product and
process innovations; marketing and organisational
innovations; and small and medium-sized
enterprises innovating in-house. As a result, the
overall score of Croatia in this area was 72 % of
the EU level in 2017 (European Commission,
2018k).
Graph 4.4.3: Business and public R&D intensity
R&D intensity measures spending on research and
development as a share of GDP.
Source: Eurostat, own calculations.
Excessive fragmentation of the science base and
policy shortcomings affect the quality of public
research. The share of Croatia's total scientific
publications that are among the top 10 % most
cited publications worldwide is rising slightly, but
compared to the EU average (11.1 %) it remains
very low at 4.2 %. Lack coordination and effective
management in research and innovation policies
leads to poor targeting and inadequate
prioritisation of support instruments. In addition,
some of the undertaken reforms of public research
institutes and universities remain unfinished. With
every faculty having a separate legal entity status,
it is difficult to develop a university-wide vision or
set a strategic direction (Kralj and al., 2011).
Performance criteria for institutional funding,
formally introduced in 2013, are still not being
used, and as a result, project-based funding
allocation is not competitive. Internationalisation
and international co-publications are rare (43
). Still,
some excellence niches in ICT, biomedical and
natural sciences exist at the Universities of Zagreb
(Faculty of electrical engineering), Rijeka and the
Ruđer Bošković Institute, and the increasing
numbers of graduates in the field of computing
places Croatia among the best performing Member
States (44
). The Ericsson-Nikola Tesla partnership
with the University of Zagreb on ICT is a good yet
isolated example of science-business cooperation.
(43) Croatia ranks 24th in the EU by international co-
publications as a share of total (European Commission, 2018k).
(44) Croatia ranks 9th in the EU by computing graduates per thousand population aged 25-34 (Eurostat)
0.0
0.2
0.4
0.6
02 03 04 05 06 07 08 09 10 11 12 13 14 15 16 17
Public R&D intensity (GOVERD + HERD)
Business R&D intensity (BERD)
% of GDP

4.4. Competitiveness reforms and investment*
50
Box 4.4.1: Investment challenges and reforms in Croatia
Macroeconomic perspective
The protracted recession made a lasting effect on investment activity in Croatia, in both the private and
public sector. While still well below the pre-crisis level, private investment has been recovering steadily
since 2015, in line with the positive macroeconomic outlook and supported by increasingly favourable
financing conditions. With the halting of the large infrastructure campaign in the aftermath of the financial
crisis, public investment has been more than halved to date, and is expected to continue relying on the so-far
limited absorption of EU funding. Overall, investment in Croatia is expected to continue recovering at
moderate pace over the forecast horizon.
Assessment of barriers to investment and ongoing reforms
As broadly positive macroeconomic trends continue, the business environment remains insufficiently
conducive to investment. Fragmented public administration, as well as insufficient administrative capacity at
regional and local level, weighs on the overall capacity to attract and implement investment, particularly as
regards the absorption of EU funding (see Section 4.4). The high corporate sector debt still constrains
financing, while capital markets remain underdeveloped and alternative sources of equity financing are
largely underutilised (see Section 4.2).
Selected barriers to investment and priority actions underway
(1) Some measures have been implemented to reduce parafiscal charges and administrative burden, but the
persisting weaknesses in the public administration and the judiciary hamper service delivery to businesses,
including the still cumbersome business registration and lengthy proceedings in civil and commercial
litigation. (2) Investment in the digital economy is constrained due to low take-up of high-speed broadband,
despite wide availability, and extremely low take-up of ultrafast broadband.
In Croatia, the national development bank is Hrvatska banka za obnovu i razvitak (HBOR). Its main
activities include promoting exports and supporting the development of SMEs. Roughly, 76 % of newly
approved loans in 2017 were used to finance investment. HBOR’s loan portfolio amounted to around 6.8 %
of GDP in Q12018.
Measures to reduce fragmentation and improve
the efficiency of research and innovation
policies are lagging. As a precondition to access
ESIF-funding, in 2016 Croatia introduced the
'smart specialisation' strategy 2016-2020 (RIS3),
aimed at fostering innovation, overcoming
fragmentation in the system and ensuring that
R&D activities are organised around key economic
priorities. However, its implementation is lagging.
Centres of Competence and Centres of Excellence

4.4. Competitiveness reforms and investment*
51
are in the process of being established or are still to
deliver clear outcomes. Both schemes
implemented along other measures, which are
lagging behind are intended to improve
connections between academia and businesses. As
a result, the funding for policies to support
businesses and innovation (EUR 1.665 billion
from the ERDF) has not yet been used in full (45
).
In an effort to overhaul the RIS 3 governance, in
July 2018, an inter-ministerial National Innovation
Council was set up to oversee its implementation.
Thematic Innovation Councils formally established
in September 2018 are yet to bring any concrete
results. In addition, there is the intention to
strengthen the monitoring of smart specialisation
strategy and other policy instruments with a view
to creating a basis for evidence-based
policymaking. Recent analysis done by the
Croatian government together with the World
Bank could be used to prioritise interventions
under the smart specialisation strategy and reform
innovation environment.
4.4.2. MARKET FUNCTIONING AND INVESTMENT
Investment gaps are pronounced in research
and development, environment and transport.
Better-targeted government investment in research
and development can spur progress towards a more
innovative economy. Similarly, investments are
required to improve the quality and connectivity of
the underdeveloped railway infrastructure, but also
urban transport. Croatia also requires substantial
investment in waste and water management, which
are underdeveloped.
Regulated professions and business services
Some restrictions in the regulation of
professional services are being relaxed.
Commission analysis (European Commission,
2016z) shows that restrictiveness of regulation in
Croatia remains higher than the EU average for six
of the seven analysed professions. This is
especially the case for lawyers (most restrictive in
the EU), architects and engineers. Some reform
measures, such as the loosening of marketing
restrictions for lawyers, abolition of exclusive
(45) Only 5.5 % of ERDF allocations earmarked for the
implementation of RIS3 have been spent by beneficiaries by the end of 2018 (SFC 2014 reporting system).
rights for architects and a significant liberalisation
of taxi services have been implemented recently.
Also, residence restrictions for certified tax
advisors have been removed and the 2017
accounting law, which introduced compulsory,
licensing for accountants was repealed. Finally,
Croatia is now working with the World Bank on
the preparation of two national action plans
covering around 20 regulated professions.
Meanwhile, the key big restrictions remain in
place.
Environment and energy
The shift away from landfilling towards
separate collection and recycling is slow.
Landfilling of municipal waste accounts for 77 %
of total waste, considerably above the EU average
(24 %). Croatia also scores low in terms of
recycling, with only 21 % of waste materials
recycled, compared to an EU average of 46 %
(Eurostat). Therefore, Croatia is at risk of not
reaching the 50 % preparation for re-use/recycling
target on municipal waste by 2020 (European
Commission, 2016x). Reaching the even more
ambitious and binding target of 65 % by 2035 will
require shifting investments further up the waste
hierarchy. In 2017, the long-awaited national
Waste Management Plan 2017-2022 was adopted,
but its implementation faces delays. Improving
Croatia's performance in waste management
requires substantial investment in waste
infrastructure.
While water supply networks are relatively
developed, sanitation in general is lagging. Data
available only up to 2011 shows that around 86 %
of the population was connected to the public
water supply system (Eurostat). The key issue
remains a high leakage rate, at 44 % compared to
the EU average of 23 % (European Commission,
2017w). Moreover, some areas do not meet the
quality requirements for drinking water, for
instance Eastern Slavonia. The development of
public sewage systems lags considerably behind as
in 2015 only 54.6 % of the population was
connected to the sewage systems (Eurostat). The
estimated investment needed to ensure appropriate
collection and treatment of wastewater is
considerable (around 2.9 billion euro) (European
Commission, 2017y). The size of the challenge
calls for an effective prioritization strategy (within
a National Investment Plan).
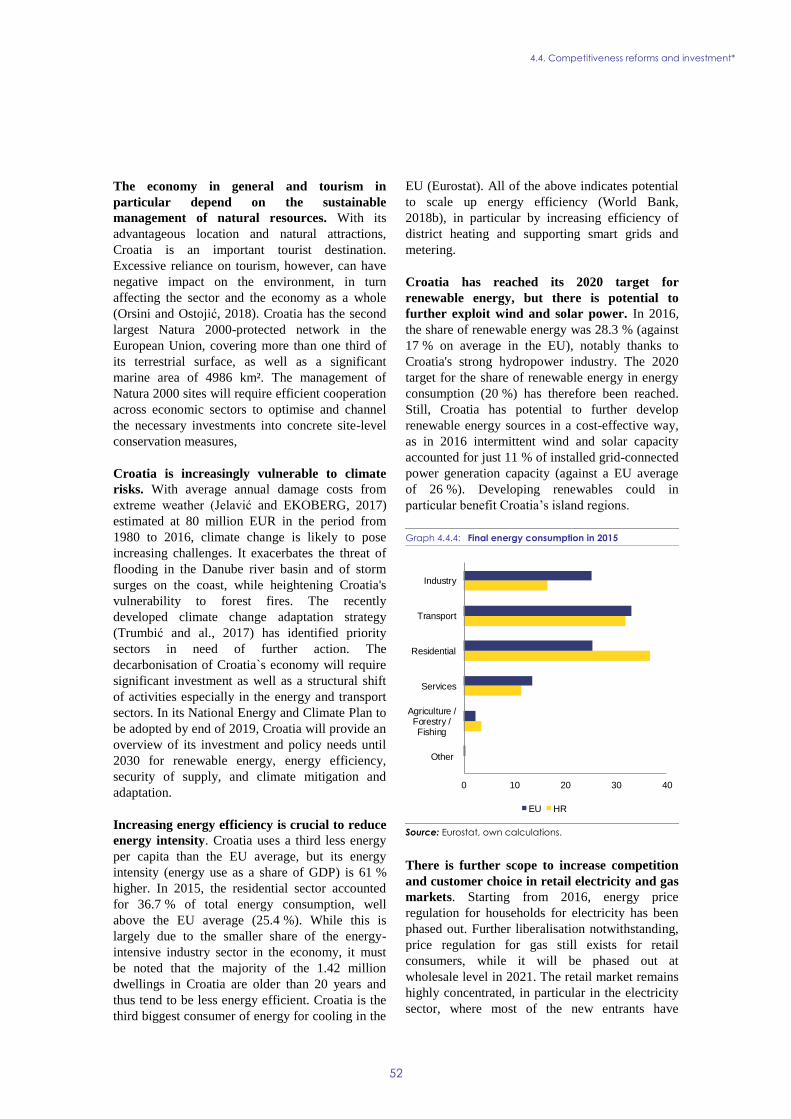
4.4. Competitiveness reforms and investment*
52
The economy in general and tourism in
particular depend on the sustainable
management of natural resources. With its
advantageous location and natural attractions,
Croatia is an important tourist destination.
Excessive reliance on tourism, however, can have
negative impact on the environment, in turn
affecting the sector and the economy as a whole
(Orsini and Ostojić, 2018). Croatia has the second
largest Natura 2000-protected network in the
European Union, covering more than one third of
its terrestrial surface, as well as a significant
marine area of 4986 km². The management of
Natura 2000 sites will require efficient cooperation
across economic sectors to optimise and channel
the necessary investments into concrete site-level
conservation measures,
Croatia is increasingly vulnerable to climate
risks. With average annual damage costs from
extreme weather (Jelavić and EKOBERG, 2017)
estimated at 80 million EUR in the period from
1980 to 2016, climate change is likely to pose
increasing challenges. It exacerbates the threat of
flooding in the Danube river basin and of storm
surges on the coast, while heightening Croatia's
vulnerability to forest fires. The recently
developed climate change adaptation strategy
(Trumbić and al., 2017) has identified priority
sectors in need of further action. The
decarbonisation of Croatia`s economy will require
significant investment as well as a structural shift
of activities especially in the energy and transport
sectors. In its National Energy and Climate Plan to
be adopted by end of 2019, Croatia will provide an
overview of its investment and policy needs until
2030 for renewable energy, energy efficiency,
security of supply, and climate mitigation and
adaptation.
Increasing energy efficiency is crucial to reduce
energy intensity. Croatia uses a third less energy
per capita than the EU average, but its energy
intensity (energy use as a share of GDP) is 61 %
higher. In 2015, the residential sector accounted
for 36.7 % of total energy consumption, well
above the EU average (25.4 %). While this is
largely due to the smaller share of the energy-
intensive industry sector in the economy, it must
be noted that the majority of the 1.42 million
dwellings in Croatia are older than 20 years and
thus tend to be less energy efficient. Croatia is the
third biggest consumer of energy for cooling in the
EU (Eurostat). All of the above indicates potential
to scale up energy efficiency (World Bank,
2018b), in particular by increasing efficiency of
district heating and supporting smart grids and
metering.
Croatia has reached its 2020 target for
renewable energy, but there is potential to
further exploit wind and solar power. In 2016,
the share of renewable energy was 28.3 % (against
17 % on average in the EU), notably thanks to
Croatia's strong hydropower industry. The 2020
target for the share of renewable energy in energy
consumption (20 %) has therefore been reached.
Still, Croatia has potential to further develop
renewable energy sources in a cost-effective way,
as in 2016 intermittent wind and solar capacity
accounted for just 11 % of installed grid-connected
power generation capacity (against a EU average
of 26 %). Developing renewables could in
particular benefit Croatia’s island regions.
Graph 4.4.4: Final energy consumption in 2015
Source: Eurostat, own calculations.
There is further scope to increase competition
and customer choice in retail electricity and gas
markets. Starting from 2016, energy price
regulation for households for electricity has been
phased out. Further liberalisation notwithstanding,
price regulation for gas still exists for retail
consumers, while it will be phased out at
wholesale level in 2021. The retail market remains
highly concentrated, in particular in the electricity
sector, where most of the new entrants have
0 10 20 30 40
Other
Agriculture /Forestry /Fishing
Services
Residential
Transport
Industry
EU HR
4.4. Competitiveness reforms and investment*
53
already exited the market, citing as reasons lack of
access for them to generation capacity, anti-
competitive practices by the incumbent and lack of
a stable investment environment in particular due
to frequent changes in the support framework for
renewable energy sources. The independence and
capacity of the National Energy Regulatory
Authority is key to improving competition.
The Projects of Common Interest currently
being developed, in particular the Krk LNG
terminal and the SINCRO large-scale smart
grid project, are essential to Croatia’s security
of supply of electricity and gas. In this context,
the implementation of bidirectional capacity gas
projects with the neighbouring counties – Hungary
in particular – is of great importance for the
viability of the Krk LNG project and for security
of supply of the region in general. This requires a
consistent regional approach with neighbouring
countries.
Transport and connectivity
The transport network is unbalanced, with
railway infrastructure lagging significantly
behind the EU average. Completion of the core
TEN-T rail network in Croatia stands at just 5-6 %,
compared to the EU average of 60 % (European
Commission, 2018p). The outdated and limited rail
infrastructure results in low competitiveness, low
quality of service and a general preference for
other transport modes, in particular road transport.
Based on an analysis of the comprehensive traffic
model and the investments taking place in the
2014–2020 period, the most critical missing
components of the rail TEN-T corridors are
Zagreb–Rijeka, development of the Zagreb node
and the Dugo Selo–Novska section. By contrast,
the quality of road infrastructure is overall good as
intensive investments have resulted in a dense
motorway network of high quality (46
). At the
same time, there remain bottlenecks on state roads,
which are often exacerbated by peaks in the tourist
season. Finally, while road deaths were reduced by
28 % between 2010 and 2016, Croatia remains
among the worst performing Member States in
terms of road safety (European Commission,
2017a).
(46) At 23.1 km of motorway per thousand km2, Croatia is
above EU average (17 km) (Eurostat).
Urban transport is developed only in a few
major cities, while others lack even basic
infrastructure. In 2014–2020, investments are
taking place in Zagreb and Osijek, but public
transport in two other major cities, Split and
Rijeka, as well as smaller cities, remains outdated
and unable to satisfy existing needs, let alone
increased future demand, or cope with seasonal
fluctuations.
The share of renewable energy sources in the
transport sector (1.3 % in 2016) is one of the
lowest among EU Member States and below the
2020 target of 10 %. In 2018, the Croatian
Government introduced incentives to the purchase
of electric cars. Additional efforts and investments
are nonetheless needed to effectively reduce the
high share of fossil fuel passenger cars, promote
inter-modality and more generally curb the rising
GHG emissions in the transport sector.
Take-up of broadband is low in Croatia. In
2018, broadband connections were available to
80 % of households – an improvement from 2017
(77 %) towards the EU average (86 %).
Meanwhile, the fast broadband take-up also
improved a lot (from 14 % to 19 % of households),
but remains well below the EU average (41 %)
(European Commission, 2019x). Factors
contributing to the low take-up include low
internet use and high prices for (fast) broadband.
Achieving the European Gigabit Society targets for
2025 (European Commission, 2016q) is uncertain
without public support. Effective deployment of
the 5G networks could improve fast connectivity
in rural and remote areas.
4.4.3. REGIONAL DISPARITIES
Croatia is characterised by marked territorial
disparities. Similarly to the great variation of GDP
per capita across the territory (see Chapter 1),
labour market outcomes also display large
territorial differences, with the unemployment rate
in 2017 ranging from a 4.6 % low in Istria county
to a high of 26 % in Sisak-Moslavina county (see
Graph 4.4.5). Almost 40 % of the country’s
unemployed population live in Eastern and Central
Croatia, even though these regions only host a
quarter of Croatia's total population, also as a

4.4. Competitiveness reforms and investment*
54
result of strong emigration flows (47
). In addition,
similarly to other Member States, the urban-rural
divide is marked, as cities offer better labour
opportunities and attract higher skilled individuals.
Namely, 69.5 % of the workforce in cities is in
employment, contrary to a 59.2 % in rural areas.
Only 18.8 % of the rural areas population has
tertiary education, compared to a 43.5 % in cities,
which is higher than the EU average (see
graph 4.4.6).
Graph 4.4.5: Registered unemployment rate (%) by county,
2017
Source: Croatian Bureau of Statistics.
Significant regional differences in terms of
resource endowments suggest different
investment needs across the territory. Industrial
production is highly concentrated in the Zagreb
and Primorje-Gorski Kotar counties (World Bank,
2018b), while large cities (Zagreb, Split, Rijeka,
Osijek) display the highest potential for
innovation, including poles of world class
excellence in information and communication
technology, biomedical and natural sciences in
both the capital and Rijeka. Eastern Croatia relies
on agriculture and wood industry and its
geographical proximity to Central Europe could be
used as a competitive advantage. Regions from the
Adriatic coast and islands draw most of their
relative prosperity from tourism. They face
problems with connectivity and access to clean
(47) The population in Central and Eastern Croatia's seven
counties has shrunk by more than 5 % in the period
2014-2017, compared to a national decline of 2 %.
energy, water and wastewater services and natural
protection in islands, which are exacerbated during
seasonal population influx peaks.
Investment decisions supported by EU funds
need to take due consideration of regional
specificities. Targeted investments with a focus on
human capital and competitiveness would help to
strengthen the endogenous growth potential of
lagging regions. They could address weaknesses in
terms of transport connectivity (islands) and/or
access to healthcare and quality social services
(border regions). However, experience in
implementing sustainable urban development
strategies (48
) with EU funded assistance is so far
inconclusive. Cities have made valuable efforts to
define strategies integrating the wider needs of
their neighbouring municipalities, but there have
been considerable delays in their implementation.
Furthermore, the absence of a comprehensive
national urban policy framework over the past
years resulted in multiple standalone projects in
cities, with limited impact. Cities could in the
future strengthen their role of engines of growth at
regional level.
Graph 4.4.6: Employment, unemployment and tertiary
education rates, by level of urbanisation, 2015-
2017
Source: Eurostat, own calculations.
(48) In Zagreb, Osijek, Rijeka, Split, Zadar, Slavonski Brod and
Pula
20
40
60
80
100
120
Employment rate Unemploymentrate
Tertiaryeducated
Index, EU28=100
EU28 HR
Cities Towns and suburbs
Rural areas
4.4. Competitiveness reforms and investment*
55
4.4.4. PUBLIC ADMINISTRATION
Regional disparities are exacerbated by a high
degree of fragmentation in the efficiency of the
public administration. Previous country reports
highlighted that many small local governments
units have devolved competencies and
responsibilities in providing public services, but
often lack the adequate financial, administrative
and personnel resources to carry out their duties.
This creates large disparities in public service
provision between financially and administratively
strong and weak local units across Croatia. The
situation is aggravated by the fact that the division
of competencies and responsibilities in terms of
service provision by local units (municipalities,
cities, counties) are not clearly spelt out (European
Commission, 2016b) (49
). The current territorial
organisation raises costs and reduces the quality
and effectiveness of the services delivered (World
Bank, 2018b).
Efforts are being made to improve coordination
within the central level state administration.
The 2015 Strategy for Public Administration,
setting out a number of objectives for the
modernisation of the state administration, has been
implemented only in few areas. In particular,
measures related to upgrading human resources
management and introducing modern systems for
the improvement of service quality are lagging.
Similarly, inter-ministerial coordination of policy
proposals has until recently been limited, as is the
involvement of academic experts in the
policymaking process (Petak et al. 2018). The
2018 country report recognised also the need to
strengthen the administrative capacities related to
design and implementation of public policies, as
well as more efficient and effective use of EU
funds. In order to strengthen policy-making,
coordination and implementation, the authorities
are preparing a National Development Strategy
2021–2030. The Strategy should result in the
streamlining of many small and non-aligned
sectorial and territorial strategies, and help to
(49) The absence of clear national standards, applicable by all
local units, is felt particularly in the field of social policy. Here, the implementation of central government regulation
has differed strongly among municipalities. In some cases, legal requirements such as the provision in the Act on
Social Welfare that municipalities should use 5 % of their
budgets for housing allowances for socially marginalized groups have not been complied with.
establish clear connections between priorities and
goals on the one hand, and budget planning on the
other. It will include a shared IT platform securing
transparency and facilitating aggregation of data
and information and reporting.
A number of other measures addressing the
efficiency of the public administration are
making progress. In August, the government
adopted a Decision on a substantial rationalisation
of the cumbersome state agencies system, which is
a step towards simplification and efficiency. A
total of 54 state agencies, state institutions and
state-owned enterprises will be either suppressed
or merged with agencies or within line ministries.
For the remaining agencies, the authorities plan to
establish a new framework introducing a higher
degree of homogeneity across the system. The
authorities have also prepared the legislation for
the transfer of competences from branch-offices of
the central administration (e.g. ministries)
operating at local level to the county-level
administration. The legislation is planned for
adoption in April 2019 (and implemented in 2020),
and it would in part address the fragmentation of
the state administration system. The impact of
these measures however remains highly dependent
on their effective implementation. Finally, the
provision of e-public services has improved with
the further development of the eCitizens systems
(currently, 54 electronic services available),
eIDAS (electronic Identification, Authentication
and trust Services) and various other eGovernment
systems (50
).
New legislation on civil service wage-setting is
planned for the first quarter of 2019. The new
legislation, which has been postponed several
times by the government, will cover civil servants,
while wages of other public sector employees will
be addressed in a second phase. The aim of the law
is to achieve a greater harmonisation of wage
setting across the public administration through the
introduction of common wage grids and job
complexity coefficients, based on more consistent
job descriptions and competences frameworks. The
(50) eGovernment includes eNewborn (online registration of
children), eTax (various tax-related activities). mSignature and mStamp (electronic signing, stamping or validation of
documents) are planned to be developed. With the establishment of the Shared Services Centre, all public
sector bodies will be able to use joint, reliable and scalable
infrastructure on the ‘cloud’ paradigm.
4.4. Competitiveness reforms and investment*
56
new legislation would also cover areas of the
employment relationship of civil servants that are
currently negotiated through collective bargaining,
conditional upon the implementation of a new
performance evaluation system for civil servants.
As for state-owned enterprises, for the time being
no further steps have been taken in setting up a
coordinated system for collective bargaining.
The overall institutional setup for public
procurement needs strengthening. A State Audit
report in 2018 (State Audit Office, 2018) noted
overall delays and shortages of staff in most
institutions involved in public procurement,
including the Central State Office for Public
Procurement and the bodies working in the area of
ESIF. The report emphasised the key role of the
Central Finance and Contracting Agency and other
second level intermediate bodies (51
) as dedicated
services to provide non-obligatory checks and
input to draft tender documents. These services are
understaffed yet they are crucial in assisting the
final beneficiaries of EU funds and must maintain
a high level of technical knowledge and resistance
to corruption and undue influence. Further work in
public procurement could include wider
development and implementation of policies (some
existing in specific cases) using public
procurement as a strategic policy instrument
(social, green and innovative procurement).
Justice system
Despite progress in the reduction of backlogs,
the quality and efficiency of the justice system
and the personal insolvency framework remain
to be improved. With the exception of the High
Commercial Court, the continued reduction of
backlogs (52
) was mainly due to a lower caseload.
The focus on resolving the oldest cases (10 years
and older) was effective, but the 2019 EU Justice
Scoreboard (European Commission, forthcoming)
shows that the duration of court proceedings and
backlogs in Croatia remain among the highest in
the EU. As of 1 January 2019, the Financial
Agency will be authorised to initiate ex officio
certain personal insolvency cases (e.g. for people
with blocked accounts) and the mediation before
(51) Bodies in direct charge of grant contracts of ESIF projects
(52) 18 % in first instance litigious civil and commercial and enforcement cases and 23 % in the High Commercial Court
(2018 compared to 2017) (Ministry of Justice)
FINA is no longer a procedural step before
reaching the court. While this is expected to lead to
an increased use of the personal insolvency
procedures and help reduce the over-indebtedness
of some households, the average duration of
insolvency and restructuring proceedings further
increased in all categories.
Electronic communication in courts and
implementation of the judicial map reform are
advancing. All commercial courts are now
equipped for e-communication with lawyers,
notaries and prosecutors. The same is expected to
follow for insolvency administrators, court experts
and municipal courts. Online payment of Court
fees are being incentivised by offering a 50 %
discount in case of immediate payment and online
submission of a claim. As of 2019, personal and
corporate insolvency documents should be
delivered from the Financial Agency to the courts
electronically. A pilot project is testing the central
postal delivery of court documents. The Supreme
Court has fully adopted the e-case system and
plans to increase the number of published first and
second instance court rulings, also to improve the
consistency of case law. The reform of the judicial
map (in force from January 2019) will merge
nearly all misdemeanour courts into municipal
courts. This is expected to increase efficiency and
quality by better distributing workload.
Challenges in efficiency and quality in criminal
justice may hamper effective fight against
economic and financial crime. Backlogs
increased at all criminal court instances and
proceedings remained lengthy (650 and 400 days
at Municipal and for first instance cases at County
courts, respectively). The State Attorney's Office
received some additional human resources, but its
capacity to fight economic and financial crime
remains limited.
Concerns about judicial independence remain.
According to a ruling by the Constitutional Court
(Constitutional Court of the Republic of Croatia,
2018), the State Judicial Council did not provide
sufficient reasoning in certain decisions on the
career of judges, which led to legislative
amendments that decreased the Council's power in
selecting judges and could interfere with its
institutional role. A Eurobarometer survey shows
that the perceived judicial independence in Croatia
decreased further from an already very low level

4.4. Competitiveness reforms and investment*
57
(European Commission 2019b).
Fight against corruption
Corruption is perceived to be widespread.
Croatia is amongst the worst performing Member
States in terms of perception and control of
corruption, with no improving trend (53
). Over half
of respondents to the 2017 Special Eurobarometer
on Corruption feel affected by corruption in their
daily lives (59 %) and Croatia has the largest
proportion of respondents (16 %) exposed to
corruption of all Member States (European
Commission, 2017g). Similarly, the 2017
Eurobarometer survey on businesses' attitudes
towards corruption in the EU (European
Commission, 2017d) reports that Croatia registered
the lowest proportion of businesses (5 %) of the
view that people who take bribes are adequately
punished, a drop of 14 percentage points compared
to previous results. Also, only 15 % of businesses
agree that measures against corruption are applied
impartially and without ulterior motive, a
considerable drop by 24 percentage points from
2015 (54
).
Some legislative initiatives do not offer
adequate enforcement tools against corruption.
Despite some progress through the partial
implementation of the anti-corruption action plan,
Croatia's capacity to prevent and sanction
instances of corruption remains limited. Two
legislative proposals, on the protection of whistle-
blowers and on the prevention of conflicts of
interests, are pending adoption by Parliament (55
),
but the latter does not fully address post-
employment issues ("revolving doors"). The draft
law also makes it difficult for the Commission for
Determining Conflicts of Interest to initiate
proceedings and impose sanctions on officials who
submit inaccurate asset declarations. It also does
not apply to chairmen and board members of
companies majority-owned by local government
units, which manage significant financial resources
and thus could be exposed to corruption. Finally,
no progress has been made on the adoption of a
(53) Transparency International, Corruption Perceptions Index;
World Bank, Control of Corruption Indicator. (54) Question: "To what extent are public officeholders
prevented from abusing their position for private interests?" (Petak and al. 2018).
(55) The laws are planned for adoption by end of 2018.
code of ethics for Members of Parliament and
plans to regulate lobbying have stalled.
Control and sanction mechanisms at the local
level are weak. Changes to the framework for the
functioning of local government units are not
accompanied by improvements to control
corruption at the local level. The Law on Local and
Regional Self-Governance gives elected local
officials considerable discretion in decision-
making. Their discretionary powers to decide on
disposing of assets and finances of up to HRK 1
million and to appoint board members of public
local companies are considerable risk factors as
these board members are not subject to the same
form of oversight. The 2017 Special
Eurobarometer on corruption shows that 90 % of
Croatians think that corruption is present in local
or regional public institutions, and 72 % of
companies think corruption is widespread in public
procurement managed at the local or regional
level, an increase by six percentage points from
2015. Studies also indicate that competitive
advantage on the market at local level is achieved
mainly because of political connections rather than
competence (Vuković, 2017).
Strengthening ex-ante scrutiny and e-
procurement can support the fight against
corruption. E-procurement in Croatia is advanced
and provides a good basis for further developments
in transparency through further use of data,
integration with other e-government solutions, and
deployment of emerging technologies. Positive
steps were taken with the development of the
contract register and the possibility to lodge
complaints electronically before the State
Commission for Supervision of Public
Procurement Procedures (56
).
(56) This will soon become mandatory and it is crucial that
adequate resources be dedicated to any technical challenges.

58
CSR 1: Strengthen the fiscal framework,
including by strengthening the mandate and
independence of the Fiscal Policy
Commission. Introduce a recurrent property
tax.
Croatia has made Some Progress in addressing
CSR 1
Strengthen the fiscal framework, including
by strengthening the mandate and
independence of the Fiscal Policy
Commission.
Substantial Progress in strengthening the fiscal
framework. After a long delay, in December 2018 the
Parliament adopted a new Fiscal Responsibility Act
and a new State Audit Office Act. The adoption of
the new Budget Act remains delayed.
Introduce a recurrent property tax. No Progress The introduction of a recurrent value-
based property tax is no longer planned.
CSR 2: Discourage early retirement,
accelerate the transition to a higher statutory
retirement age and align pension provisions
for specific categories with the rules of the
general scheme. Deliver on the reform of the
education and training system to improve its
quality and labour market relevance for both
young people and adults. Consolidate social
benefits and improve their poverty reduction
capacity.
Croatia has made Some Progress in addressing
CSR 2
Discourage early retirement, accelerate the
transition to a higher statutory retirement
age and align pension provisions for specific
categories with the rules of the general
scheme.
Substantial Progress. In December 2018 the
parliament adopted an important package of pension
system reforms aimed at addressing design
inconsistencies in the system, improving pension
adequacy through longer working lives, and
strengthening the institutional setup and performance
of the 2nd
mandatory pillar.
Deliver on the reform of the education and
training system to improve its quality and
labour market relevance for both young
people and adults.
Some Progress in delivering on the reform of the
education and training system. A number of
measures have been set in motion, such as the launch
of newly developed general education curricula as a
pilot project. Other objectives set in the Education
and Training 2020 Strategic Framework await
adoption and implementation.
Consolidate social benefits and improve
their poverty reduction capacity.
Limited Progress in consolidating social benefits. A
categorisation of the types of benefits granted at the
local government level following the European
System of integrated Social Protection Statistics
nomenclature was completed. However, most policy
measures remain in a preparatory phase.
ANNEX A: OVERVIEW TABLE
Table A.1: 2018 country-specific recommendations (and subparts) assessment

A. Overview Table
59
CSR 3: Reduce the territorial fragmentation
of the public administration, streamline the
functional distribution of competencies and
enhance the capacity to design and implement
public policies. In consultation with social
partners, introduce harmonised wage-setting
frameworks across the public administration
and public services.
Croatia has made Limited Progress in addressing
CSR 3
Reduce the territorial fragmentation of the
public administration, streamline the
functional distribution of competencies
and enhance the capacity to design and
implement public policies.
Some Progress in the public administration reform.
A substantial rationalisation of the cumbersome state
agencies system – as a step towards simplification
and efficiency – is ongoing. The territorial
fragmentation at the local government level remains
a challenge.
In consultation with social partners,
introduce harmonised wage-setting
frameworks across the public
administration and public services.
Limited Progress in harmonising wage-setting
frameworks across the public administration and
public services, as the relevant legislation remains in
a preparatory phase
CSR 4: Improve corporate governance in
state-owned enterprises and intensify the sale
of state-owned enterprises and non-productive
assets. Significantly reduce the burden on
businesses arising from parafiscal charges and
from cumbersome administrative and
legislative requirements. Enhance competition
in business services and regulated professions.
Reduce the duration of court proceedings and
improve electronic communication in courts.
Croatia has made Some Progress in addressing
CSR 4
Improve corporate governance in state-
owned enterprises and intensify the sale of
state-owned enterprises and non-
productive assets.
Limited Progress. A new Corporate Governance
Code has been implemented, and obligatory
reporting on business plans and performance has
been introduced in all major state-owned enterprises.
Disposal of state assets has progressed slowly due to
delays in adoption of required legislation.
Significantly reduce the burden on
businesses arising from parafiscal charges
and from cumbersome administrative and
legislative requirements.
Some Progress in reducing the burden on business.
There has been some progress with the continuation
of removal of identified administrative burden and
limited progress with the removal of parafiscal
charges.
Enhance competition in business services
and regulated professions.
Limited Progress in enhancing competition in
business services and regulated professions. The
implementation of some measures to remove
excessive restrictions has finally started, most
notably in passenger transport, audit and education.

A. Overview Table
60
Reduce the duration of court proceedings
and improve electronic communication in
courts.
Some Progress in the judicial system reform.
Backlogs in courts have been reduced and progress
was made with implementation of electronic
communication. Mergers of courts effective as of
January 2019 are expected to increase efficiency.
The following categories are used to assess progress in implementing the country-specific recommendations (CSRs):
No progress: The Member State has not credibly announced nor adopted any measures to address the CSR. This category
covers a number of typical situations to be interpreted on a case by case basis taking into account country-specific conditions. They include the following:
no legal, administrative, or budgetary measures have been announced
in the national reform programme,
in any other official communication to the national Parliament/relevant parliamentary committees or the European Commission,
publicly (e.g. in a press statement or on the government's website);
no non-legislative acts have been presented by the governing or legislative body;
the Member State has taken initial steps in addressing the CSR, such as commissioning a study or setting up a study group to analyse possible measures to be taken (unless the CSR explicitly asks for orientations or exploratory
actions). However, it has not proposed any clearly-specified measure(s) to address the CSR.
Limited progress: The Member State has:
announced certain measures but these address the CSR only to a limited extent; and/or
presented legislative acts in the governing or legislative body but these have not been adopted yet and substantial
further, non-legislative work is needed before the CSR is implemented;
presented non-legislative acts, but has not followed these up with the implementation needed to address the CSR.
Some progress: The Member State has adopted measures:
that partly address the CSR; and/or
that address the CSR, but a fair amount of work is still needed to fully address the CSR fully as only a few of the measures have been implemented. For instance, a measure or measures have been adopted by the national Parliament
or by ministerial decision but no implementing decisions are in place.
Substantial progress: The Member State has adopted measures that go a long way towards addressing the CSR and most of
them have been implemented.
Full implementation: The Member State has implemented all measures needed to address the CSR appropriately.

A. Overview Table
61
Europe 2020 (national targets and progress)
Employment rate (age group 20 – 64) target
set in the NRP: 65.2 %
The employment rate in Croatia has been slowly and
steadily increasing (from 58.3% in 2013 to 66.3 % in
Q3 2018). Croatia has achieved its national target,
but the employment rate is still among the lowest in
the EU, and well below the EU average.
R&D target set in the NRP: 1.4 % of GDP In 2017, R&D intensity in Croatia was 0.86% of
GDP composed of 50% private investment (0.43% of
GDP) and 50% public investment (0.43% of GDP).
Croatia is not on track to meet the target.
Greenhouse gas emissions, national target:
+11% between 2005 and 2020
Total GHG emissions in Croatia were reduced by
23.3% from 1990 to 2017. Based on the latest
national projections submitted to the Commission,
and taking into account existing measures, Croatia is
expected to meet its GHG emission target by a wide
margin (-12.5 % between 2005 and 2020).
2020 renewable energy target: 20 %
2020 renewable energy source (RES) in
transport target: 10 %
With a renewable energy share of 28.3 % in 2016,
Croatia is well above its target for 2020.
With a 1.3 % share of RES in transport in 2016,
Croatia is well below its 2020 target.
Energy efficiency, 2020 energy consumption
targets:
11.2 Mtoe (primary energy consumption);
7 Mtoe (final energy consumption).
Croatia's primary and final energy consumption
remains below the country's 2020 energy efficiency
targets.
8.07 Mtoe (primary energy consumption, 2016)
6.64 Mtoe (final energy consumption, 2016)
Early school leaving (ESL) target: 4 % At 3.1 % Croatia remained among the leading EU
Member States in ensuring that its young people
complete secondary education. Both the national
target of 4 % and the EU-level target of 10 % were
comfortably met.
Tertiary education target: 35 % Croatia's tertiary education attainment rate has been
slowly declining since 2014 and stood at 28.7 % in
2017. The enrolment rates of the corresponding
student cohort, together with the overall drop-out
rates, make it unlikely that Croatia will meet its
national target by 2020.
Target for reducing the number of people at
risk of poverty or social exclusion, expressed
as an absolute number of people: by 150 000.
The number of people at risk of poverty or social
exclusion fell from 1.384 million in 2011 to 1.085
million in 2017. Therefore, the national target has
already been met.

62
General Government debt projections under baseline, alternative scenarios and sensitivity tests
2017 2018 2019 2020 2021 2022 2023 2024 2025 2026 2027 2028 2029
Gross debt ratio 77.5 73.5 70.1 68.2 66.7 66.0 65.9 65.4 65.1 64.9 64.7 64.5 64.3
Changes in the ratio (-1+2+3) -2.7 -4.0 -3.4 -1.9 -1.5 -0.7 -0.1 -0.5 -0.3 -0.2 -0.2 -0.2 -0.3
of which
(1) Primary balance (1.1+1.2+1.3) 3.5 2.7 2.6 2.2 1.7 1.3 0.9 0.9 0.8 0.8 0.9 1.0 1.1
(1.1) Structural primary balance (1.1.1-1.1.2+1.1.3) 3.3 1.9 1.6 1.0 1.0 0.9 0.9 0.9 0.8 0.8 0.9 1.0 1.1(1.1.1) Structural primary balance (bef. CoA) 3.3 1.9 1.6 1.0 1.0 1.0 1.0 1.0 1.0 1.0 1.0 1.0 1.0
(1.1.2) Cost of ageing 0.1 0.1 0.1 0.2 0.2 0.2 0.1 0.0 -0.2
(1.1.3) Others (taxes and property incomes) 0.0 0.0 0.0 0.0 0.0 0.0 -0.1 -0.1 -0.1
(1.2) Cyclical component 0.3 0.8 1.1 1.2 0.8 0.4 0.0 0.0 0.0 0.0 0.0 0.0 0.0
(1.3) One-off and other temporary measures -0.1 0.0 0.0 0.0 0.0 0.0 0.0 0.0 0.0 0.0 0.0 0.0 0.0
(2) Snowball effect (2.1+2.2+2.3) -0.5 -1.4 -0.9 -0.6 0.2 0.7 0.8 0.4 0.5 0.6 0.7 0.8 0.9(2.1) Interest expenditure 2.7 2.4 2.3 2.2 2.2 2.2 2.2 2.3 2.4 2.5 2.6 2.7 2.7
(2.2) Growth effect -2.3 -2.1 -1.9 -1.7 -0.8 -0.3 -0.2 -0.7 -0.6 -0.6 -0.6 -0.6 -0.6
(2.3) Inflation effect -0.9 -1.7 -1.2 -1.1 -1.2 -1.2 -1.3 -1.3 -1.3 -1.3 -1.3 -1.3 -1.3
(3) Stock-flow adjustments 1.3 0.1 0.1 1.0 0.0 0.0 0.0 0.0 0.0 0.0 0.0 0.0 0.0
Note: For further information, see the European Commission Fiscal Sustainability Report (FSR) 2018.
b. For the medium-term, the risk category (low/medium/high) is based on the joint use of the S1 indicator and of the DSA results. The S1 indicator measures the fiscal adjustment
required (cumulated over the 5 years following the forecast horizon and sustained thereafter) to bring the debt-to-GDP ratio to 60 % by 2033. The critical values used are 0 and 2.5
pps. of GDP. The DSA classification is based on the results of 5 deterministic scenarios (baseline, historical SPB, higher interest rate, lower GDP growth and negative shock on the
SPB scenarios) and the stochastic projections. Different criteria are used such as the projected debt level, the debt path, the realism of fiscal assumptions, the probability of debt
stabilisation, and the size of uncertainties.
c. For the long-term, the risk category (low/medium/high) is based on the joint use of the S2 indicator and the DSA results. The S2 indicator measures the upfront and permanent
fiscal adjustment required to stabilise the debt-to-GDP ratio over the infinite horizon, including the costs of ageing. The critical values used are 2 and 6 pps. of GDP. The DSA results
are used to further qualify the long-term risk classification, in particular in cases when debt vulnerabilities are identified (a medium / high DSA risk category).
[2] The charts present a series of sensitivity tests around the baseline scenario, as well as alternative policy scenarios, in particular: the historical structural primary balance (SPB)
scenario (where the SPB is set at its historical average), the Stability and Growth Pact (SGP) scenario (where fiscal policy is assumed to evolve in line with the main provisions of the
SGP), a higher interest rate scenario (+1 pp. compared to the baseline), a lower GDP growth scenario (-0.5 pp. compared to the baseline) and a negative shock on the SPB (calibrated
on the basis of the forecasted change). An adverse combined scenario and enhanced sensitivity tests (on the interest rate and growth) are also included, as well as stochastic
projections. Detailed information on the design of these projections can be found in the FSR 2018.
HR - Debt projections baseline scenario
[1] The first table presents the baseline no-fiscal policy change scenario projections. It shows the projected government debt dynamics and its decomposition between the primary
balance, snowball effects and stock-flow adjustments. Snowball effects measure the net impact of the counteracting effects of interest rates, inflation, real GDP growth (and exchange
rates in some countries). Stock-flow adjustments include differences in cash and accrual accounting, net accumulation of assets, as well as valuation and other residual effects.
[3] The second table presents the overall fiscal risk classification over the short, medium and long-term.
a. For the short-term, the risk category (low/high) is based on the S0 indicator. S0 is an early-detection indicator of fiscal stress in the upcoming year, based on 25 fiscal and financial-
competitiveness variables that have proven in the past to be leading indicators of fiscal stress. The critical threshold beyond which fiscal distress is signalled is 0.46.
50
55
60
65
70
75
80
85
90
95
100
2016 2017 2018 2019 2020 2021 2022 2023 2024 2025 2026 2027 2028 2029
Debt as % of GDP - HR
Baseline Enhanced lower GDP growth scenario
Adverse combined scenario Enhanced higher interest rate scenario
50
60
70
80
90
100
2016 2017 2018 2019 2020 2021 2022 2023
(% of GDP) Stochastic debt projections 2019-2023 - HR
p10_p20 p20_p40 p40_p60
p60_p80 p80_p90 p50 Baseline
50
55
60
65
70
75
80
85
90
95
100
2016 2017 2018 2019 2020 2021 2022 2023 2024 2025 2026 2027 2028 2029
Debt as % of GDP - HR
Baseline Historical SPB scenario SGP scenario
50
55
60
65
70
75
80
85
90
95
100
2016 2017 2018 2019 2020 2021 2022 2023 2024 2025 2026 2027 2028 2029
Debt as % of GDP - HR
Baseline Higher interest rate scenario
Negative shock on the SPB Lower GDP growth scenario
BaselineHistorical
SPB
Lower GDP
growth
Higher
interest rate
Negative
shock on
SPB
Stochastic
projections
Risk category MEDIUM MEDIUM MEDIUM MEDIUM MEDIUM MEDIUM
Debt level (2029) 64.3 80.7 68.2 69.4 68.9
Debt peak year 2018 2029 2018 2018 2018
Percentile rank 38.0% 68.0%
Probability debt higher 35.8%
Dif. between percentiles 40.8
MEDIUM
Long
termDSA
MEDIUM
Debt sustainability analysis (detail)Medium
term
MEDIUM MEDIUM
Short
term
LOW
(S0 = 0.2) (S1 = 0.2)
S2
LOW
(S2 = -2.1)
S1
ANNEX B: COMMISSION DEBT SUSTAINABILITY ANALYSIS AND
FISCAL RISKS

63
ANNEX C: STANDARD TABLES
Table C.1: Financial market indicators
(1) Latest data Q3 2018. Includes not only banks but all monetary financial institutions excluding central banks.
(2) Latest data Q2 2018.
(3) Quarterly values are annualised.
* Measured in basis points.
Source: European Commission (long-term interest rates); World Bank (gross external debt); Eurostat (private debt); ECB (all
other indicators).
2013 2014 2015 2016 2017 2018
Total assets of the banking sector (% of GDP)(1) 132,4 133,1 129,8 124,6 119,2 115,2
Share of assets of the five largest banks (% of total assets) 72,9 72,3 72,7 73,0 72,8 -
Foreign ownership of banking system (% of total assets)(2) 89,9 90,2 90,5 90,1 90,8 90,7
Financial soundness indicators:(2)
- non-performing loans (% of total loans) - 13,6 13,0 10,7 8,8 8,7
- capital adequacy ratio (%) 19,6 20,4 19,2 20,8 21,4 20,3
- return on equity (%)(3) 0,6 3,9 -6,8 8,9 5,9 11,1
Bank loans to the private sector (year-on-year % change)(1) -0,1 -1,7 -2,4 0,5 4,5 5,0
Lending for house purchase (year-on-year % change)(1) -2,0 -2,8 -1,9 -2,1 2,7 3,3
Loan to deposit ratio(2) - 92,0 89,2 85,3 82,1 83,1
Central Bank liquidity as % of liabilities(1) 0,0 0,0 0,1 0,3 0,4 0,3
Private debt (% of GDP) 117,7 118,0 113,0 105,3 98,4 -
Gross external debt (% of GDP)(2)
- public 32,5 35,5 35,7 31,7 29,1 27,7
- private 50,3 51,8 48,7 44,7 40,7 39,0
Long-term interest rate spread versus Bund (basis points)* 311,1 288,8 305,5 339,6 245,0 176,9
Credit default swap spreads for sovereign securities (5-year)* 303,7 276,1 273,1 240,1 148,4 94,5

C. Standard Tables
64
Table C.2: Headline Social Scoreboard indicators
(1) People at risk of poverty or social exclusion (AROPE): individuals who are at risk of poverty (AROP) and/or suffering from
severe material deprivation (SMD) and/or living in households with zero or very low work intensity (LWI).
AROPE: At-risk-of-poverty or social exclusion rate (% of total population). People who are at-risk-of poverty (AROP) and/or
suffering from severe material deprivation (SMD) and/or living in household with zero or very low work intensity (LWI).
AROP: At-risk-of poverty rate (% of total population). People who have an equivalised disposable income below 60 % of the
national equivalised median income.
SMD: Severe material deprivation rate (% of total population). People who experience at least 4 out of 9 deprivations: people
cannot afford to i) pay their rent or utility bills, ii) keep their home adequately warm, iii) face unexpected expenses, iv) eat
meat, fish, or a protein equivalent every second day, v) enjoy a week of holiday away from home once a year, vi) have a
car, vii) have a washing machine, viii) have a colour tv, or ix) have a telephone.
LWI: People living in low work intensity households (% of population 0-59). People living in households where the adults work
less than 20 % of their total work-time potential during the previous 12 months.
AROPE, AROP: previous year income, SMD: current year, JLH: previous year.
(2) Unemployed persons are all those who were not employed but had actively sought work and were ready to begin
working immediately or within two weeks.
(3) Long-term unemployed are people who have been unemployed for at least 12 months.
(4) Gross disposable household income is defined in unadjusted terms, according to the draft Joint Employment Report 2019.
(5) Reduction in percentage of the risk of poverty rate, due to social transfers (calculated comparing at-risk-of poverty rates
before social transfers with those after transfers; pensions are not considered as social transfers in the calculation).
(6) Average of first three quarters of 2018 for the employment rate, long-term unemployment rate and gender employment
gap. Data for unemployment rate is annual (except for DK, EE, EL, HU, IT and UK data based on first three quarters of 2018).
Source: Eurostat.
2013 2014 2015 2016 2017 2018(6)
Equal opportunities and access to the labour market
Early leavers from education and training
(% of population aged 18-24)4,5 2,8 2,8 2,8 3,1 :
Gender employment gap (pps) 8,8 10,0 9,5 9,6 10,6 9,9
Income inequality, measured as quintile share ratio (S80/S20) 5,3 5,1 5,2 5,0 5,0 :
At-risk-of-poverty or social exclusion rate(1)
(AROPE) 29,9 29,3 29,1 27,9 26,4 :
Young people neither in employment nor in education and
training (% of population aged 15-24)19,6 19,3 18,1 16,9 15,4 :
Dynamic labour markets and fair working conditions†
Employment rate (20-64 years) 57,2 59,2 60,6 61,4 63,6 65,2
Unemployment rate(2)
(15-74 years) 17,4 17,2 16,1 13,4 11,0 8,5
Long-term unemployment rate(3)
(as % of active population) 11,0 10,1 10,2 6,6 4,6 3,5
Gross disposable income of households in real terms per
capita(4)
(Index 2008=100) : : : : : :
Annual net earnings of a full-time single worker without
children earning an average wage (levels in PPS, three-year
average)
: : 12789 13113 : :
Annual net earnings of a full-time single worker without
children earning an average wage (percentage change, real
terms, three-year average)
: : : 2,3 : :
Public support / Social protection and inclusion
Impact of social transfers (excluding pensions) on poverty
reduction(5) 34,3 35,1 35,5 28,6 24,8 :
Children aged less than 3 years in formal childcare 11,0 17,1 11,8 15,7 15,9 :
Self-reported unmet need for medical care 3,3 3,3 1,9 1,7 1,6 :
Individuals who have basic or above basic overall digital skills
(% of population aged 16-74): : 51,0 55,0 41,0 :
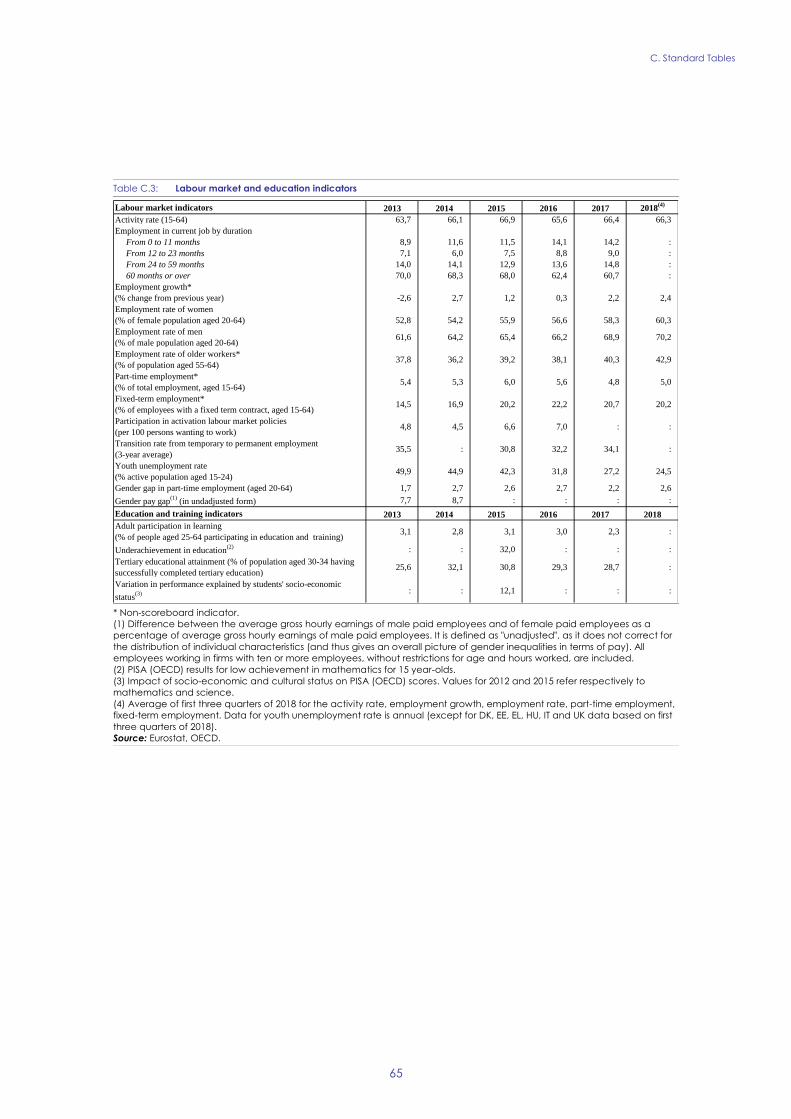
C. Standard Tables
65
Table C.3: Labour market and education indicators
* Non-scoreboard indicator.
(1) Difference between the average gross hourly earnings of male paid employees and of female paid employees as a
percentage of average gross hourly earnings of male paid employees. It is defined as "unadjusted", as it does not correct for
the distribution of individual characteristics (and thus gives an overall picture of gender inequalities in terms of pay). All
employees working in firms with ten or more employees, without restrictions for age and hours worked, are included.
(2) PISA (OECD) results for low achievement in mathematics for 15 year-olds.
(3) Impact of socio-economic and cultural status on PISA (OECD) scores. Values for 2012 and 2015 refer respectively to
mathematics and science.
(4) Average of first three quarters of 2018 for the activity rate, employment growth, employment rate, part-time employment,
fixed-term employment. Data for youth unemployment rate is annual (except for DK, EE, EL, HU, IT and UK data based on first
three quarters of 2018).
Source: Eurostat, OECD.
Labour market indicators 2013 2014 2015 2016 2017 2018(4)
Activity rate (15-64) 63,7 66,1 66,9 65,6 66,4 66,3
Employment in current job by duration
From 0 to 11 months 8,9 11,6 11,5 14,1 14,2 :
From 12 to 23 months 7,1 6,0 7,5 8,8 9,0 :
From 24 to 59 months 14,0 14,1 12,9 13,6 14,8 :
60 months or over 70,0 68,3 68,0 62,4 60,7 :
Employment growth*
(% change from previous year) -2,6 2,7 1,2 0,3 2,2 2,4
Employment rate of women
(% of female population aged 20-64) 52,8 54,2 55,9 56,6 58,3 60,3
Employment rate of men
(% of male population aged 20-64)61,6 64,2 65,4 66,2 68,9 70,2
Employment rate of older workers*
(% of population aged 55-64)37,8 36,2 39,2 38,1 40,3 42,9
Part-time employment*
(% of total employment, aged 15-64)5,4 5,3 6,0 5,6 4,8 5,0
Fixed-term employment*
(% of employees with a fixed term contract, aged 15-64)14,5 16,9 20,2 22,2 20,7 20,2
Participation in activation labour market policies
(per 100 persons wanting to work)4,8 4,5 6,6 7,0 : :
Transition rate from temporary to permanent employment
(3-year average)35,5 : 30,8 32,2 34,1 :
Youth unemployment rate
(% active population aged 15-24)49,9 44,9 42,3 31,8 27,2 24,5
Gender gap in part-time employment (aged 20-64) 1,7 2,7 2,6 2,7 2,2 2,6
Gender pay gap(1)
(in undadjusted form) 7,7 8,7 : : : :
Education and training indicators 2013 2014 2015 2016 2017 2018
Adult participation in learning
(% of people aged 25-64 participating in education and training)3,1 2,8 3,1 3,0 2,3 :
Underachievement in education(2) : : 32,0 : : :
Tertiary educational attainment (% of population aged 30-34 having
successfully completed tertiary education)25,6 32,1 30,8 29,3 28,7 :
Variation in performance explained by students' socio-economic
status(3) : : 12,1 : : :

C. Standard Tables
66
Table C.4: Social inclusion and health indicators
* Non-scoreboard indicator.
(1) At-risk-of-poverty rate (AROP): proportion of people with an equivalised disposable income below 60 % of the national
equivalised median income.
(2) Proportion of people who experience at least four of the following forms of deprivation: not being able to afford to i) pay
their rent or utility bills, ii) keep their home adequately warm, iii) face unexpected expenses, iv) eat meat, fish or a protein
equivalent every second day, v) enjoy a week of holiday away from home once a year, vi) have a car, vii) have a washing
machine, viii) have a colour TV, or ix) have a telephone.
(3) Percentage of total population living in overcrowded dwellings and exhibiting housing deprivation.
(4) People living in households with very low work intensity: proportion of people aged 0-59 living in households where the
adults (excluding dependent children) worked less than 20 % of their total work-time potential in the previous 12 months.
(5) Ratio of the median individual gross pensions of people aged 65-74 relative to the median individual gross earnings of
people aged 50-59.
(6) Fixed broadband take up (33 %), mobile broadband take up (22 %), speed (33 %) and affordability (11 %), from the Digital
Scoreboard.
Source: Eurostat, OECD.
2012 2013 2014 2015 2016 2017
Expenditure on social protection benefits* (% of GDP)
Sickness/healthcare 7,4 6,9 6,8 7,1 7,0 :
Disability 2,7 2,7 2,6 2,5 2,3 :
Old age and survivors 8,7 9,0 9,3 9,1 9,0 :
Family/children 1,6 1,6 1,9 1,9 1,8 :
Unemployment 0,5 0,5 0,5 0,6 0,5 :
Housing 0,0 0,0 0,0 0,0 0,0 :
Social exclusion n.e.c. 0,2 0,2 0,3 0,3 0,3 :
Total 21,1 20,9 21,4 21,4 20,9 :
of which: means-tested benefits 1,1 1,1 1,1 1,1 1,0 :
General government expenditure by function (% of GDP, COFOG)
Social protection 15,5 15,4 15,9 15,3 14,7 :
Health 7,2 6,5 6,6 6,4 6,5 :
Education 4,9 5,1 4,8 4,8 4,8 :
Out-of-pocket expenditure on healthcare (% of total health expenditure) : 12,8 15,8 15,5 15,4 :
Children at risk of poverty or social exclusion (% of people
aged 0-17)*34,8 29,3 29,0 28,2 26,6 25,8
At-risk-of-poverty rate(1)
(% of total population) 20,4 19,5 19,4 20,0 19,5 20,0
In-work at-risk-of-poverty rate (% of persons employed) 6,0 6,2 5,7 5,9 5,6 5,8
Severe material deprivation rate(2)
(% of total population) 15,9 14,7 13,9 13,7 12,5 10,3
Severe housing deprivation rate(3)
, by tenure status
Owner, with mortgage or loan 11,6 5,8 2,3 6,1 5,4 6,2
Tenant, rent at market price 17,6 7,1 16,0 15,0 7,6 5,5
Proportion of people living in low work intensity households(4)
(% of people aged 0-59)16,8 14,8 14,7 14,4 13,0 12,2
Poverty thresholds, expressed in national currency at constant prices* 20922 19330 19585 20544 21568 23293
Healthy life years (at the age of 65)
Females 7,9 5,9 5,8 4,5 4,9 :
Males 7,7 5,5 6,0 4,7 5,2 :
Aggregate replacement ratio for pensions(5)
(at the age of 65) 0,4 0,4 0,4 0,4 0,4 0,4
Connectivity dimension of the Digital Economy and Society Index
(DESI)(6) : : 29,9 35,4 42,0 45,0
GINI coefficient before taxes and transfers* 50,6 50,8 50,1 51,0 49,9 49,4
GINI coefficient after taxes and transfers* 30,9 30,9 30,2 30,6 29,8 29,9

C. Standard Tables
67
Table C.5: Product market performance and policy indicators
(1) Value added in constant prices divided by the number of persons employed.
(2) Compensation of employees in current prices divided by value added in constant prices.
(3) The methodologies, including the assumptions, for this indicator are shown in detail here:
http://www.doingbusiness.org/methodology
(4) Average of the answer to question Q7B_a. "[Bank loan]: If you applied and tried to negotiate for this type of financing
over the past six months, what was the outcome?". Answers were codified as follows: zero if received everything, one if
received 75 % and above, two if received below 75 %, three if refused or rejected and treated as missing values if the
application is still pending or don't know.
(5) Percentage population aged 15-64 having completed tertiary education.
(6) Percentage population aged 20-24 having attained at least upper secondary education.
(7) Index: 0 = not regulated; 6 = most regulated. The methodologies of the OECD product market regulation indicators are
shown in detail here: http://www.oecd.org/competition/reform/indicatorsofproductmarketregulationhomepage.htm
(8) Aggregate OECD indicators of regulation in energy, transport and communications (ETCR).
Source: European Commission; World Bank — Doing Business (for enforcing contracts and time to start a business); OECD (for
the product market regulation indicators); SAFE (for outcome of SMEs' applications for bank loans).
Performance indicators 2012 2013 2014 2015 2016 2017
Labour productivity per person(1)
growth (t/t-1) in %
Labour productivity growth in industry -2,72 2,53 0,79 4,23 5,07 -0,39
Labour productivity growth in construction -5,62 -2,51 0,92 -2,90 -0,86 6,18
Labour productivity growth in market services -1,03 2,64 -4,35 -0,56 -0,35 -2,48
Unit Labour Cost (ULC) index(2)
growth (t/t-1) in %
ULC growth in industry 6,01 1,61 -2,66 -1,36 -3,77 1,33
ULC growth in construction 8,64 -2,42 -3,39 4,02 -1,00 2,02
ULC growth in market services 1,48 -1,33 1,73 -1,29 2,23 0,15
Business environment 2012 2013 2014 2015 2016 2017
Time needed to enforce contracts(3)
(days) 572 650 650 650 650 650
Time needed to start a business(3)
(days) 22,5 22,5 22,5 22,5 22,5 22,5
Outcome of applications by SMEs for bank loans(4) : 0,19 0,88 0,31 0,60 0,10
Research and innovation 2012 2013 2014 2015 2016 2017
R&D intensity 0,75 0,81 0,78 0,84 0,84 0,86
General government expenditure on education as % of GDP 4,90 5,10 4,80 4,80 4,80 :
Employed people with tertiary education and/or people employed in
science and technology as % of total employment32 36 37 38 38 38
Population having completed tertiary education(5) 16 17 19 20 20 21
Young people with upper secondary education(6) 94 94 96 96 96 96
Trade balance of high technology products as % of GDP -1,27 -1,48 -1,52 -1,75 -1,85 -1,15
Product and service markets and competition 2003 2008 2013
OECD product market regulation (PMR)(7)
, overall : : 2,08
OECD PMR(7)
, retail : : 1,42
OECD PMR(7)
, professional services : : 3,70
OECD PMR(7)
, network industries(8) : : 2,75

C. Standard Tables
68
Table C.6: Green growth
(1) All macro intensity indicators are expressed as a ratio of a physical quantity to GDP (in 2010 prices).
(2) Gross inland energy consumption (in kgoe) divided by GDP (in EUR).
(3) Greenhouse gas emissions (in kg CO2 equivalents) divided by GDP (in EUR).
(4) Domestic material consumption (in kg) divided by GDP (in EUR).
(5) Waste (in kg) divided by GDP (in EUR).
(6) Balance of energy exports and imports, expressed as % of GDP.
(7) Proportion of 'energy' items in the consumption basket used for the construction of the HICP.
(8) Energy component of HICP, and total HICP inflation (annual % change).
(9) Real energy costs as % of total value added for the economy.
(10) Final energy consumption of industry (in kgoe) divided by gross value added of industry (in 2010 EUR).
(11) Real costs as % of value added for manufacturing sectors.
(12) Share of gross value added of the energy-intensive industries in GDP.
(13) Consumption band 500–20 00MWh and 10 000–100 000 GJ; figures excl. VAT.
(14) Ratio of recycled and composted municipal waste to total municipal waste.
(15) Government spending on R&D for these categories as % of GDP.
(16) Based on GHG emissions (excluding aviation, land use, land use change and forestry) as reported by Member States to
the European Environment Agency.
(17) Final energy consumption of transport activity (kgoe) divided by transport industry gross value added (in 2010 EUR).
(18) GHG emissions in transport activity divided by gross value added of the transport industry.
(19) Net energy imports divided by gross inland energy consumption incl. consumption of international bunker fuels.
(20) Covers oil, gas and coal. Smaller values indicate larger diversification and hence lower risk.
(21) Herfindahl index covering natural gas, total petrol products, nuclear heat, renewable energies and solid fuels.
* European Commission and European Environment Agency.
Source: European Commission and European Environment Agency (Share of GHG emissions covered by ETS); European
Commission (Environmental taxes over labour taxes and GDP); Eurostat (all other indicators).
Green growth performance 2012 2013 2014 2015 2016 2017
Macroeconomic(1)
Energy intensity(2) kgoe / € 0,20 0,20 0,19 0,19 0,18 0,19
Carbon intensity(3) kg / € 0,59 0,56 0,54 0,54 0,52 -
Resource intensity (reciprocal of resource productivity)(4) kg / € 0,92 0,97 0,88 0,92 0,91 0,84
Waste intensity(5) kg / € 0,08 - 0,09 - 0,11 -
Energy balance of trade(6) % GDP -5,6 -5,1 -4,0 -3,4 -2,7 -2,9
Weighting of energy in HICP(7) % 14,5 15,7 16,5 14,9 10,8 11,6
Difference between energy price change and inflation(8) % 11,4 2,6 -0,2 -2,7 -4,4 -5,3
Real unit of energy cost(9) % of value
added9,4 9,0 8,7 9,0 9,3 -
Ratio of environmental taxes to labour taxes ratio 0,18 0,20 0,22 0,23 0,24 -
Environmental taxes % GDP 2,6 2,9 3,2 3,4 3,5 3,4
Sectoral
Industry energy intensity(10) kgoe / € 0,12 0,12 0,12 0,11 0,11 -
Real unit energy cost for manufacturing industry excl.
refining(11)
% of value
added5,6 5,5 5,4 5,5 5,6 -
Share of energy-intensive industries in the economy(12) % GDP 9,2 9,2 9,4 9,5 9,8 -
Electricity prices for medium-sized industrial users(13) € / kWh 0,09 0,09 0,09 0,09 0,09 0,09
Gas prices for medium-sized industrial users € / kWh 0,04 0,04 0,04 0,04 0,03 0,02
Public R&D for energy(15) % GDP 0,00 0,00 0,00 0,00 0,00 0,00
Public R&D for environmental protection(15) % GDP 0,00 0,00 0,00 0,00 0,01 0,00
Municipal waste recycling rate(14) % 14,7 14,9 16,5 18,0 21,0 23,6
Share of GHG emissions covered by ETS(16)* % 37,5 37,0 36,7 37,2 34,1 -
Transport energy intensity(17) kgoe / € 1,23 1,34 1,36 1,42 1,37 -
Transport carbon intensity(18) kg / € 3,45 3,75 3,81 4,00 3,91 -
Security of energy supply
Energy import dependency(19) % 49,9 47,5 44,3 48,9 48,5 53,3
Aggregated supplier concentration index(20) HHI 19,8 28,2 19,5 14,7 12,6 -
Diversification of energy mix(21) HHI 0,26 0,27 0,28 0,26 0,27 0,28

69
Building on the Commission proposal for the next Multi-Annual Financial Framework for the period
2021-2027 of 2 May 2018 (COM (2018) 321), this Annex presents the preliminary Commission services
views on priority investment areas and framework conditions for effective delivery for the 2021-2027
Cohesion Policy. These priority investment areas are derived from the broader context of investment
bottlenecks, investment needs and regional disparities assessed in the report. This Annex (57
) provides the
basis for a dialogue between Croatia and the Commission services in view of the programming of the
cohesion policy funds (European Regional Development Fund, Cohesion Fund and European Social Fund
Plus).
Policy Objective 1: A Smarter Europe – Innovative and smart industrial transformation
The innovativeness of the Croatian economy is low and progress in improving innovation performance is
very limited. High priority investment needs (58
) have been identified to enhance research and
innovation capacities and the uptake of advanced technologies, by taking into account territorial
differences, and in particular to:
strengthen innovation performance and foster productivity growth by identifying smart specialisation
areas on the basis of national and regional needs and potential;
increase the number of innovative firms in the smart specialisation areas with the highest growth
potential;
develop universities’ and research institutions’ capacity to enhance market relevance of their research
projects, build critical research mass and attract talent in the strategic smart specialisation areas;
support collaboration between universities and businesses, enabling transfer of technology and
commercialisation of research outcomes; support cross-regional, transnational and interregional
projects;
strengthen governance of the smart specialisation strategy.
Croatia has made progress in digitalisation but further action is needed to exploit its potential. Priority
investment needs have been identified to reap the benefits of digitalisation for citizens, companies and
governments, and in particular to:
support integration of digital technology in small and medium-sized enterprises including
infrastructures and services, by taking into account territorial differences;
promote the range of interoperable e-services and their uptake by citizens;
upscale and accelerate Digital Public Services in a systemic way.
Croatia ranks last among peers in business environment; Croatian firms are weakly integrated in global
value chains. Business investment in research and development is low and concentrated in large
companies, with low participation of small and medium-sized enterprises. High priority investment needs
have been identified to enhance growth and competitiveness of small and medium-sized enterprises,
and in particular to:
move up the global value chains;
identify new markets, cooperation networks; stimulate potential for innovation clusters by looking
into emerging trends, markets and concentration in high-performing sectors;
enhance quality of business support institutions and business environment.
Skills shortages and mismatches are among the main barriers for further economic development of
Croatia. High priority investment needs have been identified to develop skills for smart specialisation,
industrial transition and entrepreneurship, and in particular to:
reskill and upskill in smart specialisation areas, with a particular attention to supporting acquisition of
key competences including digital skills;
strengthen education and training institutions including higher education and centres of vocational
excellence to foster skills for innovation and stimulate entrepreneurship culture.
(57) This Annex is to be considered in conjunction with the EC Proposal for a Regulation of the European Parliament and of the
Council on the European Regional Development Fund and on the Cohesion Fund COM(2018) 372 and the EC Proposal for a
Regulation of the European Parliament and of the Council on the European Social Fund Plus COM(2018) 382, in particular as
regards the requirements for thematic concentration and urban earmarking outlined in these proposals. (58) The intensity of needs is classified in three categories in a descending order – high priority needs, priority needs, needs.
ANNEX D: INVESTMENT GUIDANCE ON COHESION POLICY
FUNDING 2021-2027 FOR CROATIA

D. Investment Guidance on Cohesion Policy Funding 2021-2027 for Croatia
70
Policy Objective 2: A low carbon and greener Europe – Clean and fair energy transition, Green
and blue investment, circular economy, climate adaptation and risk prevention
The shift away from landfilling towards separate collection and recycling is stalling. High priority
investment needs have been identified to promote the transition to a circular economy, and in
particular to:
support systems of separate collection, composting and sorting plants and other measures preparing
for reuse and recycling, develop alternatives to raw materials and increase demand for recycled
content;
modernise and upgrade existing recycling and waste treatment infrastructure to adapt to new long-
term-recycling targets;
raise citizen awareness to sustainable consumption practices and behaviour and improve capacity for
all stakeholders including though cooperation and share of experiences between Member States;
improve the knowledge base and monitoring of waste and material streams.
While water supply networks are quite well developed, sanitation lags behind. High priority investment
needs have been identified to promote sustainable water management, and in particular to:
invest in the collection and treatment of wastewater in agglomerations above 2000 population
equivalent;
invest in drinking water to reduce leakage of water networks and ensure quality requirements for
drinking water where they are not met (e.g. Eastern Slavonia);
increase capacity of beneficiaries especially at local and regional level to ensure long-term
sustainability of the sector.
The economy in general and tourism in particular, depend on the sustainable management of natural
resources. Priority investment needs have been identified to enhance biodiversity, green infrastructure
in the urban environment, and reducing pollution, and in particular to:
support biodiversity as well as ecosystem conservation and restoration projects, species protection
measures and green infrastructure.
Croatia faces considerable risks caused by extreme weather conditions, especially floods and forest fires.
Priority investment needs have been identified to promote climate change adaptation, risk prevention
and disaster resilience, and in particular to:
address risks as identified in the national risk assessment and climate strategy; primarily floods and
forest fires.
High energy intensity could be decreased by increasing energy efficiency High priority investment needs
have been identified to promote energy efficiency measures and developing smart energy systems, in
particular to:
reduce energy consumption in the building sector i.e. renovation of public and residential buildings;
tackle the problem of energy poor and improve energy efficiency of district heating networks;
deploy solutions for smart electricity, distribution grids and storage linked to demand and supply.
While in 2016, renewable energy was above EU average, notably thanks to its strong hydropower
industry, the next phase of renewable energy projects, especially wind and solar have considerable
development potential. Priority investment needs have been identified to promote renewable energy and
in particular to:
support transition to renewables in heating and cooling;
ensure further penetration of sustainable and clean energy primarily wind and solar energy addressing
in particular energy self-reliance of islands in line with the “Clean Energy for EU islands” initiative.
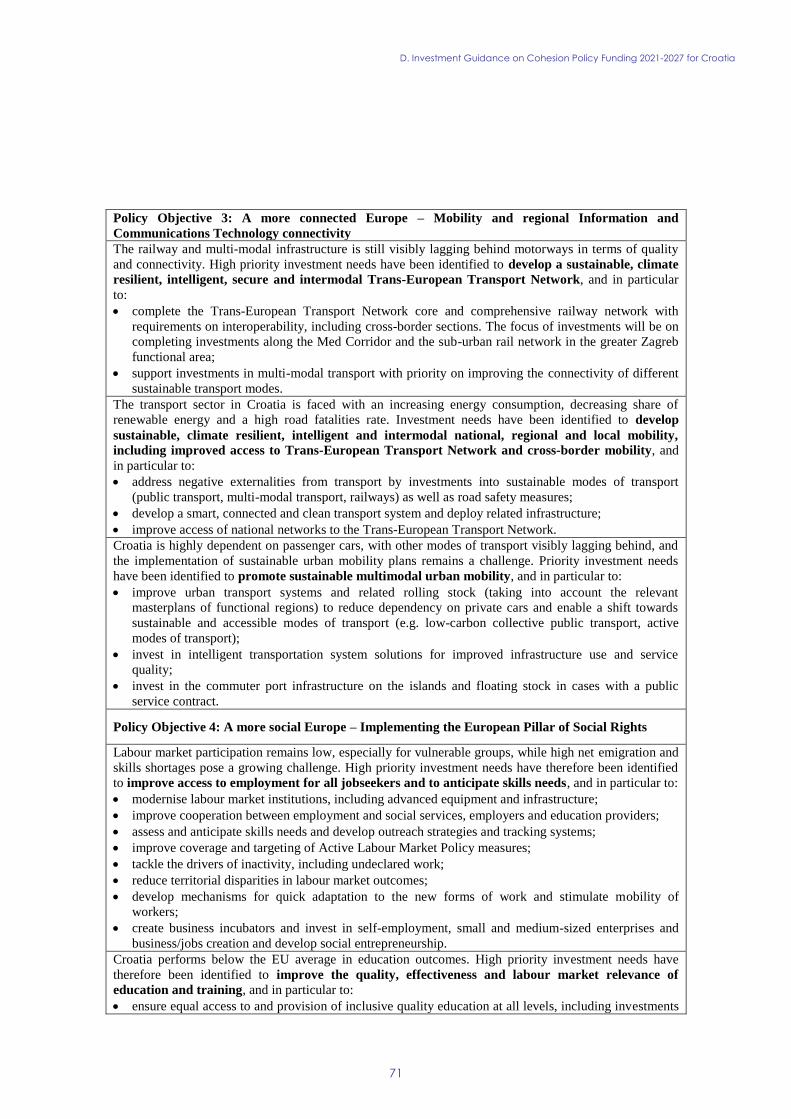
D. Investment Guidance on Cohesion Policy Funding 2021-2027 for Croatia
71
Policy Objective 3: A more connected Europe – Mobility and regional Information and
Communications Technology connectivity
The railway and multi-modal infrastructure is still visibly lagging behind motorways in terms of quality
and connectivity. High priority investment needs have been identified to develop a sustainable, climate
resilient, intelligent, secure and intermodal Trans-European Transport Network, and in particular
to:
complete the Trans-European Transport Network core and comprehensive railway network with
requirements on interoperability, including cross-border sections. The focus of investments will be on
completing investments along the Med Corridor and the sub-urban rail network in the greater Zagreb
functional area;
support investments in multi-modal transport with priority on improving the connectivity of different
sustainable transport modes.
The transport sector in Croatia is faced with an increasing energy consumption, decreasing share of
renewable energy and a high road fatalities rate. Investment needs have been identified to develop
sustainable, climate resilient, intelligent and intermodal national, regional and local mobility,
including improved access to Trans-European Transport Network and cross-border mobility, and
in particular to:
address negative externalities from transport by investments into sustainable modes of transport
(public transport, multi-modal transport, railways) as well as road safety measures;
develop a smart, connected and clean transport system and deploy related infrastructure;
improve access of national networks to the Trans-European Transport Network.
Croatia is highly dependent on passenger cars, with other modes of transport visibly lagging behind, and
the implementation of sustainable urban mobility plans remains a challenge. Priority investment needs
have been identified to promote sustainable multimodal urban mobility, and in particular to:
improve urban transport systems and related rolling stock (taking into account the relevant
masterplans of functional regions) to reduce dependency on private cars and enable a shift towards
sustainable and accessible modes of transport (e.g. low-carbon collective public transport, active
modes of transport);
invest in intelligent transportation system solutions for improved infrastructure use and service
quality;
invest in the commuter port infrastructure on the islands and floating stock in cases with a public
service contract.
Policy Objective 4: A more social Europe – Implementing the European Pillar of Social Rights
Labour market participation remains low, especially for vulnerable groups, while high net emigration and
skills shortages pose a growing challenge. High priority investment needs have therefore been identified
to improve access to employment for all jobseekers and to anticipate skills needs, and in particular to:
modernise labour market institutions, including advanced equipment and infrastructure;
improve cooperation between employment and social services, employers and education providers;
assess and anticipate skills needs and develop outreach strategies and tracking systems;
improve coverage and targeting of Active Labour Market Policy measures;
tackle the drivers of inactivity, including undeclared work;
reduce territorial disparities in labour market outcomes;
develop mechanisms for quick adaptation to the new forms of work and stimulate mobility of
workers;
create business incubators and invest in self-employment, small and medium-sized enterprises and
business/jobs creation and develop social entrepreneurship.
Croatia performs below the EU average in education outcomes. High priority investment needs have
therefore been identified to improve the quality, effectiveness and labour market relevance of
education and training, and in particular to:
ensure equal access to and provision of inclusive quality education at all levels, including investments

D. Investment Guidance on Cohesion Policy Funding 2021-2027 for Croatia
72
in infrastructure and equipment, but especially in early childhood education and care, in particular for
vulnerable groups and in less developed areas;
upskill and reskill the labour force through adult learning; modernise equipment and infrastructure;
provide support to education and training of teachers and trainers.
The share of the population at risk of poverty or social exclusion remains high. High priority investment
needs have therefore been identified to foster active inclusion with a view to promoting equal
opportunities and addressing material deprivation, and in particular to:
improve social services and infrastructure of centres to support vulnerable groups and families;
improve the transition from residential/institutional care to family and community-based care;
reduce territorial disparities in social outcomes;
address material deprivation through food and basic material assistance to the most deprived;
promote social innovation.
Health outcomes remain weak and inefficiencies in the health care sector persist. High priority investment
needs have therefore been identified to improve accessibility, effectiveness and resilience of healthcare
and long-term care services, and in particular to:
restructure inpatient care and strengthen outpatient services, particularly primary and long term care
services, including infrastructure and equipment;
tackle geographical obstacles in access to healthcare and address gaps in healthcare infrastructure and
shortages in workforce, based on mapping of needs;
support implementation of quality standards in healthcare;
develop health promotion and disease prevention programmes;
continue the rollout of e-health services and improve digital solutions as telemedicine.
Policy Objective 5 – A Europe closer to citizens by fostering the sustainable and integrated
development of urban, rural and coastal areas and local initiatives
Croatia faces noticeable territorial imbalances that weigh on its competiveness and sustainable growth
potential. High priority investment needs have been identified to foster integrated socio-economic
development, including for rural, coastal areas or islands, in particular to:
reduce inequalities between regions and urban-rural divide by unleashing the endogenous potential of
lagging regions (e.g. Eastern Croatia), addressing geographical specificities (islands), boosting the
economic activity and creating the necessary linkages with leading poles;
support community building by integrated territorial development strategies in rural/sparsely
populated areas, empowering local stakeholders possibly through the use of Community-led local
development.
Croatia's urban centres offer better job opportunities for better qualified people but do not fully play their
catalytic role as engines of regional growth. Priority investment needs have been identified and should be
further specified in integrated urban development strategies to foster the integrated socio-economic
development in urban areas, in particular to:
reinforce the role of leading economic centres as drivers of regional growth and of sustainable and
integrated development of their functional areas (university centres, places of innovation, urban-rural
linkages, etc.);
support the regeneration of deprived urban neighbourhoods to increase attractiveness for business and
social inclusion using Community-led local development when possible;
strengthen capacities of local authorities to develop sound integrated territorial strategies.
Factors for effective delivery of Cohesion policy
Additional efforts are needed to increase the administrative capacity necessary for the effective
administration and implementation of the Funds, in particular through:
enhanced dialogue with stakeholders, including with social partners, and strengthened capacities of
the final beneficiaries, and stakeholders at all levels to effectively implement projects and ensure long
term sustainability of investments including through institutional consolidation;
reduced administrative burden, improved and simplified procedures, eliminating excessive
documentation and over bureaucratic requirements to project proposals;
D. Investment Guidance on Cohesion Policy Funding 2021-2027 for Croatia
73
consolidated and properly functioning management and control systems, as well as well working
evaluation culture in order to enable proper monitoring and evidence-based decisions on
implementation of EU funds;
improved public procurement performance ensuring sufficient staff and its support;
improved and more efficient measures to prevent and address conflict of interest, fraud and
corruption;
development and implementation of a roadmap on administrative capacity building on the pilot action
on frontloading administrative capacity – to effectively manage and use EU funds;
broader use of financial instruments and/or contributions to a Croatian’s compartment under InvestEU
for revenue-generating and cost-saving activities.
74
Atoyan, R. and al. (2016), Emigration and its economic impact on Eastern Europe, IMF Staff Discussion
Note, International Monetary Fund, Washington (www.imf.org/external/pubs/ft/sdn/2016/sdn1607.pdf).
Constitutional Court of the Republic of Croatia (USRH) (2018), Decision U-III-5074/2017 of 22 May
2018, Zagreb.
Dobrotić, I. and al. (2018), Analiza pristupačnosti, kvalitete, kapaciteta i financiranja sustava ranoga i
predškolskog odgoja i obrazovanja u republici hrvatskoj, Ministry of demography, family and social
policies, Zagreb
(https://mdomsp.gov.hr/UserDocsImages/Publikacije/Analiza%20pristupačnosti%20%2C%20kvalitete%
2C%20kapaciteta%20i%20financiranja%20sustava%20ranog%20i%20predškolskog%20odgoja%20i%20
obrazovanja%20u%20Republici%20Hrvatskoj.pdf).
Doolan, K., and al. (2018), 'Social inequalities in access to higher education in Croatia: five decades of
resilient findings', Journal of further and higher education, 42:4.
Eurofound (2013), Tackling undeclared work in Croatia and four EU candidate countries, Eurofound,
Dublin (www.eurofound.europa.eu/publications/report/2013/labour-market/tackling-undeclared-work-in-
croatia-and-four-eu-candidate-countries).
Eurofound (2018), Involvement of the national social partners in the European Semester 2017: Social
dialogue practices, Eurofound, Luxembourg
(www.eurofound.europa.eu/publications/report/2018/involvement-of-the-national-social-partners-in-the-
european-semester-2017-social-dialogue-practices).
European Commission (2016a), Connectivity for a competitive digital single market - Towards a
European gigabit society, European Commission, Brussels (https://ec.europa.eu/digital-single-
market/en/news/communication-connectivity-competitive-digital-single-market-towards-european-
gigabit-society).
European Commission (2016b), Country report Croatia 2016. Including an in-depth review on the
prevention and correction of macroeconomic imbalances, European Commission, Brussels
(https://ec.europa.eu/info/publications/2016-european-semester-country-reports_en).
European Commission (2016c), Detailed information on the assessment of regulation in professional
services, European Commission, Brussels (https://eur-lex.europa.eu/legal-
content/EN/TXT/PDF/?uri=CELEX:52016SC0436&from=DE).
European Commission (2016d), Employment and social developments in Europe, European Commission,
Luxembourg (https://ec.europa.eu/social/main.jsp?catId=738&langId=en&pubId=7952&visible=0&).
European Commission (2016e), European platform tackling undeclared work: Member state factsheets
and synthesis report, European Commission, Brussels
(www.ec.europa.eu/social/BlobServlet?docId=18860&langId=en).
European Commission (2016f), The early warning report for Croatia, European Commission, Brussels
(http://ec.europa.eu/environment/waste/pdf/early_warning_report_HR.pdf).
European Commission (2017a), Annual accident report 2017, European Commission, Brussels
(https://ec.europa.eu/transport/road_safety/sites/roadsafety/files/pdf/statistics/dacota/asr2017.pdf).
European Commission (2017b), Benchmarks for the assessment of private debt. Note for the Economic
Policy Committee, European Commission, Brussels.
REFERENCES

References
75
European Commission (2017c), Country report Croatia 2017. Including an in-depth review on the
prevention and correction of macroeconomic imbalances, European Commission, Brussels
(https://ec.europa.eu/info/publications/2017-european-semester-country-reports_en).
European Commission (2017d), Flash Eurobarometer 457. Report. Businesses’ attitudes towards
corruption in the EU, European Union, Brussels
(http://ec.europa.eu/commfrontoffice/publicopinion/index.cfm/Survey/getSurveyDetail/instruments/FLAS
H/search/corruption/surveyKy/2177).
European Commission (2017e), Impact assessment, European Commission, Brussels
(https://publications.europa.eu/en/publication-detail/-/publication/b2d53cb5-074f-11e8-b8f5-
01aa75ed71a1/language-en).
European Commission (2017f), Ninth report on the implementation status and the programmes for
implementation (as required by Article 17) of Council Directive 91/271/EEC concerning urban waste
water treatment, European Commission, Brussels (http://ec.europa.eu/environment/water/water-
urbanwaste/implementation/implementationreports_en.htm).
European Commission (2017g), Special Eurobarometer 470. Report. Corruption, European Union,
Brussels
(http://ec.europa.eu/commfrontoffice/publicopinion/index.cfm/Survey/getSurveyDetail/instruments/SPEC
IAL/surveyKy/2176).
European Commission (2017h), The 2018 ageing report: Underlying assumptions and projection
methodologies, European Commission, Brussels (https://ec.europa.eu/info/publications/economy-
finance/2018-ageing-report-underlying-assumptions-and-projection-methodologies_en).
European Commission (2018a), 2018 European Semester: Assessment of progress on structural reforms,
prevention and correction of macroeconomic imbalances, and results of in-depth reviews under
Regulation (EU) No 1176/2011, European Commission, Brussels
(https://ec.europa.eu/info/sites/info/files/2018-european-semester-country-report-communication_en.pdf).
European Commission (2018b), 2019 Alert mechanism report, European Commission, Brussels
(https://ec.europa.eu/info/sites/info/files/file_import/2019-european-semester-alert-mechanism-
report_en_0.pdf).
European Commission (2018c), Allocative efficiency in the euro area. Thematic discussion on growth and
jobs. Note for the Eurogroup, European Union, Brussels
(https://www.consilium.europa.eu/media/36345/eg_ae_20180827.pdf).
European Commission (2018d), Annual growth survey 2018, European Commission, Brussels
(https://ec.europa.eu/info/publications/2018-european-semester-annual-growth-survey_en).
European Commission (2018e), Country report Croatia 2018. Including an in-depth review on the
prevention and correction of macroeconomic imbalances, European Commission, Brussels
(https://ec.europa.eu/info/publications/2018-european-semester-country-reports_en).
European Commission (2018f), Croatia — Review of progress on policy measures relevant for the
correction of macroeconomic imbalances, European Commisssion, Brussels
(https://ec.europa.eu/info/business-economy-euro/economic-and-fiscal-policy-coordination/eu-economic-
governance-monitoring-prevention-correction/macroeconomic-imbalance-procedure/specific-
monitoring_en).

References
76
European Commission (2018g), Draft joint employment report, European Commission, Brussels
(https://eur-lex.europa.eu/legal-
content/EN/TXT/?qid=1547650919951&uri=CELEX%3A52018DC0761).
European Commission (2018h), Employment and social developments in Europe. Annual review 2018,
Publications Office of the European Union, Luxembourg
(https://ec.europa.eu/social/main.jsp?catId=738&langId=en&pubId=8110&furtherPubs=yes).
European Commission (2018i), ESIF 2014-2020 EU payments, European Commission, Brussels
(https://cohesiondata.ec.europa.eu/2014-2020/ESIF-2014-2020-EU-payments-daily-update-/gayr-92qh).
European Commission (2018j), European Economic Forecast. Autumn 2018, European Commission,
Brussels (https://ec.europa.eu/info/publications/economy-finance/european-economic-forecast-autumn-
2018_en).
European Commission (2018k), European innovation scoreboard 2018, European Commission, Brussels
(https://ec.europa.eu/growth/industry/innovation/facts-figures/scoreboards_en).
European Commission (2018l), Fundamentals-based private debt benchmarks: enhanced sample and
robustness checks. Note to LIME, not published.
European Commission (2018m), Pension adequacy report. Current and future income adequacy in old
age in the EU, Publications Office of the European Union, Luxembourg
(https://publications.europa.eu/en/publication-detail/-/publication/f0e89c3f-7821-11e8-ac6a-
01aa75ed71a1/language-en).
European Commission (2018n), Transport in the European Union. Current trends and issues, European
Commission, Brussels (https://ec.europa.eu/transport/sites/transport/files/2018-transport-in-the-eu-
current-trends-and-issues.pdf).
European Commission (2019a), Digital Scoreboard 2019, European Commission, Brussels
(https://ec.europa.eu/digital-single-market/en/digital-scoreboard).
European Commission (2019b), EU Justice scoreboard 2019, European Commission, Brussels
(https://ec.europa.eu/info/policies/justice-and-fundamental-rights/effective-justice/eu-justice-
scoreboard_en).
European Commission (2019c), European Economic Forecast. Winter 2019, European Commission,
Brussels.
European Commission/EACEA/Eurydice (2018), Structural Indicators for Monitoring Education and
Training Systems in Europe – 2018. Eurydice Report, Publications Office of the European Union,
Luxembourg (https://eacea.ec.europa.eu/national-policies/eurydice/content/structural-indicators-
monitoring-education-and-training-systems-europe-%E2%80%93-2018_en).
European Commission/EACEA/Eurydice/Eurostat (2014), Key data on early childhood education and
care in Europe. Eurydice and Eurostat report, Publications Office of the European Union, Luxembourg
(https://ec.europa.eu/eurostat/documents/3217494/5785249/EC-01-14-484-EN.PDF/cbdf1804-a139-43a9-
b8f1-ca5223eea2a1).
Invest Europe (2018), 2017 European private equity activity, Invest Europe, Brussels
(www.investeurope.eu/research/activity-data/annual-activity-statistics/).
References
77
Jelavić, V. and EKOBERG (2017), Strategija niskougljičnog razvoja Republike Hrvatske do 2030.
godine, s pogledom na 2050. godinu, Ministry of Environmental Protection and Energy, Zagreb
(www.hgk.hr/documents/prezentacija-14759783310589eb.pdf).
Kralj, A. and al. (2011), Institutional Evaluation Programme – Evaluation report, University of Zagreb,
Zagreb (www.iep-qaa.org/downloads/publications/iep%20zagreb%20report%20final.pdf).
Matković, T. and D. Caha (2017), ‘Patterns of welfare-to-employment transitions of Croatian Guaranteed
Minimum Benefit recipients: a preliminary study’, Public Sector Economics, 41:3.
Medina, L. and F. Schneider (2018), Shadow economies around the world: What did we learn over the
last 20 years?, IMF Working paper, International Monetary Fund, Washington
(www.imf.org/en/Publications/WP/Issues/2018/01/25/Shadow-Economies-Around-the-World-What-Did-
We-Learn-Over-the-Last-20-Years-45583).
Munta, M. (2018), Iako broj nezaposlenih pada broj uključenih u javne radove raste, čak I onih sa
srednjom I višom školom. O čemu se tu radi, ideje, Zagreb (http://ideje.hr/iako-broj-nezaposlenih-pada-
broj-ukljucenih-u-javne-radove-raste-cak-i-onih-sa-srednjom-i-visom-skolom-o-cemu-se-tu-radi/).
Orsini, K. and V. Ostojić (2018), Croatia's Tourism Industry: Beyond the Sun and Sea, Economic Brief,
European Commission, Brussels (https://ec.europa.eu/info/publications/economy-finance/croatias-
tourism-industry-beyond-sun-and-sea_en).
Petak, Z. and al. (2018), Sustainable governance indicators 2018 - Croatia report, Bertelsmann Stiftung,
Gütersloh (www.sgi-network.org/docs/2018/country/SGI2018_Croatia.pdf).
PricewaterhouseCoopers (PwC) (2017), 2017 Asset quality report, not published.
State Audit Office (SAO) (2018), Izvješće o obavljenoj reviziji učinkovitosti provedbe operativnog
programa konkurentnost i kohezija 2014. - 2020., Republic of Croatia - State Audit
Office, Zagreb (www.revizija.hr/datastore/filestore/160/PROVEDBA-OPERATIVNOG-PROGRAMA-
KONKURENTNOST-I-KOHEZIJA-2014-2020.pdf).
Stefanov and al. (2017), Tackling undeclared work in Croatia: Knowledge-informed policy responses,
GREY Policy Brief
(https://www.researchgate.net/publication/319289121_TACKLING_UNDECLARED_WORK_IN_CRO
ATIA_KNOWLEDGE-INFORMED_POLICY_RESPONSES).
Tkalec, M. and al. (2018), An overview of the real estate market in the Republic of Croatia, Institute of
Economics (EIZ), Zagreb (www.eizg.hr/publications/serial-publications/an-overview-of-the-real-estate-
market-in-the-republic-of-croatia/4274).
Trumbić, I. (ed.) and al. (2017), Draft Climate Change Adaptation Strategy in the Republic of Croatia for
the period to 2040 with a view to 2070, EPTISA ADRIA d.o.o. o. / Ministry of environment and energy,
Zagreb (http://prilagodba-klimi.hr/wp-
content/uploads/docs/Draft%20CC%20Adaptation%20Strategy.pdf.
Vuković, V. 'The political economy of local government in Croatia: Winning coalitions, corruption and
taxes', Public Sector Economics, 41:4.
Williams, C.C. and al. (2017a), An evaluation of the scale of undeclared work in the European Union and
its structural determinants: Estimates using the Labour Input Method, Publications Office of the
European Union, Luxembourg (https://ec.europa.eu/social/BlobServlet?docId=19002&langId=en).
References
78
Williams, C.C. and al. (2017b), Preventative policy measures to tackle undeclared work in Croatia,
Ministry of labour and pension system, Zagreb
(www.researchgate.net/publication/318453335_Preventative_Policy_Measures_to_Tackle_Undeclared_
Work_in_Croatia).
Williams, C.C. and I.A. Horodnić (2017), Under-declaring work, falsely declaring work: Undeclared
employment in the European Union, European Commission, Brussels
(https://ec.europa.eu/social/BlobServlet?docId=18376&langId=en).
World Bank (2018a), Doing business 2019. Training for reform, World Bank Group, Washington
(www.doingbusiness.org/en/reports/global-reports/doing-business-2019).
World Bank (2018b), The Republic of Croatia systematic country diagnostic, World Bank Group,
Washington (http://documents.worldbank.org/curated/en/452231526559636808/Croatia-Systematic-
Country-Diagnostic).