2019 cycling monitor germany - bmvi
TRANSCRIPT

2019 Cycling Monitor Germany
Selected results
Last update: January 07th, 2020

2© SINUS-Institut 2019
Key findings
◼ 76 percent of German households have at least one bicycle (without electrical assistance) and 14 percent have a pedelec.
◼ 44 percent of the persons surveyed regularly – i. e. daily or several times a week – use the bicycle or pedelec as means of transport and/or during leisure time.
– The youngest age group (14-19 years) most frequently uses the bicycle, followed by the group of 20-29 year-olds; with increasing age, the usage decreases gradually.
◼ The trend in terms of bicycle use is positive. In comparison with 2017, regular use of the bicycle has increased by 3 percentage points and by 6 percentage points when compared to 2015.
◼ The popularity of bicycles has also continued to increase from year to year. .
– In 2019, 65 percent stated that they enjoyed or enjoyed very much using the bicycle as a means of transport. In comparison with 2017, this is an increase of 1 percentage point, and of 10 percentage points when compared to 2015. Riding the bicycle as a leisure activity is even more popular. 70 percent of the persons surveyed stated that they enjoyed using the bicycle (very much). (2017: +7 pp, 2015: +11 pp)
– The car has lost some popularity and, with 71 percent, is yet only slightly ahead of the bicycle as a leisure time activity. (2017: -4 pp, 2015: -8 pp)
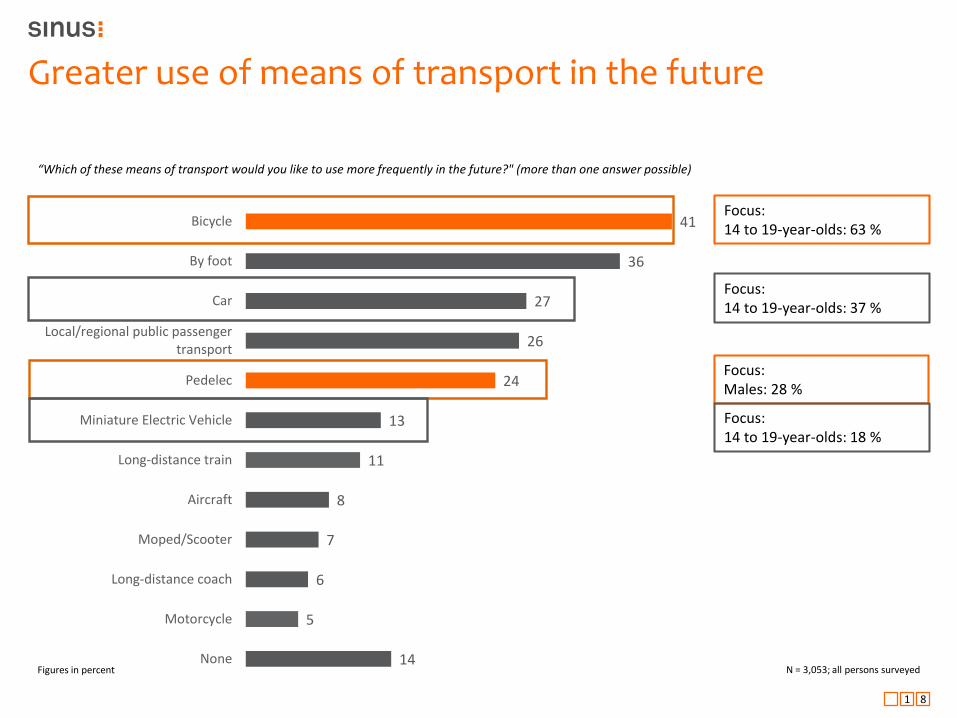
◼ In the future, 41 percent of the persons surveyed intend to use the bicycle more often.
– Among the younger ones (14-19 years), the intention is particularly strong with 63 percent.
Availability and use of means of transport
3© SINUS-Institut 2019
Key findings
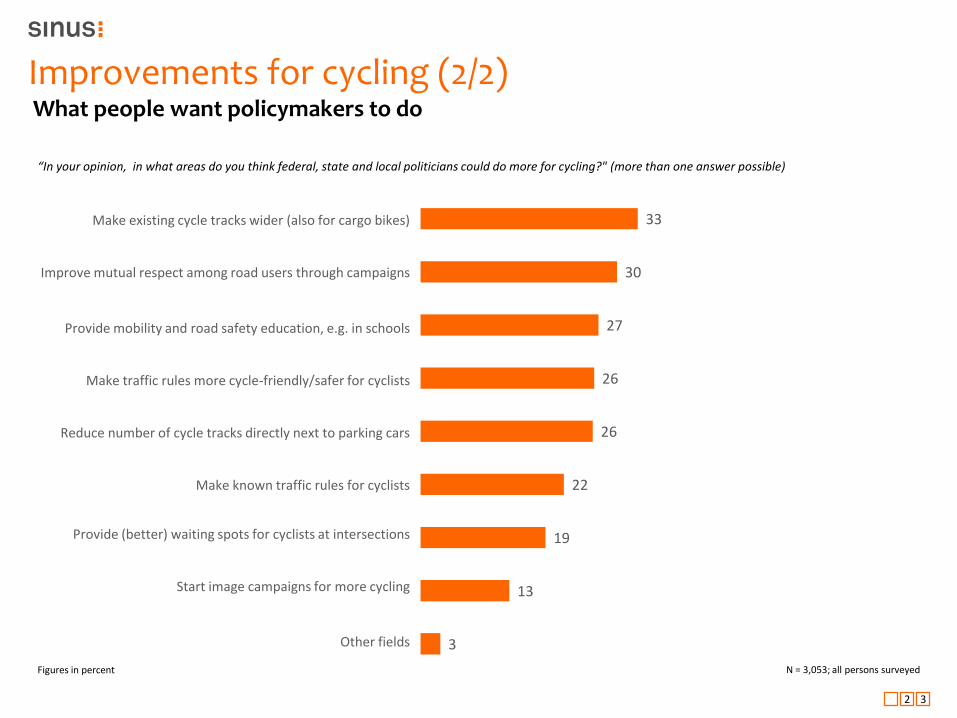
◼ The most urgent demands on politicians with regard to bicycle traffic are:
– Build more cycle paths (60 percent)
– Better separation of cyclists from car drivers (53 percent) and pedestrians (45 percent)
– Establish more protective and mandatory cycle lanes (44 percent)
– Provide safe parking facilities (44 percent)
– Increase number of cycle-only roads (43 percent)
◼ About half of the persons surveyed (49 percent) stated that they enjoyed cycling in their community.
◼ The feeling of safety while cycling is increasing: 56 percent of cyclists state that they feel very or rather safe (2017: 53 percent). Accordingly, 44 percent feel less safe on their bikes.
◼ The number of cyclists who wear a helmet has also increased from year to year – 38 percent wear headgear always or most of the time; that is 8 percentage points more than 2017.
– The youngest surveyed age group between 14 and 19 years wears a helmet the least (27 percent), the group of 30 to 39 year-olds most frequently wears one (46 percent).
Transport policy, mutual respect, feeling of security and wearing of helmets

4© SINUS-Institut 2019
Key findings
◼ 24 percent of the persons surveyed have already ridden a pedelec.
◼ 54 percent are familiar with cargo bikes, but only 2 percent of those surveyed use one.
◼ 10 percent of those surveyed can imagine buying one.
◼ 69 percent of those surveyed have heard of bike sharing (public rental bike systems) and 17 percent have used them before.
◼ 13 percent intend to use e-scooters (personal electric light vehicles) more frequently in the future.
◼ 2 percent are planning on buying a personal light electric vehicle within the next 12 months, and 12 percent is considering maybe buying one.
Pedelecs, cargo cycles, bike sharing and personal light electric vehicles

5© SINUS-Institut 2019
Key findings
◼ Bicycles are most frequently used for small errands or grocery shopping (66 percent at least a few times a month).
◼ Just under one third of those surveyed who are working or undergoing training stated that they used the bicycle at least a few times a week on the way to their place of work or education.
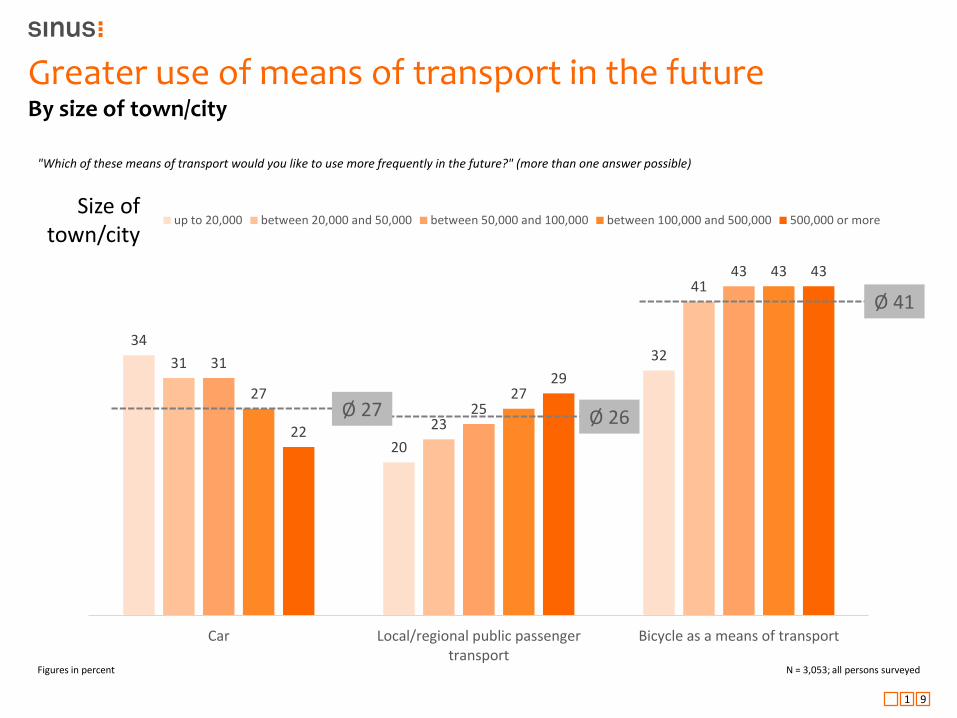
– The bicycle is more often used for commuting among young people and in urban areas.
◼ Those who do not use their bicycle to commute most often say that the reason is that the distance is too long (42 percent) or they are exposed to wind and weather (41 percent) 19 percent do not cycle to work/study, because it's too dangerous for them.
◼ The construction of cycle paths is generally viewed very positively. 37 percent of those surveyed who are yet to cycle as a means of transportation say they would use the bicycle if there were express cycle paths on their way to work/education would. 74 percent of those already commuting would use the bicycle more often than before.
Reasons to use the bicycle and commuter potentials of cycle superhighways

6© SINUS-Institut 2019
Key findings
◼ About 40 percent of those surveyed have heard of the concept of "protected bike lanes", but only 7 percent have used a protected bike lane.
◼ Cycle-only roads are significantly better known (70 percent of the persons surveyed). About one-third has already used a cycle-only road (34 percent).
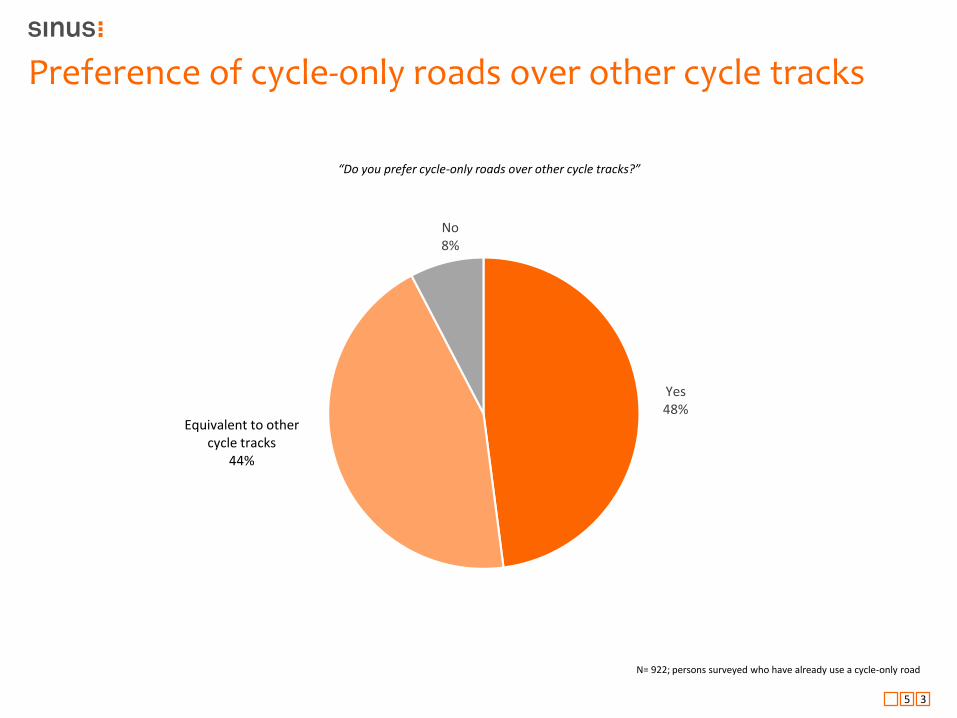
◼ Slightly less than half of cyclists who have already used a cycle route prefer this form of cycling compared to other cycle paths(48 percent).
Protected bike lanes and cycle-only roads

7© SINUS-Institut 2019
Key findings
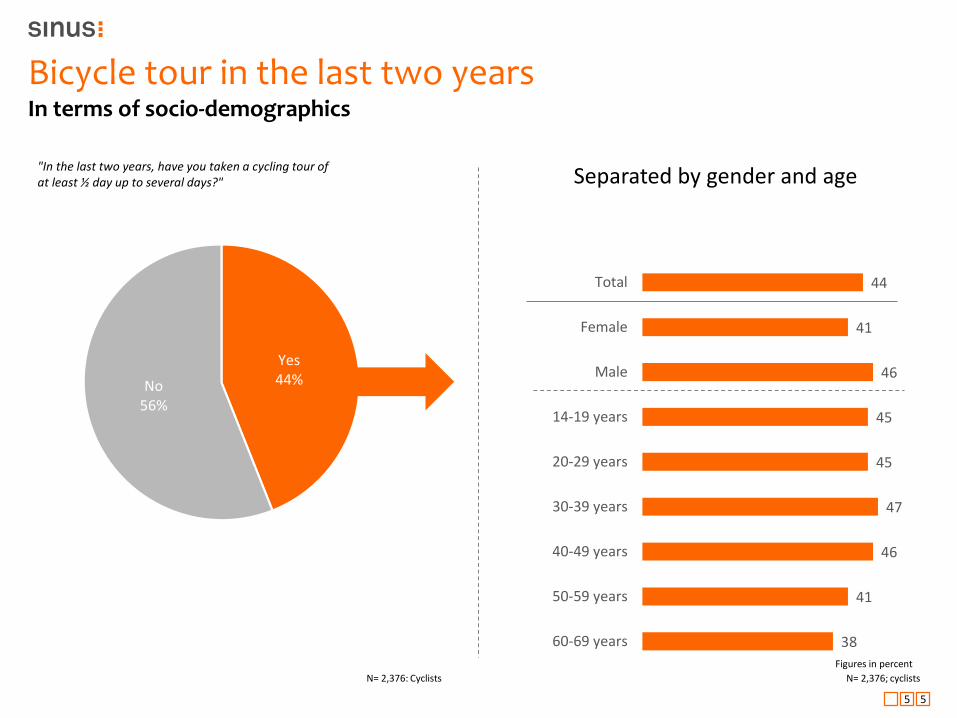
◼ 44 percent of cyclists have undertaken a bicycle tour of half a day or longer in the last two years.
◼ 15 percent of those surveyed know the German Cycle Network (D-routes) which comprises about 11,700 km. 8 percent have already used one or more D-routes.
– The Rhine Route (20 %) and the Elbe Route (17 %) are the ones most frequently used.
– The majority has used the D-routes during a longer bicycle tour (60 percent).
◼ In 2019, 31 percent of those surveyed plan to buy a new bicycle within the next 12 months. At 865 euros, the sum that each person is willing to spend is considerably higher than the average value of 2017 (+ € 184).
– The choice is often made in favour of the pedelec: 42 percent say they want to buy a pedelec. Compared to 2017, this is a significant increase of 27 percentage points.
– This is followed by the conventional bicycle with 32 percent and the mountain bike with 22 percent. Currently 5 percent of potential buyers are planning to buy a cargo bike.
◼ Conventional bicycles such as ladies’ bicycles or city bikes are still most frequently used by cyclists in Germany (62 percent).
– Presently, 14 percent of cyclists use a pedelec and 3 percent use cargo bikes.
Cycle tourism and bicycle market

8
◼ In urban areas, the bicycle or pedelec is more frequently used than in rural areas (45 percent vs. 33 percent).
◼ Cargo bikes and bike sharing are more relevant in cities.
– In urban areas, more people than in the countryside have already heard about rental bikes (+15 PP city vs. countryside). While 62 percent of those surveyed from the city state that they have a rental bike system in their place of residence, this applies to only 10 percent of rural population.
– Persons surveyed who live in urban areas are more likely to consider buying a cargo cycle than persons who live in rural areas (11 percent vs. 7 percent).
– Interviewees from urban areas are more likely than those from rural areas to imagine buying a cargo bike. (11 percent urban vs. 7 percent rural)
◼ In the case of pedelecs, the use, the experience and the interest of the persons surveyed differ only marginally between rural and urban areas.
© SINUS-Institut 2019
Key findingsUrban vs. rural area
9
Availability and use of means of transport
01

1 0
76
75
14
8
8
3
8
Fahrrad ohne elektrischeUnterstützung
Auto
Pedelec
Moped/Roller
Motorrad
E-Bikes, S-Pedelecs
Kein Verkehrsmittel
N = 3,053; all persons surveyed
Available means of transport
“What means of transport can be found in your household?” (more than one answer possible)
Number in household
approx. 2.2
approx. 1.4
Bikes used by their owners
approx. 1.1
Figures in percent
Bicycle without electric assistance
Car
Pedelec
Moped/Scooter
Motorcycle
E-bikes/high-speed pedelecs
No means of transport
1 1
52
28
15
17
1
1
1
0
0
1
30
33
29
20
2
3
2
1
1
1
11
13
21
21
9
3
4
2
2
0
By foot
Car
Bicycle/pedelec
Local/regional public means of transport
Long-distance train (IC, ICE, EC, others)
Moped/Scooter
Motorcycle
Long-distance coach
Aircraft
E-bikes/high-speed pedelecs
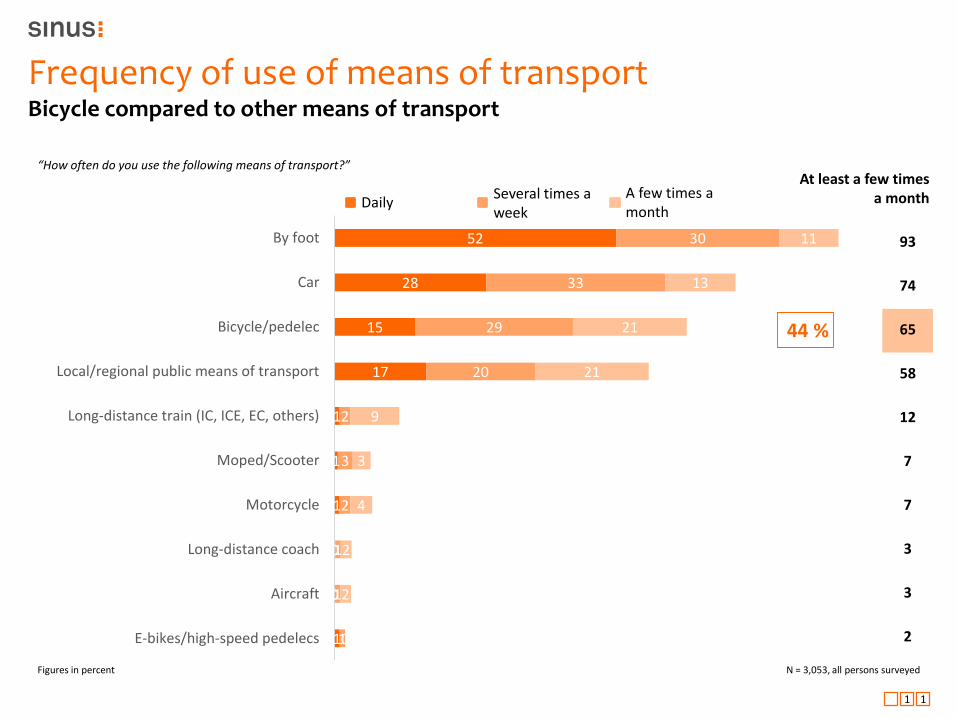
Frequency of use of means of transport Bicycle compared to other means of transport
A few times a month
Several times a week
Daily
“How often do you use the following means of transport?”
44 %
At least a few times a month
93
74
65
58
12
7
7
3
3
2
N = 3,053, all persons surveyedFigures in percent

1 2
38
70
78
41
64
84
44
61
82
Bicycle/pedelec
Car
By foot
2019***
2017**
2015*
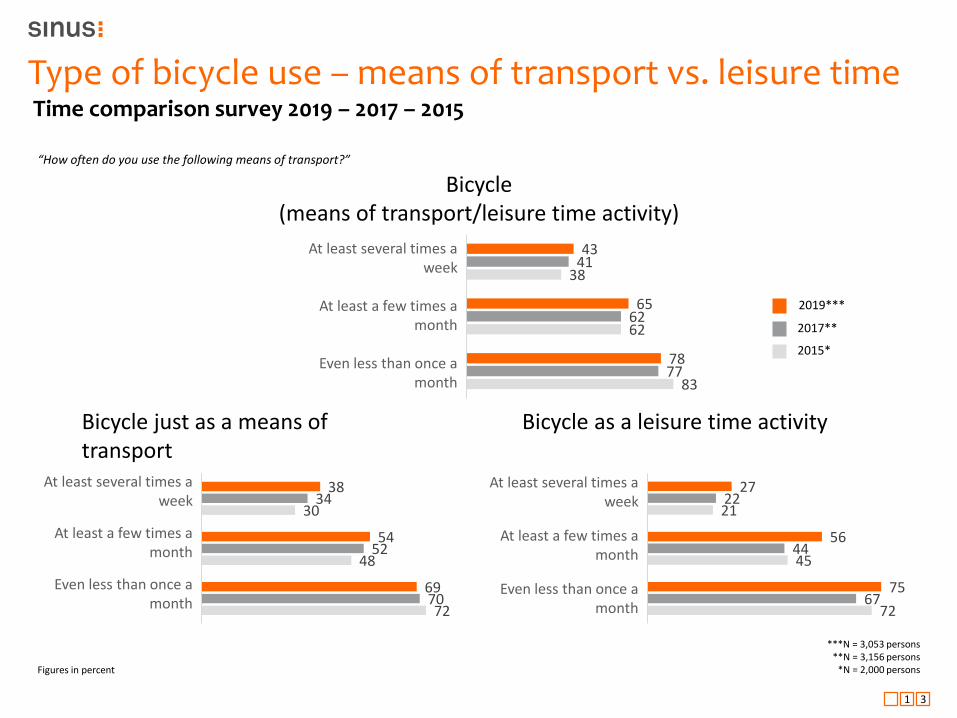
***N = 3,053 persons**N = 3,156 persons
*N = 2,000 persons
Regular use of means of transport
“How often do you use the following means of transport?” (at least a few times a week)
Figures in percent
Time comparison survey 2019 – 2017 – 2015
1 3
Bicycle (means of transport/leisure time activity)
Type of bicycle use – means of transport vs. leisure timeTime comparison survey 2019 – 2017 – 2015
“How often do you use the following means of transport?”
Bicycle just as a means of transport
Bicycle as a leisure time activity
38
54
69
34
52
70
30
48
72
Mindestens mehrmals proWoche
Mindestens ein paar Malim Monat
Mindestens seltener alsein Mal im Monat
***N = 3,053 persons **N = 3,156 persons
*N = 2,000 personsFigures in percent
At least several times a week
At least a few times a month
Even less than once a month
27
56
75
22
44
67
21
45
72
Mindestens mehrmals proWoche
Mindestens ein paar Malim Monat
Mindestens seltener alsein Mal im Monat
At least several times a week
At least a few times a month
Even less than once a month
43
65
78
41
62
77
38
62
83
Mindestens mehrmals proWoche
Mindestens ein paar Malim Monat
Mindestens seltener alsein Mal im Monat
At least several times a week
At least a few times a month
Even less than once a month
2019***
2017**
2015*

1 4
Figures in percent N = 3,053; all persons surveyed
77
18
33
70
23
46
68
30
46
61
34
46
5154
44
Car Local/regional public passenger transport Bicycle/pedelec
Population up to 20,000 Population between 20,000 and 50,000
Regular use of means of transportRegular users by size of town/city
“How often do you use the following means of transport?” – Daily/Several times a week
Size of town/city
Ø 44
Ø 61
Ø 37

1 5
58 57
50
63
34
46
60
28
36
Car Local/regional public passenger transport Bicycle/pedelec
Ø 37
N = 3,053; all persons surveyed
Regular use of means of transportRegular users by age
“How often do use the following means of transport?”– Daily/Several times a week
50-69 years 30-49 years 14-29 years Age
Ø 61
Figures in percent
Ø 44

1 6
Regular use of means of transport
15
13
15
24
18
14
13
12
10
11
12
18
8
16
11
16
16
29
27
32
31
30
34
31
27
23
22
30
34
25
30
35
30
28
Total
Women
Men
14-19 y.
20-29 y.
30-39 y.
40-49 y.
50-59 y.
60-69 y.
Low formal education
Medium formal education
High formal education
Population up to 20,000
Population between 20,000 and 50,000
Population between 50,000 and 100,000
Population between 100,000 and 500,000
Population of 500,000 or more
Bicycle/pedelec
Several times a week
Daily
“How often do you move on using the following means of transport?” (bicycle/pedelec)
44
40
47
55
48
48
45
39
33
33
42
52
33
46
46
46
44
Daily/Several times a week
N = 3,053; all persons surveyedFigures in percent

1 7
Means of transport (2019 n=2106; 2017 n=2214; 2015 n= 1445)Leisure time activity (2019 n=2272; 2017 n=2124 , 2015 n=1444)
Car (2019 n=2547; 2017 n=2885, 2015 n=1850)Basis: use the respective means of transport
Popularity of means of transport among usersTime comparison survey 2019 – 2017 – 2015
”How much do you enjoy using ... on a scale from 1=very much to 6=not at all?”
Bicycle as a means of transport
Bicycle as a leisure time activity
Car
1 = very much 6 = not at all
1 = very much 6 = not at all
1 = very much 6 = not at all
Figures in percent
27
32
31
27
31
33
24
21
19
12
9
12
7
5
3
3
2
1
2015
2017
2019
30
32
35
29
31
35
20
20
19
11
10
8
7
5
2
3
2
1
2015
2017
2019
53
52
44
26
23
27
11
13
18
5
6
7
3
3
2
2
3
3
2015
2017
2019
1 8
N = 3,053; all persons surveyed
Greater use of means of transport in the future
41
36
27
26
24
13
11
8
7
6
5
14
Bicycle
By foot
Car
Local/regional public passengertransport
Pedelec
Miniature Electric Vehicle
Long-distance train
Aircraft
Moped/Scooter
Long-distance coach
Motorcycle
None
“Which of these means of transport would you like to use more frequently in the future?" (more than one answer possible)
Focus:14 to 19-year-olds: 63 %
Focus:14 to 19-year-olds: 37 %
Focus:Males: 28 %
Figures in percent
Focus:14 to 19-year-olds: 18 %
1 9
Figures in percent N = 3,053; all persons surveyed
34
20
3231
23
41
31
25
43
27 27
43
22
29
43
Car Local/regional public passengertransport
Bicycle as a means of transport
up to 20,000 between 20,000 and 50,000 between 50,000 and 100,000 between 100,000 and 500,000 500,000 or more
Greater use of means of transport in the futureBy size of town/city
"Which of these means of transport would you like to use more frequently in the future?" (more than one answer possible)
Size of town/city
Ø 41
Ø 26Ø 27

2 0
41
36
27
26
34
29
32
26
35
30
35
28
Bicycle as a means of transport
By foot
Car
Local/regional public transport
2019***
2017**
2015*
Greater use of means of transport in the futureTime comparison survey 2019 – 2017 – 2015
"Which of these means of transport would you like to use more frequently in the future?" (more than one answer possible)
Figures in percent
***N= 3,053 persons **N= 3,156 persons
*N= 2,000 persons

2 1
Transport policy, mutual respect, feeling of security and wearing of helmets
02

2 2
Improvements for cycling (1/2) What people want policymakers to do
60
53
45
44
44
43
39
37
34
build more bike paths
Separation of cyclists from car drivers
Separation of cyclists from pedestrians
Set up more safety and cycle lanes
more safe bicycle parking facilitites
create more cycle lanes
improve the surface of the cycle paths
making intersection areas more visible
more parking facilities
“In your opinion, in what areas do you think federal, state and local politicians could do more for cycling?" (more than one answer possible)
N = 3,053; all persons surveyedFigures in percent
2 3
33
30
27
26
26
22
19
13
3
vorhandene Radwege verbreitern (auch für Lastenräder)
Kampagnen besseres Miteinander Verkehrsteilnehmer/innen
Mobilitäts- und Verkehrserziehung, z.B. an Schulen
Verkehrsregeln für Radfahrende fahrradfreundlicher/sicherergestalten
Weniger Radwege unmittelbar neben parkenden Fahrzeugen
Bekanntmachung der Verkehrsregelungen für Radfahrende
(Bessere) Rad-Aufstellflächen im Kreuzungsbereich
Imagekampagnen für mehr Radverkehr
Andere Bereiche
Make existing cycle tracks wider (also for cargo bikes)
Improve mutual respect among road users through campaigns
Provide mobility and road safety education, e.g. in schools
Make traffic rules more cycle-friendly/safer for cyclists
Reduce number of cycle tracks directly next to parking cars
Make known traffic rules for cyclists
Provide (better) waiting spots for cyclists at intersections
Start image campaigns for more cycling
Other fields
Improvements for cycling (2/2) What people want policymakers to do
“In your opinion, in what areas do you think federal, state and local politicians could do more for cycling?" (more than one answer possible)
N = 3,053; all persons surveyedFigures in percent

2 4
50%25
10
8
9
7
7
5
8
39
39
34
31
31
27
29
24
10
13
9
22
13
24
10
22
20
24
31
23
31
26
34
25
6
14
18
15
18
16
22
21
Due to the way they ride their bike, many cyclists are a factor ofuncertainty in road traffic.
Cycling in my municipality/city is fun.
There is enough space for the bicycle in my city/municipality,the tracks are sufficiently wide.
Cycle tracks are regularly cleaned/cleared where I live.
Cycling infrastructure in my municipality/city is family-friendly.
In my municipality/city, traffic lights are programmed in a waythat helps cyclists move on quickly.
In my municipality/city, all road users show mutual respect.
The municipality/city takes care that cars don’t park on cycle tracks.
Fully agree Partially agree Don’t know Rather disagree Fully disagree
N = 3,053; all persons surveyed
Statements regarding cycling in municipalities/cities
Figures in percent
Due to the way they ride their bike, many cyclists are a factor of uncertainty in road traffic.
Cycling in my municipality/city is fun.
There is enough space for the bicycle in my city/municipality, the tracks are sufficiently wide.
Cycle paths are regularly cleaned/cleared where I live.
Cycling infrastructure in my municipality/city is family-friendly.
In my municipality/city, traffic lights are programmed in a way that helps cyclists move on quickly.
In my municipality/city, all road users show mutual respect.
The municipality/city takes care that cars don’t park on cycle tracks.
“Please state to what extent the following statements are applicable to your municipality/city.”

2 5
N = 3,053; all persons surveyed
34
46
39
43
43
47
55
71
32
34
34
38
40
42
49
64
The municipality/city takes care that cars don’t park on cycletracks.
In my municipality/city, all road users show mutual respect.
In my municipality/city, traffic lights are programmed in a way thathelps cyclists move on quickly.
Cycling infrastructure in my municipality/city is family-friendly.
Cycle tracks are regularly cleaned/cleared where I live.
There is enough space for the bicycle in my city/municipality, thetracks are sufficiently wide.
Cycling in my municipality/city is fun.
Due to the way they ride their bike, many cyclists are a factor ofuncertainty in road traffic.
Total Overrepresented
Statements regarding cycling in municipalities/cities
“Please state to what extent the following statements are applicable to your municipality/city.” - Fully agree/rather agree
Figures in percent
60 to 69-year-olds
Population up to 20,000 and between 20,000 and 50,000
Population between 50,000 and 100,000
14 to 19-year-olds
Population between 100,000 and 500,000
Population up to 20,000
Population between 50,000 and 100,000
Population up to 20,000 and between 20,000 and 50,000
Due to the way they ride their bikes, many cyclists are a factor of uncertainty in road traffic.
Cycling in my municipality/city is fun.
There is enough space for bicycles in my city/municipality, the paths are wide enough.
Cycle paths are regularly cleaned/cleared where I live.
Cycling infrastructure in my municipality/city is family-friendly.
In my municipality/city, traffic lights are programmed in a way that helps cyclists move on quickly.
In my municipality/city, all road users show mutual respect.
The municipality/city takes care that cars don’t park on cycle tracks.

2 6
Feeling of security when cycling in road traffic
Yes, very secure.5%
Yes, mostly.51%
No, rather not.36%
No, not at all.8%
“Do you feel safe when cycling in road traffic?”
Subjective feeling of security
N= 2,376; cyclists

2 7
51
49
48
56
53
51
5
4
3
Feeling of security when cycling in road trafficTime comparison survey 2019 – 2017 – 2015
Very secure Mostly secure Very/mostly secure
“Do you feel secure when cycling in road traffic?”
2019***
2017**
2015*
***N=2,376 cyclists**N= 2,440 cyclists
*N= 1,644 cyclistsFigures in percent

2 8
Yes, very secure.
5%
Yes, mostly.51%
No, rather not.36%
No, not at all.8%
Subjective feeling of security
Reasons for feeling insecure in road traffic
44 %
68
68
59
56
53
46
42
37
34
21
11
zu viel Verkehr
rücksichtslose Autofahrende
zu wenig separate Radwege
zu schnell mit Autos gefahren wird
plötzlich öffnenden PKW-Türen
zu viel Schwerverkehr (Busse, LKW)
Fahrzeuge betrachten den Radwegals Haltezone
rücksichtslose Radfahrende
schlechter Zustand der Radwege
unterschiedliche Geschwindigkeitanderer Radfahrer
generelle Unsicherheit auf demFahrrad
“Why do you feel (rather) insecure?” (more than one answer possible)
N= 2,376; cyclists N= 1,035; persons who rather not or not at all feel secure in road traffic
Figures in percent
“Do you feel secure when cycling in road traffic?”
(Rather) insecure
Too much traffic
Reckless car drivers
Not enough separate cycle tracks
Cars being driven too fast
Passenger car doors suddenly being opened
Too much heavy goods vehicle traffic (buses, HGV)
Cars stopping on cycle tracks
Reckless cyclists
Cycle tracks in poor condition
Different speeds of other cyclists
General feeling of insecurity on the bicycle
“Why do you feel (rather) insecure?”(more than one answer possible)

2 9
38
48
30
30
25
6
7
6
4
46
34
50
42
45
36
22
23
14
4
10
5
8
6
9
6
14
11
10
6
12
16
19
37
26
32
20
2
2
3
4
5
12
39
25
51
As a cyclist, I always follow the rules of the German Road TrafficRegulations.
As a car driver, I always follow the rules of the German RoadTraffic Regulations.
I often find that car drivers give a bad example in road traffic.
There is a lot of tension between cyclists and other road users.
I often find that bicycle drivers give a bad example in roadtraffic.
Other road users show a sufficient amount of respect forcyclists.
As a cyclist, I only follow traffic rules that I consider appropriate.
About innovations in the German road traffic regulations thataffect bicycle traffic, I feel informed by media and politics.
As a car driver, I only follow traffic rules that I considerappropriate.
Fully agree Partially agree Don’t know Rather disagree Fully disagree
Statements regarding mutual respect in road traffic
“To what extent do you agree with the following statements regarding mutual respect between road users?”
N = 3,053; all persons surveyedFigures in percent

3 0
Immer21%
Meistens17%
Eher selten12%
Nie8%
Kein Besitz42%
Yes58%
No42%
“Do you or does your household possess a cycle helmet?”
Possession and use of cycle helmets
“How often do you wear a cycle helmet?”
N= 2,376; cyclists
UsePossession
38 %

3 1
At least mostly: 38 %
Possession and use of cycle helmets
21
19
22
14
16
25
21
22
27
17
16
19
13
15
21
17
18
15
Total
Female
Male
14-19 years
20-29 years
30-39 years
40-49 years
50-59 years
60-69 years
Separated by age and sex(always/mostly)
Always21%
Mostly17%
Not too often12%
Never8%
No possession
42%
“How often do you wear a cycle helmet?”
N= 2,376; cyclists
Figures in percent
Possession & use

3 2
Wearing of helmetsTime comparison survey 2019 – 2017 – 2015
Always Mostly Always/mostly
“Do you wear a cycle helmet?”
2019***
2017**
2015*
Figures in percent
38
30
31
17
15
15
21
15
16
***N=2,376 cyclists**N= 2,440 cyclists
*N= 1,644 cyclists

3 3
Innovations: Pedelecs, cargo bikes, bike sharing and micro electric vehicles
03

3 4
Experience with pedelecs In terms of socio-demographics
Yes24%
No76%
“Have you ever used a bicycle with an electric motor (pedelec) for support?”
24
19
29
22
28
28
25
21
20
Total
Female
Male
14-19
20-29
30-39
40-49
50-59
60-69
Experience by gender and age
Experience
N = 3,053; all persons surveyed
Figures in percent

3 5
2
2
3
3
5
4
2
1
0
52
45
58
27
40
51
58
55
66
Total
Female
Male
14-19 years
20-29 years
30-39 years
40-49 years
50-59 years
60-69 years
Use Familiarity
Awareness and use ofby gender and age
N = 3,053; all persons surveyed
Awareness and use of cargo bicyclesIn terms of socio-demographics
Awareness and use of
Figures in percent
Cargo cycle users2%
Yes52%
No46%
“Have you ever heard of cargo cycles?”

3 6
Awareness and buying potential of cargo bicycles
Buying potential
“In general, could you imagine buying a cargo cycle?”
Cargo cycle users2%
Yes52%
No46%
Awareness and use of
Yes20%
No80%
N = 3,053; all persons surveyed N= 1,578; cargo cycles known, but no owner
This 20 % equals 10 % of the total population.
“Have you ever heard of cargo cycles?”

3 7
N = 3,053; all persons surveyed N= 2,111; hire cycles known
Awareness and spread of bike sharing
Focus on major cities:Population of 500,000 or more: 79 %
56 16 28
NoYes I don’t know
56
10
13
27
58
81
Total
Population up to 20,000
Population between 20,000and 50,000
Population between 50,000and 100,000
Population between 100,000and 500,000
Population of 500,000 or more
Awareness of Spread
"Is there a bike rental system at your place of residence?"
“"Have you ever heard of public rental bike systems?”
Figures in percent
Yes 69%
No31% Spread by size of town/city

3 8
50%
59
36
28
21
33
14
20
38
34
40
18
30
8
8
17
21
14
26
6
13
11
11
12
14
7
5
10
7
23
16
I have no need for hire cycles as I prefer using my own bike aspart of my daily routine.
I prefer to explore foreign cities by foot.
In foreign cities where I don’t have my own bike available, hire cycle schemes represent an attractive alternative to public
transport for me.
It is a great advantage for me that hire cycles offer the chanceto experience foreign cities in a straight and unconventional
way.
I use hire cycles only rarely because I generally prefer othermeans of transport for my daily routes.
In my opinion, hire cycle schemes are a helpful supplement of ortemporary alternative to local public transport (for example,
when there are delays, coverage is not sufficient or outside…
Fully agree Partially agree Don’t know Fully disagree Rather disagree
Statements regarding bike sharing (1/2)
“To what extent do you agree with the following statements regarding bike rental systems?”
N= 2,111; hire cycles known
I have no need for bike rental systems as I prefer using my own bike as part of my daily routine.
I prefer to explore foreign cities by foot.
In foreign cities where I don’t have my own bike available, bike rental systems present an attractive alternative to public transport for me.
It is a great advantage for me that bike rentals offer the chance to experience foreign cities in a straight and unconventional way.
I use bike rentals only rarely because I generally prefer other means of transport for my daily routes.
In my opinion, bike rental systems are a helpful supplement of or temporary alternative to local public transport.
Figures in percent

3 9
50%
14
13
10
11
11
8
28
26
24
21
21
23
29
45
48
51
54
39
19
11
12
11
9
20
10
5
6
6
5
10
Hire cycles are inflexible because rental and return is tied tospecific locations.
All cycles are properly maintained and roadworthy.
I find the costs for hire cycles appropriate.
I find the payment scheme simple and uncomplicated to use.
Registration for the hire cycle scheme is simple anduncomplicated.
Hire cycles are heavy and clumsy to use.
Fully agree Partially agree Don’t know Fully disagree Rather disagree
Statements regarding bike sharing (2/2)
“To what extent do you agree with the following statements regarding hire cycle schemes?”
N= 2,111; hire cycles knownFigures in percent
Hire cycles are inflexible because rental and return is tied to specific locations.
All cycles are properly maintained and roadworthy.
I find the costs for hire cycles appropriate.
I find the payment scheme simple and uncomplicated to use.
Registration for the hire cycle scheme is simple and uncomplicated.
Hire cycles are heavy and clumsy to use.

4 0
N = 3,053; all persons surveyed
Yes, for sure.2%
Yes, maybe.12%
Probably not.27%
No, for sure not.59%
“Are you planning on buying a micro electric vehicle in the next twelve months?”
14
9
19
9
18
17
15
14
8
26
Total
Female
Male
14-19 years
20-29 years
30-39 years
40-49 years
50-59 years
60-69 years
Bike rental users
Interest by genderand age
(yes, for sure/yes, maybe)
Buying potential of personal light electric vehiclesIn terms of socio-demographics
Interest
14 %
Figures in percent

4 1
Reasons for travelling by bicycle andcommuting potentials viabike superhighways
04

4 2
N= 2,376; cyclists
Reason to use the bicycle Total and relevant above average groups
66
58
54
51
44
43
31
25
15
10
9
70
67
62
56
53
51
37
34
24
23
14
Shopping/little errands
Getting to school/university/place of education
Visit friends, family or acquaintances
Getting to work/place of training
Getting to leisure activities
Day trips
Sports
Carrying cargo
Accompanying people
Carrying people
Cycling holidays
Total
Overrepresented group
“How often do you use the bicycle for the following reasons?” (daily/several times a week/a few times a month)
Population between 100,000 and 500,000
60 to 69-year-olds
Figures in percentPopulation between 50,000 and 100,000
Population between 100,000 and 500,000
14 to 19-year-olds
Population between 50,000 and 100,000
30-39-year-olds
Men
Basis: people at work (n=1467)
Basis: Undergoing training (n=330)
14-19-year-olds
14 to 19-year-olds
30-39-year-olds

4 3
Reason to use the bicycle – short errandsMaximum distances
28%
18%
3%
Up to 2km
2 to 5 km 5 to 10km
Morethan 10
km
7%
31%
28%
18%
16%
Daily
Several times a week
Several times a month
Less than once a month
Never
Frequency Maximum distance
84 %
N= 2,004; persons that use the bicycle for shopping groceries or making little errands
51%
N= 2,376; cyclists

4 4
31
26
27
9
7
9
31
31
28
23
21
19
21
23
19
29
27
24
8
11
11
18
22
18
6
6
10
15
15
18
3
3
5
6
8
12
Place of work/training
School/university/place ofeducation
Residential environment
Town/city centre
Authorities
(Train) stations
Very good Good Satisfactory Sufficient Poor Insufficient
Satisfaction with parking situation
“Please assess the parking situation at the following locations using school grades."
N= 2,376 persons surveyed; however, as up to 50 % made no indication in each category, adjustments were made.Figures in percent

4 5
30
29
31
36
31
21
15
32
Total
Female
Male
14-29 years
30-49 years
50-69 years
Rural area (population<20,000)
Urban area (population>50,000)
Bicycle commutersby gender, age, urban/rural area
Use of the bicycle to get to place of work/educationIn terms of socio-demographics
30%
53%
17%
Regular use of the bicycle to get to place of work/education
(at least a few times a week)
Use the bicycle, but not/irregularly for commuting
Regularly use the bicycle for commuting
Never use the bicycle
N= 2,155; employed or undergoing training

4 6
Reasons not to use of the bicycle to get to place of work/education
42
41
39
28
22
19
13
12
10
9
9
4
9
Weg ist zu weit
Dem Wind und Wetter ausgesetzt
Dauert zu lange
Zu anstrengend
Keine ausgebauten Radwege/Fahrradstreifen
Zu gefährlich
Keine sicheren Abstellmöglichkeiten
Auto für Beruf wichtig
Fahrrad unbequem zu erreichen (z.B. im Keller)
Zu kurzer Weg /Gehdistanz
Zu wenig Abstellmöglichkeiten für Fahrräder
Nutze Mitfahrgelegenheit
Sonstiges
“For which of the following reasons do you not use the bicycle to get to your place of work/training or to school/university/the place of education?“ (more than one answer possible)
Figures in percentN= 1,151; cyclists who do not/irregularly use the bicycle to get to the place of work/training OR to school/university/the place of education and who are employed or
undergoing training
Distance too large
Exposed to wind and weather
Takes too much time
Too hard
No developed cycle tracks/cycle paths
Too dangerous
No secure parking facilities
Car is important for profession
Too much work to get the bicycle (e.g. from the cellar)
Distance too small/walking distance
Not enough parking facilities for bicycles
Use ride sharing
Other

4 7
N= 214; cyclists who don’t use the bicycle to get to the place of work/education because they think it is too dangerous
72
58
53
38
31
29
28
25
23
23
Zu viel Autoverkehr
Rücksichtsloses Verhalten anderer Verkehrsteilnehmer/innen
Keine Radwege/Radfahrstreifen vorhanden bzw. nur auf Teilstrecken
Radwege nicht genügend von der Fahrbahn der Autos abgetrennt
Unklare Verkehrsregelung auf der Strecke
Schlechter Zustand der Radwege
Radwege für andere Verkehrsteilnehmer nicht klar erkennbar
Unsichere Gegend, Angst angesprochen/angegriffen zu werden
Radwege/Radfahrstreifen nicht breit genug
Schlechte Beleuchtung der Radwege/Radfahrstreifen
“Why is it too dangerous (to use the bicycle to get to the place of work/education]?“ (more than one answer possible)
69
38
62
27
15
19
15
19
19
27
72
61
52
39
34
30
29
26
24
22
Rural area Urban area
Perceived dangers
Figures in percent
Too much car traffic
Reckless behaviour of other road users
No cycle paths/cycle lanes or only in sections
Cycle paths insufficiently separated from car lanes
Traffic regulations on the route not clear
Cycle tracks in poor condition
Cycle tracks not clearly visible to other road users
Unsafe neighbourhood, fear of being addressed/attacked
Cycle tracks/cycle lanes not wide enough
Cycle tracks/cycle lanes poorly lit

4 8
43
38
34
25
25
22
20
16
15
29
Besser ausgebaute Radwege
Mehr Radwege
Sichere Fahrradabstellplätze
Umkleidemöglichkeiten
Radfahrende erhalten einen Bonus (Gutschein fürRadreparatur, Firmenrad, etc.)
Waschgelegenheit/Duschmöglichkeit
Mehr Fahrradabstellplätze
Möglichkeit, nasse Radwäsche zu trocknen
Reparaturmöglichkeit (Luftstation, Pannenset, etc.)
Ich vermisse nichts
“What would be important for you to use the bicycle to get to your place of work/training or to school/university/the place of education?” (more than one answer possible)
N= 596; cyclists who do not use the bicycle to get to the place of work/training and are employed or undergo training
Incentives to use the bicycle to get to place of work/education
Figures in percent
Better developed cycle paths
More cycle paths
Secure parking facilities
Changing facilities
Cyclists get a bonus (voucher for bike repair, employer cycle, etc.)
Washing facility/shower
More cycle parking spaces
Room for drying wet cycle clothes
Repair options (air pump, breakdown kit, etc.)
Miss nothing
4 9
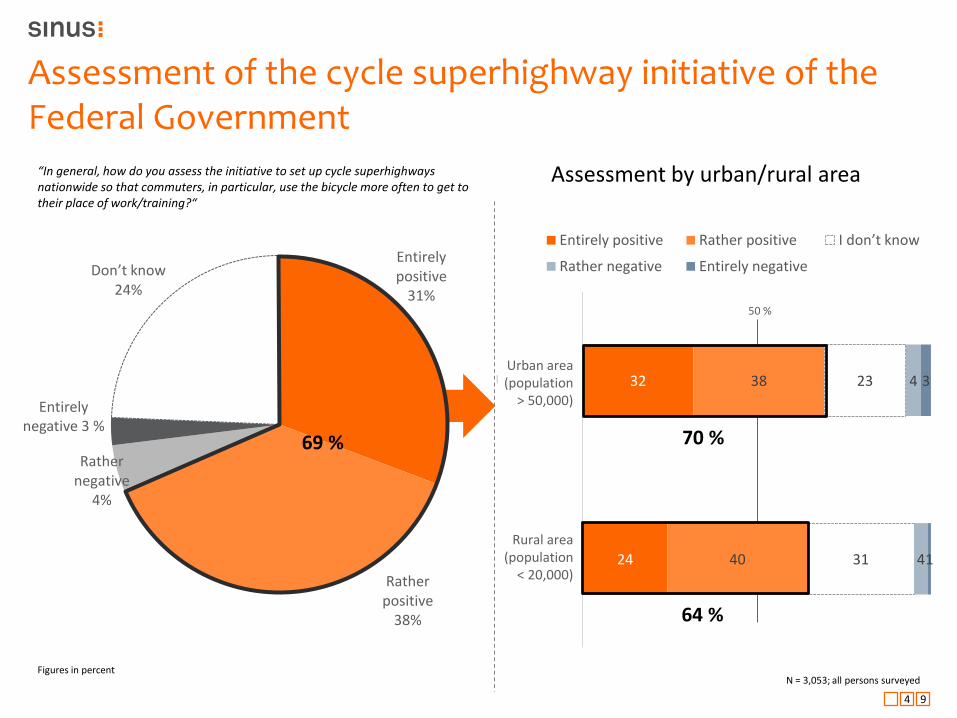
50 %
32
24
38
40
23
31
4
4
3
1
Urban area
Rural area
Entirely positive Rather positive I don’t know
Rather negative Entirely negativeEntirely positive
31%
Rather positive
38%
Rather negative
4%
Don’t know24%
Assessment of the cycle superhighway initiative of the Federal Government
N = 3,053; all persons surveyedFigures in percent
“In general, how do you assess the initiative to set up cycle superhighways nationwide so that commuters, in particular, use the bicycle more often to get to their place of work/training?“
Assessment by urban/rural area
Urban area(population
> 50,000)
Rural area (population
< 20,000)
70 %
64 %
69 %
Entirely negative 3 %

5 0
Cycle superhighways & commuting potentialMore frequent bicycle use of bicycle commuters – in terms of socio-demographics
N= 1,201; persons surveyed who use the bicycle for the way to school/university/place of education or to the place of work/training
Yes74%
No26%
Assuming there was a cycle superhighway to your place of work/education. Could you imagine to use the bicycle more frequently for this route if this was the case?
74
77
71
83
76
73
69
72
60
Total
Female
Male
14-19 years
20-29 years
30-39 years
40-49 years
50-59 years
60-69 years
Commuting potentialby gender and age
Figures in percent

5 1
Protected bike lanes and cycle-only roads
05

5 2
7%
34%
59%
Protected bike lanes and cycle-only roadsAwareness and use of
N = 3,053; all persons surveyed
Protected bike lanes
34%
36%
30%Already used
Known, but notyet used.
Unknown
Cycle-only roads
5 3
Preference of cycle-only roads over other cycle tracks
N= 922; persons surveyed who have already use a cycle-only road
“Do you prefer cycle-only roads over other cycle tracks?”
Yes48%
Equivalent to other cycle tracks
44%
No8%

5 4
Bicycle tourism and bicycle market06
5 5
44
41
46
45
45
47
46
41
38
Total
Female
Male
14-19 years
20-29 years
30-39 years
40-49 years
50-59 years
60-69 years
N= 2,376: Cyclists N= 2,376; cyclists
Yes44%No
56%
Bicycle tour in the last two yearsIn terms of socio-demographics
"In the last two years, have you taken a cycling tour ofat least ½ day up to several days?" Separated by gender and age
Figures in percent

5 6
2%
6%
7%
85%
Yes, one or more complete routes.Yes, partially.NoUnknown
Use of D-routes
“Have you ever used a ‘D route’?”
N = 3,053; all persons surveyed N= 229; persons who have already cycled on a D route
Figures in percent
15
14
14
10
15
15
7
20
10
17
8
6
Route 1: North Sea Coast Route
Route 2: Baltic Coast Route
Route 3: European Bicycle Route
Route 4: Mittelland Route
Route 5: Saar-Mosel-Main Route
Route 6: Danube Route
Route 7: Pilgrimage Route
Route 8: Rhine Route
Route 9: Weser Romantic Route
Route 10: Elbe Cycle Route
Route 11: Baltic Sea - Upper BavariaRoute
Route 12: Oder-Neiße Cycle Route
“Which ‘D-route(s)’ have you already used?” (more than one answer possible)

5 7
Type of bicycle used
62
27
17
14
8
3
2
1
3
Conventional bicycle (ladies bicycle, city bicycle or similar)
Mountain bike
Trekking bike
Pedelec
Sports bicycle (fitness bicycle, racing bicycle or similar)
Cargo bike
Folding bike
Individual custom-designed bike
Other
“What type of bicycle or what types of bicycles do you personally use?” (more than one answer possible)
N= 2,376; cyclistsFigures in percent

5 8
3. “How much will you probably spend on this bicycle including accessories?“ (aggregate of all types of bicycles)
Plans to buy a bicycleType of bicycle and budget
1. “Are you planning on buying a new bicycle in the next twelve months?”
2. “What type of bicycle or what types of bicycles will you most probably buy then?“
1. 2. 3.
Ø approx. € 865,-
4
17
18
12
12
13
11
7
6
Up to € 100
Up to € 300
Up to € 500
Up to € 800
Up to € 1,000
Up to € 1,500
Up to € 2,000
Upwards of € 2,000
I don’t know
Budget
N = 3,053; all persons surveyed N= 933 persons, who are planning on buying a new bicycle in the next twelve monthsFigures in percent
42
32
22
13
13
5
2
1
1
Elektrofahrrad(Pedelec)
HerkömmlichesFahrrad (Damenrad,…
Mountainbike
Sportrad (Fitnessbike,Rennrad o.ä.)
Trekkingrad
Lastenfahrrad
Faltrad
individuelleSonderanfertigung
Sonstiges
Electric bicycle (pedelec)
Conventional bicycle
Mountain bike
Sports bicycle (fitness bicycle, racing bicycle or the like)
Trekking bike
Cargo bike
Folding bike
Individual custom-designed bike
Other
Planned purchase Type(s) of bicycles(more than one answer possible)
31 %
6%
25%
32%
37%
Yes, for sure.
Yes, maybe.
Probably not.
No, for sure not.

5 9
***N= 924 potential buyers**N= 925 potential buyers
*N= 492 potential buyers
Plans to buy a bicycleTime comparison survey 2019 – 2017 – 2015
“Are you planning on buying a new bicycle in the next twelve months?”“How much will you probably spend on this bicycle including accessories?“
25
24
21
6
5
4
MaybeYes, for sure.
Ø spending
€ 681,-
€ 603,-
€ 865,-2019***
2017**
2015*
29%
31%
25%
Figures in percent
N = 3,053, all persons surveyed**N= 3,156 all persons surveyed
*N= 2,000 all persons surveyed

6 0
Plans to buy a bicycle – type of bicycleTime comparison survey 2019 – 2017
42
32
22
13
13
5
15
43
23
13
20
3
Pedelec
Conventional bike
Mountain bike
Trekking bike
Sports bike (e.g. racing bike)
Cargo bike
2019**
2017*
“What type of bicycle or what types of bicycles will you most probably buy then?“ (more than one answer possible)
Figures in percent**N= 924 potential buyers
*N= 925 potential buyers

6 1
Comparison: cyclists in rural areas vs. cyclists in urban areas
07

6 2
Frequency of bicycle use
8
15
25
30
25
21
Rural area (population of less than 20,000)
Urban area (population greater than50,000)
Urban vs. rural area
A few times a month
Several times a week
Daily
“How often do you use the bicycle/pedelec?”
N = 3,053; all persons surveyedFigures in percent
BICYCLE/PEDELEC
33 %
Regular use
45 %

6 3
Improvements for cycling (1/2) Urban vs. rural area
64
50
41
42
41
40
36
35
29
60
53
45
45
44
43
40
37
35
mehr Radwege bauen
Trennung der Radfahrenden von den Pkw-fahrenden
Trennung der Radfahrenden von den Fußgängern
mehr Schutz- und Radfahrstreifen einrichten
sichere Fahrradabstellanlagen
mehr Fahrradstraßen einrichten
Belag der Radwege verbessern
Kreuzungsbereiche besser einsehbar gestalten
mehr Abstellanlagen
"In your opinion, what are the areas where politicians could do more for cycling?" (more than one answer possible)
N = 3,053; all persons surveyedFigures in percent
Urban area (population greater than 50,000)
Rural area (population <20,000)
Build more cycle paths
Separate cyclists from car drivers
Separate cyclists from pedestrians
Establish more advisory and mandatory cycle lanes
Provide secure parking facilities
Establish more cycle-only roads
Improve surface of cycle paths
Improve visibility at intersections
Build more parking facilities

6 4
Improvements for cycling (2/2) Urban vs. rural area
27
25
21
23
18
16
15
11
34
30
28
27
27
23
20
14
vorhandene Radwege verbreitern (auch für Lastenräder)
Kampagnen zum besseren Miteinander von Fußgängern, Rad-und Autofahrern
Mobilitäts- und Verkehrserziehung, z.B. an Schulen
Verkehrsregeln für Radfahrende fahrradfreundlicher/sicherergestalten
Weniger Radwege unmittelbar neben parkenden Fahrzeugen
Bekanntmachung der Verkehrsregelungen für Radfahrende
(Bessere) Rad-Aufstellflächen im Kreuzungsbereich
Imagekampagnen für mehr Radverkehr
"In your opinion, what are the areas where policymakers could do more for cycling?" (more than one answer possible)
N = 3,053; all persons surveyedFigures in percent
Urban area (population greater than 50,000)
Rural area (population <20,000)
30
Make existing cycle paths wider (also for cargo bikes)
Campaigns for improving mutual respect between pedestrians, cyclists and car drivers
Provide mobility and road safety education, e.g. in schools
Make traffic rules more cycle-friendly/safer for cyclists
Reduce number of cycle paths directly next to parking cars
Make known traffic rules for cyclists
Provide (better) waiting spots for cyclists at intersections
Start image campaigns for more cycling

6 5
61
62
61
38
30
20
29
14
69
68
55
56
44
40
35
22
Da zu viel Verkehr auf den Straßen ist
Da andere Autofahrende rücksichtslos sind
Da zu schnell mit Autos gefahren wird
Da bei parkenden Fahrzeugen die Gefahr von sich plötzlichöffnenden Pkw-Türen besteht
Da zu viele Fahrzeuge den Radweg als Haltezone betrachten
Da andere Radfahrende rücksichtslos sind
Da viele Fahrradwege in einem schlechten Zustand sind
Da zu viele Radfahrende mit unterschiedlicher Geschwindigkeitden Radweg nutzen
There is too much traffic on the roads.
Other car drivers behave reckless.
Cars are being driven too fast.
There is the danger that doors of parking vehicles are suddenly being opened.
Too many vehicle drivers consider cycle paths a drop-off zone.
Other cyclists behave reckless.
Many cycle paths are in poor condition.
There are too many cyclists riding at different speeds on the cycle track.
Reasons for insecurityRural vs. urban area (selection of statements with relevant deviations)
“Why do you feel (rather) insecure?” (more than one answer possible)
N= 1,035; cyclists who feel (rather) insecure on the bicycleFigures in percent
Urban area (population >50,000)
Rural area (population <20,000)

6 6
Summary: urban vs. rural areaOverview of the most significant differences
Rural area(population up to 20,000)
Urban area(population of 50,000 or more)
Means of transport that will be used more frequently in the future*
Car (34 %) Bicycle (43 %)
Regular bicycle use (at least several times a week)
33 % 45 %
Reasons insecurity on bicycle* (Basis: cyclists who feel insecure)
Reckless car drivers (62 %) Too much traffic on the roads (69 %)
Most frequently used type of bicycle routes*(Basis: cyclists)
Roadway without marked cycle lanes (51 %)
Roadway with separately marked cycle lanes (53 %)
Feeling of security on this type of track 80 % feel insecure 34 % feel insecure
Regular use of cycle helmets (Basis: cyclists)
37 % 38 %
Cycling in my city is fun. 55 % 49 %
Awareness of bike rental systems 56 % 71 %
Interest in pedelecs 48 % 44 %
Awareness of cargo bikes 41 % 56 %
Cargo bike potential 7 % 11 %
*refers to the most frequently given response in each case

6 7
© Copyright Sinus Markt- und Sozialforschung GmbH, Heidelberg.
Funded from resources for the National Cycling Plan by the Federal Minister of Transport and Digital Infrastructure
Quotes and reprints must acknowledge the source.
Sinus Markt- und Sozialforschung GmbHAdenauerplatz 1 / D - 69115 Heidelberg
HRB 332922 MannheimManaging Directors:
Manfred Tautscher, Berthold Flaig
Tel.: +49(0)6221-8089-0/ Fax: +49 (0) 6221-8089-25Email: [email protected]
Web: http://www.sinus-institut.de