2018 western asset corporate bond ladders · fund investors, recognized as a global leader in...
TRANSCRIPT

1Q 2018 Separately Managed Accounts
WESTERN ASSETCORPORATEBOND LADDERS
INVESTMENT PRODUCTS: NOT FDIC INSURED • NO BANK GUARANTEE • MAY LOSE VALUE
Introduction | Legg Mason
Meet our investment managers
Having honed their expertiseover many decades and marketcycles, our global asset managersoffer specialized capabilitiesacross a scope of asset classesand strategies. Each skilled teamoperates with independentvision to help deliver powerfulfinancial solutions for bothindividuals and institutions.
Global alternative investments One of the world’s largest hedge fund investors, recognized as a global leader in structuring comprehensive alternative investment strategies for institutional and high net worth clients.
Active equity specialists An active equity specialist that builds global, stock-driven portfolios based on fundamental research, devoting all of its resources to delivering optimum investment outcomes and superior client relationships.
Quality-focused equity Global investment manager with over 50 years of experience and long-tenured portfolio managers who seek to build income, high active share or low volatility portfolios.
Investing with conviction Acting with conviction and discipline, we look beyond short-term, conventional thinking to rigorously pursue long-term value across differentiated fixed income, equity, and alternative solutions.
Systematic investment solutions QS Investors is a quantitative asset manager that provides multi-asset class and global equity solutions. Their approach unites intellectual and academic precision with the power of data and technology in their quest to elevate the certainty of outcomes they deliver.
Small-cap equityKnown for its disciplined, value-oriented approach to managing small-caps. An asset class pioneer, the firm’s founder is one of the longest-tenured active managers.
Global listed infrastructure investing RARE is a dedicated infrastructure investment manager focused on global listed infrastructure investments. Established in 2006, RARE has grown to become one of the largest listed infrastructure managers globally.
Fixed incomeOne of the world’s leading global fixed income managers. Founded in 1971, the firm is known for team management, proprietary research and a long-term fundamental value approach.
Real estate investment specialists Clarion Partners is a leading private equity and debt real estate investment manager established in 1982. Clarion invests in the Americas across a broad range of property types and risk profiles, with the goal of consistently creating value for its clients.
Active share is a measure of the percentage of stock holdings in a manager’s portfolio that differs from the benchmark index.
.
2
Introduction | Western Asset
Western Asset Management Approach and Philosophy
Western Asset is a global investment management firm committed to understanding the needs of each client,identifying investment solutions, and delivering superior long-term investment results.
Team-managed approach• Team unites groups of
specialists dedicated todifferent market sectors
• Each group of sectorspecialists utilizes itsexpertise in bottom-upanalysis of each portfoliosector
Investment PhilosophyLong-term, fundamentalvalue discipline• Bottom-up
• Top-down Diversified strategies• Depth of resources
• Global Integrated analytics and riskmanagement• Relative value analysis
• Transparency andcommunication
Objective-Driven InvestingSeeks to:Preserve Principal§• Money Markets
• Limited Duration Protect From Rising Rates§• Adjustable Rate
• Bank Loans Protect From Inflation§• U.S. TIPS§
• Global Inflation-Linked§
• Active Currency Diversify Globally§• Global Sovereign
• Global Infrastructure Debt§
• Global Core/Core FullDiscretion
• Global Credit
Core Fixed Income§• Intermediate
• Core
• Core Full Discretion
• Investment-Grade Credit
• Agency Mortgage-Backed Generate Total Return§• Total Return Unconstrained
• Global Total Return
• Global Multi-Sector
• Dynamic Fixed Income
• Credit Opportunities
• MBS Opportunities
• Emerging MarketOpportunities
Enhance Income§• Short-Duration High Income
• Emerging Markets Debt
• High Yield
• Diversified High Income
• Structured Products/REIT/CLO
Increase Alpha§• Global Credit Absolute
Return§
• Macro Opportunities§
Hedge Liabilities§• Long Duration§
• Long Credit§
• Liability-Driven Investing
• Tail Risk Protection§
.
3

Your investment portfolio | Corporate Bond Ladders
Western Asset Corporate Bond Ladders Portfolios
Overview• The Western Asset Corporate Bond Ladders are designed to
deliver income opportunities while preserving capital and reducinginterest rate risk by investing in laddered corporate bonds. Thestrategy invests in a diversified portfolio of credit-monitoredinvestment-grade corporate securities with equally weightedmaturities from 1-5 years or 1-10 years.
Key differentiators• Team-managed approach Team unites groups of specialists dedicated to different market
sectors
Each group of specialists draws on its distinctive expertise in thebottom-up analysis of its respective sector
• In-depth bond research Looks across sectors and issues to select attractive income
opportunities and ensure diversification when reinvesting cashflows
• Overseen by a fixed income leader Access to a highly regarded proprietary credit research team in
selecting and monitoring holdings
Exclusive focus on fixed income management
Long tenure managing separately managed accounts in taxableand tax-exempt markets
All investments involve risk, including the loss of principal, and there is no guarantee that investment objectives will be met.
.
4
Your investment portfolio | Corporate Bond Ladders
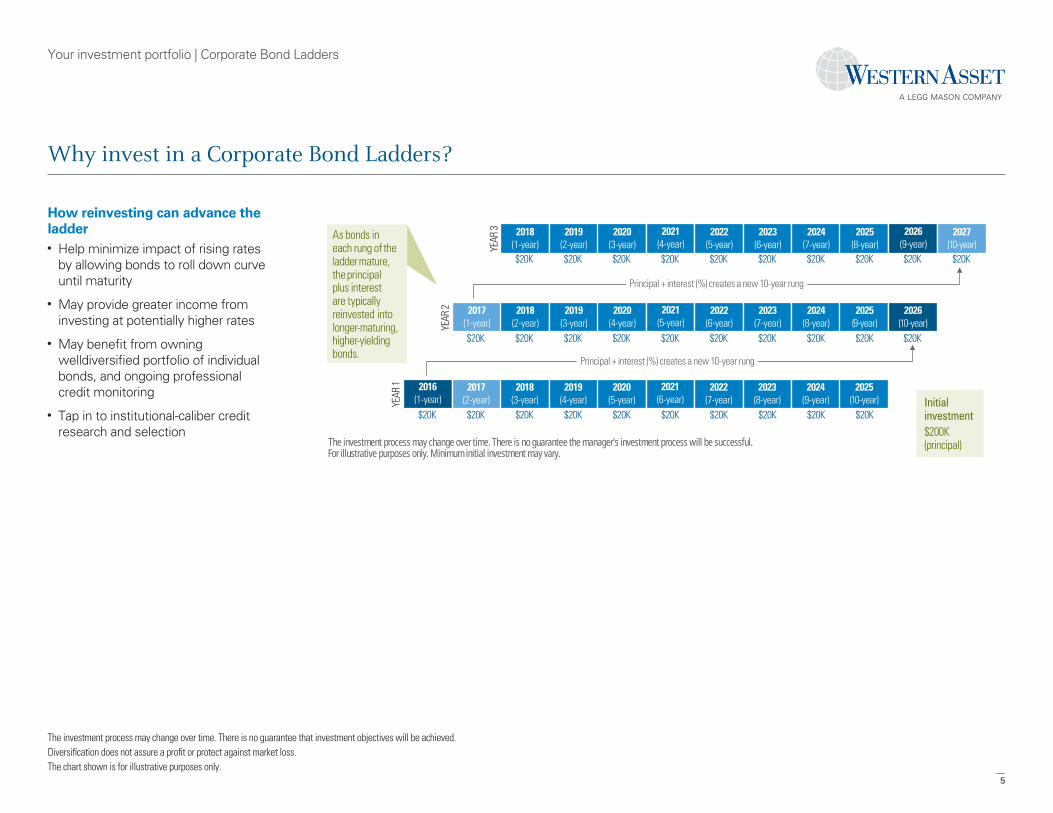
Why invest in a Corporate Bond Ladders?
How reinvesting can advance theladder• Help minimize impact of rising rates
by allowing bonds to roll down curveuntil maturity
• May provide greater income frominvesting at potentially higher rates
• May benefit from owningwelldiversified portfolio of individualbonds, and ongoing professionalcredit monitoring
• Tap in to institutional-caliber creditresearch and selection
2016(1-year)YEAR
1 2017(2-year)
2018(3-year)
2019(4-year)
2020(5-year)
2021(6-year)
2022(7-year)
2023(8-year)
2024(9-year)
2025(10-year)
$20K $20K $20K $20K $20K $20K $20K $20K $20K $20K
$20K $20K $20K $20K $20K $20K $20K $20K $20K $20K
YEAR
3 2018(1-year)
2019(2-year)
2020(3-year)
2021(4-year)
2022(5-year)
2023(6-year)
2024(7-year)
2025(8-year)
2026(9-year)
2027(10-year)
Principal + interest (%) creates a new 10-year rung
As bonds in each rung of the ladder mature, the principal plus interest are typically reinvested into longer-maturing,higher-yieldingbonds.
Initial investment$200K (principal)
$20K $20K $20K $20K $20K $20K $20K $20K $20K $20K
YEAR
2 2017(1-year)
2018(2-year)
2019(3-year)
2020(4-year)
2021(5-year)
2022(6-year)
2023(7-year)
2024(8-year)
2025(9-year)
2026(10-year)
The investment process may change over time. There is no guarantee the manager's investment process will be successful. For illustrative purposes only. Minimum initial investment may vary.
Principal + interest (%) creates a new 10-year rung
The investment process may change over time. There is no guarantee that investment objectives will be achieved.Diversification does not assure a profit or protect against market loss.The chart shown is for illustrative purposes only.
.
5

Your investment portfolio | Corporate Bond Ladders
Western Asset Corporate Bond Ladders Portfolios
• We believe: Laddered portfolios may offer advantages over self-managed
portfolios in creating a stable stream of income
Ladders represent a disciplined approach that allows investors tomanage changes in interest rates
Credit monitoring may enhance income by providingopportunities to allocate across the full range of investment-grade securities
A diversified set of bonds with staggered maturities and couponstream may provide continued opportunities for reinvestment
Objectives• The strategy seeks to maintain a competitive level of income while
preserving of principal by investing — and reinvesting — in a well-diversified portfolio of investment-grade corporate bonds withladdered maturities
Risks:All investments involve risk, including the loss of principal, and there is no guarantee that investment objectives will be met.Fixed income securities are subject to interest rate and credit risk, which is a possibility that the issuer of a security will be unable to make interest payments and repay the principal on its debt. As interest rates rise, the price of fixed income securities falls.Fixed income securities are subject to illiquidity risk, which is the risk that securities may be difficult to sell at certain prices when no market participants are willing to purchase the securities at such prices.For tax-exempt securities, certain investors may be subject to the Federal Alternative Minimum Tax, and state and local taxes may apply. Capital gains, if any, are fully taxable. Depends on individual tax situation. Please see important tax information.State-specific and state-biased portfolios within this Portfolio focus on individual states and are more vulnerable to losses caused by adverse developments in those states than are national portfolios, which diversify investments across multiple states.Tapering of the Federal Reserve Board’s quantitative easing program and a general rise in interest rates may lead to increased portfolio volatility.
.
6
Your investment portfolio | Corporate Bond Ladders
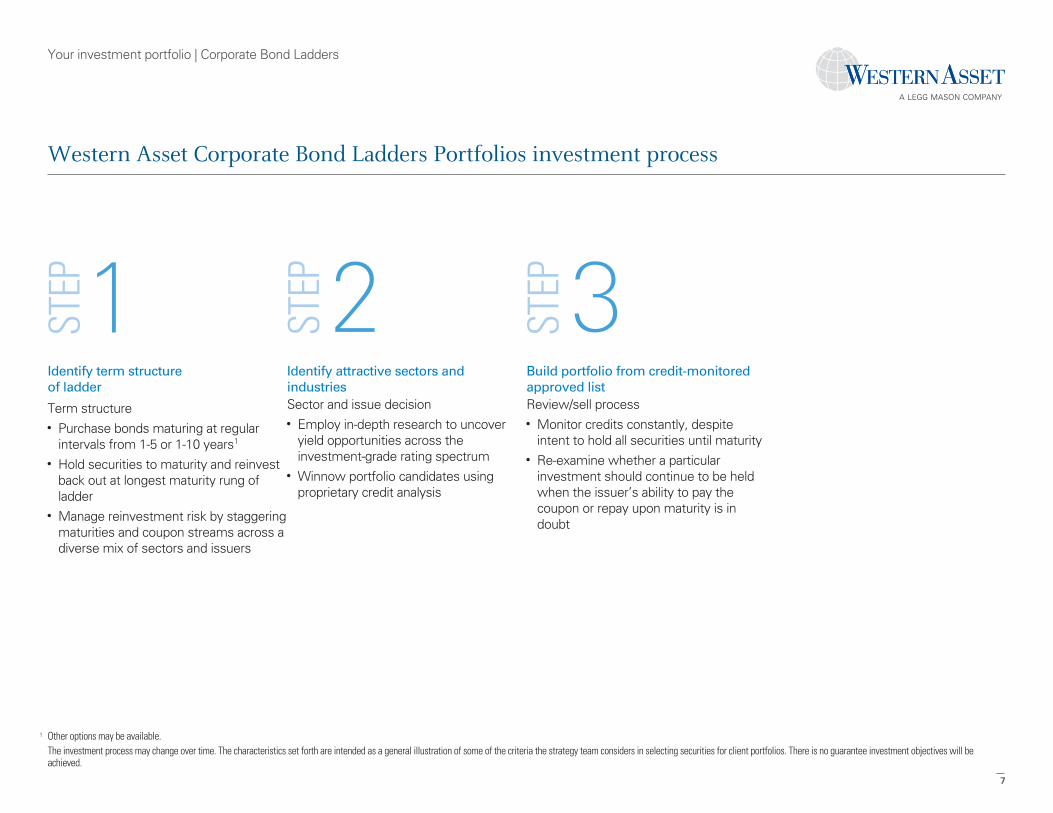
Western Asset Corporate Bond Ladders Portfolios investment process
Identify term structureof ladder
Term structure• Purchase bonds maturing at regular
intervals from 1-5 or 1-10 years1
• Hold securities to maturity and reinvestback out at longest maturity rung ofladder
• Manage reinvestment risk by staggeringmaturities and coupon streams across adiverse mix of sectors and issuers
Identify attractive sectors andindustriesSector and issue decision• Employ in-depth research to uncover
yield opportunities across theinvestment-grade rating spectrum
• Winnow portfolio candidates usingproprietary credit analysis
Build portfolio from credit-monitoredapproved listReview/sell process• Monitor credits constantly, despite
intent to hold all securities until maturity• Re-examine whether a particular
investment should continue to be heldwhen the issuer’s ability to pay thecoupon or repay upon maturity is indoubt
1 Other options may be available.The investment process may change over time. The characteristics set forth are intended as a general illustration of some of the criteria the strategy team considers in selecting securities for client portfolios. There is no guarantee investment objectives will beachieved.
.
7

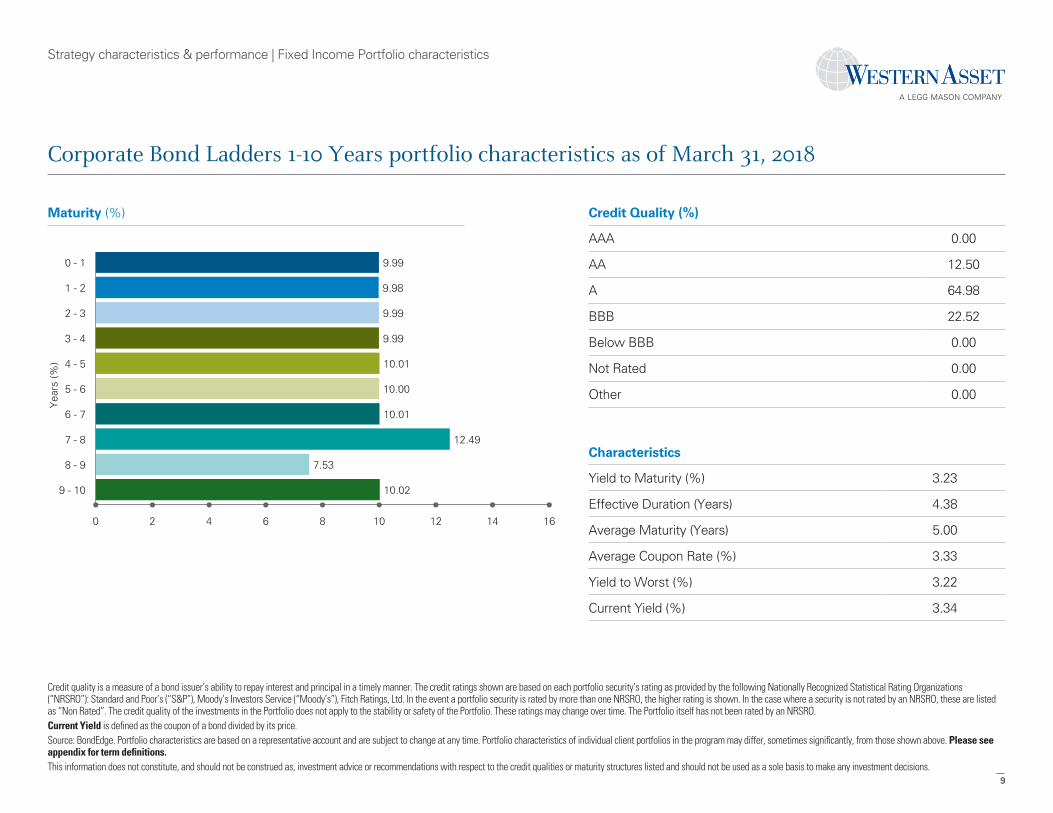
Strategy characteristics & performance | Fixed Income Portfolio characteristics
Corporate Bond Ladders 1-5 Years portfolio characteristics as of March 31, 2018
Maturity (%)
17.49
19.99
19.99
19.99
20.04
2.505 - 6
4 - 5
3 - 4
2 - 3
1 - 2
0 - 1
0 5 10 15 20 25 30
Yea
rs (%
)
Credit Quality (%)
AAA 0.00
AA 22.50
A 59.99
BBB 17.50
Below BBB 0.00
Not Rated 0.00
Other 0.00
Characteristics
Yield to Maturity (%) 2.88
Effective Duration (Years) 2.42
Average Maturity (Years) 2.62
Average Coupon Rate (%) 3.13
Yield to Worst (%) 2.87
Current Yield (%) 3.11
Credit quality is a measure of a bond issuer’s ability to repay interest and principal in a timely manner. The credit ratings shown are based on each portfolio security’s rating as provided by the following Nationally Recognized Statistical Rating Organizations(“NRSRO”): Standard and Poor’s (“S&P”), Moody’s Investors Service (“Moody’s”), Fitch Ratings, Ltd. In the event a portfolio security is rated by more than one NRSRO, the higher rating is shown. In the case where a security is not rated by an NRSRO, these are listedas “Non Rated”. The credit quality of the investments in the Portfolio does not apply to the stability or safety of the Portfolio. These ratings may change over time. The Portfolio itself has not been rated by an NRSRO.Current Yield is defined as the coupon of a bond divided by its price.Source: BondEdge. Portfolio characteristics are based on a representative account and are subject to change at any time. Portfolio characteristics of individual client portfolios in the program may differ, sometimes significantly, from those shown above. Please seeappendix for term definitions.This information does not constitute, and should not be construed as, investment advice or recommendations with respect to the credit qualities or maturity structures listed and should not be used as a sole basis to make any investment decisions.
.
8
Strategy characteristics & performance | Fixed Income Portfolio characteristics
Corporate Bond Ladders 1-10 Years portfolio characteristics as of March 31, 2018
Maturity (%)
9.99
9.98
9.99
9.99
10.01
10.00
10.01
12.49
7.53
10.029 - 10
8 - 9
7 - 8
6 - 7
5 - 6
4 - 5
3 - 4
2 - 3
1 - 2
0 - 1
0 2 4 6 8 10 12 14 16
Yea
rs (%
)
Credit Quality (%)
AAA 0.00
AA 12.50
A 64.98
BBB 22.52
Below BBB 0.00
Not Rated 0.00
Other 0.00
Characteristics
Yield to Maturity (%) 3.23
Effective Duration (Years) 4.38
Average Maturity (Years) 5.00
Average Coupon Rate (%) 3.33
Yield to Worst (%) 3.22
Current Yield (%) 3.34
Credit quality is a measure of a bond issuer’s ability to repay interest and principal in a timely manner. The credit ratings shown are based on each portfolio security’s rating as provided by the following Nationally Recognized Statistical Rating Organizations(“NRSRO”): Standard and Poor’s (“S&P”), Moody’s Investors Service (“Moody’s”), Fitch Ratings, Ltd. In the event a portfolio security is rated by more than one NRSRO, the higher rating is shown. In the case where a security is not rated by an NRSRO, these are listedas “Non Rated”. The credit quality of the investments in the Portfolio does not apply to the stability or safety of the Portfolio. These ratings may change over time. The Portfolio itself has not been rated by an NRSRO.Current Yield is defined as the coupon of a bond divided by its price.Source: BondEdge. Portfolio characteristics are based on a representative account and are subject to change at any time. Portfolio characteristics of individual client portfolios in the program may differ, sometimes significantly, from those shown above. Please seeappendix for term definitions.This information does not constitute, and should not be construed as, investment advice or recommendations with respect to the credit qualities or maturity structures listed and should not be used as a sole basis to make any investment decisions.
.
9

Appendix | Investment Management Team
Investment management team
Western Asset, one of the world’s leading fixed income managers, was founded in 1971. With a focus on long-termfundamental value investing that employs a top-down, bottom-up approach, the firm has nine offices around the globeand deep experience across the range of fixed income sectors. Western Asset has been recognized for its emphasis onteam management and intensive proprietary research, supported by robust risk management.
.
10

Appendix | Index Definitions
Definitions
Index DefinitionsThe Bloomberg Barclays 1-3 Year Government Bond Index is a broad measure of theperformance of short-term government bonds. Please note an investor cannot invest directlyin an index.
The Bloomberg Barclays 1-Year Municipal Bond Index is an unmanaged index composedof national municipal bond issues with a maturity range of 1-2 years.
The Bloomberg Barclays 5-Year Municipal Bond Index is a market-value-weighted indexrepresentative of the medium term (4 to 6 years) tax-exempt bond market.
The Bloomberg Barclays Asset-Backed Securities Index is composed of debt securitiesbacked by credit card, auto and home equity loans that are rated investment grade or higherby Moody’s Investors Service, Standard & Poor’s Ratings Service or Fitch Investor’s Service,in that order. Issues must have at least one year to maturity and an outstanding par value ofat least $50 million. Price, coupon and total return are reported on a month-end to month-endbasis. All returns are market value-weighted inclusive of accrued interest but do not includeadjustments for advisory fees or other expenses.
The Bloomberg Barclays Fixed-Rate Mortgage-Backed Securities Index is composed ofabout 600 15- year to 30-year fixed-rate mortgage-backed pools of Government NationalMortgage Association, Federal National Mortgage Association and Federal Home LoanCorporation.
The Bloomberg Barclays U.S. Agencies Index is the U.S. Agency component of the U.S.Government/Credit index, consisting of publicly issued debt of U.S. Government agencies,quasi-federal corporations, and corporate or foreign debt guaranteed by the U.S. Government(such as USAID securities). The largest issues are Fannie Mae, the Resolution Trust FundingCorporation (REFCORP), and the Federal Home Loan Bank System (FHLB). The indexincludes both callable and non-callable agency securities.
The Bloomberg Barclays U.S. Aggregate Bond Index includes the Government/Credit andthe Mortgage-Backed indexes. The return comprised price appreciation/depreciation andincome as a percent of the original investment. Indexes are rebalanced monthly by marketcapitalization.
The Bloomberg Barclays U.S. Credit Index is the U.S. Credit component of the U.S.Government/Credit Index consisting of publicly issued U.S. corporate and specified foreigndebentures and secured notes that meet the specified maturity, liquidity, and qualityrequirements. To qualify, bonds must be SEC-registered. The U.S. Credit Index is the sameas the former U.S. Corporate Investment Grade Index, which has been renamed the U.S.Credit Index. The name change is effective as of 6/1/00 (for statistics) and as of 7/1/00 (forreturns).
The Bloomberg Barclays U.S. Government/Credit Bond Index includes the BloombergBarclays U.S. Government bond Index and the Barclays Credit Bond Index. The GovernmentIndex includes all public U.S. Treasury obligations and the debt of U.S. Government agenciesand quasi-federal corporations. The Credit Index includes corporates (industrial, utility andfinance including both U.S. and non-U.S. corporations) and noncorporates (sovereign,supernational, foreign agencies and foreign local governments).
The Bloomberg Barclays U.S. Intermediate Government/Credit Bond Index is a marketvalue weighted performance benchmark for government and corporate fixed-rate debtissues (rated Baa/BBB or higher) with maturities between one and ten years.
The Bloomberg Barclays U.S. Intermediate Treasury Bond Index is composed of allpublic obligations of the U.S. Treasury. This index has an average current maturity of 3.69years (average maturity may vary over time).
The Bloomberg Barclays U.S. Treasury Index is a measure of the public obligations of theU.S. Treasury.
The FTSE 3-Month U.S. Treasury Bill Index is an index based upon the average monthlyyield of the 90-day Treasury bills. Treasury bills are secured by the full faith and credit of theU.S. Government and offer a fixed rate of return.
The Merrill Lynch 1-3 Year Treasury Bond Index is a market capitalization-weighted indexincluding all U.S. Treasury notes and bonds with maturities greater than or equal to one yearand less than three years.
Investors cannot invest directly in an index and unmanaged index returns do not reflect anyfees, expenses or sales charges.
.
11

Appendix | Market terms
Definitions
Market termsAsset-Backed Security-(ABS) - A financial security backed by a loan, lease orreceivables against assets other than real estate and mortgage-backed securities. Forinvestors, asset-backed securities arean alternative to investing incorporate debt.
Commercial Mortgage-Backed Securities-(CMBS) - are a type of mortgage-backedsecurity that is secured by the loan on a commercial property. A CMBS can provideliquidity to real estate investors and to commercial lenders.
Collateralized Mortgage Obligations-(CMO) - are securities backed by a pool ofpass-through securities, which consists of several classes of bondholders with varyingmaturities. The principal payments from the underlying pool of pass-through securitiesare used to retire the bonds on a priority basis as specified in the prospectus.
Mortgage-Backed Securities-(MBS) - A type of asset-backed security that is securedby amortgage, or a collection of mortgages. These securities must also begroupedinone of thetop tworatings as determined by an accredited credit rating agency,andusually pay periodic payments that are similar to coupon payments.Furthermore,the mortgage must have originated from a regulated and authorized financialinstitution.
Mortgage Pool - Group of related financial instruments, such as mortgages, combinedfor resale to investors on a secondary market.
Mortgage Dollar Roll - A special type of repurchase agreement in which the security,transferred to the investor as collateral, is a mortgage-backed security. The investorwho sells the security gives up the cash flows during the roll period, buthas use of theproceeds.
Treasury Inflation Protected Securities-(TIPS) - A special type of Treasury note orbond that offers protection from inflation. Like other Treasuries, an inflation-indexedsecurity pays interestevery six months and pays the principal when the securitymatures. The difference is that the coupon payments and underlying principal areautomatically increased to compensate for inflation as measured by the consumerprice index (CPI). Also referred to as “Treasury inflation-indexed securities.”
.
12
Appendix | Term Definitions
Definitions
Term definitionsMaturity is the date at which a debt instrument is due and payable.A bond due to mature on January 1, 2010, will return thebondholder’s principal and final interest payment when it reachesmaturity on that date. Bond yields are frequently calculated on ayield-to-maturity basis.
Duration (Modified Duration) is the measure of the price sensitivityof a fixed income security to an interest rate change of 100 basispoints. Calculation is based on the weighted average of the presentvalues for all cash flows.
Yield to Worst (YTW) is based on a portfolio’s current holdings onone specific day, is gross of all portfolio expenses, and is calculatedbased on assumptions that prepayment occurs if the bond has call orput provisions and the issuer can offer a lower coupon rate based oncurrent market rates. If market rates are higher than the current yieldof a bond, the YTW calculation will assume no prepayments aremade, and YTW will equal the yield to maturity. The YTW will be thelowest of yield to maturity or yield to call (if the bond has prepaymentprovisions). The YTW of a bond portfolio is the market-weightedaverage of the YTWs of all the bonds in the portfolio.
Insured municipal bonds are ones where scheduled interest andprincipal payments are guaranteed by AAA-rated municipal bondinsurers.
General Obligation municipal bonds are backed by the credit andtaxing power of the issuing jurisdiction rather than the revenue of agiven project.§
Revenue bonds are municipal bonds supported by the revenue froma specific project.
Pre-refunded bonds are municipal bonds that are generally backedor secured by U.S. Treasury bonds.
Effective Duration is a duration calculation for bonds withembedded options. Effective duration takes into account thatexpected cash flows will fluctuate as interest rates change.
Average Maturity is the average length of maturity for all fixed-ratedebt instruments held in a portfolio.
Average Coupon based on the portfolio’s underlying holdings,which may differ and are subject to change. Coupon rate is theannual coupon payments paid by the issuer relative to a bond’s faceor par value.
Yield to Maturity - The rate of return anticipated on a bond if it isheld until the maturity date. The calculation of YTM takes intoaccount the current market price, par value, coupon interest rate andtime to maturity.
The Sharpe Ratio is a risk-adjusted measure that is calculated usingstandard deviation and excess return to determine reward per unit ofrisk. The higher the Sharpe Ratio, the better the portfolio’s historicaladjusted performance.§
Alpha is a measure of the difference between actual returns andexpected performance, given the level of risk as measured by Beta,where Beta measures sensitivity to benchmark movements.
R-Squared measures the strength of the linear relationship betweenthe portfolio and its benchmark. R-squared at 1.0 implies perfectlinear relationship and zero implies no relationship exists. Standarddeviation is based on quarterly data.
Standard Deviation is a measure of the variability of returns; thehigher the standard deviation, the greater the range of performance(i.e., volatility).
The Capture Ratios measure a manager’s composite performancerelative to the benchmark, considering only those quarters that areeither positive (Up) or negative (Down) for the benchmark.
An Up Market Capture Ratio greater than 1.0 indicates a managerwho has outperformed the benchmark in the benchmark’s positivequarters.
A Down Market Capture Ratio of less than 1.0 indicates a managerwho has outperformed the relative benchmark in the benchmark’snegative quarters.
.
13

Brandywine Global
Clarion Partners
ClearBridge Investments
EnTrustPermal
Martin Currie
QS Investors
RARE Infrastructure
Royce & Associates
Western Asset leggmason.com
Legg Mason is a leading global investment company committed to helping clients reach their financial goals through long-term, actively managed investment strategies.
• A broad mix of equities, fixed-income, alternatives and cash strategies invested worldwide
• A diverse family of specialized investment managers, each with its own independent approach to research and analysis
• Over a century of experience in identifying opportunities and delivering astute investment solutions to clients
Separately Managed Accounts (SMAs) are investment services provided by Legg Mason Private Portfolio Group, LLC (LMPPG), a federally registered investment adviser. Client portfolios are managed based oninvestment instructions or advice provided by one or more of the following Legg Mason-affiliated sub-advisers: ClearBridge Investments, LLC. and Western Asset Management Company. Management isimplemented by LMPPG, the designated subadviser or, in the case of certain programs, the program sponsor or its designee.Investments for the program(s) discussed herein are traded primarily in U.S. markets and unless otherwise noted, equity and fixed-income investments for such program(s) are primarily of U.S. issuers. In addition,unless otherwise noted, indexes referred to herein represent groups of securities that are issued primarily by U.S. issuers.IMPORTANT TAX INFORMATION: Legg Mason, Inc., its affiliates, and its employees are not in the business of providing tax or legal advice to taxpayers. These materials and any tax-related statements are notintended or written to be used, and cannot be used or relied upon, by any such taxpayer for the purpose of avoiding tax penalties or complying with any applicable tax laws or regulations. Tax-related statements, ifany, may have been written in connection with the “promotion or marketing” of the transaction(s) or matter(s) addressed by these materials, to the extent allowed by applicable law. Any such taxpayer should seekadvice based on the taxpayer’s particular circumstances from an independent tax advisor.Investments are not obligations of, and are not guaranteed by, LMPPG or any other Legg Mason Inc affiliate or subsidiary; are not FDIC or government insured; and are subject to risks,including possible loss of the principal amount invested. Professional money management may not be suitable for all investors.Any information, statement or opinion set forth herein is general in nature, is not directed to or based on the financial situation or needs of any particular investor, and does not constitute,and should not be construed as, investment advice, forecast of future events, a guarantee of future results, or a recommendation with respect to any particular security or investment strategyor type of retirement account. Investors seeking financial advice regarding the appropriateness of investing in any securities or investment strategies should consult their financialprofessional.©2018 Legg Mason Investor Services, LLC, member FINRA, SIPC. Legg Mason Investor Services, LLC and Western Asset Management Company are subsidiaries of Legg Mason, Inc.- SMA0055 PPG-Q118-V1§