2018 water quality report - denverwater.org · largest water utility — denver water has a total...
TRANSCRIPT

Water Quality ReportR E P O R T E D E C A L I D A D D E A G U A
2018
WHAT IS THIS REPORT?
The U.S. Environmental Protection Agency requires public water suppliers that serve the same people year-round (community water systems) to provide consumer confidence reports to their customers. These reports are also known as annual water quality reports. This report summarizes information regarding water sources used, any detected contaminants, compliance and educational information.
Where does your water come from?Denver’s drinking water comes from
rivers, lakes, streams, reservoirs and
springs fed by high-quality mountain
snow runoff. Denver Water’s supply is
100 percent surface water that originates
in sources throughout the watershed
that encompasses 4,000 square miles on
both sides of the Continental Divide.
Mountain water sources Denver Water’s water sources are the
South Platte River and its tributaries, the
streams that feed Dillon Reservoir, and
the creeks and canals above the Fraser
River. Denver Water stores its water in
five mountain reservoirs — Antero, Eleven
Mile Canyon, Cheesman, Dillon and Gross.
From these reservoirs, the water is then
sent to one of three treatment plants in
the city through a complex system of
streams, canals and pipes.
After treatment, drinking water is fed
by both gravity and pumps to a system
of underground, clear-water reservoirs
before continuing to your home or
business. More than 3,000 miles of pipe
carry water to Denver Water customers.
Source water assessmentThe state health department has com-
pleted a source water assessment of
the potential for contaminants reaching
any of Denver Water’s three terminal
reservoirs at Strontia Springs, Marston
and Ralston. The potential sources of
contamination that may exist are: EPA
Areas of Concern; Permitted Wastewater
Discharge Sites; Aboveground, Under-
ground and Leaking Storage Tank Sites;
Solid Waste Sites; Existing/Abandoned
Mine Sites; other Facilities; Commercial/
Industrial/Transportation; Residential,
Urban Recreational Grasses; Quarries/
Strip Mines/Gravel Pits; Agriculture;
Forest; Septic Systems; Oil/Gas Wells and
Road Miles. For more information on the
report, contact the Colorado Department
of Public Health and Environment by
calling 303-692-2000.
Información importante acerca de la calidad del aguaPara recibir la versión en español del
Reporte de Calidad de Agua de 2018
de Denver Water, llame a Servicio al
cliente al 303-893-2444 o visite
denverwater.org/CalidadDeAgua.
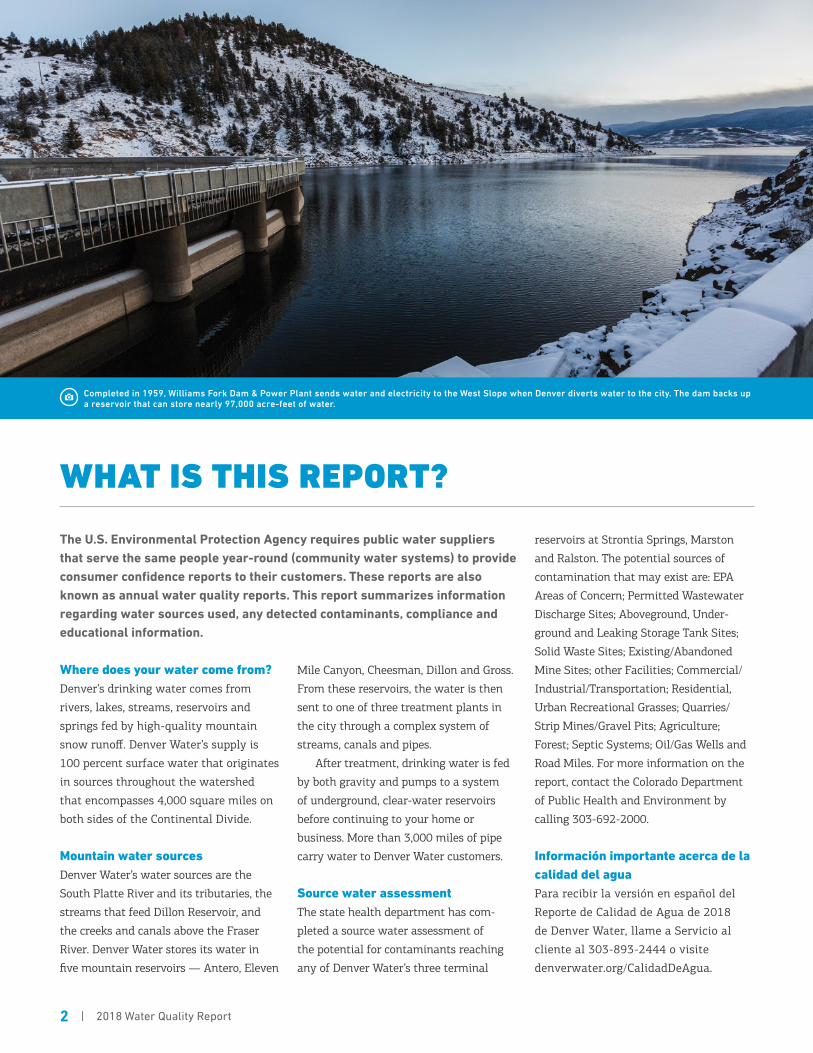
Completed in 1959, Williams Fork Dam & Power Plant sends water and electricity to the West Slope when Denver diverts water to the city. The dam backs up a reservoir that can store nearly 97,000 acre-feet of water.
2 | 2018 Water Quality Report

Denver Water’s collection system covers about 4,000 square miles and extends into more than eight counties.
DENVER WATER’S SYSTEM
Devoted to water qualityDenver Water proudly serves high-qual-
ity water to 1.4 million people in the
city of Denver and many surrounding
suburbs. Since 1918, we have expertly
planned, developed and operated a
complex system that provides clean,
safe, great-tasting water. The utility is
a public agency funded by water rates,
new tap fees and the sale of hydropower,
not taxes. We are Colorado’s oldest and
largest water utility — Denver Water has
a total water service area of more than
360 square miles.
Denver Water serves 25 percent of
the state’s population with less than 2
percent of all the water used in the state.
The natural environment is our lifeline,
and we help protect it by promoting wise
water use.
We take our water quality very
seriously. Last year, we collected more
than 35,000 samples and conducted
more than 68,000 tests to ensure our
water is as clean and safe as possible.
Denver Water vigilantly safeguards
our mountain water supplies, and the
water is carefully treated before it
reaches your tap. This brochure provides
data collected throughout 2017.
Denver Water serves 25 percent of the state’s population with less than 2 percent of all the water used in the state.
THE TREATMENT PROCESSThe treatment process consists of five steps:
1COAGULATION/FLOCCULATION:
Raw water from terminal reser-
voirs is drawn into mixing basins
at our treatment plants where we add
alum and polymer. This process causes
small particles to stick to one another
forming larger particles.
2SEDIMENTATION: Over time, the
now larger particles become
heavy enough to settle to the
bottom of a basin from which sediment
is removed.
3FILTRATION: The water is then
filtered through layers of fine,
granulated materials — either
sand, or sand and coal, depending on
the treatment plant. As smaller, sus-
pended particles are removed, turbidity
diminishes and clear water emerges.
4DISINFECTION: As protection
against any bacteria, viruses
and other microbes that might
remain, disinfectant is added before
the water flows into underground
reservoirs throughout the distribution
system and into your home or business.
Denver Water carefully monitors the
amount of disinfectant added to main-
tain quality of the water at the farthest
reaches of the system. Fluoride occurs
naturally in our water but is also added
to treated water.
5CORROSION CONTROL: pH is
maintained by adding alkaline
substances to reduce corrosion
in the distribution system and the
plumbing in your home or business.
2018 Water Quality Report | 3

WATER AT A GLANCE
All drinking water, including bottled water, may reasonably be expected to contain at least small amounts of some contaminants. The presence of contaminants does not necessarily indicate that the water poses a health risk. More information about contaminants and potential health effects can be obtained by calling the Environmental Protection Agency’s Safe Drinking Water Hotline (800-426-4791).
Some people may be more vulnerable
to contaminants in drinking water than
the general population. Immuno-com-
promised persons such as persons
with cancer undergoing chemotherapy,
persons who have undergone organ
transplants, people with HIV-AIDS or
other immune system disorders, some
elderly, and infants can be particularly
at risk of infections. These people should
seek advice about drinking water from
their health care providers. EPA/CDC
guidelines on appropriate means to
lessen the risk of infection by Cryptospo-
ridium and other microbial contaminants
are available from the Safe Drinking
Water Hotline (800-426-4791).
Lead in Drinking Water Since 1992, Denver Water has tested
water inside homes within its distri-
bution system considered at risk for
lead and copper contamination, per EPA
standards. Denver Water’s source water,
water leaving the treatment plants; and
water in the distribution system have no
detectable lead and trace levels of copper.
Lead can get into water through
lead-containing household or building
plumbing. Softened water is more
aggressive toward household plumbing.
Homes built before 1951 may have lead
service lines, which are the pipes that
connect the water main under the street
to the home. Homes built before 1987
may have lead solder in their plumbing
— lead solder was banned from use on
domestic plumbing in 1986. Homes that
do not fall within these two categories
are at lower risk for lead contamination
in the water.
Lead exposure can cause serious
health problems, especially for pregnant
women and young children. The most
common sources of lead in drinking
water are materials and components
for service lines and home plumbing.
Denver Water is responsible for providing
high-quality drinking water, but cannot
control the materials used in plumbing
components. When your water has
been sitting for several hours, you can
minimize the potential for lead exposure
by flushing your tap for up to a couple of
minutes before using water for drinking
or cooking.
If you are concerned about lead, you
may wish to have your water tested.
Information on lead in drinking water,
testing and steps to minimize exposure
is available from the Safe Drinking
Water Hotline at 800-426-4791,
at epa.gov/safewater/lead and at
denverwater.org/Lead.
Is There a Presence of Cryptosporidium and Giardia?Denver Water has tested for Crypto-
sporidium (Crypto) and Giardia in both
raw and treated water since the 1980s.
Since that time, Denver Water has never
detected a viable indication of either in
the treated drinking water.
Crypto and Giardia are microscopic
organisms that, when ingested, can cause
diarrhea, cramps, fever and other gastro-
intestinal symptoms. Crypto and Giardia
are usually spread through means other
than drinking water.
While most people readily recover
from the symptoms, Crypto and Giardia
can cause more serious illness in
people with compromised immune
systems. The organisms are in many
of Colorado’s rivers and streams and
are a result of animal wastes in the
watershed. At the treatment plants,
Denver Water removes Crypto and
Giardia through effective filtration, and
Giardia is also killed by disinfection.
If you are concerned about lead, Denver Water will test your water for free.
4 | 2018 Water Quality Report

SOURCES OF DRINKING WATER
Sources of drinking water include rivers, lakes, streams, ponds, reservoirs, springs, and wells. Aswater travels over the surface of the land or through the ground, it dissolves naturally occurring minerals and, in some cases, radioactive material. It can also pick up substances resulting from human activity and the presence of animals. Contaminants may include the following:
Microbial contaminants— viruses, bacteria and other microbes
that may come from sewage treatment
plants, septic systems, agricultural
livestock operations, and wildlife.
Inorganic contaminants— salts and metals, which can be naturally
occurring or result from urban storm water
runoff, industrial or domestic wastewater
discharges, oil and gas production, mining,
or farming.
Pesticides and herbicides— chemical substances resulting from a
variety of sources, such as agricultural
and urban storm water runoff, and
residential uses.
Organic chemical contaminants— substances including synthetic and
volatile organic chemicals, which are
by-products of industrial processes and
petroleum production, and also may come
from gas stations, urban storm water
runoff, and septic systems.
Radioactive Contaminants— substances that can be naturally
occurring or be the result of oil and gas
production, and mining activities.
The Blue River above Dillon Reservoir in Silverthorne is one of many sources of Denver’s drinking water.
2018 Water Quality Report | 5
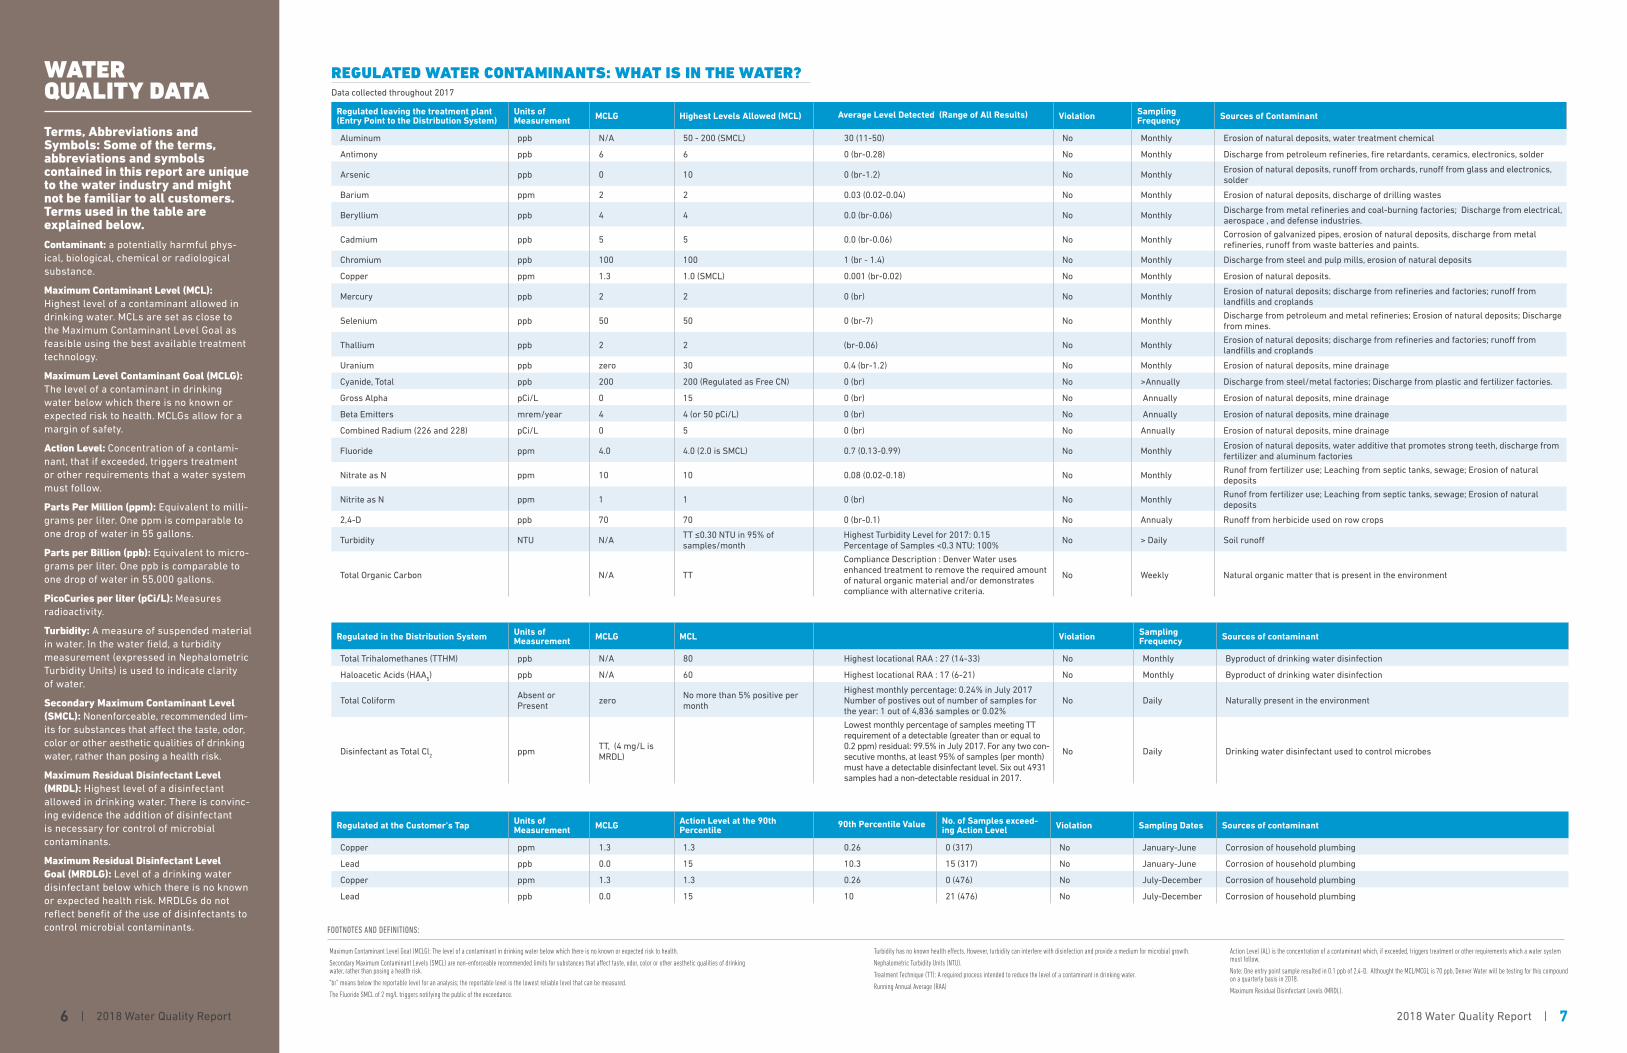
Regulated leaving the treatment plant (Entry Point to the Distribution System)
Units of Measurement MCLG Highest Levels Allowed (MCL) Average Level Detected (Range of All Results) Violation Sampling
Frequency Sources of Contaminant
Aluminum ppb N/A 50 - 200 (SMCL) 30 (11-50) No Monthly Erosion of natural deposits, water treatment chemical
Antimony ppb 6 6 0 (br-0.28) No Monthly Discharge from petroleum refineries, fire retardants, ceramics, electronics, solder
Arsenic ppb 0 10 0 (br-1.2) No MonthlyErosion of natural deposits, runoff from orchards, runoff from glass and electronics, solder
Barium ppm 2 2 0.03 (0.02-0.04) No Monthly Erosion of natural deposits, discharge of drilling wastes
Beryllium ppb 4 4 0.0 (br-0.06) No MonthlyDischarge from metal refineries and coal-burning factories; Discharge from electrical, aerospace , and defense industries.
Cadmium ppb 5 5 0.0 (br-0.06) No MonthlyCorrosion of galvanized pipes, erosion of natural deposits, discharge from metal refineries, runoff from waste batteries and paints.
Chromium ppb 100 100 1 (br - 1.4) No Monthly Discharge from steel and pulp mills, erosion of natural deposits
Copper ppm 1.3 1.0 (SMCL) 0.001 (br-0.02) No Monthly Erosion of natural deposits.
Mercury ppb 2 2 0 (br) No MonthlyErosion of natural deposits; discharge from refineries and factories; runoff from landfills and croplands
Selenium ppb 50 50 0 (br-7) No Monthly Discharge from petroleum and metal refineries; Erosion of natural deposits; Discharge from mines.
Thallium ppb 2 2 (br-0.06) No MonthlyErosion of natural deposits; discharge from refineries and factories; runoff from landfills and croplands
Uranium ppb zero 30 0.4 (br-1.2) No Monthly Erosion of natural deposits, mine drainage
Cyanide, Total ppb 200 200 (Regulated as Free CN) 0 (br) No >Annually Discharge from steel/metal factories; Discharge from plastic and fertilizer factories.
Gross Alpha pCi/L 0 15 0 (br) No Annually Erosion of natural deposits, mine drainage
Beta Emitters mrem/year 4 4 (or 50 pCi/L) 0 (br) No Annually Erosion of natural deposits, mine drainage
Combined Radium (226 and 228) pCi/L 0 5 0 (br) No Annually Erosion of natural deposits, mine drainage
Fluoride ppm 4.0 4.0 (2.0 is SMCL) 0.7 (0.13-0.99) No MonthlyErosion of natural deposits, water additive that promotes strong teeth, discharge from fertilizer and aluminum factories
Nitrate as N ppm 10 10 0.08 (0.02-0.18) No MonthlyRunof from fertilizer use; Leaching from septic tanks, sewage; Erosion of natural deposits
Nitrite as N ppm 1 1 0 (br) No Monthly Runof from fertilizer use; Leaching from septic tanks, sewage; Erosion of natural deposits
2,4-D ppb 70 70 0 (br-0.1) No Annualy Runoff from herbicide used on row crops
Turbidity NTU N/ATT ≤0.30 NTU in 95% of samples/month
Highest Turbidity Level for 2017: 0.15Percentage of Samples <0.3 NTU: 100%
No > Daily Soil runoff
Total Organic Carbon N/A TT
Compliance Description : Denver Water uses enhanced treatment to remove the required amount of natural organic material and/or demonstrates compliance with alternative criteria.
No Weekly Natural organic matter that is present in the environment
Regulated in the Distribution System Units of Measurement MCLG MCL Violation Sampling
Frequency Sources of contaminant
Total Trihalomethanes (TTHM) ppb N/A 80 Highest locational RAA : 27 (14-33) No Monthly Byproduct of drinking water disinfection
Haloacetic Acids (HAA5) ppb N/A 60 Highest locational RAA : 17 (6-21) No Monthly Byproduct of drinking water disinfection
Total Coliform Absent or Present
zeroNo more than 5% positive per month
Highest monthly percentage: 0.24% in July 2017 Number of postives out of number of samples for the year: 1 out of 4,836 samples or 0.02%
No Daily Naturally present in the environment
Disinfectant as Total Cl2 ppm
TT, (4 mg/L is MRDL)
Lowest monthly percentage of samples meeting TT requirement of a detectable (greater than or equal to 0.2 ppm) residual: 99.5% in July 2017. For any two con-secutive months, at least 95% of samples (per month) must have a detectable disinfectant level. Six out 4931 samples had a non-detectable residual in 2017.
No Daily Drinking water disinfectant used to control microbes
Regulated at the Customer's Tap Units of Measurement MCLG Action Level at the 90th
Percentile 90th Percentile Value No. of Samples exceed-
ing Action Level Violation Sampling Dates Sources of contaminant
Copper ppm 1.3 1.3 0.26 0 (317) No January-June Corrosion of household plumbing
Lead ppb 0.0 15 10.3 15 (317) No January-June Corrosion of household plumbing
Copper ppm 1.3 1.3 0.26 0 (476) No July-December Corrosion of household plumbing
Lead ppb 0.0 15 10 21 (476) No July-December Corrosion of household plumbing
Maximum Contaminant Level Goal (MCLG): The level of a contaminant in drinking water below which there is no known or expected risk to health.
Secondary Maximum Contaminant Levels (SMCL) are non-enforceable recommended limits for substances that affect taste, odor, color or other aesthetic qualities of drinking water, rather than posing a health risk.
“br” means below the reportable level for an analysis; the reportable level is the lowest reliable level that can be measured.
The Fluoride SMCL of 2 mg/L triggers notifying the public of the exceedance.
REGULATED WATER CONTAMINANTS: WHAT IS IN THE WATER?Data collected throughout 2017
FOOTNOTES AND DEFINITIONS:
WATER QUALITY DATA
Terms, Abbreviations and Symbols: Some of the terms, abbreviations and symbols contained in this report are unique to the water industry and might not be familiar to all customers. Terms used in the table are explained below.Contaminant: a potentially harmful phys-ical, biological, chemical or radiological substance.
Maximum Contaminant Level (MCL): Highest level of a contaminant allowed in drinking water. MCLs are set as close to the Maximum Contaminant Level Goal as feasible using the best available treatment technology.
Maximum Level Contaminant Goal (MCLG): The level of a contaminant in drinking water below which there is no known or expected risk to health. MCLGs allow for a margin of safety.
Action Level: Concentration of a contami-nant, that if exceeded, triggers treatment or other requirements that a water system must follow.
Parts Per Million (ppm): Equivalent to milli-grams per liter. One ppm is comparable to one drop of water in 55 gallons.
Parts per Billion (ppb): Equivalent to micro-grams per liter. One ppb is comparable to one drop of water in 55,000 gallons.
PicoCuries per liter (pCi/L): Measures radioactivity.
Turbidity: A measure of suspended material in water. In the water field, a turbidity measurement (expressed in Nephalometric Turbidity Units) is used to indicate clarity of water.
Secondary Maximum Contaminant Level (SMCL): Nonenforceable, recommended lim-its for substances that affect the taste, odor, color or other aesthetic qualities of drinking water, rather than posing a health risk.
Maximum Residual Disinfectant Level (MRDL): Highest level of a disinfectant allowed in drinking water. There is convinc-ing evidence the addition of disinfectant is necessary for control of microbial contaminants.
Maximum Residual Disinfectant Level Goal (MRDLG): Level of a drinking water disinfectant below which there is no known or expected health risk. MRDLGs do not reflect benefit of the use of disinfectants to control microbial contaminants.
Turbidity has no known health effects. However, turbidity can interfere with disinfection and provide a medium for microbial growth.
Nephalometric Turbidity Units (NTU).
Treatment Technique (TT): A required process intended to reduce the level of a contaminant in drinking water.
Running Annual Average (RAA)
Action Level (AL) is the concentration of a contaminant which, if exceeded, triggers treatment or other requirements which a water system must follow.
Note: One entry point sample resulted in 0.1 ppb of 2,4-D. Althought the MCL/MCGL is 70 ppb, Denver Water will be testing for this compound on a quarterly basis in 2018.
Maximum Residual Disinfectant Levels (MRDL).
2018 Water Quality Report | 7 6 | 2018 Water Quality Report

1600 West 12th Avenue, Denver, CO 80204-3412
303-893-2444
—
For more information on water quality, including opportunities
for public participation, visit denverwater.org.
@DenverWater @Denver_Water facebook.com/DenverWater youtube.com/YourDenverWater denverwaterTAP.org
Denver Water’s Public Water System Identification: CO0116001