2018 payment - verizon enterprise · 2020-01-08 · we explain how to structure compliance program...
TRANSCRIPT

2018 Payment Security Report
Network securityControl
environment
Control design
Control risk
Controlrobustness
Controlresilience
Control lifecycle management
Performance management
Maturity measurement
Self-assessment
Configurationstandards
Cardholderdata protection
Secure datatransmission
Malicioussoftware
Securesystems
Access control
Authentication
Physical security
Monitoring
Security testing
Security management
The 9 Factors The 12 Requirements
Executive summaryThe key theme of this edition of the Payment Security Report is improving visibility, control, and compliance program performance and maturity. The report highlights the importance of building performance measurement into the compliance program and provides expert recommendations on how to structure compliance program management for effective data protection.
Verizon payment security report history
PARTNERS
INSIDERS
INTRUSION
RISKCARDHOLDER DATA
BREACHESVALIDATION
COMPLIANCESECURITY
VERIZON 2010 PAYMENT CARD INDUSTRY COMPLIANCE REPORTA study conducted by the Verizon PCI and RISK Intelligence teams.
2010: Complexity and uncertaintyAn exploration of the complexity of PCI Security, the growing pains of PCI compliance, and the need to evolve toward a process-driven approach for compliance.
VERIZON 2011 PAYMENT CARDINDUSTRY COMPLIANCE REPORTA Study Conducted By The Verizon PCI And RISK Intelligence Teams
2011: Dealing with evolutionA review of the changing compliance requirements with insights into the importance of sound decision-making, and how organizations can position themselves for success.
Verizon 2014 PCI Compliance ReportHighlights from our in-depth research into the current state of PCI Security compliance.
In 2013, 64.4% of organizations failed to restrict each account with access to cardholder data to just one user — limiting traceability andincreasing risk. (Requirement 8)
Executive Summary 2014: Simplifying complexityA review of the value of compliance and the impact of PCI DSS changes, the need for sustainability, how to improve scope reduction and compliance program management.
In 2014, two-thirds of organizations did not adequately test the security of all in-scope systems.
Verizon 2015PCI COMPLIANCE REPORTInsight for helping businesses manage risk through payment security.
2015: Achieving sustainabilityA focus on improving the sustainability of compliance, a review of the state of scope reduction, payment security innovation and the need to avoid over-reliance on technology.
1
Payment Security ReportInsight for helping businesses manage risk through payment security.
Verizon 2016
Payment Security ReportVerizon 2016
I
?
2016: Developing proficiencyDeveloping data protection proficiency, the necessary skills and experience, and applying a structured approach to compliance management.
2017 Payment Security ReportRevealing the challenges in sustaining payment card security
2017: Establishing internal controlThe importance of establishing and maintaining an internal control environment and a holistic approach, including security control lifecycle management.
Figure 1. Timeline of previous Verizon payment security reports
This edition includes Verizon’s 9 Factors of Control Effectiveness and Sustainability (the 9 Factors) to help you focus on the key success factors of a corporate security management program.
Lack of sustainable control environments remains a top contributor and precursor to ineffective controls, which in turn become susceptible to data breaches. Organizations achieve sustainable PCI Security compliance when they demonstrate a consistent capability to maintain ongoing operation of all required security controls within their compliance environment. This enables them to prevent or minimize any future deviation from the required standard of performance.
Organizations achieve sustainability by design; i.e., by building sustainability into the functional, operational specifications of the compliance program and reinforcing it through frequent education, training and awareness campaigns. In this report, we explain how to structure compliance program management for effective data protection—with the 9 Factors.
Full compliance with PCI DSS at interim validation increased between 2011 and 2016, going up almost five-fold. In 2017, we knew that this positive trend was declining when only 52.5% of organizations—compared with 55.4% in 2016—maintained full compliance. At a regional level, only 39.7% of organizations in the Americas maintained full compliance, compared to 46.4% in Europe and 77.8% in the Asia Pacific region.
In 2017, the percentage of controls that were not in place (the control gap) increased, which resulted in more companies failing their interim assessment. Many of the security controls that were missing cover fundamental security principles that have broad applicability. Their absence could be material to the likelihood of an organization suffering a data breach. Indeed, no organization affected by payment card data breaches was found to be in full compliance with the PCI DSS during a subsequent Verizon PCI forensic investigator (PFI) inquiry.
This report delves into the detail of payment security and PCI DSS compliance and analyzes compliance patterns and control failures from global, regional and industry perspectives. It’s the only major industry publication based on data from real compliance validation assessments.
The inclusion of insights from our Data Breach Investigations Report (DBIR) specific to companies that have suffered from payment card data breaches makes this report a unique resource for compliance professionals.
Verizon thanks our first guest co-author, Andi Baritchi, Director, KPMG Cyber Security Services, for his valuable insight and writing the data breach correlation section (see page 44).
Research report
1
What is PCI DSS?
The Payment Card Industry Data Security Standard (PCI DSS) was established by the leading card brands to help businesses that take card payments reduce fraud. While it’s focused on protecting card data, it’s built on solid security principles that apply to all types of data. It covers vital topics such as retention policies, encryption, physical security, authentication and access control.
Find out more: pcisecuritystandards.org
Attitudes toward compliance
Based on our field observations and industry survey:1
• Two thirds (67%) of organizations approach and manage their PCI DSS compliance as an ongoing program with a formal structure, defined objectives, scope and supporting projects
• One third (33%) of organizations are still treating PCI Security compliance as an annual project
• Just under one in five (18%) of organizations attempt to manage PCI Security without a defined compliance program or project structures in place
• Nearly three quarters of organizations (70%) followed a phased approach with incremental deployment of PCI Security across their organization
1. Verizon global PCI customer survey, 2018
Contents
The compliance landscape 2018 ......................................2
Recommendations for control effectiveness and sustainability ......................................................................... 3
9 Factors of Control Effectiveness and Sustainability 41. Control environment ................................................................................52. Control design ........................................................................................... 83. Control risk ..................................................................................................114. Control robustness .................................................................................145. Control resilience ....................................................................................166. Control lifecycle management ..........................................................177. Performance management .................................................................188. Maturity measurement ........................................................................209. Self-assessment .....................................................................................22
The state of PCI DSS compliance .................................24Overview .......................................................................................................... 241. Maintain a firewall configuration .....................................................282. Do not use vendor-supplied defaults ...........................................293. Protect stored cardholder data ..................................................... 304. Protect data in transit ...........................................................................315. Protect against malicious software...............................................326. Develop and maintain secure systems ........................................337. Restrict access........................................................................................348. Authenticate access .............................................................................359. Control physical access ......................................................................3610. Track and monitor access .................................................................3711. Test security systems and processes .........................................3812. Security management ..........................................................................39Bottom 20 lists .............................................................................................. 40
Appendices ...........................................................................41A: Maturity models and improving the control environment ....41B: Control dependency .............................................................................43C: On downed planes and data breaches .......................................44D: PCI DSS compliance calendar .........................................................46E: Methodology .............................................................................................48
Verizon security professional services ........................49

Research report
2
The compliance landscape 2018The PCI DSS has seen little fundamental change since its launch in 2004. The original version established today’s familiar 12 Requirements and 6 domains. Through updates, including v2.0 (2010) and v3.0 (2013), the same basic framework of controls has remained with little deviation.
The biggest change with the release of v3.0 was in the reporting requirements: the Security Standards Council (SSC) introduced a strict reporting template mandating the way assessors present assessment findings. The latest update to the PCI DSS took place when the Council released v3.2.1 of the standard in May of 2018.
Over the lifecycle of PCI DSS v3.x, the changes introduced by the PCI SSC clearly responded to security threats. For example: v3.1 was released in April 2015 in response to vulnerabilities impacting SSL and early versions of TLS2 that are consistent with the guidance published by the National Institute of Standards and Technology (NIST) advising organizations to migrate to the more secure protocols TLS 1.1 or higher.3 Further, recent data breach trends resulted in stricter requirements surrounding POS security as well as the requirement for multi-factor authentication (MFA) use with administrative access to the CDE, in addition to remote access. The ability of the standard to remain relevant and beneficial is dependent on continued adaptation in response to ever-changing threats in the prevailing risk landscape.
Almost half (49%) of organizations worldwide were leveraging PCI DSS compliance efforts to meet other security requirements.4
The PCI DSS has established itself as a proven and time-tested framework for payment security with benefits for organizations that extend beyond the protection of payment data. A survey of Verizon’s PCI customers found that almost half (49%) were leveraging PCI DSS compliance efforts to meet other security requirements of data protection regulations, such as the European Union (EU) General Data Protection Regulation (GDPR).
2. itgovernance.co.uk/pci_dss/pci-dss-v3-0-update-changes-explained3. nist.gov/news-events/news/2014/04/nist-revises-guide-use-transport-layer-security-tls-networks4. Verizon global PCI customer survey, 20185. eur-lex.europa.eu/legal-content/EN/TXT/PDF/?uri=CELEX:32016R0679&from=EN6. ec.europa.eu/commission/priorities/justice-and-fundamental-rights/data-protection/2018-reform-eu-data-protection-rules_en7. ico.org.uk/for-organisations/guide-to-the-general-data-protection-regulation-gdpr/security/
General Data Protection RegulationThe GDPR5 came into force in May 2018. It regulates the processing of personal data related to individuals residing in the EU6 by an individual, company or organization. The GDPR is applicable globally, wherever data related to an EU citizen is processed, making the impact of the regulation far-reaching. It is an extensive regulation defining the reasons why and where data may be processed, as well as the protections that must be applied. The GDPR covers individual rights, including privacy, the right to be forgotten and portability. Also addressed are governance and accountability rules for organizations, with time-bound reporting requirements for data breaches.
Data security represents only a small component of the GDPR, and the regulation doesn’t specifically define security controls for compliance; rather, it states that personal data shall be “processed in a manner that ensures appropriate security of the personal data, including protection against unauthorised or unlawful processing and against accidental loss, destruction or damage using appropriate technical or organisational measures” [Article 5(1)(f)].7
Under local data protection laws that preceded GDPR, some regulators have issued undertakings on breached organizations mandating PCI DSS compliance as part of the enforcement action. Again, it should be noted that the scope of data covered by the GDPR extends far beyond payment card data as defined by the PCI DSS.
The GDPR adopts a risk-based approach for organizations to define the controls required to provide adequate protection of data covered by the regulation. Many of the data components requiring protection under PCI DSS are also defined as personal data by the GDPR, and the controls prescribed in the PCI DSS can be applied to systems and environments involved in processing all types of personal or confidential data.
Research report
3
Recommendations for control effectiveness and sustainabilityWhat and how performance is measured are inextricably linked in any security program.
Sustainable controls are extremely relevant to payment security. They can only be achieved in an environment that is measured and monitored for performance and that identifies weaknesses as they develop. To function well, payment systems need to be regularly maintained with reliable and measurable performance standards.
“…measurements are all-important in the planning process,” wrote the renowned business management guru, Peter F. Drucker, over 40 years ago. “…what we measure and how we measure determine what will be considered relevant, and determine thereby not just what we see, but what we—and others—do…”8
Peter F. Drucker understood the necessity of measuring performance in business to improve productivity, enhance ecosystem relationships, and predict future needs and concerns. Drucker’s insights are highly relevant to payment security: How often and thoroughly you measure is highly relevant to the effectiveness of your payment security plan. Drucker knew that a business is less likely to thrive or even tread water without reliable performance measurement.
The risk of a “crash” is greater if the aerodynamics of your payment system isn’t streamlined to support the mothership. The risks rise in direct proportion to the extent that you do or don’t measure and implement a supportive environment. The degree to which you create an optimal environment is directly proportional to the likelihood of a breach. That’s why Verizon has dedicated this report to the critical importance of measuring performance and control effectiveness.
This report emphasizes the value of the what and how of measuring performance and control effectiveness, and explores integrating the following recommendations into an organization’s compliance program to improve sustainability.
8. Peter F. Drucker, “Management: Tasks, Responsibilities, Practices,” 1973, reproduced with the permission from the Drucker 1996 Literary Works Trust
C Consider how not all measurements will be quantifiable as strict metrics; some are about evaluating evidence in relation to determining increase or decrease in control performance and control risk.
R Review the role of performance management structures to support continuous monitoring and the development of metrics to drive desired behaviors or outcomes.
I Implement the 9 Factors of Control Effectiveness and Sustainability, a monitoring program for control effectiveness that incorporates metrics.
T Test controls throughout the operational lifecycle for their robustness to remain effective; maintaining consistent performance in an inevitably changing environment.
E Elevate control design within operational processes and the control environment to quantify control risk; exploring the dependency on other controls to counteract any weaknesses.
R Review and respond to any anomalies or negative trends, including insights into the struggle to develop effective controls within a sustainable control environment.
I Include control performance metrics within business continuity and incident response planning for measuring the resilience of controls; considering possible challenges associated with defining metrics for control resilience in business as usual (BAU) operation.
A Assess organizational culture on control environments, monitoring security awareness and increasing employee engagement.

Research report
4
9 Factors of Control Effectiveness and Sustainability
Today’s increasingly complex ecosystems—with evolving mobile technology, IoT, FinTech, blockchain, and the cloud—make measuring the weakest points in compliance practices an additional priority.
About 70 years ago, Abraham Wald, a Hungarian mathematician and the founder of statistical sequential analysis, solved a serious military problem when he addressed the weakest points in World War II fighter aircraft defenses. A member of the Applied Mathematics Panel at Columbia University in Manhattan—a division of the National Defense Research Committee—he was assigned to analyze war-related statistical challenges. His most famous assignment occurred when the United States Air Force asked him to determine how much armor could be added to reinforce the sections of the fighter aircraft that incurred the heaviest damage from enemy fire. Reinforcing the entire plane’s armor would add too much weight, compromising maneuverability.
Wald’s analysis resulted in surprising conclusions. The military hadn’t considered downed aircraft in their assessment. Their investigation only included planes that survived their missions and returned home safely, he pointed out. The sections of the planes with the greatest damage actually were the least vulnerable, his analysis concluded. Wald focused on areas of the planes with the least amount of damage and advised placing extra armor there—on the engines.
Full compliance may sometimes seem impractical or too high a bar to achieve. As the story of Abraham Wald shows, a top priority should be assessing and addressing the most vulnerable areas in a payment security system and reinforcing those concerns. Once the “engine” is better protected, the chances of a nosedive are significantly diminished.
Verizon’s 9 Factors of Control Effectiveness and Sustainability are critical not only to vet out the weakest points in your security system but also to position you with the greatest confidence and maneuverability when facing evolving challenges. For additional insights into the statistical analysis performed by Abraham Wald and how it relates to your data security, see Appendix C written by Andi Baritchi, Director, KPMG Cyber Security Services.
The 9 Factors of Control Effectiveness and Sustainability
Figure 2. A relational model of the 9 Factors. Factor 1 is the core from which the other factors emanate. After achieving the objectives of the earlier factors, the final outcome, Factor 9, is the ability to self-assess, the output of which can then be used to improve all the factors.
1. Control environment ............................................................................... 52. Control design ...........................................................................................83. Control risk ................................................................................................. 114. Control robustness ................................................................................ 145. Control resilience ................................................................................... 166. Control lifecycle management ..........................................................177. Performance management ................................................................ 188. Maturity measurement .......................................................................209. Self-assessment .................................................................................... 22
27 3
45
6
8
1
9
Controldesign
Maturity measurement
Performance management
Control risk
Controllifecycle
management
Control resilience
Controlrobustness
Self-assessment
Controlenvironment
Research report
5
Factor 1
Control environmentA control environment is created through the culture of an organization and is defined by and enforced through the values, priorities and management styles of the business. It includes the standards, processes and organizational framework from which internal controls are implemented and operated. The control environment reflects the organization’s values, and the atmosphere in which people conduct their activities and carry out control responsibilities.
In payment card data protection, a control environment with a defined internal control framework contributes to risk mitigation and provides guidance on controls to address card security risks. Management is responsible for creating a security-conscious control environment throughout the culture to promote the protection of payment card data.
An effective control environment is defined as “an environment in which competent people understand their responsibilities, the limits of their authority, and are knowledgeable, mindful and committed to doing what is right and doing it the right way. Employees in this environment are committed to following an organization’s policies and procedures, and its ethical and behavioral standards.”9
9. Sanjay Anand in his book titled “Sarbanes-Oxley Guide for Finance and Information Technology Professionals,” John Wiley & Sons, Inc., 2006.
Achieving sustainable control environments
Control failures do not happen in isolation within the environment—they often occur because the environment contributes toward control weaknesses or introduces control exposure. Payment card security environments are not immune to chain reactions of consequences from deficiencies in the control environment that eventually result in control failures. While most PCI DSS control failures are detectable and avoidable, poor management of the control environment and control deficiencies can unnecessarily perpetuate these types of issues.
Benefits of incorporating control environment reviews into PCI DSS compliance programs
Many organizations are overly reliant on external validation assessments performed by Qualified Security Assessors (QSAs) for payment card data protection and compliance. They need to instead develop a program of internal reviews (Factor 9—self-assessments) because reliance on an annual review leaves organizations exposed to weaknesses, as controls fail to adapt to changes in the control environment. Internal reviews indicate a value on measurement, which then become integrated into the mindset of the culture.
The PCI DSS provides a control framework for cardholder data security that is often integrated into, or used in conjunction with, other industry frameworks for broader application and more comprehensive data protection.
More than 80% of respondents use another industry standard framework to structure their data protection and compliance programs. About two-thirds use ISO 27001, one third use NIST 800 and GDPR, and less than one quarter follow CobIT. A few organizations indicated they also use frameworks such as CIS Critical Controls, HIPAA, SOX, Swift and various government-specific regulatory frameworks—in addition to PCI Security. None indicated that they follow the COSO framework.
Research report
6
Elevating PCI DSS security compliance programs toward higher maturity
The PCI DSS evaluates aspects of the control environment, such as: policies, user training and awareness, risk assessment and network security. However, the PCI DSS does not directly address organizations’ capability for assessing data protection governance, oversight, and commitment toward competence. Organizations need to take self-ownership of their responsibility to develop data protection governance capabilities.
Most organizations should optimize their overall control environments and can start by answering questions, such as:
• How well is your control environment defined and documented to support you in understanding its impact on control performance, and to help you manage and improve it?
• Is your control environment supporting or detracting from achieving sustainability and continuous improvement of your PCI compliance program?
• How confident are you in understanding the relevance between your control environment and the performance of your data protection program?
• Do you have an enterprise-wise internal control program based on an independent structure with a clear responsibility matrix, such as the Responsible, Accountable, Consulted and Informed (RACI) matrix?
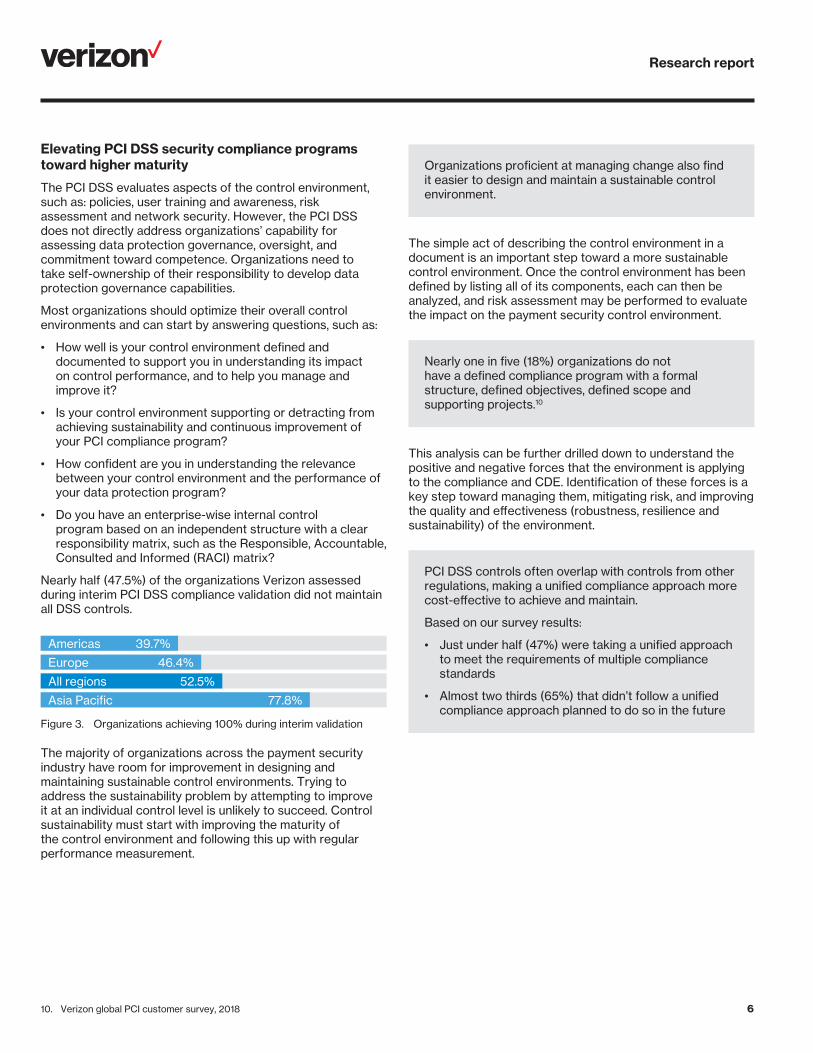
Nearly half (47.5%) of the organizations Verizon assessed during interim PCI DSS compliance validation did not maintain all DSS controls.
Figure 3. Organizations achieving 100% during interim validation
The majority of organizations across the payment security industry have room for improvement in designing and maintaining sustainable control environments. Trying to address the sustainability problem by attempting to improve it at an individual control level is unlikely to succeed. Control sustainability must start with improving the maturity of the control environment and following this up with regular performance measurement.
10. Verizon global PCI customer survey, 2018
Organizations proficient at managing change also find it easier to design and maintain a sustainable control environment.
The simple act of describing the control environment in a document is an important step toward a more sustainable control environment. Once the control environment has been defined by listing all of its components, each can then be analyzed, and risk assessment may be performed to evaluate the impact on the payment security control environment.
Nearly one in five (18%) organizations do not have a defined compliance program with a formal structure, defined objectives, defined scope and supporting projects.10
This analysis can be further drilled down to understand the positive and negative forces that the environment is applying to the compliance and CDE. Identification of these forces is a key step toward managing them, mitigating risk, and improving the quality and effectiveness (robustness, resilience and sustainability) of the environment.
PCI DSS controls often overlap with controls from other regulations, making a unified compliance approach more cost-effective to achieve and maintain.
Based on our survey results:
• Just under half (47%) were taking a unified approach to meet the requirements of multiple compliance standards
• Almost two thirds (65%) that didn’t follow a unified compliance approach planned to do so in the future
All regions
Asia Pacific
Europe
52.5%
39.7%
46.4%
77.8%
Americas
Research report
7
Top-down versus bottom-up approach to PCI compliance program management
The control environment is also influenced by how an organization approaches the planning, development, deployment and monitoring of their compliance programs. Different approaches exist as to how an organization with multiple entities (offices, geographic locations, business units) can approach the management of a compliance program; mainly top-down versus bottom-up.
Most of the organizations in our survey (69%) follow a top-down approach to compliance management. Executive support and organizational culture are critical components of the control environment.
Top-down approachOrganizations that have geographically distributed environments need to carefully consider their approach to compliance program management. One option is a top-down approach that usually includes centralized initiation of the compliance program with a high degree of organization-wide control from headquarters. The PCI compliance program and strategy are defined and enforced by headquarters. The organization may follow a stepwise design to deploy the program across the enterprise to gain insight into its compositional sub-elements. Authority is disseminated to lower levels in the hierarchy, which are to a greater or lesser extent bound by them, while still offering efficiency and oversight. However, this approach may result in slower decision-making in some cases. Reforms may be perceived as imposed “from above.” Managers of business units may sometimes view top-down direction and control as losing respect and authority, and it can be difficult for lower levels to accept that approach.
Bottom-up approachA functional business unit adopts a strategic, operational, or technical management plan to outline, develop and execute data protection initiatives without significant involvement from headquarters/group executive management. They usually follow an incremental change approach that represents an emergent process cultivated and upheld primarily by frontline workers and individual business units. This strategy often resembles a “seed” model, in which the beginnings are small but will eventually grow in complexity and thoroughness. This direction can be especially helpful for organizations that need immediate security attention. Upper management is still informed about progress and decisions made.
Commitment to competenceEnhanced commitment to competence should be integral to every stage of employee performance. Employees should be hired for their skills, knowledge and comprehensive understanding of the roles and responsibilities of the job. Maintaining internal controls are integral to job performance, as well as training, and hiring standards, and regular data protection and compliance performance evaluation.
OversightOversight groups positively influence an organization’s control environment through watchful supervision and care. Management (the board, senior leadership, executive management) must follow up on the authority the board delegates to staff to ensure consistent adherence to policies and procedures. In particular, the long-term sustainability of internal controls must be part of the board’s oversight responsibilities—to ensure that there are enough resources in the pipeline for continuous evaluation and improvement of the control environment.
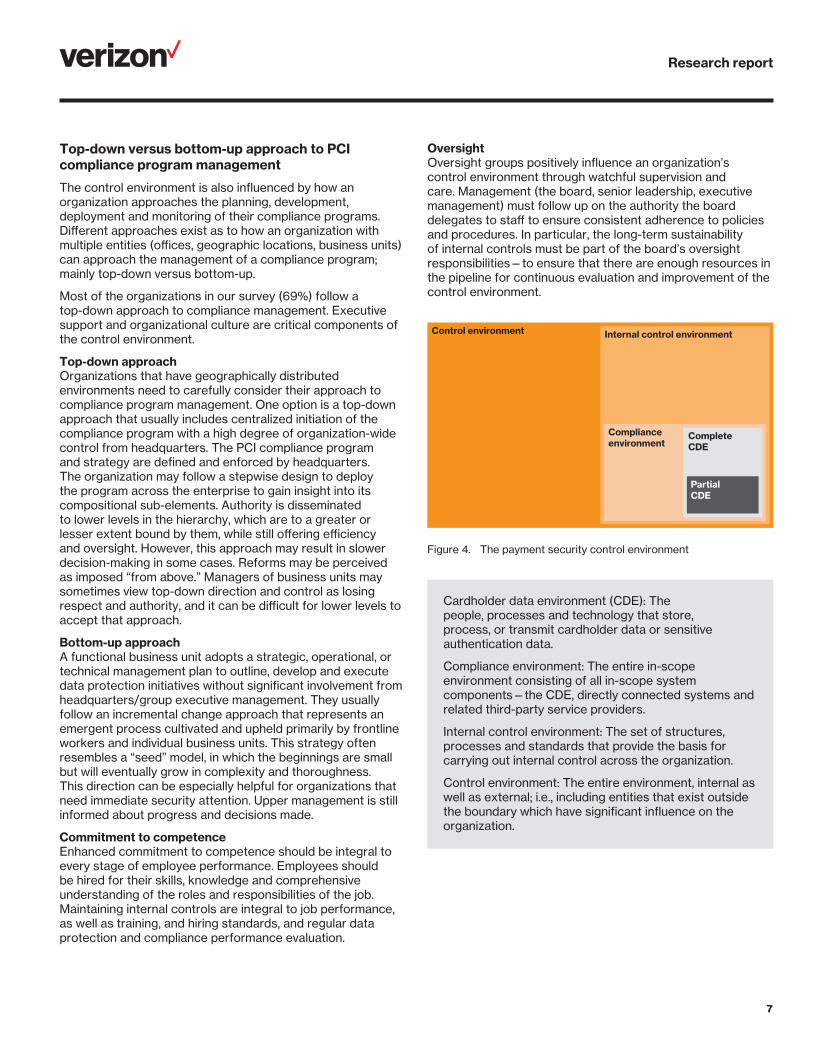
Control environment Internal control environment
Compliance environment
CompleteCDE
Partial CDE
Figure 4. The payment security control environment
Cardholder data environment (CDE): The people, processes and technology that store, process, or transmit cardholder data or sensitive authentication data.
Compliance environment: The entire in-scope environment consisting of all in-scope system components—the CDE, directly connected systems and related third-party service providers.
Internal control environment: The set of structures, processes and standards that provide the basis for carrying out internal control across the organization.
Control environment: The entire environment, internal as well as external; i.e., including entities that exist outside the boundary which have significant influence on the organization.

Research report
8
Factor 2
Control designDocumented control design is the process of systematically planning and specifying the purpose, function, scope, limitations and dependencies of a security control. This is done in accordance with its control environment to ensure that controls can operate effectively throughout the control lifecycle (see Factor 6, page 17). PCI Security controls are influenced by circumstances and their surrounding conditions, i.e., their environment, which impacts control performance. A systematic control design is therefore critical for managing control effectiveness and sustainability, and to achieve predictable control performance.
Control systems are multi-layered; some layers compensate for weaknesses in other layers, and these dependencies must be understood. A control design document is a useful tool that should include a description of the control in its effective state, as well as any business scenarios that could impact control effectiveness. Control designs reflect the requirements of an organization’s security policies and standards. Most importantly, the control in operation must be appropriately documented and described so that its effectiveness measurement can be validated.
Data protection programs rely on several internal control processes. Key processes should be designed with skill rather than allowing them to evolve and expecting deficiencies to be corrected over time. It requires a control design capability to architect the controls and the control environment that fits the needs of the process and organization.
To operate effectively, most DSS controls require customization specific to the organization’s control environments. Control implementation must take into account constraints that can limit effectiveness within the environment. It’s not prudent to assume that controls will be sustainable and meet control objectives without first carefully evaluating how their design meets operational requirements. Control environments differ substantially from one organization to the next, and implementing PCI DSS controls “out of the box” and expecting them to perform flawlessly usually isn’t effective and very likely isn’t sustainable unless the security controls include tailor-made documentation and specifications for operating within the specific environment.
Controls need to be designed in order to be effective within an organization’s control environment. The way controls are implemented should take into account business needs, technical requirements and technical or operational constraints. Not only does a poorly designed control risk failure to provide adequate security, it may limit effective operation of the organization.
11. “CISO Desk Reference Guide”, Volume 1. 2016. Reprinted with permission.
This method includes determining that the suitability of technology and supporting processes—and the capability, competence and commitment of the people behind them—are in place and can remain in place over appropriate technology lifespans to support the operation and continuous improvement of security controls and the control environment.
As repeatedly mentioned in previous reports, most DSS controls should meet requirements by design, not by luck. Control performance should be predictable by evaluating, comparing the results against a documented control specification, and correcting any deviations.
It’s important to examine and understand control design and operational constraints by recognizing the way that the effectiveness of a control is limited. Without this awareness, entire control systems can operate with unknown limitations that usually only become apparent when a control fails with noticeable consequences.
The CISO Desk Reference Guide cites crucial questions to ask when deploying PCI DSS controls: “What are the processes for implementing them? Are these security control processes documented and periodically reviewed? What are the procedures to mitigate risk identified by these processes? As you can see, controls are like children. They will need to be fed, monitored, cared for and, as they mature, updated to ensure they effectively provide value to the organization.”11
The control design document is the foundation for control risk assessment (see Factor 3, page 11). Many organizations neglect to design and test security controls before deployment. They assume that the system is secure if there is no evidence of design or operational issues once the control system goes live, i.e., “no news is good news.” Actually, no news is rather alarming! It often suggests that vital checks were not performed to detect problems or that issues found were not reported upward. What appears to be missing in organizations is not a lack of awareness of macro constraints, but an air of ignorance surrounding them. Some important questions to ask are:
• Can the people and technologies tasked with implementing and maintaining required security controls actually do so?
• Do they have the resources they need?
• Are there other demands placed on them that reduce their capacity and limit the efficacy of the control?
• Was the control designed in a way that ignores the day-to-day realities of an environment?
• Does the control consider how legacy software or hardware might behave?
• During a time of layoffs, has a control been designed to assume a full workforce?
• Was the control design drawn from best practice that assumes skill level and software or hardware upgrades that are not present in the entity’s actual environment?
Research report
9
Controls are not created equally
Organizations that demonstrate an inability to keep PCI DSS controls in place often lack insight into how control systems should be designed and beneficially function.
All controls are not created equally. They differ in many ways. Some controls (called “preventive” controls) treat the likelihood of risk to prevent threats and vulnerabilities from materializing, while others treat the consequences (called “mitigating” controls) when the controls act to reduce the negative consequences.
In our previous publication, the 2017 Payment Security Report, we discussed foundational security control concepts, including the concept of a “control system”—a suite of controls that contributes toward achievement of a particular control objective or represents the total effectiveness of a group of controls that act upon a particular risk.
It’s not sufficient for organizations to know the ability of controls to theoretically treat a risk. They must know the actual effectiveness in terms of consistent, complete, reliable and timely operation.
Whoever gets the job of reviewing control effectiveness should be looking at three key elements—maturity, competence and testing—to validate the actual achievement of the task. The importance of assessing control effectiveness during regular audits is obvious. Creating control design documentation in a structured manner can be time-consuming, although it’s useful for developing a standardized template that generates a control design profile for each required security control.
Control categories
Three types of controls are used to meet the needs of an organization, namely management, operational and technical.
Management controls
These are security controls that are strategic and suitable for planning and monitoring purposes. Examples include information assurance policy and information assurance risk management exercises.
Operational controls
These are used in day-to-day operations to ensure the secure execution of business activities. Examples include mechanisms or tools for IT support and operations, physical and environmental security controls, and information security incident-handling processes and procedures.
Technical controls
These are the possible technical and physical implementation of information assurance solutions and recommendations. Examples include access, security auditing, and monitoring and alerting.
Figure 5. Control types
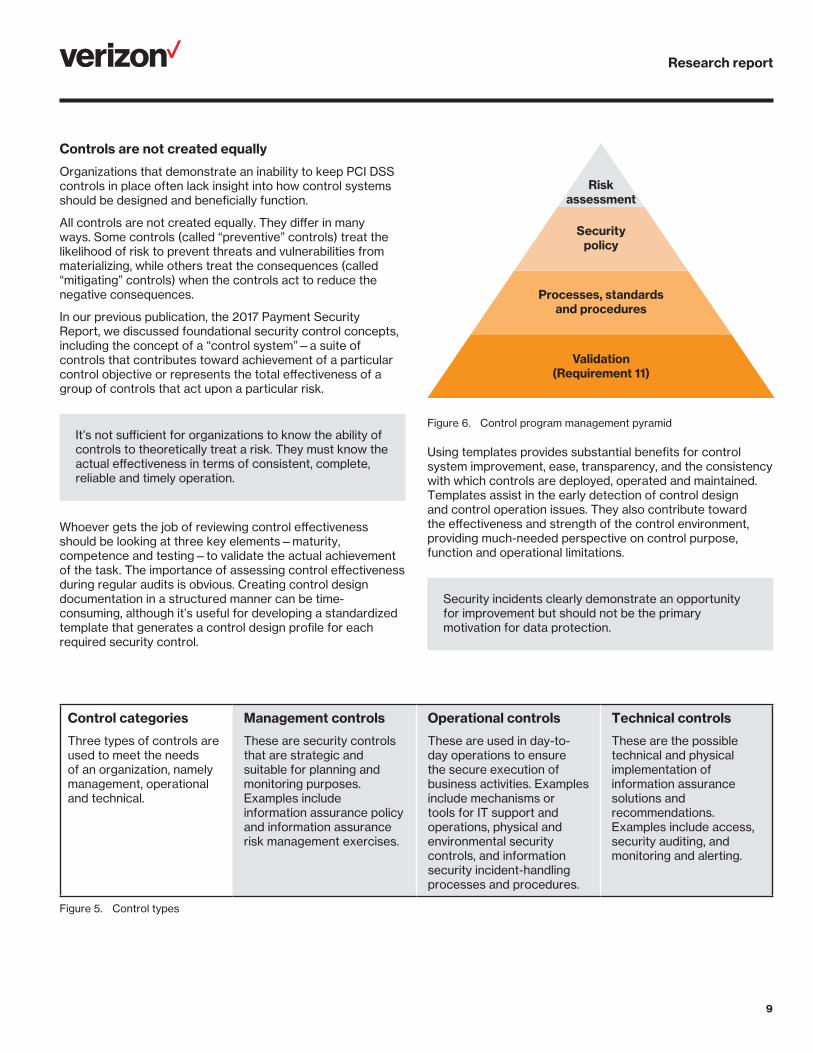
Risk assessment
Securitypolicy
Processes, standardsand procedures
Validation(Requirement 11)
Figure 6. Control program management pyramid
Using templates provides substantial benefits for control system improvement, ease, transparency, and the consistency with which controls are deployed, operated and maintained. Templates assist in the early detection of control design and control operation issues. They also contribute toward the effectiveness and strength of the control environment, providing much-needed perspective on control purpose, function and operational limitations.
Security incidents clearly demonstrate an opportunity for improvement but should not be the primary motivation for data protection.
Research report
10
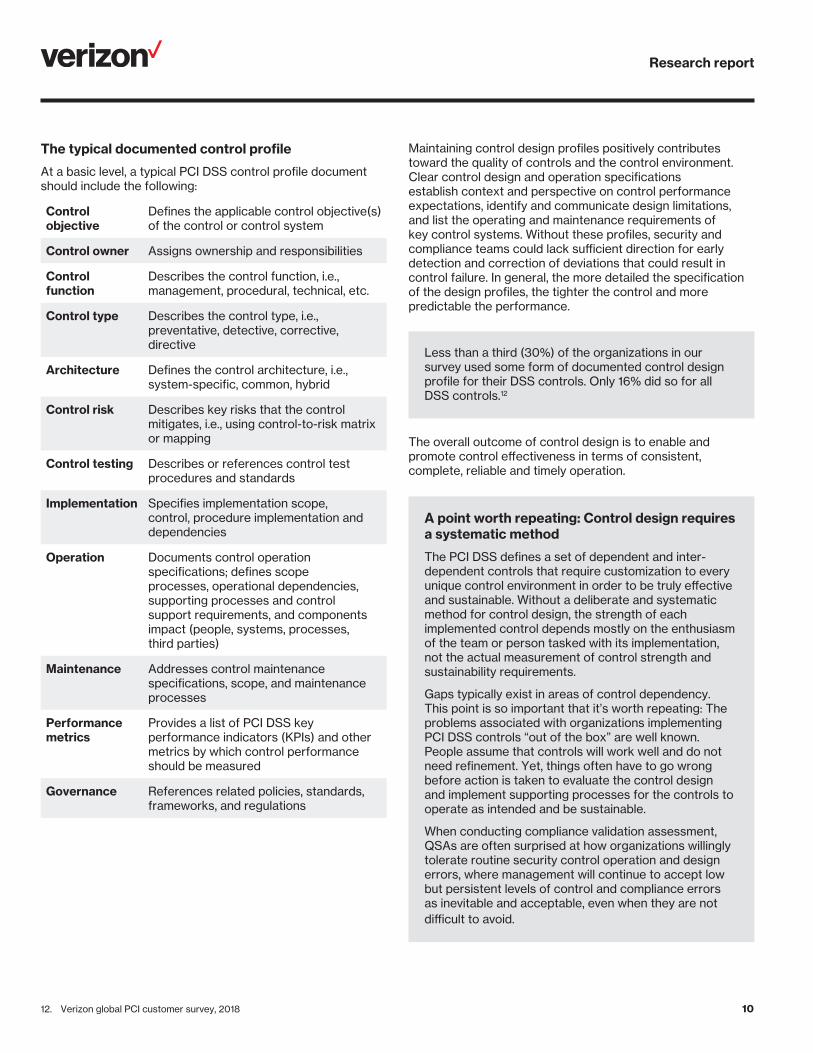
The typical documented control profile
At a basic level, a typical PCI DSS control profile document should include the following:
Control objective
Defines the applicable control objective(s) of the control or control system
Control owner Assigns ownership and responsibilities
Control function
Describes the control function, i.e., management, procedural, technical, etc.
Control type Describes the control type, i.e., preventative, detective, corrective, directive
Architecture Defines the control architecture, i.e., system-specific, common, hybrid
Control risk Describes key risks that the control mitigates, i.e., using control-to-risk matrix or mapping
Control testing Describes or references control test procedures and standards
Implementation Specifies implementation scope, control, procedure implementation and dependencies
Operation Documents control operation specifications; defines scope processes, operational dependencies, supporting processes and control support requirements, and components impact (people, systems, processes, third parties)
Maintenance Addresses control maintenance specifications, scope, and maintenance processes
Performance metrics
Provides a list of PCI DSS key performance indicators (KPIs) and other metrics by which control performance should be measured
Governance References related policies, standards, frameworks, and regulations
12. Verizon global PCI customer survey, 2018
Maintaining control design profiles positively contributes toward the quality of controls and the control environment. Clear control design and operation specifications establish context and perspective on control performance expectations, identify and communicate design limitations, and list the operating and maintenance requirements of key control systems. Without these profiles, security and compliance teams could lack sufficient direction for early detection and correction of deviations that could result in control failure. In general, the more detailed the specification of the design profiles, the tighter the control and more predictable the performance.
Less than a third (30%) of the organizations in our survey used some form of documented control design profile for their DSS controls. Only 16% did so for all DSS controls.12
The overall outcome of control design is to enable and promote control effectiveness in terms of consistent, complete, reliable and timely operation.
A point worth repeating: Control design requires a systematic method
The PCI DSS defines a set of dependent and inter-dependent controls that require customization to every unique control environment in order to be truly effective and sustainable. Without a deliberate and systematic method for control design, the strength of each implemented control depends mostly on the enthusiasm of the team or person tasked with its implementation, not the actual measurement of control strength and sustainability requirements.
Gaps typically exist in areas of control dependency. This point is so important that it’s worth repeating: The problems associated with organizations implementing PCI DSS controls “out of the box” are well known. People assume that controls will work well and do not need refinement. Yet, things often have to go wrong before action is taken to evaluate the control design and implement supporting processes for the controls to operate as intended and be sustainable.
When conducting compliance validation assessment, QSAs are often surprised at how organizations willingly tolerate routine security control operation and design errors, where management will continue to accept low but persistent levels of control and compliance errors as inevitable and acceptable, even when they are not difficult to avoid.
Research report
11
Factor 3
Control riskControl risk is the likelihood and impact of control failure due to the tendency of controls to lose their effectiveness over time. This loss can be a result of deficiencies in control design or operation failure, exposing the assets they were instituted to protect. Control risk is considered high when the assessed entity has poorly designed internal controls and ineffective management of its control environment; i.e., the risk that a company’s internal controls may fail and/or cannot detect a control failure.
Increased awareness about the importance of managing control risk is needed across the payment card industry since any control failure can severely handicap an organization’s ability to protect cardholder data. Managing control risks also helps to reduce audit and assessment risks, thereby improving assurance of compliance with PCI DSS requirements. While the measurement of control risk is not explicitly defined as a requirement in the PCI DSS, it’s mentioned in its information supplement: “Best Practices for Maintaining PCI DSS Compliance”13—an updated version of the information supplement is expected at the end of 2018.
Control failure taxonomy
Control risk can be affected by many elements. To effectively evaluate the source of the risk, it’s important to understand the factors that impact the functionality of a control.
Factors that affect the risk associated with a control include:14
• Known history of control deficiencies or errors
• The nature and probability of the risks that the control is intended to prevent, the frequency with which it operates, and the inherent risks associated with the control and related control system
• Changes that might adversely affect the design or operating effectiveness of the control
• The degree to which the control relies on the effectiveness of other controls (e.g., the control environment or general information technology controls)
• Competence of the personnel who perform the control or monitor its performance and current information on changes in key personnel
• Whether the control relies on performance that is manual or automated
13. pcisecuritystandards.org/documents/PCI_DSS_V3.0_Best_Practices_for_Maintaining_PCI_DSS_Compliance.pdf14. “Auditing Standard No. 5.” pcaobus.org/Standards/Auditing/Pages/Auditing_Standard_5.aspx15. resources.sei.cmu.edu/asset_files/TechnicalNote/2014_004_001_91026.pdf
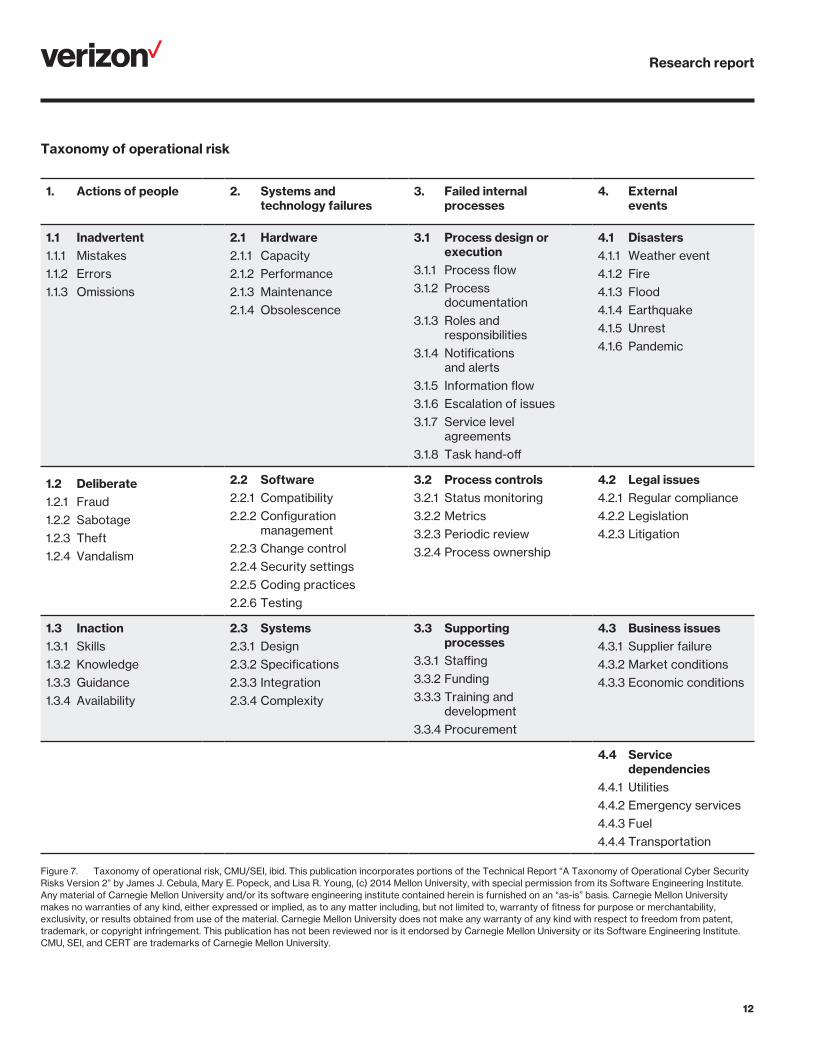
A very useful framework to evaluate potential operational control risks is “A Taxonomy of Operational Cyber Security Risks, Version 2” (James J. Cebula, Mary Popeck, Lisa R. Young, The Carnegie Mellon University, 2014):15
It lists four broad categories:
• Actions of people: Action, or lack of action, taken by people either deliberately or accidentally that impact cybersecurity
• Systems and technology failures: Failure of hardware, software and information systems
• Failed internal processes: Problems in internal business processes that impact the ability to implement, manage and sustain cybersecurity
• External events: Issues beyond the control of the company (disasters, legal issues and service provider dependencies)
Measuring control risk should not be difficult for organizations. What is needed is evidence to prove that the implemented DSS controls are part of an effective control system—a collection of related and dependent controls used to meet the required control objectives and prevent or uncover mistakes. Control sustainability depends on the quality of support from the control environment and a management team commitment to demonstrated competence, policies, and performance standards.
Guesswork should not be used when measuring control risk. Control risk must be adequately supported by evidence—facts gathered during the control evaluation procedures that provide a reasonable basis for forming an opinion on control systems and the control environment under assessment. This effort improves predictability and anticipation of control risks. Typical risk mitigation actions include a thorough inspection of the adequacy and effectiveness of the security control review process, evaluating the thoroughness with which organizations are assessing and monitoring control performance, and frequent re-evaluation of control design and operations.
Organizations should not forego these control risk evaluations. Control-systems management overrides should be minimal and applied with exceptional discretion. Otherwise ongoing arbitrary controls can override even the most well-designed control systems and be equivalent to “no control” regarding risk.
PCI DSS risk assessment evidence is subjective, notoriously under-scoped throughout the industry, and rarely includes the evaluation of control risk.
Research report
12
Taxonomy of operational risk
1. Actions of people 2. Systems and technology failures
3. Failed internal processes
4. External events
1.1 Inadvertent1.1.1 Mistakes1.1.2 Errors1.1.3 Omissions
2.1 Hardware2.1.1 Capacity2.1.2 Performance2.1.3 Maintenance2.1.4 Obsolescence
3.1 Process design or execution
3.1.1 Process flow3.1.2 Process
documentation3.1.3 Roles and
responsibilities3.1.4 Notifications
and alerts3.1.5 Information flow3.1.6 Escalation of issues3.1.7 Service level
agreements3.1.8 Task hand-off
4.1 Disasters4.1.1 Weather event4.1.2 Fire4.1.3 Flood4.1.4 Earthquake4.1.5 Unrest4.1.6 Pandemic
1.2 Deliberate1.2.1 Fraud1.2.2 Sabotage1.2.3 Theft1.2.4 Vandalism
2.2 Software2.2.1 Compatibility2.2.2 Configuration
management2.2.3 Change control2.2.4 Security settings2.2.5 Coding practices2.2.6 Testing
3.2 Process controls3.2.1 Status monitoring3.2.2 Metrics3.2.3 Periodic review3.2.4 Process ownership
4.2 Legal issues4.2.1 Regular compliance4.2.2 Legislation4.2.3 Litigation
1.3 Inaction1.3.1 Skills1.3.2 Knowledge1.3.3 Guidance1.3.4 Availability
2.3 Systems2.3.1 Design2.3.2 Specifications2.3.3 Integration2.3.4 Complexity
3.3 Supporting processes
3.3.1 Staffing3.3.2 Funding3.3.3 Training and
development3.3.4 Procurement
4.3 Business issues4.3.1 Supplier failure4.3.2 Market conditions4.3.3 Economic conditions
4.4 Service dependencies
4.4.1 Utilities4.4.2 Emergency services4.4.3 Fuel4.4.4 Transportation
Figure 7. Taxonomy of operational risk, CMU/SEI, ibid. This publication incorporates portions of the Technical Report “A Taxonomy of Operational Cyber Security Risks Version 2” by James J. Cebula, Mary E. Popeck, and Lisa R. Young, (c) 2014 Mellon University, with special permission from its Software Engineering Institute. Any material of Carnegie Mellon University and/or its software engineering institute contained herein is furnished on an “as-is” basis. Carnegie Mellon University makes no warranties of any kind, either expressed or implied, as to any matter including, but not limited to, warranty of fitness for purpose or merchantability, exclusivity, or results obtained from use of the material. Carnegie Mellon University does not make any warranty of any kind with respect to freedom from patent, trademark, or copyright infringement. This publication has not been reviewed nor is it endorsed by Carnegie Mellon University or its Software Engineering Institute. CMU, SEI, and CERT are trademarks of Carnegie Mellon University.

Research report
13
Evaluating control risk
Once all critical controls are identified, present risk in the design and operation of each control can be evaluated by taking the following actions:
Identify riskIdentify potential internal and external risks to the DSS control, either in the design or operation for all involved people, processes and technologies.
Assess riskAssessment and timely reporting of control risk should be made mandatory for all critical PCI DSS controls.
Prioritize risk Select and prioritize the risks to be concentrated on through a risk management process. Focus on the significant few; put the insignificant many to one side and attend to them afterward.
Plan risk mitigationsDevelop a response plan. Once risks are identified, assess impact on the CDE, compliance environment and the overall control environment.
Manage riskManage the identified risk and correlated response plan: monitor whether the risk evolves into a threat or vulnerability that is exploited; take action if it does. Having a risk response plan reduces the impact if it occurs and improves response time, further reducing the impact.
It is the responsibility of management, and not of the auditors or assessors, to implement and manage an internal control system to prevent errors and deficiencies in security controls and control systems. Organizations may mistakenly be under the impression that external assessments address control risk.
For PCI DSS validation assessments, the mandate of QSAs is to make a binary assertion on compliance versus non-compliance measured against the requirements of the Standard.
There is not yet an explicit requirement to objectively determine the risk to security controls and cardholder data (CHD) beyond the requirements of the DSS.
16. Reproduced with the permission of Paladin Risk Management Services © 2018 paladinrisk.com.au/risk-tip-2-measure-control-effectiveness/
Which controls should be evaluated for control risk?
All security control systems should be included in a control risk evaluation. At minimum, all critical control systems (collections of DSS and supporting controls) should have a documented control design and associated control risk report. This includes all sub-requirements in addition to the PCI DSS base controls. Each organization’s implemented controls for applicable DSS requirements work together to form a baseline set of controls—even when compensating controls are implemented within the assessed environment. These controls become part of the compliance matrix and risk assessment process and therefore cannot be excluded from evaluation based on a perception of risk mitigation qualities. Using a control prioritization method for measuring control effectiveness is highly recommended, such as the one below:
Example: Control prioritization to measure control effectiveness16
Criticality Descriptor
5
The control is absolutely critical to the management and reduction of the risk. If this control is ineffective or partially effective, the likelihood and/or consequence of the risk will increase significantly (i.e., increases likelihood or consequence by three or more levels).
4
The control is very important to the management and reduction of the risk. If this control is ineffective or partially effective, the likelihood and/or consequence of the risk will increase (i.e., increases likelihood or consequence by two levels).
3
The control is important to the management and reduction of the risk. If this control is ineffective or partially effective, the likelihood and/or consequence of the risk will increase (i.e., increases likelihood or consequence by one level).
2
The control has some impact on the management and reduction of the risk. Depending on the criticality of the other controls, an analysis should be undertaken to determine the necessity of this control.
1The control has little-to-no impact on the management and reduction of the risk. [A low priority control].

Research report
14
Factor 4
Control robustnessControl robustness relates to the ability of a control or control system to remain effective in meeting its control objective, despite environmental disruption. A robust control environment is more resistant to attacks and can operate effectively over extended periods of time even when exposed to changes in business as usual operations and adverse events, such as persistent, stealthy and sophisticated attacks.
Control environments are subject to all kinds of pressures: IT component changes, changing business requirements, limited resources, external regulatory change, as well as ever-evolving external threats. A control environment that can withstand these pressures while operating according to its design specifications is called “robust.” When an environment cannot withstand additional pressures, but can deal with them through multiple layers of controls, thereby keeping data protected, then it’s “resilient” (see Factor 5, page 16).
The best approach is to maintain an environment that is both robust and resilient, while recognizing that control failures happen even within mature control environments.
The approach taken by some organizations to prevent data breaches is to design robust controls; i.e., controls that are designed to prevent failure. However, this often results in rigid controls that are difficult to sustain within a dynamic threat environment where new threat actors and new vulnerabilities are discovered daily.
Maintaining robust controls goes beyond maintaining processes that ensure IT components are up to date. It starts with establishing a sound control environment (discussed in Factor 1), strengthening the design, operation and maintenance of security controls (Factor 2), and consistent management of control risk (Factor 3).
The four Cs of organizational proficiencies for a robust control environment
Robust control environments require four key organizational proficiencies in this order of progression: capacity, capability, competence and commitment. These proficiencies are fundamental to establishing robust and sustainable control environments.
CapacityAn organization’s “data protection capacity” can be described as the required amount of resources available to produce or deliver a determined amount of data protection objectives over an extended period. Data protection program performance depends heavily on the organization’s ability to acquire and maintain the required number of resources, i.e., the people, processes, technology, time and attention needed to support the program. A threshold of resources is required for a successful program. You cannot measure, manage and improve what your teams cannot capture.
Capability The ability of the organization to direct and apply resources to perform data protection tasks and the processes to support them. Individuals and teams must have the skills and capacity to perform the necessary actions. You need to determine whether the system components (people, processes, and technology) within your control environment have the awareness, knowledge and understanding to achieve the required standard of performance. Capability does not, however, mean there is an actual desire to apply those skills. The organization may just have the capability, but motivation and incentives are needed to make data protection and compliance a priority.
CompetenceYou need to have the knowledge, skills and experience to establish and maintain a sustainable operational control environment. It requires a level of maturity in business process management to achieve quality (repeatability and consistency) in each step of the control lifecycle. Agility and flexibility also are needed to change and develop in light of new situations, and to deal with constant changes in the threat and regulatory landscapes.
CommitmentAssurance that management and employees will consistently adhere to data protection and compliance programs is critical. It demands consistency of application and across-the-board discipline to adhere to standards and programs. In other words, consistency in doing the right things, in the right manner and at the right time.

Research report
15
Whose line is it anyway?
A robust control environment requires multiple lines of defense. A theoretical assurance model appears in a position paper published by the Institute of Internal Auditors (IIA) titled “The Three Lines of Defense in Effective Risk Management and Control.”17 This model received a fair amount of critique for its perceived over simplification. An extended model called The Five Lines of Assurance18 was proposed to correct the deficiencies in it. In our opinion, this four-lines model is a better fit for the payment security environment.
Figure 8. The Four Lines of Assurance
17. theiia.org/3-Lines-Defense18. riskoversightsolutions.com/wp-content/uploads/2011/03/Risk-Oversight-Solutions-for-comment-Three-Lines-of-Defense-vs-Five-Lines-of-Assurance-
Draft-Nov-2015.pdf
1: Individual accountability Assurance comes directly from work units: the front line staff, operational management and directors—those responsible for delivering specific objectives or processes. This line is the function that owns and manages risks, and they are executing risk and control procedures to maintain adequate internal controls. While they may lack independence, the value is that the operational staff and management know the day-to-day challenges and are crucial in anticipating and managing operational risks.
2: Risk management and compliance functionsRisk and compliance teams are the specialist support units responsible for monitoring the implementation of policies and procedures and serving as the management oversight over the first line. It is the role of the second line to provide the systems and advice necessary to integrate risk management and compliance into key processes and allow the front line to manage for success, and to ensure the first line of assurance is properly designed, in place, and operating as intended. As a management function, the second line of assurance cannot offer truly independent analyses.
3: Internal audit The internal audit function provides a level of objective, independent assurance, and also timely information to the board that the risk management and internal control framework is working as designed, with reasonable (not absolute) assurance of the overall effectiveness of governance, risk management and controls. Internal audit’s role is largely detective and corrective, i.e., detect control weaknesses or breakdowns and suggest improvements or remedial action.
4: External auditors, regulators, external bodies Independent assessors, such as QSAs, provide assurance on the effectiveness of governance, risk management and internal controls. They evaluate the manner in which the first three lines of assurance achieve control objectives. External assessors provide comprehensive assurance based on the highest level of independence and objectivity since they reside outside the organization’s structure.
Each line in the “Lines of Assurance” model has a purpose and can provide assurance, promoting efficiency and effectiveness through information sharing; Activities are coordinated among the groups responsible for managing the organization’s control environment.
Risk management and compliance functions2
Internal audit3
External audit, regulators and external bodies4
Individual accountability1
Research report
16
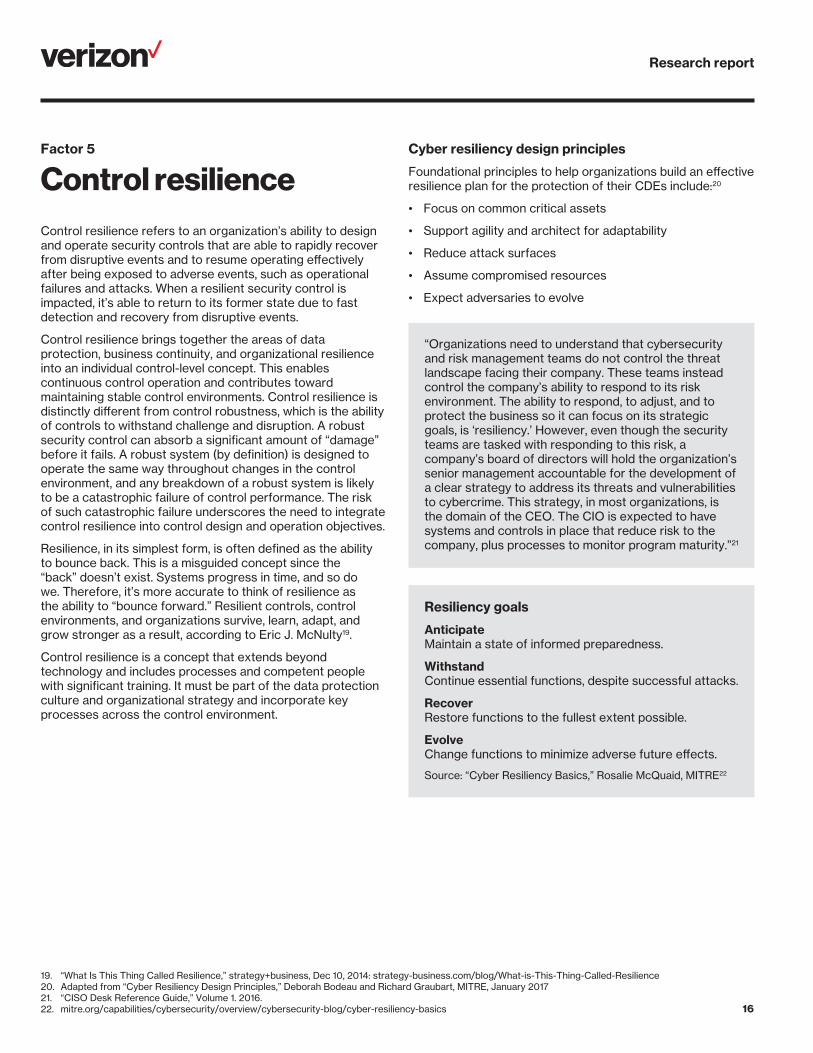
Factor 5
Control resilienceControl resilience refers to an organization’s ability to design and operate security controls that are able to rapidly recover from disruptive events and to resume operating effectively after being exposed to adverse events, such as operational failures and attacks. When a resilient security control is impacted, it’s able to return to its former state due to fast detection and recovery from disruptive events.
Control resilience brings together the areas of data protection, business continuity, and organizational resilience into an individual control-level concept. This enables continuous control operation and contributes toward maintaining stable control environments. Control resilience is distinctly different from control robustness, which is the ability of controls to withstand challenge and disruption. A robust security control can absorb a significant amount of “damage” before it fails. A robust system (by definition) is designed to operate the same way throughout changes in the control environment, and any breakdown of a robust system is likely to be a catastrophic failure of control performance. The risk of such catastrophic failure underscores the need to integrate control resilience into control design and operation objectives.
Resilience, in its simplest form, is often defined as the ability to bounce back. This is a misguided concept since the “back” doesn’t exist. Systems progress in time, and so do we. Therefore, it’s more accurate to think of resilience as the ability to “bounce forward.” Resilient controls, control environments, and organizations survive, learn, adapt, and grow stronger as a result, according to Eric J. McNulty19.
Control resilience is a concept that extends beyond technology and includes processes and competent people with significant training. It must be part of the data protection culture and organizational strategy and incorporate key processes across the control environment.
19. “What Is This Thing Called Resilience,” strategy+business, Dec 10, 2014: strategy-business.com/blog/What-is-This-Thing-Called-Resilience20. Adapted from “Cyber Resiliency Design Principles,” Deborah Bodeau and Richard Graubart, MITRE, January 201721. “CISO Desk Reference Guide,” Volume 1. 2016.22. mitre.org/capabilities/cybersecurity/overview/cybersecurity-blog/cyber-resiliency-basics
Cyber resiliency design principles
Foundational principles to help organizations build an effective resilience plan for the protection of their CDEs include:20
• Focus on common critical assets
• Support agility and architect for adaptability
• Reduce attack surfaces
• Assume compromised resources
• Expect adversaries to evolve
“Organizations need to understand that cybersecurity and risk management teams do not control the threat landscape facing their company. These teams instead control the company’s ability to respond to its risk environment. The ability to respond, to adjust, and to protect the business so it can focus on its strategic goals, is ‘resiliency.’ However, even though the security teams are tasked with responding to this risk, a company’s board of directors will hold the organization’s senior management accountable for the development of a clear strategy to address its threats and vulnerabilities to cybercrime. This strategy, in most organizations, is the domain of the CEO. The CIO is expected to have systems and controls in place that reduce risk to the company, plus processes to monitor program maturity.”21
Resiliency goals
AnticipateMaintain a state of informed preparedness.
WithstandContinue essential functions, despite successful attacks.
RecoverRestore functions to the fullest extent possible.
EvolveChange functions to minimize adverse future effects.
Source: “Cyber Resiliency Basics,” Rosalie McQuaid, MITRE22
Research report
17
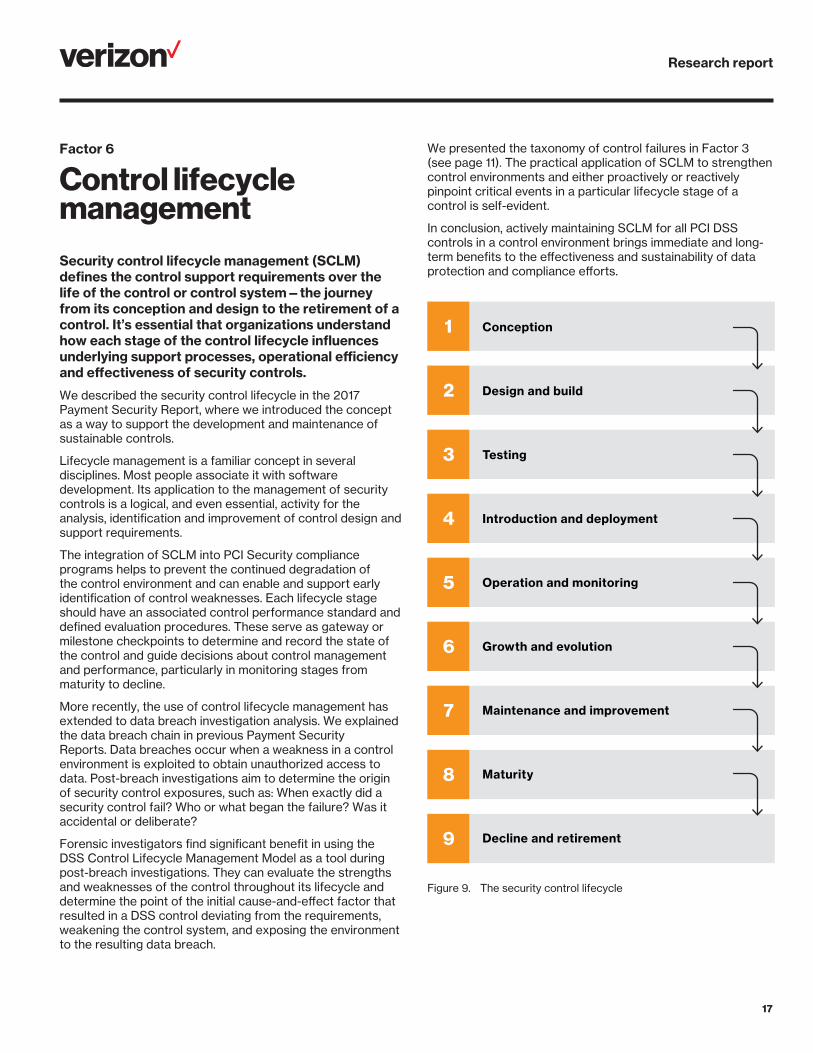
Factor 6
Control lifecycle managementSecurity control lifecycle management (SCLM) defines the control support requirements over the life of the control or control system—the journey from its conception and design to the retirement of a control. It’s essential that organizations understand how each stage of the control lifecycle influences underlying support processes, operational efficiency and effectiveness of security controls.
We described the security control lifecycle in the 2017 Payment Security Report, where we introduced the concept as a way to support the development and maintenance of sustainable controls.
Lifecycle management is a familiar concept in several disciplines. Most people associate it with software development. Its application to the management of security controls is a logical, and even essential, activity for the analysis, identification and improvement of control design and support requirements.
The integration of SCLM into PCI Security compliance programs helps to prevent the continued degradation of the control environment and can enable and support early identification of control weaknesses. Each lifecycle stage should have an associated control performance standard and defined evaluation procedures. These serve as gateway or milestone checkpoints to determine and record the state of the control and guide decisions about control management and performance, particularly in monitoring stages from maturity to decline.
More recently, the use of control lifecycle management has extended to data breach investigation analysis. We explained the data breach chain in previous Payment Security Reports. Data breaches occur when a weakness in a control environment is exploited to obtain unauthorized access to data. Post-breach investigations aim to determine the origin of security control exposures, such as: When exactly did a security control fail? Who or what began the failure? Was it accidental or deliberate?
Forensic investigators find significant benefit in using the DSS Control Lifecycle Management Model as a tool during post-breach investigations. They can evaluate the strengths and weaknesses of the control throughout its lifecycle and determine the point of the initial cause-and-effect factor that resulted in a DSS control deviating from the requirements, weakening the control system, and exposing the environment to the resulting data breach.
We presented the taxonomy of control failures in Factor 3 (see page 11). The practical application of SCLM to strengthen control environments and either proactively or reactively pinpoint critical events in a particular lifecycle stage of a control is self-evident.
In conclusion, actively maintaining SCLM for all PCI DSS controls in a control environment brings immediate and long-term benefits to the effectiveness and sustainability of data protection and compliance efforts.
Conception1
Design and build2
Testing3
Introduction and deployment4
Operation and monitoring5
Growth and evolution6
Maintenance and improvement7
Maturity8
Decline and retirement9
Figure 9. The security control lifecycle
Research report
18
Factor 7:
Performance managementPerformance management in the context of data protection and compliance programs is defined as a management control process for improving the performance and capabilities of all system components within the control environment (people, processes and technology) to achieve defined data protection and compliance goals within an established timetable. The performance management activity includes the clarification of goals and objectives setting standards, measuring actual performance and taking corrective action.
Effective performance management requires a structured process to nurture a culture in which individuals and groups take responsibility for their own skills and behaviors, and are encouraged to support the continuous improvement of business processes. It usually requires continuous monitoring and reporting against KPIs or metrics that are used to monitor performance against desired behaviors or operational outcomes.
Performance management must be aligned with the strategic goals of an organization. Too often, data protection, security and compliance objectives are not addressed effectively within a corporate strategy. They are overlooked in performance management processes or siloed to particular teams or functions. In reality, the responsibilities for security or compliance goals should be borne companywide. For many organizations within the payment card industry, measuring and improving the actual effectiveness of security controls are seldom part of their program objectives. There is significant need across the industry to promote the use of tools and procedures to measure data protection and compliance performance.
The bottom line is that what gets measured, gets done. To improve an organization’s data protection performance, you need to know the current performance. Organizations are coming to terms with being measured on 400-plus test procedures for their annual PCI DSS compliance validation, but they seem to fail in establishing continuous monitoring processes to support sustainable compliance performance.
Based on Verizon’s interviews with organizations worldwide, half (50%) of organizations manage their PCI DSS compliance programs as a standalone project and not as part of a broader data protection program initiative.
23. “Armstrong’s Handbook of Performance Management, Sixth Edition”, Kogan Page, 201824. Ibid.
Compliance programs focus on achieving compliance objectives, but once the project is concluded and compliance efforts transition into BAU, there is a drop in control sustainability. The dilution of compliance objectives among other business pressures is a contributing factor, but perhaps just as significant, a lack of adequate monitoring of control performance means that compliance failures creep in unknowingly.
The formal requirement for the establishment of a performance monitoring program to support continuous improvement is still not included as part of the PCI DSS. This omission seems to be increasingly important, as we see organizations continuing to struggle with maintaining year-on-year compliance.
“Performance management is the continuous process of improving performance by setting individual and team goals which are aligned to the strategic goals of the organization, planning performance to achieve the goals, reviewing and assessing progress, and developing the knowledge, skills and abilities of people.”23
The focus should not be on paperwork, but rather on changing behavior and achieving results by improving how the organization is enabling the capability of people to consistently adhere to data protection and compliance requirements.24
Research report
19
Principles of performance management
Performance management includes activities that ensure that goals are consistently being met effectively and efficiently. It is all-pervasive and needs structures to support it. The four key elements of a data protection performance program are:
• The clarification of goals and objectives
• Setting standards
• Measurement and comparison
• Managing deviations
Clarifying goals and objectivesOne of the first steps of managing data protection performance is to translate corporate goals into specific objectives and then into individual, team, department and divisional objectives set in precise terms. What are the objectives of your PCI compliance program? Are they the same as the objective of your corporate data protection program? Do they include unified compliance objectives? Continuous improvement? Maintaining capacity, capability and competence of all critical resources?
Setting standardsManagement needs to establish the standards of performance for each aspect of the data protection program. The setting of clearly defined standards creates the parameters for performance management. A simple example of a standard is the perfect score for candlepin bowling of 300. Individual players compare their actual scores with the perfect score. It’s a yardstick expressed in a clearly measurable and documented form. Without a standard, it’s not possible to measure outcomes in any meaningful or objective way. They should define the methods in which progress is to be measured and monitored, the degrees of deviation from standards that will be tolerated, and what actions will be taken to correct failures to achieve the required performance.
Measurement and comparisonActual performance measurements must be compared against documented standards. Management assesses all data protection and compliance performance against jointly agreed upon goals. It relies on consensus and co-operation rather than control or coercion. The objective is to create a shared understanding of what is required to improve the efficiency and effectiveness (i.e., the overall performance) of payment card data protection, and how it will be achieved.
The organization should encourage self-management of individual performance (see Factor 9 page 22). It requires a management style that is open and honest and helps two-way communication between superiors and subordinates, with continuous feedback. Feedback loops enable the experiences and knowledge gained on the job by individuals to modify corporate objectives.
25. Verizon global PCI customer survey, 2018
Managing deviationsWhen deviations from management standards are detected, appropriate corrective action must be taken. These can be established for each of the 9 Factors discussed in this report. The function of the performance management program is to set a standard for performance measurement.
Teams and individuals must know and understand data protection and compliance expectations and have the skills and ability to deliver on these expectations. They must be supported in reporting deviations and management must create a culture of openness in which individuals feel safe to call out control issues without fear of blame or burdensome responsilibility.
State of compliance measurement
About half (48%) of survey respondents indicated that they measure controls beyond the requirements in the Data Security Standard. Of those, about half (53%) do so for the entire environment and the rest (47%) only for a portion of the environment.
Less than one in five organizations (18%) measure their DSS controls across their entire environment more frequently than the DSS requires.
In terms of compliance reporting, two fifths (40%) only measure their PCI compliance annually for compliance validation purposes. Less than a quarter (19%) measure and report their PCI DSS compliance monthly.25
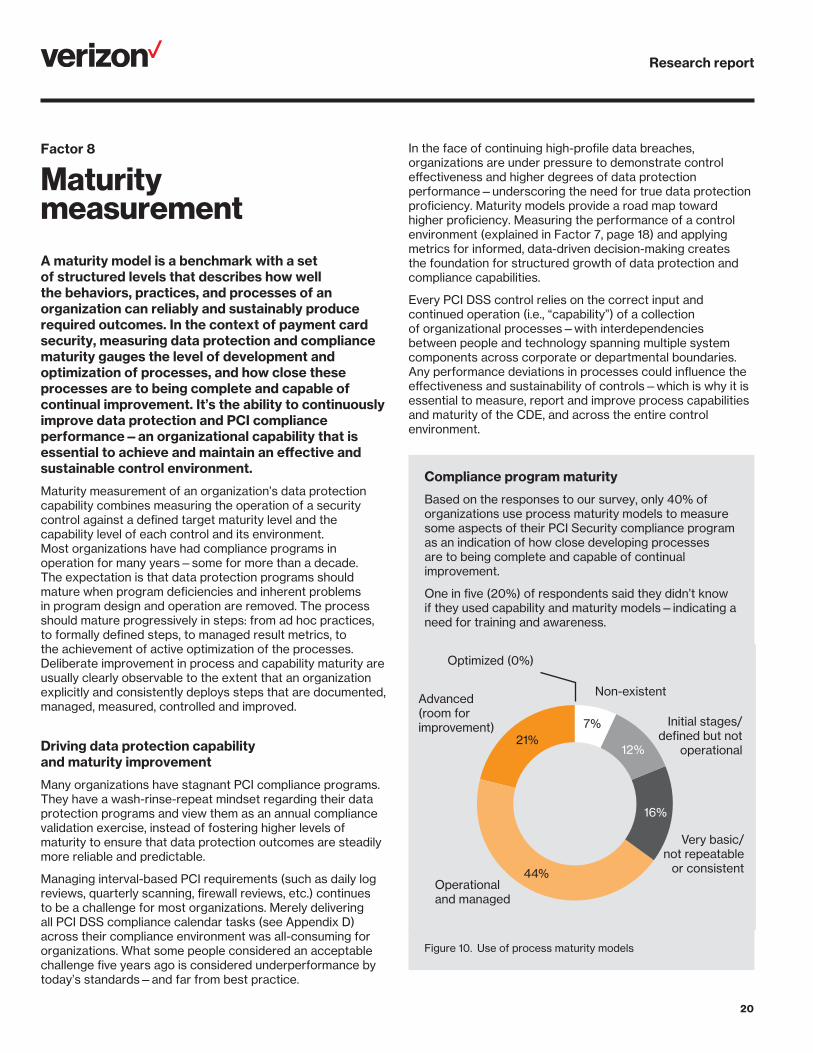
Research report
20
Factor 8
Maturity measurementA maturity model is a benchmark with a set of structured levels that describes how well the behaviors, practices, and processes of an organization can reliably and sustainably produce required outcomes. In the context of payment card security, measuring data protection and compliance maturity gauges the level of development and optimization of processes, and how close these processes are to being complete and capable of continual improvement. It’s the ability to continuously improve data protection and PCI compliance performance—an organizational capability that is essential to achieve and maintain an effective and sustainable control environment.
Maturity measurement of an organization’s data protection capability combines measuring the operation of a security control against a defined target maturity level and the capability level of each control and its environment. Most organizations have had compliance programs in operation for many years—some for more than a decade. The expectation is that data protection programs should mature when program deficiencies and inherent problems in program design and operation are removed. The process should mature progressively in steps: from ad hoc practices, to formally defined steps, to managed result metrics, to the achievement of active optimization of the processes. Deliberate improvement in process and capability maturity are usually clearly observable to the extent that an organization explicitly and consistently deploys steps that are documented, managed, measured, controlled and improved.
Driving data protection capability and maturity improvement
Many organizations have stagnant PCI compliance programs. They have a wash-rinse-repeat mindset regarding their data protection programs and view them as an annual compliance validation exercise, instead of fostering higher levels of maturity to ensure that data protection outcomes are steadily more reliable and predictable.
Managing interval-based PCI requirements (such as daily log reviews, quarterly scanning, firewall reviews, etc.) continues to be a challenge for most organizations. Merely delivering all PCI DSS compliance calendar tasks (see Appendix D) across their compliance environment was all-consuming for organizations. What some people considered an acceptable challenge five years ago is considered underperformance by today’s standards—and far from best practice.
In the face of continuing high-profile data breaches, organizations are under pressure to demonstrate control effectiveness and higher degrees of data protection performance—underscoring the need for true data protection proficiency. Maturity models provide a road map toward higher proficiency. Measuring the performance of a control environment (explained in Factor 7, page 18) and applying metrics for informed, data-driven decision-making creates the foundation for structured growth of data protection and compliance capabilities.
Every PCI DSS control relies on the correct input and continued operation (i.e., “capability”) of a collection of organizational processes—with interdependencies between people and technology spanning multiple system components across corporate or departmental boundaries. Any performance deviations in processes could influence the effectiveness and sustainability of controls—which is why it is essential to measure, report and improve process capabilities and maturity of the CDE, and across the entire control environment.
Compliance program maturity
Based on the responses to our survey, only 40% of organizations use process maturity models to measure some aspects of their PCI Security compliance program as an indication of how close developing processes are to being complete and capable of continual improvement.
One in five (20%) of respondents said they didn’t know if they used capability and maturity models—indicating a need for training and awareness.
Non-existent
Initial stages/defined but not
operational
Very basic/not repeatable
or consistentOperational and managed
Advanced (room for improvement)
Optimized (0%)
7%
12%
16%
44%
21%
Figure 10. Use of process maturity models
Research report
21
Organizations should be equally concerned with their current performance and improvement capability in the context of maturity levels, since these are key determinants of future failure or success. At present, PCI standards for measuring compliance process maturity are still lacking.
Being able to articulate not only performance-based metrics, but also the maturity of controls within the control environment and the maturity of the control environment as a whole, contributes substantially toward helping all parties within the organization participate in a meaningful dialog about the state of data protection, its actual effectiveness, sustainability and improvement.
See Appendix A (see 41) for examples on applying maturity models to improve your control environment.
Process capability levels classify an organization according to the performances of specific processes; it’s deemed “capable” if it satisfies specified process performance and quality objectives. A capable process consistently produces predictable results and outputs that are within specification, based on specific competencies that must exist in an organization for the process to be executed. As each process develops, its “capability” will improve.
Process maturity levels classify an organization’s ability to control various steps or processes. The activities are conducted according to a documented method; everyone knows what is expected of them and performs accordingly. For a process to be mature, it has to be complete in its usefulness, automated, reliable in information, and continuously improving.
Based on our field observations, less than a quarter of organizations apply security metrics, such as control coverage, control effectiveness and operational performance metrics, to measure the state of their PCI DSS controls.
Bringing objectivity to risk managementMany organizations manage risk either at a high business level that may not sufficiently involve data protection compliance, or they approach it as a vulnerability and technical risk management issue, which focuses on smaller scopes such as specific OS/systems/technologies. Many organizations still need to bridge the gaps between broader operational risk management, IT risk management, and compliance risk management. We notice this usually in the banking sector, the energy sector, and with the occasional retailer. Banking organizations usually have an excellent risk management program in place but have yet to fold in compliance and payment card data protection in an effective manner. Also worrisome is that many banks still think their acceptance of risk supersedes the PCI Security compliance requirements.
The approach taken by a particular organization, described below, stood out as a significant contributor toward the success of their data protection and compliance program:
First is the way in which they identify risks and accurately define them in realistic terms. The organization documented and reported the threats, vulnerabilities and likelihoods of exploitation as they were occurring through ongoing objective measurement and recoding. This activity distinguished their approach from the many other organizations which continue to report risks based on the opinions of teams or individuals leaving management to make decisions based on subjective perception of risks, without backing it up with objective data.
Second, the speed with which decisions are made that changes how a company operates, how quick they adapt and make adjustments to their risk model. The organization developed a practical in-house-developed dashboard to monitor all security risk. This allowed them to avoid an IT-focused decision and assessment approach, and instead involve management to achieve the balance between business- and IT decision making. All risks are tracked, and visible almost in real time. The IT Director reviews it on demand, which can be several times a day, and it remains visible online to management (which are on a different continent).
Because of this organization’s ability to adapt quickly to its own changing exposure, the company can make intelligent decisions more rapidly and more profitably than its competitors.

Research report
22
Factor 9:
Self-assessmentSelf-assessment is an in-house organizational competency to establish, evaluate and record measurable outcomes for each of the 9 Factors that respectively also includes the assessment of self-assessment capability. Looking at Factors 1 through 8 with specific attention to 6 (lifecycle management), 7 (performance management), and 8 (maturity measurement), we can see that as organizations begin to place emphasis on establishing effective and sustainable compliance programs, a number of internal controls are necessary to actualize success through the measurement of KPIs. These internal controls should align with PCI DSS requirements and any other regulatory controls that exist within the entity’s control environment.
This success can only be attained when organizations have procedures in place to measure the effectiveness of their controls and then subsequently measure the effectiveness of their control programs. It’s critical to evaluate and measure the considerations provided in Factors 1 through 8 and also formalize and communicate to management how the ongoing internal control self-assessment process is progressing in a structured manner, with prioritizing of threats that impose new risks. This activity can and should be integrated into organizations’ risk assessment and management processes.
Program maturity at this level requires the application of a structured and repeatable method to conduct defined internal assessments using a variety of techniques, methodologies and tools to identify and validate the actual state of compliance, along with any critical weaknesses in control performance or other underlying support processes adversely affecting the control environment. The self-assessment activity should be a core element of organizations’ compliance programs to determine not only if but precisely how data protection goals are being met (or not).
Establishing an internal control self-assessment process as part of the organization’s compliance program includes standardized assessment methods and procedures. The “four Cs” (see page 14) are also useful as a high-level framework in developing a self-assessment program to evaluate the required number of resources (capacity), the ability to direct and apply resources (capability), the skills, knowledge and experience (competence), and the assurance from management to consistently adhere to compliance and data protection requirements (commitment). The evaluation of organizational performance across these criteria cultivates a culture where sustainable control environments can be developed and expand prosperously.
Self-assessment capability improvement
A competent internal assessment team should have a positive impact on compliance programs and the overall control environment in a relatively short period of time.
Build internal assessment competency to measure, monitor and proactively manage each of the 9 Factors to move quickly from the generation of compliance-only issues to an output of improvement opportunities. Continuous improvement should always be an objective for organizations to advance in maturity, no matter what area is being measured or scrutinized.
Evaluating a control environment’s control sustainability and control effectiveness through the lens of the 9 Factors creates a space for entities required to be compliant with the PCI DSS (and likely other standards and regulations) to realize through discernment where risk truly exists.
This results, ultimately, in improving the overall control process maturity and sustainability of the control environment. On page 27 of the Verizon 2015 PCI Compliance Report, we discussed the evaluation of PCI DSS requirement sustainability and reviewed the need to develop procedures to evaluate the key processes within each of your technical-, administrative-, operation- and business-sustainability domains.
Ongoing development of an in-house self-assessment competency offers many benefits:
• It improves communication and perspective about the overall state of data protection and compliance by measuring control performance (including effectiveness and sustainability) in the context of its control system and control environment
• It enables more frequent control evaluations by reducing reliance on external assessors. This, in turn, can promote proactive detection and adjustment controls on the spot throughout the year and avoid waiting for an annual compliance assessment to discover an issue
• It enhances the capability to evaluate and improve control resilience and robustness by maintaining multiple in-house lines of assurance
• It improves confidence in the internal team proficiency (capacity, capability and competency) and avoids stressful peak activities as the controls are efficient, sustainable, and performed and validated on a regular basis
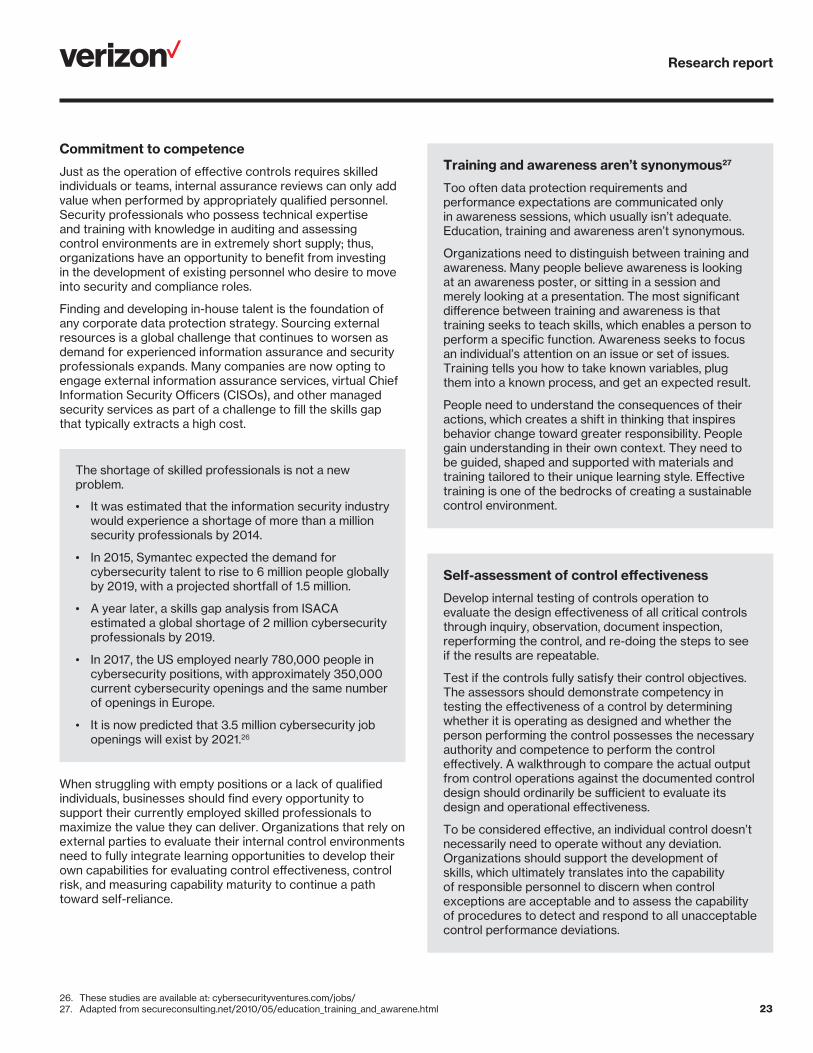
Research report
23
Commitment to competence
Just as the operation of effective controls requires skilled individuals or teams, internal assurance reviews can only add value when performed by appropriately qualified personnel. Security professionals who possess technical expertise and training with knowledge in auditing and assessing control environments are in extremely short supply; thus, organizations have an opportunity to benefit from investing in the development of existing personnel who desire to move into security and compliance roles.
Finding and developing in-house talent is the foundation of any corporate data protection strategy. Sourcing external resources is a global challenge that continues to worsen as demand for experienced information assurance and security professionals expands. Many companies are now opting to engage external information assurance services, virtual Chief Information Security Officers (CISOs), and other managed security services as part of a challenge to fill the skills gap that typically extracts a high cost.
The shortage of skilled professionals is not a new problem.
• It was estimated that the information security industry would experience a shortage of more than a million security professionals by 2014.
• In 2015, Symantec expected the demand for cybersecurity talent to rise to 6 million people globally by 2019, with a projected shortfall of 1.5 million.
• A year later, a skills gap analysis from ISACA estimated a global shortage of 2 million cybersecurity professionals by 2019.
• In 2017, the US employed nearly 780,000 people in cybersecurity positions, with approximately 350,000 current cybersecurity openings and the same number of openings in Europe.
• It is now predicted that 3.5 million cybersecurity job openings will exist by 2021.26
When struggling with empty positions or a lack of qualified individuals, businesses should find every opportunity to support their currently employed skilled professionals to maximize the value they can deliver. Organizations that rely on external parties to evaluate their internal control environments need to fully integrate learning opportunities to develop their own capabilities for evaluating control effectiveness, control risk, and measuring capability maturity to continue a path toward self-reliance.
26. These studies are available at: cybersecurityventures.com/jobs/27. Adapted from secureconsulting.net/2010/05/education_training_and_awarene.html
Training and awareness aren’t synonymous27
Too often data protection requirements and performance expectations are communicated only in awareness sessions, which usually isn’t adequate. Education, training and awareness aren’t synonymous.
Organizations need to distinguish between training and awareness. Many people believe awareness is looking at an awareness poster, or sitting in a session and merely looking at a presentation. The most significant difference between training and awareness is that training seeks to teach skills, which enables a person to perform a specific function. Awareness seeks to focus an individual’s attention on an issue or set of issues. Training tells you how to take known variables, plug them into a known process, and get an expected result.
People need to understand the consequences of their actions, which creates a shift in thinking that inspires behavior change toward greater responsibility. People gain understanding in their own context. They need to be guided, shaped and supported with materials and training tailored to their unique learning style. Effective training is one of the bedrocks of creating a sustainable control environment.
Self-assessment of control effectiveness
Develop internal testing of controls operation to evaluate the design effectiveness of all critical controls through inquiry, observation, document inspection, reperforming the control, and re-doing the steps to see if the results are repeatable.
Test if the controls fully satisfy their control objectives. The assessors should demonstrate competency in testing the effectiveness of a control by determining whether it is operating as designed and whether the person performing the control possesses the necessary authority and competence to perform the control effectively. A walkthrough to compare the actual output from control operations against the documented control design should ordinarily be sufficient to evaluate its design and operational effectiveness.
To be considered effective, an individual control doesn’t necessarily need to operate without any deviation. Organizations should support the development of skills, which ultimately translates into the capability of responsible personnel to discern when control exceptions are acceptable and to assess the capability of procedures to detect and respond to all unacceptable control performance deviations.
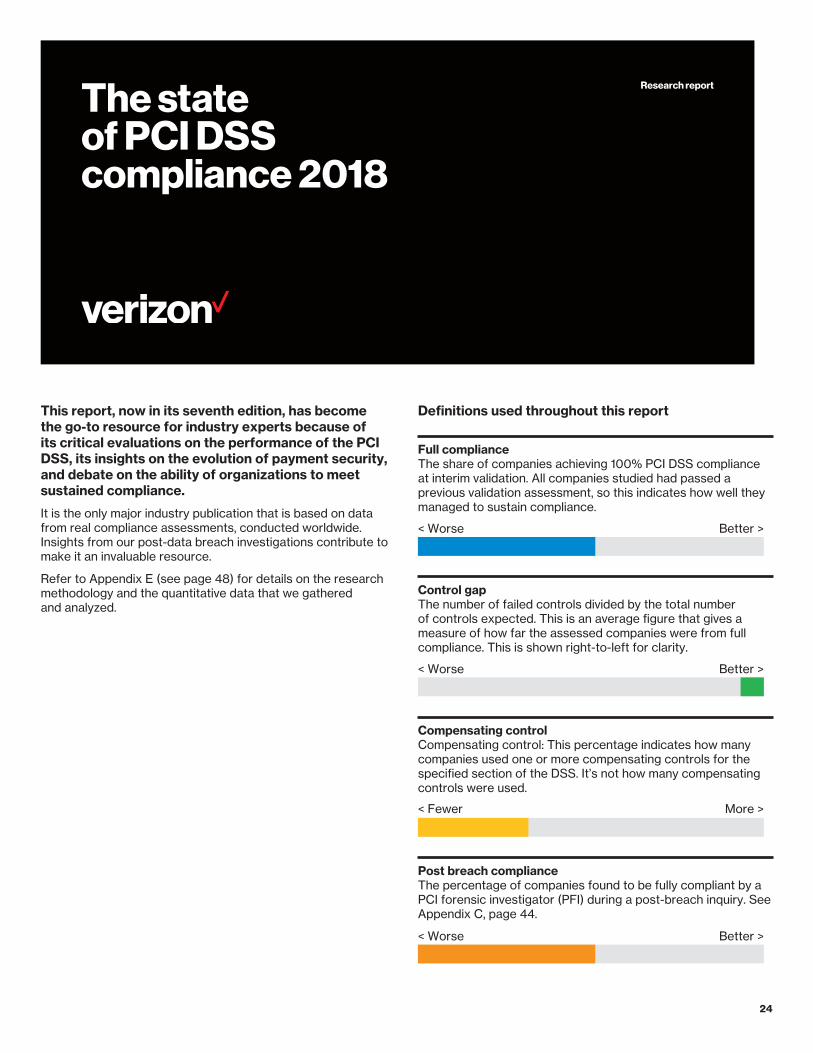
Research report
24
The state of PCI DSS compliance 2018
This report, now in its seventh edition, has become the go-to resource for industry experts because of its critical evaluations on the performance of the PCI DSS, its insights on the evolution of payment security, and debate on the ability of organizations to meet sustained compliance.
It is the only major industry publication that is based on data from real compliance assessments, conducted worldwide. Insights from our post-data breach investigations contribute to make it an invaluable resource.
Refer to Appendix E (see page 48) for details on the research methodology and the quantitative data that we gathered and analyzed.
Definitions used throughout this report
Full complianceThe share of companies achieving 100% PCI DSS compliance at interim validation. All companies studied had passed a previous validation assessment, so this indicates how well they managed to sustain compliance.
Better >< Worse
Control gapThe number of failed controls divided by the total number of controls expected. This is an average figure that gives a measure of how far the assessed companies were from full compliance. This is shown right-to-left for clarity.
Better >< Worse
Compensating controlCompensating control: This percentage indicates how many companies used one or more compensating controls for the specified section of the DSS. It’s not how many compensating controls were used.
More >< Fewer
Post breach complianceThe percentage of companies found to be fully compliant by a PCI forensic investigator (PFI) during a post-breach inquiry. See Appendix C, page 44.
Better >< Worse
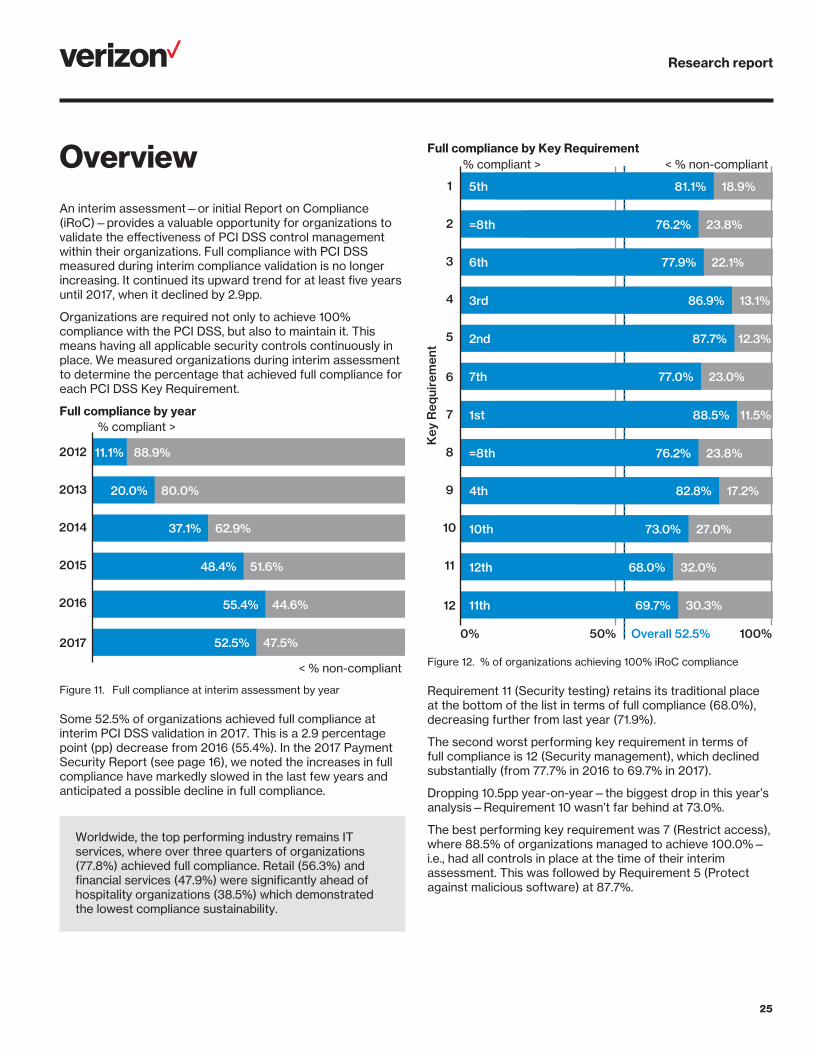
Research report
25
OverviewAn interim assessment—or initial Report on Compliance (iRoC)—provides a valuable opportunity for organizations to validate the effectiveness of PCI DSS control management within their organizations. Full compliance with PCI DSS measured during interim compliance validation is no longer increasing. It continued its upward trend for at least five years until 2017, when it declined by 2.9pp.
Organizations are required not only to achieve 100% compliance with the PCI DSS, but also to maintain it. This means having all applicable security controls continuously in place. We measured organizations during interim assessment to determine the percentage that achieved full compliance for each PCI DSS Key Requirement.
Full compliance by year% compliant >
Full compliance by year
11.1% 88.9%
55.4% 44.6%
52.5% 47.5%
48.4% 51.6%
37.1% 62.9%
20.0% 80.0%
2014
2013
2012
2015
2016
2017
< % non-compliant
Figure 11. Full compliance at interim assessment by year
Some 52.5% of organizations achieved full compliance at interim PCI DSS validation in 2017. This is a 2.9 percentage point (pp) decrease from 2016 (55.4%). In the 2017 Payment Security Report (see page 16), we noted the increases in full compliance have markedly slowed in the last few years and anticipated a possible decline in full compliance.
Worldwide, the top performing industry remains IT services, where over three quarters of organizations (77.8%) achieved full compliance. Retail (56.3%) and financial services (47.9%) were significantly ahead of hospitality organizations (38.5%) which demonstrated the lowest compliance sustainability.
Full compliance by Key Requirement% compliant >
Full compliance by Key Requirement
81.1% 18.9%
87.7% 12.3%
77.0% 23.0%
86.9% 13.1%
77.9% 22.1%
76.2% 23.8%
3
2
1
4
5
6
88.5% 11.5%
68.0% 32.0%
69.7% 30.3%
73.0% 27.0%
82.8% 17.2%
76.2% 23.8%
9
8
7
10
11
12
Key
Req
uire
men
t
Overall 52.5%0% 50% 100%
< % non-compliant
5th
2nd
7th
3rd
6th
=8th
1st
12th
11th
10th
4th
=8th
Figure 12. % of organizations achieving 100% iRoC compliance
Requirement 11 (Security testing) retains its traditional place at the bottom of the list in terms of full compliance (68.0%), decreasing further from last year (71.9%).
The second worst performing key requirement in terms of full compliance is 12 (Security management), which declined substantially (from 77.7% in 2016 to 69.7% in 2017).
Dropping 10.5pp year-on-year—the biggest drop in this year’s analysis—Requirement 10 wasn’t far behind at 73.0%.
The best performing key requirement was 7 (Restrict access), where 88.5% of organizations managed to achieve 100.0%—i.e., had all controls in place at the time of their interim assessment. This was followed by Requirement 5 (Protect against malicious software) at 87.7%.

Research report
26
But the control gap has widened
In addition to compliance by organization, we also looked at the control gap—the number of failed controls as a percentage of all those assessed. Comparing this data with compliance by organization (full compliance) provides interesting insights. It allows us to identify the PCI DSS controls with which organizations are struggling to comply.
Verizon has tracked the control gap since PCI DSS 1.1. In our previous reports, we explained how each update to the PCI DSS impacted organizations’ abilities to meet the requirements.
Control gap (all companies, including fully compliant)
< Control gap Average compliance >
Control gap (non-compliant companies)
< Control gap Average compliance >
Control gap (all companies, including fully compliant)
88.2%11.8% 2014
92.0%8.0% 2013
83.2%16.8% 2012
87.6%12.4% 2015
87.0%13.0% 2016
83.6%-3.4pp
16.4%+3.4pp 2017
92.6%7.4% 2014
93.6%6.4% 2013
14.4% 85.6%2012
93.2%6.8% 2015
94.2%5.8% 2016
92.8%-1.4pp
7.2%+1.4pp 2017
Control gap (non-compliant companies)< Control gap Average compliance >
Control gap (non-compliant companies)
< Control gap Average compliance >
Control gap (all companies, including fully compliant)
88.2%11.8% 2014
92.0%8.0% 2013
83.2%16.8% 2012
87.6%12.4% 2015
87.0%13.0% 2016
83.6%-3.4pp
16.4%+3.4pp 2017
92.6%7.4% 2014
93.6%6.4% 2013
14.4% 85.6%2012
93.2%6.8% 2015
94.2%5.8% 2016
92.8%-1.4pp
7.2%+1.4pp 2017
Figure 13. Overview of control gap at interim assessment, 2012–2017
When we exclude the companies that achieved full compliance this pattern of increasing control gap is even clearer. This means that while the trend for the share of organizations sustaining compliance is upward, the organizations failing to do so are on average failing more controls at interim assessment—i.e., getting worse.
Control gap by Key Requirement
Key R
equirement
< Control gapControl gap by Key Requirement
5.1%
5.5%
5.3%
6.1%
10.4%
9.3%
3
2
1
4
5
6
5.7%
11.9%
5.1%
8.5%
4.9%
7.8%
9
8
7
10
11
12
Overall 7.2% 0%50%100%
=2nd
5th
4th
7th
11th
10th
6th
12th
=2nd
9th
1st
8th
Figure 14. Overview of DSS control gaps, 2017
Requirement 11 (Testing security) had the highest control gap – a substantial 11.9%. This is a significant percentage of controls not in place for a Requirement that’s critical to sustaining the security of cardholder data.
Requirement 2 had the second highest control gap of 9.3%. Maintaining compliance for Requirement 2 is not easy, and organizations should expect and be prepared to respond to unauthorized, unplanned and unintended changes to the configuration of systems. Without adequate automation, keeping documented configurations up to date can be challenging.
The control gap of Requirement 10 increased to 8.5%. Many organizations still rely on poorly designed and/or implemented controls, or manual operations that are both error-prone and costly to maintain. Controls that exist and are operated within poorly designed environments impede business efficiency and adversely affect security.
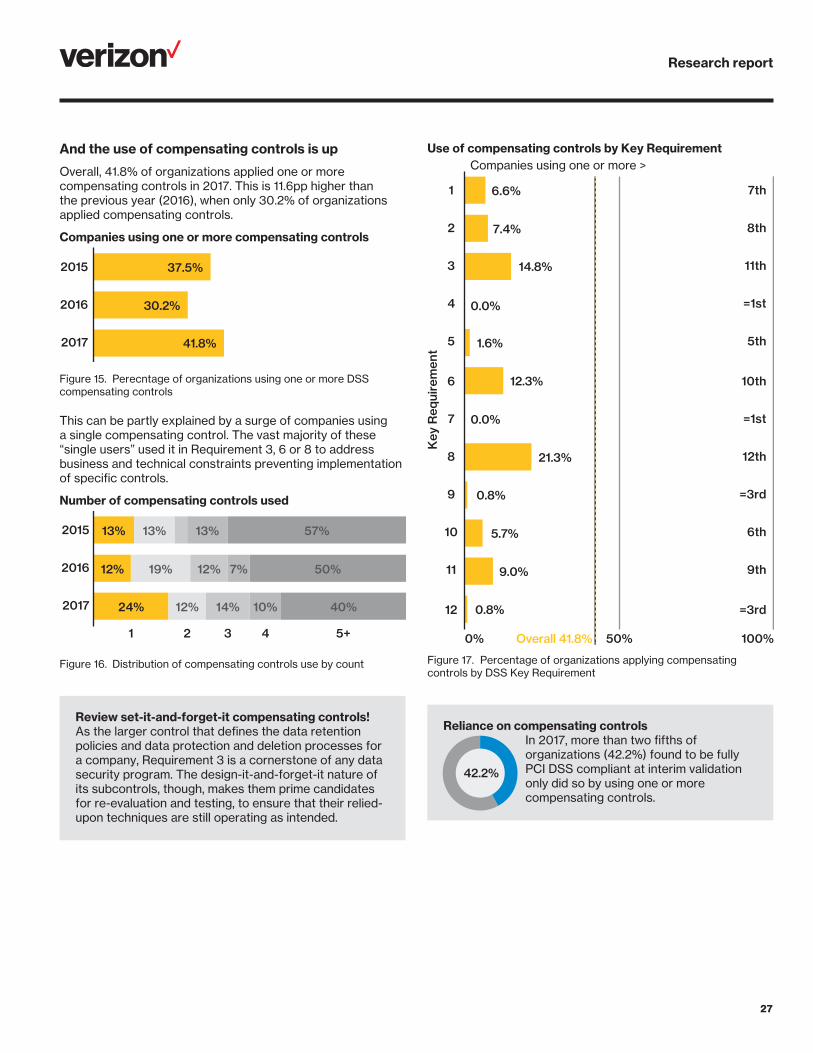
Research report
27
And the use of compensating controls is up
Overall, 41.8% of organizations applied one or more compensating controls in 2017. This is 11.6pp higher than the previous year (2016), when only 30.2% of organizations applied compensating controls.
Companies using one or more compensating controlsCompanies using one or more compensating controls
37.5%
41.8%
30.2%
2017
2016
2015
Figure 15. Perecntage of organizations using one or more DSS compensating controls
This can be partly explained by a surge of companies using a single compensating control. The vast majority of these “single users” used it in Requirement 3, 6 or 8 to address business and technical constraints preventing implementation of specific controls.
Number of compensating controls used Number of compensating controls used
2017
2016
2015 13%
12%
24%
57%
50%
40%
13%
7%
10%
13%
19%
12%
12%
14%
1 5+42 3
Figure 16. Distribution of compensating controls use by count
Review set-it-and-forget-it compensating controls!As the larger control that defines the data retention policies and data protection and deletion processes for a company, Requirement 3 is a cornerstone of any data security program. The design-it-and-forget-it nature of its subcontrols, though, makes them prime candidates for re-evaluation and testing, to ensure that their relied-upon techniques are still operating as intended.
Use of compensating controls by Key RequirementCompanies using one or more >
Use of compensating controls by Key Requirement
6.6%
1.6%
12.3%
14.8%
7.4%
3
2
1
4
5
6
9.0%
0.8%
5.7%
0.8%
21.3%
9
8
7
10
11
12
Key
Req
uire
men
t
0.0%
0.0%
Overall 41.8%0% 50%
11th
8th
7th
=1st
5th
10th
=3rd
12th
=1st
6th
9th
=3rd
100%
Figure 17. Percentage of organizations applying compensating controls by DSS Key Requirement
Reliance on compensating controls In 2017, more than two fifths of
organizations (42.2%) found to be fully PCI DSS compliant at interim validation only did so by using one or more compensating controls.
42.2%

Research report
28
Full compliance increasedFull compliance increased 12.3pp over the last three years, indicating improved use and maintenance of firewalls.
2017 (81.1%)
2016 (79.1%)
2015 (68.8%)
Americas lags other regions The Americas had the poorest record of full compliance, coming in at 70.7%.
Asia Pacific (94.4%)
Europe (85.7%)
Americas (70.7%)
Biggest improvementControl 1.2 (Restrict traffic to only necessary) showed the biggest improvement, gaining 2.9pp over 2016.
Lowest industry complianceHospitality was the least compliant at 69.2%, a year-on-year drop of 5.8pp.
Recommendation
Keep system and configuration documentation updated. Improve consistency by fully integrating documentation maintenance and management into your change control process.
Control gap showed minor changePerformance on this Requirement widened by 0.3pp from 2016, with an overall control gap of 5.1%.
Europe set the control barOrganizations in Europe had the smallest gap at 1.5%; Asia Pacific was next at 3.1%, followed by the Americas with 8.0%.
Americas (8.0%)
Asia Pacific (3.1%)
Europe (1.5%)
Retail gap surgedAmong industries the highest control gap was in retail. This was 7.6%, an improvement of 6.9pp over the previous year.
Only two controls showed improvement1.1 and 1.2 were the only controls that saw a lower gap—0.7pp and 0.4pp respectively. This indicates that more companies are inspecting and maintaining firewall and router configurations and verifying that connections are restricted.
Use of compensating controls increased in most regionsThe use of compensating controls increased in two of the three regions, taking the overall figure to 6.6%.
Asia Pacific (0.0%)
Europe (3.6%)
Americas (12.1%)
Asia Pacific was the only region to use fewer compensating controls than in the previous year: a 2.4pp drop. The Americas region had the largest increase (5.3pp) and the highest overall use at 12.1%.
And most industriesAll industries showed an increase, except IT services—here usage remained static at 0.0%.
Data breach correlation 66.7% of
companies assessed after a data breach were compliant with Requirement 1. This
is a significant improvement over previous years. In fact, there has been consistent improvement in this area since 2010.
Long-term trend: 28.4%.
66.7%
1 Maintain a firewall configuration
This Requirement covers the correct use of a firewall to filter traffic as it passes between internal and external networks, as well as traffic to and from sensitive areas within the company’s internal networks.
1.5 (0.0%)
1.4 (0.0%)
1.3 (0.8%)
1.2 (0.0%)
1.1 (6.6%)
1 (6.6%)
Full compliance (5th/12) Control gap (=2nd/12) Compensating controls (7th)
1.5 (96.7%)
1.4 (95.1%)
1.3 (94.3%)
1.2 (94.3%)
1.1 (84.4%)
1 (81.1%)
1.5 (3.4%)
1.4 (6.3%)
1.3 (5.2%)
1.2 (5.2%)
1.1 (5.1%)
1 (5.1%)
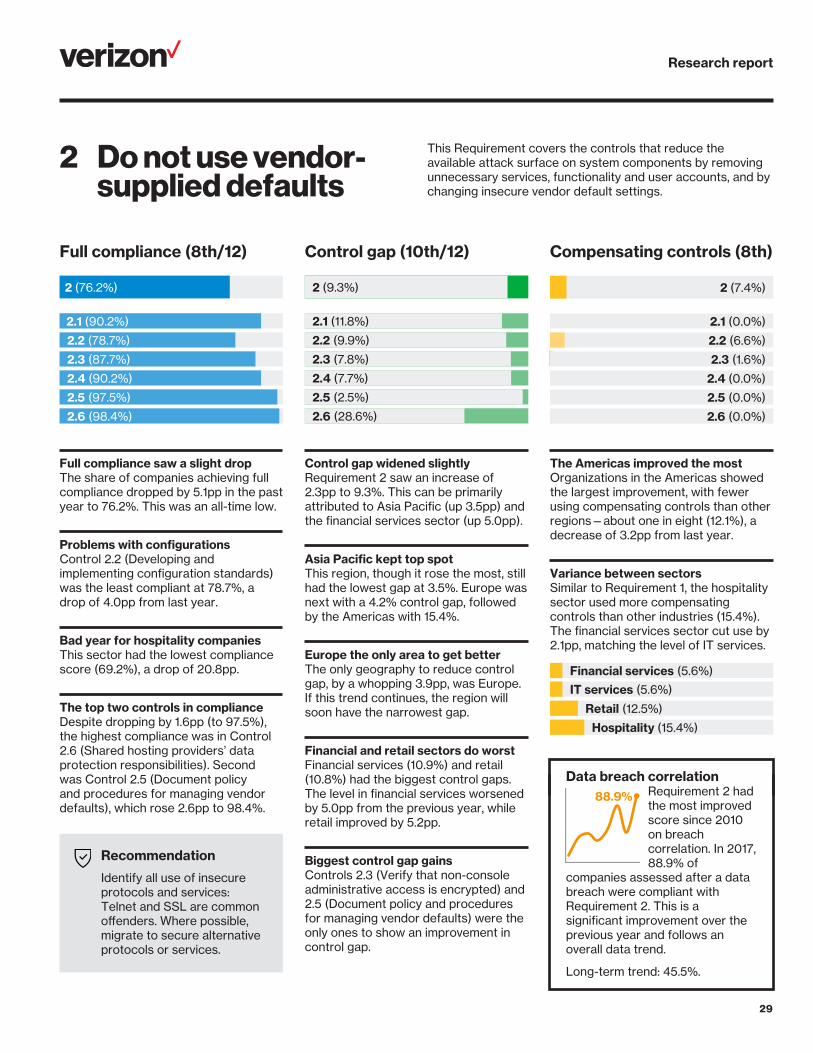
Research report
29
2 Do not use vendor-supplied defaults
This Requirement covers the controls that reduce the available attack surface on system components by removing unnecessary services, functionality and user accounts, and by changing insecure vendor default settings.
Full compliance saw a slight dropThe share of companies achieving full compliance dropped by 5.1pp in the past year to 76.2%. This was an all-time low.
Problems with configurationsControl 2.2 (Developing and implementing configuration standards) was the least compliant at 78.7%, a drop of 4.0pp from last year.
Bad year for hospitality companiesThis sector had the lowest compliance score (69.2%), a drop of 20.8pp.
The top two controls in complianceDespite dropping by 1.6pp (to 97.5%), the highest compliance was in Control 2.6 (Shared hosting providers’ data protection responsibilities). Second was Control 2.5 (Document policy and procedures for managing vendor defaults), which rose 2.6pp to 98.4%.
Recommendation
Identify all use of insecure protocols and services: Telnet and SSL are common offenders. Where possible, migrate to secure alternative protocols or services.
Control gap widened slightlyRequirement 2 saw an increase of 2.3pp to 9.3%. This can be primarily attributed to Asia Pacific (up 3.5pp) and the financial services sector (up 5.0pp).
Asia Pacific kept top spotThis region, though it rose the most, still had the lowest gap at 3.5%. Europe was next with a 4.2% control gap, followed by the Americas with 15.4%.
Europe the only area to get betterThe only geography to reduce control gap, by a whopping 3.9pp, was Europe. If this trend continues, the region will soon have the narrowest gap.
Financial and retail sectors do worstFinancial services (10.9%) and retail (10.8%) had the biggest control gaps. The level in financial services worsened by 5.0pp from the previous year, while retail improved by 5.2pp.
Biggest control gap gainsControls 2.3 (Verify that non-console administrative access is encrypted) and 2.5 (Document policy and procedures for managing vendor defaults) were the only ones to show an improvement in control gap.
The Americas improved the mostOrganizations in the Americas showed the largest improvement, with fewer using compensating controls than other regions—about one in eight (12.1%), a decrease of 3.2pp from last year.
Variance between sectorsSimilar to Requirement 1, the hospitality sector used more compensating controls than other industries (15.4%). The financial services sector cut use by 2.1pp, matching the level of IT services.
Data breach correlation Requirement 2 had
the most improved score since 2010 on breach correlation. In 2017, 88.9% of
companies assessed after a data breach were compliant with Requirement 2. This is a significant improvement over the previous year and follows an overall data trend.
Long-term trend: 45.5%.
Retail (12.5%)
Financial services (5.6%)
IT services (5.6%)
Hospitality (15.4%)
88.9%
Full compliance (8th/12) Control gap (10th/12) Compensating controls (8th)
2.5 (97.5%)
2.6 (98.4%)
2.4 (90.2%)
2.3 (87.7%)
2.2 (78.7%)
2.1 (90.2%)
2 (76.2%)
2.5 (2.5%)
2.6 (28.6%)
2.4 (7.7%)
2.3 (7.8%)
2.2 (9.9%)
2.1 (11.8%)
2 (9.3%)
2.5 (0.0%)
2.6 (0.0%)
2.4 (0.0%)
2.3 (1.6%)
2.2 (6.6%)
2.1 (0.0%)
2 (7.4%)

Research report
30
3 Protect stored cardholder data
This Requirement covers the storage of cardholder data and sensitive authentication data. It states that all stored data must be protected using appropriate methods, and must be deleted once no longer needed.
Europe showed the biggest gainDuring 2017, Europe improved the most, by 11.4pp, while Asia Pacific dropped by 8.3pp (from 100.0%), and the Americas improved by a slight 2.8pp.
IT services led the pack More firms in the IT services industry achieved full compliance than other industries. Retail came in second. Hospitality and financial services were within 2.6pp of each other and the most challenged in maintaining full compliance.
Financial services (71.8%)
Hospitality (69.2%)
Retail (87.5%)
IT services (94.4%)
Recommendation
Conduct frequent automated data discovery scans across the environment. Drive continuous improvement in the consistency with which staff follow policies and procedures.
Slight increase overallCompared to 2016 this Requirement’s control gap was 1.2pp worse at 10.4%.
2015 (9.2%)
2017 (10.4%)
2016 (9.3%)
Financial services showed increaseThe financial services sector posted the greatest increase in control gap, up 6.5pp to 14.1%. Requirements 3.4 (Render PAN unreadable) and 3.6 (Key management processes) drove this year-over-year change – see right.
Retail (-15.1pp), hospitality (-4.8pp), and IT services (-4.8pp) all narrowed their control gaps.
Regional performanceAsia Pacific led (+1.9pp) followed by Europe (-3.2pp), with the Americas lagging way behind (+6.5pp).
Americas (17.0%)
Europe (5.2%)
Asia Pacific (3.9%)
Use of compensating controls upAbout one in seven (14.8%) companies relied on compensating controls to meet Requirement 3. From 19.7% in financial to just 5.6% in IT services.
Highest use in 3.4At 11.5%, use of compensating controls for Control 3.4 (Render PAN unreadable) was more than double any other control in Requirement 3.
Acquirers and issuers have a business need to access CHD at high speeds and on a continual basis. Encrypting or otherwise rendering this data unreadable in storage causes processing delays that impact businesses downstream, exponentially. Hence the high use of compensating controls, in this group, for 3.4.
Data breach correlation 55.6% of
companies were compliant with Requirement 3 following a breach. This number has
been steadily increasing, with a noticeable dip to 9% in 2013.
Long-term trend: 27.1%
Hospitality (3.1%)
Retail (7.9%)
Financial services (14.1%)
IT services (1.0%)
55.6%
Full compliance (6th/12) Control gap (11th/12) Compensating controls (11th)
3.5 (88.5%)
3.6 (86.1%)
3.4 (86.9%)
3.3 (92.6%)
3.2 (88.5%)
3.1 (88.5%)
3 (77.9%)
3.6 (93.4%)
3.5 (12.8%)
3.6 (11.0%)
3.4 (11.4%)
3.3 (7.1%)
3.2 (8.3%)
3.1 (10.3%)
3 (10.4%)
3.7 (7.8%)
3.5 (4.1%)
3.6 (4.1%)
3.4 (11.5%)
3.3 (0.0%)
3.2 (1.6%)
3.1 (1.6%)
3 (14.8%)
3.7 (0.0%)
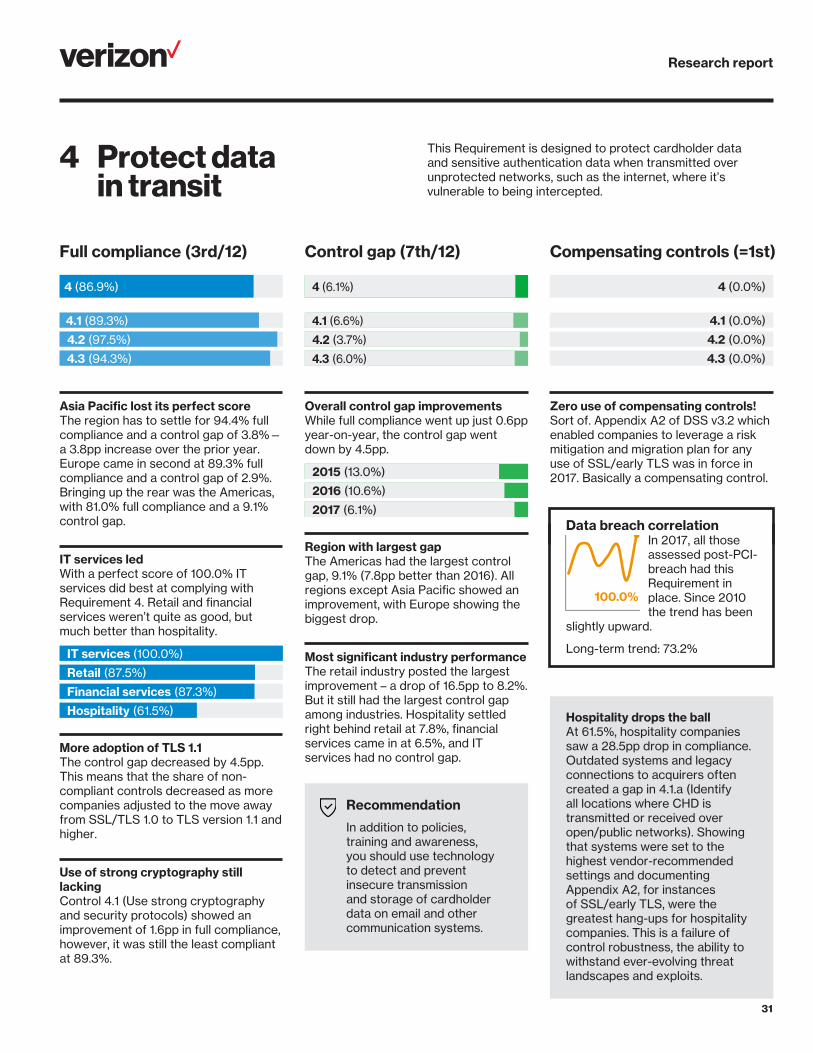
Research report
31
4 Protect data in transit
This Requirement is designed to protect cardholder data and sensitive authentication data when transmitted over unprotected networks, such as the internet, where it’s vulnerable to being intercepted.
Asia Pacific lost its perfect scoreThe region has to settle for 94.4% full compliance and a control gap of 3.8%—a 3.8pp increase over the prior year. Europe came in second at 89.3% full compliance and a control gap of 2.9%. Bringing up the rear was the Americas, with 81.0% full compliance and a 9.1% control gap.
IT services ledWith a perfect score of 100.0% IT services did best at complying with Requirement 4. Retail and financial services weren’t quite as good, but much better than hospitality.
Financial services (87.3%)
Hospitality (61.5%)
Retail (87.5%)
IT services (100.0%)
More adoption of TLS 1.1The control gap decreased by 4.5pp. This means that the share of non-compliant controls decreased as more companies adjusted to the move away from SSL/TLS 1.0 to TLS version 1.1 and higher.
Use of strong cryptography still lacking Control 4.1 (Use strong cryptography and security protocols) showed an improvement of 1.6pp in full compliance, however, it was still the least compliant at 89.3%.
Overall control gap improvementsWhile full compliance went up just 0.6pp year-on-year, the control gap went down by 4.5pp.
2017 (6.1%)
2016 (10.6%)
2015 (13.0%)
Region with largest gapThe Americas had the largest control gap, 9.1% (7.8pp better than 2016). All regions except Asia Pacific showed an improvement, with Europe showing the biggest drop.
Most significant industry performance The retail industry posted the largest improvement – a drop of 16.5pp to 8.2%. But it still had the largest control gap among industries. Hospitality settled right behind retail at 7.8%, financial services came in at 6.5%, and IT services had no control gap.
Recommendation
In addition to policies, training and awareness, you should use technology to detect and prevent insecure transmission and storage of cardholder data on email and other communication systems.
Zero use of compensating controls!Sort of. Appendix A2 of DSS v3.2 which enabled companies to leverage a risk mitigation and migration plan for any use of SSL/early TLS was in force in 2017. Basically a compensating control.
Data breach correlation In 2017, all those
assessed post-PCI-breach had this Requirement in place. Since 2010 the trend has been
slightly upward.
Long-term trend: 73.2%
Hospitality drops the ball At 61.5%, hospitality companies saw a 28.5pp drop in compliance. Outdated systems and legacy connections to acquirers often created a gap in 4.1.a (Identify all locations where CHD is transmitted or received over open/public networks). Showing that systems were set to the highest vendor-recommended settings and documenting Appendix A2, for instances of SSL/early TLS, were the greatest hang-ups for hospitality companies. This is a failure of control robustness, the ability to withstand ever-evolving threat landscapes and exploits.
100.0%
4.3 (0.0%)
4.2 (0.0%)
4.1 (0.0%)
4 (0.0%)
Full compliance (3rd/12) Control gap (7th/12) Compensating controls (=1st)
4.3 (94.3%)
4.2 (97.5%)
4.1 (89.3%)
4 (86.9%)
4.3 (6.0%)
4.2 (3.7%)
4.1 (6.6%)
4 (6.1%)
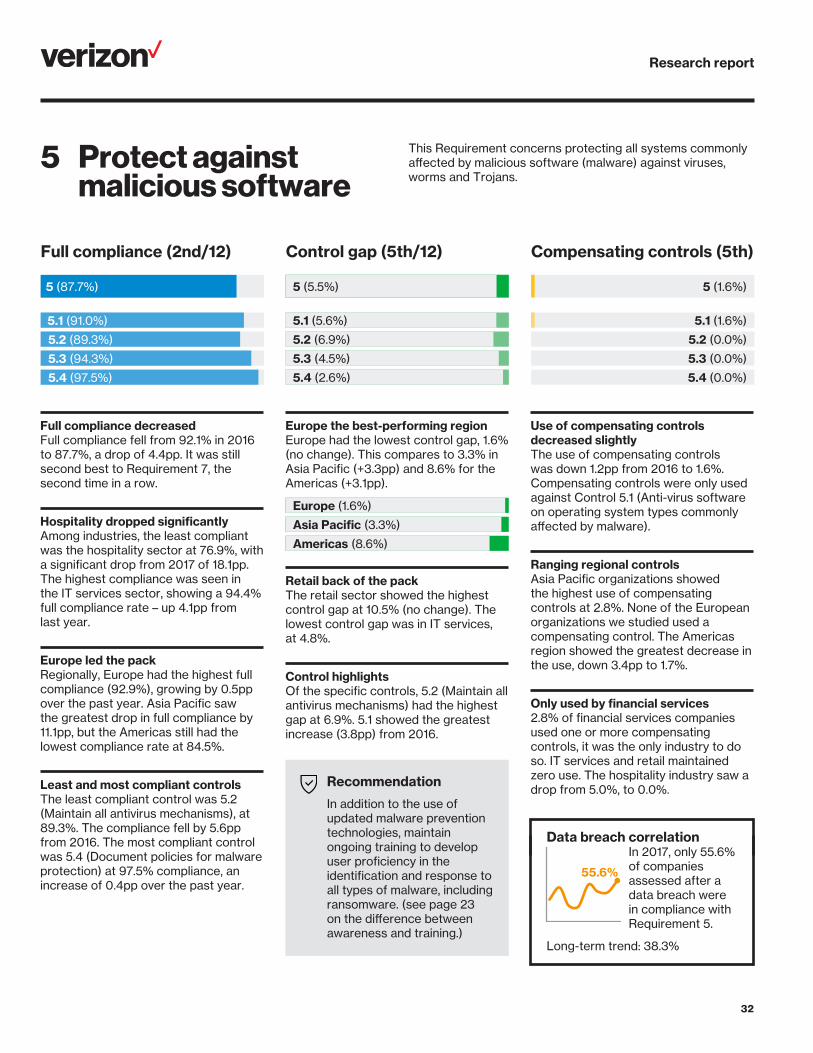
Research report
32
5 Protect against malicious software
This Requirement concerns protecting all systems commonly affected by malicious software (malware) against viruses, worms and Trojans.
Full compliance decreased Full compliance fell from 92.1% in 2016 to 87.7%, a drop of 4.4pp. It was still second best to Requirement 7, the second time in a row.
Hospitality dropped significantly Among industries, the least compliant was the hospitality sector at 76.9%, with a significant drop from 2017 of 18.1pp. The highest compliance was seen in the IT services sector, showing a 94.4% full compliance rate – up 4.1pp from last year.
Europe led the pack Regionally, Europe had the highest full compliance (92.9%), growing by 0.5pp over the past year. Asia Pacific saw the greatest drop in full compliance by 11.1pp, but the Americas still had the lowest compliance rate at 84.5%.
Least and most compliant controls The least compliant control was 5.2 (Maintain all antivirus mechanisms), at 89.3%. The compliance fell by 5.6pp from 2016. The most compliant control was 5.4 (Document policies for malware protection) at 97.5% compliance, an increase of 0.4pp over the past year.
Europe the best-performing regionEurope had the lowest control gap, 1.6% (no change). This compares to 3.3% in Asia Pacific (+3.3pp) and 8.6% for the Americas (+3.1pp).
Americas (8.6%)
Asia Pacific (3.3%)
Europe (1.6%)
Retail back of the packThe retail sector showed the highest control gap at 10.5% (no change). The lowest control gap was in IT services, at 4.8%.
Control highlightsOf the specific controls, 5.2 (Maintain all antivirus mechanisms) had the highest gap at 6.9%. 5.1 showed the greatest increase (3.8pp) from 2016.
Recommendation
In addition to the use of updated malware prevention technologies, maintain ongoing training to develop user proficiency in the identification and response to all types of malware, including ransomware. (see page 23 on the difference between awareness and training.)
Use of compensating controls decreased slightly The use of compensating controls was down 1.2pp from 2016 to 1.6%. Compensating controls were only used against Control 5.1 (Anti-virus software on operating system types commonly affected by malware).
Ranging regional controlsAsia Pacific organizations showed the highest use of compensating controls at 2.8%. None of the European organizations we studied used a compensating control. The Americas region showed the greatest decrease in the use, down 3.4pp to 1.7%.
Only used by financial services2.8% of financial services companies used one or more compensating controls, it was the only industry to do so. IT services and retail maintained zero use. The hospitality industry saw a drop from 5.0%, to 0.0%.
Data breach correlation In 2017, only 55.6%
of companies assessed after a data breach were in compliance with Requirement 5.
Long-term trend: 38.3%
55.6%
Full compliance (2nd/12) Control gap (5th/12) Compensating controls (5th)
5.4 (97.5%)
5.3 (94.3%)
5.2 (89.3%)
5.1 (91.0%)
5 (87.7%)
5.4 (2.6%)
5.3 (4.5%)
5.2 (6.9%)
5.1 (5.6%)
5 (5.5%)
5.1 (1.6%)
5 (1.6%)
5.4 (0.0%)
5.3 (0.0%)
5.2 (0.0%)
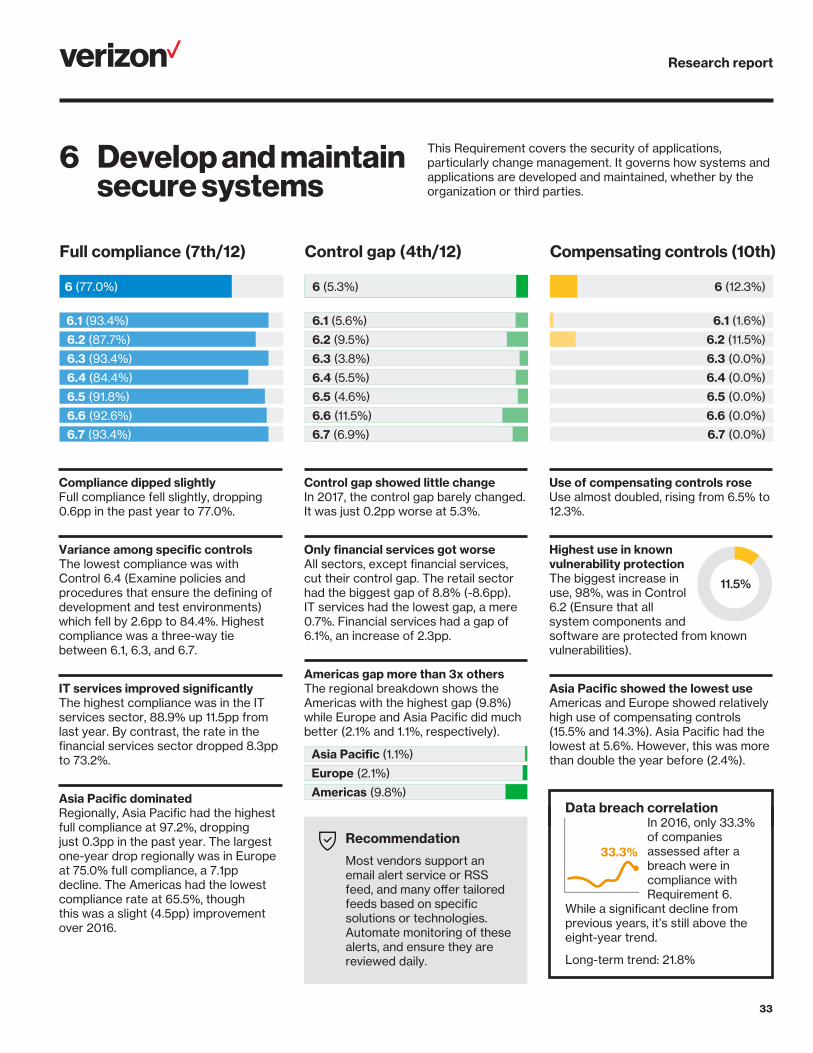
Research report
33
6 Develop and maintain secure systems
This Requirement covers the security of applications, particularly change management. It governs how systems and applications are developed and maintained, whether by the organization or third parties.
Compliance dipped slightlyFull compliance fell slightly, dropping 0.6pp in the past year to 77.0%.
Variance among specific controlsThe lowest compliance was with Control 6.4 (Examine policies and procedures that ensure the defining of development and test environments) which fell by 2.6pp to 84.4%. Highest compliance was a three-way tie between 6.1, 6.3, and 6.7.
IT services improved significantlyThe highest compliance was in the IT services sector, 88.9% up 11.5pp from last year. By contrast, the rate in the financial services sector dropped 8.3pp to 73.2%.
Asia Pacific dominatedRegionally, Asia Pacific had the highest full compliance at 97.2%, dropping just 0.3pp in the past year. The largest one-year drop regionally was in Europe at 75.0% full compliance, a 7.1pp decline. The Americas had the lowest compliance rate at 65.5%, though this was a slight (4.5pp) improvement over 2016.
Control gap showed little changeIn 2017, the control gap barely changed. It was just 0.2pp worse at 5.3%.
Only financial services got worseAll sectors, except financial services, cut their control gap. The retail sector had the biggest gap of 8.8% (-8.6pp). IT services had the lowest gap, a mere 0.7%. Financial services had a gap of 6.1%, an increase of 2.3pp.
Americas gap more than 3x othersThe regional breakdown shows the Americas with the highest gap (9.8%) while Europe and Asia Pacific did much better (2.1% and 1.1%, respectively).
Americas (9.8%)
Europe (2.1%)
Asia Pacific (1.1%)
Recommendation
Most vendors support an email alert service or RSS feed, and many offer tailored feeds based on specific solutions or technologies. Automate monitoring of these alerts, and ensure they are reviewed daily.
Use of compensating controls roseUse almost doubled, rising from 6.5% to 12.3%.
Highest use in known vulnerability protection The biggest increase in use, 98%, was in Control 6.2 (Ensure that all system components and software are protected from known vulnerabilities).
Asia Pacific showed the lowest use Americas and Europe showed relatively high use of compensating controls (15.5% and 14.3%). Asia Pacific had the lowest at 5.6%. However, this was more than double the year before (2.4%).
Data breach correlation In 2016, only 33.3%
of companies assessed after a breach were in compliance with Requirement 6.
While a significant decline from previous years, it’s still above the eight-year trend.
Long-term trend: 21.8%
11.5%
33.3%
Full compliance (7th/12) Control gap (4th/12) Compensating controls (10th)
6.5 (0.0%)
6.6 (0.0%)
6.4 (0.0%)
6.3 (0.0%)
6.2 (11.5%)
6.1 (1.6%)
6 (12.3%)
6.7 (0.0%)
6.5 (91.8%)
6.6 (92.6%)
6.4 (84.4%)
6.3 (93.4%)
6.2 (87.7%)
6.1 (93.4%)
6 (77.0%)
6.7 (93.4%)
6.5 (4.6%)
6.6 (11.5%)
6.4 (5.5%)
6.3 (3.8%)
6.2 (9.5%)
6.1 (5.6%)
6 (5.3%)
6.7 (6.9%)

Research report
34
Full compliance dropped below 90%Requirement 7 had the highest level of compliance. However, in 2017 the proportion of companies able to demonstrate full compliance actually fell by 5.0pp to 88.5%.
Open hospitality – not restricted The lowest full compliance among industries was in hospitality at 84.6%. This was 10.4pp lower than the highest full compliance rate, which was found in IT services (94.4%). In the financial and retail industries, compliance levels fell somewhere in between.
Large variance between regionsRegionally, Asia Pacific led the field, with 97.2% of companies achieving full compliance at iRoC.
Americas (79.3%)
Europe (96.4%)
Asia Pacific (97.2%)
After increasing by 6.7pp (the improved of all regions), Europe followed just 0.8% behind this high standard. The Americas region brought up the rear at 79.3%, a 12.2pp drop year over year.
Control gap widened significantlyAfter seeing a significant improvement last year, this Requirement’s control gap leapt back up close to its 2015 level.
2017 (5.7%)
2016 (1.4%)
2015 (6.0%)
Financial services had a bad yearThe financial services sector posted the greatest increase in control gap. It was up 6.6pp from the previous year, resulting in a 7.7% gap.
Retail and IT services stagnantBoth retail (4.5%) and IT services (0.6%) showed the same control gap as 2016.
Europe had the lowest control gapCompanies in Europe showed a decrease of 1.7pp and the region now has a control gap of just 0.4%. Asia Pacific rose from 0.0% to 2.5%, putting Europe in the lead.
Compensating controls not requiredNo companies used a compensating control for Requirement 7, giving it an overall perfect score of 0.0%.
Recommendation
Establish access matrices mapping access requirements to job roles. These form the basis of effective role-based access control. Additional permissions should only be added with appropriate approvals. Any exceptions for temporary escalation of privileges must be managed, recorded and tracked.
Data breach correlation In 2017, just over
half of organizations (55.6%) assessed after a data breach were in compliance
with Requirement 7 at the time of the breach. This was an improvement over previous years.
Long-term trend: 30.1%
55.6%
7 Restrict access This Requirement specifies the processes and controls that should restrict each user’s access rights to the minimum they need to perform their duties on a “need to know” basis.
7.3 (0.0%)
7.2 (0.0%)
7.1 (0.0%)
7 (0.0%)
Full compliance (1st/12) Control gap (6th/12) Compensating controls (=1st)
7.3 (95.1%)
7.2 (93.4%)
7.1 (91.0%)
7 (88.5%)
7.3 (5.1%)
7.2 (5.8%)
7.1 (5.8%)
7 (5.7%)
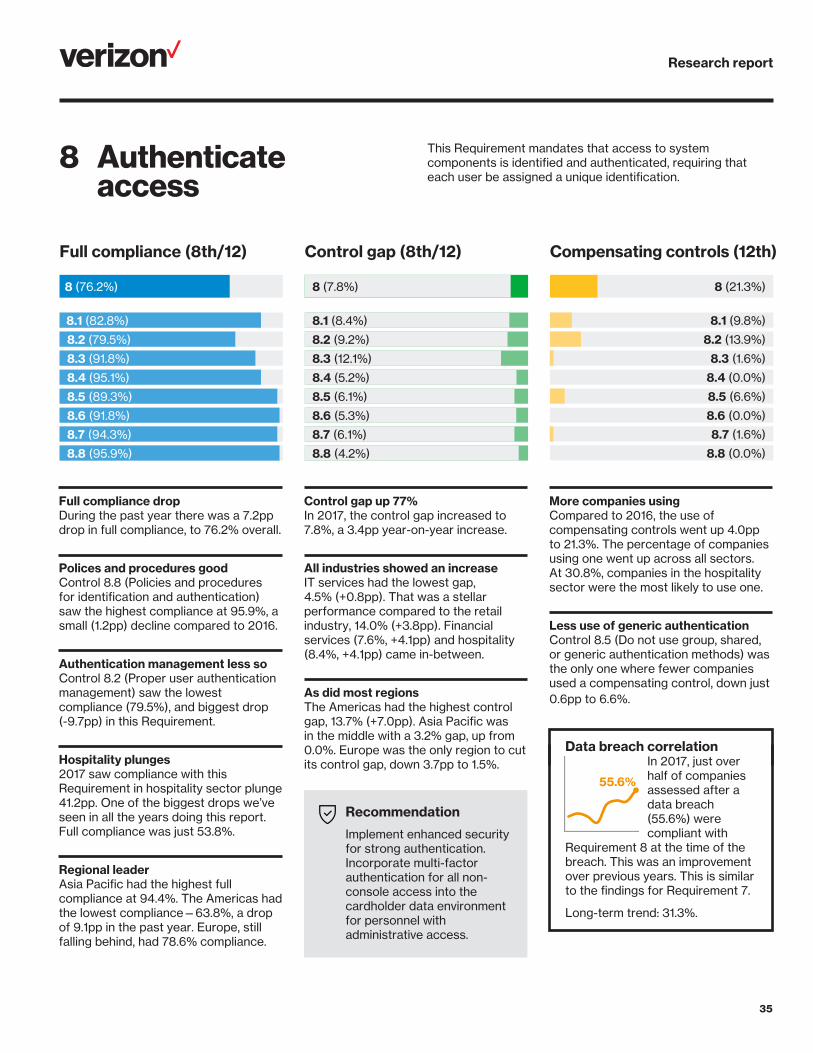
Research report
35
8 Authenticate access
This Requirement mandates that access to system components is identified and authenticated, requiring that each user be assigned a unique identification.
Full compliance dropDuring the past year there was a 7.2pp drop in full compliance, to 76.2% overall.
Polices and procedures goodControl 8.8 (Policies and procedures for identification and authentication) saw the highest compliance at 95.9%, a small (1.2pp) decline compared to 2016.
Authentication management less soControl 8.2 (Proper user authentication management) saw the lowest compliance (79.5%), and biggest drop (-9.7pp) in this Requirement.
Hospitality plunges2017 saw compliance with this Requirement in hospitality sector plunge 41.2pp. One of the biggest drops we’ve seen in all the years doing this report. Full compliance was just 53.8%.
Regional leaderAsia Pacific had the highest full compliance at 94.4%. The Americas had the lowest compliance—63.8%, a drop of 9.1pp in the past year. Europe, still falling behind, had 78.6% compliance.
Control gap up 77%In 2017, the control gap increased to 7.8%, a 3.4pp year-on-year increase.
All industries showed an increaseIT services had the lowest gap, 4.5% (+0.8pp). That was a stellar performance compared to the retail industry, 14.0% (+3.8pp). Financial services (7.6%, +4.1pp) and hospitality (8.4%, +4.1pp) came in-between.
As did most regionsThe Americas had the highest control gap, 13.7% (+7.0pp). Asia Pacific was in the middle with a 3.2% gap, up from 0.0%. Europe was the only region to cut its control gap, down 3.7pp to 1.5%.
Recommendation
Implement enhanced security for strong authentication. Incorporate multi-factor authentication for all non-console access into the cardholder data environment for personnel with administrative access.
More companies usingCompared to 2016, the use of compensating controls went up 4.0pp to 21.3%. The percentage of companies using one went up across all sectors. At 30.8%, companies in the hospitality sector were the most likely to use one.
Less use of generic authentication Control 8.5 (Do not use group, shared, or generic authentication methods) was the only one where fewer companies used a compensating control, down just 0.6pp to 6.6%.
Data breach correlation In 2017, just over
half of companies assessed after a data breach (55.6%) were compliant with
Requirement 8 at the time of the breach. This was an improvement over previous years. This is similar to the findings for Requirement 7.
Long-term trend: 31.3%.
55.6%
Full compliance (8th/12) Control gap (8th/12) Compensating controls (12th)
8.7 (6.1%)
8.8 (4.2%)
8.5 (6.1%)
8.6 (5.3%)
8.4 (5.2%)
8.3 (12.1%)
8.2 (9.2%)
8.1 (8.4%)
8 (7.8%)
8.5 (89.3%)
8.6 (91.8%)
8.4 (95.1%)
8.3 (91.8%)
8.2 (79.5%)
8.1 (82.8%)
8 (76.2%)
8.7 (94.3%)
8.8 (95.9%)
8 (21.3%)
8.5 (6.6%)
8.6 (0.0%)
8.4 (0.0%)
8.3 (1.6%)
8.2 (13.9%)
8.1 (9.8%)
8.7 (1.6%)
8.8 (0.0%)

Research report
36
9 Control physical access
This Requirement stipulates that organizations must restrict physical access to all systems within the DSS scope and all hard copies of cardholder data.
Minor downward shiftThis past year saw a slight drop (2.1pp) in full compliance with this Requirement.
Americas saw improvementThe Americas was the only region to show an increase (3.0pp), but it still had the lowest compliance level at 77.6%.
Asia Pacific and Europe dropWhile Asia Pacific had the highest compliance (91.7%), the region dropped by 5.9pp. Europe, 82.1%, also dropped by 5.0pp over the last year.
Visitor authorization and access lagA couple of years we saw near perfect compliance with Controls 9.3 and 9.4 which govern physical access and procedures to identify visitors. In 2017, both dropped again, falling to 92.6% and 91.0%. Two of the three lowest figures were within this Requirement.
Big shifts by industryHospitality had the lowest compliance at 53.8%, a drop of 26.2pp from 2016. By contrast, IT services had 94.4% full compliance, a 10.6pp increase.
Best control gapDespite a small (0.5pp) increase from 2016, at 4.9% this Requirement had the smallest control gap in our study.
Retail and IT services cut control gapRetail reduced its control gap by 1.4pp to 12.6%. IT services had the smallest gap of 0.2%, down from 5.2% in 2016.
Other sectors show increaseThe hospitality sector saw a 2.9pp increase, in control gap, to 6.7%. The control gap in financial services went up 2.6pp to 4.0%.
Europe closed the gapEurope was the only region to demonstrate a narrower control gap, decreasing by 4.4pp to just 1.1%.
Asia Pacific lost top spotThe Asia Pacific region saw a 1.8pp increase in its control gap in 2017, putting it at 1.9%. Combined with Europe’s downward trend (-4.4pp), this knocked Asia Pacific off the lead.
A niche proposition The only Controls where they were used were 9.1 (Verify the existence of physical security controls) and 9.10 (Examine documentation and interview personnel to verify security policies). And retailers in the Americas was the only group to rely on compensating controls.
Recommendation
Use “Skimming Prevention guidance” to help develop effective training and policies for identifying tampering as part of existing start/end-of-day processes.
Data breach correlation All companies we
assessed after a breach in 2017 were compliant with Requirement 9, a big leap from 2016.
Long-term trend: 62.7%.
100.0%
Full compliance (4th/12) Control gap (1st/12) Compensating controls (=3rd)
9.5 (97.5%)
9.6 (97.5%)
9.4 (91.0%)
9.3 (92.6%)
9.2 (95.1%)
9.1 (91.8%)
9 (82.8%)
9.9 (93.4%)
9.10 (91.8%)
9.8 (97.5%)
9.7 (97.5%)
9.5 (3.8%)
9.6 (4.1%)
9.4 (4.6%)
9.3 (5.1%)
9.2 (3.4%)
9.1 (3.8%)
9 (4.9%)
9.9 (21.8%)
9.10 (3.8%)
9.8 (4.1%)
9.7 (5.1%)
9.5 (0.0%)
9.6 (0.0%)
9.4 (0.0%)
9.3 (0.0%)
9.2 (0.0%)
9.1 (0.8%)
9 (0.8%)
9.9 (0.0%)
9.10 (0.8%)
9.8 (0.0%)
9.7 (0.0%)

Research report
37
10 Track and monitor access
This Requirement covers the creation and protection of information that can be used for the tracking and monitoring of access to all systems in the DSS scope and synchronization of all system clocks.
Full compliance dropped significantlyDuring the past year, there was a 10.5pp decrease, resulting in only 73.0% of companies being compliant with this Requirement.
Major fall in Control 10.2 complianceThis year saw significantly lower compliance with Control 10.2 (Automated audit trails to reconstruct events). It fell 11.0pp to 80.3%.
Hospitality dipped; IT services roseThe hospitality sector was the least compliant industry at 61.5%—a drop of 28.5pp compared with 2016, implying a decrease in vigilance and attention to access control. IT services, on the other hand, rose 8.2pp to 88.9% full compliance.
All regions went backwardNo region showed an improvement in compliance this year. Europe saw the greatest decrease, down 14.2pp to 67.9%.
Control gap widensThe control gap increased by 3.2pp from last year’s report.
IT services performed best—by farThe lowest control gap, just 0.5%, was in IT services. All other sectors saw an increase, each to more than 8.0%.
The Americas had the largest gapAt 13.3%, up 3.2pp, the Americas had a much higher control gap than the other regions. Europe and Asia Pacific kept their control gap below 5.0%.
Control 10.8 spikes upThere was a huge increase (30.5pp) in Control 10.8 (Timely reporting of control system failures). At 35.7%, this was by far the highest control gap in 2017.
In scope of PCI, companies cannot avoid the fundamental relationship of an always-current asset list/system inventory with the logging, auditing, and monitoring of the critical system components.
Use up nearly 60%The proportion of companies using a compensating control went up 2.1pp.
Control 10.5 leads the field10.5 (Secure audit trails so they cannot be altered) was the most frequently compensated control at 4.1%.
Asia Pacific goes cold turkeyFrom 2.4% in 2016, use in Asia Pacific fell to 0.0%. It was the only region to show a drop in use.
Used mainly in retail and hospitalityUse in retail leapt from 0.0% to 18.8%. Hospitality rose 5.4pp to 15.4%.
Data breach correlation In 2017, only 11.1%
of companies assessed after a data breach were in compliance with Requirement 10.
This is a slight improvement, but overall, the trend is downward.
Long-term trend: 8.4% Americas (63.8%)
Europe (67.9%)
Asia Pacific (91.7%)
<
<
<
11.1%
Full compliance (10th/12) Control gap (9th/12) Compensating controls (6th)
10.5 (85.2%)
10.6 (88.5%)
10.4 (91.0%)
10.3 (88.5%)
10.2 (80.3%)
10.1 (91.8%)
10 (73.0%)
10.9 (92.6%)
10.8 (96.7%)
10.7 (92.6%)
10.5 (8.4%)
10.6 (8.3%)
10.4 (6.6%)
10.3 (9.7%)
10.2 (8.5%)
10.1 (8.6%)
10 (8.5%)
10.9 (7.7%)
10.8 (35.7%)
10.7 (5.8%)
10.5 (4.1%)
10.6 (0.8%)
10.4 (0.0%)
10.3 (1.6%)
10.2 (1.6%)
10.1 (0.8%)
10 (5.7%)
10.9 (0.0%)
10.8 (0.0%)
10.7 (0.8%)
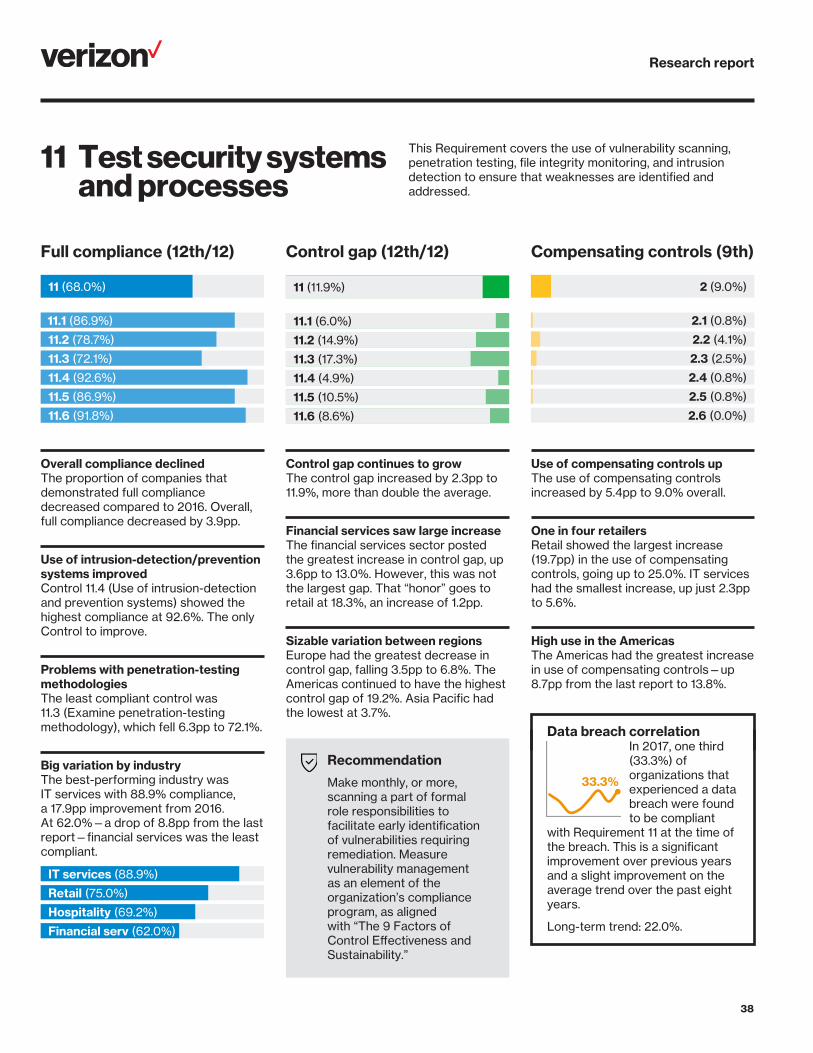
Research report
38
11 Test security systems and processes
This Requirement covers the use of vulnerability scanning, penetration testing, file integrity monitoring, and intrusion detection to ensure that weaknesses are identified and addressed.
Overall compliance declinedThe proportion of companies that demonstrated full compliance decreased compared to 2016. Overall, full compliance decreased by 3.9pp.
Use of intrusion-detection/prevention systems improved Control 11.4 (Use of intrusion-detection and prevention systems) showed the highest compliance at 92.6%. The only Control to improve.
Problems with penetration-testing methodologies The least compliant control was 11.3 (Examine penetration-testing methodology), which fell 6.3pp to 72.1%.
Big variation by industryThe best-performing industry was IT services with 88.9% compliance, a 17.9pp improvement from 2016. At 62.0%—a drop of 8.8pp from the last report—financial services was the least compliant.
Hospitality (69.2%)
Financial serv (62.0%)
Retail (75.0%)
IT services (88.9%)
Control gap continues to growThe control gap increased by 2.3pp to 11.9%, more than double the average.
Financial services saw large increaseThe financial services sector posted the greatest increase in control gap, up 3.6pp to 13.0%. However, this was not the largest gap. That “honor” goes to retail at 18.3%, an increase of 1.2pp.
Sizable variation between regionsEurope had the greatest decrease in control gap, falling 3.5pp to 6.8%. The Americas continued to have the highest control gap of 19.2%. Asia Pacific had the lowest at 3.7%.
Recommendation
Make monthly, or more, scanning a part of formal role responsibilities to facilitate early identification of vulnerabilities requiring remediation. Measure vulnerability management as an element of the organization’s compliance program, as aligned with “The 9 Factors of Control Effectiveness and Sustainability.”
Use of compensating controls upThe use of compensating controls increased by 5.4pp to 9.0% overall.
One in four retailersRetail showed the largest increase (19.7pp) in the use of compensating controls, going up to 25.0%. IT services had the smallest increase, up just 2.3pp to 5.6%.
High use in the AmericasThe Americas had the greatest increase in use of compensating controls—up 8.7pp from the last report to 13.8%.
Data breach correlation In 2017, one third
(33.3%) of organizations that experienced a data breach were found to be compliant
with Requirement 11 at the time of the breach. This is a significant improvement over previous years and a slight improvement on the average trend over the past eight years.
Long-term trend: 22.0%.
33.3%
Full compliance (12th/12) Control gap (12th/12) Compensating controls (9th)
11.5 (86.9%)
11.6 (91.8%)
11.4 (92.6%)
11.3 (72.1%)
11.2 (78.7%)
11.1 (86.9%)
11 (68.0%)
11.5 (10.5%)
11.6 (8.6%)
11.4 (4.9%)
11.3 (17.3%)
11.2 (14.9%)
11.1 (6.0%)
11 (11.9%)
2.5 (0.8%)
2.6 (0.0%)
2.4 (0.8%)
2.3 (2.5%)
2.2 (4.1%)
2.1 (0.8%)
2 (9.0%)
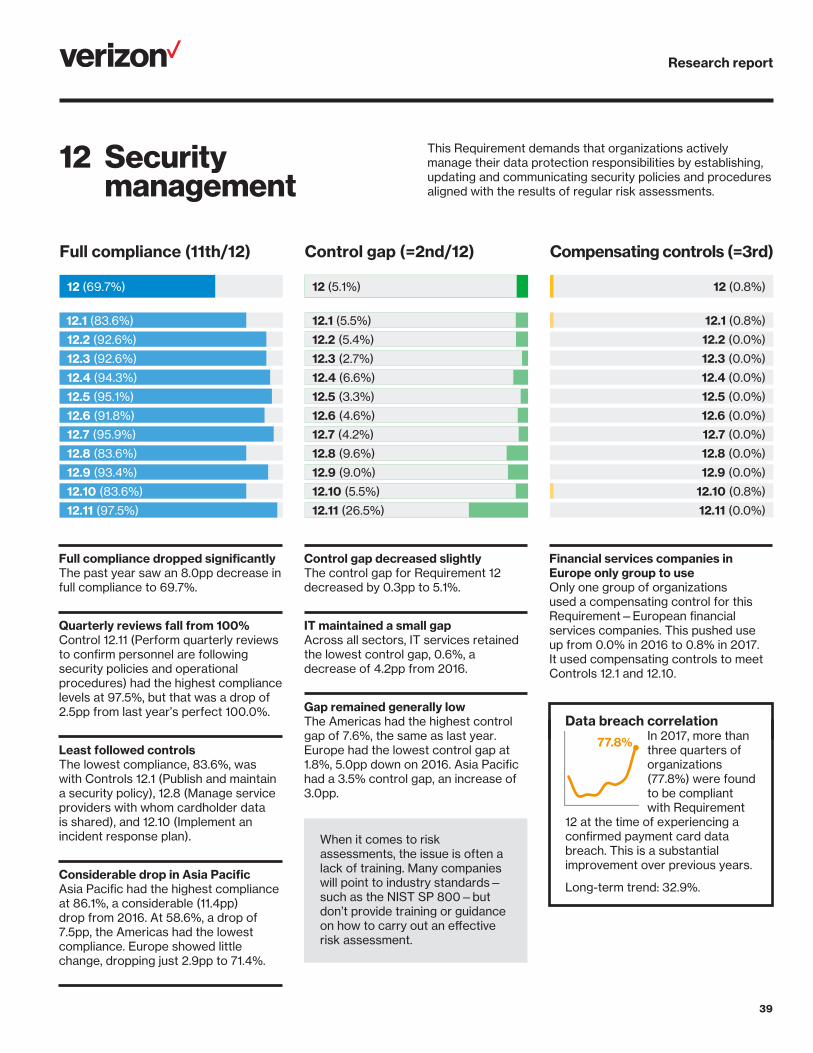
Research report
39
12 Security management
This Requirement demands that organizations actively manage their data protection responsibilities by establishing, updating and communicating security policies and procedures aligned with the results of regular risk assessments.
Full compliance dropped significantlyThe past year saw an 8.0pp decrease in full compliance to 69.7%.
Quarterly reviews fall from 100%Control 12.11 (Perform quarterly reviews to confirm personnel are following security policies and operational procedures) had the highest compliance levels at 97.5%, but that was a drop of 2.5pp from last year’s perfect 100.0%.
Least followed controlsThe lowest compliance, 83.6%, was with Controls 12.1 (Publish and maintain a security policy), 12.8 (Manage service providers with whom cardholder data is shared), and 12.10 (Implement an incident response plan).
Considerable drop in Asia PacificAsia Pacific had the highest compliance at 86.1%, a considerable (11.4pp) drop from 2016. At 58.6%, a drop of 7.5pp, the Americas had the lowest compliance. Europe showed little change, dropping just 2.9pp to 71.4%.
Control gap decreased slightly The control gap for Requirement 12 decreased by 0.3pp to 5.1%.
IT maintained a small gapAcross all sectors, IT services retained the lowest control gap, 0.6%, a decrease of 4.2pp from 2016.
Gap remained generally low The Americas had the highest control gap of 7.6%, the same as last year. Europe had the lowest control gap at 1.8%, 5.0pp down on 2016. Asia Pacific had a 3.5% control gap, an increase of 3.0pp.
When it comes to risk assessments, the issue is often a lack of training. Many companies will point to industry standards— such as the NIST SP 800—but don’t provide training or guidance on how to carry out an effective risk assessment.
Financial services companies in Europe only group to useOnly one group of organizations used a compensating control for this Requirement—European financial services companies. This pushed use up from 0.0% in 2016 to 0.8% in 2017. It used compensating controls to meet Controls 12.1 and 12.10.
Data breach correlation In 2017, more than
three quarters of organizations (77.8%) were found to be compliant with Requirement
12 at the time of experiencing a confirmed payment card data breach. This is a substantial improvement over previous years.
Long-term trend: 32.9%.
77.8%
Full compliance (11th/12) Control gap (=2nd/12) Compensating controls (=3rd)
12.5 (95.1%)
12.6 (91.8%)
12.4 (94.3%)
12.3 (92.6%)
12.2 (92.6%)
12.1 (83.6%)
12 (69.7%)
12.10 (83.6%)
12.11 (97.5%)
12.9 (93.4%)
12.8 (83.6%)
12.7 (95.9%)
12.5 (3.3%)
12.6 (4.6%)
12.4 (6.6%)
12.3 (2.7%)
12.2 (5.4%)
12.1 (5.5%)
12 (5.1%)
12.10 (5.5%)
12.11 (26.5%)
12.9 (9.0%)
12.8 (9.6%)
12.7 (4.2%)
12.5 (0.0%)
12.6 (0.0%)
12.4 (0.0%)
12.3 (0.0%)
12.2 (0.0%)
12.1 (0.8%)
12 (0.8%)
12.10 (0.8%)
12.11 (0.0%)
12.9 (0.0%)
12.8 (0.0%)
12.7 (0.0%)
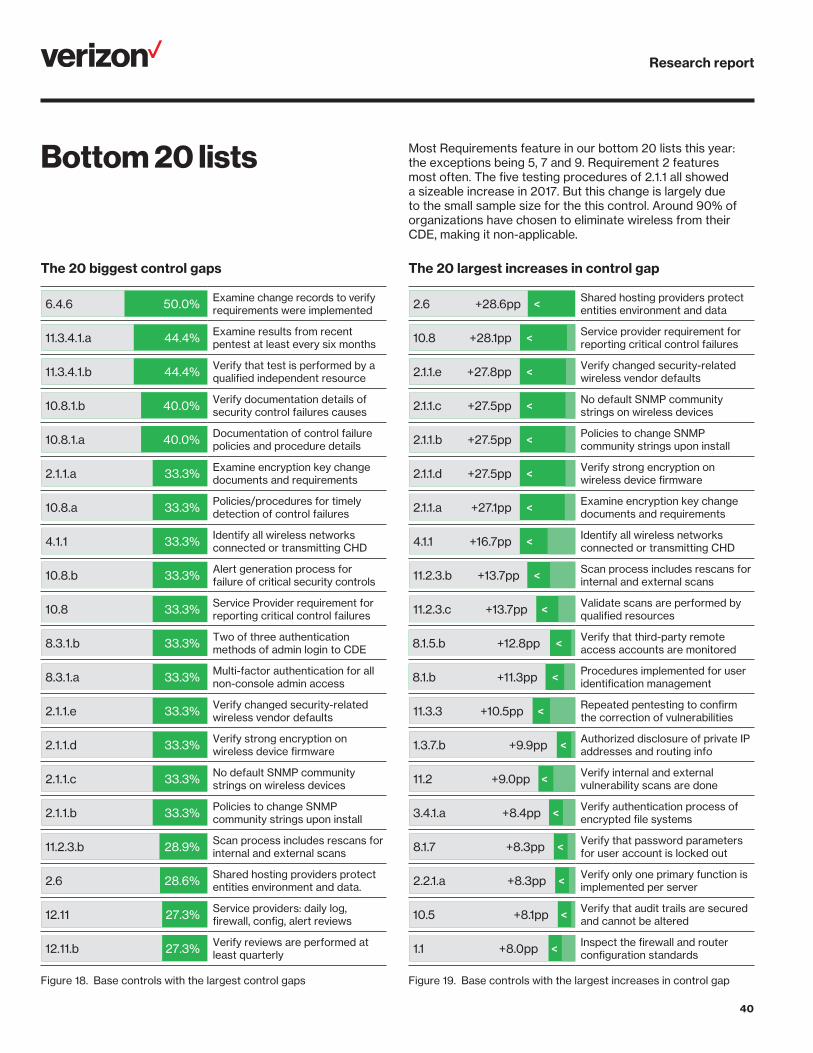
Research report
40
Bottom 20 lists Most Requirements feature in our bottom 20 lists this year: the exceptions being 5, 7 and 9. Requirement 2 features most often. The five testing procedures of 2.1.1 all showed a sizeable increase in 2017. But this change is largely due to the small sample size for the this control. Around 90% of organizations have chosen to eliminate wireless from their CDE, making it non-applicable.
The 20 biggest control gaps
50.0%6.4.6 Examine change records to verify requirements were implemented
44.4%11.3.4.1.a Examine results from recent pentest at least every six months
44.4%11.3.4.1.b Verify that test is performed by a qualified independent resource
40.0%10.8.1.b Verify documentation details of security control failures causes
40.0%10.8.1.a Documentation of control failure policies and procedure details
33.3%2.1.1.a Examine encryption key change documents and requirements
33.3%10.8.a Policies/procedures for timely detection of control failures
33.3%4.1.1 Identify all wireless networks connected or transmitting CHD
33.3%10.8.b Alert generation process for failure of critical security controls
33.3%10.8 Service Provider requirement for reporting critical control failures
33.3%8.3.1.b Two of three authentication methods of admin login to CDE
33.3%8.3.1.a Multi-factor authentication for all non-console admin access
33.3%2.1.1.e Verify changed security-related wireless vendor defaults
33.3%2.1.1.d Verify strong encryption on wireless device firmware
33.3%2.1.1.c No default SNMP community strings on wireless devices
33.3%2.1.1.b Policies to change SNMP community strings upon install
28.9%11.2.3.b Scan process includes rescans for internal and external scans
28.6%2.6 Shared hosting providers protect entities environment and data.
27.3%12.11 Service providers: daily log, firewall, config, alert reviews
27.3%12.11.b Verify reviews are performed at least quarterly
Figure 18. Base controls with the largest control gaps
The 20 largest increases in control gap
<2.6 +28.6pp Shared hosting providers protect entities environment and data
<10.8 +28.1pp Service provider requirement for reporting critical control failures
<2.1.1.e +27.8pp Verify changed security-related wireless vendor defaults
<2.1.1.c +27.5pp No default SNMP community strings on wireless devices
<2.1.1.b +27.5pp Policies to change SNMP community strings upon install
<2.1.1.d +27.5pp Verify strong encryption on wireless device firmware
<2.1.1.a +27.1pp Examine encryption key change documents and requirements
<4.1.1 +16.7pp Identify all wireless networks connected or transmitting CHD
<11.2.3.b +13.7pp Scan process includes rescans for internal and external scans
<11.2.3.c +13.7pp Validate scans are performed by qualified resources
<8.1.5.b +12.8pp Verify that third-party remote access accounts are monitored
<8.1.b +11.3pp Procedures implemented for user identification management
<11.3.3 +10.5pp Repeated pentesting to confirm the correction of vulnerabilities
<1.3.7.b +9.9pp Authorized disclosure of private IP addresses and routing info
<11.2 +9.0pp Verify internal and external vulnerability scans are done
<3.4.1.a +8.4pp Verify authentication process of encrypted file systems
<8.1.7 +8.3pp Verify that password parameters for user account is locked out
<2.2.1.a +8.3pp Verify only one primary function is implemented per server
<10.5 +8.1pp Verify that audit trails are secured and cannot be altered
<1.1 +8.0pp Inspect the firewall and router configuration standards
Figure 19. Base controls with the largest increases in control gap
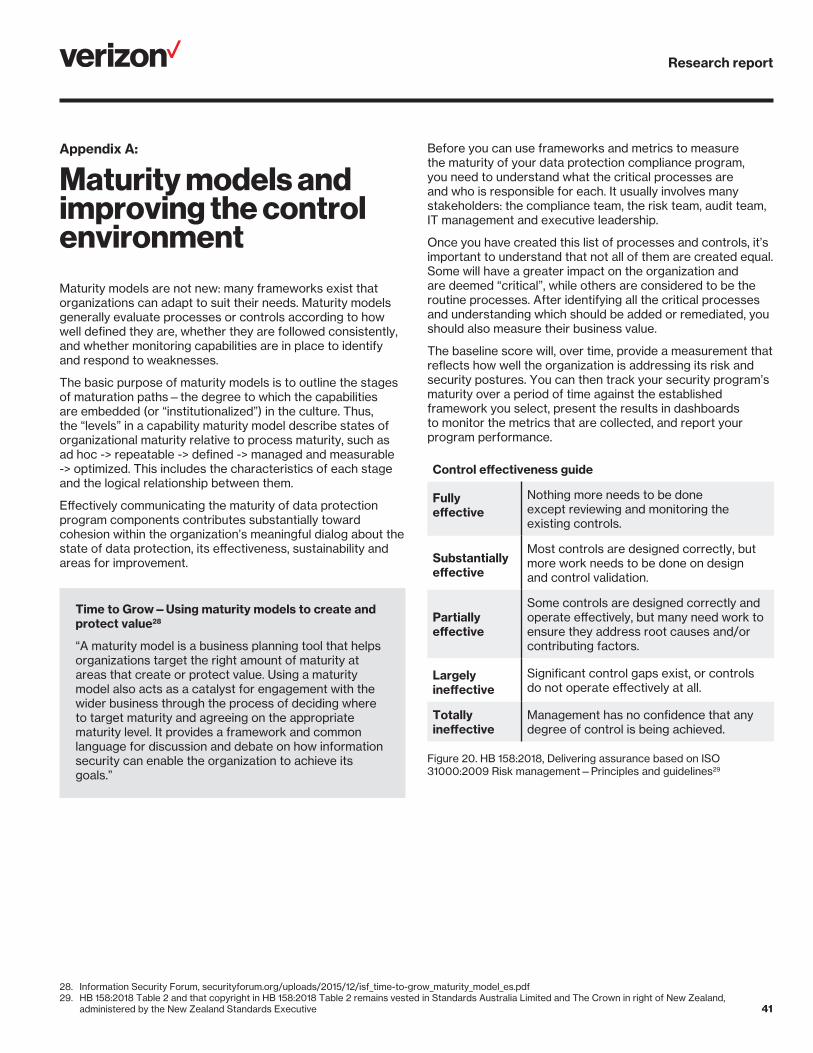
Research report
41
Appendix A:
Maturity models and improving the control environmentMaturity models are not new: many frameworks exist that organizations can adapt to suit their needs. Maturity models generally evaluate processes or controls according to how well defined they are, whether they are followed consistently, and whether monitoring capabilities are in place to identify and respond to weaknesses.
The basic purpose of maturity models is to outline the stages of maturation paths—the degree to which the capabilities are embedded (or “institutionalized”) in the culture. Thus, the “levels” in a capability maturity model describe states of organizational maturity relative to process maturity, such as ad hoc -> repeatable -> defined -> managed and measurable -> optimized. This includes the characteristics of each stage and the logical relationship between them.
Effectively communicating the maturity of data protection program components contributes substantially toward cohesion within the organization’s meaningful dialog about the state of data protection, its effectiveness, sustainability and areas for improvement.
Time to Grow—Using maturity models to create and protect value28
“A maturity model is a business planning tool that helps organizations target the right amount of maturity at areas that create or protect value. Using a maturity model also acts as a catalyst for engagement with the wider business through the process of deciding where to target maturity and agreeing on the appropriate maturity level. It provides a framework and common language for discussion and debate on how information security can enable the organization to achieve its goals.”
28. Information Security Forum, securityforum.org/uploads/2015/12/isf_time-to-grow_maturity_model_es.pdf29. HB 158:2018 Table 2 and that copyright in HB 158:2018 Table 2 remains vested in Standards Australia Limited and The Crown in right of New Zealand,
administered by the New Zealand Standards Executive
Before you can use frameworks and metrics to measure the maturity of your data protection compliance program, you need to understand what the critical processes are and who is responsible for each. It usually involves many stakeholders: the compliance team, the risk team, audit team, IT management and executive leadership.
Once you have created this list of processes and controls, it’s important to understand that not all of them are created equal. Some will have a greater impact on the organization and are deemed “critical”, while others are considered to be the routine processes. After identifying all the critical processes and understanding which should be added or remediated, you should also measure their business value.
The baseline score will, over time, provide a measurement that reflects how well the organization is addressing its risk and security postures. You can then track your security program’s maturity over a period of time against the established framework you select, present the results in dashboards to monitor the metrics that are collected, and report your program performance.
Control effectiveness guide
Fully effective
Nothing more needs to be done except reviewing and monitoring the existing controls.
Substantially effective
Most controls are designed correctly, but more work needs to be done on design and control validation.
Partially effective
Some controls are designed correctly and operate effectively, but many need work to ensure they address root causes and/or contributing factors.
Largely ineffective
Significant control gaps exist, or controls do not operate effectively at all.
Totally ineffective
Management has no confidence that any degree of control is being achieved.
Figure 20. HB 158:2018, Delivering assurance based on ISO 31000:2009 Risk management—Principles and guidelines29
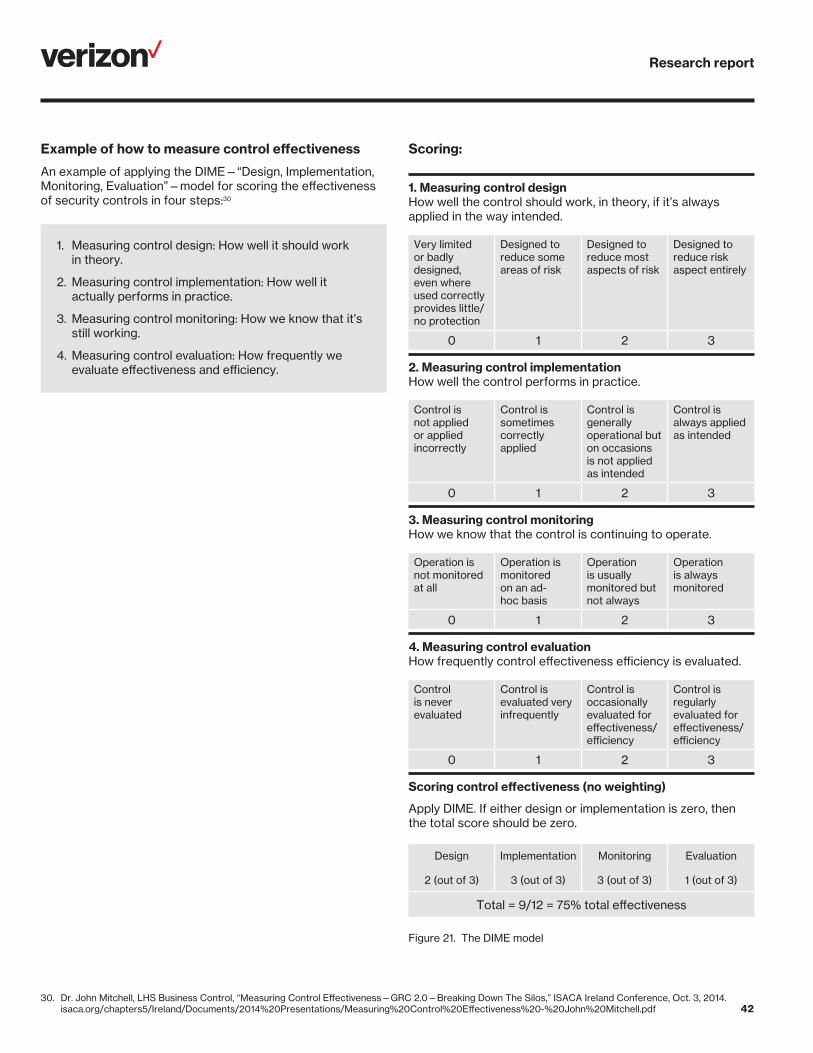
Research report
42
Example of how to measure control effectiveness
An example of applying the DIME—“Design, Implementation, Monitoring, Evaluation”—model for scoring the effectiveness of security controls in four steps:30
1. Measuring control design: How well it should work in theory.
2. Measuring control implementation: How well it actually performs in practice.
3. Measuring control monitoring: How we know that it’s still working.
4. Measuring control evaluation: How frequently we evaluate effectiveness and efficiency.
30. Dr. John Mitchell, LHS Business Control, “Measuring Control Effectiveness—GRC 2.0—Breaking Down The Silos,” ISACA Ireland Conference, Oct. 3, 2014. isaca.org/chapters5/Ireland/Documents/2014%20Presentations/Measuring%20Control%20Effectiveness%20-%20John%20Mitchell.pdf
Scoring:
1. Measuring control designHow well the control should work, in theory, if it’s always applied in the way intended.
Very limited or badly designed, even where used correctly provides little/ no protection
Designed to reduce some areas of risk
Designed to reduce most aspects of risk
Designed to reduce risk aspect entirely
0 1 2 3
2. Measuring control implementationHow well the control performs in practice.
Control is not applied or applied incorrectly
Control is sometimes correctly applied
Control is generally operational but on occasions is not applied as intended
Control is always applied as intended
0 1 2 3
3. Measuring control monitoringHow we know that the control is continuing to operate.
Operation is not monitored at all
Operation is monitored on an ad-hoc basis
Operation is usually monitored but not always
Operation is always monitored
0 1 2 3
4. Measuring control evaluationHow frequently control effectiveness efficiency is evaluated.
Control is never evaluated
Control is evaluated very infrequently
Control is occasionally evaluated for effectiveness/ efficiency
Control is regularly evaluated for effectiveness/ efficiency
0 1 2 3
Scoring control effectiveness (no weighting)
Apply DIME. If either design or implementation is zero, then the total score should be zero.
Design Implementation Monitoring Evaluation
2 (out of 3) 3 (out of 3) 3 (out of 3) 1 (out of 3)
Total = 9/12 = 75% total effectiveness
Figure 21. The DIME model
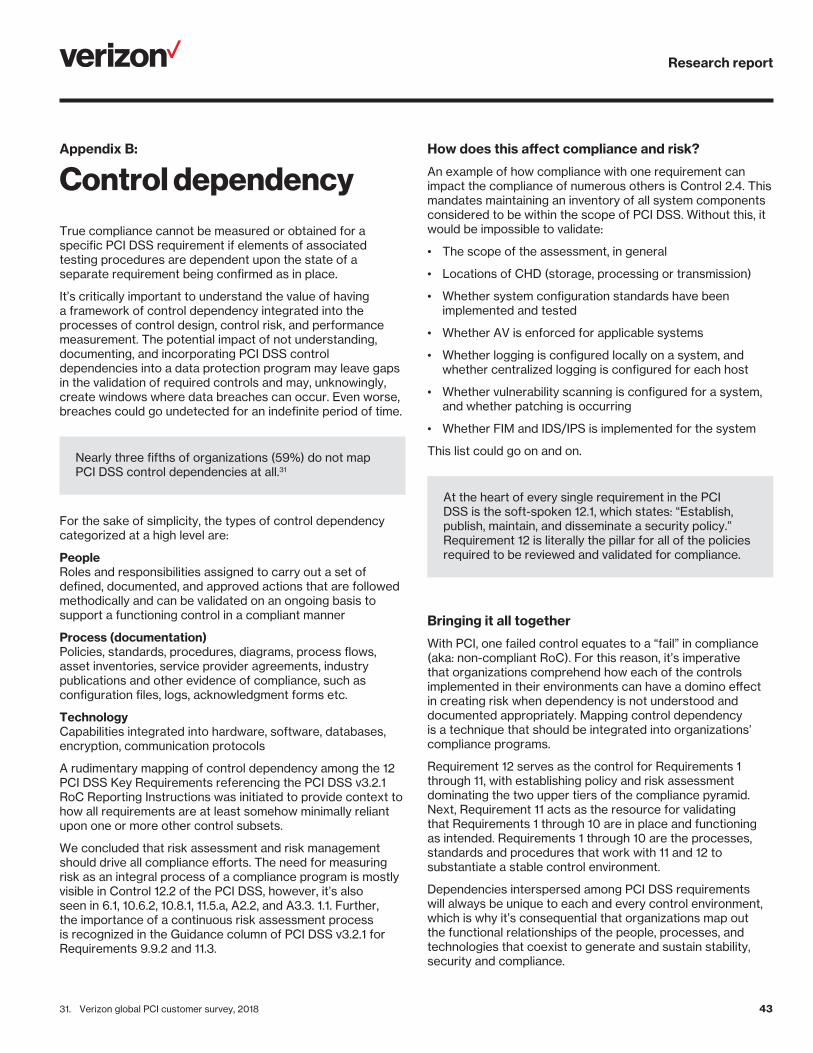
Research report
43
Appendix B:
Control dependencyTrue compliance cannot be measured or obtained for a specific PCI DSS requirement if elements of associated testing procedures are dependent upon the state of a separate requirement being confirmed as in place.
It’s critically important to understand the value of having a framework of control dependency integrated into the processes of control design, control risk, and performance measurement. The potential impact of not understanding, documenting, and incorporating PCI DSS control dependencies into a data protection program may leave gaps in the validation of required controls and may, unknowingly, create windows where data breaches can occur. Even worse, breaches could go undetected for an indefinite period of time.
Nearly three fifths of organizations (59%) do not map PCI DSS control dependencies at all.31
For the sake of simplicity, the types of control dependency categorized at a high level are:
PeopleRoles and responsibilities assigned to carry out a set of defined, documented, and approved actions that are followed methodically and can be validated on an ongoing basis to support a functioning control in a compliant manner
Process (documentation)Policies, standards, procedures, diagrams, process flows, asset inventories, service provider agreements, industry publications and other evidence of compliance, such as configuration files, logs, acknowledgment forms etc.
TechnologyCapabilities integrated into hardware, software, databases, encryption, communication protocols
A rudimentary mapping of control dependency among the 12 PCI DSS Key Requirements referencing the PCI DSS v3.2.1 RoC Reporting Instructions was initiated to provide context to how all requirements are at least somehow minimally reliant upon one or more other control subsets.
We concluded that risk assessment and risk management should drive all compliance efforts. The need for measuring risk as an integral process of a compliance program is mostly visible in Control 12.2 of the PCI DSS, however, it’s also seen in 6.1, 10.6.2, 10.8.1, 11.5.a, A2.2, and A3.3. 1.1. Further, the importance of a continuous risk assessment process is recognized in the Guidance column of PCI DSS v3.2.1 for Requirements 9.9.2 and 11.3.
31. Verizon global PCI customer survey, 2018
How does this affect compliance and risk?
An example of how compliance with one requirement can impact the compliance of numerous others is Control 2.4. This mandates maintaining an inventory of all system components considered to be within the scope of PCI DSS. Without this, it would be impossible to validate:
• The scope of the assessment, in general
• Locations of CHD (storage, processing or transmission)
• Whether system configuration standards have been implemented and tested
• Whether AV is enforced for applicable systems
• Whether logging is configured locally on a system, and whether centralized logging is configured for each host
• Whether vulnerability scanning is configured for a system, and whether patching is occurring
• Whether FIM and IDS/IPS is implemented for the system
This list could go on and on.
At the heart of every single requirement in the PCI DSS is the soft-spoken 12.1, which states: “Establish, publish, maintain, and disseminate a security policy.” Requirement 12 is literally the pillar for all of the policies required to be reviewed and validated for compliance.
Bringing it all together
With PCI, one failed control equates to a “fail” in compliance (aka: non-compliant RoC). For this reason, it’s imperative that organizations comprehend how each of the controls implemented in their environments can have a domino effect in creating risk when dependency is not understood and documented appropriately. Mapping control dependency is a technique that should be integrated into organizations’ compliance programs.
Requirement 12 serves as the control for Requirements 1 through 11, with establishing policy and risk assessment dominating the two upper tiers of the compliance pyramid. Next, Requirement 11 acts as the resource for validating that Requirements 1 through 10 are in place and functioning as intended. Requirements 1 through 10 are the processes, standards and procedures that work with 11 and 12 to substantiate a stable control environment.
Dependencies interspersed among PCI DSS requirements will always be unique to each and every control environment, which is why it’s consequential that organizations map out the functional relationships of the people, processes, and technologies that coexist to generate and sustain stability, security and compliance.

Research report
44
Appendix C:
On downed planes and data breachesAndi Baritchi, Director, KPMG Cyber Security Services
In his book, Jordan Ellenberg tells the story of Abraham Wald, a Hungarian-Romanian mathematician whose work helped the Allied Forces win World War II (WWII).32 As a researcher at the elite Statistical Research Group at Columbia University during the war, Wald was tasked to advise the US Air Force where to strengthen the armor on its fighter planes.
The conventional wisdom was to look at planes after they returned from combat and identify the areas with the greatest damage. Surely, it makes sense to further armor those areas, right? If you said yes, you would be wrong.33 Wald realized that by only looking at the planes that made it back, we have a known unknown: the damage to the downed planes. Thus the field of study known as survivorship bias34 was born. Since Wald didn’t have access to the downed planes, he had to make do with the survivors, so he gave the military an answer contrary to what they expected: Reinforce the planes in the areas with fewer bullet holes. Why? The areas with less damage on returned planes likely means, assuming an equal dispersion of bullets, that a greater percentage of planes with damage in those areas were downed.
What does this have to do with cybersecurity?
As an industry, we often forget what Wald taught us and look only at the “control group” data. We’ve all heard boasts like “look at how well my simulated phishing training is working,” or, “check out my RoC, I’m so compliant I’m secure!” As the security versus compliance debate continues to rage in the infosec community, we want to answer the question, where do we want to better armor our payment security?
Luckily for us, in the case of payment security and PCI, we don’t have to make inferences from the survivors—we have access to the downed planes in the form of PCI Forensic Investigator (PFI) reports.
First, a primer. When a card data breach occurs, the stolen cards usually show up for sale on the dark web. Criminals purchase blocks of cards and use them to make fraudulent purchases. The card brands and law enforcement also monitor the dark web and sometimes they find the stolen cards quickly enough to flag them for reissuance before fraud is committed. More commonly, the fact that a card has been stolen is first discovered after the fraud event, either via manual chargeback mechanisms or automated fraud detection systems.
32. “How Not to Be Wrong: The Power of Mathematical Thinking”, Jordan Ellenberg, 201433. “A Method of Estimating Plane Vulnerability Based on Damage of Survivors”, Statistical Research Group, Columbia University, Abraham Wald, 194334. Survivorship bias: en.wikipedia.org/wiki/Survivorship_bias
At this point, you might be asking yourself, how does any of this trigger a PFI investigation, and how do they know what company to investigate? Big data, that’s how. The card brands have sophisticated data mining tools that are always searching for the missing link between fraud-involved cards.
This missing link usually shows up as a common point of purchase (CPP). When a large number of people that all shopped at Joe’s Bait & Tackle thereafter have their cards either showing up on the dark web or have fraudulent transactions charged to their cards, we can infer Joe might have had a card data breach. At that point, Joe will receive a CPP notification, through which the card brands and acquiring bank will mandate that Joe engage a PFI to perform a data breach investigation.
A PFI investigation is focused on three key missions:
• Determine whether a PCI data breach occurred
• If yes, determine whether there were significant PCI compliance deficiencies
• If yes, determine which deficiencies if any caused or contributed to the breach.
As a result of being a PFI as well as a QSA, Verizon has almost a decade’s worth of “downed planes” to look at from a PCI data breach perspective. In the analysis herein, we look at the aggregate historical analysis of the PCI compliance of organizations that experienced a PCI data breach (item 2 above).
The data
If the iRoC compliance data found elsewhere in this report represents the planes that made it home, the graphs across show us the downed planes. Three key themes stand out:
• By and large, most PCI DSS controls show a positive trendline over the years in the PFI dataset
• Some controls don’t show up on PFI reports very often, such as Requirement 4 (Secure data transmission) and Requirement 9 (Physical security)
• There’s a set of controls—what I like to call the “troublemakers”—where breached companies consistently demonstrate deficiencies
Requirement 2 (Configuration standards) showed the largest improvement. Requirement 3 (Cardholder data protection) also showed significant improvement, as did Requirement 8 (Authentication) and Requirement 12 (Security management). Note that some of these, Requirement 8 for example, still had pretty lackluster percentages notwithstanding the upward trend.
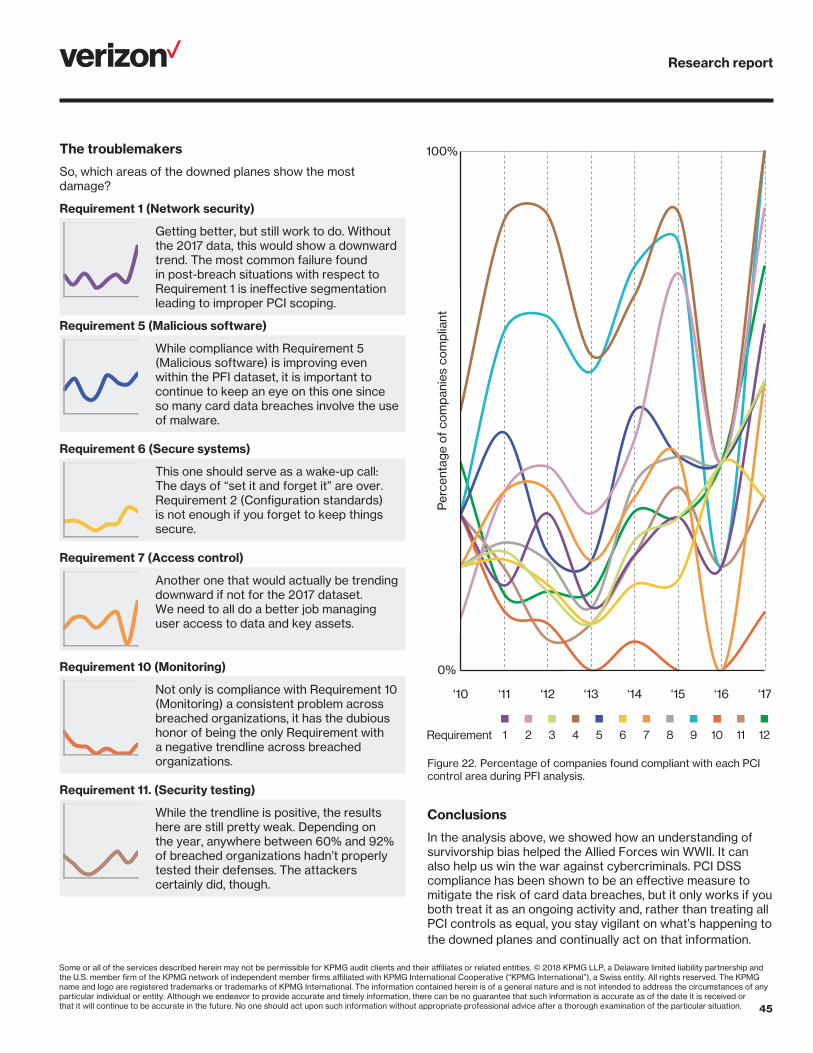
Research report
45
The troublemakers
So, which areas of the downed planes show the most damage?
Requirement 1 (Network security)
Getting better, but still work to do. Without the 2017 data, this would show a downward trend. The most common failure found in post-breach situations with respect to Requirement 1 is ineffective segmentation leading to improper PCI scoping.
Requirement 5 (Malicious software)
While compliance with Requirement 5 (Malicious software) is improving even within the PFI dataset, it is important to continue to keep an eye on this one since so many card data breaches involve the use of malware.
Requirement 6 (Secure systems)
This one should serve as a wake-up call: The days of “set it and forget it” are over.Requirement 2 (Configuration standards) is not enough if you forget to keep things secure.
Requirement 7 (Access control)
Another one that would actually be trending downward if not for the 2017 dataset. We need to all do a better job managing user access to data and key assets.
Requirement 10 (Monitoring)
Not only is compliance with Requirement 10 (Monitoring) a consistent problem across breached organizations, it has the dubious honor of being the only Requirement with a negative trendline across breached organizations.
Requirement 11. (Security testing)
While the trendline is positive, the results here are still pretty weak. Depending on the year, anywhere between 60% and 92% of breached organizations hadn’t properly tested their defenses. The attackers certainly did, though.
Requirement
‘10 ‘11 ‘12 ‘13 ‘14 ‘15 ‘16 ‘17
0%
Per
cent
age
of c
ompa
nies
com
plia
nt
100%
1 32 4 65 7 98 10 1211
Figure 22. Percentage of companies found compliant with each PCI control area during PFI analysis.
Conclusions
In the analysis above, we showed how an understanding of survivorship bias helped the Allied Forces win WWII. It can also help us win the war against cybercriminals. PCI DSS compliance has been shown to be an effective measure to mitigate the risk of card data breaches, but it only works if you both treat it as an ongoing activity and, rather than treating all PCI controls as equal, you stay vigilant on what’s happening to the downed planes and continually act on that information.
Some or all of the services described herein may not be permissible for KPMG audit clients and their affiliates or related entities. © 2018 KPMG LLP, a Delaware limited liability partnership and the U.S. member firm of the KPMG network of independent member firms affiliated with KPMG International Cooperative (“KPMG International”), a Swiss entity. All rights reserved. The KPMG name and logo are registered trademarks or trademarks of KPMG International. The information contained herein is of a general nature and is not intended to address the circumstances of any particular individual or entity. Although we endeavor to provide accurate and timely information, there can be no guarantee that such information is accurate as of the date it is received or that it will continue to be accurate in the future. No one should act upon such information without appropriate professional advice after a thorough examination of the particular situation.
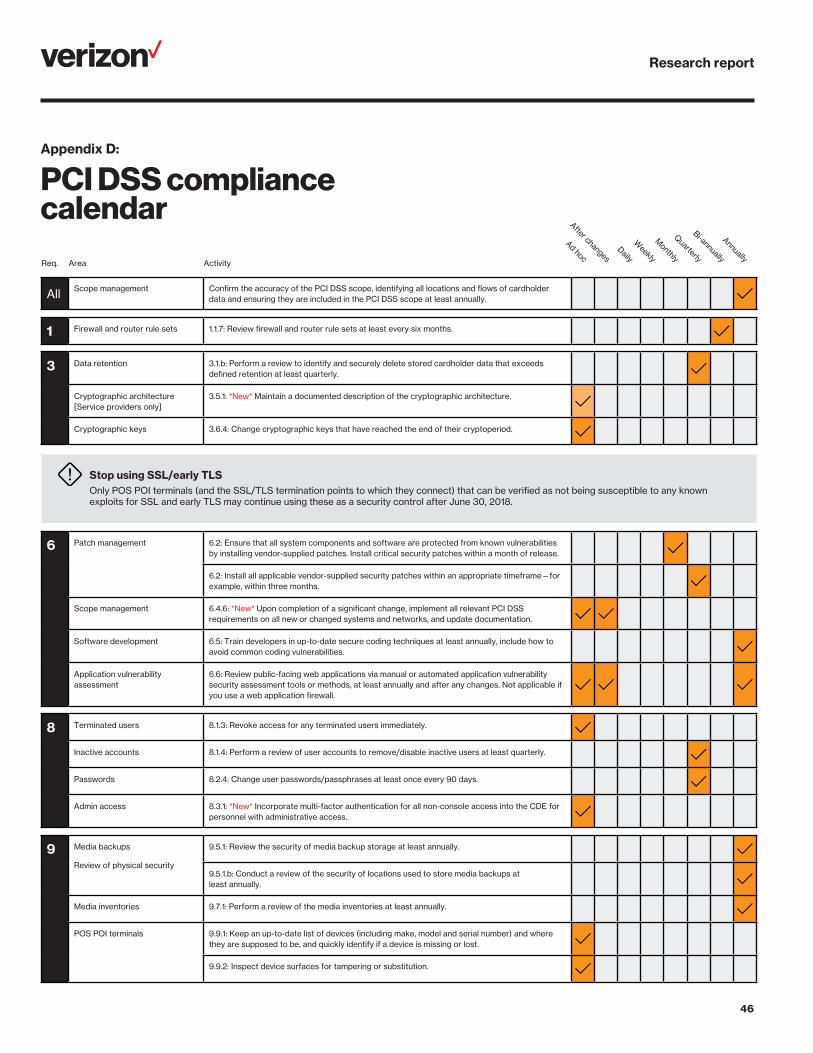
Research report
46
Appendix D:
PCI DSS compliance calendarReq. Area Activity
All Scope management Confirm the accuracy of the PCI DSS scope, identifying all locations and flows of cardholder data and ensuring they are included in the PCI DSS scope at least annually.
1 Firewall and router rule sets 1.1.7: Review firewall and router rule sets at least every six months.
3 Data retention 3.1.b: Perform a review to identify and securely delete stored cardholder data that exceeds defined retention at least quarterly.
Cryptographic architecture [Service providers only]
3.5.1: *New* Maintain a documented description of the cryptographic architecture.
Cryptographic keys 3.6.4: Change cryptographic keys that have reached the end of their cryptoperiod.
Stop using SSL/early TLSOnly POS POI terminals (and the SSL/TLS termination points to which they connect) that can be verified as not being susceptible to any known exploits for SSL and early TLS may continue using these as a security control after June 30, 2018.
6 Patch management 6.2: Ensure that all system components and software are protected from known vulnerabilities by installing vendor-supplied patches. Install critical security patches within a month of release.
6.2: Install all applicable vendor-supplied security patches within an appropriate timeframe—for example, within three months.
Scope management 6.4.6: *New* Upon completion of a significant change, implement all relevant PCI DSS requirements on all new or changed systems and networks, and update documentation.
Software development 6.5: Train developers in up-to-date secure coding techniques at least annually, include how to avoid common coding vulnerabilities.
Application vulnerability assessment
6.6: Review public-facing web applications via manual or automated application vulnerability security assessment tools or methods, at least annually and after any changes. Not applicable if you use a web application firewall.
8 Terminated users 8.1.3: Revoke access for any terminated users immediately.
Inactive accounts 8.1.4: Perform a review of user accounts to remove/disable inactive users at least quarterly.
Passwords 8.2.4: Change user passwords/passphrases at least once every 90 days.
Admin access 8.3.1: *New* Incorporate multi-factor authentication for all non-console access into the CDE for personnel with administrative access.
9 Media backups
Review of physical security
9.5.1: Review the security of media backup storage at least annually.
9.5.1.b: Conduct a review of the security of locations used to store media backups at least annually.
Media inventories 9.7.1: Perform a review of the media inventories at least annually.
POS POI terminals 9.9.1: Keep an up-to-date list of devices (including make, model and serial number) and where they are supposed to be, and quickly identify if a device is missing or lost.
9.9.2: Inspect device surfaces for tampering or substitution.
Ad hocDaily
Monthly
Weekly
Quarterly
Annually
Bi-annually
After changes

Research report
47
Req. Area Activity
10 Review of logs 10.6: Review logs and security events for all system components to identify anomalies or suspicious activity.
10.6.2: Review logs of other systems components -as set by annual risk assessment.
Failures within critical security control systems [Service providers only]
10.8: *New* Detect and report on failures within critical security control systems.
11 Rogue wireless access points 11.1: Test for the presence of all authorized and unauthorized wireless access points on a quarterly basis.
Authorized wireless networks 11.1.1 Maintain inventory of authorized wireless access points.
Vulnerability scans 11.1.1: Perform quarterly internal vulnerability scans and rescans as needed, until all “high risk” vulnerabilities (as identified in Requirement 6.1) are resolved.
11.2.2: Perform quarterly external vulnerability scans, via an approved scanning vendor (ASV) approved by the PCI SSC. Perform rescans as needed, until passing scans are achieved.
11.2.3: Conduct scans of the internal and external networks after any significant change.
Penetration tests 11.3: Review and consider threats and vulnerabilities experienced in the last 12 months.
11.3.1: Conduct an external penetration test after any significant change.
11.3.2: Conduct an internal penetration test after any significant change.
Scope management 11.3.4.1: *New* Confirm PCI DSS scope by performing penetration testing on segmentation controls at least every six months and after any changes to segmentation controls/methods.
Changes to critical files 11.5: Perform a comparison of critical files using change-detection mechanisms, such as file integrity monitoring software, at least weekly.
12 Policy review 12.1.1: Perform a review of the organization’s security policies at least annually.
Risk assessment 12.2: Conduct a formal risk assessment at least annually. Risk assessment process must result in a formal, “documented analysis of risk”.
Remote access for third parties 12.3.9: Activate remote-access technologies for vendors and business partners only when needed by vendors and business partners, with immediate deactivation after use.
PCI DSS compliance program [Service providers only]
12.4: *New* Executive management to establish responsibilities for the protection of cardholder data and a PCI DSS compliance program.
Security awareness 12.6.1: Re-educate individuals on the organization’s policies at least annually. Individuals must formally acknowledge that they have read and understood the security policy and procedures.
12.6.1: Educate personnel upon hire and at least annually.
Compliance of service providers 12.8.4: Monitor the compliance status of service providers at least annually.
Incident response plan 12.10.2: Review and test the organization’s incident response plan/s at least annually.
Incident response responsibilities 12.10.3: Designate specific personnel to be available on a 24/7 basis to respond to alerts.
Security policies and operational procedures
12.11: *New* Perform reviews at least quarterly to confirm personnel are following security policies and operational procedures.
Ad hocDaily
Monthly
Weekly
Quarterly
Annually
Bi-annually
After changes

Research report
48
Appendix E:
Methodology
State of compliance
This research is based on analysis of quantitative data gathered by our qualified security assessors (QSAs) while performing assessments of PCI DSS compliance between 2016 and 2017. The assessments carried out for this report covered both DSS 3.1 and 3.2. Unless explicitly stated otherwise, all the references to controls and test procedures refer to DSS 3.2. The charts below show how the organizations from which we gathered interim PCI DSS assessment data to create this report break down by industry and region.
Figure 23. Distribution of iRoC data by region
Figure 24. Distribution of iRoC data by industry
Global PCI compliance management survey
Verizon conducted an opt-in survey of PCI DSS compliant organizations to determine how they approach compliance program management to obtain insights on compliance program governance, performance measurement, continuous improvement and capability maturity. There were 44 respondents spread almost equally across the Americas, Europe and Asia-Pacific. 81% were services providers and 19% were merchants.
Figure 25. Distribution of survey respondents by region
Figure 26. Distribution of survey respondents by industry
Data breach correlationData for the data breach correlation section (see page 44) is separate from our PCI DSS assessment dataset. It comes from investigations into organizations following a breach of payment card data. These investigations, 237 across 35 countries, were carried out by the VTRAC team between 2010 and 2017. Data analysis was performed by Andi Baritchi - Director, KPMG Cyber Security Services.
The datasets of organizations undergoing regular compliance validation and those that had been breached do not overlap. None of Verizon’s PCI DSS customers experienced a data breach.
Americas
Asia Pacific
Europe
48%
30%
23%
iRoC splitby region
Financial services
Retail
IT services
58%
13%
15%
iRoC splitby industry
Hospitality
11%
Americas
Asia Pacific
Europe35%
28%
37%
Survey splitby region
Financial servicesRetail
IT services
44%
14%
23%
Survey splitby industry
Hospitality7%
12%
Other

Research report
49
Professional security servicesSecurity assurance
Payment card industry and payment security (PCI)Our services
• PCI DSS Audits • PCI DSS Readiness Assessments• PCI Consulting Services• PCI Payment Application Data Security Standard (PA-DSS)• PCI Point-to-Point Encryption (P2PE)• PCI PIN Transaction Security (PTS)• EI3PA• SWIFT
Threat and vulnerability (T&V)To bolster your security, you need to understand where your weakest points lie. Our team can help you to prioritize your defenses.
• Application/Network Vulnerability Assessment• Penetration Testing• Secure Source Code Review• Wireless Vulnerability Assessment• Data Discovery• Development and Penetration Testing Training
Cyber risk programs (CRP)Managing compliance and risk is challenging in today’s connected world and regulatory environment. Although you may not be able to plan for every possibility, you can use historical trends and continual analysis as a guide to help you improve your security posture.
• Security Management Program (SMP)• Cyber Risk Programs (CRP)• Verizon Risk Report (VRR) Level 3: Culture & Process• Application Security Certification Program (AppCert)
Governance, risk and compliance (GRC)Our GRC team will guide you through assessments, programs and advisory services that can strengthen your security.
• Business Security Assessment – BSA (NIST CSF, ISO 2700X, GDPR)
• Healthcare Security (HIPAA,HITRUST)• Fed/Gov (FedRAMP, FISMA)• OTACS (SCADA, ICS, IoT)• Risk Assessment• Security Architecture Review (SAR) Assessments
Product and solutions testing and certification (ICSA Labs)You want to assure customers that your security products and services will help keep their business running smoothly. Verizon’s ICSA Labs can help.
• Device security certifications: Anti-Malware, IPSec, Network (firewall, IPS…), SSL-TLS VPN, WAF, IoT
• Mobility and custom: IoT, mobile device, app• Advance threat defense: Periodic testing• Health IT testing, certification and maintenance
Verizon Threat Response Advisory Center (VTRAC)VTRAC uses cyber intelligence to enable Verizon, its security services, and their customers to prevent, detect and respond to security incidents.
Our security assurance team has:
• Over 180 consultants in 30 countries• Provided security consulting services since 1999 • Offered PCI compliance services since 2003• Conducted over 16,000 assessments since 2009
Payment card industry (PCI)
Threat and vulnerability (T&V)
Cyber risk program (CRP)
Governance, risk and compliance (GRC)
Product and solutions testing and certification (ICSA Labs)
verizonenterprise.com© 2018 Verizon. All Rights Reserved. The Verizon name and logo and all other names, logos, and slogans identifying Verizon’s products and services are trademarks and service marks or registered trademarks and service marks of Verizon Trademark Services LLC or its affiliates in the United States and/or other countries. All other trademarks and service marks are the property of their respective owners. 10/18
Verizon 2018 Payment Security Report
Published September 25, 2018
Editorial team
Lead authorCiske van Oosten
Co-authorsAnne Turner, Cynthia B. Hanson, Dyana Pearson, Ronald Tosto and Andi Baritchi (KPMG)
ContributorsAhmed Bacha Abdelkrim, Brian Fay, Claire Lavelle, Doug Smith, Gabriel Leperlier, Geena Richards, John Galt, Jyri Ryhänen, Kelly Clark, Loic Breat, Marc Spitler, Marcus Bjork, Mark Stachowicz, Matt Arntsen, Noel Richards, Priyanka Bhattacharya, Rokon Sk Mohammad, Souheil Maurin, William Gouy, Xavier Michaud and Zeya Kyaw
Contributing editorsCynthia B. Hanson, Dyana Pearson, Sky Hackett and Anne Turner
This report would not have been possible without contributions of data and insight from across Verizon’s security practice, particularly the PCI Security and VTRAC teams and KPMG.
Security assurance practice
Managing directorRodolphe Simonetti
PCI managersGlobal lead: Ronald (Ron) Tosto
EMEA region: Gabriel Leperlier
APAC region: Sebastien Mazas
Americas region: Franklin Tallah
Global intelligence: Ciske van Oosten
Team [email protected]
About the cover
The front cover depicts the 12 PCI DSS Key Requirements on the right and each of the 9 Factors for Control Effectiveness and Sustainability on the left. The lines show the numerous relationships between the two. To some, the image may resemble an abstract ball of yarn. That may perhaps be an apt analogy. In a way, if that yarn was a long, continuous length of interlocked fibers resembling a series of interlocked objectives, it represents the tightly woven relationships between the 9 Factors and Key Requirements, which are success factors for achieving an effective and sustainable data protection program.