2018 first quarter briefing - ir-cloud.com fhc_1q18_ndr… · cathay life embedded value &...
TRANSCRIPT

June 2018
2018 First Quarter Briefing
2
Disclaimer
This document is provided by Cathay Financial Holding Co., Ltd. (the "Company"). Except for the numbers and information included in the Company's financial statements, the information contained in this document has not been audited or reviewed by any accountant or independent expert. The Company makes no express or implied representations or warranties as to the fairness, accuracy, completeness, or correctness of such information or opinions. This document is provided as of the date herein and will not be updated to reflect any changes hereafter. The Company, its affiliates and their representatives do not accept any responsibility or liability for any damage caused by their negligence or any other reasons, nor do they accept responsibility or liability for any loss or damages arising from the use of this document or the information contained herein or anything related to this document.This document may contain forward-looking statements, including but not limited to all statements that address activities, events or developments that the Company expects or anticipates to take place in the future based on the projections of the Company toward the future, and various factors and uncertainness beyond the Company's control. Therefore, the actual results may differ materially from those contained in the forward-looking statements.This document is not and cannot be construed as an offer to purchase or sell securities or other financial products or solicitation of an offer.This document may not be directly or indirectly reproduced, redistributed or forwarded to any other person and may not be published in whole or in part for any purpose.

Introduction of Cathay FHC1Q18 Business overviewOverseas ExpansionBusiness Performance SummaryCathay United BankCathay LifeCathay CenturyCathay Life Embedded Value & Appraisal ValueCathay’s CSR EffortsM&A Key HighlightsAppendix
3
Agenda
Cathay FHC: largest FHC, comprehensive products
4
2nd biggest non-life insurerMarket share in total premium income: 11.8% (1Q18).
Investment banking, brokerage, and prop trading businessesStrong underwriting and capital raising platformDiversified products and services
One of the largest private banks in terms of total assets No. 2 credit card issuer The largest brokerage settlement bank
No. 1 life insurer in terms of total assets and total premium Market share in total premium: 19.6% (1Q18).
Largest AUM among asset managers in Taiwan Qualified QFII to invest in ChinaPursue business opportunity from QDII of China
Cathay FHC
Cathay United Bank
100%
Cathay Century
100%
Cathay Life
100%
Asset Management
Cathay Securities
100%
Cathay Venture
100%
Indovina Bank(50%)
CUBC Bank(100%)
Cathay Century (China)(49%)
Cathay Century (Vietnam)
(100%)
Cathay Lujiazui Life (China)(50%)
Cathay Life (Vietnam)
(100%)
Cathay Futures(100%)
Chairman: Mr. Hong-Tu TsaiVice Chairman: Mr. Tsu-Pei ChenPresident: Mr. Chang-Ken Lee
Cathay Securities Investment Trust
(100%)
Conning (100%)
CDBS-CAM(33%)
Cathay Securities (HK)
(100%)

13.3 14.6 17.8 18.8 17.5 19.72.515.4
31.7 38.430.2
36.3
FY12 FY13 FY14 FY15 FY16 FY17
CUB Cathay Life
Cathay’s earnings accelerates as life turnarounds
5
Profit contributionEPS & ROE
Note: (1) FY13 figures do not reflect the impact from applying fair value method on investment property.
(2) Since Cathay FHC has more subsidiaries other than Cathay Life and CUB, besides, due to affiliate transactions, the Cathay FHC net income might not equal to the sum of Cathay Life and CUB’s.
(3) EPS has been adjusted for stock dividend (stock split).
1.3
2.4
3.9
4.6
3.84.5
6.8%
10.9%12.1%
12.9%
9.7% 10.0%
0.0%
2.0%
4.0%
6.0%
8.0%
10.0%
12.0%
14.0%
16.0%
-
0.5
1.0
1.5
2.0
2.5
3.0
3.5
4.0
4.5
FY12 FY13 FY14 FY15 FY16 FY17
EPS ROE(NT$/%) (NT$ BN)
4 0%
FHC 16.2 29.0 49.6 57.9 48.0 56.7Life 2.5 15.4 31.7 38.4 30.2 36.3CUB 13.3 14.6 17.8 18.8 17.5 19.7
22.517.8
14.0
7.1 5.6 5.6
11.9 8.3 7.2 6.6
Cathay Fubon CTBC Mega First Cooperative E.SUN Hua Nan CDF Yuanta
Privately owned Government-run
Market leader in Taiwan’s FIG sector
6
Largest listed financials group by market capitalization and assets.
Ranking of total asset (US$bn)
Ranking of market cap (US$bn)
Note: Market capitalization as of May 31, 2018
Note: Total assets as of Mar. 31, 2018
308 239187
11860
181120 118 91 89
Cathay Fubon CTBC Taiwan Mega Cooperative Shin Kong First Hua Nan Taishin
Privately owned Government-run

57.948.0
56.7
FY15 FY16 FY17
10.8
23.3
1Q17 1Q18
7
Cathay FHC – Net income & EPS
Net income (NT$BN) EPS (NT$)
-17% 18%
116%
57.948.0
56.7
FY15 FY16 FY17
0.85
1.84
1Q17 1Q18
8
Cathay FHC – Net income & EPS
Net income of primary subsidiaries ROE
1Q17 1Q18 1Q17 1Q18
Note: Starting from 1Q18, ROE calculation was based on IFRS 9.
FY16 FY17FY16 FY17
5.0 5.10.4 0.1 0.1
5.8
16.7
0.5 0.2 0.1
CUB CathayLife
CathayCentury
CathaySITE
CathaySecurities
17.5
30.2
2.3 0.3 0.3
19.7
36.3
1.9 0.4 0.3
CUB CathayLife
CathayCentury
CathaySITE
CathaySecurities
8.0%12.4%
5.6%
18.5%14.2%14.9% 12.4% 14.8%
18.0%
27.2%
CathayFHC
CUB CathayLife
CathayCentury
CathaySITE
9.7% 11.1%8.5%
28.5%
13.8%10.0% 11.5%
9.0%
18.8% 19.7%
CathayFHC
CUB CathayLife
CathayCentury
CathaySITE

9
Book value
Cathay FHC – Book value & BVPS
Note: (1) Book value includes preferred shares and minority interests, BVPS represented BVPS attributable to common shareholders.(2) Starting Jan.1, 2018, the reporting was based on IFRS 9.
BVPS(NT$BN) (NT$)
461.1529.8
608.5 608.9
FY15 FY16 FY17 1Q18
36.2 37.743.7 43.7
FY15 FY16 FY17 1Q18
Introduction of Cathay FHC1Q18 Business overviewOverseas ExpansionBusiness Performance SummaryCathay United BankCathay LifeCathay CenturyCathay Life Embedded Value & Appraisal ValueCathay’s CSR EffortsM&A Key HighlightsAppendix
10
Agenda

11
1Q18 Business overview
Cathay United hay UnitBank
Cathay Life
Cathay SITE
Cathay Century
Cathay Securities
Loan and deposit delivered mild growth with benign credit quality.Continued to expand overseas business. FX loan grew 21% YoY.Wealth management and credit card fee grew by 12% and 21% YoY respectively. Active card number ranked No.1 in the industry.
Focused on value-driven strategy with investment-linked and traditional life regular paid policies. FYP and FYPE remained No. 1 in the industry.After-hedging investment yield reached 4.5%. Overall investment performance maintained stable.
Premium income grew 6% YoY. Remained in second place with 11.8% market share.Deepened overseas operation and elevate service quality. Developed online products in China and enlarged localized management team in Vietnam.
Ranked No.1 in terms of AUM, which amounted to NT$608 BN.Received “Best Institutional House” and "Best New ETF" awards from Asia Asset Management and "Risk Management Award" from Benchmark magazine. Selected by Thomson Reuters Lipper and Morningstar as “Taiwan Fund Award" winner.
Brokerage business grew steadily. Sub-brokerage market share ranked No.1. Optimized customer experience with new digital business model.
Introduction of Cathay FHC1Q18 Business overviewOverseas ExpansionBusiness Performance SummaryCathay United BankCathay LifeCathay Century
Cathay Life Embedded Value & Appraisal ValueCathay’s CSR EffortsM&A Key HighlightsAppendix
12
Agenda

13
Cathay FHC in South East Asia
Thailand Vietnam
Cambodia
Indonesia
Malaysia
Cathay United BankCathay Life
Cathay Century
Philippines
Banking- Vietnam: Indovina Bank posts solid results- Cambodia: Subsidiary’s businesses grows steadily- Philippines: Invests 23% stake in RCBC(3)
- Indonesia: Invests 40% stake in Bank Mayapada(3)
Cathay Life Vietnam- Total premium grew 56% YoY to VND129BN in 1Q18- Expands and diversifies distribution channels
Cathay Century- Continues to expand local distribution channels to
enhance growth momentum
Note: (1) Cathay Lujiazui Life obtained approval to set up a branch office in Henan, China.
(2) Footprints in Thailand, Myanmar and Indonesia are representative offices.
(3) Investments in RCBC and Bank Mayapada are funded by Cathay Life.
(4) Cathay FHC owns 49% stake of Cathay Century (China), and 33% stake of CDBS Cathay Asset Management.
LaosMyanmar
Singapore
China Vietnam Cambodia Hong Kong Singapore Malaysia Laos Philippines Thailand Myanmar IndonesiaBank 6 37 16 1 1 1 1 1 1 1 1Life 44(1) 44P&C 26 2Asset Mgt. 1 1
Securities 1
14
Cathay FHC in China
Cathay Century (China)Cathay United BankCathay Lujiazui Life
Conning Asia Pacific LimitedCDBS Cathay Asset Management Company
Cathay Securities
Beijing Liaoning
Tianjin
ShandongJiangsu
ShanghaiZhejiang
Fujian
Guangdong
Hong Kong
HubeiSzechwan
Cathay United Bank- Expects to convert Shanghai branch into subsidiary
in 2018Cathay Lujiazui Life
- Total premium grew 52% YoY to RMB 709MN in 1Q18Cathay Century (China)
- Forms a strategic alliance with Ant Financial group to capture new business opportunitiesCathay Securities (HK)
- Each business line grows steadilyJV with China Development Bank Securities (CDBS Cathay Asset Management)
- Continues to launch new products. Mainly focus on fixed income fundsConning Asia Pacific Limited
- Continues to expand asset management business

Introduction of Cathay FHC1Q18 Business overviewOverseas ExpansionBusiness Performance SummaryCathay United BankCathay LifeCathay CenturyCathay Life Embedded Value & Appraisal ValueCathay’s CSR EffortsM&A Key HighlightsAppendix
15
Agenda
788.0 801.4
1,233.1 1,300.0
1Q17 1Q18
719.8 669.7
629.8 684.2
110.3 135.6 15.2 16.3
1Q17 1Q1816
Cathay United Bank – Loan & deposit breakdown
Deposit breakdown Loan breakdown
Time DepositDemand Deposit (NT$BN)
CorporateMortgageConsumerCredit Card related (NT$BN)
1.1%1.0%
44.5%
9.0%7.5%
42.7%
48.8%
2%
45.4%
1,475.1 1,505.92,021.1 2,101.4
61.0%
39.0%
61.9%
38.1%
4%

17
Cathay United Bank – Interest yields
Note: Credit card related loans are included in the calculation of interest spread.
4Q15 1Q16 2Q16 3Q16 4Q16 1Q17 2Q17 3Q17 4Q17 1Q181.81% 1.75% 1.68% 1.62% 1.59% 1.56% 1.64% 1.74% 1.76% 1.81%1.12% 1.07% 1.02% 1.06% 1.10% 1.11% 1.18% 1.20% 1.22% 1.24%
Quarterly SpreadQuarterly NIM
1.96%2.08% 1.99%
1.81% 1.78% 1.76% 1.76% 1.80% 1.83% 1.86% 1.88%2.01%
1.79% 1.84% 1.83% 1.75% 1.71% 1.68% 1.66%1.56% 1.60% 1.64% 1.67%
1.81%
1.26% 1.33%1.20%
1.07% 1.05% 1.05% 1.07% 1.11% 1.14% 1.16% 1.18% 1.24%
0.70% 0.75% 0.79% 0.74% 0.73% 0.71% 0.69% 0.69% 0.69% 0.70% 0.71% 0.77%
FY13 FY14 FY15 1Q16 1H16 9M16 FY16 1Q17 1H17 9M17 FY17 1Q18
Avg. rate of interest-earning assets Interest spread Net interest margin Funding cost
0.15% 0.21%
9.23%7.56%
FY16 FY17
0.19% 0.20%
7.33% 7.78%
1Q17 1Q18
18
Cathay United Bank – Credit quality
NPL & Coverage ratio Gross provision(NT$BN)Gross provision
RecoveryNPL ratio
Coverage ratio
0.10% 0.14%Mortgage NPL
756%923%
0.08% 0.15%Mortgage NPL
778%733% 0.8 0.8
0.5 0.3
1Q17 1Q18
5.4 4.5
1.3 1.8
FY16 FY17

19
Cathay United Bank – SME & FX loans
SME loans Foreign currency loans(NT$BN) (NT$BN)
Note: Total loans exclude credit card revolving balance.
As % of total loans
9.2% 10.7%10.5%10.5% 10.6% 13.3% 12.2%16.6% 15.8% 15.3%
116.5 118.8130.9
151.9 157.4
FY14 FY15 FY16 FY17 1Q18
185.0
148.9174.0
224.0 227.7
FY14 FY15 FY16 FY17 1Q18
6.9
9.47.6
8.510.0
FY13 FY14 FY15 FY16 FY17
20
Cathay United Bank – Offshore earnings
As % of CUB pre-tax profitsOffshore earnings(NT$BN)
36% 12%-19%17%
-33%2.9
1.9
1Q17 1Q18
52.7%
29.0%
1Q17 1Q18
42.4% 46.1%36.3%
44.5% 45.6%
FY13 FY14 FY15 FY16 FY17

1.3 1.6
2.63.0
0.10.1
0.2
0.20.3
0.4
1Q17 1Q18
3.5 4.4 4.9 5.7 6.5
5.26.7
8.89.8 8.8
0.3
0.4
0.4
0.4 0.4
0.9
1.1
1.2
1.1 0.8
1.1
1.3
1.3
1.3 1.4
FY13 FY14 FY15 FY16 FY1721
Cathay United Bank – Fee income
Quarterly Fee income Annual Fee income(NT$BN)Others
Cards related
FXWealth management
Syndicated loans(NT$BN)Others
Cards related
FXWealth management
Syndicated loans
46.8%
49.2%
7.7%4.7%2.3%
36.1%
9.8%8.2%2.9%
32.2%
-3%
26%
19%
11%
11.0
13.9
16.6
18.4 17.9
4.7%
4.6
5.213%
56.9%
7.2%3.0%2.2%
30.7%
6.9%
57.4%
2.2%
28.7%
22
Cathay United Bank – Wealth management fee
Wealth management fee breakdown
(NT$MN) 1Q17 1Q18 FY15 FY16 FY17Wealth Management Fee Income 2,641 2,952 8,779 9,828 8,837YoY growth (%) -10.4% 11.8% 31.6% 11.9% -10.1%
FY16 FY17FY151Q17 1Q18
503 31 80
2,016
758
58 95
2,025
MutualFunds
Structuredproducts
& Securities
Trust &Custody
Insurance
2,307
85 273
6,097
1,573
124 304
7,794
2,453
230 316
5,790
Mutual Funds Structuredproducts
& Securities
Trust & Custody Insurance

80.8
120.0
53.9
8.9
9.3
9.1
0.2
0.2
0.1
12.1
5.5
15.5
0.0
0.0
0.0
FY15 FY16 FY17
91.0 129.6
65.3
2.8
5.2
4.4
8.9
9.3
9.1
0.3
0.2
0.2
114.3 54.6 154.2
0.0 0.0
0.0
FY15 FY16 FY1723
Cathay Life – Annual FYP & APE
First Year Premium Annualized FYP (APE)
0.1%3.9%
0.0%199.1
233.2
28.0%
66.1%
1.9%
17%217.4 -8%
102.0
32%
135.0
78.6
0.0%
68.5%
19.7%0.2%
11.6%
-42%
(NT$BN)
Traditional life – single paidHealth, accident and othersInvestment-linked (VUL)Investment-linked (non-VUL)Interest sensitive annuity
Traditional life – regular paid
Note: Annualized FYP = 10% x single-paid FYP + 20% x 2-yr-paid FYP + … + 50% x 5-yr-paid FYP + 100% x 6-yr and above payment term FYP
(NT$BN)
Traditional lifeHealth, accident and othersInvestment-linked (VUL)Investment-linked (non-VUL)Interest sensitive annuity
292.1366.1 335.6
418.1499.1 496.4
73.584.9 87.5
94.0
99.3 101.9
30.3
26.0 23.3
17.515.6 14.5
24.0
70.5 90.8
115.555.8
155.5
141.513.8 10.8
0.1 0.2
0.1
FY10 FY12 FY13 FY15 FY16 FY17
116.4 115.5 105.2
21.4 21.823.0
4.0 3.73.5
11.9
53.144.60.1
0.00.0
1Q16 1Q17 1Q1824
Cathay Life – Total premiumQuarterly Total premium Annual Total premium
(NT$BN)
Traditional lifeHealth, accident and othersInvestment-linked (VUL)Investment-linked (non-VUL)Interest sensitive annuity (NT$BN)
Traditional lifeHealth, accident and othersInvestment-linked (VUL)Investment-linked (non-VUL)Interest sensitive annuity
194.0176.4-9%
13.1%
0.0%
25.3%
2.0%
59.6%
153.726%
561.3 548.0
645.2
561.4
13.1%
13.3%
0.0%20.2%
1.9%
64.6%
25.2%4.3%5.4%
52.0%
669.9
768.315%

36.2
17.914.1
2.4
2.22.9
0.0
0.00.0
1.2
5.34.5
0.0
0.00.0
1Q16 1Q17 1Q18
37.5
20.5 19.6
0.6
1.0 1.1
2.4
2.2 2.9
0.1
0.0 0.0
11.6 52.7 44.3
0.0
0.0
0.0
1Q16 1Q17 1Q1825
Cathay Life – Quarterly FYP & APE
First Year Premium(NT$BN)
Traditional life – single paidHealth, accident and othersInvestment-linked (VUL)Investment-linked (non-VUL)Interest sensitive annuity
Traditional life – regular paid
(NT$BN)
Traditional lifeHealth, accident and othersInvestment-linked (VUL)Investment-linked (non-VUL)Interest sensitive annuity
Annualized FYP (APE)
0.1%4.2%
0.0%
76.5
67.9
28.8%
65.2%
1.6%
-11%
52.1
47%39.8
-36%
25.321.4
0.0%
65.6%
20.8%0.2%
13.4%
-15%
Note: Annualized FYP = 10% x single-paid FYP + 20% x 2-yr-paid FYP + … + 50% x 5-yr-paid FYP + 100% x 6-yr and above payment term FYP
12.020.5 14.4 14.5
1Q15 1Q16 1Q17 1Q18
26
Cathay Life – Regular paid policies remain as focus
Breakdown of Traditional FYP
Traditional life - 3 year and above regular paidTraditional life - 2 year regular paidTraditional life – single paid
Value for New Business
34%51%
83%93% 88%
76% 80%5%
43%
13%4% 8%
18% 14%
61%
6% 4% 3% 4% 6% 5%
FY12 FY13 FY14 FY15 FY16 FY17 1Q18
Profit Margin 1Q15 1Q16 1Q17 1Q18VNB/FYP 23% 39% 19% 21%VNB/FYPE 74% 51% 57% 68%
71% -30% 1%
Profit Margin FY12 FY13 FY14 FY15 FY16 FY17
VNB/FYP 19% 26% 23% 27% 38% 22%VNB/FYPE 54% 70% 75% 57% 56% 64%
YoY 4% 8%3% 31% -33%
46.0 50.0 52.5 55.5 59.0 54.0 50.0 51.4 53.5 57.6
75.5
50.5
FY12 FY13 FY14 FY15 FY16 FY17
Target Actual

27
Cathay Life – Cost of liability
Note: The figures of cost of liability are reserve-based.
Cost of Liability (annual)Cost of liability (quarterly)
4.31%4.29%
4.26%
4.23%4.21%
4.17%4.14%
4.11%4.10%
1Q16 1H16 9M16 FY16 1Q17 1H17 9M17 FY17 1Q18
5.40%
5.07%
4.83%4.78%
4.63%4.54%
4.43%4.33%
4.23%4.11%
FY08 FY10 FY12 FY14 FY16 FY17
28
Cathay Life – Investment portfolio
(NT$BN) FY15 FY16 FY17 1Q18
Total investments(1) 4,636.6 5,001.1 5,502.6 5,555.5
Weight Weight Weight Amount Return Weight Amount Return
Cash & Cash equivalents 1.3% 1.3% 1.6% 87 0.5% 2.4% 131 0.5%
Equity- Domestic 7.4% 7.9% 8.4% 465 9.1% 8.2% 454 9.8%
Equity- International(2)
6.2% 6.4% 6.3% 347 8.3% 6.4% 357 18.0%
Bond- Domestic 8.0% 6.5% 5.5% 305 2.1% 5.5% 305 2.8%
Bond- International(1)(2)
50.6% 53.8% 55.7% 3,063 5.0% 55.4% 3,076 4.9%
Mortgage & Secured loans 10.2% 8.9% 8.1% 444 1.8% 7.9% 436 1.9%
Policy loans 3.6% 3.3% 3.0% 166 5.8% 3.0% 166 5.6%
Real estate 10.5% 9.8% 9.2% 496 2.3% 9.0% 498 2.6%
Others 2.1% 2.2% 2.4% 130 2.4% 133Note: (1) Total assets excluded separate account assets; international bond includes foreign currency deposit and related adjustments
(2) Yields of international equity and international bond are pre-hedge investment yields.

4.13%
4.35% 4.18% 4.02% 4.02%
FY13 FY14 FY15 FY16 FY17
29
Cathay Life – Investment performance highlight
After-hedging investment yield
Note: FY13 (4.38% ) was pro forma adjusted number of fair value method on investment property.
4.38%*4.01%4.48%
3.62% 3.68%
4.48%
1Q14 1Q15 1Q16 1Q17 1Q18
After-hedging investment yield
63%21%
16%
3.35% 3.17% 3.28% 3.39% 3.35%
FY13 FY14 FY15 FY16 FY17
30
Cathay Life – Investment performance highlight
Note: (1) FY13 (3.27%) was pro forma adjusted number of fair value method on investment property.
(2) Pre-hedging recurring income doesn’t include capital gains but rental, interest revenue and cash dividend. Most dividend will be recognized in 2Q & 3Q. FX Asset
NT$3.50TR
FX riskExposure
70%
FX policy30%
1Q18 Hedging cost 1.32%
3.27%(1)
Proxy& Open
Currency Swap &
NDF
FVOCI & FVTPL(overlay)
2.86% 2.84% 3.02% 2.98% 2.86%
1Q14 1Q15 1Q16 1Q17 1Q18
Pre-hedging recurring yield Pre-hedging recurring yield
Currency Hedging Structure

31
Asia PacificEuropeNorth America
Others(NT$BN)
Note: Exclude overseas deposit and equity.
Cathay Life – Cash dividend income &Overseas fixed income by region
15.2
20.322.6 23.7
FY14 FY15 FY16 FY17
45% 44% 43% 43%
18% 19% 19% 18%
24% 22% 22% 23%
12% 15% 17% 15%
FY15 FY16 FY17 1Q18
Cash dividend income Overseas fixed income by region*
32
Cathay Life – Book value & Unrealized G/L of AFS financial assets
(NT$BN) (NT$BN)
FVOCI & FVTPL(overlay approach)AFS financial assets
348.2 364.0
441.2 432.9
FY15 FY16 FY17 1Q18-3.9
3.2
51.6
34.6
FY15 FY16 FY17 1Q18
Book value Unrealized G/L of financial assets

33
Cathay Life – Distribution channel
Tied agentsBancassurance-CUBOthers
First Year Premium Annualized First Year Premium
82.8%71.8%
14.7%24.0%
2.5% 4.2%
1Q17 1Q18
82.7% 82.2%
14.7% 15.9%2.6% 1.9%
1Q17 1Q18
34
Cathay Life – Operational indicators
Persistency ratio Expense ratio
1Q17 1Q18
98.3%
92.0%
98.4%
94.5%
13 months 25 months
9.4% 10.3%
1Q17 1Q18

Introduction of Cathay FHC1Q18 Business overviewOverseas ExpansionBusiness Performance SummaryCathay United BankCathay LifeCathay CenturyCathay Life Embedded Value & Appraisal ValueCathay’s CSR EffortsM&A Key HighlightsAppendix
35
Agenda
Premium income
36
Cathay Century – Premium income & distribution
12.0% 11.8%Market share77.2% 79.4%Retention
(NT$BN)
AutoFireMarineEngineeringOthers
Distribution channel
Cathay P&C agentsCathay group channel
Affiliate channels
6%
2.6%
11.8%
63.7%
17.6%
2.5%3.1%
12.5%
3.2%
17.6%
65.6%
5.35.0
65.9% 66.6%
33.9% 33.1%
0.2% 0.3%
1Q17 1Q18
68.6% 49.2%
30.7%30.8%
FY16 FY17
46.7% 47.2%
31.3% 32.2%
1Q17 1Q18
46.7% 47.2%
31.3% 32.2%
1Q17 1Q18
37
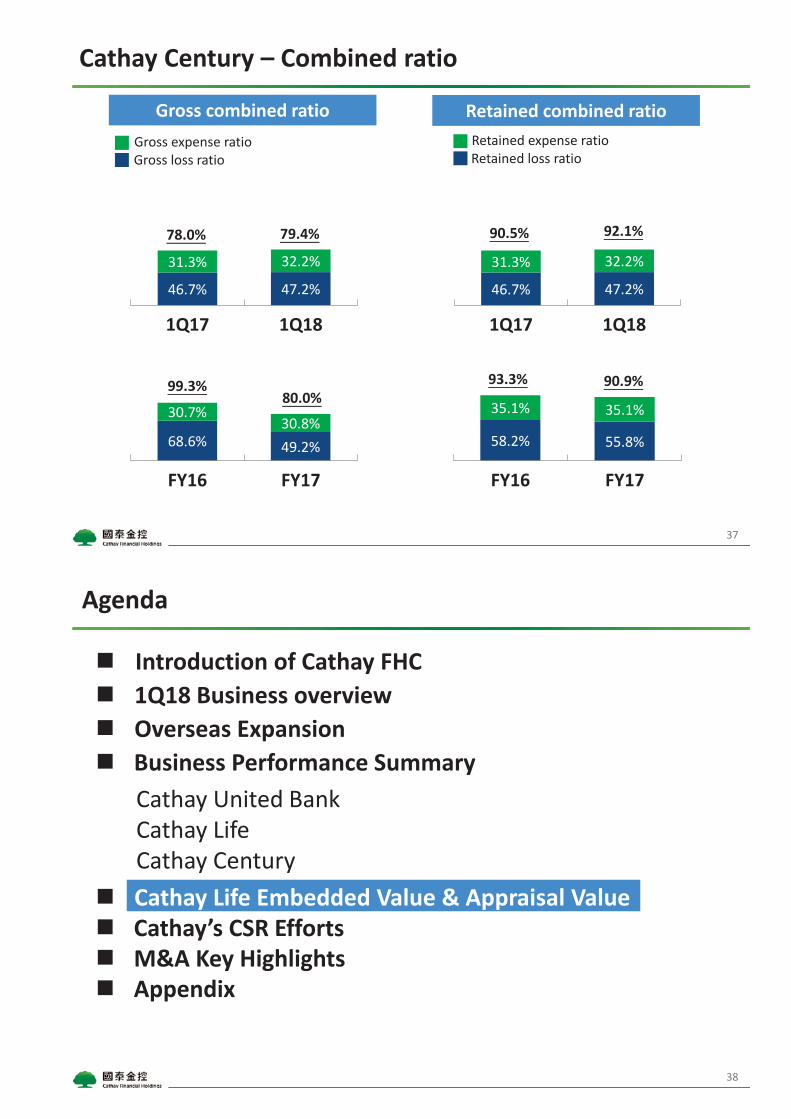
Cathay Century – Combined ratio
Gross combined ratio Retained combined ratioRetained expense ratioRetained loss ratio
Gross expense ratioGross loss ratio
80.0%99.3% 90.9%93.3%
92.1%90.5%79.4%78.0%
58.2% 55.8%
35.1% 35.1%
FY16 FY17
Introduction of Cathay FHC1Q18 Business overviewOverseas ExpansionBusiness Performance SummaryCathay United BankCathay LifeCathay CenturyCathay Life Embedded Value & Appraisal ValueCathay’s CSR EffortsM&A Key HighlightsAppendix
38
Agenda

Embedded Value & Appraisal Value
39
Valuation date 2016/12/31 2017/12/31
In-force business investment yield
4.00% ~ Year 2036 5.05%for NTD policies
4.76% ~ Year 2036 5.82%for USD policies
(Equivalent investment yield: 4.50%Rolling over to 2017: 4.51%)
3.92% ~ Year 2037 5.05%for NTD policies
4.67% ~ Year 2037 5.82%for USD policies
(Equivalent investment yield: 4.43%)
Risk discount rate 10% 10%Adjusted net worth 392 464
Value of in-force business 633 670Cost of capital (CoC) -169 -190
Value of in-force business (After CoC) 464 480Embedded Value (EV) 856 944
EV / per share 161.3(68.1) 164.8(75.1)
Future one year’s new businessinvestment yield
2.97%~ Year 2036 4.91%for NTD policies
4.38% ~ Year 2036 5.84%for USD policies
2.91%~ Year 2037 4.91%for NTD policies
4.22% ~ Year 2037 5.84%for USD policies
Value of future one year’snew business (After CoC) 54.0 54.5
Appraisal Value (AV) 1,328 1,416AV / per share 250.3(105.7) 247.3(112.7)
Note: (1) EV/AV calculation does not include business of Cathay Life in China and Vietnam.(2) per share = per share of Cathay Life; (per share) = per share of Cathay FHC(3) The outstanding shares of Cathay Life in 2016 and 2017 are 5.3bn and 5.7bn, respectively. The increase of outstanding shares of Cathay
Life in 2017 reflects capital injection in June 2018. (4) The outstanding shares of Cathay FHC in 2016 and 2017 are 12.6bn.(5) May not sum to total due to rounding.
NT$BN, except for per share figures
Summary
40
Valuation date 2016 2017 Growth rate 1Q18
Embeddedvalue
Equity 361 436 21% --Adjusted net worth 392 464 18% --Value of in-force business(before CoC) 633 670 6% --Cost of capital (CoC) -169 -190 12% --Value in-force business (after CoC) 464 480 3% --Embedded value 856 944 10% --
Value of oneyear’s newbusiness
First year premium (FYP) 199.1 233.2 17% 67.9First year premium equivalent (FYPE) 135.0 78.6 -41% 21.4Value of one year’s new business (V1NB) 75.5 50.5 -33% 14.5Profit margin (V1NB/FYP) 38% 22% -- 21%Profit margin (V1NB/FYPE) 56% 64% -- 68%Profit margin (V1NB/FYP)(investment-linked(non-VUL)is excluded)
51% 57% -- 55%
Appraisal value(20 years NB)
Multiple 8.7 8.7 -- --Appraisal value 1,328 1,416 7% --
Basic Valueper share
EV / per share of Cathay FHC 68.1 75.1 10% --AV / per share of Cathay FHC 105.7 112.7 7% --
NT$BN, except for per share figures
Note: (1) Basic EV and AV per share is based on weighted average of outstanding shares 12.6bn.(2) Totals may not sum due to rounding.

Investment return assumptions for the value of in force business of NTD-denominated policies as of the end of 2016 & 2017.
Investment return assumptions for the value of in force business of USD-denominated policies as of the end of 2016 & 2017.
Economic Assumptions:In-force business investment yield
41
42
Economic Assumptions:Future one year’s new business investment yield
Investment return assumptions for the value of future one year’s new business of NTD-denominated policies as of the end of 2016 & 2017.
Investment return assumptions for the value of future one year’s new business of USD-denominated policies as of the end of 2016 & 2017.
Cost of Capital Projection and Non-economic Assumptions
43
RBC capital requirement:Apply 2017 RBC formula announced by Insurance Bureau to project future capital requirement.1. Capital Requirement = 200% RBC.2. Risk-based capital calculation reflects company’s current and future operation status. 3. Reflect RBC calculation change in 2017
For C3 risk capital of traditional products, the extra risk factor applied to previous year’s C3 risk capital is increased from 40% to 50%. This change is reflected in all projection years.The calculation of asset concentration risk is adjusted to reflect the change in bond classification from 3 categories to 4 categories.
Experience rate:
PricewaterhouseCoopers Asia Actuarial Services provides an independent review of the actuarial assumptions on EV.
Experience Rate Assumptions
Mortality Rate In accordance with Cathay’s most updated mortality trends.
Morbidity Rate In accordance with Cathay’s most updated morbidity trends and varied by product type.
Lapse Rate In accordance with Cathay’s most updated lapse rate trends and varied by product type.
Expenses Assumption
In accordance with Cathay’s most updated expense analysis and varied by product type; commissions are based on the actual commission rates.
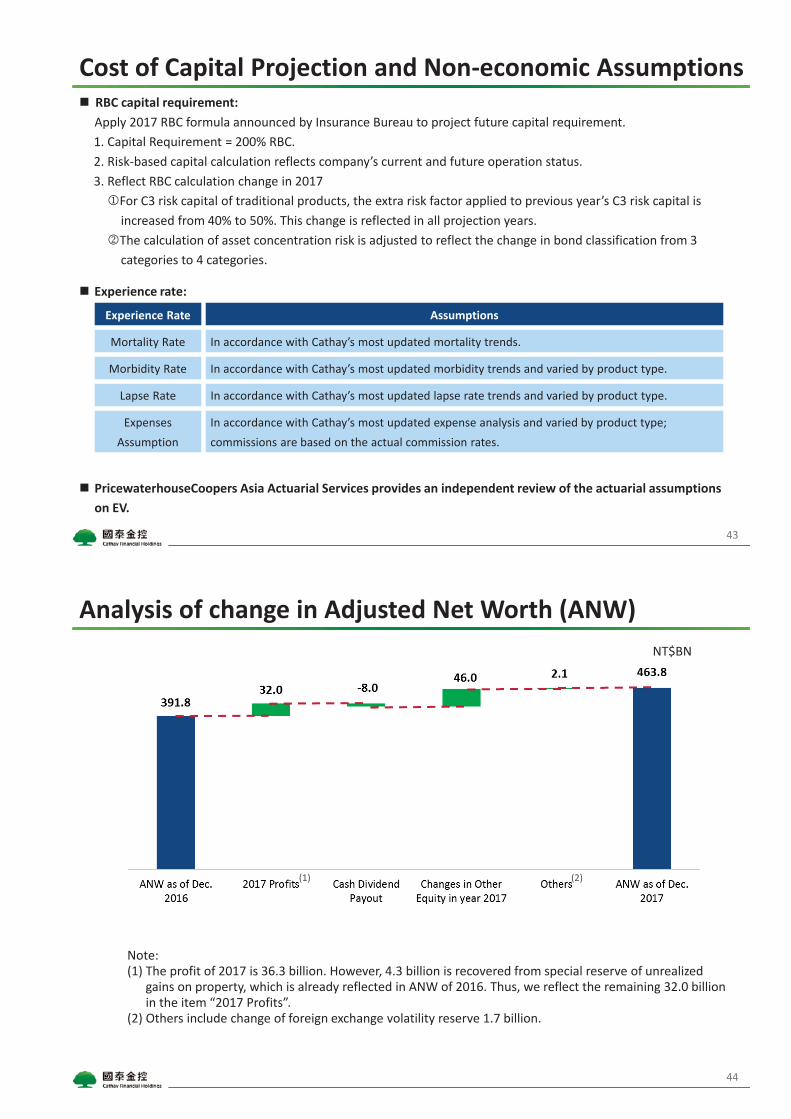
Note:(1) The profit of 2017 is 36.3 billion. However, 4.3 billion is recovered from special reserve of unrealized
gains on property, which is already reflected in ANW of 2016. Thus, we reflect the remaining 32.0 billion in the item “2017 Profits”.
(2) Others include change of foreign exchange volatility reserve 1.7 billion.
Analysis of change in Adjusted Net Worth (ANW)
44
NT$BN
(2)(1)

Analysis of change in value of in-force business (VIF)
45
The value of one year new business (after CoC) of 2017 is 50.5 billion.
NT$BN
Analysis of change in value of one year’s new business (V1NB)
46
NT$BN

Sensitivity Analysis
47
NT$BN, except for per share figures
Note: (1) “Investment yield +0.25% (capped)” : the investment return is capped by 5.05% for NTD policies and 5.82% for USD policies. (2) May not sum to total due to rounding.
Valuation date 2017/12/31
AssumptionInvestment
yield - 0.25%
Investmentyield
+ 0.25%
Investmentyield + 0.25%
(capped)(1)Base Case Discount
rate – 0.5%Discount
rate + 0.5%
Adjusted net worth 464 464 464 464 464 464
Value of in-force business 549 791 735 670 713 631
Cost of capital (CoC) -199 -181 -185 -190 -183 -197
Value of in-force business(After CoC)
350 610 550 480 530 435
Embedded Value 813 1,074 1,014 944 994 899
EV / per share142.1 187.5 177.1 164.8 173.6 156.9(64.8) (85.5) (80.7) (75.1) (79.1) (71.5)
Appraisal Value 1,249 1,578 1,500 1,416 1,493 1,347
Value of future one year’snew business (After CoC)
48.9 60.2 56.3 54.5 58.7 50.7
AV / per share218.0 275.6 262.0 247.3 260.7 235.2(99.4) (125.6) (119.4) (112.7) (118.9) (107.2)
YoY Comparison
48
Valuation date 2016/12/31 2017/12/31
Embedded Value 813 903 899 994
Value of future oneyear’s new business
50.2 58.3 50.7 58.7
Appraisal Value 1,266 1,394 1,347 1,493
NT$BN
Under the different discount rate assumption (9.5% 10.5%), the results of the Year 2016 & 2017 go as follows.

49
(This page is intentionally left blank)
Introduction of Cathay FHC1Q18 Business overviewOverseas ExpansionBusiness Performance SummaryCathay United BankCathay LifeCathay CenturyCathay Life Embedded Value & Appraisal ValueCathay’s CSR EffortsM&A Key HighlightsAppendix
50
Agenda

Continuous efforts in CSR
51
Superior Corporate Governance Performance Ranked Top 10 of Taiwan Corporate Citizenship Award
2011 2012 2013 2014 2015
AA-
A
A++ A++
Note: 1. Information Disclosure and Transparency Ranking (IDTR) is an important evaluation initiated by TWSE.2. Taiwan Corporate Citizenship Award is ranked by Taiwan Common Wealth Magazine.
Cathay FHC has been ranked as top 5% of TWSE Corporate Governance Evaluation in 2017.
Recognized by representative international ESG institutions
19 12 10 9 7 Top 10
2011 2012 2013 2014 2015 2016 2017
5
Ranked top 10 for 5 consecutive years
Selected in DJSI Emerging Markets since 2015The first Taiwan insurance company included in DJSI
Constituents of Vigeo Eiris Best EM Performers
Recognized the highest ranking of IDTR in 2014-2015.
Cathay FHC integrates sustainability into business
52
In 2016, Cathay Life was the first Taiwanese life insurer voluntarily complying with the PSI.Cathay Century P&C Insurance also followed PSI framework in 2017.
In 2015, CUB was the first Taiwanese financial institution signing the Equator Principles (EPs).
Conning Inc., subsidiary of Conning Holding which was acquired by Cathay FHC, is the PRI signatory.Cathay SITE also signed Taiwan Stewardship Code in 2016.
Corporate Sustainability (CS) team in Cathay Life and Cathay Century
Sustainable Finance Management Section in Cathay United Bank
Responsible investments team under Cathay FHC CS committee
Insurance
PSI
Cathay FHC
EPs
Banking
PRI
Asset Management
Key initiatives
Team in-charge

Integrating ESG issues into all business processes
53
Integrating ESG into Business Process
•Consider ESG emerging risks • Improve the
management of climate risk and opportunity by following TCFD framework• Set
investment/ lending limits and management procedures
• Fintech and one-stopservice• Strengthen the
green finance and inclusive finance services• Integrate ESG
issues to the underwriting and lending processes
•Paperless operations and Fintech•GHG inventory
and carbon emission reduction•Water and
waste control
•Review the product details and offer flexibility to customers when significant ESG incidents occur • Trigger critical
disaster claims mechanism when significant ESG incidents occur •Disclose EPs
projects
•Exclusion policy•ESG
integration • Sustainability
themed investing •Corporate
engagement and shareholders’ actions • Investment
mandate management
Risk Management
Products & Services Operation After-Sales
Management Investment Business Processes
54
Actively participate in Global ESG initiativesCathay FHC was the first Taiwanese financial institution joining CDP in 2012 aiming to improve the carbon emission data transparency of Cathay’s investee companies and loan customers.
Participated in the CDP non-discloser engagement campaign since 2017 encouraging Cathay‘s investee companies to respond CDP questionnaires.
The response rate in 2017 reached 19%, higher than overall response rate.
Cathay FHC was the only Taiwanese financial institution joining Low Carbon Investment Registry initiated by GIC in 2014.The low carbon investment amount registered in 2015 reached US$ 1.73 billion.
Cathay FHC joined AIGCC in 2016 and participates in the monthly conference calls discussing the global trends of climate change.
Cathay Life and Cathay SITE are the signatories of Climate Action 100+ initiatives.Cathay will engage with Taiwanese companies who are the substantial greenhouse emitters by encouraging them to disclose the impact of climate-related risks and opportunities based on TCFD recommendation.
Introduction of Cathay FHC1Q18 Business overviewOverseas ExpansionBusiness Performance SummaryCathay United BankCathay LifeCathay CenturyCathay Life Embedded Value & Appraisal ValueCathay’s CSR EffortsM&A Key HighlightsAppendix
55
Agenda
M&A Transaction: Conning in USA
56
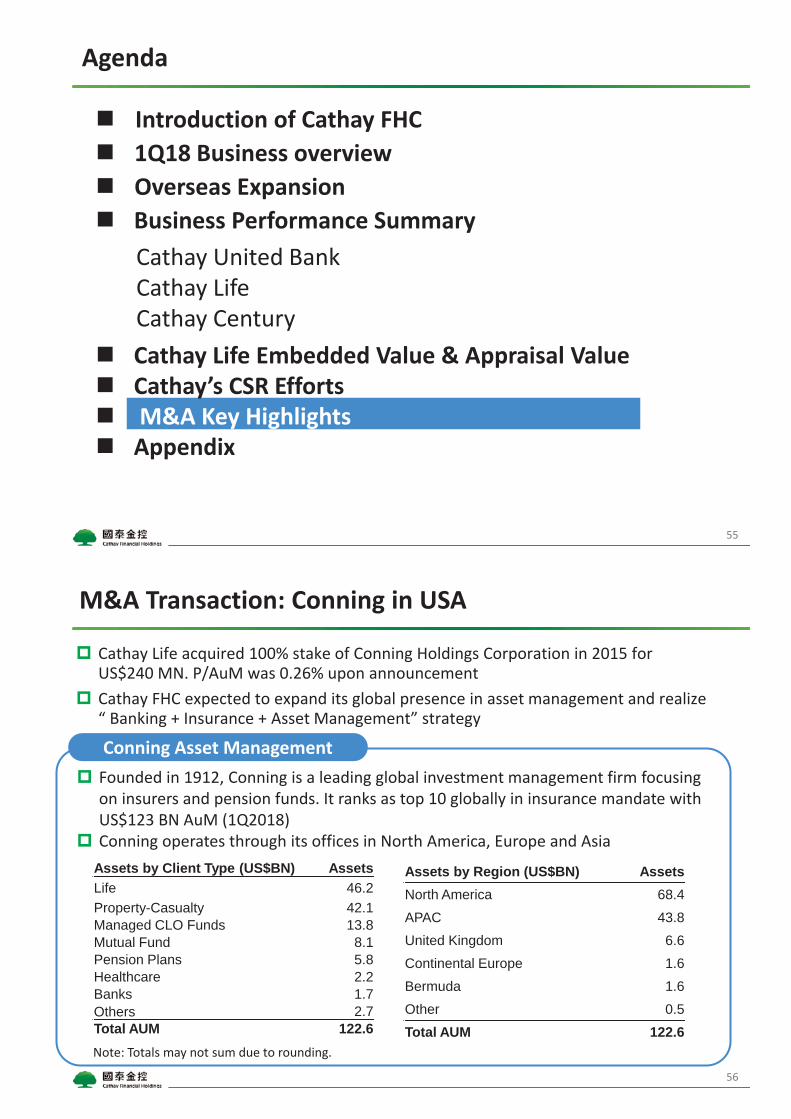
Founded in 1912, Conning is a leading global investment management firm focusing on insurers and pension funds. It ranks as top 10 globally in insurance mandate with US$123 BN AuM (1Q2018)Conning operates through its offices in North America, Europe and Asia
Cathay Life acquired 100% stake of Conning Holdings Corporation in 2015 for US$240 MN. P/AuM was 0.26% upon announcementCathay FHC expected to expand its global presence in asset management and realize “ Banking + Insurance + Asset Management” strategy
Conning Asset Management
Note: Totals may not sum due to rounding.
Assets by Region (US$BN) AssetsNorth America 68.4APAC 43.8United Kingdom 6.6Continental Europe 1.6Bermuda 1.6 Other 0.5Total AUM 122.6
Assets by Client Type (US$BN) AssetsLife 46.2Property-Casualty 42.1Managed CLO Funds 13.8Mutual Fund 8.1Pension Plans 5.8Healthcare 2.2Banks 1.7 Others 2.7Total AUM 122.6

57
Cathay Life invested in 20% shares of Rizal Commercial Banking Corporation (“RCBC”) with 3 board seats of the company in 2015. Total investment was PHP$17.9 BN (c. US$400 MN). Post-money P/B was c.1.57x upon announcementCathay Life may increase its investment in RCBC via placement or open market purchase, up to 30%
M&A Transaction: RCBC in Philippines
ROE ROATotal loan(PHP$BN)
RCBC is one of the large private-owned banks in terms of total assets, with 503branches and over 6,000 employees
RCBC’s Performance
259
297 306
353
FY14 FY15 FY16 FY17
9.2% 9.3%
6.4% 6.7%
11.0%
9.4%10.0% 10.0%
FY14 FY15 FY16 FY17
1.0%1.1%
0.8% 0.8%
1.3%1.2% 1.2%
1.1%
FY14 FY15 FY16 FY17
RCBC Industry RCBC Industry
58
Cathay Life has completed the acquisition of 40% stake in PT Bank MayapadaInternational, Tbk (”Bank Mayapada”)• Stage 1 acquire 24.9% stake (US$ 164 MN) – completed in 1H15• Stage 2 acquire 15.1% stake – completed in Oct 2016
Total investment was~IDR$3.52 TN (US$ 295 MN), representing a ~3.15x P/B multiple upon announcement
M&A Transaction: Bank Mayapada in Indonesia
ROE* ROA*Total loan(IDR$TN)
Bank Mayapada’s Performance
Note: ROE: Profit After Tax/Average Total Equity, ROA: Profit After Tax/Average Total Assets; ROE and ROA in the unaudited report are 25.5%(=Profit After Tax /Average Core Capital (Tier1) and 2.4% (=Profit Before Tax/Average Total Assets) respectively.
26.0 34.2
47.2 56.4
FY14 FY15 FY16 FY17
16.5%
17.7%14.1%
8.7%
16.7%13.6%
13.5%
13.5%
FY14 FY15 FY16 FY17
1.4%1.6%
1.5%
1.0%
2.1%1.8% 1.8% 1.9%
FY14 FY15 FY16 FY17
Bank Mayapada Industry Bank Mayapada Industry

59
Cathay Life - Asset reclassification under IFRS 9
FVTPL
FVOCI
AC
0.9%
25.9%
25.4%
47.8%
Overlay(≈AFS)
Loan and ReceivablesLAR
+Hold to Maturity
HTM
Available for SaleAFS
FVTPL 0.7%
36.8%
62.5%
Note: FVTPL stands for Fair Value through Profit or Loss, FVOCI stands for Fair Value through Other Comprehensive Income, andAC stands for Amortized Cost.
Cathay Life’s book value increased by NT$32.6 bn.
2017/12/31Classification under IAS 39
2018/1/1Classification under IFRS 9
60
Asset classification under IFRS 9 with overlay approach
Debt Equity
‘Contractual cash flow characteristic’ test (SPPI test)*
‘Business model’ assessment
If designating to value at fair value
Amortized Cost
FVOCI(with recycling) FVTPL FVOCI
(no recycling)
Held for trading
If recognizing volatility of fair value to OCI (FVOCI option)
Eligible for overlay approach if the asset is not FVTPL under IAS 39
Held-to-Collect contractual cash flow
Held-to-Collect contractual cash flow & sell
Neither 1 or 2
1 2
PASS
FAIL Yes
No
Yes
No
Yes
No No
*SPPI means cash flow are solely payments of the principal and interests on the principal amount outstanding. Interests consist of the consideration of time value and credit risk associated with the principal.

USD, 93%
CNH, 3%AUD, 2%
VND, 1% GBP, 0.3% Others, 1%
61
Cathay Life – Overseas bond breakdown by currency and rating
O
Fully hedged to USD
IG, 95%
Non-IG, 5%
Overseas bond by currency (1Q18) Overseas bond by rating (1Q18)
11.5 12.0 10.7 11.7
4.7 4.43.5
4.2
FY14 FY15 FY16 FY17
62
Capital adequacy
Cathay Life RBC(%)
CUB Capital Adequacy (%)Cathay FHC CAR (%) 16.2 16.4 15.9
Tier2
Tier1
BIS14.2
287.4
304.6 304.8 309.5
FY14 FY15 FY16 FY17
144.2
151.0
146.3
141.1
FY14 FY15 FY16 FY17

Cathay Financial Holdings FY17/ 1Q18/
(NT$MN) FY16 1Q17
Income Statement Data (Consolidated) FY15 FY16 FY17 % Chg 1Q17 1Q18 % Chg
Operating Income
Net interest income 139,998 153,478 168,461 10% 40,525 41,104 1%
Net commission and fee (4,480) (8,050) 1,070 113% (216) 978 553%
Net earned premium 535,858 622,916 624,617 0% 143,875 136,368 -5%
Change in liability reserve (306,598) (408,614) (445,833) -9% (98,573) (79,909) 19%
Net claims payment (309,104) (308,697) (295,503) 4% (73,311) (89,750) -22%
Investment income 63,734 37,782 62,065 64% 5,064 31,162 515%
Contribution from associates-equity method 1,108 1,202 1,298 8% 472 67 -86%
Other net non-interest income 14,151 40,606 22,446 -45% 10,517 1,215 -88%
Bad debt expense (2,467) (5,232) (3,460) 34% (319) (417) -30%
Operating expense (65,067) (75,207) (75,526) 0% (17,176) (19,020) -11%
Income before taxes 67,132 50,185 59,636 19% 10,859 21,799 101%
Income taxes (9,250) (2,145) (2,962) -38% (68) 1,458 2233%
Net income 57,882 48,039 56,673 18% 10,790 23,257 116%
EPS (NT$) 4.58 3.79 4.47 0.85 1.84
Dividend Payout
Cash dividend per share 2.00 2.00
Stock dividend per share 0.00 0.00
Weighted average outstanding shares 12,563 12,563 12,563 12,563 12,563 (Millions of common shares)
Balance Sheet Data
Total assets 7,568,975 8,135,137 8,841,510 8,279,518 8,961,966
Total shareholders' equity 461,062 529,824 608,471 543,293 608,892
Operating Metrics
ROAE (Consolidated) 12.86% 9.70% 9.96% 8.04% 14.85%
ROAA (Consolidated) 0.80% 0.61% 0.67% 0.53% 1.04%
Double leverage ratio(inc. preferred stock) 111% 105% 108% 105% 108%
Capital Adequacy Metrics
Capital Adequacy Ratio 151% 146% 141%
Notes:
(1) All data and information on this page is provided for informational purposes only, and may subject to adjustment.
For more details, please refer to our official financial reports.
(2) Total may not sum due to rounding.
(3) Starting from 2018/1/1, Cathay FHC adopted IFRS9. The comparative information for prior periods was not restated.

Cathay Life FY17/ 1Q18/
(NT$MN) FY16 1Q17
Income Statement Data (Consolidated) FY15 FY16 FY17 % Chg 1Q17 1Q18 % Chg
Net written premium 519,014 605,910 608,404 0% 140,111 132,246 -6%
Net earned premium 518,250 605,231 607,547 0% 140,493 132,524 -6%
Reinsurance commission earned 200 363 301 -17% 52 55 6%
Fee income 5,762 5,542 9,468 71% 2,589 2,660 3%
Recurring investment income 140,977 161,051 173,846 8% 37,549 40,343 7%
Gain on disposal of investment
Realized gain (loss)-Equity 30,072 18,210 43,625 140% 14,743 25,090 70%
Realized gain (loss)-Debt 14,804 29,382 21,233 -28% 5,231 8,810 68%
Gain on investment property 11,074 5,000 (756) -115% (2) (19) -1125%
FX and others, net (13,101) (21,333) (28,258) -32% (10,817) (11,141) -3%
Investment income, net 183,827 192,310 209,691 9% 46,704 63,083 35%
Other operating income 914 5,032 5,069 1% 1,168 1,290 10%
Separate account revenues 17,303 39,589 44,304 12% 4,820 2,678 -44%
Net claims payment (298,102) (297,201) (284,023) 4% (71,370) (87,255) -22%
Changes in liability reserves (305,864) (408,398) (445,843) -9% (98,438) (80,035) 19%
Acquisition and commission expense (33,238) (38,901) (32,507) 16% (8,232) (8,620) -5%
Other operating costs (5,541) (6,381) (6,418) -1% (1,533) (2,063) -35%
Financial cost (296) (413) (1,963) -375% (293) (568) -94%
Separate account expense (17,303) (39,589) (44,304) -12% (4,820) (2,678) 44%
Operating expense (23,021) (30,768) (28,790) 6% (7,112) (7,366) -4%
Net non-operating income 1,265 1,956 1,442 -26% 370 324 -12%
Income taxes (5,710) 1,861 2,294 23% 733 2,697 268%
Net income 38,447 30,235 36,268 20% 5,131 16,727 226%
Balance Sheet Data
Total assets 5,179,877 5,556,950 6,097,655 5,611,606 6,176,772
General account 4,699,309 5,058,936 5,542,385 5,104,057 5,617,725
Separate account 480,568 498,014 555,269 507,549 559,047
Reserves for life insurance liabilities 4,228,117 4,567,324 4,944,292 4,602,079 4,999,017
Total liabilities 4,831,642 5,192,967 5,656,473 5,239,024 5,743,851
Total shareholders' equity 348,235 363,984 441,181 372,583 432,921
Operating Metrics
First Year Premium(FYP) 217,378 199,082 233,250 76,546 67,879
First Year Premium Equivalent(FYPE) 102,002 135,035 78,602 25,348 21,443
Expense ratio 10.3% 10.3% 8.6% 9.4% 10.3%
13-M persistency ratio 97.6% 98.3% 98.2% 98.3% 98.4%
25-M persistency ratio 91.8% 92.2% 94.3% 92.0% 94.5%
ROAE 11.36% 8.49% 9.01% 5.57% 14.76%
ROAA 0.78% 0.56% 0.62% 0.37% 1.09%
Capital Adequacy Metrics
RBC ratio (Standalone) 305% 305% 309%
Notes:
(1) All data and information on this page is provided for informational purposes only, and may subject to adjustment.
For more details, please refer to our official financial reports.
(2) Total may not sum due to rounding.
(3) Starting from 2018/1/1, Cathay Life adopted IFRS9. The comparative information for prior periods was not restated.

Cathay United Bank
FY17/ 1Q18/
(NT$MN) FY16 1Q17
Income Statement Data (Consolidated) FY15 FY16 FY17 % Chg 1Q17 1Q18 % Chg
Operating Income
Net interest income 26,729 25,910 29,701 15% 7,033 7,711 10%
Fee income 14,344 15,745 14,862 -6% 3,850 4,483 16%
Investment income 5,599 8,278 9,442 14% 1,468 2,075 41%
Other income 1,380 1,222 1,216 0% 282 179 -37%
Net operating income 48,052 51,154 55,222 8% 12,633 14,448 14%
Operating expenses (24,851) (26,959) (29,301) -9% (6,550) (7,075) -8%
Pre-provision profit 23,201 24,195 25,920 7% 6,083 7,373 21%
Net provisions for possible losses (1,922) (4,455) (3,494) 22% (370) (433) -17%
Income before taxes 21,279 19,740 22,426 14% 5,712 6,940 21%
Income tax (2,513) (2,229) (2,763) -24% (704) (1,136) -61%
Net income 18,767 17,511 19,664 12% 5,008 5,803 16%
Balance Sheet Data
Total assets 2,383,377 2,566,669 2,735,704 2,642,894 2,777,640
Loans, net 1,127,807 1,437,531 1,434,558 1,471,529 1,503,695
Financial assets 791,192 849,989 859,590 798,861 922,363
Total liability 2,226,608 2,406,701 2,553,396 2,478,535 2,587,301
Deposits 1,881,657 2,032,600 2,098,368 2,037,125 2,117,166
Financial Debenture Payable 51,900 51,900 63,350 51,900 59,500
Total shareholders' equity 156,769 159,968 182,308 164,359 190,339
Operating Metrics
Cost income ratio 51.72% 52.70% 53.06% 51.85% 48.97%
ROAE 12.33% 11.06% 11.49% 12.35% 12.35%
ROAA 0.81% 0.71% 0.74% 0.77% 0.84%
Assets Quality
NPL 1,599 2,133 2,982 2,753 2,917
NPL ratio 0.14% 0.15% 0.21% 0.19% 0.20%
NPL provisions 17,323 19,686 22,553 20,172 22,701
Coverage ratio 1083% 923% 756% 733% 778%
Capital Adequacy Metrics
BIS ratio (Standalone) 16.4% 14.2% 15.9%
Tier I Ratio (Standalone) 12.0% 10.7% 11.7%
Notes:
(1) All data and information on this page is provided for informational purposes only, and may subject to adjustment.
For more details, please refer to our official financial reports.
(2) Total may not sum due to rounding.
(3) Starting from 2018/1/1, Cathay United Bank adopted IFRS9. The comparative information for prior periods was not restated.

Cathay Century
FY17/ 1Q18/
(NT$MM) FY16 1Q17
Income Statement Data (Consolidated) FY15 FY16 FY17 % Chg 1Q17 1Q18 % Chg
Premium income 22,449 22,774 21,878 -4% 5,080 5,364 6%
Net written premium 17,254 17,390 16,610 -4% 3,917 4,254 9%
Net earned premium 17,169 17,213 16,344 -5% 3,879 4,153 7%
Reinsurance commission earned 517 526 489 -7% 124 141 14%
Fee income 48 44 42 -6% 10 11 11%
Investment 972 2,082 892 -57% 180 247 37%
Interest income 564 568 547 -4% 131 134 2%
Other investment income, net 408 1,514 345 -77% 49 112 131%
Other operating income 15 0 0 0 0 0%
Net claims payment (9,292) (9,559) (9,138) 4% (2,015) (2,411) -20%
Changes in liability reserves (734) (209) 10 105% (135) 125 193%
Commissions and other operating costs (1,402) (3,015) (2,859) 5% (679) (763) -13%
Operating expenses (6,197) (4,248) (3,609) 15% (861) (907) -5%
Operating income 1,095 2,834 2,170 -23% 503 596 18%
Net non-operating income (4) (1) (16) -1862% (5) (5) 13%
Income taxes (287) (492) (297) 40% (62) (109) -75%
Net income 804 2,342 1,858 -21% 436 483 11%
Balance Sheet Data
Total assets 42,106 38,250 38,351 37,904 38,171
Total stockholders' equity 7,219 9,216 10,517 9,627 10,917
Operating Metrics
Gross Combined ratio 85.3% 99.3% 80.0% 78.0% 79.4%
Net Combined ratio 93.2% 93.3% 90.9% 90.5% 92.1%
ROAE 11.44% 28.50% 18.83% 18.50% 18.01%
ROAA 2.06% 5.83% 4.85% 4.58% 5.05%
Capital Adequacy Metrics
RBC ratio (Standalone) 359% 385% 392%
Notes:
(1) All data and information on this page is provided for informational purposes only, and may subject to adjustment.
For more details, please refer to our official financial reports.
(2) Total may not sum due to rounding.
(3) Starting from 2018/1/1, Cathay Century adopted IFRS9. The comparative information for prior periods was not restated.