2018 financial results of bank pekao sdc165124-2a28-4ab6-84c8-5aa301f6a354... · finance management...
TRANSCRIPT

2018 Financial results of Bank Pekao S.A Successful execution of our strategic ambitions in 2018
Warsaw, 26th of February 2019

2
Key achievements in 2018
Detailed financial performance in 4Q’18 and 2018
2019 business and financial outlook
Business growth and development
Appendix
1
2
3
4
5

3
Successful execution of our strategic ambitions in 2018
Double-digit RoE in 2018 (10.2%) achieved for a first time since 2014
+10% commercial revenue growth outpacing ca. 2x growth in deployed balance sheet in 2018
Exceeded milestone of +400K new current accounts, powered by a world-class digital platform: PeoPay
150bps improvement in Cost/Income ratio supported by ongoing digital transformation
Strong commercial and operational momentum into 2019 to deliver on our 2020 strategic goals
+11% net profit growth delivering on our ambition and promise, to reach ca. PLN 2.3bn net profit
Achievements Appendix Financial results Outlook Business development

4
Best Corporate Bank in Poland 2018 2nd time in a row
Key achievements in 2018 Double-digit recurring net profit growth delivered in 2018, highest earnings growth since 2011
+11% growth in recurring earnings fulfilling our ambitions for 2018
Robust volume growth in all strategic segments supported by strong
net interest income
+16% earnings increase in Q4(1) driven by another quarter with a strong
‘positive jaws’ effect in revenues and costs
Business development built on global recognition in all key areas
2 061
2 287
2017 2018
2 475
414
+11.0%
Recurring net profit generation
m PLN
The gain on re-measurement to fair value of previously held shares of PPIM & Xelion
Key levers of growth and achievements
World’s most innovative product
Best Private Bank in Poland 2018 4th time in a row
(1) Pro-forma, 2017 figures include results of Pekao Investment Management S.A. and Xelion under a full consolidation method
Achievements Appendix Financial results Outlook Business development

5
1) In units; 2) MID and large corporate ; 3) Share in total number of granted cash loans 4) Incl. the effect of the reduction of own branches by 34; 5) Retail segment
Key achievements in 2018 Successful execution on all commercial levers of our strategy
Key dimensions
Smart
growth
Digital
Acquisition
Business
efficiency
Expanding in most
profitable products &
maximizing cross-sell
potential
Building outstanding
digital experience
Accelerating
to record levels
Unlocking
full potential
of our distribution
New current accounts1, ths.
Mobile banking active Clients, ths. eop
Loans digital sales share3
Consumer loans volume, bn PLN, eop
New SME & Mid Clients
Mid Corporate total assets, bn PLN,eop
Revenue / Client in corporate2, ths. PLN
Number of branches4, eop
KPIs Commercial levers
406 274
1 614 1 239
12.3 10.7
15.3 13.5
135 119
1 263 938
30% 21%
825 851
126 100
+48% Product redesign and value
proposition
Product offer, organisation set-up
and expertise
Pro-active distribution and new
pricing tools
Portfolio-allocation, roll-out of
product offer and expertise
Cross-sell, actions on pricing and
capital allocation
Investment in digital tools
Customer digitalisation; risk and
pricing tools
Focus on profitability of branches
and geo-locations
Product offer, sales force training and
process automatization
2018 2017
+35%
+13%
+14%
+15%
+9pts
-26
+26%
+30%
Revenue / Sales FTE (indexed)5, ths.PLN
Achievements Appendix Financial results Outlook Business development
6
Lending growth and client acquisition Key achievements Digital and innovation
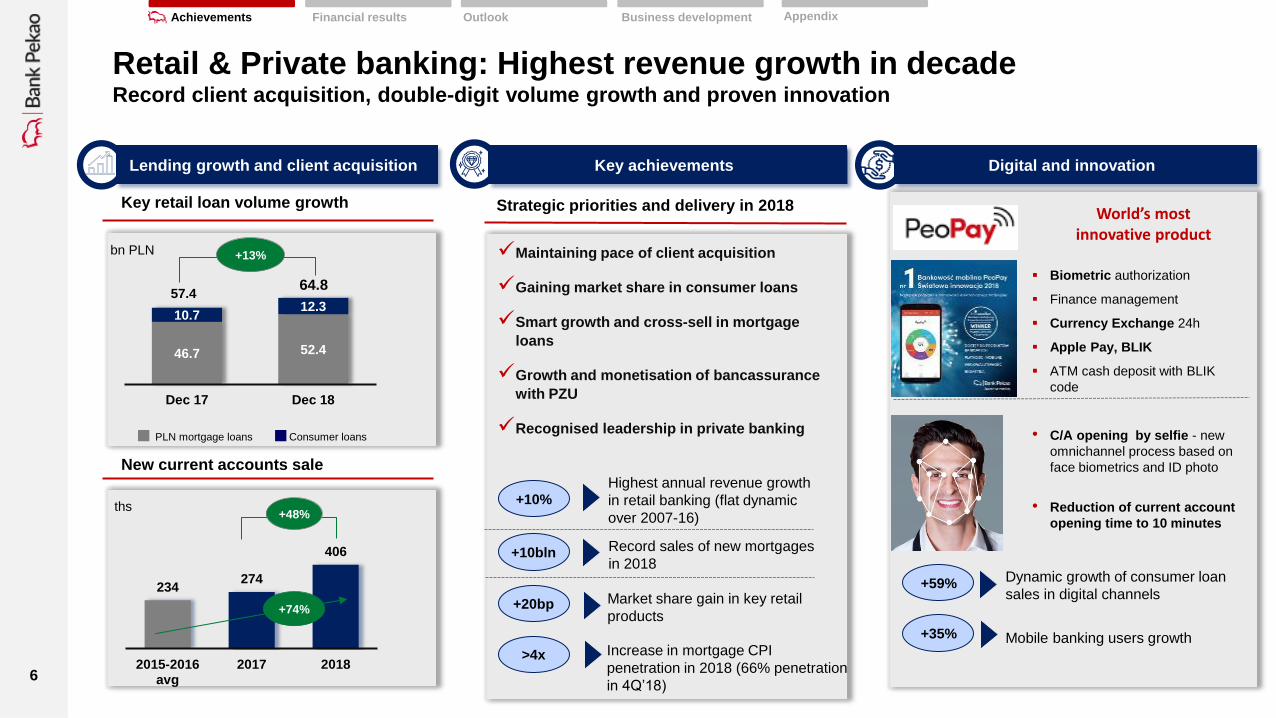
Retail & Private banking: Highest revenue growth in decade Record client acquisition, double-digit volume growth and proven innovation
Key retail loan volume growth
New current accounts sale
46.7 52.4
10.7 12.3
Dec 17 Dec 18
+13%
PLN mortgage loans Consumer loans
57.4 64.8
234 274
406
2015-2016avg
2017 2018
+48%
World’s most innovative product
• C/A opening by selfie - new
omnichannel process based on
face biometrics and ID photo
• Reduction of current account
opening time to 10 minutes
Biometric authorization
Finance management
Currency Exchange 24h
Apple Pay, BLIK
ATM cash deposit with BLIK
code
+74%
bn PLN
Strategic priorities and delivery in 2018
ths
Achievements Appendix Financial results Outlook Business development
Record sales of new mortgages
in 2018 +10bln
+20bp
+10%
Highest annual revenue growth
in retail banking (flat dynamic
over 2007-16)
Market share gain in key retail
products
>4x Increase in mortgage CPI
penetration in 2018 (66% penetration
in 4Q’18)
Maintaining pace of client acquisition
Gaining market share in consumer loans
Smart growth and cross-sell in mortgage
loans
Growth and monetisation of bancassurance
with PZU
Recognised leadership in private banking
+59% Dynamic growth of consumer loan
sales in digital channels
+35% Mobile banking users growth
7
Lending growth and profitability Key achievements
Key corporate loan volume growth
Revenue/Clients(1) and cross-sell(2)
+11%
+13%
+15%
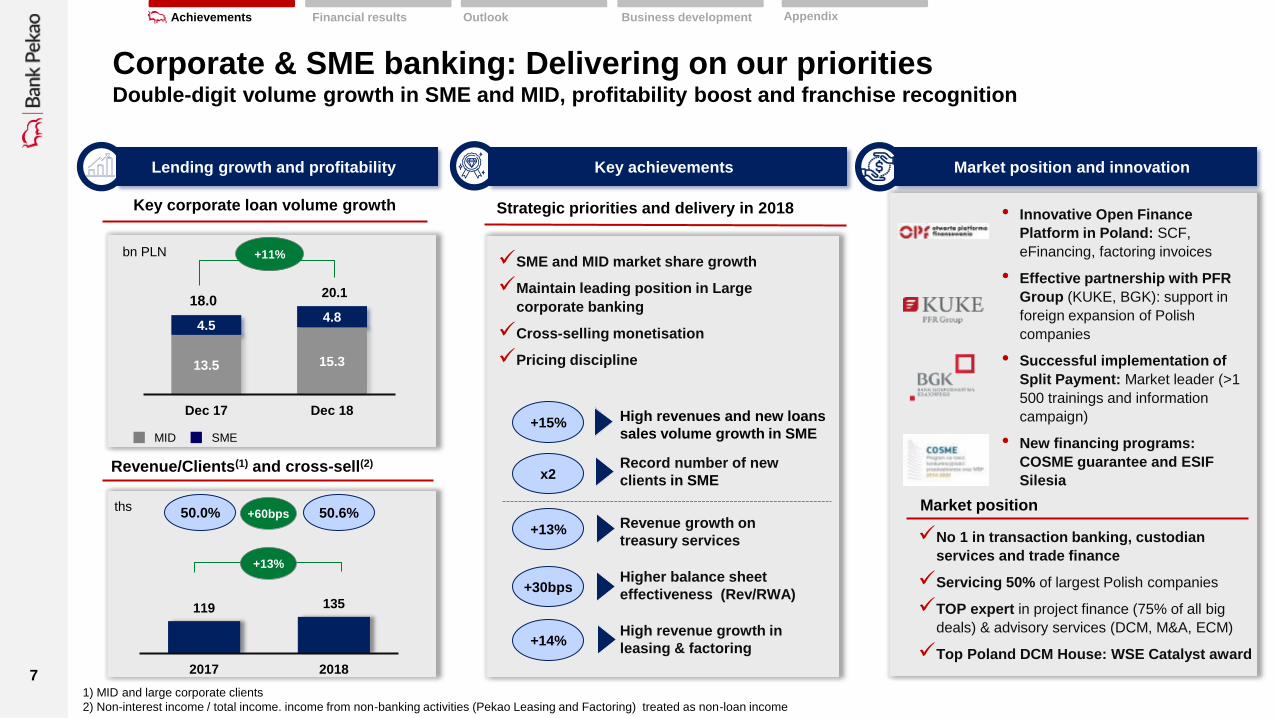
Corporate & SME banking: Delivering on our priorities Double-digit volume growth in SME and MID, profitability boost and franchise recognition
13.5 15.3
4.5 4.8
Dec 17 Dec 18
MID SME
SME and MID market share growth
Maintain leading position in Large
corporate banking
Cross-selling monetisation
Pricing discipline
x2
• Innovative Open Finance
Platform in Poland: SCF,
eFinancing, factoring invoices
• Effective partnership with PFR
Group (KUKE, BGK): support in
foreign expansion of Polish
companies
• Successful implementation of
Split Payment: Market leader (>1
500 trainings and information
campaign)
• New financing programs:
COSME guarantee and ESIF
Silesia
High revenues and new loans
sales volume growth in SME
Record number of new
clients in SME
Revenue growth on
treasury services
+14%
+30bps Higher balance sheet
effectiveness (Rev/RWA)
High revenue growth in
leasing & factoring
No 1 in transaction banking, custodian
services and trade finance
Servicing 50% of largest Polish companies
TOP expert in project finance (75% of all big
deals) & advisory services (DCM, M&A, ECM)
Top Poland DCM House: WSE Catalyst award
Market position
18.0 20.1
bn PLN
Achievements Appendix Financial results Outlook Business development
Market position and innovation
Strategic priorities and delivery in 2018
119 135
2017 2018
+13%
50.6% 50.0% +60bps
1) MID and large corporate clients
2) Non-interest income / total income. income from non-banking activities (Pekao Leasing and Factoring) treated as non-loan income
ths
8
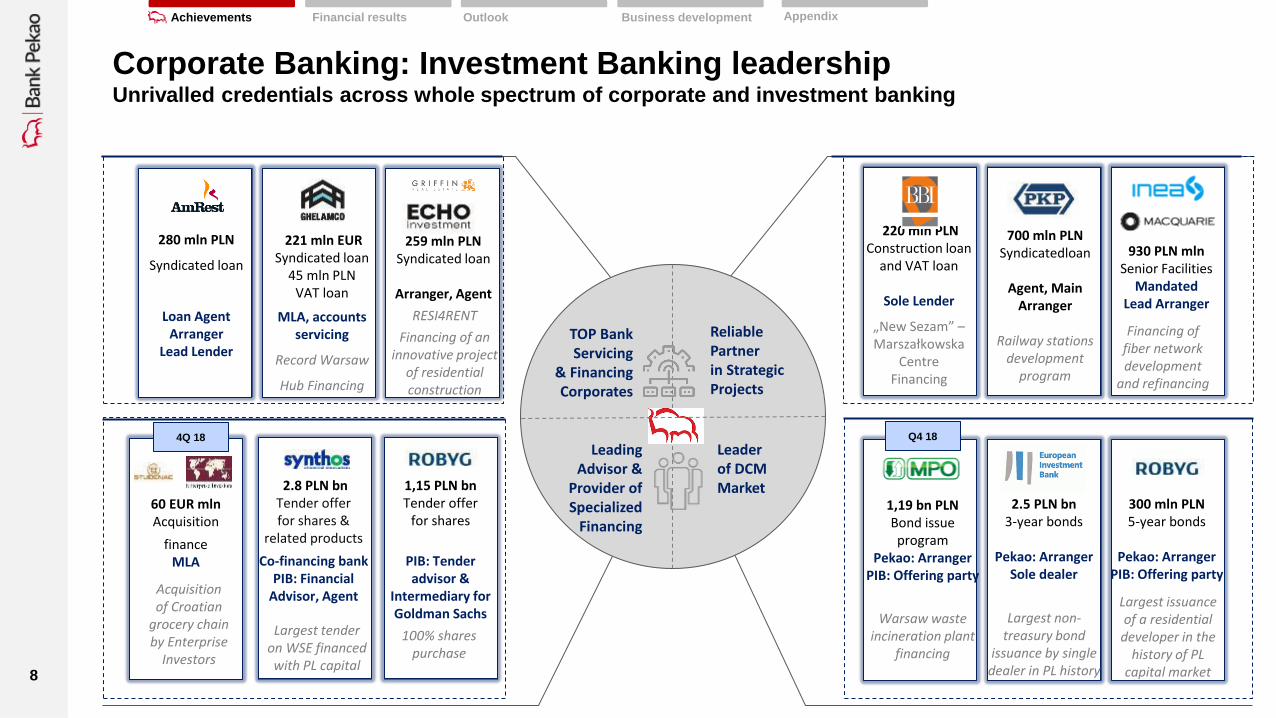
Corporate Banking: Investment Banking leadership Unrivalled credentials across whole spectrum of corporate and investment banking
TOP Bank Servicing
& Financing Corporates
Leading Advisor &
Provider of Specialized
Financing
Reliable Partner in Strategic Projects
Leader of DCM Market 2.8 PLN bn
Tender offer for shares &
related products
Co-financing bank PIB: Financial
Advisor, Agent
1,15 PLN bn Tender offer
for shares
PIB: Tender advisor &
Intermediary for Goldman Sachs
280 mln PLN
Syndicated loan
Loan Agent Arranger
Lead Lender
259 mln PLN Syndicated loan
Arranger, Agent
Largest tender on WSE financed with PL capital
100% shares purchase
60 EUR mln Acquisition
finance MLA
Acquisition of Croatian
grocery chain by Enterprise
Investors
RESI4RENT
Financing of an innovative project
of residential construction
221 mln EUR Syndicated loan
45 mln PLN VAT loan
MLA, accounts servicing
Record Warsaw
Hub Financing
220 mln PLN Construction loan
and VAT loan
Sole Lender
„New Sezam” –Marszałkowska
Centre Financing
700 mln PLN Syndicatedloan
Agent, Main
Arranger
Railway stations development
program
1,19 bn PLN Bond issue program
Pekao: Arranger PIB: Offering party
Warsaw waste incineration plant
financing
300 mln PLN 5-year bonds
Pekao: Arranger
PIB: Offering party
Largest issuance of a residential
developer in the history of PL
capital market
2.5 PLN bn 3-year bonds
Pekao: Arranger
Sole dealer
Largest non-treasury bond
issuance by single dealer in PL history
Q4 18 4Q 18
Financing of fiber network development
and refinancing
930 PLN mln Senior Facilities
Mandated Lead Arranger
Achievements Appendix Financial results Outlook Business development
9
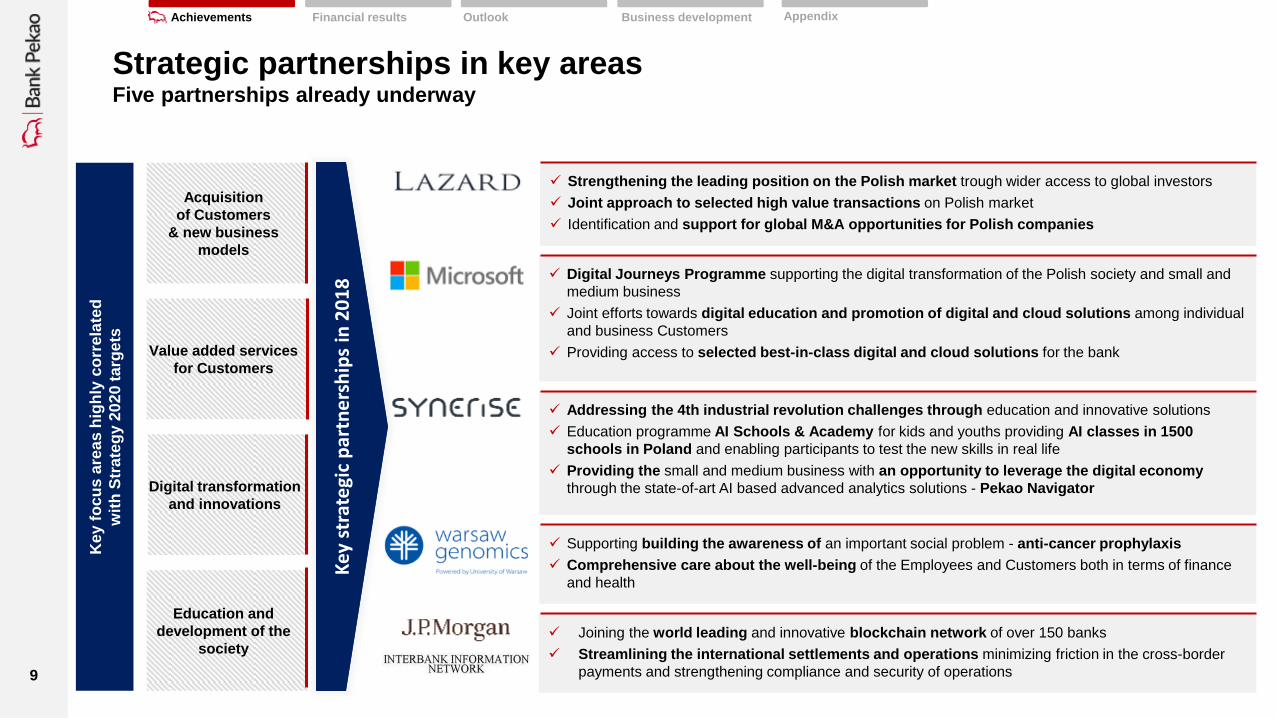
Strategic partnerships in key areas Five partnerships already underway
Key
str
ate
gic
par
tne
rsh
ips
in 2
01
8
Key f
oc
us a
rea
s h
igh
ly c
orr
ela
ted
wit
h S
trate
gy 2
02
0 t
arg
ets
Acquisition
of Customers
& new business
models
Digital transformation
and innovations
Value added services
for Customers
Digital Journeys Programme supporting the digital transformation of the Polish society and small and
medium business
Joint efforts towards digital education and promotion of digital and cloud solutions among individual
and business Customers
Providing access to selected best-in-class digital and cloud solutions for the bank
Strengthening the leading position on the Polish market trough wider access to global investors
Joint approach to selected high value transactions on Polish market
Identification and support for global M&A opportunities for Polish companies
Joining the world leading and innovative blockchain network of over 150 banks
Streamlining the international settlements and operations minimizing friction in the cross-border
payments and strengthening compliance and security of operations
Education and
development of the
society
Addressing the 4th industrial revolution challenges through education and innovative solutions
Education programme AI Schools & Academy for kids and youths providing AI classes in 1500
schools in Poland and enabling participants to test the new skills in real life
Providing the small and medium business with an opportunity to leverage the digital economy
through the state-of-art AI based advanced analytics solutions - Pekao Navigator
Supporting building the awareness of an important social problem - anti-cancer prophylaxis
Comprehensive care about the well-being of the Employees and Customers both in terms of finance
and health
Achievements Appendix Financial results Outlook Business development

10
Investor Day London Rep. Office Opening London CEO Summit Warsaw European Financial Congress Sopot
Awards and events Recognition by market and industry experts
Corporate Bank
EFMA-Accenture Distribution & Marketing Innovation Awards 2018
PeoPay: the most innovative 2018 project
Retail & Private
Newsweek: #1 most customer -friendly mortgage bank in Poland
TOP EMPLOYER 2018/2019 8th time in a row
World’s Best Private Banks 2018 4th time in a row
WSE RESPECT Index Pekao among socially responsible companies 3rd time in a row
Bank Pekao SA infoline once again the best in Poland
Pekao TFI: 1st in the Customer Laurel contest 2019 in the "Investment Fund Companies" category for
Best Corporate Bank in Poland 2018 2nd time in a row
The Best Investment Bank in Poland 2018 2nd time in a row
Best Investment Bank
Best Sub-Custodian in Poland 2018 6th time in a row
Aw
ard
s
Eve
nts
Business Inspirator 2018 - „Innovations”
Pekao Connect – Innowacja 2018
Forbes: #2 Best bank for business customers (#11 in 2017)
WEF Davos
Achievements Appendix Financial results Outlook Business development

11
2017 (ΔY/Y) (1) 2018 (ΔY/Y) Strategic path to 2020
Growth
Loan growth +7% +6% +7-8% (CAGR 2017-20)
Commercial
revenues +4% +10% +10% (CAGR 2017-20)
Efficiency
Cost dynamics +1.6% +2.3% (2) Cost dynamic below CPI inflation
C/I (excl. BFG) 45.3%(3) 43.8% (2) < 40%
Risk CoR 40bps (3) 38bps (3) Up to ~50bps
Profitability ROE 9.2% 10.2% 12.5% (flat interest rates)
(1) Pro-forma, 2017 figures include results of Pekao Investment Management S.A. and Xelion under a full consolidation method and exclude one-off gain on re-measurement to fair value of previously held shares of PPIM
& Xelion
(2) Excluding the cost of voluntary retirement programme of PLN 50m in 1H18
(3) Excluding the impact of the sale of NPLs in 2017 and 2018
Value for investors We are on a clear path to achieve our strategic financials targets in 2020
Key dimensions
Key financial achievements in 2018 Tangible progress achieved on our key financial KPIs
Achievements Appendix Financial results Outlook Business development
12
Key achievements in 2018
Detailed financial performance in 4Q’18 and 2018
2019 business and financial outlook
Business growth and development
Appendix
1
2
3
4
5
13
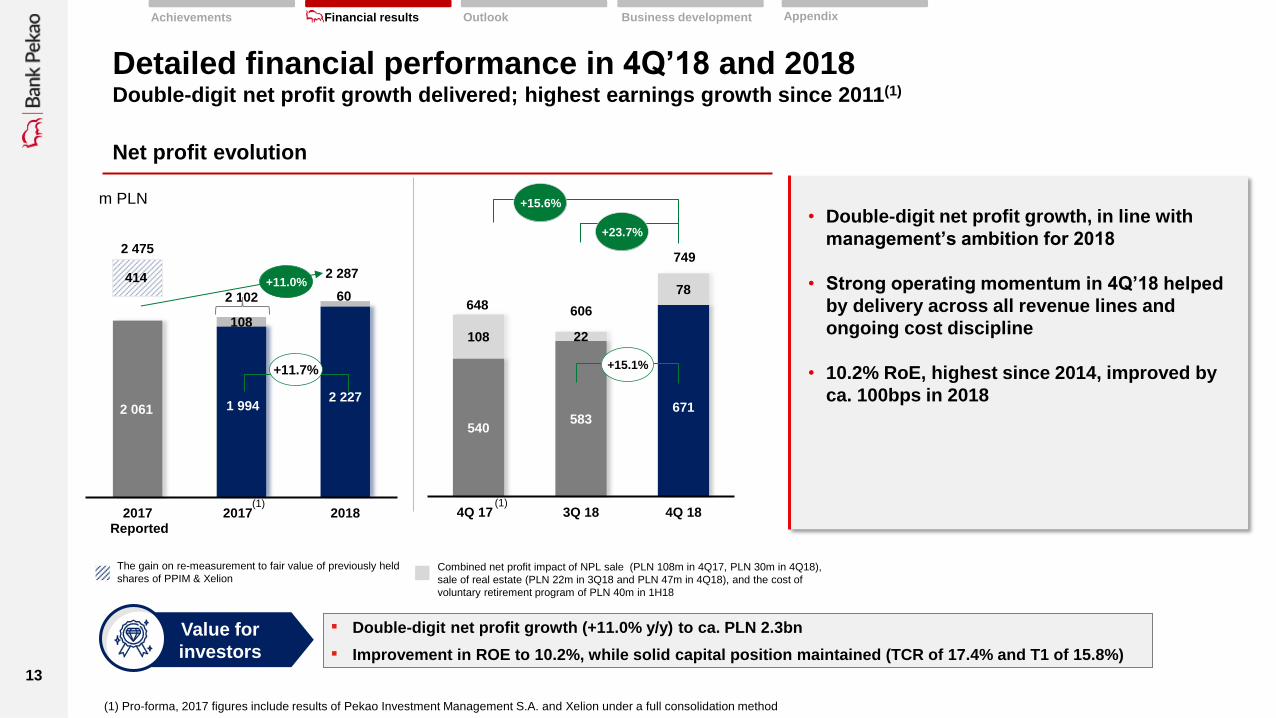
Detailed financial performance in 4Q’18 and 2018 Double-digit net profit growth delivered; highest earnings growth since 2011(1)
• Double-digit net profit growth, in line with
management’s ambition for 2018
• Strong operating momentum in 4Q’18 helped
by delivery across all revenue lines and
ongoing cost discipline
• 10.2% RoE, highest since 2014, improved by
ca. 100bps in 2018
2 061 1 994 2 227
60
108
2017 Reported
2017 2018
2 287
+11.7%
2 475
414 +11.0%
2 102
(1)
Net profit evolution
m PLN
540 583
671
108 22
78
4Q 17 3Q 18 4Q 18
749
648 606
+23.7%
+15.6%
(1)
+15.1%
▪ Double-digit net profit growth (+11.0% y/y) to ca. PLN 2.3bn
▪ Improvement in ROE to 10.2%, while solid capital position maintained (TCR of 17.4% and T1 of 15.8%)
Value for
investors
The gain on re-measurement to fair value of previously held
shares of PPIM & Xelion Combined net profit impact of NPL sale (PLN 108m in 4Q17, PLN 30m in 4Q18),
sale of real estate (PLN 22m in 3Q18 and PLN 47m in 4Q18), and the cost of
voluntary retirement program of PLN 40m in 1H18
(1) Pro-forma, 2017 figures include results of Pekao Investment Management S.A. and Xelion under a full consolidation method
Achievements Appendix Financial results Outlook Business development

14
Detailed financial performance in 4Q’18 and 2018 Record high gross operating profit due to revenue growth and cost discipline
Gross operating profit Operating income
Operating costs
m PLN
• 2018 gross operating profit at PLN 4.4bn, +8.9 y/y on a comparable
basis, thanks to strong income generation and ongoing cost discipline
• Strong 4Q’18 momentum on the back of +7.5% y/y operating income
increase and fall in costs by 1.9% y/y
• Underlying C/I ratio improved by 150bps to 43.8% in 2018, despite
ongoing investment initiatives in digital and operational transformation
7 325
7 757
2017 2018
+5.9%
(1)
864
843 848
4Q 17 3Q 18 4Q 18
-1.9%
+0.5%
(1)
3 319 3 394
50
2017 2018
+3.8% +2.3%
(1)
1 901 1 933
2 044
4Q 17 3Q 18 4Q 18
+7.5%
+5.7%
(1)
1 037 1 089
1 196
4Q 17 3Q 18 4Q 18
+15.3%
+9.8%
(1)
m PLN
m PLN
1) Pro-forma, 2017 figures include results of Pekao Investment Management S.A. and Xelion under a full consolidation method
2) Excluding impact of the cost of voluntary retirement program of PLN 50m in 1H18
4 006 4 313
50
2017 2018
+8.9%
4 006 4 363
(1)
+7.7%
XX% Dynamic excluding impact of the cost of voluntary retirement program of PLN 50m in 1H18
The cost of voluntary retirement program of PLN 50m in 1H18
Appendix Outlook Business development Achievements Financial results
(2)

15
• Continued strong growth
momentum in all businesses
on the back of robust net
interest income and resilience
across fee & commission lines
• Commercial revenue growth
of 10% y/y significantly
outpacing balance sheet growth
7 102 7 457
222
301
2017 2018
7 325
+5.9%
(1)
Detailed financial performance in 4Q’18 and 2018 Acceleration of income generation in 4Q’18; Strong commercial activity across all businesses
Operating income
Other income Core income
1 836 1 877
1 933
65
56
111
4Q 17 3Q 18 4Q 18
1 901
1 933
2 044
+7.5%
7 757
+5.7%
m PLN
1) Pro forma, 2017 figures include results of Pekao Investment Management S.A. and Xelion under a full consolidation method
Strong revenue dynamics
across commercial activity
10%
15%
8%
10%
-7%
Retail &
Private
SME
Corporate
Total
Commercial
2018 ΔY/Y%
ALM and
Others
Effect of obligatory reserves
and lower bond yields
2) Proceeds from NPL sales reported under credit provision line in 2018
(1)
Appendix Outlook Business development Achievements Financial results
(2)
16
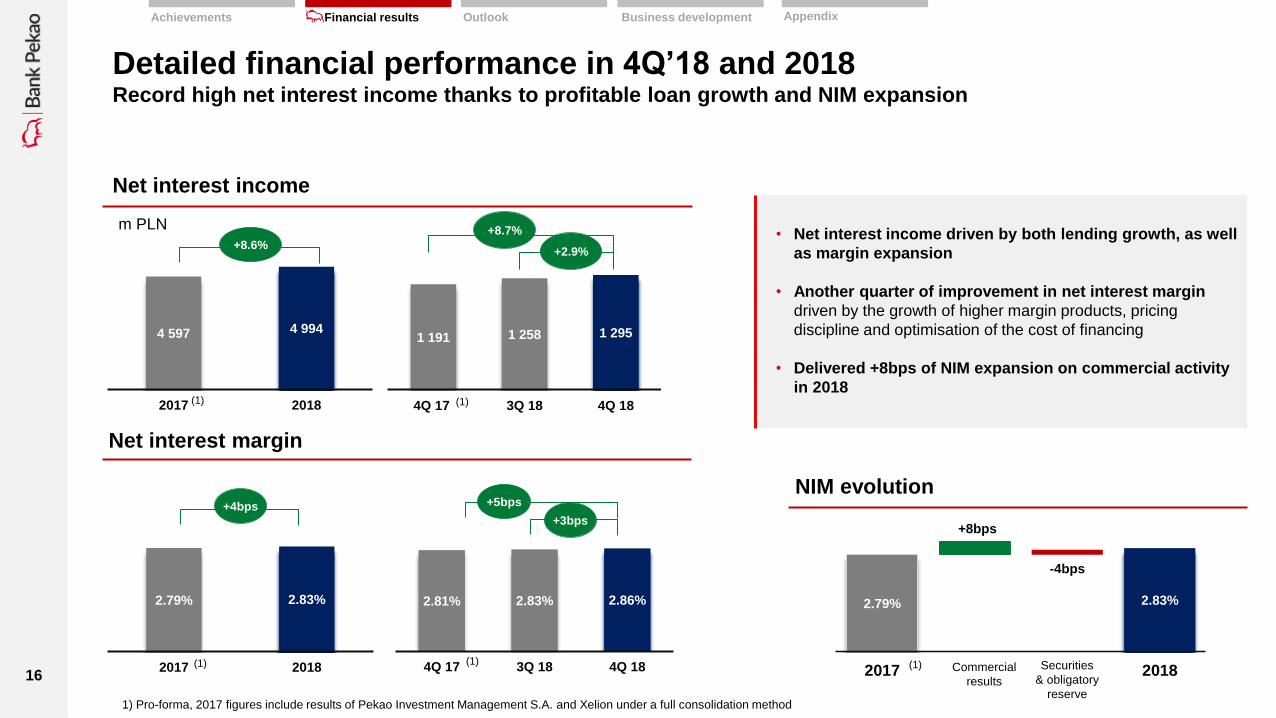
Detailed financial performance in 4Q’18 and 2018 Record high net interest income thanks to profitable loan growth and NIM expansion
Net interest margin
• Net interest income driven by both lending growth, as well
as margin expansion
• Another quarter of improvement in net interest margin
driven by the growth of higher margin products, pricing
discipline and optimisation of the cost of financing
• Delivered +8bps of NIM expansion on commercial activity
in 2018
2.79% 2.83%
2017 2018
+4bps
(1)
4 597 4 994
2017 2018
+8.6%
(1)
2.81% 2.83% 2.86%
4Q 17 3Q 18 4Q 18
+3bps
(1)
m PLN
+5bps
1 191 1 258 1 295
4Q 17 3Q 18 4Q 18
+8.7%
+2.9%
(1)
Net interest income
1) Pro-forma, 2017 figures include results of Pekao Investment Management S.A. and Xelion under a full consolidation method
2.79% 2.83%
+8bps
-4bps
2017 2018Commercial
results
Securities
& obligatory
reserve
NIM evolution
(1)
Appendix Outlook Business development Achievements Financial results

17
Detailed financial performance in 4Q’18 and 2018 Loan origination concentrated on most profitable segments
• Total lending growth of 6% y/y
• Targeted lending activity with 12.8% y/y
increase in key retail lending and 4.4%
lending growth deployed in core corporate
• 20bps of market share gains in key retail
lending through 2018
• Growth in corporate loan portfolio focused
on most profitable segments, with 12.6% y/y
loan volume expansion in mid-market
corporate sector
6 748 6 121 6 131
57 408 63 190 64 784
Dec 17 Sep 18 Dec 18
64 157
69 311 70 915
+12.8%
13 999 13 509 12 727
58 719 60 215 61 299
Dec 17 Sep 18 Dec 18
72 717 73 724 74 027
+4.4%
Corporates (Core corporate)
Other corporate loans (Public sector)
Key retail loans (PLN mortgage, consumer loans)
Other retail loans
+10.5%
+2.3%
+1.8%
+0.4%
Retail loans(1) Corporate loans(2)
1) Gross loans
2) Gross loans, corporate and SME including leasing and factoring, excl. BSB and reverse repo transactions
Appendix Outlook Business development Achievements Financial results
18
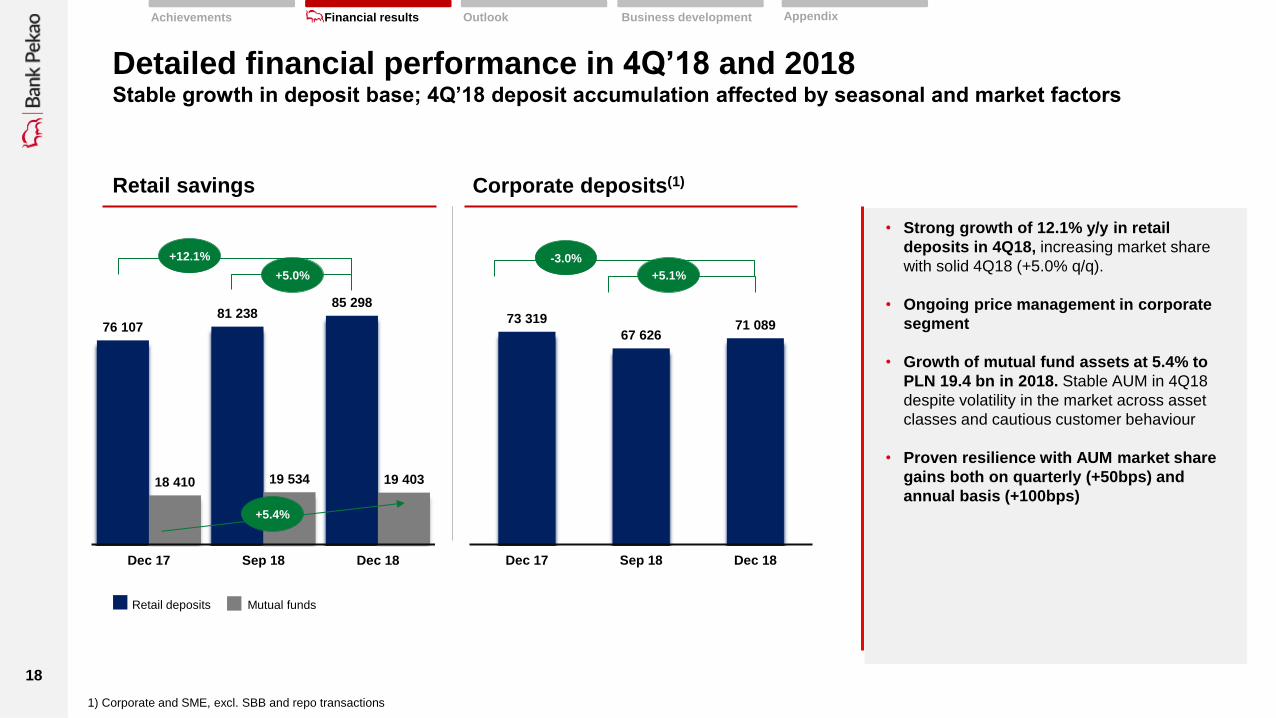
Detailed financial performance in 4Q’18 and 2018 Stable growth in deposit base; 4Q’18 deposit accumulation affected by seasonal and market factors
• Strong growth of 12.1% y/y in retail
deposits in 4Q18, increasing market share
with solid 4Q18 (+5.0% q/q).
• Ongoing price management in corporate
segment
• Growth of mutual fund assets at 5.4% to
PLN 19.4 bn in 2018. Stable AUM in 4Q18
despite volatility in the market across asset
classes and cautious customer behaviour
• Proven resilience with AUM market share
gains both on quarterly (+50bps) and
annual basis (+100bps)
76 107 81 238
85 298
18 410 19 534 19 403
Dec 17 Sep 18 Dec 18
73 319
67 626 71 089
Dec 17 Sep 18 Dec 18
Retail deposits Mutual funds
+12.1%
+5.0%
-3.0%
+5.1%
Retail savings Corporate deposits(1)
1) Corporate and SME, excl. SBB and repo transactions
+5.4%
Appendix Outlook Business development Achievements Financial results
19
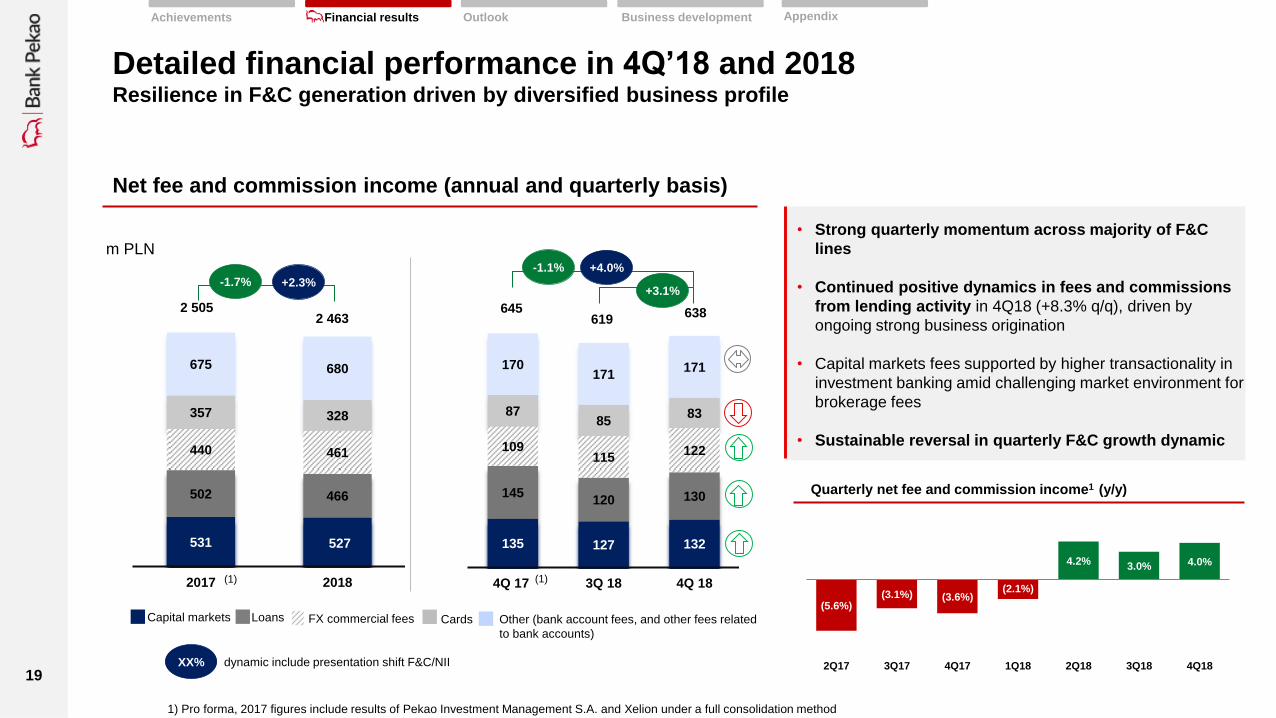
• Strong quarterly momentum across majority of F&C
lines
• Continued positive dynamics in fees and commissions
from lending activity in 4Q18 (+8.3% q/q), driven by
ongoing strong business origination
• Capital markets fees supported by higher transactionality in
investment banking amid challenging market environment for
brokerage fees
• Sustainable reversal in quarterly F&C growth dynamic
Detailed financial performance in 4Q’18 and 2018 Resilience in F&C generation driven by diversified business profile
Net fee and commission income (annual and quarterly basis)
2 505 2 463
645 619
638
Other (bank account fees, and other fees related
to bank accounts)
FX commercial fees Loans Capital markets Cards
m PLN
1) Pro forma, 2017 figures include results of Pekao Investment Management S.A. and Xelion under a full consolidation method
531 527
502 466
440 461
357 328
675 680
2017 2018(1)
-1.7%
135 127 132
145 120 130
109 115
122
87 85
83
170 171
171
4Q 17 3Q 18 4Q 18(1)
+4.0%
XX% dynamic include presentation shift F&C/NII
Quarterly net fee and commission income1 (y/y)
(5.6%) (3.1%) (3.6%)
(2.1%)
4.2% 3.0% 4.0%
2Q17 3Q17 4Q17 1Q18 2Q18 3Q18 4Q18
+2.3%
-1.1%
+3.1%
Appendix Outlook Business development Achievements Financial results
20
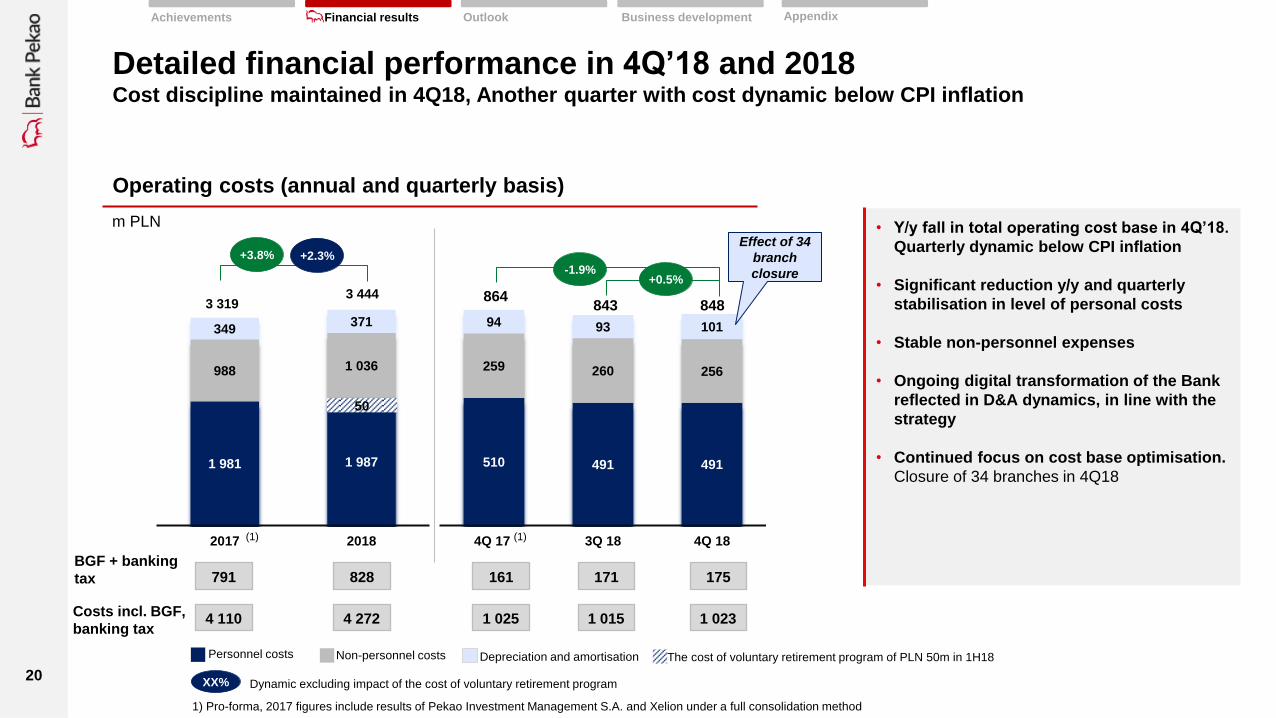
• Y/y fall in total operating cost base in 4Q’18.
Quarterly dynamic below CPI inflation
• Significant reduction y/y and quarterly
stabilisation in level of personal costs
• Stable non-personnel expenses
• Ongoing digital transformation of the Bank
reflected in D&A dynamics, in line with the
strategy
• Continued focus on cost base optimisation.
Closure of 34 branches in 4Q18
Detailed financial performance in 4Q’18 and 2018 Cost discipline maintained in 4Q18, Another quarter with cost dynamic below CPI inflation
Operating costs (annual and quarterly basis)
3 319 3 444
1 981 1 987
988 1 036
349 371
2017 2018
Non-personnel costs
Personnel costs
Depreciation and amortisation
510 491 491
259 260 256
94 93 101
4Q 17 3Q 18 4Q 18
-1.9%
(1)
864 843 848
+0.5%
BGF + banking
tax
Costs incl. BGF,
banking tax 4 110
791
4 272
828
1 025
161
1 015
171
1 023
175
+3.8%
m PLN
1) Pro-forma, 2017 figures include results of Pekao Investment Management S.A. and Xelion under a full consolidation method
+2.3%
XX% Dynamic excluding impact of the cost of voluntary retirement program
(1)
Effect of 34
branch
closure
The cost of voluntary retirement program of PLN 50m in 1H18
50
Appendix Outlook Business development Achievements Financial results

21
Detailed financial performance in 4Q’18 and 2018 Prudent risk control: Stable cost of risk and continually high asset quality
NPL ratio
Cost of risk (annual and quarterly basis)
• Annual and quarterly improvement in cost of
risk
• COR significantly below market
• Continually one of the highest NPL coverage
ratios in the Polish sector
• NPL ratio improving, helped by active risk
management (NPL sale)
NPL coverage ratio
5.5% 5.8% 5.4%
4Q 17 3Q 18 4Q 18
-2bps
Including IBNR, basket 1-2
67% 65% 66%
16% 14% 13%
4Q 17 3Q 18 4Q 18
83% 80% 79%
-40bps
Appendix Outlook Business development Achievements Financial results
1) restated, methodology unified for all periods. NPL ratio and coverage ratio included restricted interests, which was written off in June 2018
2) COR excluding sale of NPLs
(1) (1)
2017 2018
0.40% 0.38%
(2) (2)
0.46%
0.34% 0.33%
0.43% 0.35%
0.75%
0.63%
0.78% 0.73%
0.84%
4Q17 1Q18 2Q18 3Q18 4Q18
Bank Market
Source: Market – NBP; Bank – non-consolidated data consistent with NBP methodology
22
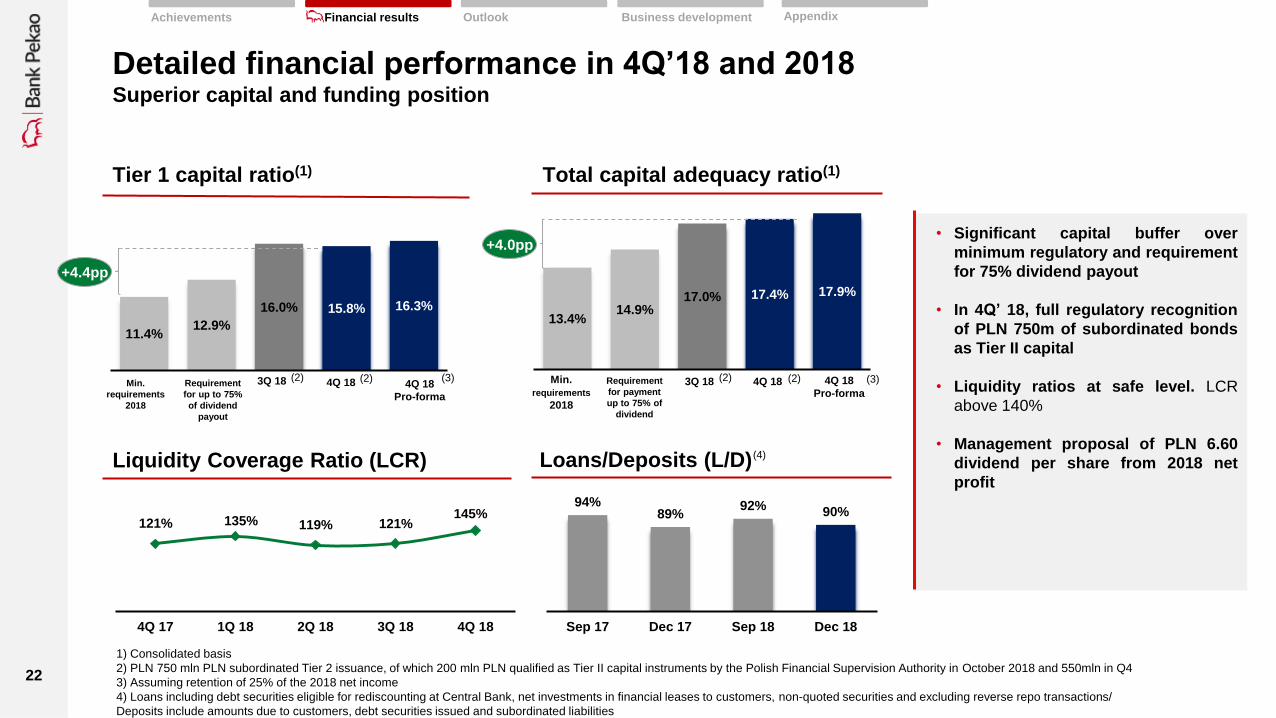
Detailed financial performance in 4Q’18 and 2018 Superior capital and funding position
Tier 1 capital ratio(1)
• Significant capital buffer over
minimum regulatory and requirement
for 75% dividend payout
• In 4Q’ 18, full regulatory recognition
of PLN 750m of subordinated bonds
as Tier II capital
• Liquidity ratios at safe level. LCR
above 140%
• Management proposal of PLN 6.60
dividend per share from 2018 net
profit
Total capital adequacy ratio(1)
Liquidity Coverage Ratio (LCR) Loans/Deposits (L/D)
94% 89%
92% 90%
Sep 17 Dec 17 Sep 18 Dec 18
121% 135% 119% 121% 145%
4Q 17 1Q 18 2Q 18 3Q 18 4Q 18
13.4% 14.9%
17.0% 17.4% 17.9%
Min.
requirements
2018
Requirement
for payment
up to 75% of
dividend
3Q 18 4Q 18
11.4% 12.9%
16.0% 15.8% 16.3%
Min.
requirements
2018
Requirement
for up to 75%
of dividend
payout
3Q 18 4Q 18
+4.4pp
+4.0pp
4Q 18
Pro-forma
4Q 18
Pro-forma
(3) (3)
1) Consolidated basis
2) PLN 750 mln PLN subordinated Tier 2 issuance, of which 200 mln PLN qualified as Tier II capital instruments by the Polish Financial Supervision Authority in October 2018 and 550mln in Q4
3) Assuming retention of 25% of the 2018 net income
4) Loans including debt securities eligible for rediscounting at Central Bank, net investments in financial leases to customers, non-quoted securities and excluding reverse repo transactions/
Deposits include amounts due to customers, debt securities issued and subordinated liabilities
(2) (2) (2) (2)
(4)
Appendix Outlook Business development Achievements Financial results

23
Key achievements in 2018
Detailed financial performance in 4Q’18 and 2018
2019 business and financial outlook
Business growth and development
Appendix
1
2
3
4
5

24
2019 Business and financial outlook Key strategic initiatives underway in 2019 driving commercial effectiveness
Appendix Business development Financial results Outlook Achievements
Credit process 2.0
Client Value Management Sales Force Effectiveness
What are we going to do?
Identification of key Clients and prospects
Sales network operating model optimization
Streamlining key processes (Client planning, pricing,
Cooperation with Bank’s subsidiaries)
Providing modern and intelligent IT tools (sales support)
Intelligent growth supported by excellent understanding
of Client potential and needs
Unleashing sales potential of the network thanks to
digitization, automation and streamlining of processes
Effective pricing & optimal capital allocation
What are we going to do?
Optimization of retail branch network activities with
special focus on:
reorganizing operating model
equipping RM’s with necessary digital support tools
calibration of the incentives system
What do we want to achieve?
Building sustainable competitive advantage in terms of
retail branch network effectiveness and service quality
Ensuring consistency with market trends and evolving
Customer needs
CIB Retail
All
segments
What are we going to do?
Comprehensive review & optimization
Implementing cutting-edge IT tools
to achieve best-in-class Customer
experience
e2e process acceleration
Smart credit processes based on a
common system architecture
What do we want to achieve?
What do we want to achieve?

25
Omnichannel Platform – futher
development
C/A opening via „selfie” in PeoPay
New internet banking platforms
Pekao24 for individuals and micro
New functions in PeoPay (Mobile
authorization, GarminPay, P2P BLIK,
contacless cash withdrawals)
New simplified credit card offer with
additional benefits
New offer dedicated to private
banking clients
New services in the area of
knowledge and trainings for
microfirms
New internet banking platforms
PekaoBiznes24 for SME and
Corpo
Value added services for
Customers through
partnerships
Pekao Connect System -
Integrating Pekao and clients
accounting systems
Acquiring transformation
(process and product innovation)
Dedicated team of specialists
responsible for driving
innovations
Cooperation with partners on
banking unique value
proposition
Operational
Effectivness
Robotic process and
servicess automatisation
IT transformation
Franchise smart
optimiztion
Fit organisation
Pekao Innovation Lab
Transforming Bank Pekao to become leader in effectiveness
and digital champion delivering client value
Innovative
Environment
Corporate & SME Retail & Private
Relationship building & cross-sell
Value Added Services
Robotic Process Automation & Streamlining
Retail
CIB
SME
Back Office
Inn
ova
tio
n fo
cus
Customer experience & channel integration
2019 Business and financial outlook Key strategic initiatives underway in 2019 driving digital and operational transformation
Appendix Business development Financial results Outlook Achievements
26
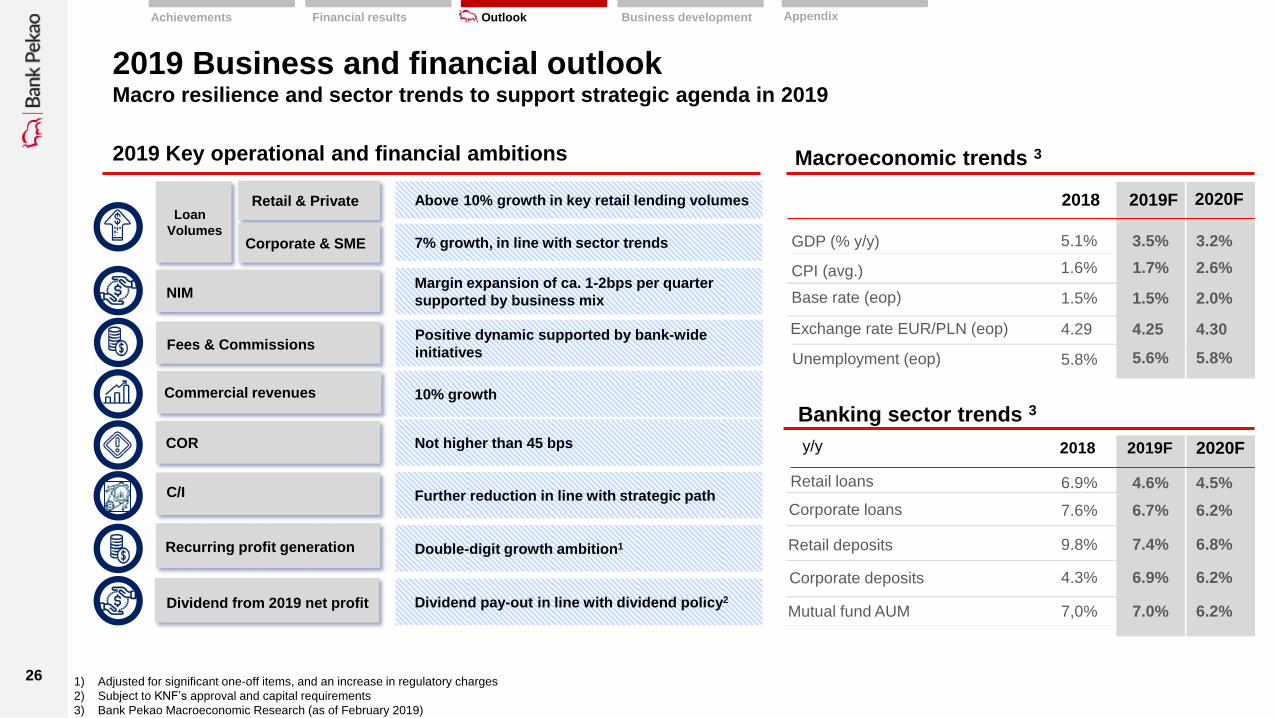
y/y
Banking sector trends 3
Macroeconomic trends 3 Net profit Net profit 2019 Key operational and financial ambitions
2018 2019F
GDP (% y/y) 5.1% 3.5%
CPI (avg.) 1.6% 1.7%
Base rate (eop) 1.5% 1.5%
2018 2019F
Retail loans 6.9% 4.6%
Retail deposits 9.8% 7.4%
Corporate deposits 4.3% 6.9%
Mutual fund AUM 7,0% 7.0%
Corporate loans 7.6% 6.7%
1) Adjusted for significant one-off items, and an increase in regulatory charges
2) Subject to KNF’s approval and capital requirements
3) Bank Pekao Macroeconomic Research (as of February 2019)
Exchange rate EUR/PLN (eop) 4.29 4.25
2020F
2020F
3.2%
2.6%
2.0%
4.30
4.5%
6.2%
6.8%
6.2%
6.2%
Retail & Private Above 10% growth in key retail lending volumes Loan
Volumes Corporate & SME
NIM
Commercial revenues
COR
C/I
Recurring profit generation
Dividend from 2019 net profit
7% growth, in line with sector trends
Margin expansion of ca. 1-2bps per quarter
supported by business mix
10% growth
Not higher than 45 bps
Further reduction in line with strategic path
Double-digit growth ambition1
Dividend pay-out in line with dividend policy2
Fees & Commissions Positive dynamic supported by bank-wide
initiatives Unemployment (eop) 5.8% 5.6% 5.8%
2019 Business and financial outlook Macro resilience and sector trends to support strategic agenda in 2019
Appendix Financial results Outlook Business development Achievements

27
Successful execution of our strategic ambitions in 2018
Double-digit RoE in 2018 (10.2%) achieved for a first time since 2014
+10% commercial revenue growth outpacing ca. 2x growth in deployed balance sheet in 2018
Exceeded milestone of +400K new current accounts, powered by a world-class digital platform: PeoPay
150bps improvement in Cost/Income ratio supported by ongoing digital transformation
Strong commercial and operational momentum into 2019 to deliver on our 2020 strategic goals
+11% net profit growth delivering on our ambition and promise, to reach ca. PLN 2.3bn net profit
Achievements Appendix Financial results Outlook Business development

28
Key achievements in 2018
Detailed financial performance in 4Q’18 and 2018
2019 business and financial outlook
Business growth and development
Appendix
1
2
3
4
5
29
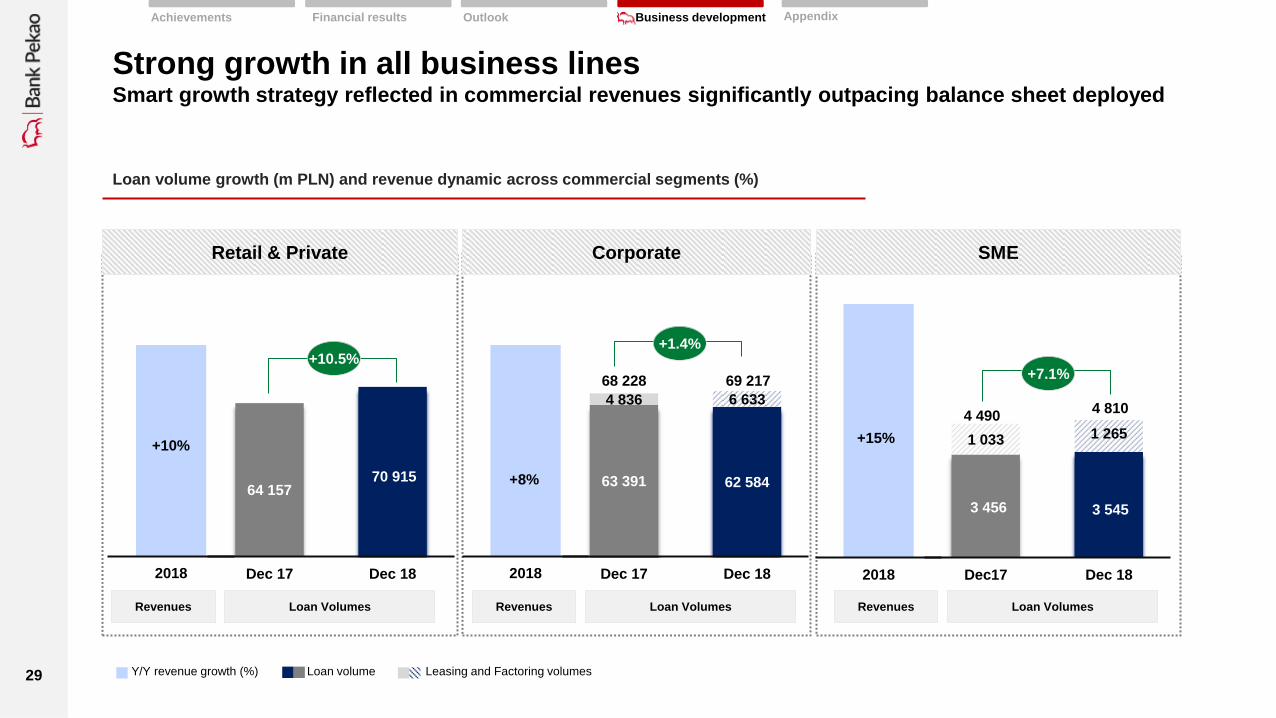
Strong growth in all business lines Smart growth strategy reflected in commercial revenues significantly outpacing balance sheet deployed
Loan volume growth (m PLN) and revenue dynamic across commercial segments (%)
64 157 70 915
Dec 17 Dec 182018
+10%
63 391 62 584
4 836 6 633
Dec 17 Dec 182018
+8%
3 456 3 545
1 033 1 265
Dec17 Dec 182018
+15%
4 490 4 810
Loan volume Leasing and Factoring volumes
+7.1%
+1.4% +10.5%
Corporate SME
Y/Y revenue growth (%)
68 228
Revenues Loan Volumes Revenues Loan Volumes Revenues Loan Volumes
69 217
Retail & Private
Appendix Financial results Outlook Business development Achievements
30
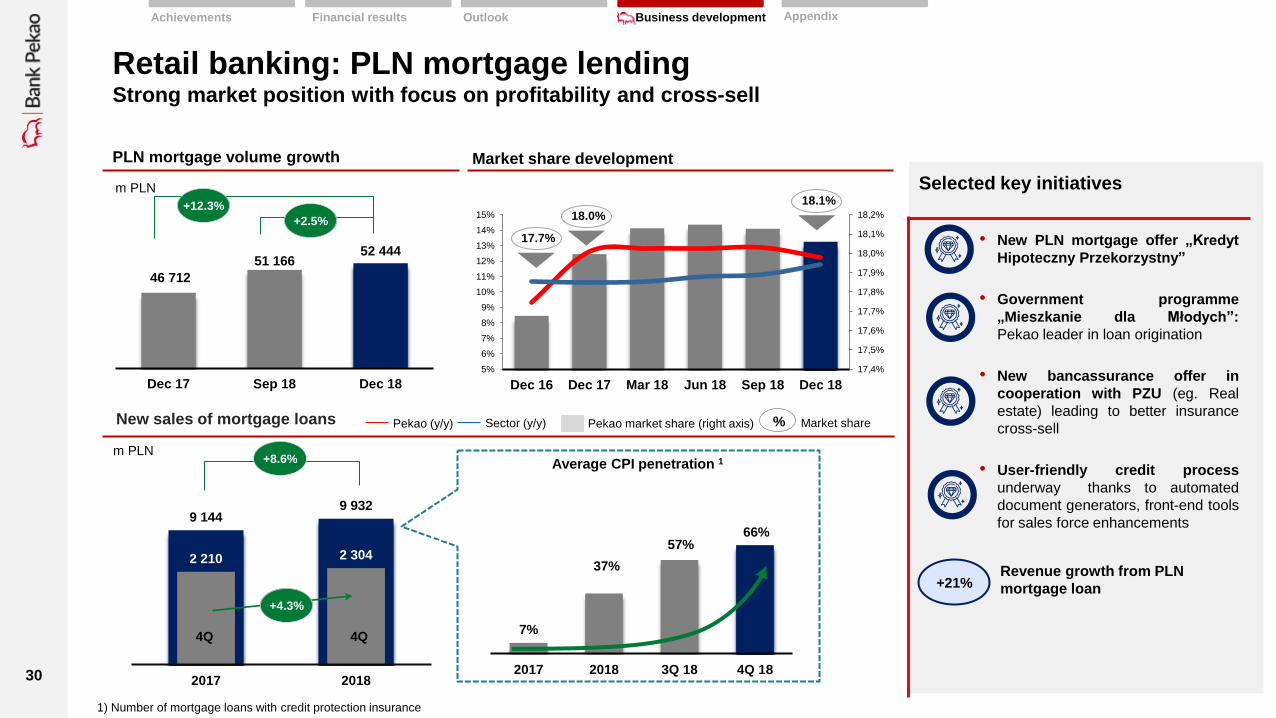
Retail banking: PLN mortgage lending Strong market position with focus on profitability and cross-sell
• New PLN mortgage offer „Kredyt
Hipoteczny Przekorzystny”
• Government programme
„Mieszkanie dla Młodych”:
Pekao leader in loan origination
• New bancassurance offer in
cooperation with PZU (eg. Real
estate) leading to better insurance
cross-sell
• User-friendly credit process
underway thanks to automated
document generators, front-end tools
for sales force enhancements
1) Number of mortgage loans with credit protection insurance
Selected key initiatives
+21% Revenue growth from PLN
mortgage loan
Appendix Financial results Outlook Business development Achievements
46 712
51 166 52 444
Dec 17 Sep 18 Dec 18
+2.5%
+12.3%
PLN mortgage volume growth
m PLN
Market share development
17,4%
17,5%
17,6%
17,7%
17,8%
17,9%
18,0%
18,1%
18,2%
5%
6%
7%
8%
9%
10%
11%
12%
13%
14%
15%
Dec 16 Dec 17 Mar 18 Jun 18 Sep 18 Dec 18
17.7%
18.1%
Pekao (y/y) Sector (y/y) Pekao market share (right axis) % Market share
18.0%
New sales of mortgage loans
m PLN +8.6%
7%
37%
57% 66%
2017 2018 3Q 18 4Q 18
Average CPI penetration 1
9 144 9 932
2 210 2 304
0
500
1 000
1 500
2 000
2 500
3 000
3 500
0
1 000
2 000
3 000
4 000
5 000
6 000
7 000
8 000
9 000
10 000
2017 2018
4Q 4Q
+4.3%
31
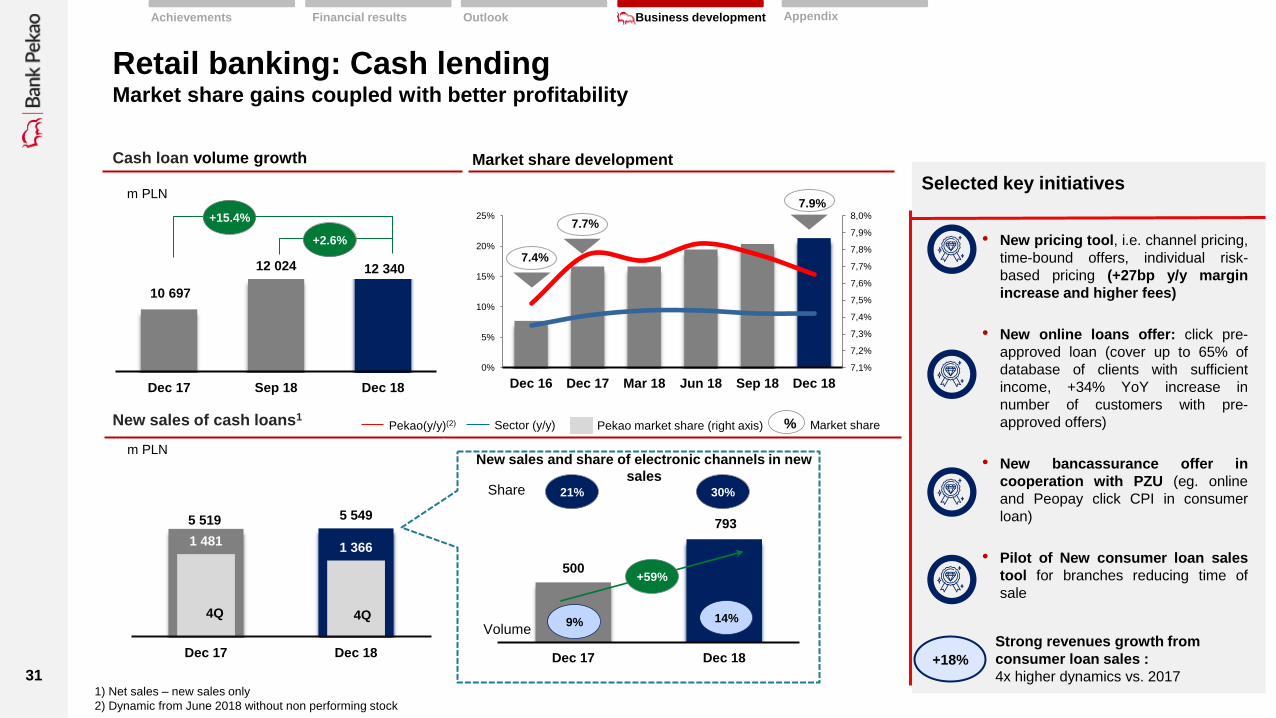
Retail banking: Cash lending Market share gains coupled with better profitability
1) Net sales – new sales only
2) Dynamic from June 2018 without non performing stock
• New pricing tool, i.e. channel pricing,
time-bound offers, individual risk-
based pricing (+27bp y/y margin
increase and higher fees)
• New online loans offer: click pre-
approved loan (cover up to 65% of
database of clients with sufficient
income, +34% YoY increase in
number of customers with pre-
approved offers)
• New bancassurance offer in
cooperation with PZU (eg. online
and Peopay click CPI in consumer
loan)
• Pilot of New consumer loan sales
tool for branches reducing time of
sale
+18%
Strong revenues growth from
consumer loan sales :
4x higher dynamics vs. 2017
Selected key initiatives
Appendix Financial results Outlook Business development Achievements
7,1%
7,2%
7,3%
7,4%
7,5%
7,6%
7,7%
7,8%
7,9%
8,0%
0%
5%
10%
15%
20%
25%
Dec 16 Dec 17 Mar 18 Jun 18 Sep 18 Dec 18
10 697
12 024 12 340
Dec 17 Sep 18 Dec 18
7.9%
7.4%
+15.4%
+2.6%
m PLN
Cash loan volume growth
7.7%
Market share development
4Q 4Q
500
793
Dec 17 Dec 18
21% 30% Share
New sales and share of electronic channels in new
sales
+59%
9% 14% Volume
5 519 5 549
1 481 1 366
0
500
1 000
1 500
2 000
2 500
3 000
3 500
0
1 000
2 000
3 000
4 000
5 000
6 000
7 000
8 000
9 000
10 000
Dec 17 Dec 18
m PLN
4Q 4Q
New sales of cash loans1 Pekao(y/y)(2) Sector (y/y) Pekao market share (right axis) % Market share

32
234 274
406
68 115
0
50
100
150
200
250
300
350
400
450
2015-2016 avg
2017 2018
10.4%
11.4%
Dec 17 Dec 18
Retail banking: Customer acquisition and investment management 400k acquisition target achieved; Resilience of asset management franchise in challenging market
Current Accounts: gross sale
ths
Mutual funds AUM1
+5.4%
Dec 17 Sep 18 Dec 18
18 410
19 403
+4.3%
2017 2018
1 523
1 590 • New Accounts Konto
Przekorzystne and Konto Świat
Premium with unique,
comprehensive offer
• Omnichannel C/A: Current account
in 10 minutes
• My First Fund: New attractive offer
for customers opening first mutual
fund (0 PLN upfront fee up to PLN
100k AUM)
• 4 new subscriptions of structured
products with full capital
protection
m PLN
m PLN
19 534
4Q 4Q
Investment products: net sale
Retail mutual funds market share (AUM)
+100bps
+74.0%
+12%
Good revenues growth
momentum from investment
products
+48.2%
1) Mutual funds managed by PPIM
Selected key initiatives
Appendix Financial results Outlook Business development Achievements

33
Selected key initiatives
119 135
2017 2018
2.9% 3.2%
2017 2018
Corporate banking: Consistent execution of strategy Strong focus on profitability and cross-selling potential
50.0% 50.6%
2017 2018
+30bps
Cross-sell(1)
1) Non-interest income / total income. income from non-banking activities (Pekao Leasing and Factoring) treated as non-loan income
2) In comparable terms (the same methodology of RWA calculation for both years)
3) Mid&Large
MID banking: Total assets
13 554 14 881 15 265
Dec 17 Sep 18 Dec 18
m PLN
Total revenue/RWA(2)
m PLN +60bps
Revenues per client (MID&large)
+13.8%
• 1st Innovative Open Finance
Platform in Poland: Managing SCF,
eFinancing, factoring invoices
• Kuke and Pekao cooperation: KUKE
guarantees support foreign expansion
of Polish companies thanks to access
financial instruments
• Split Payment: Nr 1 in the market (incl.
over 1,500 trainings and information
campaign)
• E-guarantee: Bank guarantees online
issued as an electronic document with
qualified electronic signature via
PekaoBiznes24 system
• 1st Municipal Investment Fund in
Poland: Pekao Samorząd Plus FIZ
+12.6%
+2.6%
ths PLN
Appendix Financial results Outlook Business development Achievements

34
SME banking: Growth momentum intact Strong client acquisition; sustainable asset growth
Loan sales
3 456 3 545
1 033 1 265
Dec 17 Dec 18
Loan volumes
Loans Leasing and Factoring
m PLN
+7%
m PLN
4 490 4 810
1 725 1 615
584 1 022
2017 2018
2 309 2 637
Loans Leasing and Factoring
+14%
x2
2017 2018
pcs
Clients acquisition1 Revenues per client
• 60 SME centres established ensuring client
proximity, servicing >50k SMEs
• Universal agreement for comprehensive offer in
transactional banking
• Hire of SME product specialists to support
cross-sell (treasury, leasing, factoring, EU
Funds)
• Unique solution for SME Companies: Loans
with the COSME guarantee. The guarantee line
signed directly with EFI for a record PLN 1.2bn
• ESIF Silesia Program: Preferential loans for
SME companies located in the Silesian Region
2017 2018
+19%
1) Clients with annual turnover above PLN 5m
PLN
Selected key initiatives
Appendix Financial results Outlook Business development Achievements

35
Digital Innovation Industry-leading initiatives supporting growth
Active clients of electronic banking1
ths PLN ths PLN
Payments in mobile banking PeoPay 2
Active clients of mobile banking1
2013 2014 2015 2016 2017 2018
2.6x
pcs.
1) Unique clients with min. 1 log-in within last 3 months
2) Transactions including HCE, Apple Pay, BLIK, QR
1 157
• Maximizing user experience thanks
to remote identity verification based
on face biometrics and ID photo
• Biometric authorization
• Finance management
• Currency Exchange 24h
• Online card managment
• Apple Pay, BLIK
• ATM cash deposit with BLIK code
1 981 1 998
2 185
Dec 17 Sep 18 Dec 18
+ 10%
938 1 179 1 263
Dec 17 Sep 18 Dec 18
+ 35%
• Testing new technologies
(biometrics, AI, machine learning)
• Hackathons, Service jams (i.e. new
branch format)
• Creating new services and products
concepts
Innovation Lab
World’s
most innovative product
Key achievements
Selected key initiatives
C/A opening by selfie
+99%
+94%
+88%
+30%
• growth in the number of daily
activations of PeoPay
• transfers realized via electronic
channels
• term deposits opened via electronic
channels
• Share of sales of consumer loan
PEX in electronic channels
Appendix Financial results Outlook Business development Achievements

36
Employer of the Best Talent Numerous initiatives supporting growth and development of our workforce
Streamlining recruitment processes
Nearly 4x YoY growth in # new hirings
Improving employees onboarding
Investing in managerial competences: Attracted
>80 new top professionals from PL and international
Establishing dedicated unit responsible for
innovations and cooperation with start-ups &
fintechs
Stimulating generational change
Roll-out of Voluntary retirement program
Improving competences
Increased engagement in professional
trainings (# trainees +162% YoY)
Boosting employer branding outlays to attract
professionals with strategic competences (Big Data,
Innovations, IT Developers, Sales)
Establishing strategic cooperation with Poland’s best
economics universities (SGH, WSE, Kozminski
University)
New summer internship program for talented
students of best PL and European universities
Effective employer branding
Simplifying management structure
Reducing number of director positions by 12%
YoY with total cost reduction by 10% YoY
2020 Strategy levers Strategic initiatives
"Top of mind"
banking
employer
Unique
development
opportunities
Attractive
remuneration
Organizational
culture
Market recognition: 8th time in a row
Appendix Financial results Outlook Business development Achievements

37
Key achievements in 2018
Detailed financial performance in 4Q’18 and 2018
2019 business and financial outlook
Business growth and development
Appendix
1
2
3
4
5
38
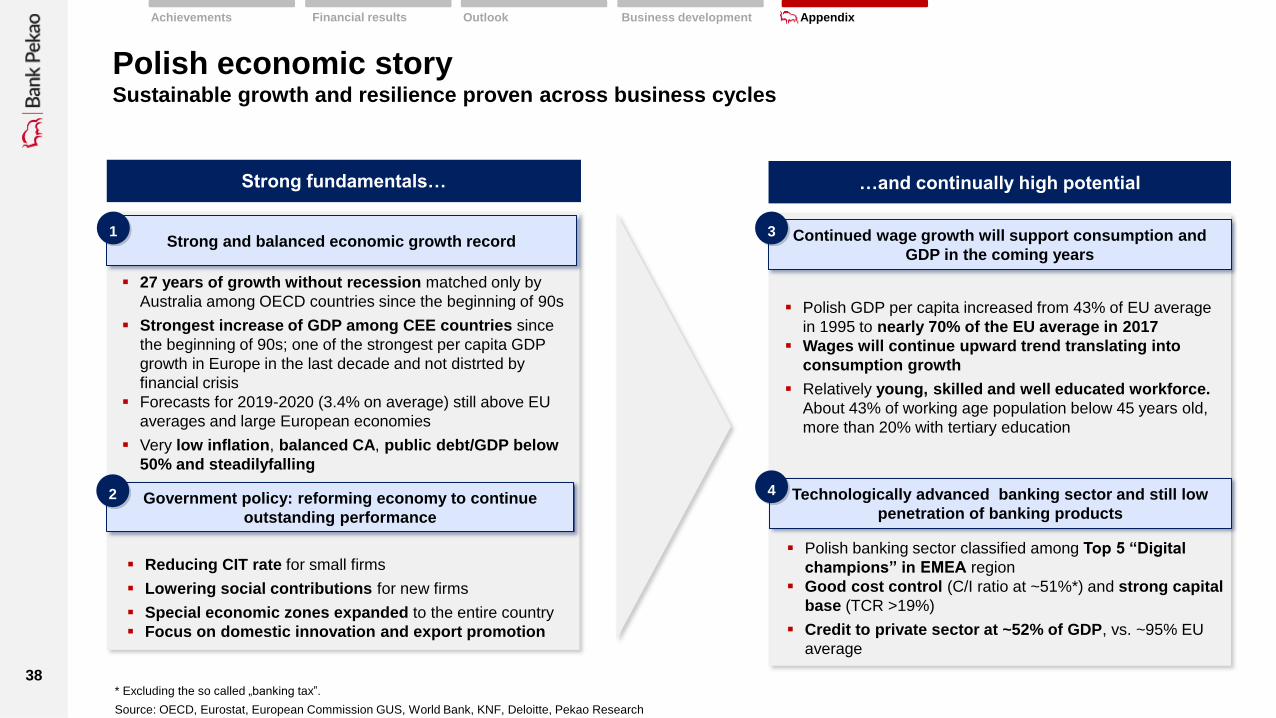
Polish economic story Sustainable growth and resilience proven across business cycles
* Excluding the so called „banking tax”.
Source: OECD, Eurostat, European Commission GUS, World Bank, KNF, Deloitte, Pekao Research
Strong fundamentals… …and continually high potential
Strong and balanced economic growth record
Government policy: reforming economy to continue
outstanding performance
Continued wage growth will support consumption and
GDP in the coming years
Technologically advanced banking sector and still low
penetration of banking products
27 years of growth without recession matched only by
Australia among OECD countries since the beginning of 90s
Strongest increase of GDP among CEE countries since
the beginning of 90s; one of the strongest per capita GDP
growth in Europe in the last decade and not distrted by
financial crisis
Forecasts for 2019-2020 (3.4% on average) still above EU
averages and large European economies
Very low inflation, balanced CA, public debt/GDP below
50% and steadilyfalling
Reducing CIT rate for small firms
Lowering social contributions for new firms
Special economic zones expanded to the entire country
Focus on domestic innovation and export promotion
Polish GDP per capita increased from 43% of EU average
in 1995 to nearly 70% of the EU average in 2017
Wages will continue upward trend translating into
consumption growth
Relatively young, skilled and well educated workforce.
About 43% of working age population below 45 years old,
more than 20% with tertiary education
Polish banking sector classified among Top 5 “Digital
champions” in EMEA region
Good cost control (C/I ratio at ~51%*) and strong capital
base (TCR >19%)
Credit to private sector at ~52% of GDP, vs. ~95% EU
average
1
2
3
4
Appendix Financial results Outlook Achievements Business development

39
2019 Outlook Solid growth of bank sector volumes despite less robust economic environment
Economic outlook Bank sector outlook
Pekao Research forecasts as of January 2019
(1) all non-housing loans (2) internal macroeconomic scenario, fixed exchange rates (3) deposits + retail customers assets in investment funds units (4) retail customers assets in investment funds units
2018 2019F 2020F
GDP, % 5.1 (F) 3.5 3.2
Private consumption, % y/y 4.5 (F) 3.8 3.5
Investments, % y/y 7.3 (F) 6.0 5.0
Unemployment, % eop 5.8 5.6 5.8
CPI, % avg 1,6 1.7 2.6
3M WIBOR, % eop 1.72 1.75 2.35
Reference rate, % eop 1,50 1.5 2.0
Exchange rate EUR, eop 4.29 4.25 4.30
Exchange rate USD, eop 3.74 3.79 3.74
Public sector balance, % GDP (0.6)(F) (0.9) (1.5)
2018 2019F 2020F (2)
Loans, % y/y 7.1 5.4 5.2
Retail, % y/y 6.9 4.6 4.5
Mortgage loans PLN 11.8 9.1 8.0
Consumer loans (1) 6.9 5.4 5.3
Corporate, % y/y 7.6 6.7 6.2
Savings (3) , % y/y 7.5 (F) 7.2 6.7
Deposits, % y/y 9.0 7.2 6.6
Retail, % y/y 9.8 7.4 6.8
Corporate, % y/y 4.3 6.9 6.2
Mutual Funds (4) , % y/y 7.0 7.0 n.a.
• Moderate slowdown expected in 2019
after highest GDP growth rate in
decade, achieved in 2018
• Household consumption remains
buoyant, while fixed investment
performance continues to be mixed
(strong public investment offset by soft
private investment activity)
• Slowing external demand is perceived
as the main risk to economic prospects
in Poland and may put pressure on
export. Import activity is still supported
by strong internal demand
• Bank volume growth in 2019 to
moderate in retail products whilst
corporate activity expected at broadly
similar growth dynamic
Financial results Outlook Business development Appendix Achievements
40
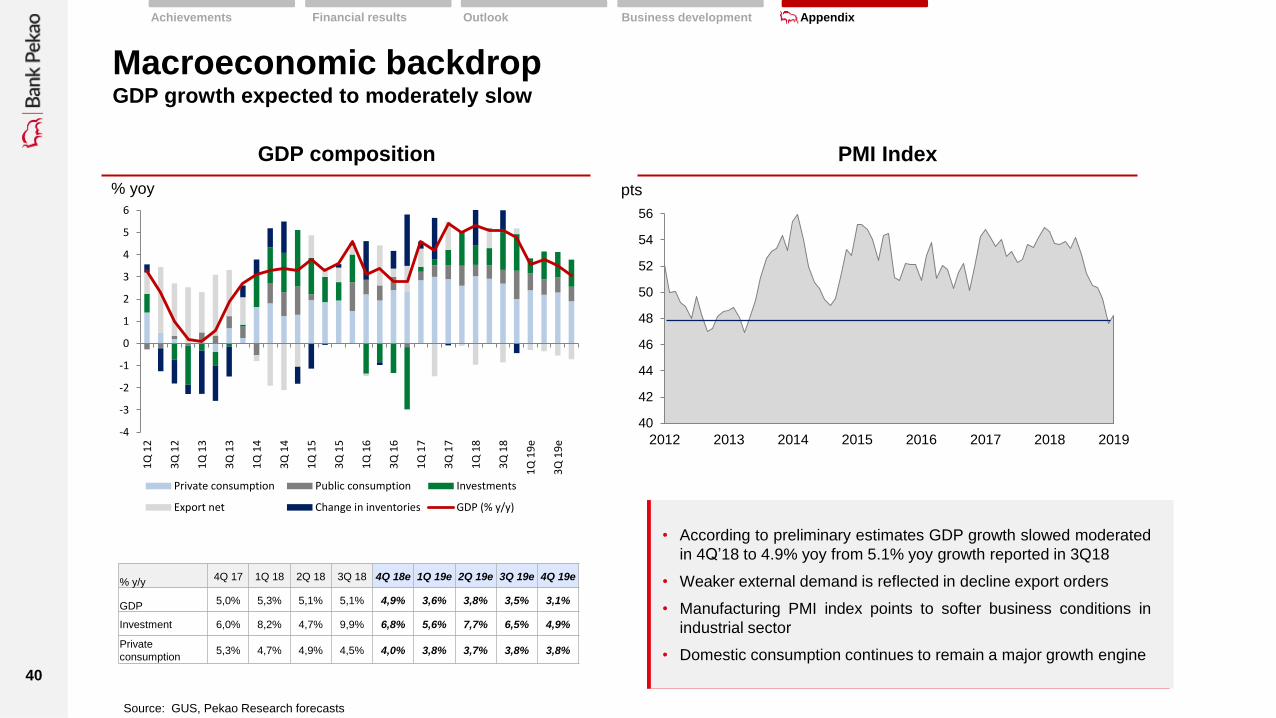
Macroeconomic backdrop GDP growth expected to moderately slow
GDP composition PMI Index
Source: GUS, Pekao Research forecasts
% yoy pts
• According to preliminary estimates GDP growth slowed moderated
in 4Q’18 to 4.9% yoy from 5.1% yoy growth reported in 3Q18
• Weaker external demand is reflected in decline export orders
• Manufacturing PMI index points to softer business conditions in
industrial sector
• Domestic consumption continues to remain a major growth engine
-4
-3
-2
-1
0
1
2
3
4
5
6
1Q
12
3Q
12
1Q
13
3Q
13
1Q
14
3Q
14
1Q
15
3Q
15
1Q
16
3Q
16
1Q
17
3Q
17
1Q
18
3Q
18
1Q
19
e
3Q
19
e
Private consumption Public consumption Investments
Export net Change in inventories GDP (% y/y)
% y/y 4Q 17 1Q 18 2Q 18 3Q 18 4Q 18e 1Q 19e 2Q 19e 3Q 19e 4Q 19e
GDP 5,0% 5,3% 5,1% 5,1% 4,9% 3,6% 3,8% 3,5% 3,1%
Investment 6,0% 8,2% 4,7% 9,9% 6,8% 5,6% 7,7% 6,5% 4,9%
Private
consumption 5,3% 4,7% 4,9% 4,5% 4,0% 3,8% 3,7% 3,8% 3,8%
40
42
44
46
48
50
52
54
56
2012 2013 2014 2015 2016 2017 2018 2019
Financial results Outlook Business development Appendix Achievements
41
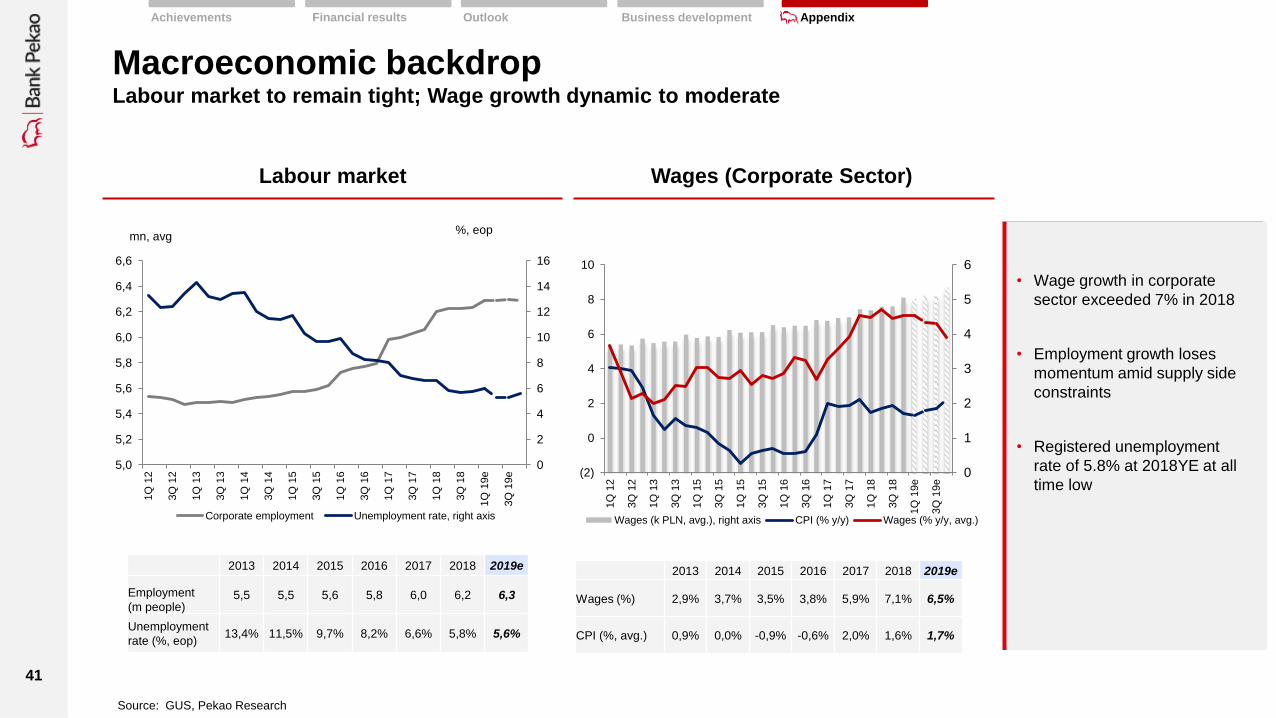
Macroeconomic backdrop Labour market to remain tight; Wage growth dynamic to moderate
Labour market Wages (Corporate Sector)
Source: GUS, Pekao Research
mn, avg %, eop
• Wage growth in corporate
sector exceeded 7% in 2018
• Employment growth loses
momentum amid supply side
constraints
• Registered unemployment
rate of 5.8% at 2018YE at all
time low
0
2
4
6
8
10
12
14
16
5,0
5,2
5,4
5,6
5,8
6,0
6,2
6,4
6,6
1Q
12
3Q
12
1Q
13
3Q
13
1Q
14
3Q
14
1Q
15
3Q
15
1Q
16
3Q
16
1Q
17
3Q
17
1Q
18
3Q
18
1Q
19e
3Q
19e
Corporate employment Unemployment rate, right axis
0
1
2
3
4
5
6
(2)
0
2
4
6
8
10
1Q
12
3Q
12
1Q
13
3Q
13
1Q
15
3Q
15
1Q
15
3Q
15
1Q
16
3Q
16
1Q
17
3Q
17
1Q
18
3Q
18
1Q
19e
3Q
19e
Wages (k PLN, avg.), right axis CPI (% y/y) Wages (% y/y, avg.)
2013 2014 2015 2016 2017 2018 2019e
Employment
(m people) 5,5 5,5 5,6 5,8 6,0 6,2 6,3
Unemployment
rate (%, eop) 13,4% 11,5% 9,7% 8,2% 6,6% 5,8% 5,6%
2013 2014 2015 2016 2017 2018 2019e
Wages (%) 2,9% 3,7% 3,5% 3,8% 5,9% 7,1% 6,5%
CPI (%, avg.) 0,9% 0,0% -0,9% -0,6% 2,0% 1,6% 1,7%
Financial results Outlook Business development Appendix Achievements

42
Macroeconomic backdrop CPI inflation running below NBP target; First rate hikes expected in 2020
Inflation, interest rates Government bond yields
Source: NBP, GUS, Pekao Research
Exchange rates
%
%
eop
Base rate
Feb 2019 -
1,50%
• NBP reference interest rate at 1.5%, lombard rate at 2.5% and
deposit rate at 0.5% in 4Q 2018
• CPI declined to 1.1% yoy at the end of 4Q 2018, still below
the NBP target of 2.5% after touching 2% level in 2018
• CPI is expected to run below the NBP target (2.5%) until 2020
and interest rate hikes by the Monetary Policy Council are not
expected in 2019. We factor 2 rates hikes of 25bps each in
2020
-2
-1
0
1
2
3
4
5
6
1Q
12
3Q
12
1Q
13
3Q
13
1Q
15
3Q
15
1Q
15
3Q
15
1Q
16
3Q
16
1Q
17
3Q
17
1Q
18
3Q
18
1Q
19e
3Q
19e
3M WIBOR (% eop) CPI (% y/y) Base rate NBP (%)
0
1
2
3
4
5
6
1Q
12
3Q
12
1Q
13
3Q
13
1Q
15
3Q
15
1Q
15
3Q
15
1Q
16
3Q
16
1Q
17
3Q
17
1Q
18
3Q
18
1Q
19e
3Q
19e
2Y 5Y 10Y
2,0
2,5
3,0
3,5
4,0
4,5
5,0
1Q
12
3Q
12
1Q
13
3Q
13
1Q
15
3Q
15
1Q
15
3Q
15
1Q
16
3Q
16
1Q
17
3Q
17
1Q
18
3Q
18
1Q
19e
3Q
19e
EUR/PLN USD/PLN CHF/PLN
Financial results Outlook Business development Appendix Achievements

43
Loans and advances to households and
institutional clients Deposits of households and institutional
clients
Macroeconomic backdrop Steady accelaration in household loans, strong inflow of deposits towards end of year
bl PLN bl PLN
* Households and non-profit institutions serving households
** Enterprises, non-bank financial institutions & public sector
Source: NBP
• Retail loans: strong growth
in core products throughout
the year (PLN mortgages
+11,8% y/y, consumer loans
+8,9% y/y at the end of
year)
• Corporate loans:
disappointing result in terms
of investment loans (-2,1%
y/y eop), but double-digit
growth achieved for
revolving credit
• Deposits: strong inflow in
households and enterprises
sectors towards end of the
year; high pace in general in
2018 shifted toward current
deposit
% y /y 2013 2014 2015 2016 2017 1Q 18 2Q 18 3Q 18 4Q 18
Households 4,5 5,5 6,6 5,2 1,8 3,3 4,8 5,3 6,9
Corporate 2,5 7,3 7,0 4,5 6,2 5,8 6,7 7,9 7,3
% y /y 2013 2014 2015 2016 2017 1Q 18 2Q 18 3Q 18 4Q 18
Households 6,5 9,2 9,4 9,5 4,1 4,7 6,4 7,8 9,8
Corporate 4,5 7,7 3,7 8,5 4,9 7,7 6,4 4,6 7,4
568 599 639 672 683 693 712 721 731
381 408
437 457 485 493 506 520 520
100
300
500
700
900
1100
1300
2013 2014 2015 2016 2017 1Q18 2Q18 3Q18 4Q18
Households* Corporate**
571 624 682 747 778 792 805 819 854
323 348
361 392 411 434 443 438 441
100
300
500
700
900
1100
1300
2013 2014 2015 2016 2017 1Q18 2Q18 3Q18 4Q18
Households* Corporate**
Financial results Outlook Business development Achievements Appendix

44
Bank loans and receivables to households*
Macroeconomic backdrop Further accelaration in household volumes in Q4’18, mixed for corporates
* Households and non-profit institutions serving households ** Enterprises, non-bank financial institutions & public sector; Source: NBP
2018 2013 2014 2015 2016 2017
% Ytd
Household deposits*
% Ytd
Bank loans and receivables to institutional clients**
% Ytd
Institutional client deposits**
% Ytd
-1%
0%
1%
2%
3%
4%
5%
6%
7%
XII' I II III IV V VI VII VIII IX X XI XII
-1%
1%
3%
5%
7%
9%
11%
XII' I II III IV V VI VII VIII IX X XI XII
-1%
1%
3%
5%
7%
9%
11%
XII' I II III IV V VI VII VIII IX X XI XII
-5%
0%
5%
10%
15%
XII' I II III IV V VI VII VIII IX X XI XII
Financial results Outlook Business development Appendix Achievements

45
Household non-performing loans* Corporate non-performing loans*
Main trends NPL statistics distorted by changes in methodology, but generally positive picture
Fom the beginning of 2018 data according to the changed methodology (impact of IFRS9 implementation).
* Share of non-performing loans in portfolio.
Source: NBP, KNF
2013 2014 2015 2016 2017 1Q 18 2Q 18 3Q 18 XI'18
Total 7,0% 6,5% 6,2% 6,0% 6,0% 6,5% 6,0% 5,9% 5,9%
Mortgage 3,1% 3,1% 2,8% 2,9% 2,8% 2,9% 2,6% 2,5% 2,5%
Consumer and other 12,8% 11,5% 11,2% 10,6% 10,6% 11,7% 10,9% 10,8% 10,7%
2013 2014 2015 2016 2017 1Q 18 2Q 18 3Q 18 XI'18
Total 11,9% 11,4% 10,4% 9,1% 8,3% 9,8% 9,0% 9,0% 8,9%
SME 13,0% 12,7% 12,2% 11,0% 10,0% 11,8% 11,3% 11,3% 11,4%
Large f irms 10,2% 9,5% 7,6% 6,4% 5,9% 7,1% 6,0% 6,1% 5,7%
0%
2%
4%
6%
8%
10%
12%
14%
16%
1Q
13
2Q
13
3Q
13
4Q
13
1Q
14
2Q
14
3Q
14
4Q
14
1Q
15
2Q
15
3Q
15
4Q
15
1Q
16
2Q
16
3Q
16
4Q
16
1Q
17
2Q
17
3Q
17
4Q
17
1Q
18
2Q
18
3Q
18
XI'18
Retail total Mortgage Consumer and other
4%
6%
8%
10%
12%
14%
16%
1Q
13
2Q
13
3Q
13
4Q
13
1Q
14
2Q
14
3Q
14
4Q
14
1Q
15
2Q
15
3Q
15
4Q
15
1Q
16
2Q
16
3Q
16
4Q
16
1Q
17
2Q
17
3Q
17
4Q
17
1Q
18
2Q
18
3Q
18
XI'1
8
Corporate total SME Large firms
• Households: one-off spike at
the beginning of the year due
to changes in methodology
(visible mainly in non-mortage
lending), declining trend
afterwards in both mortage and
other loans supported by NPL
sales in the sector
• Corporate sector: significant
increase at the beginning of
the year due to changes in
methodology; converged to
previous levels towards end of
2018 for large corporates but
remain elevated for SMEs
Financial results Outlook Business development Appendix Achievements
46
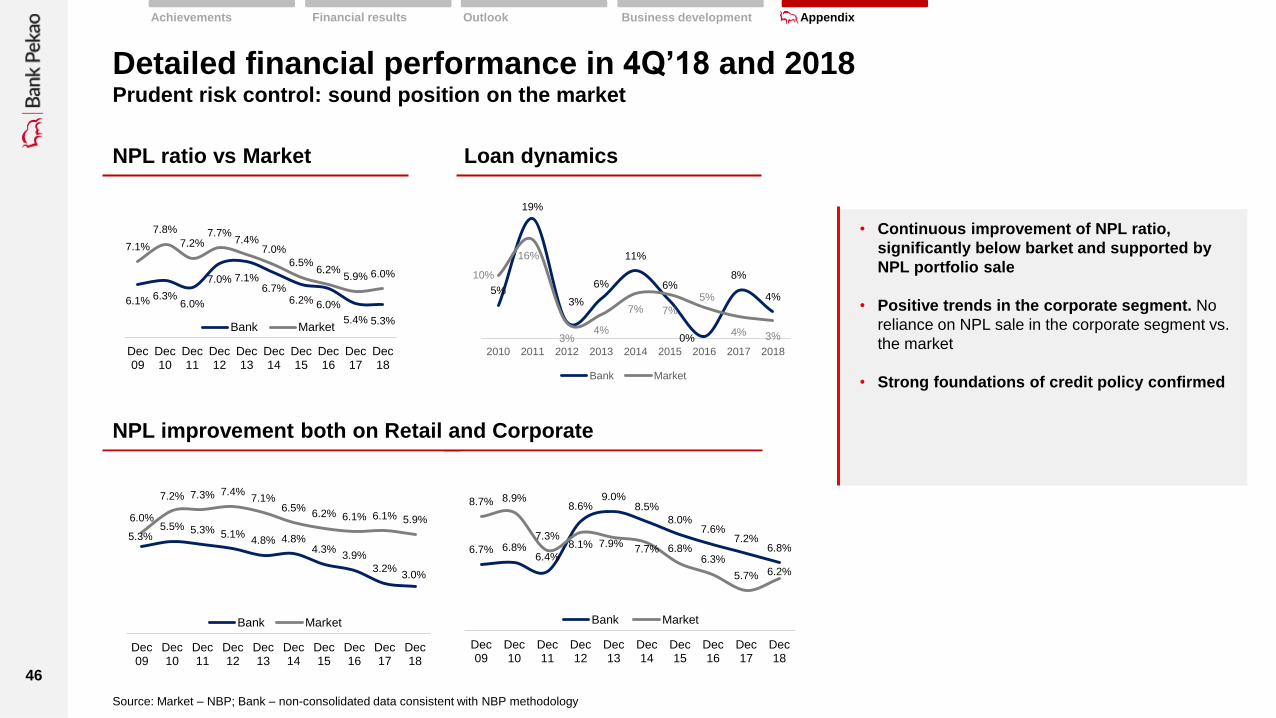
Detailed financial performance in 4Q’18 and 2018 Prudent risk control: sound position on the market
NPL ratio vs Market
NPL improvement both on Retail and Corporate
• Continuous improvement of NPL ratio,
significantly below barket and supported by
NPL portfolio sale
• Positive trends in the corporate segment. No
reliance on NPL sale in the corporate segment vs.
the market
• Strong foundations of credit policy confirmed
Loan dynamics
5%
19%
3%
6%
11%
6%
0%
8%
4%
10%
16%
3% 4%
7% 7%
5%
4% 3% 0%
5%
10%
15%
20%
2010 2011 2012 2013 2014 2015 2016 2017 2018
Bank Market
Financial results Outlook Business development Appendix Achievements
6.7% 6.8% 6.4%
8.6% 9.0%
8.5%
8.0% 7.6%
7.2% 6.8%
8.7% 8.9%
7.3% 8.1% 7.9%
7.7% 6.8% 6.3%
5.7% 6.2%
Dec09
Dec10
Dec11
Dec12
Dec13
Dec14
Dec15
Dec16
Dec17
Dec18
Bank Market
5.3% 5.5% 5.3% 5.1%
4.8% 4.8% 4.3%
3.9%
3.2% 3.0%
6.0%
7.2% 7.3% 7.4% 7.1%
6.5% 6.2% 6.1% 6.1% 5.9%
Dec09
Dec10
Dec11
Dec12
Dec13
Dec14
Dec15
Dec16
Dec17
Dec18
Bank Market
6.1% 6.3% 6.0%
7.0% 7.1% 6.7%
6.2% 6.0%
5.4% 5.3%
7.1%
7.8%
7.2% 7.7%
7.4% 7.0%
6.5% 6.2%
5.9% 6.0%
Dec09
Dec10
Dec11
Dec12
Dec13
Dec14
Dec15
Dec16
Dec17
Dec18
Bank Market
Source: Market – NBP; Bank – non-consolidated data consistent with NBP methodology

47
Selected data
48
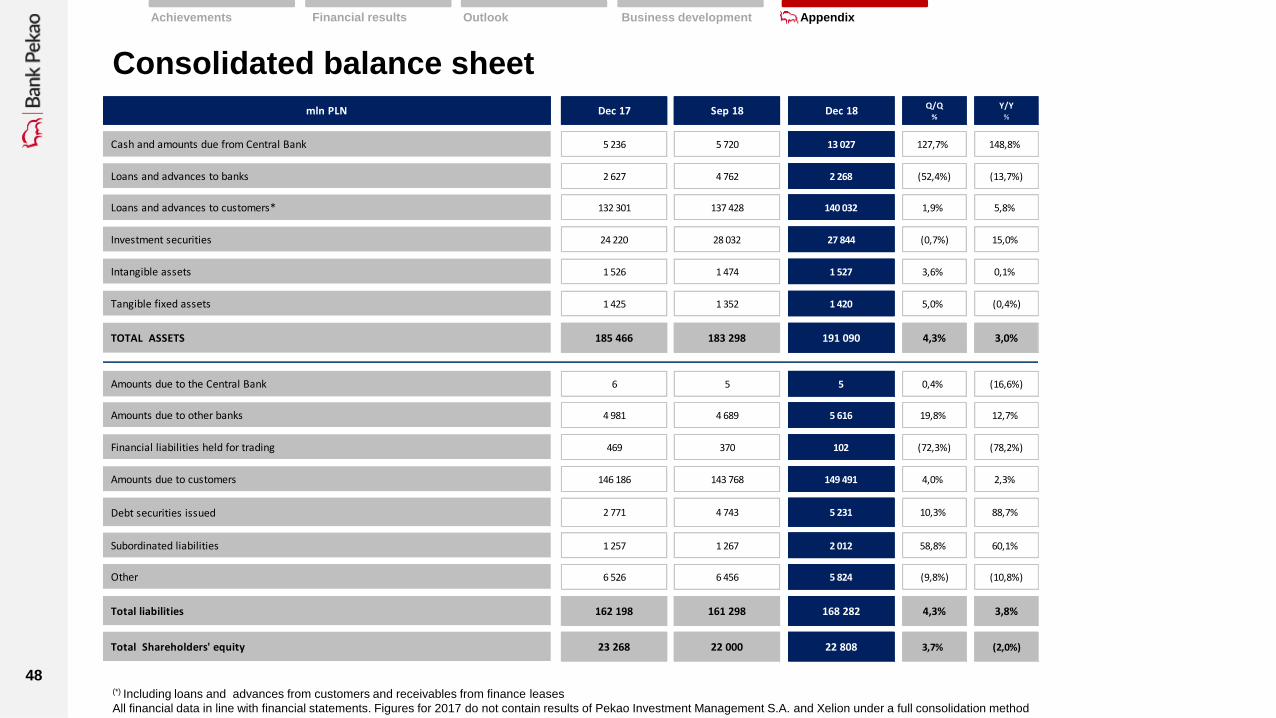
Consolidated balance sheet
(*) Including loans and advances from customers and receivables from finance leases
All financial data in line with financial statements. Figures for 2017 do not contain results of Pekao Investment Management S.A. and Xelion under a full consolidation method
Financial results Outlook Business development Appendix Achievements
mln PLN Dec 17 Sep 18 Dec 18 Q/Q%
Y/Y%
Cash and amounts due from Central Bank 5 236 5 720 13 027 127,7% 148,8%
Loans and advances to banks 2 627 4 762 2 268 (52,4%) (13,7%)
Loans and advances to customers* 132 301 137 428 140 032 1,9% 5,8%
Investment securities 24 220 28 032 27 844 (0,7%) 15,0%
Intangible assets 1 526 1 474 1 527 3,6% 0,1%
Tangible fixed assets 1 425 1 352 1 420 5,0% (0,4%)
TOTAL ASSETS 185 466 183 298 191 090 4,3% 3,0%
Amounts due to the Central Bank 6 5 5 0,4% (16,6%)
Amounts due to other banks 4 981 4 689 5 616 19,8% 12,7%
Financial liabilities held for trading 469 370 102 (72,3%) (78,2%)
Amounts due to customers 146 186 143 768 149 491 4,0% 2,3%
Debt securities issued 2 771 4 743 5 231 10,3% 88,7%
Subordinated liabilities 1 257 1 267 2 012 58,8% 60,1%
Other 6 526 6 456 5 824 (9,8%) (10,8%)
Total liabilities 162 198 161 298 168 282 4,3% 3,8%
Total Shareholders' equity 23 268 22 000 22 808 3,7% (2,0%)

49
Consolidated income statement
(1) NII and dividends and other income from equity investments. In 2018, in line with MSSF9, the bank reclassified some credit commissions and fees to net interest income
(2) Costs excl. guarantee funds charges
(3) In 2018 the bank changed methodology of presenting in P&L statement revenues from NPL sale reclassifying from net other income/expenses to provision
(4) Net profit attributable to equity holders of the Bank
NOTE: Data as reported
Financial results Outlook Business development Appendix Achievements
mln PLN 4Q 17 3Q 18 4Q 18 Q/Q % Y/Y % 12M 2017 12M 2018 Y/Y %
Net interest income (1) 1 198,1 1 258,2 1 294,9 2,9% 8,1% 4 652,7 5 014,2 7,8%
Net fee and commission 617,2 619,0 638,3 3,1% 3,4% 2 353,0 2 462,6 4,7%
Operating income 2 022,4 1 932,7 2 043,6 5,7% 1,0% 7 350,4 7 757,1 5,5%
Operating costs (2) (854,5) (843,3) (847,7) 0,5% (0,8%) (3 263,4) (3 444,4) 5,5%
OPERATING PROFIT 1 167,9 1 089,4 1 195,8 9,8% 2,4% 4 087,1 4 312,7 5,5%
Provisions (3) (152,8) (155,3) (104,9) (32,5%) (31,4%) (521,3) (511,0) (2,0%)
Guarantee funds charges (22,6) (30,5) (30,7) 0,5% 35,6% (269,0) (265,5) (1,3%)
Banking tax (138,8) (140,9) (144,2) 2,3% 3,9% (522,3) (562,0) 7,6%
PROFIT BEFORE INCOME TAX 1 253,8 793,3 976,8 23,1% (22,1%) 3 153,0 3 047,3 (3,4%)
Income tax (199,7) (186,9) (227,6) 21,7% 14,0% (677,3) (759,5) 12,1%
GROUP NET INCOME (4) 1 054,1 605,8 749,2 23,7% (28,9%) 2 475,1 2 287,2 (7,6%)

50
Consolidated income statement pro-forma
(1) NII and dividends and other income from equity investments; In 2018, in line with MSSF9, bank reclassified some credit commissions and fees to net interest income
(2) Costs excl. guarantee funds charges
(3) In 2018 the bank changed methodology of presenting in P&L statement revenues from NPL sale reclassifying from net other income/expenses to provision
(4) Net profit attributable to equity holders of the Bank
NOTE: Pro-forma, 2017 figures include results of Pekao Investment Management S.A. and Xelion under a full consolidation method
Financial results Outlook Business development Appendix Achievements
mln PLN 4Q 17 3Q 18 4Q 18 Q/Q % Y/Y % 12M 2017 12M 2018 Y/Y %
Net interest income (1) 1 191,0 1 258,2 1 294,9 2,9% 8,7% 4 616,9 5 014,2 8,6%
Net fee and commission 645,3 619,0 638,3 3,1% (1,1%) 2 505,0 2 462,6 (1,7%)
Operating income 1 901,0 1 932,7 2 043,6 5,7% 7,5% 7 324,5 7 757,1 5,9%
Operating costs (2) (863,8) (843,3) (847,7) 0,5% (1,9%) (3 319,0) (3 444,4) 3,8%
OPERATING PROFIT 1 037,1 1 089,4 1 195,8 9,8% 15,3% 4 005,5 4 312,7 7,7%
Provisions (3) (10,1) (155,3) (104,9) (32,5%) 935,0% (378,6) (511,0) 35,0%
Guarantee funds charges (22,6) (30,5) (30,7) 0,5% 35,6% (269,0) (265,5) (1,3%)
Banking tax (138,8) (140,9) (144,2) 2,3% 3,9% (522,3) (562,0) 7,6%
PROFIT BEFORE INCOME TAX 851,7 793,3 976,8 23,1% 14,7% 2 799,9 3 047,3 8,8%
Income tax (203,5) (186,9) (227,6) 21,7% 11,8% (697,1) (759,5) 9,0%
GROUP NET INCOME (4) 648,2 605,8 749,2 23,7% 15,6% 2 102,2 2 287,2 8,8%

51
Key performance indicators
NOTE: Data as reported
Financial results Outlook Business development Appendix Achievements
mln PLN 4Q 17 3Q 18 4Q 18Q/Q
net
Y/Y
net12M 2017 12M 2018
Y/Y
net
ROE (%) 18,6% 11,1% 13,4% 2,25 -5,24 11,0% 10,2% -0,85
ROA (%) 2,4% 1,3% 1,6% 0,29 -0,77 1,4% 1,3% -0,14
NIM (%) 2,8% 2,8% 2,9% 0,03 0,05 2,8% 2,8% 0,04
L/D (%) 88,5% 92,3% 89,5% -2,80 1,00 88,5% 89,5% 1,00
Cost/Income Ratio (%) 42,3% 43,6% 41,5% -2,10 -0,75 44,4% 44,4% 0,00
Cost of Risk (%) 0,45% 0,44% 0,39% -0,05 -0,06 0,40% 0,38% -0,02
TCR 17,1% 17,0% 17,4% 0,40 0,30 17,1% 17,4% 0,30
Tier 1 16,1% 16,0% 15,8% -0,20 -0,30 16,1% 15,8% -0,30

52
Selected data
(*) Number of accounts including pre-paid card accounts (**) Retail clients’ accounts (***) Pożyczka Ekspresowa (Express Loan)
Financial results Outlook Business development Appendix Achievements
Bank Dec 17 Sep 18 Dec 18 Q/Q % Y/Y %
Outlets 851 849 825 (2,8%) (3,1%)
ATM's 1 745 1 709 1 708 (0,1%) (2,1%)
Employees 15 316 14 674 14 569 (0,7%) (4,9%)
No of PLN current accounts (ths)* 5 669 5 876 5 949 1,2% 4,9%
No of mortgage loan accounts (ths)** 354 374 378 1,1% 6,7%
No of clients holding a consumer loan accounts (ths)*** 621 670 678 1,3% 9,2%
Number of individuals acitive users electronic banking Pekao24 (ths) 1 846 1 998 2 045 2,4% 10,8%
Number of individuals with an access to mobile banking (ths) 1 541 1 772 1 829 3,2% 18,7%
Group Dec 17 Sep 18 Dec 18 Q/Q % Y/Y %
Employees 17 339 16 906 16 714 (1,1%) (3,6%)
Number of MF accounts (ths) 762 736 723 (1,8%) (5,1%)
Number of Brokerage accounts (ths) 335 273 269 (1,5%) (19,6%)

53
Activity by segments
(1) Total net interest income, dividends and other income from equity investments
(2) Operating costs excluding guarantee funds charges
Nota: Income statement consistent with presentation version
Financial results Outlook Business development Appendix Achievements
2017 2018 Y/Y%
2017 2018 Y/Y%
2017 2018 Y/Y%
2017 2018 Y/Y%
2017 2018 Y/Y%
2017 2018 Y/Y%
Net interest income (1) 2 420,4 2 736,5 13,1% 40,6 38,7 (4,7%) 1 338,2 1 354,9 1,2% 160,8 180,1 12,0% 692,6 704,0 1,6% 4 653 5 014 7,8%
Non-interest income 1 285,8 1 420,3 10,5% 28,2 47,0 66,7% 834,5 1 019,0 22,1% 225,6 260,9 15,7% 323,6 (4,4) n.a. 2 698 2 743 1,7%
Operating income 3 706,2 4 156,7 12,2% 68,8 85,7 24,6% 2 172,7 2 373,9 9,3% 386,4 441,1 14,1% 1 016,2 699,6 (31,2%) 7 350,4 7 757,1 5,5%
Operating costs (2) (2 268,2) (2 384,6) 5,1% (53,7) (68,6) 27,6% (629,8) (671,4) 6,6% (317,3) (314,8) (0,8%) 5,8 (5,1) n.a. (3 263,4) (3 444,4) 5,5%
OPERATING PROFIT 1 438,0 1 772,1 23,2% 15,1 17,2 13,8% 1 542,9 1 702,5 10,3% 69,1 126,3 82,8% 1 022,0 694,5 (32,0%) 4 087,1 4 312,7 5,5%
Net write-downs/provision (196,3) (255,8) 30,3% (0,5) (0,1) (82,9%) (298,4) (234,2) (21,5%) (34,4) (32,3) (6,3%) 8,4 11,3 34,6% -521 -511 (2,0%)
Guarantee funds charges (155,7) (171,5) 10,2% (0,6) (0,6) (9,1%) (121,2) (153,3) 26,5% (7,6) (8,5) 12,2% 16,1 68,4 324,5% -269 -265 (1,3%)
Banking tax (522,3) (562,0) 7,6% -522 -562 7,6%
PROFIT BEFORE INCOME TAX 1 073,3 1 345,5 25,4% 13,8 14,5 5,5% 1 124,1 1 314,5 16,9% 27,0 85,5 216,3% 914,8 287,3 (68,6%) 3 153,0 3 047,3 (3,4%)
mln PLN
Retail Banking Private BankingCorporate&Investment
Banking
Assets&Liabilities
Management & OthersGroupSME Banking

54
Group net profit structure
(*) On December 11, 2017, the Bank acquired 51% of the stock in Pekao Investment Management S.A. and took control of this company. (**) On December 11, 2017, the Bank acquired 50% of the stock in Dom Inwestycyjny Xelion Sp. z o.o and took control of this company.
NOTE: Data as reported
Financial results Outlook Business development Appendix Achievements
mln PLN cumulativeGroup's share in
capital % 2017 2018 Y/Y %
Bank Pekao S.A. Banking - Poland 2 088,1 2 310,6 10,7%
Entities - consolidated under full method 79,8 188,6 136%
of which:
Pekao Leasing Sp. z o.o. Leasing 100% 34,8 47,6 36,8%
Centralny Dom Maklerski Pekao S.A. Brokerage 100% 33,1 24,8 (25,1%)
Pekao Bank Hipoteczny S.A. Mortgage Bank 100% 5,8 2,6 (55,2%)
Pekao PTE S.A. in liquidation Pension Fund 100% (3,1) 3,0
Pekao Faktoring Sp. z o.o. Factoring 100% 11,0 13,7 24,5%
Pekao Investment Banking S.A. Brokerage 100% 4,7 9,6 104,3%
Centrum Bankowości Bezpośredniej Sp. z o.o. Call Centre 100% 3,8 3,2 (15,8%)
Pekao Financial Services Sp. z o.o. Servicing MF/PF 66,5% 6,0 3,9 (35,0%)
Centrum Kart S.A. Cards 100% 0,8 0,3 (62,5%)
Pekao Fundusz Kapitałowy Sp. z o.o. in liquidation Business consulting 100% 0,4 0,4 0,0%
Pekao Property S.A. Real estate development 100% (24,5) (0,1) (99,6%)
FPB "MEDIA" Sp. z o.o. - indirect Real estate development 100% 0,9 (15,6) -1833%
Dom Inwestycyjny Xelion Sp. z o.o. Financial Advisory 100% 0,3 5,0
Pekao Investment Management S.A. Mutual Funds 100% 5,8 90,2
Entities - valued under the equity method 39,5 0,0 -100%
Pekao Investment Management S.A* Mutual Funds 36,9 ---
Dom Inwestycyjny Xelion Sp. z o.o. ** Financial Advisory 2,6 ---
Exclusions and consolidation adjustments 267,7 (212,0)
Group Net Profit (**) 2 475,1 2 287,2 (7,6%)
55
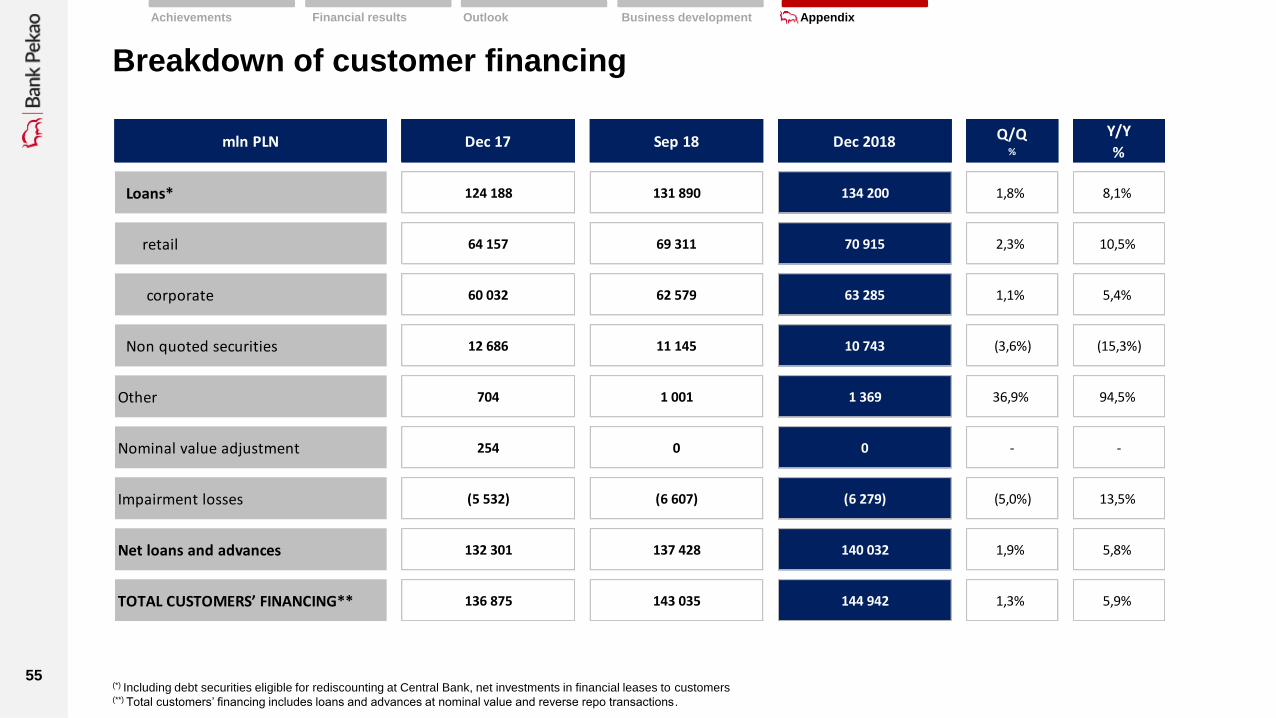
Breakdown of customer financing
(*) Including debt securities eligible for rediscounting at Central Bank, net investments in financial leases to customers (**) Total customers’ financing includes loans and advances at nominal value and reverse repo transactions.
Financial results Outlook Business development Appendix Achievements
mln PLN Dec 17 Sep 18 Dec 2018 Q/Q%
Y/Y
%
Loans* 124 188 131 890 134 200 1,8% 8,1%
retail 64 157 69 311 70 915 2,3% 10,5%
corporate 60 032 62 579 63 285 1,1% 5,4%
Non quoted securities 12 686 11 145 10 743 (3,6%) (15,3%)
Other 704 1 001 1 369 36,9% 94,5%
Nominal value adjustment 254 0 0 - -
Impairment losses (5 532) (6 607) (6 279) (5,0%) 13,5%
Net loans and advances 132 301 137 428 140 032 1,9% 5,8%
TOTAL CUSTOMERS’ FINANCING** 136 875 143 035 144 942 1,3% 5,9%
56
Financial results Outlook Business development Appendix Achievements
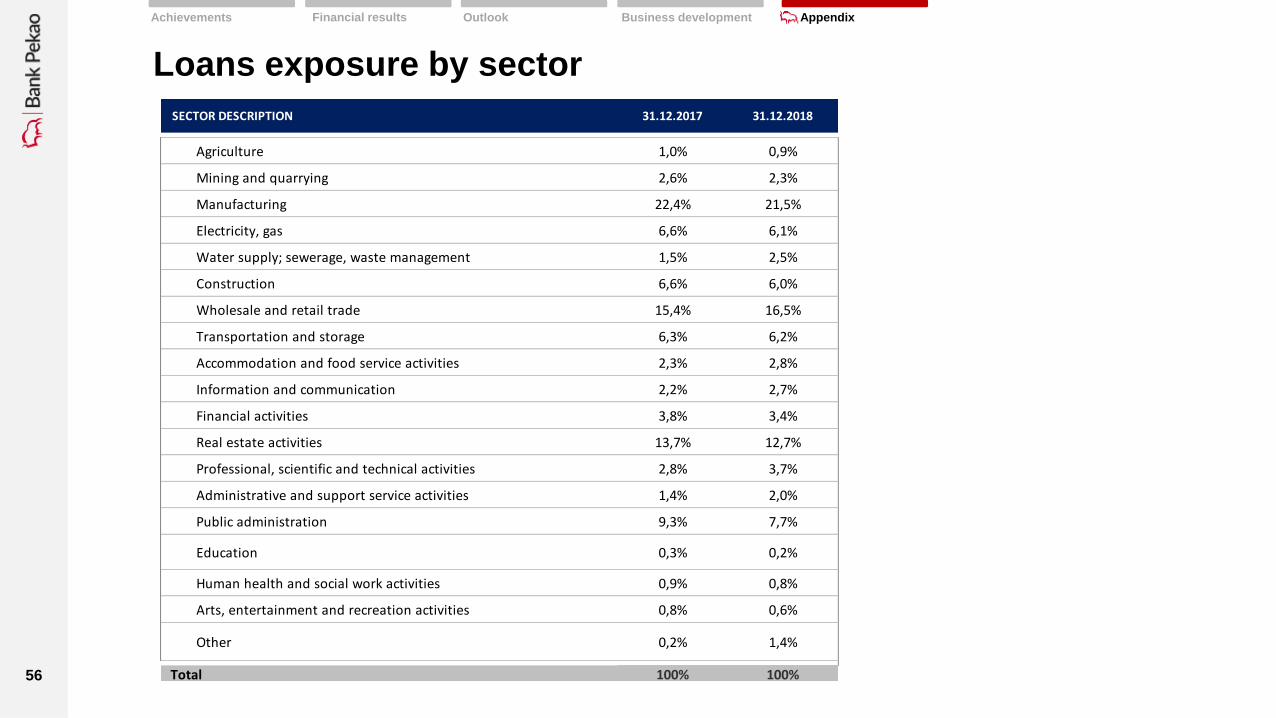
Loans exposure by sector
SECTOR DESCRIPTION 31.12.2017 31.12.2018
Agriculture 1,0% 0,9%
Mining and quarrying 2,6% 2,3%
Manufacturing 22,4% 21,5%
Electricity, gas 6,6% 6,1%
Water supply; sewerage, waste management 1,5% 2,5%
Construction 6,6% 6,0%
Wholesale and retail trade 15,4% 16,5%
Transportation and storage 6,3% 6,2%
Accommodation and food service activities 2,3% 2,8%
Information and communication 2,2% 2,7%
Financial activities 3,8% 3,4%
Real estate activities 13,7% 12,7%
Professional, scientific and technical activities 2,8% 3,7%
Administrative and support service activities 1,4% 2,0%
Public administration 9,3% 7,7%
Education 0,3% 0,2%
Human health and social work activities 0,9% 0,8%
Arts, entertainment and recreation activities 0,8% 0,6%
Other 0,2% 1,4%
Total 100% 100%
57
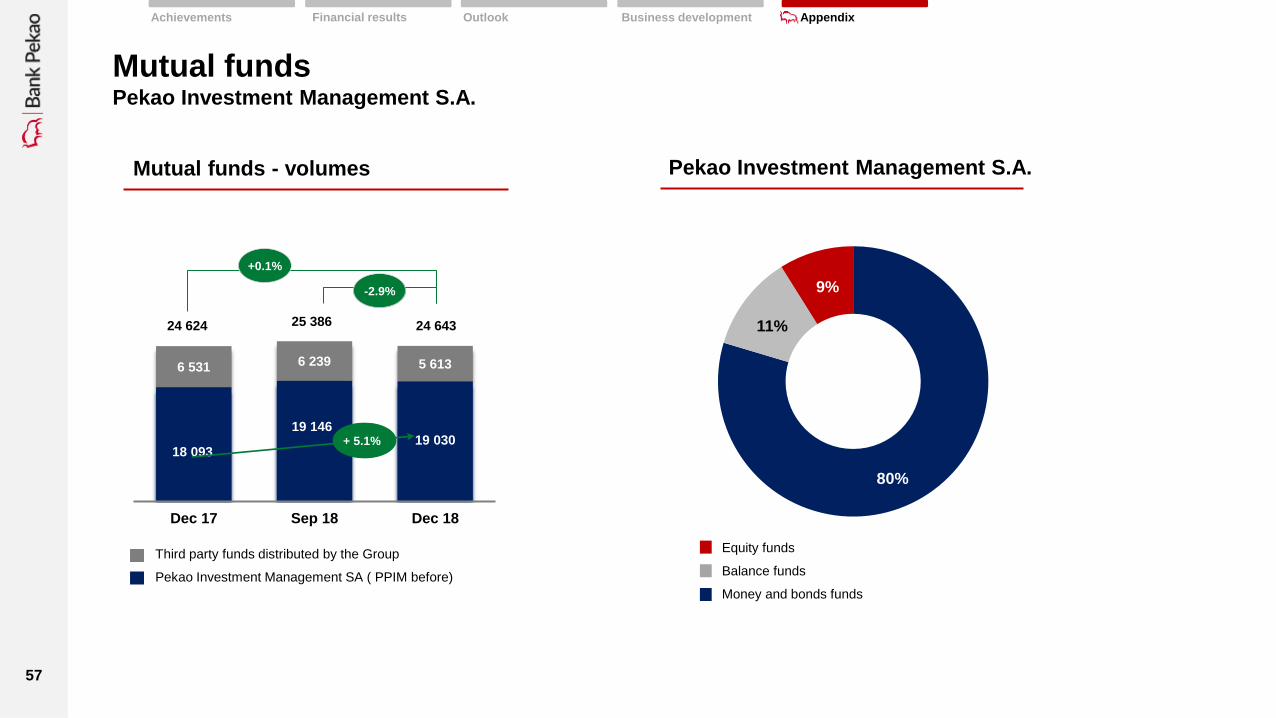
Mutual funds Pekao Investment Management S.A.
Mutual funds - volumes Pekao Investment Management S.A.
80%
11%
9%
Equity funds
Balance funds
Money and bonds funds
18 093
19 146 19 030
6 531 6 239 5 613
Dec 17 Sep 18 Dec 18
+ 5.1%
-2.9%
+0.1%
24 624 25 386 24 643
Pekao Investment Management SA ( PPIM before)
Third party funds distributed by the Group
Financial results Outlook Business development Appendix Achievements

58
Ratings of Bank Pekao S.A.
On October 17, 2018, Fitch Ratings has changed the following ratings of Bank Pekao S.A.: Long-term Issuer Default Rating (IDR) from "A-“ to "BBB+;„ Outlook on long-term IDR from “Negative” to “Stable”
Viability Rating (VR) from "a-" to "bbb+"; Other Bank’s ratings Fitch Ratings confirmed at the unchanged level.
(**) On October 12, 2018, S& P Global Ratings changed following ratings of Poland: Long-term in foreign currencies from "BBB +" to "A-„; Long-term in the national currency from "A-" to "A„; Outlook on the long-term domestic
and long-term ratings from “Positive” to “Stable”
(***) On October 15, 2018 S&P Global Ratings confirmed the Issuer Credit Rating of Bank Pekao S.A. and at the same time upgraded Bank’s RCR long-term
rating from "BBB+" to "A-". The short-term RCR was confirmed at the "A-2" level.
Financial results Outlook Business development Appendix Achievements
31.12.2018
FITCH RATINGS PEKAO POLAND
Long-term rating (IDR) BBB+ A-
Short-term rating F2 F2
Viability rating bbb+ -
Support rating 5 -
Outlook Stable Stable
S&P GLOBAL RATINGS PEKAO POLAND
Long-term rating BBB+ A-
Short-term rating A-2 A-2
Stand-alone bbb -
Outlook Stable Stable
MOODY'S INVESTORS SERVICE LTDPEKAO
(unsolicited rating)POLAND
Long-term foreign-currency deposit rating A2 A2
Short-term deposit rating Prime-1 Prime-1
BCA baa1 -
Long term counterparty credit risk A1(cr) -
Short term counterparty credit risk Prime-1(cr) -
Outlook Stable Stable
59
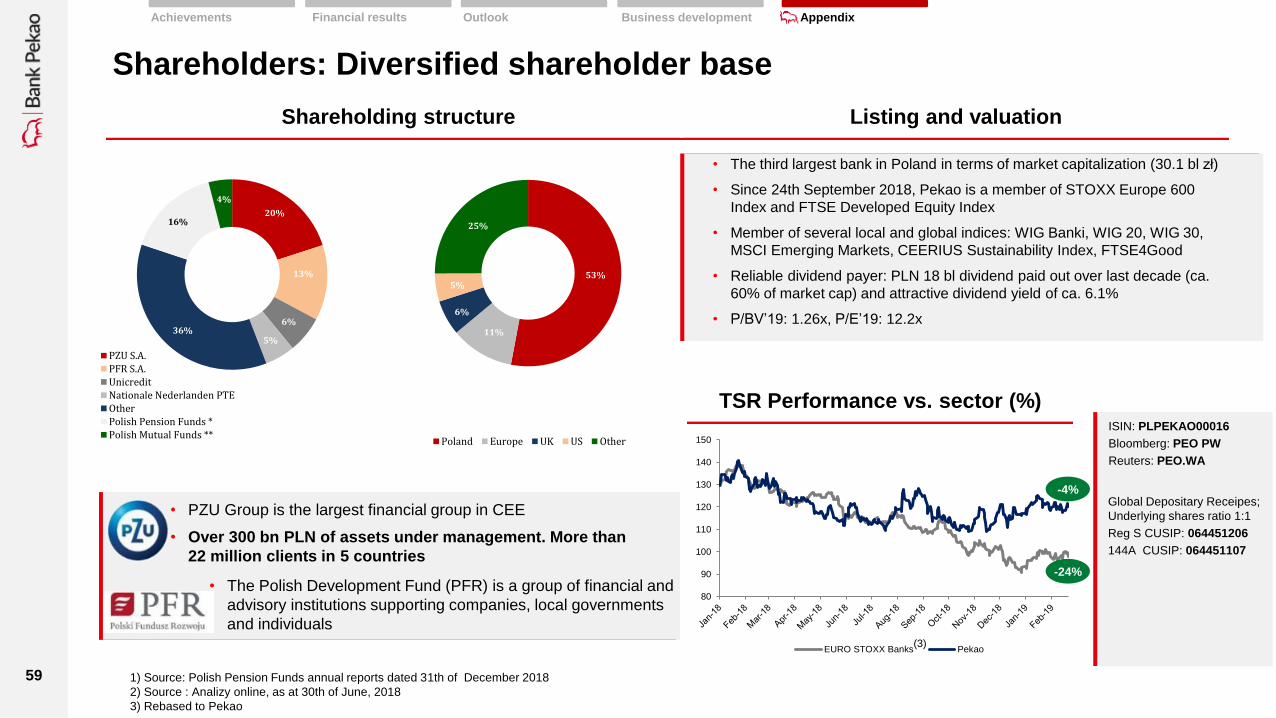
• The third largest bank in Poland in terms of market capitalization (30.1 bl zł)
• Since 24th September 2018, Pekao is a member of STOXX Europe 600
Index and FTSE Developed Equity Index
• Member of several local and global indices: WIG Banki, WIG 20, WIG 30,
MSCI Emerging Markets, CEERIUS Sustainability Index, FTSE4Good
• Reliable dividend payer: PLN 18 bl dividend paid out over last decade (ca.
60% of market cap) and attractive dividend yield of ca. 6.1%
• P/BV’19: 1.26x, P/E’19: 12.2x
• PZU Group is the largest financial group in CEE
• Over 300 bn PLN of assets under management. More than
22 million clients in 5 countries
• The Polish Development Fund (PFR) is a group of financial and
advisory institutions supporting companies, local governments
and individuals
ISIN: PLPEKAO00016
Bloomberg: PEO PW
Reuters: PEO.WA
Global Depositary Receipes;
Underlying shares ratio 1:1
Reg S CUSIP: 064451206
144A CUSIP: 064451107
1) Source: Polish Pension Funds annual reports dated 31th of December 2018
2) Source : Analizy online, as at 30th of June, 2018
3) Rebased to Pekao
Shareholding structure Listing and valuation
TSR Performance vs. sector (%)
Shareholders: Diversified shareholder base
20%
13%
6%
5% 36%
16%
4%
PZU S.A.PFR S.A.UnicreditNationale Nederlanden PTEOtherPolish Pension Funds *Polish Mutual Funds **
53%
11%
6%
5%
25%
Poland Europe UK US Other
80
90
100
110
120
130
140
150
EURO STOXX Banks Pekao
-4%
-24%
Financial results Outlook Business development Appendix Achievements
(3)
60
Investor Relations Team: Contact and calendar
26 February 2019
9 May 2019
7 August 2019
6 November 2019
Annual Report 2018
and Webcasting
First Quarter Report
and Webcasting
Semi-annual Report
and Webcasting
Third Quarter Report
and Webcasting
FINANCIAL CALENDAR CONTACT DETAILS
Q&A related to the presentation:
Paweł Rzeźniczak
Head of IR and Corporate Development
ph.: +48 22 524 55 27
e-mail: [email protected]
Wioletta Reimer
Director of IR Office
ph.: +48 22 524 55 27
e-mail: [email protected]
Jerzy Kosiński
ph.: +48 22 524 55 30
e-mail: [email protected]
Iwona Milewska
ph.: +48 22 524 55 28
e-mail: [email protected]
Financial results Outlook Business development Appendix Achievements

61
Disclaimer
This presentation (the ”Presentation”) has been prepared by Bank Polska Kasa Opieki Spółka Akcyjna (“Bank”) for the clients, shareholders and financial analysts. The Presentation should not be treated as
an offer or invitation to purchase any securities or financial instruments or as advice or recommendation in respect to such securities or financial instruments.
The presented data are only general information and does not refer to an offer by the Bank for products or services. In order to take advantage of the services and products of the Bank, one should be
thoroughly familiar with the characteristics of the particular service or product, its rules, risks and legal and tax consequences of the use of particular services or products.
The strategy presented in the Presentation contains goals which are the ambition of the Management Board and do not constitute any financial results forecast.
Rights for the Presentation as a whole are reserved to the Bank. The Presentation is subject to the protection provided by law, in particular: the Act dated
4 February 1994 on Copyright and Related Rights (consolidated text in Journal. Laws of 2006, No. 90, item. 631, as amended); the Act dated 27 July 2001 on the protection of Databases (Journal of Laws No.
128, item. 1402, as amended); the Act dated 16 April 1993 on Combating Unfair Competition (consolidated text in Journal of Laws of 2003 , No. 153, item 1503, as amended) and the Act dated 30 June 2000
on Industrial Property Law (consolidated text in Journal. Laws of 2003, No. 119, item. 1117, as amended).
The Presentation may include forward looking statements, the Bank’s outlook for the future, future plans and strategies or anticipated events that are not historical facts. Since these statements are based on
assumptions, expectations, projections and provisional data about future events, the content is inherently uncertain. Factors that could cause or contribute to differences in current expectations include, but
are not limited to: (i) general economic conditions, among which the economic conditions of the business areas and the markets in which the Bank and its subsidiaries operate, (ii) the performance of financial
markets (iii) changes in laws or regulations and (iv) general competitive conditions locally, regionally, nationally and/or internationally.
The Bank does not undertake to publish any updates, modifications or revisions of the information, data or statements contained herein should there be any change in the strategy or intentions of the Bank, or
should facts or events occur that affect the Bank’s strategy or intentions, unless such reporting obligations arise under applicable laws and regulations.
Neither the Bank, nor any of its representatives shall be responsible for any loss or damage that may arise from the use of the Presentation or of any information contained herein or otherwise arising in
connection to this Presentation.
This presentation is not for distribution in or into countries where the public dissemination of the information contained herein may be restricted or prohibited by law.