2018 eu-wide transparency exercise · lei code liu16f6vzjsd6ukhd557 country code dk ny 2018 eu-wide...
TRANSCRIPT
Round_3
Master_version_2015 TRA Templates 26102015Bank Name Nykredit Realkredit
LEI Code LIU16F6VZJSD6UKHD557
Country Code DK
Ny
2018 EU-wide Transparency Exercise

201712 201806
(mln EUR, %)As of 31/12/2017 As of 30/06/2018 COREP CODE REGULATION
A OWN FUNDS 11,444 11,587 C 01.00 (r010,c010) Articles 4(118) and 72 of CRR
A.1COMMON EQUITY TIER 1 CAPITAL (net of deductions and after applying
transitional adjustments)9,354 9,601 C 01.00 (r020,c010) Article 50 of CRR
A.1.1Capital instruments eligible as CET1 Capital (including share premium and net own capital
instruments)159 159 C 01.00 (r030,c010) Articles 26(1) points (a) and (b), 27 to 29, 36(1) point (f) and 42 of CRR
A.1.2 Retained earnings 4,264 4,414 C 01.00 (r130,c010) Articles 26(1) point (c), 26(2) and 36 (1) points (a) and (l) of CRR
A.1.3 Accumulated other comprehensive income 3 1 C 01.00 (r180,c010) Articles 4(100), 26(1) point (d) and 36 (1) point (l) of CRR
A.1.4 Other Reserves 4,888 5,104 C 01.00 (r200,c010) Articles 4(117) and 26(1) point (e) of CRR
A.1.5 Funds for general banking risk 0 0 C 01.00 (r210,c010) Articles 4(112), 26(1) point (f) and 36 (1) point (l) of CRR
A.1.6 Minority interest given recognition in CET1 capital 82 0 C 01.00 (r230,c010) Article 84 of CRR
A.1.7 Adjustments to CET1 due to prudential filters -9 -8 C 01.00 (r250,c010) Articles 32 to 35 of and 36 (1) point (l) of CRR
A.1.8 (-) Intangible assets (including Goodwill) -25 -27 C 01.00 (r300,c010) + C 01.00 (r340,c010) Articles 4(113), 36(1) point (b) and 37 of CRR. Articles 4(115), 36(1) point (b) and 37 point (a)
of CCR
A.1.9(-) DTAs that rely on future profitability and do not arise from temporary differences net of
associated DTLs 0 0 C 01.00 (r370,c010) Articles 36(1) point (c) and 38 of CRR
A.1.10 (-) IRB shortfall of credit risk adjustments to expected losses 0 0 C 01.00 (r380,c010) Articles 36(1) point (d), 40 and 159 of CRR
A.1.11 (-) Defined benefit pension fund assets -44 -41 C 01.00 (r390,c010) Articles 4(109), 36(1) point (e) and 41 of CRR
A.1.12 (-) Reciprocal cross holdings in CET1 Capital 0 0 C 01.00 (r430,c010) Articles 4(122), 36(1) point (g) and 44 of CRR
A.1.13 (-) Excess deduction from AT1 items over AT1 Capital 0 0 C 01.00 (r440,c010) Article 36(1) point (j) of CRR
A.1.14 (-) Deductions related to assets which can alternatively be subject to a 1.250% risk weight 0 0C 01.00 (r450,c010) + C 01.00 (r460,c010)
+ C 01.00 (r470,c010) + C 01.00
(r471,c010)+ C 01.00 (r472,c010)
Articles 4(36), 36(1) point (k) (i) and 89 to 91 of CRR; Articles 36(1) point (k) (ii), 243(1) point
(b), 244(1) point (b) and 258 of CRR; Articles 36(1) point k) (iii) and 379(3) of CRR; Articles
36(1) point k) (iv) and 153(8) of CRR and Articles 36(1) point k) (v) and 155(4) of CRR.
A.1.14.1 Of which: from securitisation positions (-) 0 0 C 01.00 (r460,c010) Articles 36(1) point (k) (ii), 243(1) point (b), 244(1) point (b) and 258 of CRR
A.1.15(-) Holdings of CET1 capital instruments of financial sector entities where the institiution
does not have a significant investment0 0 C 01.00 (r480,c010) Articles 4(27), 36(1) point (h); 43 to 46, 49 (2) and (3) and 79 of CRR
A.1.16 (-) Deductible DTAs that rely on future profitability and arise from temporary differences 0 0 C 01.00 (r490,c010) Articles 36(1) point (c) and 38; Articles 48(1) point (a) and 48(2) of CRR
A.1.17(-) Holdings of CET1 capital instruments of financial sector entities where the institiution
has a significant investment0 0 C 01.00 (r500,c010) Articles 4(27); 36(1) point (i); 43, 45; 47; 48(1) point (b); 49(1) to (3) and 79 of CRR
A.1.18 (-) Amount exceding the 17.65% threshold 0 0 C 01.00 (r510,c010) Article 48 of CRR
A.1.19 (-) Additional deductions of CET1 Capital due to Article 3 CRR 0 0 C 01.00 (r524,c010) Article 3 CRR
A.1.20 CET1 capital elements or deductions - other 0 0 C 01.00 (r529,c010) -
A.1.21 Transitional adjustments 37 0 CA1 {1.1.1.6 + 1.1.1.8 + 1.1.1.26} -
A.1.21.1 Transitional adjustments due to grandfathered CET1 Capital instruments (+/-) 0 0 C 01.00 (r220,c010) Articles 483(1) to (3), and 484 to 487 of CRR
A.1.21.2 Transitional adjustments due to additional minority interests (+/-) 28 0 C 01.00 (r240,c010) Articles 479 and 480 of CRR
A.1.21.3 Other transitional adjustments to CET1 Capital (+/-) 9 0 C 01.00 (r520,c010) Articles 469 to 472, 478 and 481 of CRR
A.2 ADDITIONAL TIER 1 CAPITAL (net of deductions and after transitional adjustments) 498 484 C 01.00 (r530,c010) Article 61 of CRR
A.2.1 Additional Tier 1 Capital instruments 518 496 C 01.00 (r540,c010) + C 01.00 (r670,c010)
A.2.2 (-) Excess deduction from T2 items over T2 capital 0 0 C 01.00 (r720,c010)
A.2.3 Other Additional Tier 1 Capital components and deductions -21 -12
C 01.00 (r690,c010) + C 01.00 (r700,c010)
+ C 01.00 (r710,c010) + C 01.00
(r740,c010) + C 01.00 (r744,c010) + C
01.00 (r748,c010)
A.2.4 Additional Tier 1 transitional adjustments 0 0C 01.00 (r660,c010) + C 01.00 (r680,c010)
+ C 01.00 (r730,c010)
A.3 TIER 1 CAPITAL (net of deductions and after transitional adjustments) 9,852 10,085 C 01.00 (r015,c010) Article 25 of CRR
A.4 TIER 2 CAPITAL (net of deductions and after transitional adjustments) 1,592 1,502 C 01.00 (r750,c010) Article 71 of CRR
A.4.1 Tier 2 Capital instruments 1,547 1,450 C 01.00 (r760,c010) + C 01.00 (r890,c010)
A.4.2 Other Tier 2 Capital components and deductions 62 53
C 01.00 (r910,c010) + C 01.00 (r920,c010)
+ C 01.00 (r930,c010) + C 01.00
(r940,c010) + C 01.00 (r950,c010) + C
01.00 (r970,c010) + C 01.00 (r974,c010) +
C 01.00 (r978,c010)
A.4.3 Tier 2 transitional adjustments -17 0C 01.00 (r880,c010) + C 01.00 (r900,c010)
+ C 01.00 (r960,c010)
B TOTAL RISK EXPOSURE AMOUNT 45,214 46,658 C 02.00 (r010,c010) Articles 92(3), 95, 96 and 98 of CRR
B.1 Of which: Transitional adjustments included 0 0 C 05.01 (r010;c040)
C.1 COMMON EQUITY TIER 1 CAPITAL RATIO (transitional period) 20.69% 20.58% CA3 {1} -
C.2 TIER 1 CAPITAL RATIO (transitional period) 21.79% 21.61% CA3 {3} -
C.3 TOTAL CAPITAL RATIO (transitional period) 25.31% 24.83% CA3 {5} -
CET1 Capital
Fully loadedD COMMON EQUITY TIER 1 CAPITAL (fully loaded) 9,317 9,601
[A.1-A.1.13-A.1.21+MIN(A.2+A.1.13-
A.2.2-A.2.4+MIN(A.4+A.2.2-
A.4.3,0),0)]
-
CET1 RATIO (%)
Fully loaded1 E COMMON EQUITY TIER 1 CAPITAL RATIO (fully loaded) 20.61% 20.58% [D.1]/[B-B.1] -
F Adjustments to CET1 due to IFRS 9 transitional arrangements 0 C 05.01 (r440,c010)
F Adjustments to AT1 due to IFRS 9 transitional arrangements 0 C 05.01 (r440,c020)
F Adjustments to T2 due to IFRS 9 transitional arrangements 0 C 05.01 (r440,c030)
F Adjustments included in RWAs due to IFRS 9 transitional arrangements 0 C 05.01 (r440,c040)
(1)The fully loaded CET1 ratio is an estimate calculated based on bank’s supervisory reporting. Therefore, any capital instruments that are not eligible from a regulatory point of view at the reporting date are not taken into account in this calculation.
Fully loaded CET1 capital ratio estimation is based on the formulae stated in column “COREP CODE” – please note that this might lead to differences to fully loaded CET1 capital ratios published by the participating banks e.g. in their Pillar 3 disclosure
Memo items
2018 EU-wide Transparency Exercise
Capital
Nykredit Realkredit
OWN FUNDS
Transitional period
OWN FUNDS
REQUIREMENTS
CAPITAL RATIOS (%)
Transitional period

201712 201806
(mln EUR, %)
As of
31/12/2017
As of
30/06/2018COREP CODE REGULATION
A.1 Tier 1 capital - transitional definition 9,852 10,085 C 47.00 (r320,c010)
A.2 Tier 1 capital - fully phased-in definition 9,815 10,085 C 47.00 (r310,c010)
B.1 Total leverage ratio exposures - using a transitional definition of Tier 1 capital 205,352 203,093 C 47.00 (r300,c010)
B.2 Total leverage ratio exposures - using a fully phased-in definition of Tier 1 capital 205,339 203,093 C 47.00 (r290,c010)
C.1 Leverage ratio - using a transitional definition of Tier 1 capital 4.8% 5.0% C 47.00 (r340,c010)
C.2 Leverage ratio - using a fully phased-in definition of Tier 1 capital 4.8% 5.0% C 47.00 (r330,c010)
2018 EU-wide Transparency ExerciseLeverage ratio
Nykredit Realkredit
Article 429 of the CRR; Delegated Regulation (EU) 2015/62 of 10 October 2014 amending
CRR
201712 201806
(mln EUR)
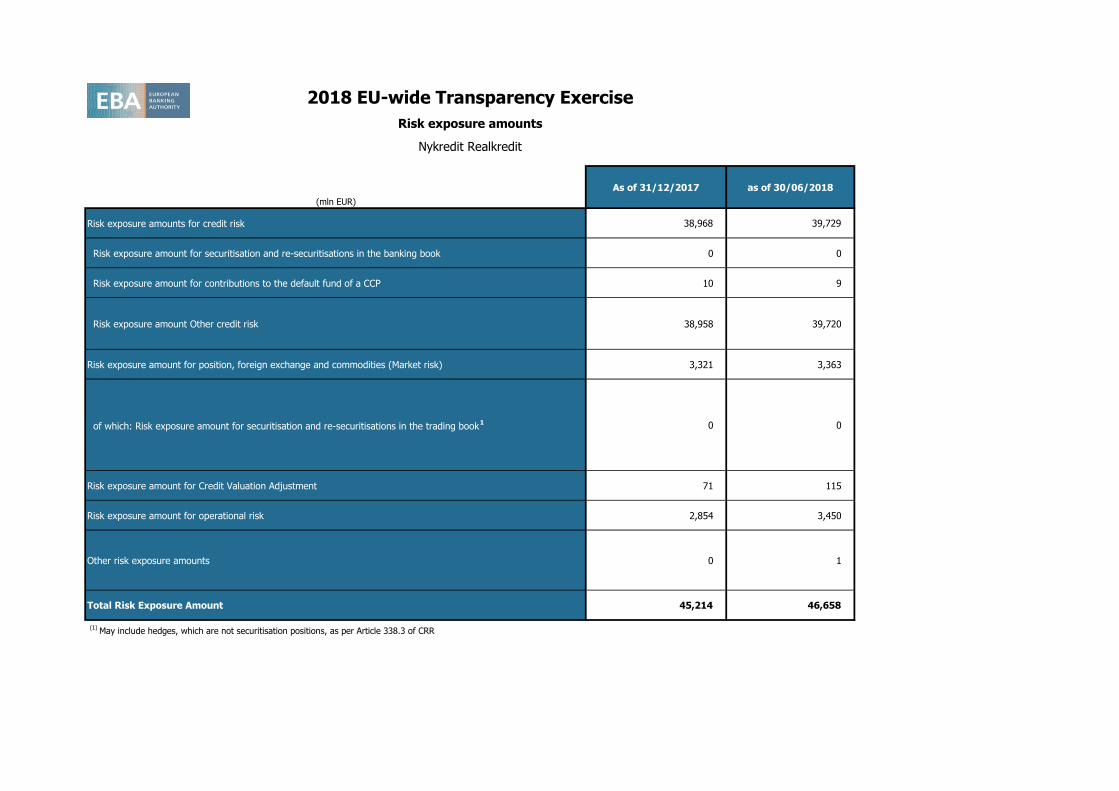
As of 31/12/2017 as of 30/06/2018
Risk exposure amounts for credit risk 38,968 39,729
Risk exposure amount for securitisation and re-securitisations in the banking book 0 0
Risk exposure amount for contributions to the default fund of a CCP 10 9
Risk exposure amount Other credit risk 38,958 39,720
Risk exposure amount for position, foreign exchange and commodities (Market risk) 3,321 3,363
of which: Risk exposure amount for securitisation and re-securitisations in the trading book1 0 0
Risk exposure amount for Credit Valuation Adjustment 71 115
Risk exposure amount for operational risk 2,854 3,450
Other risk exposure amounts 0 1
Total Risk Exposure Amount 45,214 46,658
(1)
May include hedges, which are not securitisation positions, as per Article 338.3 of CRR
2018 EU-wide Transparency Exercise
Risk exposure amounts
Nykredit Realkredit
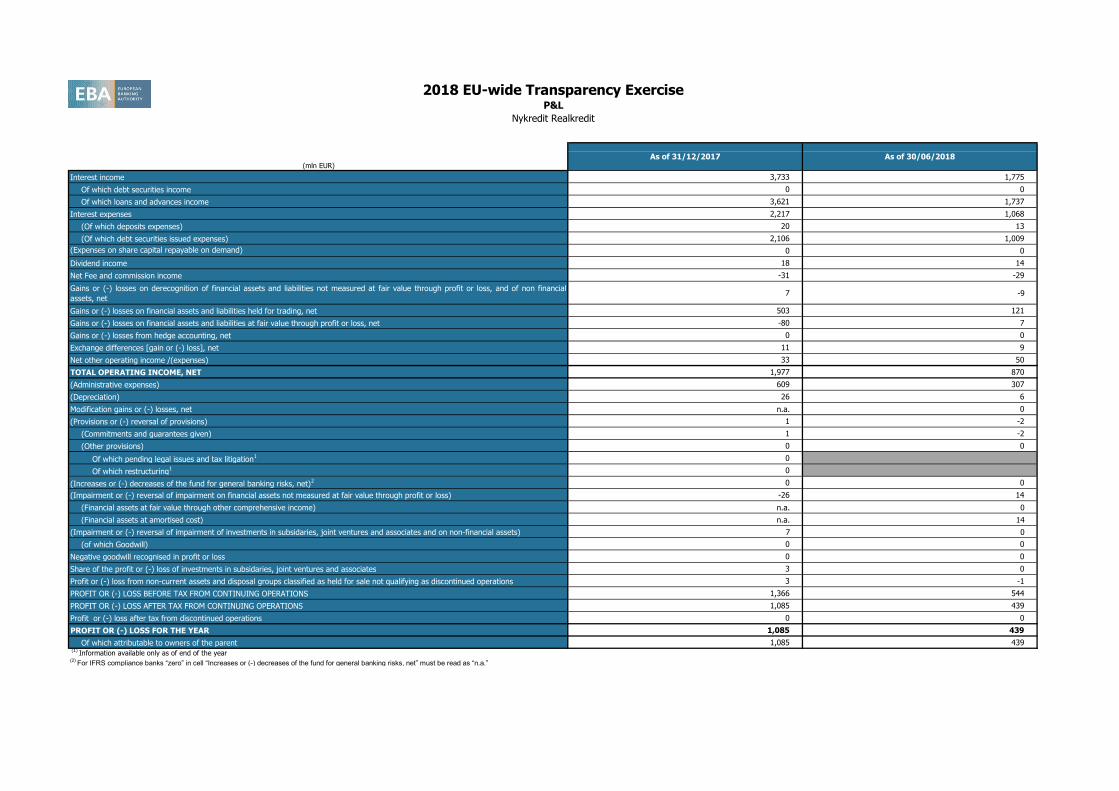
201712 201806
(mln EUR)
Interest income 3,733 1,775
Of which debt securities income 0 0
Of which loans and advances income 3,621 1,737
Interest expenses 2,217 1,068
(Of which deposits expenses) 20 13
(Of which debt securities issued expenses) 2,106 1,009
(Expenses on share capital repayable on demand) 0 0
Dividend income 18 14
Net Fee and commission income -31 -29
Gains or (-) losses on derecognition of financial assets and liabilities not measured at fair value through profit or loss, and of non financial
assets, net7 -9
Gains or (-) losses on financial assets and liabilities held for trading, net 503 121
Gains or (-) losses on financial assets and liabilities at fair value through profit or loss, net -80 7
Gains or (-) losses from hedge accounting, net 0 0
Exchange differences [gain or (-) loss], net 11 9
Net other operating income /(expenses) 33 50
TOTAL OPERATING INCOME, NET 1,977 870
(Administrative expenses) 609 307
(Depreciation) 26 6
Modification gains or (-) losses, net n.a. 0
(Provisions or (-) reversal of provisions) 1 -2
(Commitments and guarantees given) 1 -2
(Other provisions) 0 0
Of which pending legal issues and tax litigation1 0
Of which restructuring1 0
(Increases or (-) decreases of the fund for general banking risks, net)2 0 0
(Impairment or (-) reversal of impairment on financial assets not measured at fair value through profit or loss) -26 14
(Financial assets at fair value through other comprehensive income) n.a. 0
(Financial assets at amortised cost) n.a. 14
(Impairment or (-) reversal of impairment of investments in subsidaries, joint ventures and associates and on non-financial assets) 7 0
(of which Goodwill) 0 0
Negative goodwill recognised in profit or loss 0 0
Share of the profit or (-) loss of investments in subsidaries, joint ventures and associates 3 0
Profit or (-) loss from non-current assets and disposal groups classified as held for sale not qualifying as discontinued operations 3 -1
PROFIT OR (-) LOSS BEFORE TAX FROM CONTINUING OPERATIONS 1,366 544
PROFIT OR (-) LOSS AFTER TAX FROM CONTINUING OPERATIONS 1,085 439
Profit or (-) loss after tax from discontinued operations 0 0
PROFIT OR (-) LOSS FOR THE YEAR 1,085 439
Of which attributable to owners of the parent 1,085 439 (1)
Information available only as of end of the year(2)
For IFRS compliance banks “zero” in cell “Increases or (-) decreases of the fund for general banking risks, net” must be read as “n.a.”
2018 EU-wide Transparency ExerciseP&L
Nykredit Realkredit
As of 31/12/2017 As of 30/06/2018
201712 201806 201712 201712 201712 201712 201712 201712 201712 201712 201712 201712 201806 201806 201806 201806 201806 201806 201806 201806 201806 201806
As of 31/12/2017 As of 30/06/2018
(mln EUR)
MULTIPLICATION
FACTOR (mc) x
AVERAGE OF
PREVIOUS 60
WORKING DAYS
(VaRavg)
PREVIOUS
DAY (VaRt-1)
MULTIPLICATION
FACTOR (ms) x
AVERAGE OF
PREVIOUS 60
WORKING DAYS
(SVaRavg)
LATEST AVAILABLE
(SVaRt-1)
12 WEEKS
AVERAGE
MEASURE
LAST MEASURE FLOOR
12 WEEKS
AVERAGE
MEASURE
LAST
MEASURE
MULTIPLICATION
FACTOR (mc) x
AVERAGE OF
PREVIOUS 60
WORKING DAYS
(VaRavg)
PREVIOUS DAY
(VaRt-1)
MULTIPLICATION
FACTOR (ms) x
AVERAGE OF
PREVIOUS 60
WORKING DAYS
(SVaRavg)
LATEST
AVAILABLE (SVaRt-
1)
12 WEEKS
AVERAGE
MEASURE
LAST
MEASUREFLOOR
12 WEEKS
AVERAGE
MEASURE
LAST
MEASURE
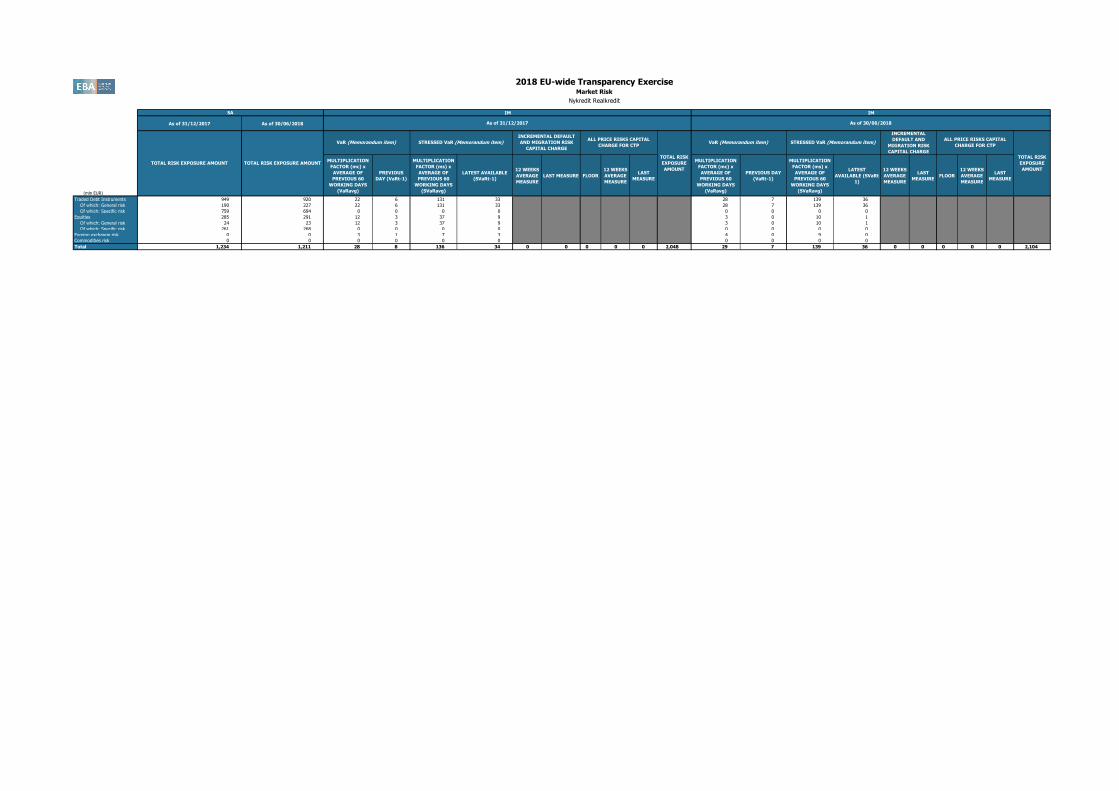
Traded Debt Instruments 949 920 22 6 131 33 28 7 139 36
Of which: General risk 190 227 22 6 131 33 28 7 139 36
Of which: Specific risk 759 694 0 0 0 0 0 0 0 0
Equities 285 291 12 3 37 9 3 0 10 1
Of which: General risk 24 23 12 3 37 9 3 0 10 1
Of which: Specific risk 261 268 0 0 0 0 0 0 0 0
Foreign exchange risk 0 0 3 1 7 3 4 0 9 0
Commodities risk 0 0 0 0 0 0 0 0 0 0
Total 1,234 1,211 28 8 136 34 0 0 0 0 0 2,048 29 7 139 36 0 0 0 0 0 2,104
2018 EU-wide Transparency ExerciseMarket Risk
Nykredit Realkredit
SA IM IM
TOTAL RISK EXPOSURE AMOUNT TOTAL RISK EXPOSURE AMOUNT
VaR (Memorandum item) STRESSED VaR (Memorandum item)
INCREMENTAL DEFAULT
AND MIGRATION RISK
CAPITAL CHARGE
STRESSED VaR (Memorandum item)
INCREMENTAL
DEFAULT AND
MIGRATION RISK
CAPITAL CHARGE
ALL PRICE RISKS CAPITAL
CHARGE FOR CTP
TOTAL RISK
EXPOSURE
AMOUNT
As of 31/12/2017 As of 30/06/2018
ALL PRICE RISKS CAPITAL
CHARGE FOR CTP
TOTAL RISK
EXPOSURE
AMOUNT
VaR (Memorandum item)

201712 201712 201712 201712 201806 201806 201806 201806
(mln EUR, %)
Central governments or central banks 6,343 10,445 10 3,941 8,451 10
Regional governments or local authorities 0 0 0 0 0 0
Public sector entities 0 0 0 0 0 0
Multilateral Development Banks 0 0 0 0 0 0
International Organisations 0 0 0 0 0 0
Institutions 3,142 2,468 581 2,847 2,154 579
Corporates 1,122 864 731 845 845 724
of which: SME 410 410 313 408 408 311
Retail 106 106 80 140 140 105
of which: SME 0 0 0 0 0 0
Secured by mortgages on immovable property 69 69 24 0 0 0
of which: SME 0 0 0 0 0 0
Exposures in default 5 4 4 1 0 0 0 0
Items associated with particularly high risk 0 0 0 0 0 0
Covered bonds 2,493 2,493 249 1,820 1,820 190
Claims on institutions and corporates with a ST credit assessment 0 0 0 0 0 0
Collective investments undertakings (CIU) 0 0 0 0 0 0
Equity 35 35 35 20 20 20
Securitisation 0 0 0 0 0 0
Other exposures 0 0 0 0 0 0
Standardised Total 13,314 16,484 1,714 1 9,614 13,430 1,628 0(1) Original exposure, unlike Exposure value, is reported before taking into account any effect due to credit conversion factors or credit risk mitigation techniques (e.g. substitution effects).
1 (mln EUR, %)
Central governments or central banks 5,116 9,919 0 2,714 7,605 0
Regional governments or local authorities 0 0 0 0 0 0
Public sector entities 0 0 0 0 0 0
Multilateral Development Banks 0 0 0 0 0 0
International Organisations 0 0 0 0 0 0
Institutions 2,027 1,675 444 2,039 1,793 458
Corporates 1,082 824 711 845 845 724
of which: SME 410 410 313 408 408 311
Retail 106 106 80 140 140 105
of which: SME 0 0 0 0 0 0
Secured by mortgages on immovable property 0 0 0 0 0 0
of which: SME 0 0 0 0 0 0
Exposures in default 0 0 0 0 0 0 0 0
Items associated with particularly high risk 0 0 0 0 0 0
Covered bonds 2,358 2,358 236 1,666 1,666 167
Claims on institutions and corporates with a ST credit assessment 0 0 0 0 0 0
Collective investments undertakings (CIU) 0 0 0 0 0 0
Equity 35 35 35 20 20 20
Securitisation
Other exposures 0 0 0 0 0 0
Standardised Total2
0 1(1) Original exposure, unlike Exposure value, is reported before taking into account any effect due to credit conversion factors or credit risk mitigation techniques (e.g. substitution effects). (2) Total value adjustments and provisions per country of counterparty excludes those for securistisation exposures, additional valuation adjustments (AVAs) and other own funds reductions related to the exposures, but includes general credit risk adjustments.
2 (mln EUR, %)
Central governments or central banks 747 46 0 442 60 0
Regional governments or local authorities 0 0 0 0 0 0
Public sector entities 0 0 0 0 0 0
Multilateral Development Banks 0 0 0 0 0 0
International Organisations 0 0 0 0 0 0
Institutions 54 54 9 33 33 9
Corporates 0 0 0 0 0 0
of which: SME 0 0 0 0 0 0
Retail 0 0 0 0 0 0
of which: SME 0 0 0 0 0 0
Secured by mortgages on immovable property 0 0 0 0 0 0
of which: SME 0 0 0 0 0 0
Exposures in default 0 0 0 0 0 0 0 0
Items associated with particularly high risk 0 0 0 0 0 0
Covered bonds 76 76 8 76 76 12
Claims on institutions and corporates with a ST credit assessment 0 0 0 0 0 0
Collective investments undertakings (CIU) 0 0 0 0 0 0
Equity 0 0 0 0 0 0
Securitisation
Other exposures 0 0 0 0 0 0
Standardised Total2
0 0(1) Original exposure, unlike Exposure value, is reported before taking into account any effect due to credit conversion factors or credit risk mitigation techniques (e.g. substitution effects). (2) Total value adjustments and provisions per country of counterparty excludes those for securistisation exposures, additional valuation adjustments (AVAs) and other own funds reductions related to the exposures, but includes general credit risk adjustments.
3 (mln EUR, %)
Central governments or central banks 0 0 0 0 0 0
Regional governments or local authorities 0 0 0 0 0 0
Public sector entities 0 0 0 0 0 0
Multilateral Development Banks 0 0 0 0 0 0
International Organisations 0 0 0 0 0 0
Institutions 0 0 0 0 0 0
Corporates 0 0 0 0 0 0
of which: SME 0 0 0 0 0 0
Retail 0 0 0 0 0 0
of which: SME 0 0 0 0 0 0
Secured by mortgages on immovable property 0 0 0 0 0 0
of which: SME 0 0 0 0 0 0
Exposures in default 0 0 0 0 0 0 0 0
Items associated with particularly high risk 0 0 0 0 0 0
Covered bonds 0 0 0 0 0 0
Claims on institutions and corporates with a ST credit assessment 0 0 0 0 0 0
Collective investments undertakings (CIU) 0 0 0 0 0 0
Equity 0 0 0 0 0 0
Securitisation
Other exposures 0 0 0 0 0 0
Standardised Total2
0 0(1) Original exposure, unlike Exposure value, is reported before taking into account any effect due to credit conversion factors or credit risk mitigation techniques (e.g. substitution effects). (2) Total value adjustments and provisions per country of counterparty excludes those for securistisation exposures, additional valuation adjustments (AVAs) and other own funds reductions related to the exposures, but includes general credit risk adjustments.
2018 EU-wide Transparency Exercise
Credit Risk - Standardised Approach
Nykredit Realkredit
Standardised Approach
As of 31/12/2017 As of 30/06/2018
Risk exposure
amount
Value adjustments
and provisions
Consolidated data
Standardised Approach
As of 31/12/2017 As of 30/06/2018
Original Exposure1
Exposure Value1 Risk exposure
amount
Value adjustments
and provisionsOriginal Exposure
1 Exposure Value
1
Risk exposure
amount
Value adjustments
and provisions2
DENMARK
Standardised Approach
As of 31/12/2017 As of 30/06/2018
Original Exposure1
Exposure Value1 Risk exposure
amount
Value adjustments
and provisions2 Original Exposure
1 Exposure Value
1
Risk exposure
amount
Value adjustments
and provisions2
SWEDEN
Standardised Approach
As of 31/12/2017 As of 30/06/2018
Original Exposure1
Exposure Value1 Risk exposure
amount
Value adjustments
and provisions2 Original Exposure
1 Exposure Value
1
Risk exposure
amount
Value adjustments
and provisions2
Country of
Counterpart 3
Original Exposure1
Exposure Value1 Risk exposure
amount
Value adjustments
and provisions2 Original Exposure
1 Exposure Value
1
201712 201712 201712 201712 201806 201806 201806 201806
2018 EU-wide Transparency Exercise
Credit Risk - Standardised Approach
Nykredit Realkredit
Standardised Approach
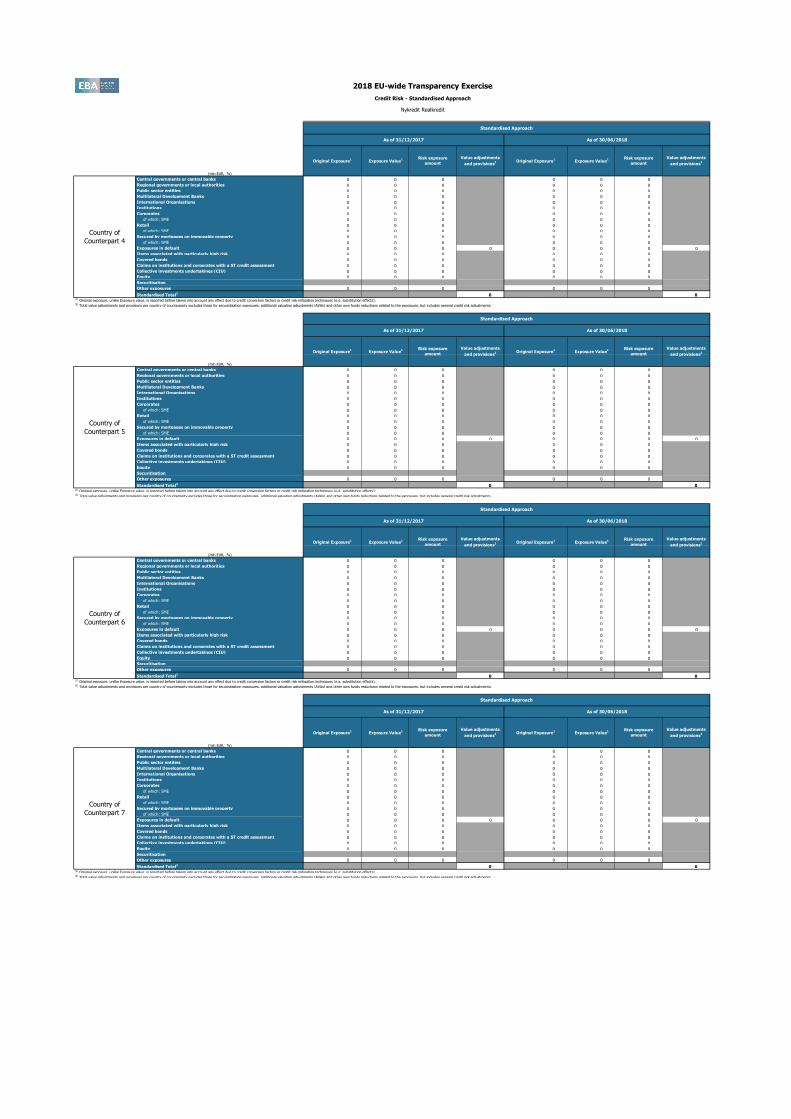
4 (mln EUR, %)
Central governments or central banks 0 0 0 0 0 0
Regional governments or local authorities 0 0 0 0 0 0
Public sector entities 0 0 0 0 0 0
Multilateral Development Banks 0 0 0 0 0 0
International Organisations 0 0 0 0 0 0
Institutions 0 0 0 0 0 0
Corporates 0 0 0 0 0 0
of which: SME 0 0 0 0 0 0
Retail 0 0 0 0 0 0
of which: SME 0 0 0 0 0 0
Secured by mortgages on immovable property 0 0 0 0 0 0
of which: SME 0 0 0 0 0 0
Exposures in default 0 0 0 0 0 0 0 0
Items associated with particularly high risk 0 0 0 0 0 0
Covered bonds 0 0 0 0 0 0
Claims on institutions and corporates with a ST credit assessment 0 0 0 0 0 0
Collective investments undertakings (CIU) 0 0 0 0 0 0
Equity 0 0 0 0 0 0
Securitisation
Other exposures 0 0 0 0 0 0
Standardised Total2
0 0(1) Original exposure, unlike Exposure value, is reported before taking into account any effect due to credit conversion factors or credit risk mitigation techniques (e.g. substitution effects). (2) Total value adjustments and provisions per country of counterparty excludes those for securistisation exposures, additional valuation adjustments (AVAs) and other own funds reductions related to the exposures, but includes general credit risk adjustments.
5 (mln EUR, %)
Central governments or central banks 0 0 0 0 0 0
Regional governments or local authorities 0 0 0 0 0 0
Public sector entities 0 0 0 0 0 0
Multilateral Development Banks 0 0 0 0 0 0
International Organisations 0 0 0 0 0 0
Institutions 0 0 0 0 0 0
Corporates 0 0 0 0 0 0
of which: SME 0 0 0 0 0 0
Retail 0 0 0 0 0 0
of which: SME 0 0 0 0 0 0
Secured by mortgages on immovable property 0 0 0 0 0 0
of which: SME 0 0 0 0 0 0
Exposures in default 0 0 0 0 0 0 0 0
Items associated with particularly high risk 0 0 0 0 0 0
Covered bonds 0 0 0 0 0 0
Claims on institutions and corporates with a ST credit assessment 0 0 0 0 0 0
Collective investments undertakings (CIU) 0 0 0 0 0 0
Equity 0 0 0 0 0 0
Securitisation
Other exposures 0 0 0 0 0 0
Standardised Total2
0 0(1) Original exposure, unlike Exposure value, is reported before taking into account any effect due to credit conversion factors or credit risk mitigation techniques (e.g. substitution effects). (2) Total value adjustments and provisions per country of counterparty excludes those for securistisation exposures, additional valuation adjustments (AVAs) and other own funds reductions related to the exposures, but includes general credit risk adjustments.
6 (mln EUR, %)
Central governments or central banks 0 0 0 0 0 0
Regional governments or local authorities 0 0 0 0 0 0
Public sector entities 0 0 0 0 0 0
Multilateral Development Banks 0 0 0 0 0 0
International Organisations 0 0 0 0 0 0
Institutions 0 0 0 0 0 0
Corporates 0 0 0 0 0 0
of which: SME 0 0 0 0 0 0
Retail 0 0 0 0 0 0
of which: SME 0 0 0 0 0 0
Secured by mortgages on immovable property 0 0 0 0 0 0
of which: SME 0 0 0 0 0 0
Exposures in default 0 0 0 0 0 0 0 0
Items associated with particularly high risk 0 0 0 0 0 0
Covered bonds 0 0 0 0 0 0
Claims on institutions and corporates with a ST credit assessment 0 0 0 0 0 0
Collective investments undertakings (CIU) 0 0 0 0 0 0
Equity 0 0 0 0 0 0
Securitisation
Other exposures 0 0 0 0 0 0
Standardised Total2
0 0(1) Original exposure, unlike Exposure value, is reported before taking into account any effect due to credit conversion factors or credit risk mitigation techniques (e.g. substitution effects). (2) Total value adjustments and provisions per country of counterparty excludes those for securistisation exposures, additional valuation adjustments (AVAs) and other own funds reductions related to the exposures, but includes general credit risk adjustments.
7 (mln EUR, %)
Central governments or central banks 0 0 0 0 0 0
Regional governments or local authorities 0 0 0 0 0 0
Public sector entities 0 0 0 0 0 0
Multilateral Development Banks 0 0 0 0 0 0
International Organisations 0 0 0 0 0 0
Institutions 0 0 0 0 0 0
Corporates 0 0 0 0 0 0
of which: SME 0 0 0 0 0 0
Retail 0 0 0 0 0 0
of which: SME 0 0 0 0 0 0
Secured by mortgages on immovable property 0 0 0 0 0 0
of which: SME 0 0 0 0 0 0
Exposures in default 0 0 0 0 0 0 0 0
Items associated with particularly high risk 0 0 0 0 0 0
Covered bonds 0 0 0 0 0 0
Claims on institutions and corporates with a ST credit assessment 0 0 0 0 0 0
Collective investments undertakings (CIU) 0 0 0 0 0 0
Equity 0 0 0 0 0 0
Securitisation
Other exposures 0 0 0 0 0 0
Standardised Total2
0 0(1) Original exposure, unlike Exposure value, is reported before taking into account any effect due to credit conversion factors or credit risk mitigation techniques (e.g. substitution effects). (2) Total value adjustments and provisions per country of counterparty excludes those for securistisation exposures, additional valuation adjustments (AVAs) and other own funds reductions related to the exposures, but includes general credit risk adjustments.
Standardised Approach
As of 31/12/2017 As of 30/06/2018
Risk exposure
amount
Value adjustments
and provisions2
Country of
Counterpart 4
Standardised Approach
As of 31/12/2017 As of 30/06/2018
Original Exposure1
Exposure Value1 Risk exposure
amount
Value adjustments
and provisions2 Original Exposure
1 Exposure Value
1
Risk exposure
amount
Value adjustments
and provisions2
Country of
Counterpart 5
Standardised Approach
As of 31/12/2017 As of 30/06/2018
Original Exposure1
Exposure Value1 Risk exposure
amount
Value adjustments
and provisions2 Original Exposure
1 Exposure Value
1
Risk exposure
amount
Value adjustments
and provisions2
Country of
Counterpart 6
Standardised Approach
As of 31/12/2017 As of 30/06/2018
Original Exposure1
Exposure Value1 Risk exposure
amount
Value adjustments
and provisions2 Original Exposure
1 Exposure Value
1
Risk exposure
amount
Value adjustments
and provisions2
Country of
Counterpart 7
Original Exposure1
Exposure Value1 Risk exposure
amount
Value adjustments
and provisions2 Original Exposure
1 Exposure Value
1
201712 201712 201712 201712 201806 201806 201806 201806
2018 EU-wide Transparency Exercise
Credit Risk - Standardised Approach
Nykredit Realkredit
Standardised Approach
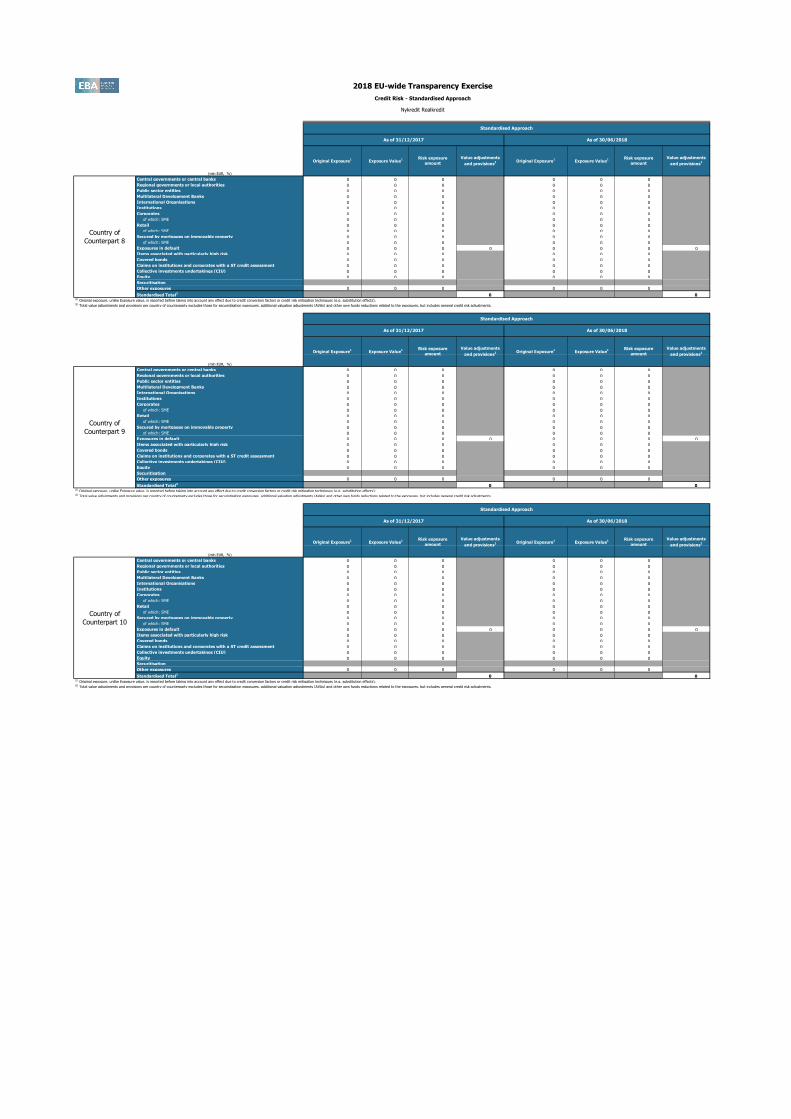
8 (mln EUR, %)
Central governments or central banks 0 0 0 0 0 0
Regional governments or local authorities 0 0 0 0 0 0
Public sector entities 0 0 0 0 0 0
Multilateral Development Banks 0 0 0 0 0 0
International Organisations 0 0 0 0 0 0
Institutions 0 0 0 0 0 0
Corporates 0 0 0 0 0 0
of which: SME 0 0 0 0 0 0
Retail 0 0 0 0 0 0
of which: SME 0 0 0 0 0 0
Secured by mortgages on immovable property 0 0 0 0 0 0
of which: SME 0 0 0 0 0 0
Exposures in default 0 0 0 0 0 0 0 0
Items associated with particularly high risk 0 0 0 0 0 0
Covered bonds 0 0 0 0 0 0
Claims on institutions and corporates with a ST credit assessment 0 0 0 0 0 0
Collective investments undertakings (CIU) 0 0 0 0 0 0
Equity 0 0 0 0 0 0
Securitisation
Other exposures 0 0 0 0 0 0
Standardised Total2
0 0(1) Original exposure, unlike Exposure value, is reported before taking into account any effect due to credit conversion factors or credit risk mitigation techniques (e.g. substitution effects). (2) Total value adjustments and provisions per country of counterparty excludes those for securistisation exposures, additional valuation adjustments (AVAs) and other own funds reductions related to the exposures, but includes general credit risk adjustments.
9 (mln EUR, %)
Central governments or central banks 0 0 0 0 0 0
Regional governments or local authorities 0 0 0 0 0 0
Public sector entities 0 0 0 0 0 0
Multilateral Development Banks 0 0 0 0 0 0
International Organisations 0 0 0 0 0 0
Institutions 0 0 0 0 0 0
Corporates 0 0 0 0 0 0
of which: SME 0 0 0 0 0 0
Retail 0 0 0 0 0 0
of which: SME 0 0 0 0 0 0
Secured by mortgages on immovable property 0 0 0 0 0 0
of which: SME 0 0 0 0 0 0
Exposures in default 0 0 0 0 0 0 0 0
Items associated with particularly high risk 0 0 0 0 0 0
Covered bonds 0 0 0 0 0 0
Claims on institutions and corporates with a ST credit assessment 0 0 0 0 0 0
Collective investments undertakings (CIU) 0 0 0 0 0 0
Equity 0 0 0 0 0 0
Securitisation
Other exposures 0 0 0 0 0 0
Standardised Total2
0 0(1) Original exposure, unlike Exposure value, is reported before taking into account any effect due to credit conversion factors or credit risk mitigation techniques (e.g. substitution effects). (2) Total value adjustments and provisions per country of counterparty excludes those for securistisation exposures, additional valuation adjustments (AVAs) and other own funds reductions related to the exposures, but includes general credit risk adjustments.
10 (mln EUR, %)
Central governments or central banks 0 0 0 0 0 0
Regional governments or local authorities 0 0 0 0 0 0
Public sector entities 0 0 0 0 0 0
Multilateral Development Banks 0 0 0 0 0 0
International Organisations 0 0 0 0 0 0
Institutions 0 0 0 0 0 0
Corporates 0 0 0 0 0 0
of which: SME 0 0 0 0 0 0
Retail 0 0 0 0 0 0
of which: SME 0 0 0 0 0 0
Secured by mortgages on immovable property 0 0 0 0 0 0
of which: SME 0 0 0 0 0 0
Exposures in default 0 0 0 0 0 0 0 0
Items associated with particularly high risk 0 0 0 0 0 0
Covered bonds 0 0 0 0 0 0
Claims on institutions and corporates with a ST credit assessment 0 0 0 0 0 0
Collective investments undertakings (CIU) 0 0 0 0 0 0
Equity 0 0 0 0 0 0
Securitisation
Other exposures 0 0 0 0 0 0
Standardised Total2
0 0(1) Original exposure, unlike Exposure value, is reported before taking into account any effect due to credit conversion factors or credit risk mitigation techniques (e.g. substitution effects). (2) Total value adjustments and provisions per country of counterparty excludes those for securistisation exposures, additional valuation adjustments (AVAs) and other own funds reductions related to the exposures, but includes general credit risk adjustments.
Standardised Approach
As of 31/12/2017 As of 30/06/2018
Risk exposure
amount
Value adjustments
and provisions2
Country of
Counterpart 8
Standardised Approach
As of 31/12/2017 As of 30/06/2018
Original Exposure1
Exposure Value1 Risk exposure
amount
Value adjustments
and provisions2 Original Exposure
1 Exposure Value
1
Risk exposure
amount
Value adjustments
and provisions2
Country of
Counterpart 9
Standardised Approach
As of 31/12/2017 As of 30/06/2018
Original Exposure1
Exposure Value1 Risk exposure
amount
Value adjustments
and provisions2 Original Exposure
1 Exposure Value
1
Risk exposure
amount
Value adjustments
and provisions2
Country of
Counterpart 10
Original Exposure1
Exposure Value1 Risk exposure
amount
Value adjustments
and provisions2 Original Exposure
1 Exposure Value
1
201712 201712 201712 201712 201712 201712 201806 201806 201806 201806 201806 201806
(mln EUR, %)
Of which:
defaulted(2)
Of which:
defaulted
Of which:
defaulted
Of which:
defaulted
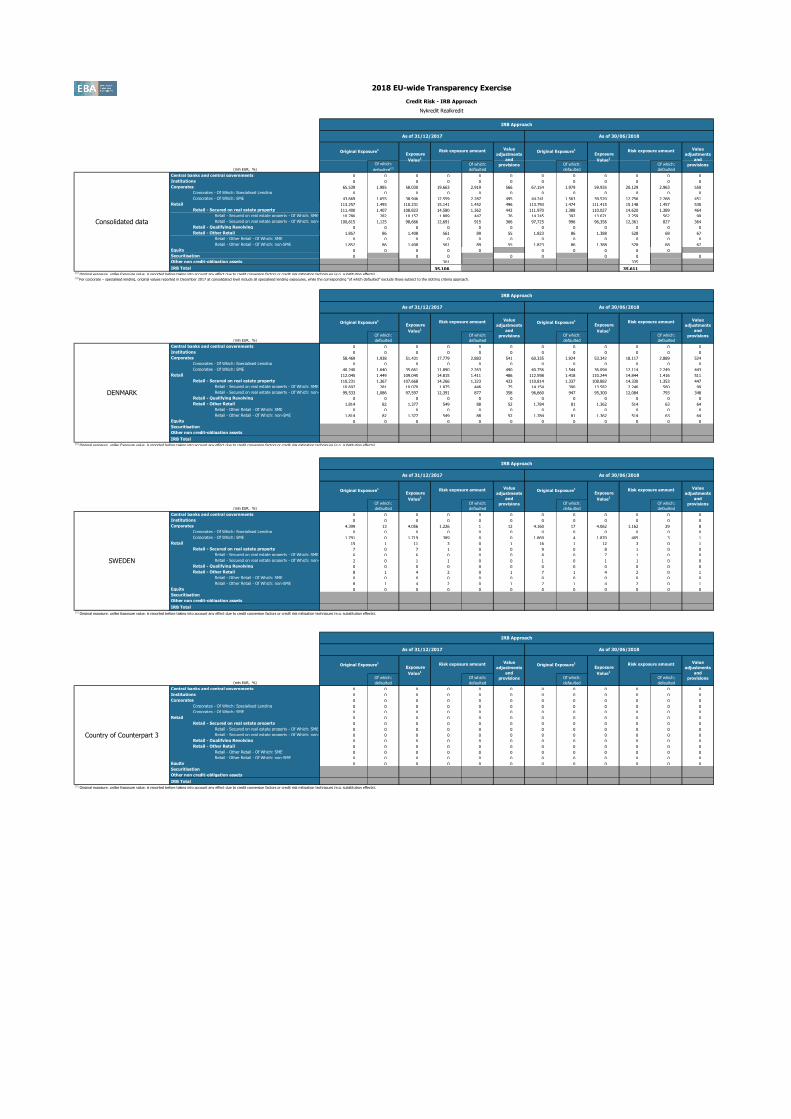
Central banks and central governments 0 0 0 0 0 0 0 0 0 0 0 0
Institutions 0 0 0 0 0 0 0 0 0 0 0 0
Corporates 65,539 1,985 58,030 19,663 2,919 566 67,154 1,979 59,935 20,129 2,963 550
Corporates - Of Which: Specialised Lending 0 0 0 0 0 0 0 0 0 0 0 0
Corporates - Of Which: SME 43,669 1,655 38,946 12,559 2,287 495 44,241 1,563 39,520 12,756 2,268 451
Retail 113,257 1,493 110,231 15,141 1,452 496 113,793 1,474 111,415 15,148 1,457 530
Retail - Secured on real estate property 111,400 1,407 108,823 14,580 1,362 442 111,970 1,388 110,027 14,620 1,389 464
Retail - Secured on real estate property - Of Which: SME 10,786 282 10,157 1,889 447 76 14,245 392 13,671 2,259 562 99
Retail - Secured on real estate property - Of Which: non-
SME100,615 1,125 98,666 12,691 915 366 97,725 996 96,356 12,361 827 364
Retail - Qualifying Revolving 0 0 0 0 0 0 0 0 0 0 0 0
Retail - Other Retail 1,857 86 1,408 561 89 55 1,823 86 1,388 528 68 67
Retail - Other Retail - Of Which: SME 0 0 0 0 0 0 0 0 0 0 0 0
Retail - Other Retail - Of Which: non-SME 1,857 86 1,408 561 89 55 1,823 86 1,388 528 68 67
Equity 0 0 0 0 0 0 0 0 0 0
Securitisation 0 0 0 0 0 0 0 0
Other non credit-obligation assets 301 335
IRB Total 35,106 35,611(1) Original exposure, unlike Exposure value, is reported before taking into account any effect due to credit conversion factors or credit risk mitigation techniques (e.g. substitution effects). (2) For corporate – specialised lending, original values reported in December 2017 at consolidated level include all specialised lending exposures, while the corresponding “of which defaulted” exclude those subject to the slotting criteria approach.
1 (mln EUR, %)
Of which:
defaulted
Of which:
defaulted
Of which:
defaulted
Of which:
defaulted
Central banks and central governments 0 0 0 0 0 0 0 0 0 0 0 0
Institutions 0 0 0 0 0 0 0 0 0 0 0 0
Corporates 58,469 1,938 51,431 17,779 2,883 541 60,335 1,924 53,342 18,117 2,889 524
Corporates - Of Which: Specialised Lending 0 0 0 0 0 0 0 0 0 0 0 0
Corporates - Of Which: SME 40,240 1,640 35,661 11,890 2,263 490 40,756 1,544 36,094 12,114 2,249 443
Retail 112,045 1,449 109,045 14,815 1,411 486 112,598 1,418 110,244 14,844 1,416 511
Retail - Secured on real estate property 110,231 1,367 107,668 14,266 1,323 433 110,814 1,337 108,882 14,330 1,353 447
Retail - Secured on real estate property - Of Which: SME 10,697 281 10,070 1,875 446 75 14,154 390 13,582 2,246 560 99
Retail - Secured on real estate property - Of Which: non-
SME99,533 1,086 97,597 12,391 877 358 96,660 947 95,300 12,084 793 348
Retail - Qualifying Revolving 0 0 0 0 0 0 0 0 0 0 0 0
Retail - Other Retail 1,814 82 1,377 549 88 52 1,784 81 1,362 514 63 64
Retail - Other Retail - Of Which: SME 0 0 0 0 0 0 0 0 0 0 0 0
Retail - Other Retail - Of Which: non-SME 1,814 82 1,377 549 88 52 1,784 81 1,362 514 63 64
Equity 0 0 0 0 0 0 0 0 0 0 0 0
Securitisation
Other non credit-obligation assets
IRB Total(1) Original exposure, unlike Exposure value, is reported before taking into account any effect due to credit conversion factors or credit risk mitigation techniques (e.g. substitution effects).
2 (mln EUR, %)
Of which:
defaulted
Of which:
defaulted
Of which:
defaulted
Of which:
defaulted
Central banks and central governments 0 0 0 0 0 0 0 0 0 0 0 0
Institutions 0 0 0 0 0 0 0 0 0 0 0 0
Corporates 4,399 13 4,056 1,226 1 12 4,160 17 4,062 1,162 29 8
Corporates - Of Which: Specialised Lending 0 0 0 0 0 0 0 0 0 0 0 0
Corporates - Of Which: SME 1,791 0 1,719 389 0 0 1,869 4 1,870 405 3 1
Retail 15 1 11 3 0 1 16 1 12 3 0 1
Retail - Secured on real estate property 7 0 7 1 0 0 9 0 8 1 0 0
Retail - Secured on real estate property - Of Which: SME 6 0 6 0 0 0 8 0 7 1 0 0
Retail - Secured on real estate property - Of Which: non-
SME2 0 1 1 0 0 1 0 1 1 0 0
Retail - Qualifying Revolving 0 0 0 0 0 0 0 0 0 0 0 0
Retail - Other Retail 8 1 4 2 0 1 7 1 4 2 0 1
Retail - Other Retail - Of Which: SME 0 0 0 0 0 0 0 0 0 0 0 0
Retail - Other Retail - Of Which: non-SME 8 1 4 2 0 1 7 1 4 2 0 1
Equity 0 0 0 0 0 0 0 0 0 0 0 0
Securitisation
Other non credit-obligation assets
IRB Total(1) Original exposure, unlike Exposure value, is reported before taking into account any effect due to credit conversion factors or credit risk mitigation techniques (e.g. substitution effects).
3 (mln EUR, %)
Of which:
defaulted
Of which:
defaulted
Of which:
defaulted
Of which:
defaulted
Central banks and central governments 0 0 0 0 0 0 0 0 0 0 0 0
Institutions 0 0 0 0 0 0 0 0 0 0 0 0
Corporates 0 0 0 0 0 0 0 0 0 0 0 0
Corporates - Of Which: Specialised Lending 0 0 0 0 0 0 0 0 0 0 0 0
Corporates - Of Which: SME 0 0 0 0 0 0 0 0 0 0 0 0
Retail 0 0 0 0 0 0 0 0 0 0 0 0
Retail - Secured on real estate property 0 0 0 0 0 0 0 0 0 0 0 0
Retail - Secured on real estate property - Of Which: SME 0 0 0 0 0 0 0 0 0 0 0 0
Retail - Secured on real estate property - Of Which: non-
SME0 0 0 0 0 0 0 0 0 0 0 0
Retail - Qualifying Revolving 0 0 0 0 0 0 0 0 0 0 0 0
Retail - Other Retail 0 0 0 0 0 0 0 0 0 0 0 0
Retail - Other Retail - Of Which: SME 0 0 0 0 0 0 0 0 0 0 0 0
Retail - Other Retail - Of Which: non-SME 0 0 0 0 0 0 0 0 0 0 0 0
Equity 0 0 0 0 0 0 0 0 0 0 0 0
Securitisation
Other non credit-obligation assets
IRB Total(1) Original exposure, unlike Exposure value, is reported before taking into account any effect due to credit conversion factors or credit risk mitigation techniques (e.g. substitution effects).
2018 EU-wide Transparency Exercise
Credit Risk - IRB Approach
Nykredit Realkredit
IRB Approach
As of 31/12/2017 As of 30/06/2018
Risk exposure amount Value
adjustments
and
provisions
Consolidated data
IRB Approach
As of 31/12/2017 As of 30/06/2018
Original Exposure1
Exposure
Value1
Risk exposure amount Value
adjustments
and
provisions
Original Exposure1
Exposure
Value1
Risk exposure amount Value
adjustments
and
provisions
DENMARK
IRB Approach
As of 31/12/2017 As of 30/06/2018
Original Exposure1
Exposure
Value1
Risk exposure amount Value
adjustments
and
provisions
Original Exposure1
Exposure
Value1
Risk exposure amount Value
adjustments
and
provisions
SWEDEN
IRB Approach
As of 31/12/2017 As of 30/06/2018
Original Exposure1
Exposure
Value1
Risk exposure amount Value
adjustments
and
provisions
Original Exposure1
Exposure
Value1
Risk exposure amount Value
adjustments
and
provisions
Country of Counterpart 3
Original Exposure1
Exposure
Value1
Risk exposure amount Value
adjustments
and
provisions
Original Exposure1
Exposure
Value1

201712 201712 201712 201712 201712 201712 201806 201806 201806 201806 201806 201806
2018 EU-wide Transparency Exercise
Credit Risk - IRB Approach
Nykredit Realkredit
4 (mln EUR, %)
Of which:
defaulted
Of which:
defaulted
Of which:
defaulted
Of which:
defaulted
Central banks and central governments 0 0 0 0 0 0 0 0 0 0 0 0
Institutions 0 0 0 0 0 0 0 0 0 0 0 0
Corporates 0 0 0 0 0 0 0 0 0 0 0 0
Corporates - Of Which: Specialised Lending 0 0 0 0 0 0 0 0 0 0 0 0
Corporates - Of Which: SME 0 0 0 0 0 0 0 0 0 0 0 0
Retail 0 0 0 0 0 0 0 0 0 0 0 0
Retail - Secured on real estate property 0 0 0 0 0 0 0 0 0 0 0 0
Retail - Secured on real estate property - Of Which: SME 0 0 0 0 0 0 0 0 0 0 0 0
Retail - Secured on real estate property - Of Which: non-
SME0 0 0 0 0 0 0 0 0 0 0 0
Retail - Qualifying Revolving 0 0 0 0 0 0 0 0 0 0 0 0
Retail - Other Retail 0 0 0 0 0 0 0 0 0 0 0 0
Retail - Other Retail - Of Which: SME 0 0 0 0 0 0 0 0 0 0 0 0
Retail - Other Retail - Of Which: non-SME 0 0 0 0 0 0 0 0 0 0 0 0
Equity 0 0 0 0 0 0 0 0 0 0 0 0
Securitisation
Other non credit-obligation assets
IRB Total(1) Original exposure, unlike Exposure value, is reported before taking into account any effect due to credit conversion factors or credit risk mitigation techniques (e.g. substitution effects).
5 (mln EUR, %)
Of which:
defaulted
Of which:
defaulted
Of which:
defaulted
Of which:
defaulted
Central banks and central governments 0 0 0 0 0 0 0 0 0 0 0 0
Institutions 0 0 0 0 0 0 0 0 0 0 0 0
Corporates 0 0 0 0 0 0 0 0 0 0 0 0
Corporates - Of Which: Specialised Lending 0 0 0 0 0 0 0 0 0 0 0 0
Corporates - Of Which: SME 0 0 0 0 0 0 0 0 0 0 0 0
Retail 0 0 0 0 0 0 0 0 0 0 0 0
Retail - Secured on real estate property 0 0 0 0 0 0 0 0 0 0 0 0
Retail - Secured on real estate property - Of Which: SME 0 0 0 0 0 0 0 0 0 0 0 0
Retail - Secured on real estate property - Of Which: non-
SME0 0 0 0 0 0 0 0 0 0 0 0
Retail - Qualifying Revolving 0 0 0 0 0 0 0 0 0 0 0 0
Retail - Other Retail 0 0 0 0 0 0 0 0 0 0 0 0
Retail - Other Retail - Of Which: SME 0 0 0 0 0 0 0 0 0 0 0 0
Retail - Other Retail - Of Which: non-SME 0 0 0 0 0 0 0 0 0 0 0 0
Equity 0 0 0 0 0 0 0 0 0 0 0 0
Securitisation
Other non credit-obligation assets
IRB Total(1) Original exposure, unlike Exposure value, is reported before taking into account any effect due to credit conversion factors or credit risk mitigation techniques (e.g. substitution effects).
6 (mln EUR, %)
Of which:
defaulted
Of which:
defaulted
Of which:
defaulted
Of which:
defaulted
Central banks and central governments 0 0 0 0 0 0 0 0 0 0 0 0
Institutions 0 0 0 0 0 0 0 0 0 0 0 0
Corporates 0 0 0 0 0 0 0 0 0 0 0 0
Corporates - Of Which: Specialised Lending 0 0 0 0 0 0 0 0 0 0 0 0
Corporates - Of Which: SME 0 0 0 0 0 0 0 0 0 0 0 0
Retail 0 0 0 0 0 0 0 0 0 0 0 0
Retail - Secured on real estate property 0 0 0 0 0 0 0 0 0 0 0 0
Retail - Secured on real estate property - Of Which: SME 0 0 0 0 0 0 0 0 0 0 0 0
Retail - Secured on real estate property - Of Which: non-
SME0 0 0 0 0 0 0 0 0 0 0 0
Retail - Qualifying Revolving 0 0 0 0 0 0 0 0 0 0 0 0
Retail - Other Retail 0 0 0 0 0 0 0 0 0 0 0 0
Retail - Other Retail - Of Which: SME 0 0 0 0 0 0 0 0 0 0 0 0
Retail - Other Retail - Of Which: non-SME 0 0 0 0 0 0 0 0 0 0 0 0
Equity 0 0 0 0 0 0 0 0 0 0 0 0
Securitisation
Other non credit-obligation assets
IRB Total(1) Original exposure, unlike Exposure value, is reported before taking into account any effect due to credit conversion factors or credit risk mitigation techniques (e.g. substitution effects).
7 (mln EUR, %)
Of which:
defaulted
Of which:
defaulted
Of which:
defaulted
Of which:
defaulted
Central banks and central governments 0 0 0 0 0 0 0 0 0 0 0 0
Institutions 0 0 0 0 0 0 0 0 0 0 0 0
Corporates 0 0 0 0 0 0 0 0 0 0 0 0
Corporates - Of Which: Specialised Lending 0 0 0 0 0 0 0 0 0 0 0 0
Corporates - Of Which: SME 0 0 0 0 0 0 0 0 0 0 0 0
Retail 0 0 0 0 0 0 0 0 0 0 0 0
Retail - Secured on real estate property 0 0 0 0 0 0 0 0 0 0 0 0
Retail - Secured on real estate property - Of Which: SME 0 0 0 0 0 0 0 0 0 0 0 0
Retail - Secured on real estate property - Of Which: non-
SME0 0 0 0 0 0 0 0 0 0 0 0
Retail - Qualifying Revolving 0 0 0 0 0 0 0 0 0 0 0 0
Retail - Other Retail 0 0 0 0 0 0 0 0 0 0 0 0
Retail - Other Retail - Of Which: SME 0 0 0 0 0 0 0 0 0 0 0 0
Retail - Other Retail - Of Which: non-SME 0 0 0 0 0 0 0 0 0 0 0 0
Equity 0 0 0 0 0 0 0 0 0 0 0 0
Securitisation
Other non credit-obligation assets
IRB Total(1) Original exposure, unlike Exposure value, is reported before taking into account any effect due to credit conversion factors or credit risk mitigation techniques (e.g. substitution effects).
IRB Approach
As of 31/12/2017 As of 30/06/2018
Risk exposure amount Value
adjustments
and
provisions
Country of Counterpart 4
IRB Approach
As of 31/12/2017 As of 30/06/2018
Original Exposure1
Exposure
Value1
Risk exposure amount Value
adjustments
and
provisions
Original Exposure1
Exposure
Value1
Risk exposure amount Value
adjustments
and
provisions
Country of Counterpart 5
IRB Approach
As of 31/12/2017 As of 30/06/2018
Original Exposure1
Exposure
Value1
Risk exposure amount Value
adjustments
and
provisions
Original Exposure1
Exposure
Value1
Risk exposure amount Value
adjustments
and
provisions
Country of Counterpart 6
IRB Approach
As of 31/12/2017 As of 30/06/2018
Original Exposure1
Exposure
Value1
Risk exposure amount Value
adjustments
and
provisions
Original Exposure1
Exposure
Value1
Risk exposure amount Value
adjustments
and
provisions
Country of Counterpart 7
Original Exposure1
Exposure
Value1
Risk exposure amount Value
adjustments
and
provisions
Original Exposure1
Exposure
Value1

201712 201712 201712 201712 201712 201712 201806 201806 201806 201806 201806 201806
2018 EU-wide Transparency Exercise
Credit Risk - IRB Approach
Nykredit Realkredit
8 (mln EUR, %)
Of which:
defaulted
Of which:
defaulted
Of which:
defaulted
Of which:
defaulted
Central banks and central governments 0 0 0 0 0 0 0 0 0 0 0 0
Institutions 0 0 0 0 0 0 0 0 0 0 0 0
Corporates 0 0 0 0 0 0 0 0 0 0 0 0
Corporates - Of Which: Specialised Lending 0 0 0 0 0 0 0 0 0 0 0 0
Corporates - Of Which: SME 0 0 0 0 0 0 0 0 0 0 0 0
Retail 0 0 0 0 0 0 0 0 0 0 0 0
Retail - Secured on real estate property 0 0 0 0 0 0 0 0 0 0 0 0
Retail - Secured on real estate property - Of Which: SME 0 0 0 0 0 0 0 0 0 0 0 0
Retail - Secured on real estate property - Of Which: non-
SME0 0 0 0 0 0 0 0 0 0 0 0
Retail - Qualifying Revolving 0 0 0 0 0 0 0 0 0 0 0 0
Retail - Other Retail 0 0 0 0 0 0 0 0 0 0 0 0
Retail - Other Retail - Of Which: SME 0 0 0 0 0 0 0 0 0 0 0 0
Retail - Other Retail - Of Which: non-SME 0 0 0 0 0 0 0 0 0 0 0 0
Equity 0 0 0 0 0 0 0 0 0 0 0 0
Securitisation
Other non credit-obligation assets
IRB Total(1) Original exposure, unlike Exposure value, is reported before taking into account any effect due to credit conversion factors or credit risk mitigation techniques (e.g. substitution effects).
9 (mln EUR, %)
Of which:
defaulted
Of which:
defaulted
Of which:
defaulted
Of which:
defaulted
Central banks and central governments 0 0 0 0 0 0 0 0 0 0 0 0
Institutions 0 0 0 0 0 0 0 0 0 0 0 0
Corporates 0 0 0 0 0 0 0 0 0 0 0 0
Corporates - Of Which: Specialised Lending 0 0 0 0 0 0 0 0 0 0 0 0
Corporates - Of Which: SME 0 0 0 0 0 0 0 0 0 0 0 0
Retail 0 0 0 0 0 0 0 0 0 0 0 0
Retail - Secured on real estate property 0 0 0 0 0 0 0 0 0 0 0 0
Retail - Secured on real estate property - Of Which: SME 0 0 0 0 0 0 0 0 0 0 0 0
Retail - Secured on real estate property - Of Which: non-
SME0 0 0 0 0 0 0 0 0 0 0 0
Retail - Qualifying Revolving 0 0 0 0 0 0 0 0 0 0 0 0
Retail - Other Retail 0 0 0 0 0 0 0 0 0 0 0 0
Retail - Other Retail - Of Which: SME 0 0 0 0 0 0 0 0 0 0 0 0
Retail - Other Retail - Of Which: non-SME 0 0 0 0 0 0 0 0 0 0 0 0
Equity 0 0 0 0 0 0 0 0 0 0 0 0
Securitisation
Other non credit-obligation assets
IRB Total(1) Original exposure, unlike Exposure value, is reported before taking into account any effect due to credit conversion factors or credit risk mitigation techniques (e.g. substitution effects).
10 (mln EUR, %)
Of which:
defaulted
Of which:
defaulted
Of which:
defaulted
Of which:
defaulted
Central banks and central governments 0 0 0 0 0 0 0 0 0 0 0 0
Institutions 0 0 0 0 0 0 0 0 0 0 0 0
Corporates 0 0 0 0 0 0 0 0 0 0 0 0
Corporates - Of Which: Specialised Lending 0 0 0 0 0 0 0 0 0 0 0 0
Corporates - Of Which: SME 0 0 0 0 0 0 0 0 0 0 0 0
Retail 0 0 0 0 0 0 0 0 0 0 0 0
Retail - Secured on real estate property 0 0 0 0 0 0 0 0 0 0 0 0
Retail - Secured on real estate property - Of Which: SME 0 0 0 0 0 0 0 0 0 0 0 0
Retail - Secured on real estate property - Of Which: non-
SME0 0 0 0 0 0 0 0 0 0 0 0
Retail - Qualifying Revolving 0 0 0 0 0 0 0 0 0 0 0 0
Retail - Other Retail 0 0 0 0 0 0 0 0 0 0 0 0
Retail - Other Retail - Of Which: SME 0 0 0 0 0 0 0 0 0 0 0 0
Retail - Other Retail - Of Which: non-SME 0 0 0 0 0 0 0 0 0 0 0 0
Equity 0 0 0 0 0 0 0 0 0 0 0 0
Securitisation
Other non credit-obligation assets
IRB Total(1) Original exposure, unlike Exposure value, is reported before taking into account any effect due to credit conversion factors or credit risk mitigation techniques (e.g. substitution effects).
IRB Approach
As of 31/12/2017 As of 30/06/2018
Risk exposure amount Value
adjustments
and
provisions
Country of Counterpart 8
IRB Approach
As of 31/12/2017 As of 30/06/2018
Original Exposure1
Exposure
Value1
Risk exposure amount Value
adjustments
and
provisions
Original Exposure1
Exposure
Value1
Risk exposure amount Value
adjustments
and
provisions
Country of Counterpart 9
IRB Approach
As of 31/12/2017 As of 30/06/2018
Original Exposure1
Exposure
Value1
Risk exposure amount Value
adjustments
and
provisions
Original Exposure1
Exposure
Value1
Risk exposure amount Value
adjustments
and
provisions
Country of Counterpart 10
Original Exposure1
Exposure
Value1
Risk exposure amount Value
adjustments
and
provisions
Original Exposure1
Exposure
Value1
201712 201712 201712 201712 201712 201712 201712 201712 201712 201712 201712 201712 201712 201712 201712 201712 201712 201712
2018 EU-wide Transparency Exercise
Sovereign Exposure
Nykredit Realkredit
(mln EUR)
of which:
loans and
advances
of which:
debt
securities
of which:
Loans and
advances
of which:
Debt
securities
of which:
Loans and
advances
of which:
Debt
securities
of which:
Loans and
advances
of which:
Debt
securities
of which:
Loans and
advances
of which:
Debt
securities
of which:
Loans and
advances
of which:
Debt
securities
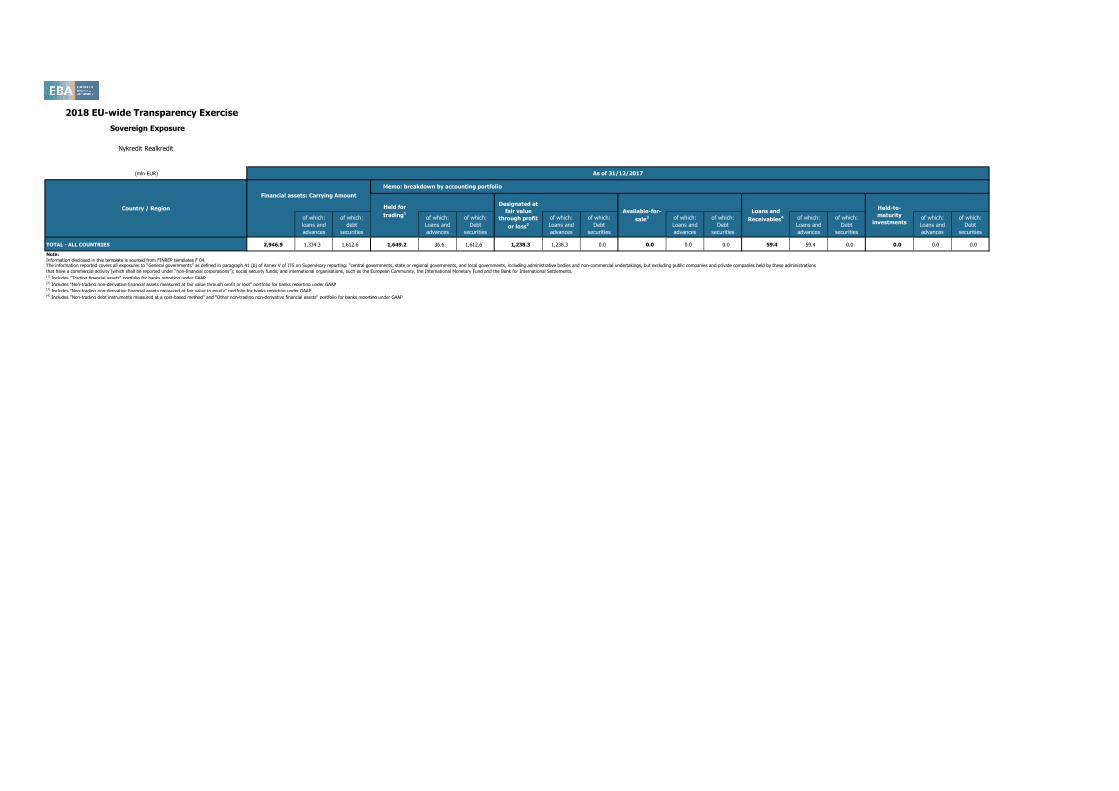
TOTAL - ALL COUNTRIES 2,946.9 1,334.3 1,612.6 1,649.2 36.6 1,612.6 1,238.3 1,238.3 0.0 0.0 0.0 0.0 59.4 59.4 0.0 0.0 0.0 0.0
Note:
Information disclosed in this template is sourced from FINREP templates F 04.The information reported covers all exposures to “General governments” as defined in paragraph 41 (b) of Annex V of ITS on Supervisory reporting: “central governments, state or regional governments, and local governments, including administrative bodies and non-commercial undertakings, but excluding public companies and private companies held by these administrations
that have a commercial activity (which shall be reported under “non-financial corporations”); social security funds; and international organisations, such as the European Community, the International Monetary Fund and the Bank for International Settlements.(1) Includes "Trading financial assets" portfolio for banks reporting under GAAP(2) Includes "Non-trading non-derivative financial assets measured at fair value through profit or loss" portfolio for banks reporting under GAAP(3) Includes "Non-trading non-derivative financial assets measured at fair value to equity" portfolio for banks reporting under GAAP(4) Includes "Non-trading debt instruments measured at a cost-based method" and "Other non-trading non-derivative financial assets" portfolio for banks reporting under GAAP
As of 31/12/2017
Country / Region
Financial assets: Carrying Amount
Memo: breakdown by accounting portfolio
Held for
trading1
Designated at
fair value
through profit
or loss2
Available-for-
sale3
Loans and
Receivables4
Held-to-
maturity
investments

201806 201806 201806 201806 201806 201806 201806 201806 201806 201806 201806 201806 201806
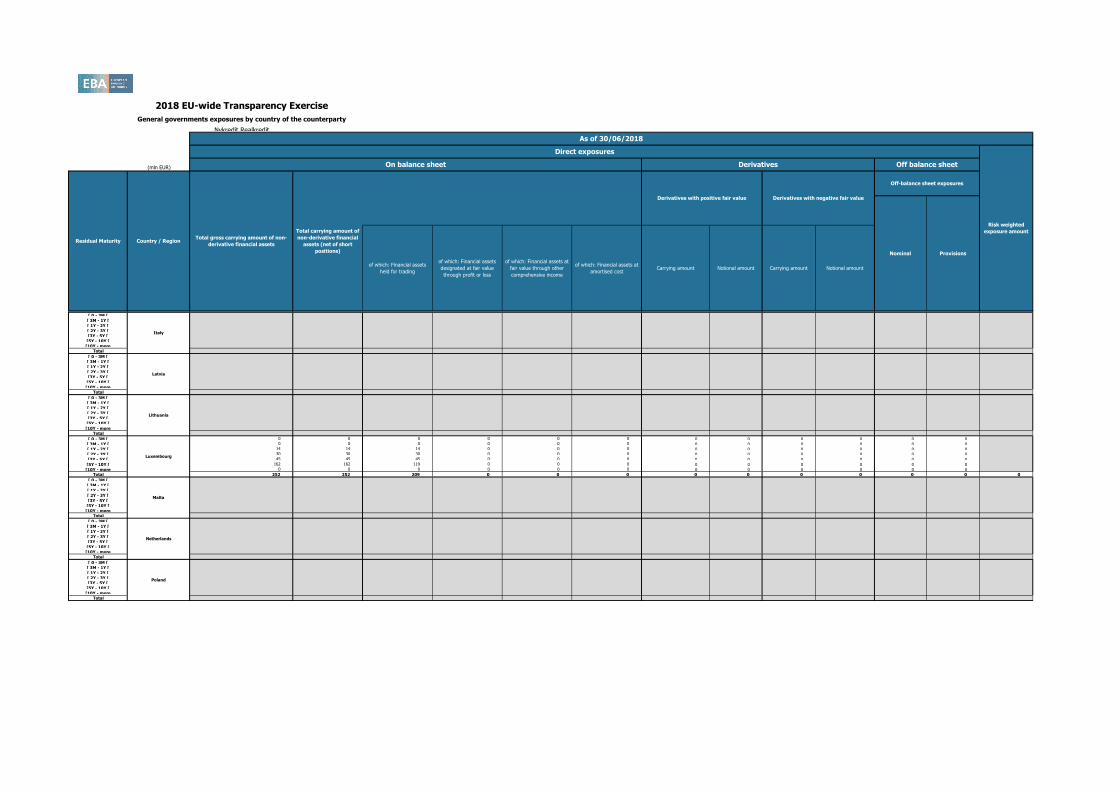
2018 EU-wide Transparency Exercise
General governments exposures by country of the counterparty
Nykredit Realkredit
(mln EUR)
[ 0 - 3M [ 0 0 0 0 0 0 0 0 0 0 0 0
[ 3M - 1Y [ 0 0 0 0 0 0 0 0 0 0 0 0
[ 1Y - 2Y [ 0 0 0 0 0 0 0 0 0 0 0 0
[ 2Y - 3Y [ 20 20 20 0 0 0 0 0 0 0 0 0
[3Y - 5Y [ 20 20 20 0 0 0 0 0 0 0 0 0
[5Y - 10Y [ 0 0 0 0 0 0 0 0 0 0 0 0
[10Y - more 0 0 0 0 0 0 0 0 0 0 0 0Total 41 41 41 0 0 0 0 0 0 0 0 0 4
[ 0 - 3M [ 0 0 0 0 0 0 0 0 0 0 0 0
[ 3M - 1Y [ 0 0 0 0 0 0 0 0 0 0 0 0
[ 1Y - 2Y [ 0 0 0 0 0 0 0 0 0 0 0 0
[ 2Y - 3Y [ 0 0 0 0 0 0 0 0 0 0 0 0
[3Y - 5Y [ 0 0 0 0 0 0 0 0 0 0 0 0
[5Y - 10Y [ 0 0 0 0 0 0 0 0 0 0 0 0
[10Y - more 0 0 0 0 0 0 0 0 0 0 0 0Total 0 0 0 0 0 0 0 0 0 0 0 0 0
[ 0 - 3M [ 0 0 0 0 0 0 0 0 0 0 0 0
[ 3M - 1Y [ 0 0 0 0 0 0 0 0 0 0 0 0
[ 1Y - 2Y [ 0 0 0 0 0 0 0 0 0 0 0 0
[ 2Y - 3Y [ 0 0 0 0 0 0 0 0 0 0 0 0
[3Y - 5Y [ 0 0 0 0 0 0 0 0 0 0 0 0
[5Y - 10Y [ 0 0 0 0 0 0 0 0 0 0 0 0
[10Y - more 0 0 0 0 0 0 0 0 0 0 0 0Total 0 0 0 0 0 0 0 0 0 0 0 0 0
[ 0 - 3M [ 0 0 0 0 0 0 0 0 0 0 0 0
[ 3M - 1Y [ 0 0 0 0 0 0 0 0 0 0 0 0
[ 1Y - 2Y [ 0 0 0 0 0 0 0 0 0 0 0 0
[ 2Y - 3Y [ 0 0 0 0 0 0 0 0 0 0 0 0
[3Y - 5Y [ 0 0 0 0 0 0 0 0 0 0 0 0
[5Y - 10Y [ 0 0 0 0 0 0 0 0 0 0 0 0
[10Y - more 0 0 0 0 0 0 0 0 0 0 0 0Total 0 0 0 0 0 0 0 0 0 0 0 0 0
[ 0 - 3M [ 0 0 0 0 0 0 0 0 0 0 0 0
[ 3M - 1Y [ 0 0 0 0 0 0 0 0 0 0 0 0
[ 1Y - 2Y [ 0 0 0 0 0 0 0 0 0 0 0 0
[ 2Y - 3Y [ 0 0 0 0 0 0 0 0 0 0 0 0
[3Y - 5Y [ 0 0 0 0 0 0 0 0 0 0 0 0
[5Y - 10Y [ 0 0 0 0 0 0 0 0 0 0 0 0
[10Y - more 0 0 0 0 0 0 0 0 0 0 0 0Total 0 0 0 0 0 0 0 0 0 0 0 0 0
[ 0 - 3M [ 2,778 2,778 154 0 0 0 0 0 0 87 0 0
[ 3M - 1Y [ 376 376 376 0 0 0 0 0 0 0 35 0
[ 1Y - 2Y [ 1 1 0 0 0 0 0 0 0 0 3 0
[ 2Y - 3Y [ 56 56 55 0 0 0 0 0 0 0 8 0
[3Y - 5Y [ 40 40 34 0 0 0 0 0 0 0 69 0
[5Y - 10Y [ 116 116 98 0 0 0 1 6 0 0 1,059 0
[10Y - more 31 31 0 0 0 0 0 6 0 0 3,758 0Total 3,398 3,398 717 0 0 0 1 12 0 87 4,933 0 0
[ 0 - 3M [ 0 0 0 0 0 0 0 0 0 0 0 0
[ 3M - 1Y [ 0 0 0 0 0 0 0 0 0 0 0 0
[ 1Y - 2Y [ 0 0 0 0 0 0 0 0 0 0 0 0
[ 2Y - 3Y [ 0 0 0 0 0 0 0 0 0 0 0 0
[3Y - 5Y [ 0 0 0 0 0 0 0 0 0 0 0 0
[5Y - 10Y [ 0 0 0 0 0 0 0 0 0 0 0 0
[10Y - more 0 0 0 0 0 0 0 0 0 0 0 0Total 0 0 0 0 0 0 0 0 0 0 0 0 0
As of 30/06/2018
Direct exposures
Risk weighted
exposure amount
On balance sheet Derivatives Off balance sheet
Off-balance sheet exposures
Nominal Provisions
Carrying amount
Derivatives with positive fair value Derivatives with negative fair value
of which: Financial assets
held for trading
of which: Financial assets
designated at fair value
through profit or loss
of which: Financial assets at
fair value through other
comprehensive income
of which: Financial assets at
amortised cost
Bulgaria
Residual Maturity Country / RegionTotal gross carrying amount of non-
derivative financial assets
Total carrying amount of
non-derivative financial
assets (net of short
positions)
Notional amount Carrying amount Notional amount
Austria
Belgium
Cyprus
Czech Republic
Denmark
Estonia

201806 201806 201806 201806 201806 201806 201806 201806 201806 201806 201806 201806 201806
2018 EU-wide Transparency Exercise
General governments exposures by country of the counterparty
Nykredit Realkredit
(mln EUR)
As of 30/06/2018
Direct exposures
Risk weighted
exposure amount
On balance sheet Derivatives Off balance sheet
Off-balance sheet exposures
Nominal Provisions
Carrying amount
Derivatives with positive fair value Derivatives with negative fair value
of which: Financial assets
held for trading
of which: Financial assets
designated at fair value
through profit or loss
of which: Financial assets at
fair value through other
comprehensive income
of which: Financial assets at
amortised cost
Residual Maturity Country / RegionTotal gross carrying amount of non-
derivative financial assets
Total carrying amount of
non-derivative financial
assets (net of short
positions)
Notional amount Carrying amount Notional amount
Austria
[ 0 - 3M [ 0 0 0 0 0 0 0 0 0 0 0 0
[ 3M - 1Y [ 0 0 0 0 0 0 0 0 0 0 0 0
[ 1Y - 2Y [ 0 0 0 0 0 0 0 0 0 0 0 0
[ 2Y - 3Y [ 0 0 0 0 0 0 0 0 0 0 0 0
[3Y - 5Y [ 0 0 0 0 0 0 0 0 0 0 0 0
[5Y - 10Y [ 0 0 0 0 0 0 0 0 0 0 0 0
[10Y - more 0 0 0 0 0 0 0 0 0 0 0 0Total 0 0 0 0 0 0 0 0 0 0 0 0 0
[ 0 - 3M [ 0 0 0 0 0 0 0 0 0 0 0 0
[ 3M - 1Y [ 0 0 0 0 0 0 0 0 0 0 0 0
[ 1Y - 2Y [ 0 0 0 0 0 0 0 0 0 0 0 0
[ 2Y - 3Y [ 0 0 0 0 0 0 0 0 0 0 0 0
[3Y - 5Y [ 0 0 0 0 0 0 0 0 0 0 0 0
[5Y - 10Y [ 0 0 0 0 0 0 0 0 0 0 0 0
[10Y - more 0 0 0 0 0 0 0 0 0 0 0 0Total 0 0 0 0 0 0 0 0 0 0 0 0 1
[ 0 - 3M [ 15 15 0 0 0 0 0 0 0 0 0 0
[ 3M - 1Y [ 38 30 30 0 0 0 0 0 0 0 0 0
[ 1Y - 2Y [ 328 328 177 0 0 0 0 0 0 0 0 0
[ 2Y - 3Y [ 57 22 22 0 0 0 0 0 0 0 0 0
[3Y - 5Y [ 97 97 97 0 0 0 0 0 0 0 0 0
[5Y - 10Y [ 304 304 211 0 0 0 0 0 0 0 0 0
[10Y - more 0 0 0 0 0 0 0 0 0 0 0 0Total 840 796 536 0 0 0 0 0 0 0 0 0 0
[ 0 - 3M [ 0 0 0 0 0 0 0 0 0 0 0 0
[ 3M - 1Y [ 0 0 0 0 0 0 0 0 0 0 0 0
[ 1Y - 2Y [ 0 0 0 0 0 0 0 0 0 0 0 0
[ 2Y - 3Y [ 0 0 0 0 0 0 0 0 0 0 0 0
[3Y - 5Y [ 0 0 0 0 0 0 0 0 0 0 0 0
[5Y - 10Y [ 0 0 0 0 0 0 0 0 0 0 0 0
[10Y - more 0 0 0 0 0 0 0 0 0 0 0 0Total 0 0 0 0 0 0 0 0 0 0 0 0 0
[ 0 - 3M [ 0 0 0 0 0 0 0 0 0 0 0 0
[ 3M - 1Y [ 0 0 0 0 0 0 0 0 0 0 0 0
[ 1Y - 2Y [ 0 0 0 0 0 0 0 0 0 0 0 0
[ 2Y - 3Y [ 0 0 0 0 0 0 0 0 0 0 0 0
[3Y - 5Y [ 0 0 0 0 0 0 0 0 0 0 0 0
[5Y - 10Y [ 0 0 0 0 0 0 0 0 0 0 0 0
[10Y - more 0 0 0 0 0 0 0 0 0 0 0 0Total 0 0 0 0 0 0 0 0 0 0 0 0 0
[ 0 - 3M [ 0 0 0 0 0 0 0 0 0 0 0 0
[ 3M - 1Y [ 0 0 0 0 0 0 0 0 0 0 0 0
[ 1Y - 2Y [ 0 0 0 0 0 0 0 0 0 0 0 0
[ 2Y - 3Y [ 0 0 0 0 0 0 0 0 0 0 0 0
[3Y - 5Y [ 0 0 0 0 0 0 0 0 0 0 0 0
[5Y - 10Y [ 0 0 0 0 0 0 0 0 0 0 0 0
[10Y - more 0 0 0 0 0 0 0 0 0 0 0 0Total 0 0 0 0 0 0 0 0 0 0 0 0 0
[ 0 - 3M [ 0 0 0 0 0 0 0 0 0 0 0 0
[ 3M - 1Y [ 0 0 0 0 0 0 0 0 0 0 0 0
[ 1Y - 2Y [ 0 0 0 0 0 0 0 0 0 0 0 0
[ 2Y - 3Y [ 0 0 0 0 0 0 0 0 0 0 0 0
[3Y - 5Y [ 0 0 0 0 0 0 0 0 0 0 0 0
[5Y - 10Y [ 0 0 0 0 0 0 0 0 0 0 0 0
[10Y - more 0 0 0 0 0 0 0 0 0 0 0 0Total 0 0 0 0 0 0 0 0 0 0 0 0 0
Finland
France
Germany
Croatia
Greece
Hungary
Ireland
201806 201806 201806 201806 201806 201806 201806 201806 201806 201806 201806 201806 201806
2018 EU-wide Transparency Exercise
General governments exposures by country of the counterparty
Nykredit Realkredit
(mln EUR)
As of 30/06/2018
Direct exposures
Risk weighted
exposure amount
On balance sheet Derivatives Off balance sheet
Off-balance sheet exposures
Nominal Provisions
Carrying amount
Derivatives with positive fair value Derivatives with negative fair value
of which: Financial assets
held for trading
of which: Financial assets
designated at fair value
through profit or loss
of which: Financial assets at
fair value through other
comprehensive income
of which: Financial assets at
amortised cost
Residual Maturity Country / RegionTotal gross carrying amount of non-
derivative financial assets
Total carrying amount of
non-derivative financial
assets (net of short
positions)
Notional amount Carrying amount Notional amount
Austria
[ 0 - 3M [ 0 0 0 0 0 0 0 0 0 0 0 0
[ 3M - 1Y [ 0 0 0 0 0 0 0 0 0 0 0 0
[ 1Y - 2Y [ 0 0 0 0 0 0 0 0 0 0 0 0
[ 2Y - 3Y [ 0 0 0 0 0 0 0 0 0 0 0 0
[3Y - 5Y [ 0 0 0 0 0 0 0 0 0 0 0 0
[5Y - 10Y [ 0 0 0 0 0 0 0 0 0 0 0 0
[10Y - more 0 0 0 0 0 0 0 0 0 0 0 0Total 0 0 0 0 0 0 0 0 0 0 0 0 0
[ 0 - 3M [ 0 0 0 0 0 0 0 0 0 0 0 0
[ 3M - 1Y [ 0 0 0 0 0 0 0 0 0 0 0 0
[ 1Y - 2Y [ 0 0 0 0 0 0 0 0 0 0 0 0
[ 2Y - 3Y [ 0 0 0 0 0 0 0 0 0 0 0 0
[3Y - 5Y [ 0 0 0 0 0 0 0 0 0 0 0 0
[5Y - 10Y [ 0 0 0 0 0 0 0 0 0 0 0 0
[10Y - more 0 0 0 0 0 0 0 0 0 0 0 0Total 0 0 0 0 0 0 0 0 0 0 0 0 0
[ 0 - 3M [ 0 0 0 0 0 0 0 0 0 0 0 0
[ 3M - 1Y [ 0 0 0 0 0 0 0 0 0 0 0 0
[ 1Y - 2Y [ 0 0 0 0 0 0 0 0 0 0 0 0
[ 2Y - 3Y [ 0 0 0 0 0 0 0 0 0 0 0 0
[3Y - 5Y [ 0 0 0 0 0 0 0 0 0 0 0 0
[5Y - 10Y [ 0 0 0 0 0 0 0 0 0 0 0 0
[10Y - more 0 0 0 0 0 0 0 0 0 0 0 0Total 0 0 0 0 0 0 0 0 0 0 0 0 0
[ 0 - 3M [ 0 0 0 0 0 0 0 0 0 0 0 0
[ 3M - 1Y [ 0 0 0 0 0 0 0 0 0 0 0 0
[ 1Y - 2Y [ 14 14 14 0 0 0 0 0 0 0 0 0
[ 2Y - 3Y [ 30 30 30 0 0 0 0 0 0 0 0 0
[3Y - 5Y [ 45 45 45 0 0 0 0 0 0 0 0 0
[5Y - 10Y [ 162 162 119 0 0 0 0 0 0 0 0 0
[10Y - more 0 0 0 0 0 0 0 0 0 0 0 0Total 252 252 209 0 0 0 0 0 0 0 0 0 0
[ 0 - 3M [ 0 0 0 0 0 0 0 0 0 0 0 0
[ 3M - 1Y [ 0 0 0 0 0 0 0 0 0 0 0 0
[ 1Y - 2Y [ 0 0 0 0 0 0 0 0 0 0 0 0
[ 2Y - 3Y [ 0 0 0 0 0 0 0 0 0 0 0 0
[3Y - 5Y [ 0 0 0 0 0 0 0 0 0 0 0 0
[5Y - 10Y [ 0 0 0 0 0 0 0 0 0 0 0 0
[10Y - more 0 0 0 0 0 0 0 0 0 0 0 0Total 0 0 0 0 0 0 0 0 0 0 0 0 0
[ 0 - 3M [ 0 0 0 0 0 0 0 0 0 0 0 0
[ 3M - 1Y [ 0 0 0 0 0 0 0 0 0 0 0 0
[ 1Y - 2Y [ 0 0 0 0 0 0 0 0 0 0 0 0
[ 2Y - 3Y [ 0 0 0 0 0 0 0 0 0 0 0 0
[3Y - 5Y [ 0 0 0 0 0 0 0 0 0 0 0 0
[5Y - 10Y [ 0 0 0 0 0 0 0 0 0 0 0 0
[10Y - more 0 0 0 0 0 0 0 0 0 0 0 0Total 0 0 0 0 0 0 0 0 0 0 0 0 0
[ 0 - 3M [ 0 0 0 0 0 0 0 0 0 0 0 0
[ 3M - 1Y [ 0 0 0 0 0 0 0 0 0 0 0 0
[ 1Y - 2Y [ 0 0 0 0 0 0 0 0 0 0 0 0
[ 2Y - 3Y [ 0 0 0 0 0 0 0 0 0 0 0 0
[3Y - 5Y [ 0 0 0 0 0 0 0 0 0 0 0 0
[5Y - 10Y [ 0 0 0 0 0 0 0 0 0 0 0 0
[10Y - more 0 0 0 0 0 0 0 0 0 0 0 0Total 0 0 0 0 0 0 0 0 0 0 0 0 0
Italy
Latvia
Lithuania
Luxembourg
Malta
Netherlands
Poland

201806 201806 201806 201806 201806 201806 201806 201806 201806 201806 201806 201806 201806
2018 EU-wide Transparency Exercise
General governments exposures by country of the counterparty
Nykredit Realkredit
(mln EUR)
As of 30/06/2018
Direct exposures
Risk weighted
exposure amount
On balance sheet Derivatives Off balance sheet
Off-balance sheet exposures
Nominal Provisions
Carrying amount
Derivatives with positive fair value Derivatives with negative fair value
of which: Financial assets
held for trading
of which: Financial assets
designated at fair value
through profit or loss
of which: Financial assets at
fair value through other
comprehensive income
of which: Financial assets at
amortised cost
Residual Maturity Country / RegionTotal gross carrying amount of non-
derivative financial assets
Total carrying amount of
non-derivative financial
assets (net of short
positions)
Notional amount Carrying amount Notional amount
Austria
[ 0 - 3M [ 0 0 0 0 0 0 0 0 0 0 0 0
[ 3M - 1Y [ 0 0 0 0 0 0 0 0 0 0 0 0
[ 1Y - 2Y [ 0 0 0 0 0 0 0 0 0 0 0 0
[ 2Y - 3Y [ 0 0 0 0 0 0 0 0 0 0 0 0
[3Y - 5Y [ 0 0 0 0 0 0 0 0 0 0 0 0
[5Y - 10Y [ 0 0 0 0 0 0 0 0 0 0 0 0
[10Y - more 0 0 0 0 0 0 0 0 0 0 0 0Total 0 0 0 0 0 0 0 0 0 0 0 0 0
[ 0 - 3M [ 0 0 0 0 0 0 0 0 0 0 0 0
[ 3M - 1Y [ 0 0 0 0 0 0 0 0 0 0 0 0
[ 1Y - 2Y [ 0 0 0 0 0 0 0 0 0 0 0 0
[ 2Y - 3Y [ 0 0 0 0 0 0 0 0 0 0 0 0
[3Y - 5Y [ 0 0 0 0 0 0 0 0 0 0 0 0
[5Y - 10Y [ 0 0 0 0 0 0 0 0 0 0 0 0
[10Y - more 0 0 0 0 0 0 0 0 0 0 0 0Total 0 0 0 0 0 0 0 0 0 0 0 0 0
[ 0 - 3M [ 0 0 0 0 0 0 0 0 0 0 0 0
[ 3M - 1Y [ 0 0 0 0 0 0 0 0 0 0 0 0
[ 1Y - 2Y [ 0 0 0 0 0 0 0 0 0 0 0 0
[ 2Y - 3Y [ 0 0 0 0 0 0 0 0 0 0 0 0
[3Y - 5Y [ 0 0 0 0 0 0 0 0 0 0 0 0
[5Y - 10Y [ 0 0 0 0 0 0 0 0 0 0 0 0
[10Y - more 0 0 0 0 0 0 0 0 0 0 0 0Total 0 0 0 0 0 0 0 0 0 0 0 0 0
[ 0 - 3M [ 0 0 0 0 0 0 0 0 0 0 0 0
[ 3M - 1Y [ 0 0 0 0 0 0 0 0 0 0 0 0
[ 1Y - 2Y [ 0 0 0 0 0 0 0 0 0 0 0 0
[ 2Y - 3Y [ 0 0 0 0 0 0 0 0 0 0 0 0
[3Y - 5Y [ 0 0 0 0 0 0 0 0 0 0 0 0
[5Y - 10Y [ 0 0 0 0 0 0 0 0 0 0 0 0
[10Y - more 0 0 0 0 0 0 0 0 0 0 0 0Total 0 0 0 0 0 0 0 0 0 0 0 0 0
[ 0 - 3M [ 0 0 0 0 0 0 0 0 0 0 0 0
[ 3M - 1Y [ 0 0 0 0 0 0 0 0 0 0 0 0
[ 1Y - 2Y [ 0 0 0 0 0 0 0 0 0 0 0 0
[ 2Y - 3Y [ 0 0 0 0 0 0 0 0 0 0 0 0
[3Y - 5Y [ 0 0 0 0 0 0 0 0 0 0 0 0
[5Y - 10Y [ 0 0 0 0 0 0 0 0 0 0 0 0
[10Y - more 0 0 0 0 0 0 0 0 0 0 0 0Total 0 0 0 0 0 0 0 0 0 0 0 0 0
[ 0 - 3M [ 365 365 0 0 0 365 0 0 0 0 0 0
[ 3M - 1Y [ 0 0 0 0 0 0 0 0 0 0 0 0
[ 1Y - 2Y [ 0 0 0 0 0 0 0 0 0 0 0 0
[ 2Y - 3Y [ 0 0 0 0 0 0 0 0 0 0 0 0
[3Y - 5Y [ 22 22 0 0 0 0 0 0 0 0 0 0
[5Y - 10Y [ 0 0 0 0 0 0 0 0 0 0 0 0
[10Y - more 0 0 0 0 0 0 0 0 0 0 48 0Total 387 387 0 0 0 365 0 0 0 0 48 0 0
[ 0 - 3M [ 142 142 0 0 0 0 21 4,081 -16 2,990 0 0
[ 3M - 1Y [ 0 0 0 0 0 0 79 7,367 -92 7,936 0 0
[ 1Y - 2Y [ 0 0 0 0 0 0 64 4,035 -110 3,808 0 0
[ 2Y - 3Y [ 0 0 0 0 0 0 68 2,263 -130 3,783 0 0
[3Y - 5Y [ 0 0 0 0 0 0 181 3,817 -332 6,449 0 0
[5Y - 10Y [ 0 0 0 0 0 0 308 6,269 -759 9,374 0 0
[10Y - more 0 0 0 0 0 0 587 2,710 -1,474 5,292 0 0Total 142 142 0 0 0 0 1,307 30,542 -2,913 39,633 0 0 7
Sweden
Portugal
Romania
Slovakia
Slovenia
Spain
United Kingdom

201806 201806 201806 201806 201806 201806 201806 201806 201806 201806 201806 201806 201806
2018 EU-wide Transparency Exercise
General governments exposures by country of the counterparty
Nykredit Realkredit
(mln EUR)
As of 30/06/2018
Direct exposures
Risk weighted
exposure amount
On balance sheet Derivatives Off balance sheet
Off-balance sheet exposures
Nominal Provisions
Carrying amount
Derivatives with positive fair value Derivatives with negative fair value
of which: Financial assets
held for trading
of which: Financial assets
designated at fair value
through profit or loss
of which: Financial assets at
fair value through other
comprehensive income
of which: Financial assets at
amortised cost
Residual Maturity Country / RegionTotal gross carrying amount of non-
derivative financial assets
Total carrying amount of
non-derivative financial
assets (net of short
positions)
Notional amount Carrying amount Notional amount
Austria
[ 0 - 3M [ 0 0 0 0 0 0 0 0 0 0 0 0
[ 3M - 1Y [ 0 0 0 0 0 0 0 0 0 0 0 0
[ 1Y - 2Y [ 0 0 0 0 0 0 0 0 0 0 0 0
[ 2Y - 3Y [ 0 0 0 0 0 0 0 0 0 0 0 0
[3Y - 5Y [ 0 0 0 0 0 0 0 0 0 0 0 0
[5Y - 10Y [ 0 0 0 0 0 0 0 0 0 0 0 0
[10Y - more 0 0 0 0 0 0 0 0 0 0 0 0Total 0 0 0 0 0 0 0 0 0 0 0 0 0
[ 0 - 3M [ 0 0 0 0 0 0 0 0 0 0 0 0
[ 3M - 1Y [ 0 0 0 0 0 0 0 0 0 0 0 0
[ 1Y - 2Y [ 0 0 0 0 0 0 0 0 0 0 0 0
[ 2Y - 3Y [ 0 0 0 0 0 0 0 0 0 0 0 0
[3Y - 5Y [ 0 0 0 0 0 0 0 0 0 0 0 0
[5Y - 10Y [ 0 0 0 0 0 0 0 0 0 0 0 0
[10Y - more 0 0 0 0 0 0 0 0 0 0 0 0Total 0 0 0 0 0 0 0 0 0 0 0 0 0
[ 0 - 3M [ 0 0 0 0 0 0 0 0 0 0 0 0
[ 3M - 1Y [ 0 0 0 0 0 0 0 0 0 0 0 0
[ 1Y - 2Y [ 0 0 0 0 0 0 0 0 0 0 0 0
[ 2Y - 3Y [ 0 0 0 0 0 0 0 0 0 0 0 0
[3Y - 5Y [ 0 0 0 0 0 0 0 0 0 0 0 0
[5Y - 10Y [ 0 0 0 0 0 0 0 0 0 0 0 0
[10Y - more 0 0 0 0 0 0 0 0 0 0 0 0Total 0 0 0 0 0 0 0 0 0 0 0 0 0
[ 0 - 3M [ 0 0 0 0 0 0 0 0 0 0 0 0
[ 3M - 1Y [ 0 0 0 0 0 0 0 0 0 0 0 0
[ 1Y - 2Y [ 0 0 0 0 0 0 0 0 0 0 0 0
[ 2Y - 3Y [ 0 0 0 0 0 0 0 0 0 0 0 0
[3Y - 5Y [ 0 0 0 0 0 0 0 0 0 0 0 0
[5Y - 10Y [ 0 0 0 0 0 0 0 0 0 0 0 0
[10Y - more 0 0 0 0 0 0 0 0 0 0 0 0Total 0 0 0 0 0 0 0 0 0 0 0 0 0
[ 0 - 3M [ 0 0 0 0 0 0 0 0 0 0 0 0
[ 3M - 1Y [ 0 0 0 0 0 0 0 0 0 0 0 0
[ 1Y - 2Y [ 0 0 0 0 0 0 0 0 0 0 0 0
[ 2Y - 3Y [ 0 0 0 0 0 0 0 0 0 0 0 0
[3Y - 5Y [ 0 0 0 0 0 0 0 0 0 0 0 0
[5Y - 10Y [ 0 0 0 0 0 0 0 0 0 0 0 0
[10Y - more 0 0 0 0 0 0 0 0 0 0 0 0Total 0 0 0 0 0 0 0 0 0 0 0 0 0
[ 0 - 3M [ 0 0 0 0 0 0 0 0 0 0 0 0
[ 3M - 1Y [ 0 0 0 0 0 0 0 0 0 0 0 0
[ 1Y - 2Y [ 0 0 0 0 0 0 0 0 0 0 0 0
[ 2Y - 3Y [ 0 0 0 0 0 0 0 0 0 0 0 0
[3Y - 5Y [ 0 0 0 0 0 0 0 0 0 0 0 0
[5Y - 10Y [ 0 0 0 0 0 0 0 0 0 0 0 0
[10Y - more 0 0 0 0 0 0 0 0 0 0 0 0Total 0 0 0 0 0 0 0 0 0 0 0 0 0
[ 0 - 3M [ 0 0 0 0 0 0 0 0 0 0 0 0
[ 3M - 1Y [ 0 0 0 0 0 0 0 0 0 0 0 0
[ 1Y - 2Y [ 0 0 0 0 0 0 0 0 0 0 0 0
[ 2Y - 3Y [ 0 0 0 0 0 0 0 0 0 0 0 0
[3Y - 5Y [ 0 0 0 0 0 0 0 0 0 0 0 0
[5Y - 10Y [ 0 0 0 0 0 0 0 0 0 0 0 0
[10Y - more 0 0 0 0 0 0 0 0 0 0 0 0Total 0 0 0 0 0 0 0 0 0 0 0 0 0
Iceland
Liechtenstein
Norway
Australia
Canada
Hong Kong
Japan
201806 201806 201806 201806 201806 201806 201806 201806 201806 201806 201806 201806 201806
2018 EU-wide Transparency Exercise
General governments exposures by country of the counterparty
Nykredit Realkredit
(mln EUR)
As of 30/06/2018
Direct exposures
Risk weighted
exposure amount
On balance sheet Derivatives Off balance sheet
Off-balance sheet exposures
Nominal Provisions
Carrying amount
Derivatives with positive fair value Derivatives with negative fair value
of which: Financial assets
held for trading
of which: Financial assets
designated at fair value
through profit or loss
of which: Financial assets at
fair value through other
comprehensive income
of which: Financial assets at
amortised cost
Residual Maturity Country / RegionTotal gross carrying amount of non-
derivative financial assets
Total carrying amount of
non-derivative financial
assets (net of short
positions)
Notional amount Carrying amount Notional amount
Austria
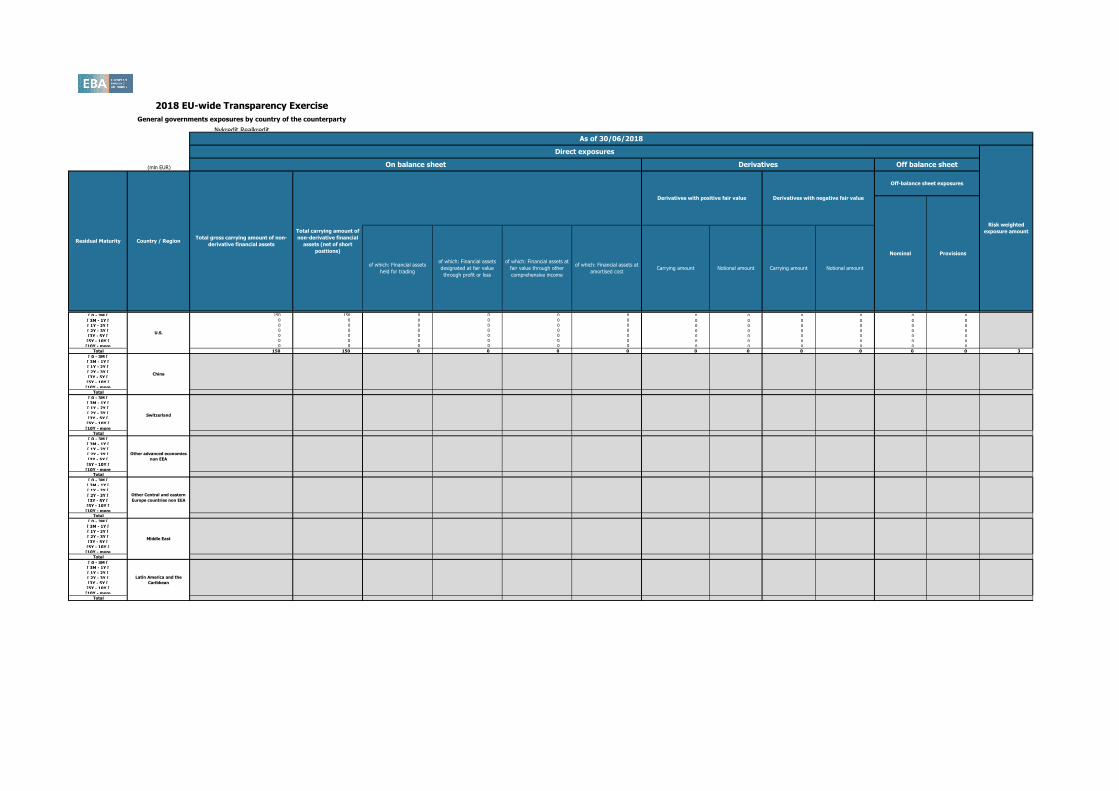
[ 0 - 3M [ 150 150 0 0 0 0 0 0 0 0 0 0
[ 3M - 1Y [ 0 0 0 0 0 0 0 0 0 0 0 0
[ 1Y - 2Y [ 0 0 0 0 0 0 0 0 0 0 0 0
[ 2Y - 3Y [ 0 0 0 0 0 0 0 0 0 0 0 0
[3Y - 5Y [ 0 0 0 0 0 0 0 0 0 0 0 0
[5Y - 10Y [ 0 0 0 0 0 0 0 0 0 0 0 0
[10Y - more 0 0 0 0 0 0 0 0 0 0 0 0Total 150 150 0 0 0 0 0 0 0 0 0 0 3
[ 0 - 3M [ 0 0 0 0 0 0 0 0 0 0 0 0
[ 3M - 1Y [ 0 0 0 0 0 0 0 0 0 0 0 0
[ 1Y - 2Y [ 0 0 0 0 0 0 0 0 0 0 0 0
[ 2Y - 3Y [ 0 0 0 0 0 0 0 0 0 0 0 0
[3Y - 5Y [ 0 0 0 0 0 0 0 0 0 0 0 0
[5Y - 10Y [ 0 0 0 0 0 0 0 0 0 0 0 0
[10Y - more 0 0 0 0 0 0 0 0 0 0 0 0Total 0 0 0 0 0 0 0 0 0 0 0 0 0
[ 0 - 3M [ 0 0 0 0 0 0 0 0 0 0 0 0
[ 3M - 1Y [ 0 0 0 0 0 0 0 0 0 0 0 0
[ 1Y - 2Y [ 0 0 0 0 0 0 0 0 0 0 0 0
[ 2Y - 3Y [ 0 0 0 0 0 0 0 0 0 0 0 0
[3Y - 5Y [ 0 0 0 0 0 0 0 0 0 0 0 0
[5Y - 10Y [ 0 0 0 0 0 0 0 0 0 0 0 0
[10Y - more 0 0 0 0 0 0 0 0 0 0 0 0Total 0 0 0 0 0 0 0 0 0 0 0 0 0
[ 0 - 3M [ 0 0 0 0 0 0 0 0 0 0 0 0
[ 3M - 1Y [ 0 0 0 0 0 0 0 0 0 0 0 0
[ 1Y - 2Y [ 0 0 0 0 0 0 0 0 0 0 0 0
[ 2Y - 3Y [ 0 0 0 0 0 0 0 0 0 0 0 0
[3Y - 5Y [ 0 0 0 0 0 0 0 0 0 0 0 0
[5Y - 10Y [ 0 0 0 0 0 0 0 0 0 0 0 0
[10Y - more 0 0 0 0 0 0 0 0 0 0 0 0Total 0 0 0 0 0 0 0 0 0 0 0 0 0
[ 0 - 3M [ 0 0 0 0 0 0 0 0 0 0 0 0
[ 3M - 1Y [ 0 0 0 0 0 0 0 0 0 0 0 0
[ 1Y - 2Y [ 0 0 0 0 0 0 0 0 0 0 0 0
[ 2Y - 3Y [ 0 0 0 0 0 0 0 0 0 0 0 0
[3Y - 5Y [ 0 0 0 0 0 0 0 0 0 0 0 0
[5Y - 10Y [ 0 0 0 0 0 0 0 0 0 0 0 0
[10Y - more 0 0 0 0 0 0 0 0 0 0 0 0Total 0 0 0 0 0 0 0 0 0 0 0 0 0
[ 0 - 3M [ 0 0 0 0 0 0 0 0 0 0 0 0
[ 3M - 1Y [ 0 0 0 0 0 0 0 0 0 0 0 0
[ 1Y - 2Y [ 0 0 0 0 0 0 0 0 0 0 0 0
[ 2Y - 3Y [ 0 0 0 0 0 0 0 0 0 0 0 0
[3Y - 5Y [ 0 0 0 0 0 0 0 0 0 0 0 0
[5Y - 10Y [ 0 0 0 0 0 0 0 0 0 0 0 0
[10Y - more 0 0 0 0 0 0 0 0 0 0 0 0Total 0 0 0 0 0 0 0 0 0 0 0 0 0
[ 0 - 3M [ 0 0 0 0 0 0 0 0 0 0 0 0
[ 3M - 1Y [ 0 0 0 0 0 0 0 0 0 0 0 0
[ 1Y - 2Y [ 0 0 0 0 0 0 0 0 0 0 0 0
[ 2Y - 3Y [ 0 0 0 0 0 0 0 0 0 0 0 0
[3Y - 5Y [ 0 0 0 0 0 0 0 0 0 0 0 0
[5Y - 10Y [ 0 0 0 0 0 0 0 0 0 0 0 0
[10Y - more 0 0 0 0 0 0 0 0 0 0 0 0Total 0 0 0 0 0 0 0 0 0 0 0 0 0
Other advanced economies
non EEA
U.S.
China
Switzerland
Other Central and eastern
Europe countries non EEA
Middle East
Latin America and the
Caribbean

201806 201806 201806 201806 201806 201806 201806 201806 201806 201806 201806 201806 201806
2018 EU-wide Transparency Exercise
General governments exposures by country of the counterparty
Nykredit Realkredit
(mln EUR)
As of 30/06/2018
Direct exposures
Risk weighted
exposure amount
On balance sheet Derivatives Off balance sheet
Off-balance sheet exposures
Nominal Provisions
Carrying amount
Derivatives with positive fair value Derivatives with negative fair value
of which: Financial assets
held for trading
of which: Financial assets
designated at fair value
through profit or loss
of which: Financial assets at
fair value through other
comprehensive income
of which: Financial assets at
amortised cost
Residual Maturity Country / RegionTotal gross carrying amount of non-
derivative financial assets
Total carrying amount of
non-derivative financial
assets (net of short
positions)
Notional amount Carrying amount Notional amount
Austria
[ 0 - 3M [ 0 0 0 0 0 0 0 0 0 0 0 0
[ 3M - 1Y [ 0 0 0 0 0 0 0 0 0 0 0 0
[ 1Y - 2Y [ 0 0 0 0 0 0 0 0 0 0 0 0
[ 2Y - 3Y [ 0 0 0 0 0 0 0 0 0 0 0 0
[3Y - 5Y [ 0 0 0 0 0 0 0 0 0 0 0 0
[5Y - 10Y [ 0 0 0 0 0 0 0 0 0 0 0 0
[10Y - more 0 0 0 0 0 0 0 0 0 0 0 0Total 0 0 0 0 0 0 0 0 0 0 0 0 0
[ 0 - 3M [ 0 0 0 0 0 0 0 0 0 0 0 0
[ 3M - 1Y [ 0 0 0 0 0 0 0 0 0 0 0 0
[ 1Y - 2Y [ 0 0 0 0 0 0 0 0 0 0 0 0
[ 2Y - 3Y [ 0 0 0 0 0 0 0 0 0 0 0 0
[3Y - 5Y [ 0 0 0 0 0 0 0 0 0 0 0 0
[5Y - 10Y [ 0 0 0 0 0 0 0 0 0 0 0 0
[10Y - more 0 0 0 0 0 0 0 0 0 0 0 0
Total 0 0 0 0 0 0 0 0 0 0 0 0 0
Notes and definitions
(2) The exposures reported cover only exposures to central, regional and local governments on immediate borrower basis, and do not include exposures to other counterparts with full or partial government guarantees
(3) The banks disclose the exposures in the "Financial assets held for trading" portfolio after offsetting the cash short positions having the same maturities.
(4) The exposures reported include the positions towards counterparts (other than sovereign) on sovereign credit risk (i.e. CDS, financial guarantees) booked in all the accounting portfolio (on-off balance sheet). Irrespective of the denomination and or accounting classification of the positions the economic substance over the form must be used as a criteria for the identification of the exposures to be included in this column. This item does not include exposures to counterparts (other than sovereign) with full or partial government guarantees by central, regional and local governments
Regions:
Other advanced non EEA: Israel, Korea, New Zealand, Russia, San Marino, Singapore and Taiwan.
Other CEE non EEA: Albania, Bosnia and Herzegovina, FYR Macedonia, Montenegro, Serbia and Turkey.
Middle East: Bahrain, Djibouti, Iran, Iraq, Jordan, Kuwait, Lebanon, Libya, Oman, Qatar, Saudi Arabia, Sudan, Syria, United Arab Emirates and Yemen.
(1) Information on sovereign exposures is only available for institutions that have sovereign exposures of at least 1% of total “Debt securities and loans receivables”. Country of breakdown is only available for institutions that hold non-domestic sovereign exposures of 10% or more compared to total
sovereign exposures. Where the latter threshold is not met, information is disclosed through the aggregate "Others".
(5) Residual countries not reported separately in the Transparency exercise
Latin America: Argentina, Belize, Bolivia, Brazil, Chile, Colombia, Costa Rica, Dominica, Dominican Republic, Ecuador, El Salvador, Grenada, Guatemala, Guyana, Haiti, Honduras, Jamaica, Mexico, Nicaragua, Panama, Paraguay, Peru, St. Kitts and Nevis, St. Lucia, St. Vincent and the Grenadines, Suriname, Trinidad and Tobago, Uruguay, Venezuela,Antigua And Barbuda, Aruba, Bahamas, Barbados, Cayman Islands, Cuba, French Guiana, Guadeloupe, Martinique, Puerto
Rico, Saint Barthélemy, Turks And Caicos Islands, Virgin Islands (British), Virgin Islands (U.S. ).
Africa: Algeria, Egypt, Morocco, South Africa, Angola, Benin, Botswana, Burkina Faso, Burundi, Cameroon, Cape Verde, Central African Republic, Chad, Comoros, Congo, Congo, The Democratic Republic Of The, Côte D'Ivoire, Equatorial Guinea, Eritrea, Ethiopia, Gabon, Gambia, Ghana, Guinea, Guinea-Bissau, Kenya, Lesotho, Liberia, Madagascar, Malawi, Mali, Mauritius, Mauritania, Mozambique, Namibia, Niger, Nigeria, Rwanda, Sao Tome And Principe, Senegal,
Seychelles, Sierra Leone, South Sudan, Swaziland, Tanzania, United Republic Of, Togo, Uganda, Zambia, Zimbabwe and Tunisia.
Africa
Others(5)
Information disclosed in this template is sourced from COREP template C 33, introduced with the reporting framework 2.7, applicable for reports as of 31 march 2018.

201712 201712 201712 201712 201712 201712 201712 201806 201806 201806 201806 201806 201806 201806
(mln EUR, %)
Of which:
defaulted
Of which:
defaulted
Debt securities (including at amortised cost and fair value) 0 0 0 0 0 0 0 12,179 0 0 0 0 0 0
Central banks 0 0 0 0 0 0 0 0 0 0 0 0 0 0
General governments 0 0 0 0 0 0 0 1,669 0 0 0 0 0 0
Credit institutions 0 0 0 0 0 0 0 9,968 0 0 0 0 0 0
Other financial corporations 0 0 0 0 0 0 0 386 0 0 0 0 0 0
Non-financial corporations 0 0 0 0 0 0 0 155 0 0 0 0 0 0
Loans and advances(including at amortised cost and fair value) 165,993 113 3,837 3,658 367 688 2,863 175,374 104 3,591 3,577 106 964 2,253
Central banks 710 0 0 0 0 0 0 691 0 0 0 0 0 0
General governments 1,298 0 1 0 0 0 0 1,293 0 0 0 0 0 0
Credit institutions 198 0 17 0 0 9 0 3,237 0 5 5 3 5 0
Other financial corporations 2,160 0 19 0 1 16 0 6,436 0 24 10 20 10 0
Non-financial corporations 45,801 82 2,418 2,418 96 247 1,946 46,340 47 2,511 2,511 24 340 1,870
of which: small and medium-sized enterprises at amortised cost 2,722 12 230 230 32 106 3 2,725 4 199 199 16 81 0
Households 115,825 31 1,383 1,240 270 415 917 117,376 57 1,051 1,051 60 608 383
DEBT INSTRUMENTS other than HFT 165,993 113 3,837 3,658 367 688 2,863 187,552 104 3,591 3,577 106 964 2,253
OFF-BALANCE SHEET EXPOSURES 4,268 43 43 0 4 1 4,002 21 20 14 0 1
(1) For the definition of non-performing exposures please refer to COMMISSION IMPLEMENTING REGULATION (EU) 2015/227 of 9 January 2015, ANNEX V, Part 2-Template related instructions, subtitle 29(2) Insitutions report here collective allowances for incurrred but not reported losses (instruments at amortised cost) and changes in fair value of performing exposures due to credit risk and provisions (instruments at fair value other than HFT)(3) Insitutions report here specific allowances for financial assets, individually and collectively estimated (instruments at amortised cost) and changes in fair value of NPE due to credit risk and provisions (instruments at fair value other than HFT)
Accumulated impairment,
accumulated changes in fair
value due to credit risk and
provisions4
2018 EU-wide Transparency ExercisePerforming and non-performing exposures
Nykredit Realkredit
As of 31/12/2017 As of 30/06/2018
On non-
performing
exposures3
(4) For the on-balance sheet items, accumulated impairments and accumulated negative changes in fair value due to credit risk are disclosed with a positive sign if they are decreasing assets. Following this sign convention, information is disclosed with the opposite sign of what is reported according to the FINREP framework (templates F 18.00 / F 19.00), which follows a sign convention
based on a credit/debit convention, as explained in Annex V, Part 1 paragraphs 9 and 10 of Regulation (EU) No 680/2014 - ITS on Supervisory reporting. However, for the off-balance sheet instruments, the same item (‘Accumulated impairment, accumulated changes in fair value due to credit risk and provisions’) is disclosed consistently with the FINREP sign convention. This is because,
based on this sign convention, the provisions on off-balance sheet commitments are generally reported with a positive sign.
Collaterals and
financial
guarantees
received on non-
performing
exposures
Of which
performing but
past due >30
days and <=90
days
Of which non-performing1
On performing
exposures2
On non-
performing
exposures3
Of which
performing but
past due >30
days and <=90
days
Of which non-performing1
On performing
exposures2
Gross carrying amount
Accumulated impairment,
accumulated changes in fair
value due to credit risk and
provisions4
Collaterals and
financial
guarantees
received on non-
performing
exposures
Gross carrying amount
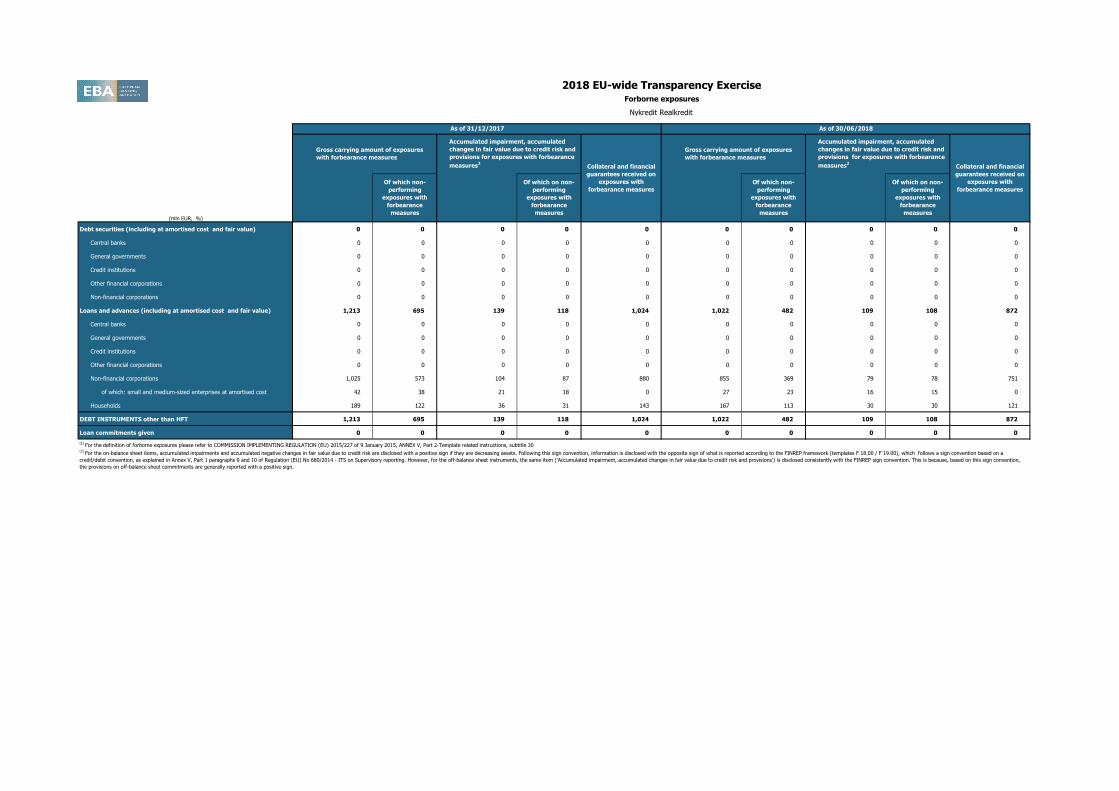
201712 201712 201712 201712 201712 201806 201806 201806 201806 201806
(mln EUR, %)
Debt securities (including at amortised cost and fair value) 0 0 0 0 0 0 0 0 0 0
Central banks 0 0 0 0 0 0 0 0 0 0
General governments 0 0 0 0 0 0 0 0 0 0
Credit institutions 0 0 0 0 0 0 0 0 0 0
Other financial corporations 0 0 0 0 0 0 0 0 0 0
Non-financial corporations 0 0 0 0 0 0 0 0 0 0
Loans and advances (including at amortised cost and fair value) 1,213 695 139 118 1,024 1,022 482 109 108 872
Central banks 0 0 0 0 0 0 0 0 0 0
General governments 0 0 0 0 0 0 0 0 0 0
Credit institutions 0 0 0 0 0 0 0 0 0 0
Other financial corporations 0 0 0 0 0 0 0 0 0 0
Non-financial corporations 1,025 573 104 87 880 855 369 79 78 751
of which: small and medium-sized enterprises at amortised cost 42 38 21 18 0 27 23 16 15 0
Households 189 122 36 31 143 167 113 30 30 121
DEBT INSTRUMENTS other than HFT 1,213 695 139 118 1,024 1,022 482 109 108 872
Loan commitments given 0 0 0 0 0 0 0 0 0 0
(1) For the definition of forborne exposures please refer to COMMISSION IMPLEMENTING REGULATION (EU) 2015/227 of 9 January 2015, ANNEX V, Part 2-Template related instructions, subtitle 30
2018 EU-wide Transparency ExerciseForborne exposures
Nykredit Realkredit
As of 31/12/2017 As of 30/06/2018
(2) For the on-balance sheet items, accumulated impairments and accumulated negative changes in fair value due to credit risk are disclosed with a positive sign if they are decreasing assets. Following this sign convention, information is disclosed with the opposite sign of what is reported according to the FINREP framework (templates F 18.00 / F 19.00), which follows a sign convention based on a
credit/debit convention, as explained in Annex V, Part 1 paragraphs 9 and 10 of Regulation (EU) No 680/2014 - ITS on Supervisory reporting. However, for the off-balance sheet instruments, the same item (‘Accumulated impairment, accumulated changes in fair value due to credit risk and provisions’) is disclosed consistently with the FINREP sign convention. This is because, based on this sign convention,
the provisions on off-balance sheet commitments are generally reported with a positive sign.
Collateral and financial
guarantees received on
exposures with
forbearance measures
Of which non-
performing
exposures with
forbearance
measures
Of which on non-
performing
exposures with
forbearance
measures
Of which non-
performing
exposures with
forbearance
measures
Of which on non-
performing
exposures with
forbearance
measures
Gross carrying amount of exposures
with forbearance measures
Accumulated impairment, accumulated
changes in fair value due to credit risk and
provisions for exposures with forbearance
measures2
Collateral and financial
guarantees received on
exposures with
forbearance measures
Gross carrying amount of exposures
with forbearance measures
Accumulated impairment, accumulated
changes in fair value due to credit risk and
provisions for exposures with forbearance
measures2