2018 data summary - idph.iowa.gov
TRANSCRIPT

1
2018 Data Summary
July 2019
Prepared by
Mary E. Losch, Ph.D.
Rodney J. Muilenburg, B.L.S.
Alyssa R. McCoy, B.A.
Center for Social and Behavioral Research
University of Northern Iowa

2
OVERVIEW
The findings in this summary are based on the Iowa Barriers to Prenatal Care project.
Ongoing since 1991, the purpose of this project is to obtain brief, accurate information about
women delivering babies in Iowa hospitals. Specifically, the project seeks to learn about
women’s experiences getting prenatal or delivery care during their current pregnancy. Other
information is included which may be pertinent to health planners or those concerned with the
systematic development of health care services.
This project is a cooperative venture of all of Iowa’s maternity hospitals, the University
of Northern Iowa Center for Social and Behavioral Research, and the Iowa Department of Public
Health. The Robert Wood Johnson Foundation funded the first three years of this project. The
current funding is provided by the Iowa Department of Public Health. The Director is Dr. Mary
Losch, University of Northern Iowa Center for Social and Behavioral Research. The
Coordinator for the project is Rodney Muilenburg.
The questionnaire is distributed to nearly seventy maternity hospitals across the state of
Iowa. Nursing staff or those responsible for obtaining birth certificate information in the
obstetrics unit are responsible for approaching all birth mothers prior to dismissal to request their
participation in the study. The questionnaire takes approximately ten minutes to complete.
Completed questionnaires are returned to the University of Northern Iowa Center for Social and
Behavioral Research for data entry and analysis. Returns are made monthly, weekly, or
biweekly depending on the number of births per week in a given hospital. Except in the case of a
mother who is too ill to complete the questionnaire, all mothers are eligible to be recruited for
participation.
The present yearly report includes an analysis of large Iowa cities, a trend analysis of the
last ten years, and a frequency analysis of all variables included in the 2018 questionnaire.
Unless otherwise noted, all entries reflect percentages. Please note that, because percentages
were rounded, total values may not equal 100%. Data presented are based upon 2018
questionnaires received to date (n = 20,035). All analyses reflect unweighted percentages of
those responding.

3
Questions concerning this project or additional data requests may be addressed to:
Mary Losch, Ph.D.
Director, Center for Social & Behavioral Research
University of Northern Iowa
Cedar Falls, IA 50614-0402
Phone: (319) 273-2105
Fax: (319) 273-3104
Rodney Muilenburg, B.L.S.
Field Supervisor, Center for Social & Behavioral Research
University of Northern Iowa
Cedar Falls, IA 50614-0402
Phone: (319) 273-2105
Fax: (319) 273-3104
Recommended Citation:
Losch, M. E., Muilenburg, R. J., & McCoy, A. R. (2019). Iowa Barriers to Prenatal Care
Project. Iowa Department of Public Health, University of Northern Iowa Center for Social and
Behavioral Research: 2018 Data Summary.

4
TABLE OF CONTENTS
A. Analysis of Selected Variables by City ...................................................................................5
B. Analysis of Selected Variables by Black, Hispanic, and Low Income Mothers ....................15
C. Trend Analysis of Barriers Data: 2009-2018 ........................................................................39
D. 2018 Questionnaire Frequency Tables ..................................................................................44

5
A. Analysis of Selected Variables by City
The present section compares the findings across the following cities for all 2018 data received
(n =11,980). Location of hospital where mothers gave birth is the basis for analysis.
DM = Des Moines (n = 6,328)
QC = Quad Cities (n = 672)
SC = Sioux City (n = 360)
WL = Waterloo (n = 1,420)
CR = Cedar Rapids (n = 1,621)
DB = Dubuque (n = 682)
IC = Iowa City (n = 897)
*All data provided in the following tables reflect percentages unless otherwise noted.
Mother/Family Characteristics
Overall, the age of the mothers in the cities closely matched the state data. The Quad Cities and
Sioux City had a higher percentage of mothers aged 18 to 19 (4%) than the other cities. Iowa
City (15%) had the highest percentage of mothers over 35 (see Table A1).
Table A1. Mother’s Age
STATE DM QC SC WL CR DB IC
< 18 years 01 01 01 02 01 01 01 <1
18 - 19 years 03 02 04 04 02 03 02 02
20 - 25 years 24 21 22 23 25 20 15 16
26 - 30 years 37 36 39 41 38 37 40 36
31 - 35 years 26 29 25 23 25 28 33 31
> 35 years 09 11 09 07 08 11 09 15

6
Sioux City had the largest percentage of Hispanic mothers (23%) and Native American mothers
(7%). Waterloo (9%) and the Quad Cities (9%) had the highest percentages of Black mothers
(see Table A2).
Table A2. Race/Ethnicity
STATE DM QC SC WL CR DB IC
Hispanic 08 09 13 23 05 03 05 07
Non-Hispanic 92 91 87 77 95 97 95 93
White 90 88 88 84 88 89 94 89
Black 06 07 09 06 09 08 03 07
Asian/Pacific Islander 03 05 03 02 03 03 03 03
Native American 01 01 01 07 <1 01 <1 01
As shown in Table A3, the largest proportion of mothers born outside of the US was found in
Sioux City (15%) while Waterloo (73%) had the highest percentage of mothers who were born in
Iowa.
Table A3. Mother’s Place of Birth
STATE DM QC SC WL CR DB IC
In Iowa 66 65 44 58 73 71 68 65
In U.S., outside of Iowa 26 24 49 27 19 22 27 27
Outside of U.S. 08 11 07 15 08 07 05 08
Sioux City had the lowest level of educational attainment compared to the other cities with 12%
of mothers possessing less than a high school education. Iowa City had the highest level of
educational attainment compared to the other cities with 19% of mothers possessing a graduate
degree (see Table A4).
Table A4. Education
STATE DM QC SC WL CR DB IC
< High School 07 06 05 12 08 06 03 05
High School 21 18 19 23 21 17 13 14
Some College 33 29 35 33 33 34 30 30
College 27 32 26 21 29 27 35 31
Graduate School 12 15 15 10 10 15 18 19

7
Dubuque (53%) respondents reported the highest family incomes at $70,000 or more. Sioux City
(14%), on the other hand, had the highest percentage of respondents in the lowest-income
category (see Table A5).
Table A5. Annual Family Income Last Year
STATE
DM
QC
SC
WL
CR DB IC
Under $10,000 11 09 12 14 11 10 08 08 $10,000 - $19,999 08 07 08 08 07 07 05 07 $20,000 - $29,999 09 08 10 13 10 09 04 08 $30,000 - $39,999 08 08 05 10 09 06 06 06 $40,000 - $49,999 08 06 06 08 08 05 06 05
$50,000 - $59,999 08 07 07 07 08 07 08 09
$60,000 - $69,999 07 06 06 09 08 08 10 07
$70,000 or more 41 50 45 32 39 48 53 49
During Pregnancy
Waterloo (21%) had the highest percentage of women reporting smoking in the last two years
while Dubuque (13%) had the lowest percentage (see Table A6).
Table A6. Smoked in Last 2 Years
STATE
DM
QC
SC
WL CR
DB IC
Not smoked in last 2 years 79 83 83 80 79 80 87 84
Smoked in last 2 years 21 17 17 20 21 20 13 16

8
Across locations, Waterloo had the highest proportion of women (53%) reporting smoking one
or more cigarettes per day during the last 3 months of their pregnancy. Mothers in Sioux City
reported the highest percent of smoking more than twenty cigarettes per day in the last three
months of the pregnancy (see Table A7).
Table A7. Cigarettes Smoked Per Day in Last 3 Months of Pregnancy
STATE
DM
QC
SC
WL CR
DB IC
Zero in last three months of
pregnancy 53 56 56 62 47 58 62 63
1-10 per day in last three
months of pregnancy 41 37 39 34 44 39 34 30
11-20 per day in last three
months of pregnancy 06 06 04 01 08 03 04 07
>20 per day in last three
months of pregnancy 01 01 01 03 01 <1 <1 <1
Sioux City (33%) had the highest rate of unintended pregnancy (see Table A8). Of all unintended
pregnancies (mistimed and/or unwanted), women in the Quad Cities (73%), Waterloo (73%) and
Iowa City (72%) had the highest rates of pregnancies while not using birth control. Dubuque
(36%) had the highest rates of unintended pregnancy while using some form of birth control and
the lowest rate (64%) of unintended pregnancies when no birth control was used (see Table A8).
Table A8. Pregnancy Intent
STATE DM QC SC WL CR DB IC
Intended 72 74 70 67 72 74 80 77
Unintended 28 26 30 33 28 26 20 23
Table A9. Unintended Pregnancy, Birth Control Use
STATE DM QC SC WL CR DB IC
Unintended, no birth
control used 70 70 73 68 73 68 64 72
Unintended, birth
control used 30 30 27 32 27 32 36 28

9
The three most common stressors during pregnancy were moving to a new address, having a
family member or close friend die and having a close family member very sick who had to be
hospitalized. The highest percentage of women who moved (20%) lived in Des Moines.
Women in Waterloo and Iowa City had the highest percentages (12%) who reported having a
sick and hospitalized family member. The highest percentage of women who had a family
member or friend die were from the Quad Cities (see Table A10).
Table A10. Possible Stressors During Pregnancy
STATE
DM
QC
SC
WL CR
DB IC
A close family member was
very sick and had to be
hospitalized
11 11 11 09 12 10 11 12
I got separated or divorced
from my husband or partner 03 02 03 02 03 02 01 02
I moved to a new address 20 20 19 19 18 18 15 18
I was homeless (for example,
had to sleep outside, in a car,
or in a homeless shelter)
01 01 01 <1 <1 01 01 01
My husband or partner lost
their job 04 04 04 03 03 04 02 03
I lost my job 05 05 05 03 04 05 04 04
I argued with my husband
or partner more than usual 08 07 09 09 10 08 07 09
My husband or partner said
they didn’t want me to be
pregnant
01 01 02 02 01 02 01 01
I had a lot of bills I couldn’t
pay 06 05 06 06 05 05 05 05
I was in a physical fight <1 <1 <1 01 <1 01 01 <1
My husband or partner or I
went to jail 02 01 01 01 02 02 01 01
A family member or close
friend has a bad problem
with drinking or drugs
03 03 03 01 04 03 02 03
A family member or close
friend died 14 13 16 14 14 14 14 14

10
Most mothers statewide plan to return to work following the birth of their baby with Dubuque
having the highest percentage of women (84%) planning to return to work (see Table A11).
Table A11. Plans to Return to Work Following Birth
STATE DM QC SC WL CR DB IC
Yes 74 74 76 70 75 78 84 80
No 26 26 24 30 25 22 16 20
Throughout the state, about two-thirds of mothers reported that their worksites have a designated
room for women to breastfeed. Des Moines and Dubuque respondents (71%) reported a higher
percentage of worksites having a designated breastfeeding room compared to the other cities (see
Table A12).
Table A12. Designated Breastfeeding Room in Workplace
STATE DM QC SC WL CR DB IC
Yes 66 71 67 64 67 69 71 68
No 34 29 33 36 33 31 29 32
Not sure 17 14 14 22 17 16 13 13
While most worksites had a designated room for women to breastfeed, only 44% of women
stated their workplace had a written policy regarding breastfeeding at work (see Table A13).
Table A13. Written Breastfeeding Policy at Workplace
STATE DM QC SC WL CR DB IC
Yes 44 50 46 45 43 46 48 51
No 56 50 54 55 57 54 52 49
Not sure 50 49 48 53 51 52 47 48

11
Prenatal Care
Only 35% of women in Des Moines report being given information about using seatbelts during pregnancy, while 61% in the Quad
Cities report being given this information. Women in the Quad Cities (86%) were most likely to report receiving information from a
health care professional regarding tests to screen for birth defects and diseases. Des Moines had the lowest percentage of women
(25%) reporting receiving information regarding physical abuse to women by their husbands or partners. The highest percentage
(67%) of women reporting being provided information about the Zika virus during pregnancy were from Dubuque (see Table A14).
Table A14. Information Provided by a Health Care Professional During This Pregnancy
STATE
DM
QC
SC
WL CR
DB IC
How smoking during pregnancy may affect baby 59 52 64 59 62 60 64 58
Breastfeeding my baby 67 59 75 67 71 64 75 70
How drinking alcohol during pregnancy may affect
baby 55 48 62 56 58 56 61 57
Using a seatbelt during pregnancy 43 35 61 44 47 45 45 42
Medicines safe to take during pregnancy 84 84 87 82 83 82 88 87
How using illegal drugs may affect baby 45 37 55 47 49 46 50 45
How using prescription medications may affect baby 53 48 58 51 57 51 58 57
Doing tests on me/baby to screen for birth
defects/diseases 83 84 86 78 84 83 85 85
What to do if I feel depressed during pregnancy/after
baby born 59 55 64 51 65 58 59 60
Physical abuse to women by their husbands or partners 31 25 40 31 40 31 33 33
Signs and symptoms of preterm labor 67 63 74 66 68 66 70 69
What to do if labor starts early 69 65 76 65 70 66 72 71
How to monitor changes in baby’s activity during
pregnancy 78 79 82 75 77 78 81 82
What to do if baby had not felt as active as expected 78 77 83 72 77 79 80 81
Oral health or dental care during pregnancy 44 39 48 47 51 46 50 45
The Zika virus 36 33 45 42 35 32 67 36
Not provided with any information listed above 04 03 04 05 04 03 03 02

12
Women in the Quad Cities (64%) and Iowa City (64%) reported the highest rates of HIV/AIDS
testing during pregnancy, while women in Dubuque (52%) reported the lowest rates of testing
(see Table A15).
Table A15. HIV/AIDS Testing
STATE DM QC SC WL CR DB IC
Tested 60 56 64 62 62 61 44 64
Not tested 37 41 32 34 36 37 52 34
Offered but not tested 03 03 03 04 02 02 04 02
Table A17 shows that about two-thirds of the women in the state (65%) reported receiving a flu
shot during their pregnancy. Women in Cedar Rapids and Iowa City were more likely than
women in other areas to get a flu shot (72% and 74% respectively) and women in the Quad
Cities and Waterloo were less likely to get a flu shot (59% and 54%). Thirteen percent of women
in the state report they never get a flu shot, with the highest number of those in the Quad Cities
(16%) and Waterloo (17%) (see Table A16).
Table A16. Flu Shot
STATE
DM
QC
SC
WL
CR DB IC
Received during 65 66 59 70 54 72 66 74
Received before 06 07 05 06 08 05 06 07 Not wanted 13 12 19 12 17 11 14 07
Doctor instructed to wait 01 01 <1 02 01 <1 <1 01
Never get flu shots 13 12 16 09 17 11 13 09
Flu shot not available 02 02 01 02 03 01 01 02

13
Hospital Care
Mothers statewide are encouraged by hospital staff to breastfeed their baby. Iowa City mothers
(88%) are most likely to report being encouraged while mothers in Cedar Rapids (83%) are the
lowest (see Table A17).
Table A17. Encouraged to Breastfeed by Hospital Staff
STATE DM QC SC WL CR DB IC
Yes 85 86 87 85 84 83 87 88
No 13 12 11 12 14 14 12 10
I don’t remember 02 03 03 03 02 03 02 02
Women in Cedar Rapids (78%) were less likely to receive information about breastfeeding or
breastfeeding techniques compared to the other cities. Sioux City respondents (64%) had the
highest percentage of women reporting receiving information about the dangers of shaking an
infant (see Table A18).
Table A18. Information Provided by a Health Care Professional During This Pregnancy
STATE
DM
QC
SC
WL CR
DB IC
Breastfeeding or
breastfeeding techniques 82 85 83 84 83 78 88 82
Action steps to decrease
frustration when my infant
cries
43 33 34 64 40 52 41 35
How to lay my baby down to
sleep 56 47 45 66 63 61 55 52
Dangers of shaking an infant 40 31 30 64 37 50 33 30
Did not receive information
and have not scheduled time
to discuss these topics
08 08 09 08 06 08 06 08

14
Most mothers plan to have their baby sleep on their back. A higher percentage of women in the
Quad Cities and Sioux City (6%) have no preference on their baby’s sleep position (see Table
A19).
Table A19. Baby’s Sleep Position
STATE
DM
QC
SC
WL
CR DB IC
On his/her back 94 94 90 90 95 94 94 95
On his/her side 02 02 03 03 01 02 01 02 On his/her stomach <1 <1 01 <1 <1 <1 <1 <1
No preference 04 04 06 06 04 04 04 03
Women in the Quad Cities were more likely to have their baby sleep in the same bed as them
compared to the other major cities. Waterloo and Cedar Rapids (86%) had the highest percentage
of women reporting that they did not plan to have their baby sleep with anyone (see Table A20).
Table A20. Plan to Have Baby Sleep in Same Bed
STATE
DM
QC
SC
WL CR
DB IC
Daily 07 06 11 07 06 06 05 08
Weekly 06 05 10 07 04 05 06 08
Monthly 01 01 01 <1 01 01 02 01
A few times/year 04 03 05 05 03 04 04 05
Do not plan to have my baby
sleep with me or anyone else 82 85 74 80 86 86 83 77

15
B. Analysis of Selected Variables by Black, Hispanic, and Low Income
Mothers
The following section looks at the mothers who identify as Black, Hispanic, or with an annual
gross household income under twenty thousand dollars. Table B1 breaks down the frequency and
percent of mothers across all races and ethnicities with household incomes under twenty
thousand dollars a year.
Table B1. Income Under $20,000 by Race/Ethnicity
Income Under $20,000
Frequency Valid Percent % Within Race/Ethnicity
White 2,827 80 17% of all White Mothers
Black 539 15 53% of all Black Mothers
Asian/Pacific Islander 120 03 19% of all Asian/Pacific
Islander Mothers
American Indian or
Native Alaskan 65 02
45% of all American Indian
or Native Alaskan Mothers
Hispanic 545 15 37% of all Hispanic Mothers
Mother/Family Characteristics
Overall, mothers with an income of under twenty thousand dollars a year (47%) were most likely
between twenty and twenty-five years old. This is similar to Black (36%) and Hispanic (35%)
mothers who were also more likely to be twenty to twenty-five years old when they gave birth
(see Table B2).
Table B2. Mother’s Age
STATE
Income
under
$20,000
Black Hispanic
< 18 years 01 03 03 03
18 - 19 years 03 11 07 07
20 - 25 years 24 47 36 35
26 - 30 years 37 25 32 30
31 - 35 years 26 11 15 16
> 35 years 09 04 08 08

16
Approximately one-fourth of Black mothers were born outside of the US. Hispanic (39%) and
Black (24%) mothers were much more likely to be born outside of the US than other mothers
(see Table B3).
Table B3. Mother’s Place of Birth
STATE
Income
under
$20,000
Black Hispanic
In Iowa 66 62 39 26
In the US outside of
Iowa 26 27 37 35
Outside of Iowa 08 11 24 39
Black and Hispanic mothers reported much lower percentages of completing their Bachelor’s
degree than other mothers. Almost half (47%) of the respondents with an annual income under
twenty thousand dollars reported their highest level of school completed as twelfth grade or GED
(see Table B4).
Table B4. Mother’s Education
STATE
Income
under
$20,000
Black Hispanic
Grade school 01 02 02 05
Junior high <1 01 01 02
Some high school 06 19 14 16
12th grade or GED 21 47 38 36
Vocational school or
A.A. degree 14 07 08 07
Some college 19 22 26 22
Bachelor’s degree 27 03 07 08
Master’s degree 09 <1 03 03
Doctoral/Professional
degree 03 <1 01 01

17
Overall, Black mothers (23%) and mothers with an annual income under twenty thousand dollars
(33%) had a much higher percentage of only one person depending on the household income
compared to other mothers. Hispanic mothers and Black mothers reported similar numbers of
dependents relying on the household income (see Table B5).
Table B5. Number of People Dependent on Household Income
STATE
Income
under
$20,000
Black Hispanic
1 12 33 23 18
2 30 27 26 24
3 30 19 22 25
4 17 12 16 18
5 07 05 07 09
6 02 02 03 03
7 01 01 02 01
8 <1 <1 <1 <1
9 <1 <1 <1 <1
10 or more <1 <1 01 <1

18
Before Becoming Pregnant
Black (35%) and Hispanic (38%) mothers were less likely to visit a health professional compared
to other mothers (33%). Throughout all topics discussed by a healthcare professional before
becoming pregnant, Black mothers (30%) were less likely to discuss taking folic acid or
multivitamin than Hispanic mothers (42%); however, Hispanic mothers (31%) reported smaller
percentages of discussing smoking with their healthcare professional than Black mothers (36%)
before becoming pregnant (see Table B6).
Table B6. Topics Discussed with a Healthcare Professional Prior to Becoming Pregnant
STATE
Income
under
$20,000
Black Hispanic
Taking folic acid or
multivitamin 46 27 30 42
Smoking 35 33 36 31
Drinking alcohol 32 25 30 30
Your weight 29 25 31 30
Regular exercise 33 24 30 30
How romantic relationships
affect your health 14 12 15 13
Oral health 21 16 17 20
Did not see a health
professional 33 45 35 38

19
When You Became Pregnant
Mothers in households with incomes under twenty thousand dollars a year (81%), Black mothers
(82%), and Hispanic mothers (81%) were more likely to report using birth control at the time of
conception compare to other mothers (87%). Hispanic mothers (5%) were slightly more likely to
use condoms compared to mothers overall (3%) (see Table B7).
Table B7. Birth Control Used at Conception
STATE
Income
under
$20,000
Black Hispanic
No birth control 87 81 82 81
Pills 06 09 07 07
Patch <1 01 01 01
Diaphragm <1 <1 <1 <1
Spermicidal foam/insert <1 <1 <1 <1
Injection 01 01 01 01
Nuvaring <1 01 <1 <1
Condom 03 04 03 05
NFP or rhythm method 01 <1 <1 01
IUD/IUC/Paragard/Mirena 01 01 01 01
Implant/Implanon <1 01 01 01
Some other method 01 01 <1 01

20
Overall, mothers who are Black (48%), Hispanic (62%), or with an annual income under twenty
thousand dollars (43%) were less likely to desire a child at the time of conception as well as
before the time of conception than other respondents (72%). A majority of mothers (50%) with
an income under twenty thousand a year were mostly likely to want a child in the future, but not
at the time of conception. Hispanic (4%) mothers reported smaller percentages of not desiring a
pregnancy now, nor in the future, compared to Black (7%) mothers and mothers with an annual
income under twenty thousand (6%) (see Table B8).
Table B8. Desirability of Pregnancy
STATE
Income
under
$20,000
Black Hispanic
Yes, and earlier 35 20 24 28
Yes, at that time 37 23 24 34
No, but in the future 24 50 45 33
No, nor in the future 03 06 07 04

21
Both Black mothers (36%) and mothers with a lower income (40%) reported not trying to
become pregnant, but not actively preventing it as the most common reason for not using birth
control when they did not desire a pregnancy. Black mothers (9%) were slightly less likely to
experience their birth control failing than other mothers (12%) (see Table B9).
Table B9. Reasons for Not Using Birth Control When Pregnancy Not Desired
STATE
Income
under
$20,000
Black Hispanic
Didn’t want to ruin mood 01 01 02 01
Physical discomfort/side
effects from BC 08 11 10 06
Embarrassed buying or
going to health care
provider
<1 01 <1 01
Against religious beliefs 01 02 02 01
Judgment impaired 01 03 02 <1
Ran out 03 04 04 04
Did not plan to have
intercourse 03 07 07 05
Father wanted child/refused 01 01 02 01
Preferred method too
expensive 01 01 01 01
Birth control failed 12 14 09 10
Not trying to become
pregnant, not actively
preventing
33 40 36 29
Thought I (or partner) could
not become pregnant 06 09 07 06
Other 04 05 04 03

22
Hispanic mothers (62%) had higher reports of desiring their pregnancy than Black mothers
(48%) and lower income mothers (43%). Lower income and Black mothers (57% and 52%
respectively) had higher reports of not desiring their pregnancy than mothers overall (28%) (see
Table B10).
B10. Pregnancy Desirability
STATE
Income
under
$20,000
Black Hispanic
Yes 72 43 48 62
No 28 57 52 38
While Black mothers (80%) and mothers with an annual income under twenty thousand a year
(75%) were most likely to not desire a pregnancy, they also had the highest reports of not using
birth control when not desiring a pregnancy compared to other mothers (70%) (see Table B11).
Table B11. Birth Control Use When Pregnancy Not Desired
STATE
Income
under
$20,000
Black Hispanic
Unitended, birth
control used 30 25 20 31
Unintended, no
birth control used 70 75 80 69
During Pregnancy
Black respondents (7%) were more likely to report having progesterone shots recommended to
them by their health care provider than other mothers (4%) (see Table B12).
Table B12. Recommendation of Progesterone by Health Care Provider
STATE
Income
under
$20,000
Black Hispanic
Yes, shots recommended 04 04 07 05
Yes, suppositories
recommended 02 01 02 02
No 94 95 91 94

23
The following table looks at the percentages of 58 Black mothers, 57 Hispanic mothers, and 125
low income mothers. Hispanic (38%) mothers and lower income (47%) mothers reported
experiencing at least one or more barriers to receiving progesterone than Black (54%) mothers.
Hispanic (9%) mothers were more likely to experience Medicaid not covering the medicine than
other mothers (4%), while lower income mothers (5%) were more likely to be too busy for an
appointment than others (1%) (see Table B13). Caution should be exercised in generalizing
from small cell sizes.
Table B13. Barriers to Receiving Progesterone
STATE
Income
under
$20,000
Black Hispanic
Hard to remember to use
suppositories/make
appointments for shot
03 07 04 04
No way to get to
clinic/doctor’s office 01 03 06 <1
Couldn’t take time off from
work/school 01 03 03 02
No one to take care of
children <1 <1 <1 <1
Medicaid did not cover
medicine 04 07 03 09
Insurance did not cover
medicine 13 05 06 07
Doctor not able to get
medicine 01 <1 01 <1
Do not like or afraid of
shots/injections 04 07 04 07
Afraid of possible side effects
for me or baby 04 03 04 06
Could not afford medication
or co-pay 04 07 04 05
Too busy to get appointments 01 05 01 01
No major barriers to
receiving medication 57 47 54 38

24
The most common stressor experience during pregnancy across all mothers was moving to a new
address (20%), but this stressor was even more prevalent for lower income (34%), Black (29%),
and Hispanic mothers (23%). In general, Black mothers and mothers with an annual income
under twenty thousand dollars experienced more stressors during their pregnancy than other
mothers (see Table B14).
Table B14. Possible Stressors Experienced During Pregnancy
STATE
Income
under
$20,000
Black Hispanic
Close family member very sick
or hospitalized 11 11 12 09
Separated/divorced husband or
partner 03 08 05 04
Moved to a new address 20 34 29 23
Was homeless 01 03 03 01
Husband/partner lost job 04 08 05 05
Lost my job 05 13 11 06
Argued with husband/partner
more often than usual 08 14 15 08
Husband/partner said they did
not want me to be pregnant 01 03 03 02
Had a lot of bills I couldn’t pay 06 14 14 09
Was in a physical fight 01 02 02 <1
Husband/partner went to jail 02 06 05 02
Family member/close friend
had bad problem with
drinking/drugs
04 07 04 03
Family member/close friend
died 14 17 18 10

25
Compared to other mothers (74%), Hispanic mothers (56%) were less likely to return to work
following the birth of their child (see Table B15).
Table B15. Plan to Return to Work Following Birth of Baby
STATE
Income
under
$20,000
Black Hispanic
Yes 74 67 72 56
No 26 33 28 43
Black mothers (50%) and Hispanic mothers (56%) were less likely to report having a designated
breastfeeding location at their workplace than mothers overall (66%); furthermore, mothers of
lower incomes (42%) were the least likely to have a breastfeeding location at their workplace
(see Table B16).
Table B16. Designated Breastfeeding Location at Workplace
STATE
Income
under
$20,000
Black Hispanic
Yes 66 42 50 56
No 34 58 50 44
While mothers with lower incomes were the least likely to report having a location at their
workplace for breastfeeding there were even lower reports of having a written policy about
breastfeeding in the workplace for lower income mothers (19%) compared to other mothers
(44%) (see Table B17).
Table B17. Written Policy about Breastfeeding in Workplace
STATE
Income
under
$20,000
Black Hispanic
Yes 44 19 29 32
No 56 82 71 68

26
Lower income mothers reported much higher percentages (46%) of smoking in the last two years
compared to mothers overall (21%), while Hispanic mothers reported the lowest percentages
(19%) of smoking within the last two years (see Table B18).
Table B18. Smoked Cigarettes in the Last 2 Years
STATE
Income
under
$20,000
Black Hispanic
Yes 21 46 26 14
No 80 54 74 86
Lower income (91%) and Black mothers (93%) were more likely to have smoked cigarettes in
the three months before becoming pregnant than Hispanic mothers (81%). Mothers with lower
incomes reported slightly higher percentages (5%) of smoking more than twenty cigarettes per
day in the three months prior to becoming pregnant than Black or Hispanic mothers (3% and 4%
respectively) (see Table B19).
Table B19. Cigarettes Smoked 3 Months Before Becoming Pregnant
STATE
Income
under
$20,000
Black Hispanic
Zero cigarettes per day 14 09 07 19
1-10 per day 54 53 76 58
11-20 per day 28 33 14 19
More than 20 per day 04 05 03 04
Hispanic mothers had the highest reports (65%) of not smoking during the last three months of
their pregnancy compared to other mothers (53%). More than half of lower income and Black
mothers stated (52% and 51% respectively) they smoked between one and ten cigarettes during
the last the three months of their pregnancy (see Table B20).
Table B20. Cigarettes Smoked During the Last 3 Months of Pregnancy
STATE
Income
under
$20,000
Black Hispanic
Zero cigarettes per day 53 39 46 65
1-10 per day 41 52 51 34
11-20 per day 06 08 02 01
More than 20 per day 01 01 <1 01

27
Low-income mothers reported the highest percentage (46%) of consuming alcohol within the
past two years compare to other mothers (21%), while Hispanic mothers had the lowest reports
of consuming alcohol within the past two years (14%) (see Table B21).
Table B21. Consumed Alcohol in the Past Two Years
STATE
Income
under
$20,000
Black Hispanic
Yes 21 46 26 14
No 80 54 74 86
Lower income mothers (29%), Black mothers (28%), and Hispanic mothers (32%) were more
likely to have zero drinks per week in the three months before they became pregnant compare to
other mothers (25%). Lower income mothers (3%) were slightly more likely to drink more than
ten drinks per week in the three months before becoming pregnant compared to mothers overall
(1%) (see Table B22).
Table B22. Alcohol Consumed 3 Month Before Becoming Pregnant
STATE
Income
under
$20,000
Black Hispanic
Zero drinks per week 25 29 28 32
1-2 drinks per week 50 44 48 46
3-5 drinks per week 19 18 19 17
6-10 drinks per week 04 06 04 04
More than 10 drinks per week 01 03 01 01

28
Black mothers (4%) were slightly more likely than other mothers (2%) to drink one to two drinks
per week during the last three months of their pregnancy. Mothers with an annual income under
twenty thousand dollars a year, Black mothers, and Hispanic mother were less likely (96%) to
drink zero alcoholic beverages during the last three months of their pregnancy compared to
mothers overall (98%) (see Table B23).
Table B23. Alcohol Consumed During the Last 3 Months of Pregnancy
STATE
Income
under
$20,000
Black Hispanic
Zero drinks per week 98 96 96 96
1-2 drinks per week 02 03 04 03
3-5 drinks per week <1 01 01 <1
6-10 drinks per week <1 <1 <1 <1
More than 10 drinks per week <1 00 00 00

29
Prenatal Care
Difficulty paying for the doctor visit (3%) and problems with signing up for Medicaid and/or
Title 19 (3%) were reported as the most common barrier to receiving prenatal care for Hispanic
mothers. For lower income mothers and Black mothers, the most common barrier to receiving
prenatal care was not having a way to get to the doctor’s office or clinic (3%) (see Table B24).
Table B24. Barriers to Receiving Prenatal Care
STATE
Income
under
$20,000
Black Hispanic
Did not have any problems 87 80 76 79
Couldn’t get appointment when
wanted 01 02 02 02
Difficulty paying for visits 01 02 02 03
No way to get to doctor’s office or
clinic 01 03 03 02
Couldn’t take time off work 01 01 01 01
Doctor of health plan wouldn’t
start care as early as wanted <1 01 01 01
Problems signing up for
Medicaid/Title 19 01 02 02 03
Medicaid coverage was dropped
during pregnancy 01 02 02 02
Had no one to take care of my
children 01 01 01 01
Had too many other things going
on 01 02 02 02
Didn’t want anyone to know I was
pregnant <1 01 01 01
Doctor would not take my
insurance <1 01 01 01
Some other problem 01 01 01 01
Across all mothers, Black mothers were had the highest reports (3%) of being refused prenatal
care (see Table B25).
Table B25. Ever Refused Prenatal Care During Pregnancy
STATE
Income
under
$20,000
Black Hispanic
Yes 01 02 03 01
No 99 98 97 99

30
The following table looks at the percentages of 24 Black mothers, 16 Hispanic mothers, and 58
low income mothers. The most common reported reason for being refused prenatal care for
lower income and Black mothers was having problems with their insurance (28% and 27%
respectively), while Hispanic mothers experienced not having insurance (36%) as the most
common reason for being refused prenatal care (see Table B26). Caution should be exercised in
generalizing from small cell sizes.
Table B26. Reasons for Being Refused Care
STATE
Income
under
$20,000
Black Hispanic
Didn’t have insurance 18 24 21 36
Had problems with insurance 23 28 27 32
Doctor was not accepting new
patients 11 09 09 05
Unable to find doctor who
accepted Medicaid/Title 19 07 06 06 09
Pregnancy was high risk 15 19 15 09
Too late in pregnancy to change
doctors 10 05 07 09
Unsure why I was refused care 13 08 10 09

31
Mothers who are Hispanic (90%), Black (86%), or have lower incomes (88%) were less likely to
receive prenatal care within the first three months of their pregnancy compared to other mothers
(95%); Specifically, Hispanic (8%), Black (11%), and lower income (11%) mothers were more
likely to begin receive prenatal care within the second trimester of their pregnancy compared to
other mothers (4%) (see Table B27).
Table B27. Months into Pregnancy When Received Prenatal Care
STATE
Income
under
$20,000
Black Hispanic
0 04 03 03 04
1 30 32 27 32
2 47 39 40 38
3 14 14 16 16
4 02 05 06 05
5 01 03 03 02
6 01 02 02 01
7 01 01 01 01
8 01 01 01 01
9 <1 01 01 01
Black mothers (86%) and mothers with an annual income of under twenty thousand dollars
(88%) were less likely to receive prenatal care as early as they wanted compared to Hispanic
mothers (92%). Compared to mothers overall (95%), Hispanic mothers (92%) were slightly less
likely to receive prenatal care as early as they wanted (see Table B28).
Table B28. Receive Prenatal Care as Early as Wanted
STATE
Income
under
$20,000
Black Hispanic
Yes 95 88 86 92
No 05 12 14 09

32
Black mothers (9%) were more likely than other mothers (7%) to receive most of their prenatal
care from of midwife’s office or a home visit for a midwife. Hispanic (28%) and lower income
(24%) mothers had higher reports of going to a public clinic than mothers overall (15%) (see
Table B29).
Table B29. Location Received Prenatal Care
STATE
Income
under
$20,000
Black Hispanic
Private doctor’s office or clinic
or OBGYN 78 68 70 64
Midwife’s office or home visit
from a midwife 07 06 09 05
Public clinic 15 24 18 28
Other 01 01 01 02
No prenatal care 01 01 02 01

33
Lower income mothers and Black mothers were more likely (6%) than Hispanic mothers (4%) to
report not receiving any information from a healthcare professional during their pregnancy.
Medicines that are safe to take during pregnancy was the most common piece of information
provided by a healthcare professional overall, but lower income (77%), Black (72%), and
Hispanic (77%) mothers had lower reports of receiving this information compared to mothers
overall (84%). Black respondents (64%) and respondents with an income under twenty thousand
dollars a year (69%) were more likely to report receiving information on how smoking during
pregnancy may affect the baby compared to Hispanic respondents (57%) (see Table B30).
Table B30. Information Provided by a Healthcare Professional During Pregnancy
STATE
Income
under
$20,000
Black Hispanic
How smoking during pregnancy
may affect baby 59 69 64 57
Breastfeeding my baby 67 68 66 68
How drinking alcohol during
pregnancy may affect my baby 55 56 54 53
Using a seat belt during
pregnancy 43 44 44 45
Medicines that are safe to take
during pregnancy 84 77 72 77
How illegal drugs may affect my
baby 45 51 48 44
How prescription medicines may
affect my baby 53 52 44 46
Tests on me or my baby to screen
for birth defects/disease 83 74 67 72
What to do if I feel depressed
during pregnancy 59 58 52 53
Physical abuse by husbands/
partners 31 32 30 31
Signs/ symptoms of preterm labor 67 60 54 58
What to do if labor starts early 69 60 53 58
How to monitor changes in baby
activity during pregnancy 78 68 61 67
What to do if baby is not as active
as I would have expected 78 69 61 65
Oral health or dental care during
pregnancy 44 45 43 44
The Zika virus 36 31 27 34
Did not receive information 04 06 06 04
34
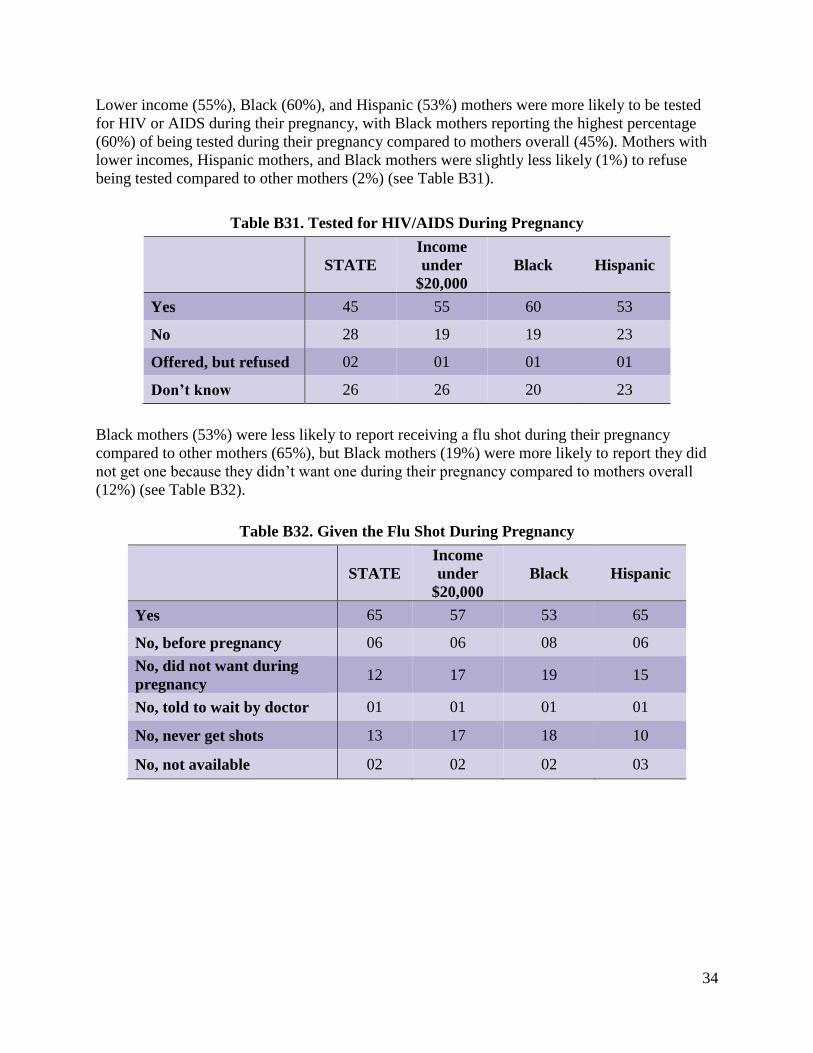
Lower income (55%), Black (60%), and Hispanic (53%) mothers were more likely to be tested
for HIV or AIDS during their pregnancy, with Black mothers reporting the highest percentage
(60%) of being tested during their pregnancy compared to mothers overall (45%). Mothers with
lower incomes, Hispanic mothers, and Black mothers were slightly less likely (1%) to refuse
being tested compared to other mothers (2%) (see Table B31).
Table B31. Tested for HIV/AIDS During Pregnancy
STATE
Income
under
$20,000
Black Hispanic
Yes 45 55 60 53
No 28 19 19 23
Offered, but refused 02 01 01 01
Don’t know 26 26 20 23
Black mothers (53%) were less likely to report receiving a flu shot during their pregnancy
compared to other mothers (65%), but Black mothers (19%) were more likely to report they did
not get one because they didn’t want one during their pregnancy compared to mothers overall
(12%) (see Table B32).
Table B32. Given the Flu Shot During Pregnancy
STATE
Income
under
$20,000
Black Hispanic
Yes 65 57 53 65
No, before pregnancy 06 06 08 06
No, did not want during
pregnancy 12 17 19 15
No, told to wait by doctor 01 01 01 01
No, never get shots 13 17 18 10
No, not available 02 02 02 03

35
Hospital Care
Hispanic mothers (87%) were more likely to report being encouraged to breastfeed by hospital
staff than were other mothers (85%), while lower income and Black mothers had lower reports
(72%) of being encouraged to breastfeed by hospital staff (see Table B33).
Table B33. Encouraged to Breastfeed by Hospital Staff
STATE
Income
under
$20,000
Black Hispanic
Yes 85 72 72 87
No 13 23 20 10
Don’t remember 02 05 08 04
Overall, lower income mothers and Black mothers were more likely (13%) to report not
receiving any information after their birth from the hospital compared to other mothers (8%). In
general, Black and Hispanic mothers were less likely to receive information about specific topics
from the hospital after their birth than mothers overall (see Table B34).
Table B34. Information Provided After Birth at Hospital
STATE
Income
under
$20,000
Black Hispanic
Breastfeeding or breastfeeding
techniques 83 72 71 81
Actions steps to decrease
frustration when my infant
cries
43 42 35 37
How to lay my baby down to
sleep 56 55 51 51
Dangers of shaking an infant 40 41 34 36
Not provided any information 08 13 13 08

36
In general, mothers with lower incomes, Black mothers, and Hispanic mothers were less likely to
plan on laying their baby on their back when sleeping and more likely to not have a preference
on the position of the baby when they were sleeping compared to mothers overall (see Table
B35).
Table B35. Position Planning to Lay Baby When Sleeping
STATE
Income
under
$20,000
Black Hispanic
On his/her back 94 87 84 84
On his/her side 02 04 05 06
On his/her stomach <1 <1 01 <1
No preference 04 08 10 10
Black and Hispanic mothers were slightly less (97%) likely compared to mothers overall (99%)
to have their baby sleep in a crib, bassinet, or portable crib (see Table B36a). Lower income
(11%), Black (10%), and Hispanic (12%) mothers were more likely to be unsure if their baby
was going to sleep with bumper pads compared to other mothers (6%) (see Table B36c). Black
mothers (19%) reported higher percentages of planning to have their baby sleep with a loose
blanket covering them than other mothers (6%) (see Table B36d).
Table B36a. Plan to Have Baby Sleep in a Crib, Bassinet, or Portable Crib
STATE
Income
under
$20,000
Black Hispanic
Yes 99 98 97 97
No <1 01 02 01
Not sure 01 01 02 02
Table B36b. Plan to Have Baby Sleep with Pillows Nearby or Under Him/Her
STATE
Income
under
$20,000
Black Hispanic
Yes 02 03 06 04
No 96 91 87 90
Not sure 03 06 07 06

37
Table B36c. Plan to Have Baby Sleep with Bumper Pads
STATE
Income
under
$20,000
Black Hispanic
Yes 06 10 11 07
No 88 79 79 80
Not sure 06 11 10 12
Table B36d. Plan to Have Baby Sleep Covered in a Loose
Blanket
STATE
Income
under
$20,000
Black Hispanic
Yes 06 11 19 11
No 90 80 72 81
Not sure 05 09 09 09
Table B36e. Plan to Have Baby Sleep with Stuffed Toys
STATE
Income
under
$20,000
Black Hispanic
Yes 01 01 02 01
No 98 96 94 97
Not sure 02 03 04 02
Table B36f. Plan to Have Baby Sleep in Bed with Someone
STATE
Income
under
$20,000
Black Hispanic
Yes 04 05 08 07
No 90 86 85 82
Not sure 06 09 07 11

38
Black mothers (78%) reported higher percentages of not planning to have the baby share a bed
with any one compared to Hispanic mothers (73%); however, Black (78%) and Hispanic (73%)
mothers reported lower percentages of not planning to have their baby share a bed with anyone
compared to mothers overall (82%). Black (11%) and Hispanic (12%) mothers were more likely
to have their baby share a bed with someone every day compared to other mothers (7%) (see
Table B37).
Table B37. How Often Will the Baby Share a Bed with Someone
STATE
Income
under
$20,000
Black Hispanic
Daily 07 08 11 12
Weekly 06 07 06 07
Monthly 01 01 01 02
A few times/year 04 04 04 06
Do not plan to have
baby share a bed 82 81 78 73

39
C. Trend Analysis of Barriers Data 2009-2018
All percentages in the present section reflect statewide percentages. The number of respondents
was greater than 20,000 for all years.
Respondents by Year
2009 2010 2011 2012 2013 2014 2015 2016 2017 2018
N = 20,752 23,511 23,934 23,674 24,634 24,696 23,212 21,928 20,919 20,035
Demographics
The age distribution of mothers has maintained a generally stable pattern over the past ten years
with about two-thirds of mothers between the ages of 20 and 30 years of age. However, there
has been a decrease in mothers 18 to 25 years old and a steady increase in mothers 26 years of
age and older (see Table C1).
Table C1. Mother’s Age Ranges
2009 2010 2011 2012 2013 2014 2015 2016 2017 2018
<18 years 02 02 02 02 02 01 01 01 01 01
18 - 19 years 06 06 05 05 04 04 04 03 03 03
20 - 25 years 31 30 29 29 29 28 27 26 25 24
26 - 30 years 33 35 35 35 35 35 35 36 36 37
31 - 35 years 20 21 22 22 23 24 25 25 26 26
> 35 years 07 07 07 07 07 08 08 08 09 09
Educational levels have shown small increases in the past ten years. The proportion of mothers
completing college has increased from 24% in 2009 to 27% in 2018. The proportion of mothers
completing graduate school also increased from 8% in 2009 to 12% in 2018 (see Table C2).
Table C2. Education
2009 2010 2011 2012 2013 2014 2015 2016 2017 2018
Mother
< High school 10 09 09 08 08 08 07 07 07 07
High school 21 20 20 20 20 19 20 20 21 21
Some college 36 37 36 36 36 36 35 34 34 33
College 24 25 26 26 26 27 27 27 27 27
Graduate school 08 09 10 10 10 10 11 11 12 12

40
Although not quite as pronounced as in previous years, racial and ethnic backgrounds of
respondents have become more diverse over the last ten years. This is consistent with population
changes in the state. The proportion of Hispanic mothers has varied from 7% in 2009 down to
6% in 2011 and 2012. There was then a slight increase to 7% in 2013, which has been consistent
since. Additionally, the proportion of Black mothers responding has increased slightly from 4%
in 2009 to 6% in 2018 (see Table C3).
Table C3. Race/Ethnicity
2009 2010 2011 2012 2013 2014 2015 2016 2017 2018
Mother
Hispanic 07 08 06 06 07 07 07 07 07 08
Non-Hispanic* 93 93 94 94 93 93 93 93 93 92
White 93 93 92 91 91 91 91 91 90 90
Black 04 04 05 05 05 05 05 05 06 06
Asian/Pacific Islander 02 03 03 03 03 03 03 03 03 03
Native American 01 01 01 01 01 01 01 01 01 01
The proportion of mothers reporting an annual family income over $70,000 has steadily
increased over the past ten years from 27% in 2009 to 41% in 2018. The proportion of mothers
in the lowest income range (under $10,000) has decreased slightly over the last several of years.
This downward trend resulted in 2018 being the lowest percentage (11%) reported in the past 10
years of annual family income under $10,000 (see Table C4).
Table C4. Annual Family Income Last Year
2009 2010 2011 2012 2013 2014 2015 2016 2017 2018
Under $10,000 14 14 15 16 16 14 14 12 12 11
$10,000 - $19,999 10 11 11 11 11 10 10 09 09 08
$20,000 - $29,999 11 10 09 10 10 10 09 09 09 09
$30,000 - $39,999 10 10 09 08 08 09 09 09 08 08
$40,000 - $49,999 10 10 09 08 08 08 07 08 07 08
$50,000 - $59,999 10 10 09 09 08 09 08 08 08 08
$60,000 - $69,999 09 09 09 08 08 07 08 07 07 07
Above $70,000 27 28 29 31 32 33 36 38 39 41

41
Prenatal Experiences and Care
The most widely used form of birth control across all ten years was the birth control pill.
Condoms were the second most popular method across the period. Those indicating that they
used no birth control has increased slightly over time (see Table C5).
Table C5. Birth Control Used At Conception
2009 2010 2011 2012 2013 2014 2015 2016 2017 2018
No birth control used 83 84 84 85 84 86 86 87 86 87
Birth control pills 08 07 07 07 07 06 06 06 06 06
Diaphragm <1 <1 <1 <1 <1 <1 <1 <1 <1 <1
Spermicidal foam/insert <1 <1 <1 <1 <1 <1 <1 <1 <1 <1
Condom 05 05 05 04 04 04 04 03 03 03
NFP/rhythm method 01 01 01 01 01 01 01 01 01 01
Birth control patch <1 01 <1 <1 <1 <1 <1 <1 <1 <1
Birth control injection 01 01 01 01 01 01 01 01 01 01
NuvaRing 01 01 01 01 01 01 01 <1 <1 <1
IUD/IUC <1 01 01 01 01 01 01 01 01 01
Implant/ Nexplanon
<1 -- <1 <1 <1 <1 <1 <1 <1 <1
Other <1 -- <1 <1 01 01 <1 01 <1 01

42
Over two-thirds of women not desiring pregnancy reported that they were not using birth control
at the time of conception; this number has increased from 64% in 2009 to 72% in 2018 (see
Table C6).
Table C6. Reported Birth Control Type
Among Those Not Desiring Pregnancy
2009 2010 2011 2012 2013 2014 2015 2016 2017 2018
No birth control used 64 65 64 66 66 66 68 70 70 72
Birth control pills 19 18 19 18 18 17 17 16 16 16
Diaphragm <1 <1 <1 <1 <1 <1 <1 <1 <1 <1
Spermicidal foam/insert 01 <1 01 <1 <1 <1 <1 <1 <1 <1
Condom 11 11 12 11 10 09 09 07 08 07
NFP/rhythm method 03 02 02 02 01 02 02 02 02 02
Birth control patch 01 01 01 01 01 01 01 01 01 01
Birth control injection 01 01 01 02 02 02 02 01 02 01
NuvaRing 02 02 02 02 02 01 01 01 01 01
IUD/IUC 01 01 01 01 01 01 01 01 01 01
Implant/Nexplanon <1 <1 <1 <1 <1 <1 <1 <1 01 01
Other 01 01 01 01 01 01 01 01 01 01
Approximately two-thirds of the pregnancies were reported to be desired across the time frame.
The percentage of mistimed pregnancies decreased slightly to 24% in 2018 which is the lowest
level in a more than a decade (see Table C7).
Table C7. Desirability of Pregnancy
2009 2010 2011 2012 2013 2014 2015 2016 2017 2018
Yes, and earlier 32 33 32 33 32 34 33 34 34 35
Yes, at that time 33 33 36 35 37 36 38 37 37 37
No, but in future 32 30 29 29 28 27 26 26 25 24
No, nor in future 04 04 03 03 04 04 04 03 04 03

43
Lack of birth control use among mothers not desiring a pregnancy has increased slightly over the
past ten years (see Table C8).
Table C8. No Birth Control Use by Desirability of Pregnancy
2009 2010 2011 2012 2013 2014 2015 2016 2017 2018
Yes, and earlier 97 97 96 97 96 97 96 97 96 97
Yes, at that time 95 95 94 95 94 94 93 94 94 94
No, but in future 65 65 65 67 67 67 68 71 70 73
No, nor in future 57 61 57 55 61 59 62 63 62 64
For the mothers who reported not wanting to be pregnant at that time, the reported reasons for
not using birth control has remained relatively consistent since 2013. The most common reason
reported for not using birth control among these mothers was not trying to become pregnant but
not actively preventing it, with nearly half of these mothers (49.9%) selecting this response (see
Table C9 – note that a single decimal place was used in this table owing to the very small
percentages).
Table C9. Reported Reason For Not Using Birth Control When Pregnancy Not Desired
2013 2014 2015 2016 2017 2018
Didn’t want to ruin mood 1.0 1.1 1.0 1.0 1.0 1.0
Physical discomfort/side effects
from BC 8.6 8.0 8.8 10.3 10.0 11.8
Embarrassed buying or going to
health care provider 0.5 0.4 0.5 0.5 0.5 0.5
Against religious beliefs 1.4 1.2 1.4 1.5 1.5 2.0
Judgment impaired 1.8 2.0 2.0 1.6 1.8 1.8
Ran out 5.5 5.7 4.4 5.1 3.8 4.8
Did not plan to have intercourse 5.8 5.9 5.4 5.7 4.7 5.3
Father wanted child/refused 1.1 1.0 0.9 0.8 0.7 0.8
Preferred method too expensive 1.9 1.9 1.4 1.0 1.1 1.0
Birth control failed 22.1 21.3 19.1 18.9 17.9 18.4
Not trying to become pregnant, not
actively preventing 43.5 45.6 44.8 47.7 46.2 49.9
Thought I (or partner) could not
become pregnant 8.3 8.1 9.0 8.1 8.7 9.3
Other 7.3 7.1 5.4 6.4 5.2 5.4

44
D. 2018 Questionnaire Frequency Tables
Presented below is a frequency analysis of all variables in the 2018 questionnaire. Data
presented in this section are based upon 2018 questionnaires received to date (n = 20,035). All
entries reflect unweighted percentages of those mothers answering the item.
MOTHER/FAMILY CHARACTERISTICS
1. How old are you (baby’s mother)?
Frequency Valid Percent
< 18 years 195 1.0
18 - 19 years 611 3.1
20 - 25 years 4,840 24.3
26 - 30 years 7,298 36.7
31 - 35 years 5,123 25.8
> 35 years 1,815 9.1
2. Where were you born?
Frequency Valid Percent
In Iowa 13,067 66.1
In the US outside of Iowa 5,051 25.6
Outside the US 1,650 8.3

45
3. What is the highest grade or year of regular school or college that you completed?
(select only one)?
Frequency Valid Percent
Grade school 195 1.0
Junior high 81 0.4
Some high school 1,135 5.7
12th grade or GED 4,135 20.7 Vocational school or A.A. degree 2,872 14.4
Some college 3,692 18.5
Bachelor’s degree 5,434 27.2
Master’s degree 1,808 9.0
Doctoral/Professional degree 629 3.1
4. Which one of the following best describes your racial background? (select only one)
Are you…
Frequency Valid Percent
Black 1,089 5.6
White 17,644 90.2
Asian/Pacific Islander 664 3.4
American Indian or Native Alaskan 157 0.8
5. Which one of the following best describes your ethnic background? Are you…
Frequency Valid Percent
Hispanic 1,636 8.3
Non-Hispanic 18,155 91.7

46
6. What was the general range of your household income before taxes last year – including
wages, unemployment, Social Security, and all other sources of income?
Frequency Valid Percent
Under $10,000 2,159 11.2
$10,000-$19,999 1,557 8.1
$20,000-$29,999 1,772 9.2
$30,000-$39,999 1,536 8.0 $40,000-$49,999 1,443 7.5
$50,000-$59,999 1,493 7.8
$60,000-$69,999 1,382 7.2
$70,000 or over 7,890 41.0
7. During the last year, how many people, including you depended on that income?
Frequency Valid Percent
1 2,242 11.5
2 5,782 29.7
3 5,829 30.0
4 3,353 17.2
5 1,414 7.3
6 463 2.4
7 198 1.0
8 69 0.4
9 42 0.2
10 or more 50 0.3

47
BEFORE YOU BECAME PREGNANT
8. In the twelve months prior to becoming pregnant, did a doctor, nurse, or other health
care professional ever talk to you about the following topics as they relate to pregnancy?
(mark all that apply)
Frequency Valid Percent
Taking folic acid or multivitamin 9,288 46.4
Smoking 7,002 34.9
Drinking alcohol 6,313 31.5
Your weight 5,839 29.1
Regular exercise 6,631 33.1
How romantic relationships affect your health 2,775 13.9
Oral health 4,171 20.8
Did not see health professional 6,674 33.3
WHEN YOU BECAME PREGNANT
9. Thinking back to the time you became pregnant were you (or your partner) using any
form of birth control when you got pregnant? (mark all that apply)
Frequency Valid Percent
No birth control used 17,484 87.3
Birth control pills 1,150 5.7
Patch 67 0.3
Diaphragm 11 0.1
Spermicidal foam/insert 38 0.2
Injection 97 0.5
NuvaRing 72 0.4
Condom 507 2.5
NFP/rhythm method 264 1.3
IUD/IUC/ParaGard/Mirena 135 0.7
Implant/Nexplanon 76 0.4
Other 92 0.5

48
10. Thinking back, just before you became pregnant, did you want to become pregnant at
that time?
Frequency Valid Percent
Yes and earlier 6,875 35.1
Yes, at that time 7,269 37.1
No, but in future 4,783 24.4
No, nor in future 675 3.4
11. If you did not want to get pregnant, why did you not use any form of birth control?
(mark all that apply)
Frequency Valid Percent
Wanted to get pregnant – SKIP TO Q12 11,638 58.1
Didn’t want to ruin mood 59 0.7
Physical discomfort/side effects from BC 636 7.6
Embarrassed buying or going to health care provider 32 0.4
Against religious beliefs 112 1.3
Judgment impaired 99 1.2
Ran out 259 3.1
Did not plan to have intercourse 283 3.4
Father wanted child/refused 47 0.6
Preferred method too expensive 56 0.7
Birth control failed 991 11.8
Not trying to become pregnant, not actively preventing 2,726 32.5
Thought I (or partner) could not become pregnant 511 6.1
Other 304 3.6
49
DURING YOUR PREGNANCY
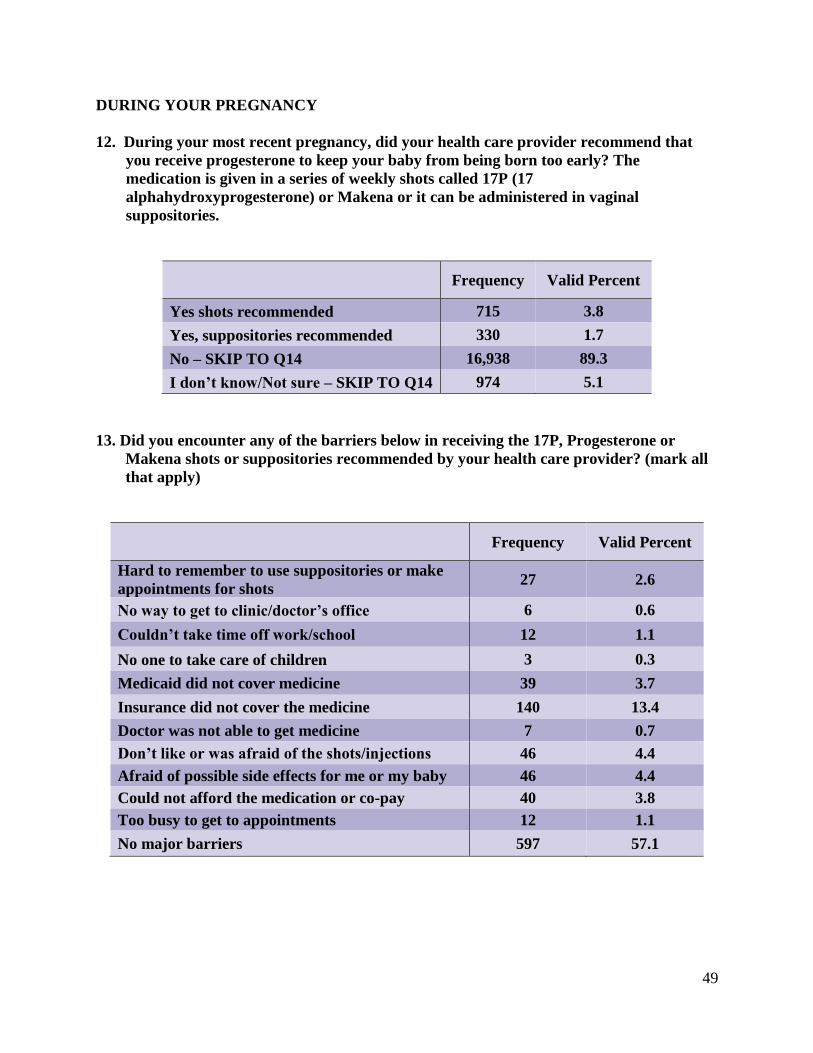
12. During your most recent pregnancy, did your health care provider recommend that
you receive progesterone to keep your baby from being born too early? The
medication is given in a series of weekly shots called 17P (17
alphahydroxyprogesterone) or Makena or it can be administered in vaginal
suppositories.
Frequency Valid Percent
Yes shots recommended 715 3.8
Yes, suppositories recommended 330 1.7
No – SKIP TO Q14 16,938 89.3
I don’t know/Not sure – SKIP TO Q14 974 5.1
13. Did you encounter any of the barriers below in receiving the 17P, Progesterone or
Makena shots or suppositories recommended by your health care provider? (mark all
that apply)
Frequency Valid Percent
Hard to remember to use suppositories or make
appointments for shots 27 2.6
No way to get to clinic/doctor’s office 6 0.6
Couldn’t take time off work/school 12 1.1
No one to take care of children 3 0.3
Medicaid did not cover medicine 39 3.7
Insurance did not cover the medicine 140 13.4
Doctor was not able to get medicine 7 0.7
Don’t like or was afraid of the shots/injections 46 4.4
Afraid of possible side effects for me or my baby 46 4.4
Could not afford the medication or co-pay 40 3.8
Too busy to get to appointments 12 1.1
No major barriers 597 57.1

50
14. Here are a few things that might happen to some women during pregnancy. Please tell
us if any of these things happened to you during this pregnancy. (mark all that apply)
Frequency Valid Percent
Close family member was sick and hospitalized 2,188 10.9
Got separated or divorced from husband or partner 515 2.6
Moved to a new address 3,959 19.8
Was homeless (sleep outside, in car, or homeless shelter) 132 0.7
Husband or partner lost their job 796 4.0
Lost my job 940 4.7
Argued with husband or partner more than usual 1,665 8.3
Husband/Partner said didn’t want me to be pregnant 271 1.4
Had a lot of bills I couldn’t pay 1,191 5.9
Was in a physical fight 99 0.5
Husband or partner or I went to jail 342 1.7
Family member/Friend had problem with drinking/drugs 695 3.5
Family member or close friend died 2,807 14.0
15. Do you plan to return to work outside of your home following the birth of this baby?
Frequency Valid Percent
Yes 14,082 74.3
No – SKIP TO Q18 4,873 25.7
16. Does your worksite have a designated room/location (not counting bathroom stalls) for
mothers to breastfeed or pump/express their breast milk?
Frequency Valid Percent
Yes 7,657 55.3
No 3,878 28.0
Don’t know 2,323 16.8

51
17. Does your worksite have a written policy about breastfeeding?
Frequency Valid Percent
Yes 3,080 22.3
No 3,855 27.9
Don’t know 6,895 49.9
18. Have you smoked any cigarettes in the past 2 years?
Frequency Valid Percent
Yes 3,989 20.5
No – SKIP TO Q28 15,427 79.5
19. In the 3 months before you got pregnant, how many cigarettes did you smoke on an
average day? (If none, fill in 00; a pack has 20 cigarettes)
Frequency Valid Percent
Zero Cigarettes per day 562 14.3
1-10 per day 2,121 54.1
11-20 per day 1,092 27.9
More than 20 per day 144 3.7
20. In the last 3 months of your pregnancy, how many cigarettes did you smoke on an
average day? (If none, fill in 00)
Frequency Valid Percent
Zero Cigarettes per day 2,097 53.3
1-10 per day 1,594 40.5
11-20 per day 221 5.6
More than 20 per day 22 0.6

52
21. Have you had any alcoholic drinks in the past 2 years? (A drink is 12 oz. of beer, 4 oz.
of wine, and 1 ½ oz. of liquor)
Frequency Valid Percent
Yes 13,623 71.1
No – SKIP TO Q23 5,550 28.9
22. In the 3 months before you got pregnant, how many alcoholic drinks did you have in
an average week? (If none, fill in 00)
Frequency Valid Percent
Zero drinks per week 3,456 25.4
1-2 drinks per week 6,812 50.2
3-5 drinks per week 2,618 19.3
6-10 drinks per week 545 4.0
More than 10 drinks per week 152 1.1
23. In the last 3 months of your pregnancy, how many alcoholic drinks did you have in an
average week? (If none, fill in 00)
Frequency Valid Percent
Zero drinks per week 13,344 98.0
1-2 drinks per week 225 1.7
3-5 drinks per week 30 0.2
6-10 drinks per week 9 0.1
More than 10 drinks per week 2 0.0

53
PRENATAL CARE
The next questions are about the prenatal care that you received during this pregnancy.
Prenatal care includes visits to a doctor, nurse, or health care worker before your baby was
born for checkups and advice about pregnancy.
24. Some women experience problems getting prenatal care, while others do not. Here is a
list of problems some women can have getting prenatal care. (Mark all that applied
during this pregnancy.)
Frequency Valid Percent
Did not have any problems 17,515 87.4
Couldn’t get appointment when wanted 203 1.0
Difficulty paying for visits 227 1.1
No way to get to doctor’s office or clinic 162 0.8
Couldn’t take time off work 137 0.7
Doctor or health plan wouldn’t start care as early as wanted 78 0.4
Problems signing up for Medicaid/Title 19 223 1.1
Medicaid coverage was dropped during pregnancy 136 0.7
Had no one to take care of my children 102 0.5
Had too many other things going on 140 0.7
Didn’t want anyone to know I was pregnant 51 0.3
Doctor would not take my insurance 49 0.2
Some other problem 107 0.5
25. Were you ever refused prenatal care during this pregnancy?
Frequency Valid Percent
Yes 175 0.9
No – SKIP TO Q27 18,918 99.1

54
26. Why were you refused care? (mark all that apply)
Frequency Valid Percent
Didn’t have insurance 32 18.3
Had problems with insurance 41 23.4
Doctor was not accepting new patients 19 10.9
Unable to find doctor who accepted Medicaid/Title 19 13 7.4
Pregnancy was high risk 27 15.4
Too late in pregnancy to change doctors 17 9.7
Unsure why I was refused care 22 12.6
27. How many months along were you when you went for your first prenatal care visit?
Frequency Valid Percent
0 719 3.8
1 5,671 30.0
2 8,838 46.7
3 2,610 13.8
4 444 2.3
5 214 1.1
6 148 0.8
7 87 0.5
8 113 0.6
9 75 0.4
28. Did you get prenatal care as early in this pregnancy as you wanted?
Frequency Valid Percent
Yes 17,928 94.3
No 977 5.1
No prenatal care 109 0.6

55
29. Where did you go for most of your prenatal care?
Frequency Valid Percent
Private doctor’s office or clinic 14,683 77.6
Midwife’s office or home visit from a midwife 1,286 6.8
Public clinic 2,769 14.6
Other 86 0.5
No prenatal care 108 0.6
30. During any of your prenatal care visits, did a doctor, nurse, or other health care
professional tell you about any of the things listed below? (mark all that apply)
Frequency Valid Percent
How smoking during pregnancy may affect baby 11,774 59.1
Breastfeeding my baby 13,422 67.4
How drinking alcohol during pregnancy may affect baby 10,900 54.7
Using a seatbelt during pregnancy 8,657 43.4
Medicines safe to take during pregnancy 16,790 84.3
How using illegal drugs may affect baby 8,913 44.7
How using prescription medications may affect baby 10,548 52.9
Doing tests on me/baby to screen for birth defects/diseases 16,538 83.0
What to do if feel depressed during pregnancy/after baby born 11,705 58.7
Physical abuse to women by their husbands or partners 6,184 31.0
Signs and symptoms of preterm labor 13,396 67.2
What to do if labor starts early 13,667 68.6
How to monitor changes in baby’s activity during pregnancy 15,605 78.3
What to do if baby had not felt as active as expected 15,449 77.5
Oral health or dental care during pregnancy 8,795 44.1
The Zika virus 7,096 35.6
Not provided with any information listed above 726 3.6

56
31. Were you tested for HIV/AIDS during this pregnancy?
Frequency Valid Percent
Yes 8,727 44.9
No 5,373 27.6
No, offered testing, but didn’t want to be tested 387 2.0
I don’t know 4,969 25.5
32. Did you get a flu shot during this pregnancy?
Frequency Valid Percent
Yes 12,735 65.4
No – Received a flu shot before became pregnant 1,206 6.2
No – Did not want a flu shot during pregnancy 2,519 12.9
No – Doctor said to wait until after pregnancy 130 0.7
No – Do not ever get flu shots 2,528 13.0
No – Flu shot was not available 355 1.8

57
HOSPITAL CARE
33. During the first 24 hours following the birth of your baby, did the hospital staff
encourage you to breastfeed?
Frequency Valid Percent
Yes 16,095 85.0
No 2,382 12.6
Don’t remember 457 2.4
34. During your hospitalization, has a doctor, nurse, or other healthcare professional
discussed any of the following topics? (mark all that apply)
Frequency Valid Percent
Breastfeeding or breastfeeding techniques 16,518 82.4
Action steps to take to decrease frustration when baby cries 8,570 42.8
How to lay my baby down to sleep 11,231 56.1
Dangers of shaking an infant 8,078 40.3
Did not receive information and have not scheduled a time 1,530 7.6
35. In which of the following positions do you plan to lay your baby down to sleep most of
the time?
Frequency Valid Percent
On his/her back 18,109 93.5
On his/her side 386 2.0
On his/her stomach 42 0.2
No preference, whatever seems most comfortable 825 4.3
58
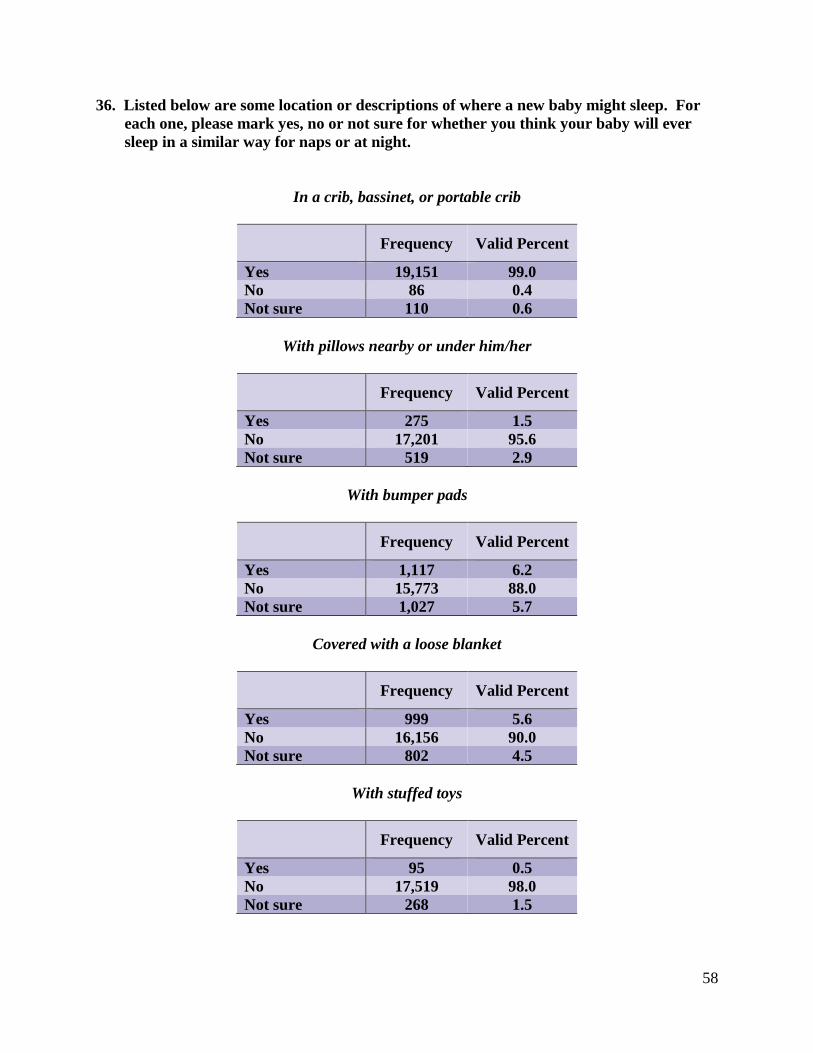
36. Listed below are some location or descriptions of where a new baby might sleep. For
each one, please mark yes, no or not sure for whether you think your baby will ever
sleep in a similar way for naps or at night.
In a crib, bassinet, or portable crib
Frequency Valid Percent
Yes 19,151 99.0
No 86 0.4
Not sure 110 0.6
With pillows nearby or under him/her
Frequency Valid Percent
Yes 275 1.5
No 17,201 95.6
Not sure 519 2.9
With bumper pads
Frequency Valid Percent
Yes 1,117 6.2
No 15,773 88.0
Not sure 1,027 5.7
Covered with a loose blanket
Frequency Valid Percent
Yes 999 5.6
No 16,156 90.0
Not sure 802 4.5
With stuffed toys
Frequency Valid Percent
Yes 95 0.5
No 17,519 98.0
Not sure 268 1.5

59
In a bed with me or another person
Frequency Valid Percent
Yes 706 3.9
No 16,160 89.8
Not sure 1,135 6.3
37. How often do you plan to have your new baby sleep in the same bed, in a reclining
chair or on a couch with you or anyone else? Sleeping would include both at night and
for naps during the day.
Frequency Valid Percent
Daily 1,380 7.2
Weekly 1,180 6.1
Monthly 185 1.0
A few times/year 707 3.7
Do not plan to have baby sleep with me or anyone else 15,754 82.0
38. Please indicate who completed this questionnaire:
Frequency Valid Percent
I completed it alone 14,261 74.6
I completed it with a nurse/other hospital staff
member 99 0.5
I completed it with my husband/partner 4,493 23.5
I completed it with another family member 237 1.2
I completed it with a friend 36 0.2

60
39. What is the current month?
Frequency Valid Percent
January 1,697 8.5
February 1,541 7.7
March 1,783 8.9
April 1,665 8.3
May 1,834 9.2
June 1,773 8.8
July 1,747 8.7
August 1,881 9.4
September 1,635 8.2
October 1,697 8.5
November 1,492 7.4
December 1,290 6.4