2018 census data user guide (second edition)
TRANSCRIPT

2018 Census data user guide
Second edition

Crown copyright © See Copyright and terms of use for our copyright, attribution, and liability statements.
Citation Stats NZ (2021). 2018 Census data user guide (second edition). Retrieved from www.stats.govt.nz.
ISBN 978-1-99-003233-2
Published in January 2021 by Stats NZ Tatauranga Aotearoa Wellington, New Zealand
Contact Stats NZ Information Centre: [email protected] Phone toll-free 0508 525 525 Phone international +64 4 931 4600
www.stats.govt.nz

2018 Census data user guide (second edition)
3
Contents Purpose ............................................................................................................................ 5
What’s new in the second edition...................................................................................... 5
Census processes and procedures ...................................................................................... 5
Who is counted? .................................................................................................................... 5
What geographic area did the census cover? ........................................................................ 5
How was everyone counted in the 2018 Census? ................................................................. 5
Who must fill in a census form? ............................................................................................ 6
How do you protect people’s privacy? .................................................................................. 6
How do you know how many people the census missed? .................................................... 6
How did you decide what to include in the census? ............................................................. 7
Understanding data quality ............................................................................................... 7
How do you manage data quality? ........................................................................................ 7
How do you ensure census data is fit for use? ...................................................................... 8
What are possible sources of error? ...................................................................................... 8
What about missing forms or questions that aren’t answered? ........................................... 9
How can I understand the quality of the 2018 Census data? ................................................ 9
Can I use the data even if the data quality is moderate or poor? ....................................... 10
Does data quality differ depending on the data source? .................................................... 10
Should I treat data differently depending on its source? .................................................... 10
Is iwi data available and what is its quality level? ............................................................... 11
Is family and household data available and what is its quality level? ................................. 11
Using census data ........................................................................................................... 12
How is census data different from survey data? ................................................................. 12
Is 2018 data comparable with 2013 and 2006 Census data? .............................................. 12
What does it mean for time-series comparisons if you used 2013 Census data to fill gaps in the 2018 Census? ................................................................................................................. 12
To what geographic levels can I get census data? ............................................................... 13
Can I get microdata / unit record level data? ...................................................................... 14
Which population count should I use? ................................................................................ 14
What is the difference between census counts, population estimates, and projections? . 14
Why is the subject population important? .......................................................................... 14
What is the difference between a dwelling and a household? ........................................... 17
How do you define occupied and unoccupied dwellings? .................................................. 18

2018 Census data user guide (second edition)
4
What is an absentee? .......................................................................................................... 18
What is repatriation? ........................................................................................................... 18
What are person record types and absentee flags? ............................................................ 19
What are derived variables? ................................................................................................ 20
How are total family and household incomes worked out? ................................................ 20
Why use income bands? ...................................................................................................... 20
Why are totals for some geographic areas different in time-series data including 2018 than in data from previous censuses? ................................................................................. 20
How should I calculate percentages? .................................................................................. 21
What is total response data? ............................................................................................... 22
More information about 2018 Census .............................................................................. 22
List of tables 1 Geographic levels available from census data .............................................................................. 13 2 Census variables/topics by subject population ............................................................................ 15

2018 Census data user guide (second edition)
5
Purpose 2018 Census data user guide provides information about collecting, processing, interpreting, and the ways of using 2018 Census data.
What’s new in the second edition This edition contains updates on the availability of 2018 Census data, including iwi and family and household data. It also has a link to the results of the 2018 Post-enumeration Survey. Additional information to help with understanding the 2018 Census data and its quality has been provided, including the work of the External Data Quality Panel. All information on data quality has been moved into the data quality section.
Census processes and procedures Below are answers to some questions people commonly ask Stats NZ about how we collect and process census data. See also Introduction to the New Zealand Census for more information.
Who is counted? The census aims to count everyone in New Zealand on census night. This includes:
• people on New Zealand soil • people on a vessel in New Zealand waters • people on a passage between New Zealand ports • overseas residents in New Zealand • overseas visitors in New Zealand • people in diplomatic residences including housekeeping staff, uniformed military personnel,
and members of diplomats' families • overseas military personnel and their families located in New Zealand on census night
(including people on our territorial waters).
New Zealand residents who are not in the country on census night are not included in the census.
What geographic area did the census cover? 2018 Census covered the North Island, South Island, Stewart Island, and the Chatham Islands, plus offshore islands, including the Kermadec Islands, Manawatāwhi / Three Kings Islands, Mayor Island (Tuhua), Motiti Island, White Island, Moutohora Island, Bounty Islands, Snares Islands / Tini Heke, Antipodes Islands, Auckland Islands, and Campbell Island / Motu Ihupuku.
How was everyone counted in the 2018 Census? We used a new model where respondents were encouraged to complete the census without field intervention, with online response as the primary response mode.
Under the new model, our collection processes changed from mainly field-based activities to 80 percent mail-out with a reduced field presence and increased communications, marketing, and engagement. Most of the population was encouraged to complete the census online using an internet access code mailed to their households before census night. The new collection model

2018 Census data user guide (second edition)
6
therefore relied on the public to self-respond, rather than wait for a visit from field staff. Field follow-up activities were also planned.
For more information on the changes to delivery and follow-up, see Operational phases of the 2018 Census.
For more information on how we counted everyone in New Zealand, see Overview of statistical methods for adding admin records to the 2018 Census dataset.
Who must fill in a census form? Everyone who is in New Zealand on census night is required to complete a census form under the Statistics Act 1975.
We undertake a programme of communication and engagement to educate the public on the value of the census and encourage a high response rate. For more information on communication programmes, community engagement, and targeted strategies, see Communication, marketing, and engagement strategies for 2018 Census and Targeted field strategies for the 2018 Census.
People who do not participate in the census or who provide false information can be prosecuted.
How do you protect people’s privacy? We use several methods to protect the privacy and confidentiality of individuals who fill in census forms or whose administrative data has been included in the census dataset.
Under the provisions of the Statistics Act 1975, we must ensure that any statistical information published does not identify particulars about any individual or entity. To comply with this, we make the data confidential, balancing the need to protect individuals’ details while providing useful information for users. For more information on how we collect and process data, see Processing and evaluating the quality of 2018 Census data.
We also consider privacy when we add administrative data to the census dataset. For more information on the measures and actions we take to ensure privacy, see Creating the 2018 Census dataset by combining administrative data and census forms data: Our privacy impact assessment.
We usually review our confidentiality rules after each census and update them when necessary. For more information on the latest confidentiality rules see Applying confidentiality rules to 2018 Census data and summary of changes since 2013.
How do you know how many people the census missed? We have undertaken a post-enumeration survey (PES) after each census since 1996. The PES, which is a sample survey carried out at approximately 15,000 private dwellings soon after census day, provides the official estimate of how many people were missed or counted more than once in the census. See Post-enumeration survey: 2018 for the results of the 2018 PES.
For 2018, we also used interim coverage rates – these are provisional and unofficial counts of how many people the census missed based on the best estimate of the population on census day. For more information on interim coverage rates and how their use compares with previous censuses, see 2018 Census: Interim coverage rates, collection response rates, and data sources.

2018 Census data user guide (second edition)
7
How did you decide what to include in the census? To determine census content, we:
• undertook public engagement and consultation – these were the first steps in the 2018 Census content development process
• investigated whether information needs could be met from other data sources • carried out survey development work, including further research, development of the
questionnaires, and testing (testing included cognitive testing of questions, mass completion tests, and two large-scale tests in 2016 and 2017)
• considered questionnaire constraints, real-world change, respondent burden, classification reviews, and international trends.
The topics to be included in the 2018 Census were reviewed to better reflect our customers’ information needs. We undertook a full review of existing content and considered potential new topics for inclusion.
Proposed topics and changes to existing topics were evaluated and ranked using a set of criteria for example, whether the census is the most appropriate information source and whether good quality data can be produced. It was not possible to include all topics or changes to existing topics proposed during consultation and engagement. The amount of content that can be included in a census is limited by constraints such as questionnaire length and respondent burden.
Changes made for 2018 included the addition of questions on usual residence one year ago, housing quality (that is, access to basic amenities, dwelling dampness indicator, dwelling mould indicator), main means of travel to education, and educational institution address. We removed the question on usual residence five years ago from the form, but used 2013 Census data to produce information on this. For more information on content development, the criteria used, and the content changes made for 2018, see the 2018 Census report on final content. For more information on how we developed questions, response options, and online and paper forms, see 2018 Census: Design of forms and Developing the forms for 2018 Census. For the English and bilingual individual and dwelling paper forms (including guide notes), see the Stats NZ Store House.
Understanding data quality Below are answers to some questions people commonly ask Stats NZ about census data quality, such as how we manage data quality and ensure data is fit for use. Links to information on the overall quality of the 2018 Census data and the quality of specific variables are included.
How do you manage data quality? All output variables and topics are assigned a quality priority level: priority 1, 2, or 3. We use these levels to guide the level of quality assurance at all phases of the census. That is, when considering quality (accuracy, relevance, timeliness, consistency, interpretability, and accessibility), time, and resources, priority 1 variables take precedence over priority 2 and priority 3 variables.
For more information on quality management, including priority levels of variables, see 2018 Census data quality management strategy.
2018 Census data user guide (second edition)
8
How do you ensure census data is fit for use? Each census, we work with our customers to understand their information needs and review our product and service mix. For the 2018 Census, we used a quality assurance framework to identify and assess data quality concerns. This included evaluating the variables using a quality rating scale composed of three metrics:
• metric 1 – data sources and coverage • metric 2 – consistency and coherence • metric 3 – data quality.
For more information on the quality assurance framework, including the 2018 Census quality rating scale, see Data quality assurance for 2018 Census.
During our data evaluation phase, we compared the data coming through from processing against what was expected, undertook a series of checks on each variable, and investigated and fixed data quality problems. It is not possible, however, to discover or fix every data quality problem during the evaluation phase, particularly given the wide variety of uses of census data. The priority level of a variable was considered when determining which data quality problems could be fixed. At the end of this process we assigned a quality rating to each variable using our quality rating scale. These quality ratings are provided in Data quality ratings for 2018 Census variables. Information on data quality issues affecting particular variables and recommendations for use is available in the 2018 Census information by variable documents.
For more information on the evaluation phase, see Processing and evaluating the quality of the 2018 Census data.
What are possible sources of error? The census covers the entire population of New Zealand and is not subject to sampling error. Sampling error occurs when a sample of people in the population is surveyed but the group surveyed is not representative of the population of interest. However, census data may be subject to non-sampling errors resulting from respondents, collection or processing, or coverage.
The census is subject to respondent error because it is self-administered, that is, designed to be completed by respondents without an interviewer. Examples of respondent error include misunderstanding a question, accidentally marking the wrong box, or giving a partial response or no response to census questions that were relevant to them. To minimise these errors, census forms have been designed so that questions are as easy to understand and as simple to answer as possible. Online census forms also help minimise respondent errors by ‘piping’ previous responses (that is, copying an earlier response – for example, copying their usual residence address across to relevant sections later in the same form so respondents don’t need to type it multiple times), directing respondents to appropriate questions, alerting the respondent when their response is not valid, and providing suggestions as respondents start typing a text response. For more information on the online form, see 2018 Census: Design of forms. Guide notes (included with paper forms and available online), other online help (including e-queries), the toll-free census helpline number, and assisted completion events are also available to help individuals complete their census forms.
To minimise individuals intentionally distorting information, the importance of the census is communicated through a variety of media channels – such as television, radio, the internet

2018 Census data user guide (second edition)
9
(including social media), and newspapers – and through community engagement and targeted strategies.
Collection errors are errors made when census information (including access codes) and forms are delivered to, or collected from, dwellings in the census dwelling frame (a list of all private and non-private dwellings in New Zealand). These could include assigning a dwelling to an incorrect meshblock, misidentifying a dwelling as occupied or unoccupied, or incorrectly classifying a dwelling as private or non-private. We have checks and balances at different stages of the collection, processing, and evaluation phases to identify and fix these errors. For more information, see Creating the census dwelling frame for the 2018 Census.
Examples of errors that can occur during data processing include incorrectly classifying responses and misrecognising written responses (processing online forms results in fewer of these types of errors). Checks are made during data processing to identify possible errors and correct them if necessary. The data processing phase is followed by a data evaluation phase, where the data is checked further to ensure that it meets quality standards and is fit for use. More information on these phases is available in Processing and evaluating the quality of 2018 Census data. More information on the inclusion of administrative data is available in Overview of statistical methods for adding admin records to the 2018 Census dataset.
While we aim to collect information on everyone living in New Zealand, some people may be missed, and some may be counted more than once. Our collection processes seek to minimise these errors. In most censuses, more people are missed than overcounted, which results in a net undercount. This is measured through the PES (see How do you know how many people the census missed? above).
What about missing forms or questions that aren’t answered? We combined data from the census forms with administrative data to create the 2018 Census dataset, which meets Stats NZ’s quality criteria for population structure information.
We added real data about real people to the dataset where we were confident the people should be counted but hadn’t completed a census form. We also used data from the 2013 Census and administrative sources and statistical imputation methods to fill in some missing characteristics of people and dwellings.
For more information on these processes, see:
• Overview of statistical methods for adding admin records to the 2018 Census dataset • Data sources, editing, and imputation in the 2018 Census • Processing and evaluating the quality of 2018 Census data
For information on how we adjusted for missing information for specific variables, see the 2018 Census information by variable documents.
How can I understand the quality of the 2018 Census data? Data quality for 2018 Census provides information on the quality of the 2018 Census data. An independent panel of experts assessed the quality of the 2018 Census dataset. The panel endorsed Stats NZ’s overall methods and concluded that the use of government administrative records has improved the coverage of key variables such as age, sex, ethnicity, and place. The panel’s Initial Report of the 2018 Census External Data Quality Panel assessed the methodologies used by Stats NZ to produce the final dataset, as well as the quality of some of the key variables. Its second

2018 Census data user guide (second edition)
10
report 2018 Census External Data Quality Panel: Assessment of variables assessed an additional 31 variables.
In its third report, Final report of the 2018 Census External Data Quality Panel, the panel made 24 recommendations, several relating to preparations for the 2023 Census. Along with this report, the panel, supported by Stats NZ, produced a series of graphs summarising the sources of data for key 2018 Census individual variables, 2018 Census External Data Quality Panel: Data sources for key 2018 Census individual variables.
Quick guide to the 2018 Census (updated 16 September 2019) outlines the key changes we introduced as we prepared for the 2018 Census and the changes we made once collection was complete.
Can I use the data even if the data quality is moderate or poor? Variables given a quality rating of poor or moderate (or higher) by Stats NZ are included in standard Stats NZ products and are also available for use via customised requests and microdata (microdata is unit record data accessible via the Data Lab; an application process is required to access this data). The quality rating assigned to each census variable by Stats NZ is shown in Data quality ratings for 2018 Census variables. Where necessary, we indicated any limitations on the use of the data in the 2018 Census information by variable documents.
Does data quality differ depending on the data source? Data quality can vary depending on the data source. For example, data from imputation may be of lower quality than data from census forms, administrative data, or historical (2013 Census) data. However, most of the 2018 Census dataset comes from census forms and data from other sources such as imputation makes up only a small percentage of the data.
Information on the quality of the different data sources for each variable is available in the 2018 Census information by variable documents.
For more information on alternative data sources see:
• Data sources, editing, and imputation in the 2018 Census
• Overview of statistical methods for adding admin records to the 2018 Census dataset
• Processing and evaluating the quality of 2018 Census data • Census transformation – research papers.
Should I treat data differently depending on its source? Unless noted as a data quality concern for a specific variable (see the 2018 Census information by variable documents), we recommend that the dataset be treated as a whole, regardless of data source. That is, while datasets are composed of information from census forms, administrative data, historical data, and/or imputed data, we don’t recommend separating the data by source unless specifically noted in the variable’s information.

2018 Census data user guide (second edition)
11
Is iwi data available and what is its quality level? Iwi data from the 2018 Census was rated as very poor quality and has not been released for use.
Stats NZ is working with technicians from the Data Iwi Leaders Group to review the issues and opportunities with the iwi data collected in the 2018 Census. For information on the progress with this work, see 2018 Census iwi data: October 2020 update.
For more information on the quality of iwi data, see the 2018 Census information by variable for iwi.
Is family and household data available and what is its quality level? Initially the family and household data as a whole was rated very poor quality and was not released, but further investigations showed many of these variables are of better quality than was first thought.
A quality rating has now been assigned to each variable in the family and household suite. Most family and household variables were rated moderate quality and are available via standard Stats NZ products as well as customised requests and microdata. Extended family type was rated poor quality and is available via standard Stats NZ products, customised requests, and microdata.
Two absentee variables and the variables relating to same-sex couples were rated very poor quality and are not included in standard Stats NZ products but are available via customised requests, and microdata. These variables are:
• absentee in New Zealand on census night • absentee time away from New Zealand • type of couple • family type with type of couple • age of older partner in same-sex couple • age of younger partner in same-sex couple.
Families and households in the 2018 Census: Data sources, family coding, and data quality has information on our assessment of the quality of the family and household data and gives the quality rating for each family and household variable.
More information on the quality of the family type, household composition, and extended family type variables is in the 2018 Census information by variable documents for these variables.
For more information on the quality of the absentees data, see the 2018 Census information by variable for absentees. For more information on the quality of the type of couple and same-sex couple data, see Families and households in the 2018 Census: Data sources, family coding, and data quality, and the 2018 Census information by variable for family type.

2018 Census data user guide (second edition)
12
Using census data Below are answers to some questions people commonly ask Stats NZ about using the census data.
How is census data different from survey data? The most important difference is that a census sets out to include information from every person in the country. Therefore, it is not subject to sampling errors that occur in sample surveys (see What are possible sources of error? above).
The census includes a broad range of topics providing good contextual information for individuals, families, and households, unlike other surveys, which have a narrower focus. However, in order to cover such a broad range of topics and maximise response rates, census questions are quick and simple and may not gather information in as much detail or in as much depth as other methods.
The population coverage of census means information is available for much smaller geographic areas – down to statistical area one (SA1) (see Statistical standard for geographic areas 2018) – and for small population groups, for example ethnic groups. Sample surveys only cover a small proportion of the population.
Respondents complete the forms themselves. Like other self-administered questionnaires, this can lead to more truthful responses because the interviewer cannot influence the respondent. However, respondents might not complete the form correctly, which may lead to issues or errors with the data.
For 2018 Census, we also used administrative data, historical data from the 2013 Census, and imputed data to fill in missing information. While there are improvements to the dataset, there are also some limitations for certain variables (see the 2018 Census information by variable documents for more information).
We advise you to understand the strengths and limitations of census data compared with other survey methods before deciding which to use.
Is 2018 data comparable with 2013 and 2006 Census data? Several changes were made for the 2018 Census including new and changed questions on the forms, different collection operations, the introduction of repatriation, and the inclusion of data sources other than census forms for the final dataset.
Due to these changes and the lower than expected response rate, time-series data should be interpreted with care. We recommend users consult the 2018 Census information by variable document for their variable of interest and, when performing time series comparisons and analysis, consider using proportions as the point of comparison rather than specific numbers or percentage change across censuses.
What does it mean for time-series comparisons if you used 2013 Census data to fill gaps in the 2018 Census? Most variables that use 2013 Census data are unlikely to have changed since we collected the data. For example, we used responses in the 2013 Census to ‘birthplace’ and ‘years since arrival in New Zealand’ to fill gaps in the 2018 Census. We also used the usual residence provided in the 2013 Census as the respondent’s location for ‘usual residence five years ago’. This means that, for these

2018 Census data user guide (second edition)
13
variables, the inclusion of data from the 2013 Census improves the quality of the dataset (as compared with no response or imputing the response).
There are, however, some variables where the inclusion of 2013 Census data may be an issue for characteristics that can change over time. For example, we used 2013 Census data to fill gaps for cigarette smoking behaviour. We acknowledge that some people may have changed their smoking behaviour since the data was collected, and we note this in the 2018 Census information by variable for cigarette smoking behaviour.
For more information on data sources and issues with comparability for specific variables, see 2018 Census information by variable.
To what geographic levels can I get census data? 2018 Census data is available at a range of geographic levels, including new statistical geographies. The 2018 Census uses these geographies for all 2018, 2013, and 2006 Census data. For more information on the new geographies, see Statistical standard for geographic areas 2018.
Census data is available in two main ways: • as standard published outputs available from our website, www.stats.govt.nz • as customised data available on request, see Customised data services.
The geographic levels available from these two sources are summarised in Table 1 below.
Table 1 1 Geographic levels available from census data
Geographic levels available from census data
Geographic level Standard published output Customised request Meshblock √
Statistical area 1 (SA1)(1) √ √
Statistical area 2 (SA2)(1) √ √
Urban rural (UR)(1) √
Regional council √ √
Regional council constituency √
Māori constituency √
Territorial authority √ √
Ward √ √
Māori ward √
Community board √
Auckland local board √ √
General electorates √ √
Māori electorates √ √
District health boards √ √
Island indicator √
Statistical area (provincial districts)(2)
√
User defined(3) √

2018 Census data user guide (second edition)
14
1. These are new geographic areas, with SA2 replacing area units and UR replacing urban area. For more information on these geographies see Statistical standard for geographic areas 2018.
2. Statistical areas were established in 1961 and are broad geographic regions used for historical comparability of data from these areas. For more information see Statistical area (Provincial districts) V2.0.0
3. Such as police districts, radius from a specific point, any combination of standard geographies.
Source: Stats NZ
Geographic information for censuses before 2006 is available as a customised request.
Can I get microdata / unit record level data? In addition to standard products and customised requests, we may provide accredited researchers with access to microdata. Microdata is unit-record-level data or data corresponding to information at the respondent level. We present all statistical data in a way that does not identify the particulars about a person, dwelling, or household. This means the microdata is anonymised for use in our Data Lab facilities. The application process for Data Lab access has strict eligibility criteria based on the requirements of the Statistics Act 1975. For more information on applying for access to microdata in the Data Lab see Apply to use microdata for research.
Which population count should I use? For some output variables, data about individuals/people can be reported in two ways:
• census usually resident population count • census night population count.
Most often, the census usually resident population count is used. This is the count of all people who usually live in an area of New Zealand and are present in New Zealand on census night. This count excludes visitors from overseas and residents who are temporarily overseas on census night. New Zealand residents who are away from their usual address on census night are allocated back to the address or area where they usually live and form part of the ‘census usually resident population count’ of the area.
The census night population count is a count of all people present in a given area of New Zealand on census night. This count includes visitors from overseas who are in New Zealand on census night and people who usually live elsewhere in New Zealand but excludes New Zealand residents who are temporarily overseas on census night.
What is the difference between census counts, population estimates, and projections? See Population statistics – user guide for information on the differences between census counts, population estimates, and projections.
Why is the subject population important? The subject population is the individuals, families, households, or dwellings to which variables apply. For example, while the subject population for birthplace is the census night population (as the question applies to everyone in New Zealand on census night), the subject population for years since arrival in New Zealand is the overseas born census usually resident population (as the question does not apply to people born in New Zealand or overseas visitors).

2018 Census data user guide (second edition)
15
When interpreting census data, it is important for users to know what subject population the data is based on, so that any inferences drawn from that data are restricted only to that population group and not generalised outside that population group. Table 2 lists the subject population(s) for each census variable.
Table 2 2 Census variables/topics by subject population
Census variables/topics by subject population
Census variable / topic Subject population Absentees Subject populations for the absentee variables are:
Number of absentees: occupied private dwellings Absentee in New Zealand on census night: absentees from occupied private dwellings Absentee – time away from New Zealand: absentees from occupied private dwellings who are away from New Zealand on census night
Access to basic amenities Occupied private dwellings Access to telecommunication systems
Households in occupied private dwellings
Activity limitations Census usually resident population count aged 5 years and over
Age Census night population count
However, age is usually output for the census usually resident population count.
Birthplace Census night population count
However, birthplace is usually output for the census usually resident population count.
Census night address Census night population count
Census night population count Census night population count
Census usually resident population count
Census usually resident population count
Cigarette smoking behaviour Census usually resident population count aged 15 years and over
Disability indicator Census usually resident population count aged 5 years and over
Dwelling dampness indicator Occupied private dwellings
Dwelling mould indicator Occupied private dwellings
Dwelling occupancy status All dwellings
Dwelling type Occupied dwellings (private and non-private)
Educational institution address Census usually resident population count studying part time or full time in any educational institute, from early education (childcare) to tertiary education
Ethnicity Census night population count
However, ethnicity is usually output for the census usually resident population count.
Extended family type Extended families in households in occupied private dwellings
Family type Families in households in occupied private dwellings
Fuel types used to heat dwellings Occupied private dwellings

2018 Census data user guide (second edition)
16
Census variables/topics by subject population
Census variable / topic Subject population Highest qualification Census usually resident population count aged 15 years and over
Highest secondary school qualification
Census usually resident population count aged 15 years and over
Hours worked in employment per week
Employed census usually resident population count aged 15 years and over
Household composition Households in occupied private dwellings (visitor-only private dwellings are excluded)
Individual home ownership Census usually resident population count aged 15 years and over
Industry Employed census usually resident population count aged 15 years and over
Iwi affiliation Māori descent census usually resident population count
Iwi affiliation data is also collected, where provided, for respondents who selected ‘don’t know’ for Māori descent but provided an iwi affiliation. However, these respondents are not included in the subject population for the iwi affiliation variable.
Languages spoken Census usually resident population count
Legally registered relationship status
Census usually resident population count aged 15 years and over
Main means of travel to education
Census usually resident population count studying part time or full time in any educational institute, from early education (childcare) to tertiary education
Main means of travel to work Employed census usually resident population count aged 15 years and over
Main types of heating used Occupied private dwellings
Māori descent Census usually resident population count
Number of bedrooms Occupied private dwellings
Number of children born Female census usually resident population count aged 15 years and over
Number of motor vehicles Households in occupied private dwellings
Number of rooms Occupied private dwellings
Occupation Employed census usually resident population count aged 15 years and over
Partnership status in current relationship
Census usually resident population count aged 15 years and over
Post-school qualification field of study
Census usually resident population count aged 15 years and over
Post-school qualification level of attainment
Census usually resident population count aged 15 years and over
Religious affiliation Census usually resident population count
Sector of landlord Households in rented occupied private dwellings
Sector of ownership Employed census usually resident population count aged 15 years and over

2018 Census data user guide (second edition)
17
Census variables/topics by subject population
Census variable / topic Subject population Sex Census night population count
However, sex is usually output for the census usually resident population count.
Sources of personal income Census usually resident population count aged 15 years and over
Status in employment Employed census usually resident population count aged 15 years and over
Study participation Census usually resident population count
However, study participation is also output for the census usually resident population count aged 15 years and over.
Tenure of household Households in occupied private dwellings
Total personal income Census usually resident population count aged 15 years and over
Unpaid activities Census usually resident population count aged 15 years and over
Usual residence Census night population count
However, data on usual residence is usually output for the census usually resident population count.
Usual residence five years ago Census usually resident population count
Usual residence one year ago Census usually resident population count
Weekly rent paid by household Households in rented occupied private dwellings
Work and labour force status Census usually resident population count aged 15 years and over
Workplace address Employed census usually resident population count aged 15 years and over
Years at usual residence Census night population count
However, years at usual residence is usually output for the census usually resident population count.
Years since arrival in New Zealand Overseas-born census usually resident population count
See the 2018 Census information by variable documents for more information on variables and subject populations, including any changes from previous censuses.
What is the difference between a dwelling and a household? A dwelling is any building or structure – or its parts – that is used, or intended to be used, for human habitation. Dwellings can be permanent or temporary and include structures such as houses, motels, hotels, prisons, motor homes, huts, and tents.
There can be more than one dwelling within a building; for example, in an apartment building, each separate apartment or unit is considered an independent dwelling.
There are two types of dwellings: • private (for example houses, flats, or apartments) • non-private (for example hotels, hospitals, prisons).

2018 Census data user guide (second edition)
18
‘Dwellings under construction’ includes all houses, flats, and groups or blocks of flats being built.
A household is either one person who usually resides alone, or two or more people who usually reside together and share facilities (such as for eating and cooking, or a living area and bathroom and toilet) in a private dwelling. Included are people who were absent on census night but usually live in a particular dwelling and are members of that household, as long as they were reported as being absent by the reference person on the dwelling form or they have completed their individual form elsewhere and included their usual residence address on that form.
Census collects information on families and households in occupied private dwellings. No family and household data is collected for non-private dwellings.
With the use of administrative data to fill in missing information, the count for total households is now equal to the count for occupied private dwellings (excluding visitor-only dwellings, that is, private dwellings that have no usual residents, such as holiday homes that were occupied on census night). See the 2018 Census information by variable for dwelling occupancy status for more information.
How do you define occupied and unoccupied dwellings? See the 2018 Census information by variable for dwelling occupancy status for a detailed definition of ‘occupied’, ‘unoccupied’, and ‘usually occupied’, including the use of administrative data.
What is an absentee? An absentee is identified on the census dwelling form on paper or the household set-up form online as someone who usually lives in a particular dwelling but had not completed a census individual form there – because the person was elsewhere in New Zealand or overseas on census night. Such a person may have completed a census individual form elsewhere in New Zealand. (Note: People who completed an individual form elsewhere but are not listed as an absentee at their usual residence address are not considered ‘absentees’.)
What is repatriation? On census night, most people complete their individual forms at their usual residence. Some people, however, are somewhere else in New Zealand on census night (for example, staying in a hotel, a campground, or hospital), and they complete their individual form at that location. In previous censuses, this meant that we would have limited information about them that would be linked to their usual residence or to their household. This is because we could only assign the information from these individual forms to a meshblock, rather than to their usual residence address.
For the 2018 Census, we introduced ‘repatriation’. Repatriation is the process of linking individual forms completed by people who were somewhere other than their usual residence on census night to their actual usual residence dwelling.
Some of these people are absentees, that is, listed as an absentee in the paper dwelling form or online household set-up form. In previous censuses, we would only have had the absentees’ age, relationship to reference person, and whether they were in New Zealand or overseas on census night (and if overseas, for how long). While this was used for family coding, we would not have had any more information about them. With repatriation, we now have all the information on their individual form linked to their actual usual residence dwelling. This includes information such as ethnicity, income, and qualifications, for example, of people in a specific family/household.

2018 Census data user guide (second edition)
19
Some people who were repatriated were not listed in the dwelling form / household set-up form as an absentee for their usual residence.
The introduction of repatriation has meant that we needed to change person record types and introduce absentee flags.
What are person record types and absentee flags? Each individual record is assigned a person record type. The person record type determines if the individual record is included in a particular subject population (for example, census usual resident population, or census night population).
In previous censuses we had five person record types:1 1 absentee 3 New Zealand adult 4 New Zealand child 5 overseas adult 6 overseas child.
For the 2018 Census, we expanded the person record types to seven to provide more specific information about the absentee record types:
3 New Zealand adult 4 New Zealand child 5 overseas adult 6 overseas child 7 absentee – in NZ or away from NZ < 12 months adult 8 absentee – in NZ or away from NZ < 12 months child 9 absentee – away from NZ >= 12 months.
This is because we introduced repatriation, as discussed above. In instances where an absentee has completed an individual form elsewhere and we have linked their individual form to their actual usual residence dwelling, they would now be a person record type 3 (New Zealand adult) or 4 (New Zealand child) instead of an absentee record. They can still be identified as absentees on census night, however, by using absentee flags.
Absentee flags include:
0 not an absentee 1 absentee on usual residence dwelling form 2 census night visitor not linked to usual residence dwelling form.
A person who was at their usual residence on census night would have an absentee flag of 0. A person who was listed on a dwelling form or household summary page as being a usual resident absent on census night would have an absentee flag of 1. A person who was listed as a visitor elsewhere and provided a usual residence address but was not listed as an absentee at that address would have an absentee flag of 2.
Absentees who completed an individual form elsewhere in New Zealand and had been repatriated would have a record type of 3 or 4 and an absentee flag of 1. There are, however, absentees who
1 For example, in the 2013 Census. See 2013 Census data dictionary, available from [email protected].

2018 Census data user guide (second edition)
20
may not have completed an individual form elsewhere or who may have been overseas at the time of the census. They will have a person record type of 7, 8, or 9, with an absentee flag of 1.
What are derived variables? Some census output variables are created from responses to individual questions or from a combination of responses given to two or more questions on the census forms. These are called derived variables. For example:
• age is derived from the census question on the date of birth • years since arrival is derived from month and year first arrived in New Zealand • work and labour force status is derived from the questions on job indicator, hours worked,
seeking paid work, job search methods, and availability for work. (For comparison, variables such as sex and total personal income are not derived – that is, we directly ask for this information in questions specific to these variables.)
Derived variables are dependent on the quality of the input variables. Any errors or issues with the input variables are likely to affect the data quality of the derived variable and may be greater when two or more census questions feed into the derived variable. See the 2018 Census information by variable documents for more information on the data quality of derived variables.
How are total family and household incomes worked out? Total family and household incomes are derived from total personal income. Total personal income is the before-tax income of a person in the 12 months ended 6 March 2018. The information is collected as income bands rather than in actual dollars.
Total family income is derived by aggregating the total personal income of all members of the family nucleus who are aged 15 years and over. To calculate total family income, a representative income is worked out for each total personal income range. The representative value for each band is the median value (half are above and half below) for those in that band of the more detailed household economic survey (HES). These median values are then added together.
Household income is calculated in a similar way to family income, except that all people in the household who are aged 15 years and over are included in the calculation.
Why use income bands? The census question on total personal income provides the respondent with a choice of income ranges or bands. This is because asking respondents to state their actual income is a sensitive issue and will often result in a higher level of non-response to the question. Also, it is likely that non-response to a question on the exact amount would be higher than for a question on the income band because many respondents may not know the exact amount but may find it easier to work out their income band. For consistency, data from other sources (for example, administrative data) is also allocated to a band.
Why are totals for some geographic areas different in time-series data including 2018 than in data from previous censuses? Population changes throughout New Zealand lead to changes in geographic boundaries. We produce data from previous census years according to the current census’s geographic boundaries to
2018 Census data user guide (second edition)
21
maintain comparability and allow time-series analysis of census data. This statistical process is called rebasing.
In the process of rebasing, each dwelling and individual within a meshblock split since the previous census is identified and allocated to the new meshblock pattern.
This allows users to compare people and dwellings in the same area between different censuses.
This means that totals for geographic areas, for example SA1s, SA2s, and regional council areas, may change between the censuses.
How should I calculate percentages? When you calculate percentages using census data, it is important to follow these steps.
1. Ensure that the data reflects the correct subject population. For example, when calculating the percentage of regular cigarette smokers, the data needs to refer to the census usually resident population count aged 15 years and over, as this is the correct subject population for this variable.
2. Use the total stated population as the denominator for the calculation – this excludes residual categories (‘not stated’, ‘refused to answer’, ‘response outside scope’, ‘response unidentifiable’, and ‘not elsewhere included’).
3. Where a total stated population specifically appears in the census table, we recommend you use this total stated population as the denominator.
4. Where a total stated population does not appear in the table, we recommend you calculate the total stated population to use as the denominator (as in point 2) by subtracting the residual categories from the total population (people, families, households, or dwellings) mentioned in the table.
5. Several variables have categories that are valid responses and should not be excluded from the total stated population. For example:
o number of children born – ‘object to answer’ is a valid response and is part of the total stated population (it is a tick-box option on the form)
o Māori descent – ‘don’t know’ is a valid response and is part of the total stated population (it is a tick-box option on the form)
o religious affiliation – ‘no religion’ and ‘object to answer’ are valid responses and are part of the total stated population (they are tick-box options on the form).
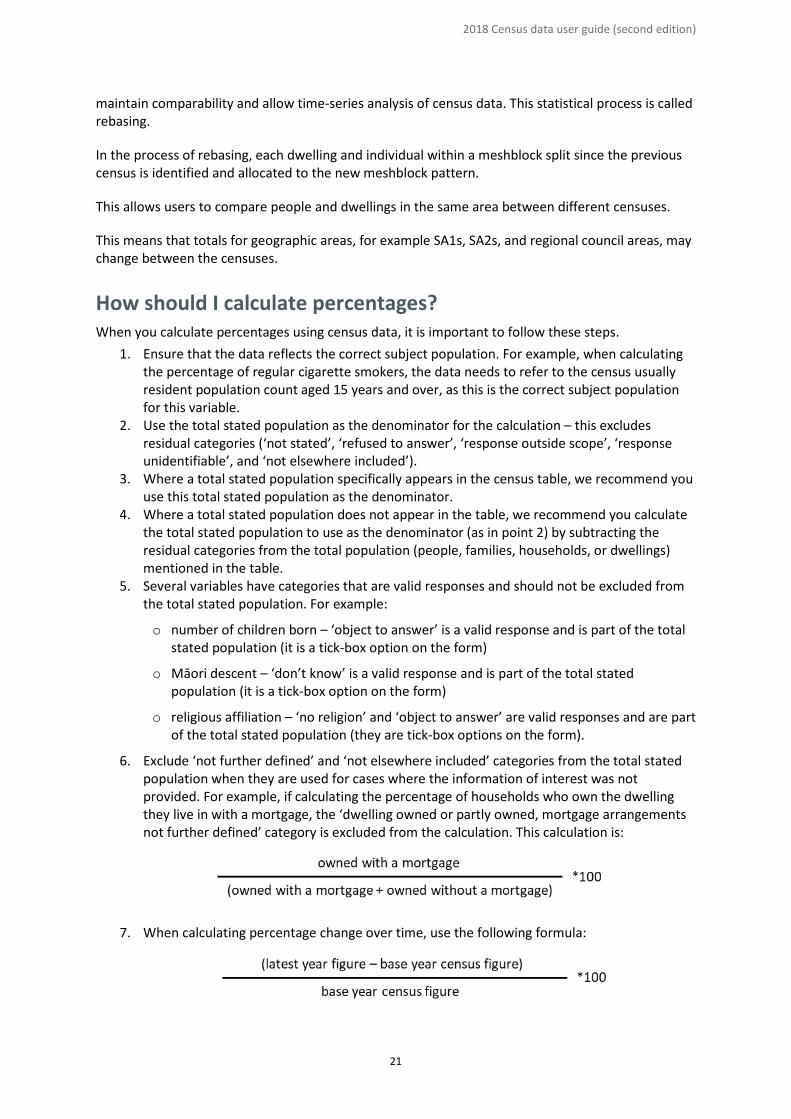
6. Exclude ‘not further defined’ and ‘not elsewhere included’ categories from the total stated population when they are used for cases where the information of interest was not provided. For example, if calculating the percentage of households who own the dwelling they live in with a mortgage, the ‘dwelling owned or partly owned, mortgage arrangements not further defined’ category is excluded from the calculation. This calculation is:
7. When calculating percentage change over time, use the following formula:

2018 Census data user guide (second edition)
22
Note: In published census data, percentages are usually rounded to one decimal place. When percentages are calculated for categories within total response variables (variables for which there can be more than one valid response), they will most likely add to more than 100 percent.
What is total response data? Several census questions give individuals the option to provide more than one response. We work out the total response count or percentage by counting each response given, for example, each ethnic group stated. This means the total response count may add up to more than the count of the subject population for that variable. When calculating percentages for categories within these variables, they will most likely add to more than 100 percent.
Variables that may be output as total responses include: • ethnic group
• languages spoken
• iwi
• religious affiliation
• sources of personal income
• job search methods
• unpaid activities
• sources of family income
• sources of extended family income
• sources of household income
• main types of heating
• access to telecommunication systems
• access to amenities.
Total response variables can also be output as single and combined data, so individuals or dwellings count once in the category that applies to them. For example, for ‘ethnic group’, the categories may be combined to be European only, European/Māori, or Māori/Pacific peoples. This means that the total population will be equal to the usual subject population for that variable, as we count individuals once only.
Examples of variables that can be output as single and combination categories are: • ethnic group
• languages spoken
• main types of heating.
More information about 2018 Census The following publications offer more information on the 2018 and past censuses, as well as definitions, metadata, and other explanatory information about 2018 Census data.
• Introduction to the New Zealand Census outlines the changes to this census, including the digital-first model, new and updated questions, and how we counted people. It also gives an
2018 Census data user guide (second edition)
23
overview of the census, including why we conduct a census and the census cycle. See Operational phases of the 2018 Census for more information about census phases.
• Developing the forms for 2018 Census explains how we developed the forms, online help, and guide notes. A more detailed report on questions can be found in 2018 Census: Design of forms, and the 2018 Census report on final content outlines content changes.
• Information on our approach for adding administrative data records to the 2018 Census dataset is available in:
o Overview of statistical methods for adding admin records to the 2018 Census dataset
o Predicting the quality of admin location information for use in the 2018 Census
o Linking 2018 Census respondents to the Integrated Data Infrastructure.
Data quality assurance for 2018 Census outlines the quality rating scale and quality assurance framework used to assess the quality of data from the 2018 Census and determine whether it is fit for purpose and suitable for release.
Data quality ratings for 2018 Census variables shows the priority level and quality rating of each census variable and has information on the relative contribution of different data sources for individual variables.
The 2018 Census information by variable documents have information about our census data, including non-response rates, data sources, comparability over time, data quality, and recommendations for use.
An External Data Quality Panel was established to provide independent advice on methodologies used for the 2018 Census. Their assessments of the methods used and the quality of the variables in the 2018 Census dataset are available in the following reports:
• Initial Report of the 2018 Census External Data Quality Panel • 2018 Census External Data Quality Panel: Assessment of variables • Final report of the 2018 Census External Data Quality Panel.
You can also contact our Information Centre for further assistance:
Statistics NZ Information Centre: [email protected] Phone toll-free: 0508 525 525 Phone international: +64 4 931 4610 www.stats.govt.nz