2018 - cambridge, ma
TRANSCRIPT

Prepared by:Community Development DepartmentEconomic Development DivisionCity of Cambridge
2018

Jump to...Neighborhood Context
Key Findings and Opportunities
What We Heard from Merchants
What We Heard from Shoppers
Data Appendix
4-5
6-7
8-10
10-13
14-17
Existing conditions, business data, opportunities, and qualitative depictions of the neighborhood were gathered from more than 500 surveys of neighborhood merchants, shoppers, workers, and residents. Additional data gathered in this report comes from data collected from a .25 mile walking distance (also known as a walk-shed) around the commercial district. Boundaries of the Central Square trade area data can be found on page 14 of this report.
In this Report
Acknowledgments
Louis A. DePasquale, City ManagerLisa Peterson, Deputy City Manager
Marc C. McGovern, Mayor Jan Devereux, Vice Mayor Dennis J. Carlone Craig A. KelleyAlanna M. MallonSumbul SiddiquiE. Denise Simmons Timothy J. Toomey, Jr. Quinton Y. Zondervan
Iram Farooq, Assistant City ManagerSandra Clarke, Deputy DirectorChristina DiLisio, Associate Economic Development SpecialistLisa Hemmerle, Director of Economic Development DivisionMichael Rosenberg, Intern, Economic Development DivisionPardis Saffari, Senior Economic Development Specialist
Central Square Business Association
Executive Office City Council Community Development Department Business Association

Purpose of the District Assessment
The purpose of the Central Square Commercial District Assessment is to highlight the neighborhood’s existing business landscape and consumer characteristics. Understanding the current business landscape provides the City and local business associations with a better knowledge of how Central Square visitors and residents utilize the district and how they would like the district to evolve in the future. Data in this report will also assist business owners seeking a location in Central Square, and help current business owners understand potential opportunities for growth.
Key issues and opportunities identified through this assessment will help prioritize the city and local business associations initiatives and serve as an informational and marketing resource for the neighborhood.

4
ABOUT CENTRAL SQUARE
Central Square serves as the traditional downtown for Cambridge, playing many roles as a vibrant, mixed-use district. It is central in many ways—it is the seat of City government, it is mid-way between Harvard to the west and MIT to the east, and it is surrounded by four dense, livable neighborhoods.
The character of Central Square changes along the length of Massachusetts Avenue, with a strong institutional presence at either end. At the heart of the Square, City Hall and the Lombardi Building form the center of Cambridge city government, with the City’s Senior Center across the street, adjacent to the YMCA. Nearby are the YWCA (Temple Street), and offices for the Cambridge Learing Center, Multi-Service Center, and Cambridge Housing Authority in the historic old police station building (Western Avenue). Continuing eastward, in the block between Prospect and Pearl Street, Central Square Station is one of the busiest on the MBTA Red Line, complemented by bus stops for the many lines that link the Square to the broader region.
There are several mixed-use blocks between the Station and Lafayette Square at the intersection of Massachusetts Avenue and Main Street (also known as Jill Brown Rhone Park). Altogether, the Square features a vibrant arts and culture atmosphere created by its numerous ethnic restaurants, interesting shops, small offices, and diverse nightlife. In the daytime, there is a strong business presence in buildings throughout the length of the Square, with a mix of life science, technology and other professional services. In 2012, the Massachusetts Cultural Council (MCC) designated the Square as a Cultural District, one of the first fifteen cultural districts in the state.
Background
Demographics
Future Opportunities
More than 25,000 residents (ESRI Community Analyst, November 2017) of varying ethnicities and incomes call Central Square home. The Square has a large population of Asian (21.2%), African American (15.1%), and Hispanic (10.5%) residents, making it one of the most diverse commercial districts in Cambridge. The Square also includes a large daytime worker population (24,652), bringing in thousands of workers to the Square every day to shop, dine, and explore. For more information on Central Square demographics, refer to page 12 of the report.
Central Square’s growth as a district is tied to a unique set of characteristics that have been cultivated over time: a strong history, transit connectivity, and cultural and social services assets. In recent years, new commercial and residential activity has brought new economic activity to the neighborhood, with more in the pipeline, such as Mass and Main, 10 Essex Street, and 907 Main Street. Meanwhile, the City began implementation of such projects as bicycle safety improvements to Massachusetts Ave. and Western Ave., improvements to storm-water management through the Port Infrastructure Improvements Project, a Warming Center (for unsheltered adults), and the development of a new Cambridge Police Central Square Reporting Station. Through initiatives like the redesign of River Street/Carl Barron Plaza, the community continues to collaborate with public and private partners to ensure these new investments translate into economic opportunity for all Central Square residents and business owners.
Photos: Kyle Klein
Notable Places
GRAFFITI ALLEY
CENTRAL SQUARE T STOP
CITY HALL
CENTRAL FLEA

5
NEIGHBORHOOD CONTEXT
Transportation
Community Events
NeighborhoodMerchant Group
Subway Station
1, CT1, 47, 70A91, 64, 83
Central FleaDumpling FestivalCity Dance Party
Sources: MBTA, Walk ScorePhotos: Central Square Business Association, Hubway
$$
$$
$
$
$$
$$$$
$
$
$
$
$
$
$
$
$
!Û
Û
Û
City Hall
YMCA
FarmersMarket
Graffiti Alley
Central SquareTheater CCTV
PublicLibrary
YWCA
Cambridgeport
MID CAMBRIDGE
THE PORT
MIT
UNIVERSITY PARK
RiversideÛ
Û
Û
ÛÛ
SeniorCenter Û
CambridgeLearning Center
Û
99
97
72
Bike Score
Walk Score
Transit Score
5 Hubway Stations
115,326Weekday
Riders
7 BusRoutes
$!ÛAssessed Commercial District
Point ofInterest
SubwayStation
BusShelter
BusRoute
SubwayLine
KeyItems
Parking*Transit Scores
4 Public ParkingFacilities
405 Parking Spaces
*Note: These numbers do not include the parking lots under construction nor the street metered spaces.
3 Lots & 1 Garage

6
KEY FINDINGS
Strengths
Challenges
Many long standing local businessesVarious governmental and social services availableAccessible to four diverse residential neighborhoodsExcellent transportation accessibility via subway, bus, car, and bike
Businesses and educational institutions that bring thousands of workersState Cultural District DesignationNew residential development bringing in new customers to local businesses
Rapidly increasing commercial rents apply pres-sure to local businesses and their ability to offer affordable goodsReal and perceived safety concerns, both day and night
Large disparity between the number of retail and food options
Considerable foot traffic from social/governmental services and transportation hubs contribute to the strain on public realm maintenance
Changing demographics and consumer preferences require longstanding businesses to adapt in order to grow and better serve a changing clientele
Photos: Kyle Klein (Top Left, Bottom Right) and Gretchen Ertl (Top Center & Right, Bottom Left & Center))
Identified through District Assessment Surveys

7
Opportunities
Attract new businesses to vacant storefronts that meet neighborhood demand for local businesses, affordable food options, and clothing and other general merchandise retailersCreate and market a unified cultural district identity for the Central Square district, including more arts and culture eventsDevelop wayfinding materials and guides to direct more workers, residents, and visitors to the full array of local retail and restaurant options
Continue to clean and maintain the streets and sidewalks across Central Square
Program existing private and public open spaces and add new streetscape amenities and beautification elements
Continue to support services for business owners that plan on growing in place
Photos: Kyle Klein (Bottom center & Right) and Gretchen Ertl (Top row & Bottom Left)

8
BUSINESS LANDSCAPEGround Floor Business Inventory
163Total Number of Storefronts
5%*Storefront Vacancy
*Note: Numbers are based on a ground floor storefront survey conducted in October 2017, some of the vacant properties were under lease negotiations at time of the survey
Storefront & Retail Mix
HotelGeneral Merchandise Stores
Other Miscellaneous Store RetailersFlower StoresGas Stations
Electronics & Cell Phone StoresHealth & Personal Care Stores
Groceries, SupermarketsVintage/Secondhand
Recreation RetailGyms & Recreation
Dance/Theater/TVHardware & Home Goods Stores
Social/Governmental ServicesLaundry Services, Tailoring, Shoe Repair
CaféBodegas & Liquor Stores
Other ServicesMusic/Book/Art Supply
ReligiousVacant/Under Negotiation
Medical ServicesProfessional Services & Real Estate Offices
Hair, Nail, & Beauty Salons/SpasCommercial Banks
Restaurants/Bars 4699
888
7777
66
55
43333
22
11111
Source: Based on Storefront Inventory Survey October 2017 Photos: Gretchen Ertl

9
What We Heard From Central Square Merchants
5
10
15
20
20+10 to 196 to 93 to 50 to 2
17% 14% 14% 14%
40%
Years
Busin
esse
s
How many years have you been in business here?
Own Rent
83%17%
43% 47% 9%Improved Stayed the Same Decreased
Do you Own or Rent your property?
Over the past year, has your business improved, stayed the same, decreased?
How many employees do you have?
% Merchants
Safety 74%Sanitation 60%Parking 55%Community Events/Square Marketing 47%Storefront Improvements 33%Business to Business Communication 24%
% Merchants
Marketing Support 41%Space Improvements 29%Assistance with Regulatory Compliance 15%Training for Staff 9%Financing 6%Legal/Lease Support 0%
What changes need to occur on or around your corridor to attract more shoppers?*
What kind of resources would help you grow your business?*
20 10Average Median
Source: Based on 40 responses to the Central Square Merchant Survey (September 2017)
What changes would you suggest to improve Central Square for residents, pedestrians, and shoppers?
$
Police and Safety Cleanliness Help The Homeless More Events*Note: Respondants were allowed to chse more than one answer, totals may be more than 100%

10
CUSTOMER OUTLOOKWhat We Heard From Shoppers
Othe
r
Scho
ol
Did
Not
Disc
lose
Visit
ing
Recr
eatio
n
Tran
spor
tatio
n
Even
t/Mee
ting
Dini
ng
Wor
k
Shop
ping
/Ser
vices
130122
8173 72
50
32 3023
50
% Shoppers
Food/Groceries 80%Beauty/Personal Care Products 23%Arts/Crafts 22%Wine/Beer/Spirits 22%Clothing 19%Home Goods 17%Accessories 7%Electronics/Gifts 6%
What are the most common items you purchase in Central Square?*
% Shoppers
Restaurant (Sit-Down) 57%Restaurant (Take-Out) 49%Music/Performing Arts Venue 20%Medical 7%Other 6%Pharmacy 5%Hair Salon/Barber 5%Dental 2%
What are the most common services you use in Central Square?*
What is your primary purpose for being in Central Square?*
If not Central Square, where do you shop?
Source: Central Square Customer Intercept Survey (September 2017)
Online Elsewhere in Cambridge Boston Grocery not in the area Other Communities Did not Respond
33% 24% 20% 16% 13% 42%
Note: Percentages for these categories are based on the 58% of survey respondents who responded to this question.
*Note: Respondants were allowed to chse more than one answer, totals may be more than 100%
11
% Shoppers
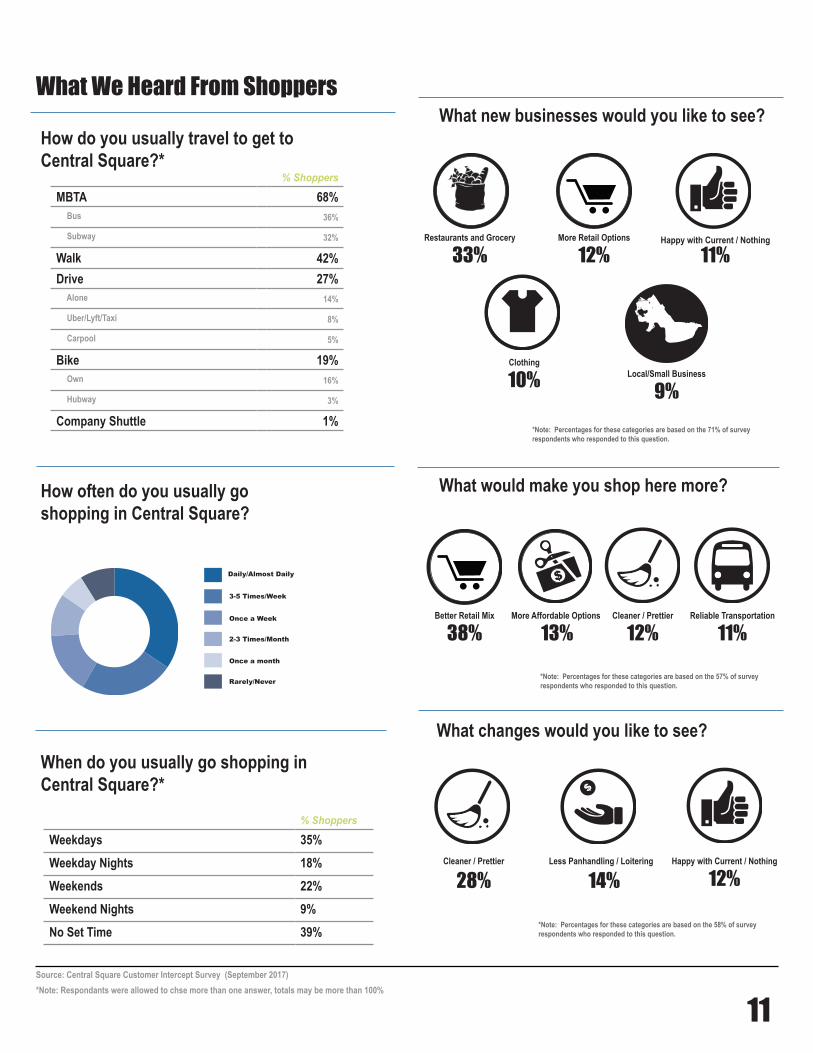
MBTA 68% Bus 36%
Subway 32%
Walk 42%Drive 27% Alone 14%
Uber/Lyft/Taxi 8%
Carpool 5%
Bike 19% Own 16%
Hubway 3%
Company Shuttle 1%
How do you usually travel to get to Central Square?*
When do you usually go shopping in Central Square?*
% Shoppers
Weekdays 35%Weekday Nights 18%Weekends 22%Weekend Nights 9%No Set Time 39%
Rarely/Never
Once a month
2-3 Times/Month
Once a Week
3-5 Times/Week
Daily/Almost Daily
How often do you usually go shopping in Central Square?
Source: Central Square Customer Intercept Survey (September 2017)
What We Heard From ShoppersWhat new businesses would you like to see?
What changes would you like to see?
What would make you shop here more?
Did not Respond
29% *Note: Percentages for these categories are based on the 71% of survey respondents who responded to this question.
Did not Respond
43%
Did not Respond
42%
$
Restaurants and Grocery
33%More Retail Options
12%Happy with Current / Nothing
11%
Clothing
10% Local/Small Business
9%
Better Retail Mix
38%More Affordable Options
13%Cleaner / Prettier
12%Reliable Transportation
11%
*Note: Percentages for these categories are based on the 57% of survey respondents who responded to this question.
$
Cleaner / Prettier
28%Less Panhandling / Loitering
14%Happy with Current / Nothing
12%
*Note: Percentages for these categories are based on the 58% of survey respondents who responded to this question.
*Note: Respondants were allowed to chse more than one answer, totals may be more than 100%

12
DATA APPENDIX
Context AreaCentral Square is defined in two ways in this report. The “Context Area” outlined in the map below refers to the commercial district boundaries identifying the greatest concentration of businesses in the Central Square area. The data presented in the Ground Floor Business Inventory on p.8 refers to businesses located in the Context Area and all surveys were distributed and taken within this boundary. The “Trade Area” represents the location of the residents who live a quarter mile from the Context Area and are most served by the commercial district. Responses from this demographic are reflected in the report’s Appendix, pp.14-16.
Trade Area DemographicsTotal Population
25,788 Central Square
114,866 Cambridge6,884,028 Massachusetts
Average Household Size
Commuting Patterns
Median HouseholdIncome
2.02 Central Square
2.02 Cambridge2.50 Massachusetts
24,652 1,472 11,222Work Live
Work+Live
24,652 Work in Central Square, live elsewhere
1,472 Live & Work in Central Square
11,222 Live in Central Square, work elsewhere
$75,354 Central Square
$77,105 Cambridge$71,460 Massachusetts
Source: ESRI Community Analyst: US Census 2010 ESRI 2017 Estimates (November 2017)
Somerville
Charles River
Source: OnTheMap data 2015 Data based on Origin Destination Employer Statistics
Survey MethodologyA variety of City staff and volunteers surveyed people in Central Square over two weeks in September 2017 during peak times: morning, mid-day, and evening. We received 478 surveys from this effort. Additionally, City staff and the Central Square Business Association conducted a merchant survey. The merchant survey was conducted online and in person, and was available for 4 weeks, starting in mid-September. We received 40 responses to the merchant survey.
Central Square Context Area
Central Square Trade Area
13
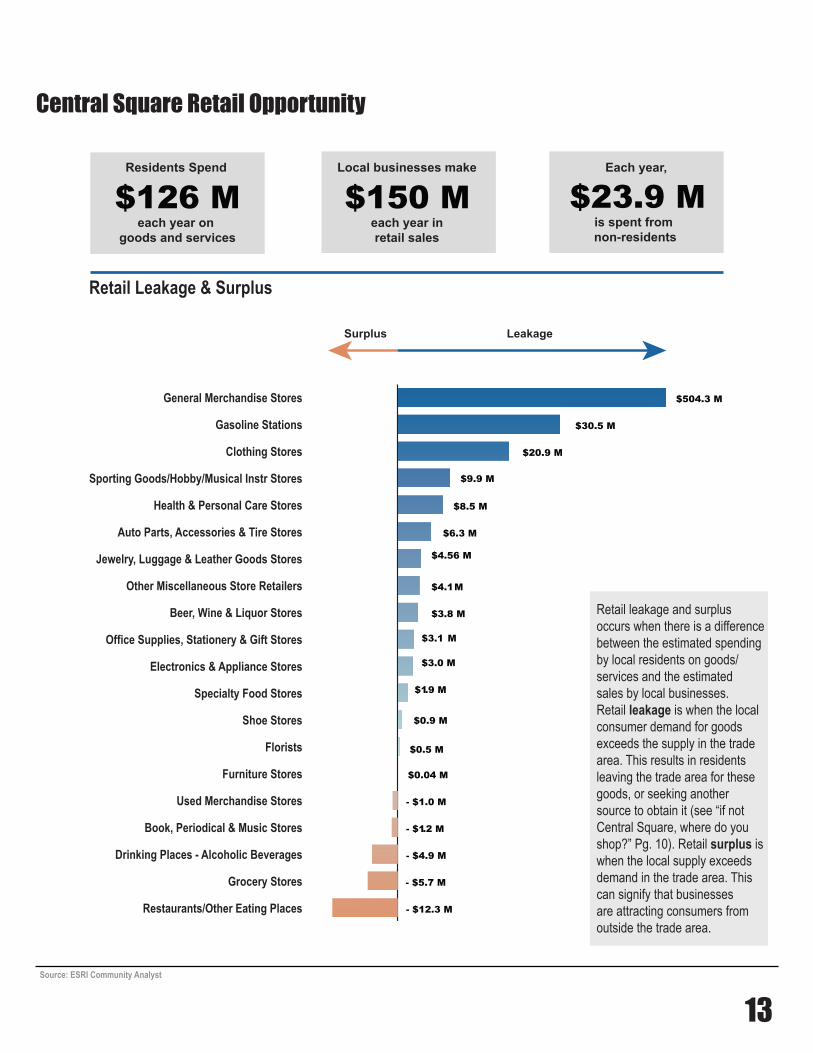
Restaurants/Other Eating Places
Grocery Stores
Drinking Places - Alcoholic Beverages
Book, Periodical & Music Stores
Used Merchandise Stores
Furniture Stores
Florists
Shoe Stores
Specialty Food Stores
Electronics & Appliance Stores
Office Supplies, Stationery & Gift Stores
Beer, Wine & Liquor Stores
Other Miscellaneous Store Retailers
Jewelry, Luggage & Leather Goods Stores
Auto Parts, Accessories & Tire Stores
Health & Personal Care Stores
Sporting Goods/Hobby/Musical Instr Stores
Clothing Stores
Gasoline Stations
General Merchandise Stores $504.3 M
$30.5 M
$20.9 M
$9.9 M
$8.5 M
$6.3 M
$4.56 M
$3.8 M
$3.1 M
$3.0 M
$1.9 M
- $12.3 M
- $5.7 M
- $4.9 M
- $1.2 M
- $1.0 M
$0.04 M
$0.5 M
$0.9 M
$4.1 M
Surplus Leakage
Residents Spend
$126 Meach year on
goods and services
Local businesses make
each year inretail sales
$150 MEach year,
is spent from non-residents
$23.9 M
Central Square Retail Opportunity
Retail Leakage & Surplus
Source: ESRI Community Analyst
Retail leakage and surplus occurs when there is a difference between the estimated spending by local residents on goods/services and the estimated sales by local businesses. Retail leakage is when the local consumer demand for goods exceeds the supply in the trade area. This results in residents leaving the trade area for these goods, or seeking another source to obtain it (see “if not Central Square, where do you shop?” Pg. 10). Retail surplus is when the local supply exceeds demand in the trade area. This can signify that businesses are attracting consumers from outside the trade area.
Trade Area DemographicsTotal Population
Average Household Size
Commuting Patterns
Median HouseholdIncome

14
Survey Respondent Locations
MorePeople
LessPeople
45%Cambridge Residents
NOT PICTUREDOther Places in Massachusetts
New YorkCalifornia
PennsylvaniaMaine
ATLANTICOCEAN
The map below shows the home location of survey participants. They provided their home location by zip code and the most frequent are mapped here. 451 (94%) survey respondents shared their zip code.
Source: Central Square Customer Intercept Survey (September 2017)
77
19
13
8

15
50-59 11%40-49 11%30-39 19%20-29 30%<19 6%
Did not Disclose 4%
60+ 19%
% Shoppers
8%
% Central Square
% Cambridge
13%
21%8%
14%36%
X
9%16%
20%9%
16%30%
X
Black / African American 10%Mixed 5%Hispanic 5%Other 1%White/Caucasian 55%
Did not Disclose 14%
Asian 10%
% Shoppers
15.1%
% Central Square
% Cambridge21.1%
10.5%5.4%
55.3%2.9%
X
12.9%18.9%
9.6%5.1%
60.2%2.8%
X
Male 39%Other 1%Did not Disclose 14%
Female 46%
% Shoppers
51.3%
% Central Square
% Cambridge48.7%
XX
49%50.9%
XX
Other 30%Resident 29%Worker 24%Student 10%Visitor 1%
Did not Disclose 11%
% Shoppers
What is your relationship to Central Square?
What is your age?
What is your race or ethnicity?
What is your gender?
Demographics
Source: ESRI Community Analyst: US Census 2010 ESRI 2017 Estimates (November 2017), Central Square Customer Intercept Survey (September 2017)
Shoppers | Central Square | Cambridge

SourcesESRI and Infogroup, INC. November 2017 ESRI Retail MarketPlace Profile.ESRI and U.S Census Bureau. November 2017 ESRI Community Profile.U.S. Census Bureau. 2015. OnTheMap Application.
Photo Credits: Kyle Klein Photography; Gretchen Ertl Photography; Central Square Business Association
cambridgema.gov/cdd
About the Economic Development Division
The Economic Development Division (EDD) is responsible for a wide range of activities designed to meet the City’s need for a diversified and thriving economic base. EDD does this through promoting thriving commercial districts; cultivating a supportive environment for small, women and minority-owned businesses; and marketing Cambridge as a location for business and maintaining a supportive business climate. EDD offers various resources and services to the businesses community of Cambridge such as site search and selection assistance, one-on-one meetings with staff, various classes and workshops, expert consulting services in various industries, interior improvement grants, ADA accessibility grants, and storefront improvement grants. For more information on any of these programs visit:
cambridgema.gov/business