2018 annual activity report annexes - ec.europa.eu · comp_aar_2018_annexes_final page 4 of 45...
TRANSCRIPT

2018
Annual Activity Report
Annexes
DG Competition
Ref. Ares(2019)3820496 - 14/06/2019

comp_aar_2018_annexes_final Page 2 of 45
Table of Contents
ANNEX 1: STATEMENT OF THE DIRECTOR AND THE HEAD OF UNIT IN CHARGE OF RISK MANAGEMENT AND INTERNAL
CONTROL ............................................................................................................................................ 3 ANNEX 2: REPORTING – HUMAN RESOURCES, BETTER REGULATION, INFORMATION MANAGEMENT AND EXTERNAL
COMMUNICATION ................................................................................................................................. 4 ANNEX 3: DRAFT ANNUAL ACCOUNTS AND FINANCIAL REPORTS ................................................................................ 11 ANNEX 4: MATERIALITY CRITERIA ........................................................................................................................ 21 ANNEX 5: RELEVANT CONTROL SYSTEM ................................................................................................................ 22 ANNEX 6: IMPLEMENTATION THROUGH NATIONAL OR INTERNATIONAL PUBLIC-SECTOR BODIES AND BODIES GOVERNED BY
PRIVATE LAW WITH A PUBLIC SECTOR MISSION (NOT APPLICABLE) ................................................................ 26 ANNEX 7: EAMR OF THE UNION DELEGATIONS (NOT APPLICABLE) ............................................................................ 26 ANNEX 8: DECENTRALISED AGENCIES (NOT APPLICABLE) .......................................................................................... 26 ANNEX 9: EVALUATIONS AND OTHER STUDIES FINALISED OR CANCELLED DURING THE YEAR ............................................ 27 ANNEX 10: SPECIFIC ANNEXES RELATED TO "FINANCIAL MANAGEMENT" ..................................................................... 28 ANNEX 11: SPECIFIC ANNEXES RELATED TO "ASSESSMENT OF THE EFFECTIVENESS OF THE INTERNAL CONTROL SYSTEMS" (NOT
APPLICABLE) ....................................................................................................................................... 30 ANNEX 12: PERFORMANCE TABLES ........................................................................................................................ 31

comp_aar_2018_annexes_final Page 3 of 45
ANNEX 1: Statement of the Director and the Head of
Unit in charge of Risk Management and Internal Control
I declare that in accordance with the Commission’s communication on the internal control
framework1, I have reported my advice and recommendations on the overall state of internal
control in the DG to the Director-General.
I hereby certify that the information provided in Section 2 of the present Annual Activity Report
and in its annexes is, to the best of my knowledge, accurate and complete.
Brussels, 22 March 2019
(e-signed)
Isabelle Bénoliel
I hereby certify that the information provided in Section 1 of the present Annual Activity Report
and in its annexes is, to the best of my knowledge, accurate and complete.
Brussels, 26 March 2019
(e-signed)
Téa Katarina Broms
1 C(2017)2373 of 19.04.2017.

comp_aar_2018_annexes_final Page 4 of 45
ANNEX 2: Reporting – Human Resources, Better
Regulation, Information Management and External Communication
This annex is the annex of section 2.2 "Other organisational management dimensions".
Objective 1: The DG deploys effectively its resources in support of the delivery
of the Commission’s priorities and core business, has a competent and engage
workforce, which is driven by an effective and gender-balanced management
and which can deploy its full potential within supportive and healthy working
conditions
Indicator 1: Percentage of staff who feel that the Commission cares about their
well-being
Source of data: Commission staff survey
Baseline 2014 Target (2020) Latest known results
(2018)
36.5%
(EC=35%)
Maintain above the Commission average (52%
in 2018)
59%
Indicator 2: Staff engagement index
Source of data: Commission staff survey
Baseline 2014 Target (2020) Latest known results
(2018)
68.4% Above 70% and maintain above the Commission
average (68% in 2018)
76%
Indicator 3: First appointments of female Heads of Unit
Source of data: Sysper and DG Competition statistics
Baseline
01/05/2017
Target (01/11/2019)
Latest known results
(01/01/2019)
0 2 first female Heads of Unit appointments 2 first female Heads
of Unit appointments
between 01/05/2017
and 01/01/2019
Objective 2: Attract, motivate, train and retain highly qualified staff and
promote equal opportunities within DG Competition
Indicator 1: Turnover (% of statutory staff leaving DG Competition before three
years in DG Competition)
Source of data: Sysper
Baseline
(2015)
Target (2020) Latest known results
(2018)
3.4% Less than 3.4% 4.2%2
2 This figure includes all statutory staff, i.e. Officials, Temporary Agents and Contract Agents, and thus also
staff with contracts of limited duration. If only AD and AST officials are considered, the percentage of staff leaving DG Competition before three years in DG Competition reaches 2.7%.

comp_aar_2018_annexes_final Page 5 of 45
Indicator 2: Staff engagement index
Source of data: Commission staff survey
Baseline
(2014)
Target (2020) Latest known results
(2018)
68.4 % Above 70% and maintain above the
Commission average (68% in 2018)
76%
Objective 3: Information flows effectively both top-down and bottom-up and
that staff understand Commission and DG Competition's objectives and how
their individual work relates to these objectives
Indicator 1: Understanding by the staff of DG Competition's priorities
Source of data: Commission staff survey
Baseline
(2014)
Target (2016-2020) Latest known results
(2016)
89% Improve the level of staff understanding of DG
Competition's priorities
88%
Indicator 2: Understanding by the staff of DG Competition of their objectives
and tasks
Source of data: Commission staff survey
Baseline
(2014)
Target (2016-2020) Latest known results
(2016)
85% Maintain or increase 86%
Objective: Prepare new policy initiatives and manage the EU's acquis in line
with better regulation practices to ensure that EU policy objectives are achieved
effectively and efficiently
Indicator 1: Percentage of Impact assessments submitted by DG Competition to
the Regulatory Scrutiny Board that received a favourable opinion on first
submission
Explanation: The opinion of the RSB (Regulatory Scrutiny Board) will take into account
the better regulation practices followed for new policy initiatives. Gradual improvement of
the percentage of positive opinions on first submission is an indicator of progress made
by the DG in applying better regulation practices
Source of data: EC
Baseline (2014) Target (2018) Latest known results
(2018)
For DG Competition:
87.5%, RSB positive
opinions on 7 of the 8 IA
submissions in 2014 (68%
Commission average in
2014)
Positive trend For DG Competition:
100%, RSB positive
opinions on 1 of the 1
IA submissions in
20183 (57%4
Commission average
in 2017)
3 Commission Staff Working Document impact assessment accompanying the document Proposal for a
Regulation of the European Parliament and of the Council establishing the Programme for single market, competitiveness of enterprises, including small and medium-sized enterprises, and European statistics and repealing Regulations (EU) No 99/2013, (EU) No 1287/2013, (EU) No 254/2014, (EU) No 258/2014, (EU) No 652/2014 and (EU) No 2017/826. DG Competition was associated in the IA.
See: https://eur-lex.europa.eu/legal-content/EN/TXT/?qid=1540389285918&uri=CELEX%3A52018SC0320. 4 See for further information the Factsheet to the Regulatory Scrutiny Board's Annual Report of the year
2018, not yet available at https://ec.europa.eu/info/sites/info/files/rsb_-factsheet-v7mar_en_0.pdf.

comp_aar_2018_annexes_final Page 6 of 45
Indicator 2: Percentage of the DG's regulatory acquis covered by ex-post
evaluations and Fitness Checks not older than five years
Explanation: Better Regulation principles foresee that regulatory acquis is evaluated at
regular intervals. As evaluations help to identify any burdens, implementation problems,
and the extent to which objectives have been achieved, the availability of performance
feedback is a prerequisite to introduce corrective measures allowing the acquis to stay fit
for purpose
Relevance of Indicator 2: The application of better regulation practices would
progressively lead to the stock of legislative acquis covered by regular evaluations to
increase
Source of data: EC
Baseline (2015) Target (2018) Latest known results
(2018)
25%5 (Percentage of the
DG's regulatory acquis
covered by ex-post
evaluations and Fitness
Checks not older than
seven years)
Positive trend compared to
baseline
25%6
5 The DG's regulatory acquis comprises the following four key instruments: Access to file/complaints
study/evaluation finalised in 2015 (Reg. 1/2003); Council Regulation (EC) No 1/2003 of 16 December 2002 on the implementation of the rules on competition laid down in Articles 81 and 82 of the Treaty, OJ L 1, 4.1.2003, p. 1-25; Council Regulation (EC) No 139/2004 of 20 January 2004 on the control of concentrations between undertakings (the EC Merger Regulation), OJ L 24, 29.1.2004, p. 1-22; Council Regulation (EU) No 733/2013 of 22 July 2013 amending Regulation (EC) No 994/98 on the application of Articles 92 and 93 of the Treaty establishing the European Community to certain categories of horizontal State aid, OJ L 204, 31.7.2013, p. 11-14; Damages Directive, Directive of the European Parliament and of
the Council on certain rules governing actions for damages under national law for infringements of the competition law provisions of the Member States and of the European Union, 2013/0185 (COD) of 26 November 2014, http://ec.europa.eu/competition/antitrust/actionsdamages/damages_directive_final_en.pdf see also webpage of Directive on antitrust damages actions available at http://ec.europa.eu/competition/antitrust/actionsdamages/directive_en.html For the State Aid Modernisation see also http://ec.europa.eu/competition/state_aid/modernisation/index_en.html Of these four key regulatory instruments, one has been evaluated in the last five years (Access to file/complaints study/evaluation finalised in 2015) already. The share of the DG's regulatory acquis covered by evaluations in the last five years was therefore 25% in 2015 and in 2016 (nothing has changed since then).
6 During 2018, the evaluation of the Merger Regulation was ongoing, with the aim to finalise it in 2019. In
addition, in 2018 the Commission launched (1) the evaluation of State aid rules, which were adopted as part of the State Aid Modernisation, the railways guidelines and the short term export credit insurance (“Fitness check”) ; (2) the review of the Emissions trading scheme State aid guidelines (ETS Guidelines) to ensure that they are adapted to the new Emissions Trading Scheme for the period 2021-2030; (3) the evaluation of the Vertical Block Exemption Regulation (VBER); (4) the evaluation of the Motor Vehicle Block Exemption Regulation; (4) the evaluation of Commission Regulation 906/2009 ("the Consortia Block Exemption Regulation") in view of its statutory expiration in April 2020. The finalisation of these evaluations will contribute to a positive trend of regulatory acquis evaluations in the coming years.

comp_aar_2018_annexes_final Page 7 of 45
Objective: Information and knowledge in your DG is shared and reusable by
other DGs. Important documents are registered, filed and retrievable7
Indicator 1 (data provided by DG DIGIT): Percentage of registered documents
that are not filed (ratio)
Baseline (2015)
2.10% (ARES)
0% (EDMA)
Target
N.A. (ARES)
0% (EDMA)
Latest known results
(2018)
13.10% (ARES)
0% (EDMA)
This number reflects only filing and registration in Ares of documents exchanged with
other DGs, because internally DG Competition uses its own registration/document system
(EDMA). In EDMA 100% of documents are filed, including also those that are sent from
EDMA to other DGs via ARES, since filing is mandatory in DG Competition (technically not
possible to save a document into the system EDMA without filing).
Indicator 2: (data provided by DG DIGIT): Percentage of HAN files
readable/accessible by all units in the DG
Source of data: HAN statistic
Baseline (2015)
99.19%
Target
99%
Latest known results
(2018)
99.19%
For this indicator it is not useful to refer to HAN, because inside DG Competition
documents are exchanged and made visible in the DG's own registration/document
system (EDMA), in which 99.19% of files are opened to the whole DG. Note however that
inside the DG security is implemented in EDMA also at the attachment level, and
individual attachments can be and are protected. The target here is not a quality
measure, but reflects a policy decision taken in DG Competition on accessibility.
Indicator 3: (data provided by DG DIGIT): Percentage of HAN files shared with
other DGs
Source of data: HAN statistics
Baseline (2015)
0,04%
Target
<1%
Latest known results
(2018)
0%
Files created by DG COMP in HAN are by default not shared with other DGs, since
documents are exchanged in the framework of cases. In its own registration/document
system (EDMA), no file is shared with another DG. Competition regulations set out a
strict professional secrecy obligation and limitations on use of data for any other
purposes than competition cases.
In the new Case Management Application currently under development, COMP will assess
if some horizontal files could be shared.
Indicator 4: Percentage of units using collaborative tools to manage their
activities
Source of data: DG Competition
Baseline (2015)
95%
Target
100%
Latest known results
(2018)
100%
The percentage represent the proportion of units using either the COMP Collaborative
Platform or eDiscovery.
7 As for indicator “Number of documents eligible to an electronic validation circuit”, the estimated number
(80%) of documents eligible to an electronic validation circuit remains unchanged. Therefore, DG Competition opted not to report on it.

comp_aar_2018_annexes_final Page 8 of 45
Indicator 5: Number of cases where an important document could not be
retrieved and resulted in a report to the DMO (register of "exceptions" to be
created)
Source of data: DG Competition
Baseline (2015)
0
Target
0
Latest known results
(2018)
0
Objective: Timely and effective handling of requests for information under
Regulation 1049/2001
Output indicator: Respect of the time-limits for replies
Source of data: GESTDEM – corporate application managing access to document
requests
Baseline (2014)
87%8
Target
100%
Latest known results
(2018)
93%
Objective: Enhance paperless document exchanges (e-Commission) with 3rd
parties
Result indicator: Incrementing paperless exchanges with Member States and
external stakeholders
Source of data: DG Competition's document management and electronic communication
systems (EDMA)
Baseline (2015)
95%
Target
99%
Latest known results
(2018)
97.65%
Objective: IT rationalisation in sub-domain for Case Management Systems (led
by DG Competition)
Indicator: Implementation of a common Case Management System for the
Commission services participating in CASE@EC project (KPI 4)
Source of data: Reports to the Inter-Service Steering Committee of the project
Baseline
(2015)
Target (2018)
Latest known results (2018)
Conclusion of
the Inception
phase, start
of the tender
process.
Completed implementation of the first
version of the new common Case
Management System.
User acceptance testing of
the first version, in view of
its release into production
by March 2019.
8 DG Competition is one of the Commission services receiving most requests for access to documents under
Regulation 1049/2001. DG Competition aims to handle all requests for access to documents efficiently and within the time limits set in the Regulation. In 2018, the number of requests managed by DG Competition remained high (405 requests), continuing at the same time to ensure clarity in application of the public access principles through explanations provided in any access refusal letters.
comp_aar_2018_annexes_final Page 9 of 45
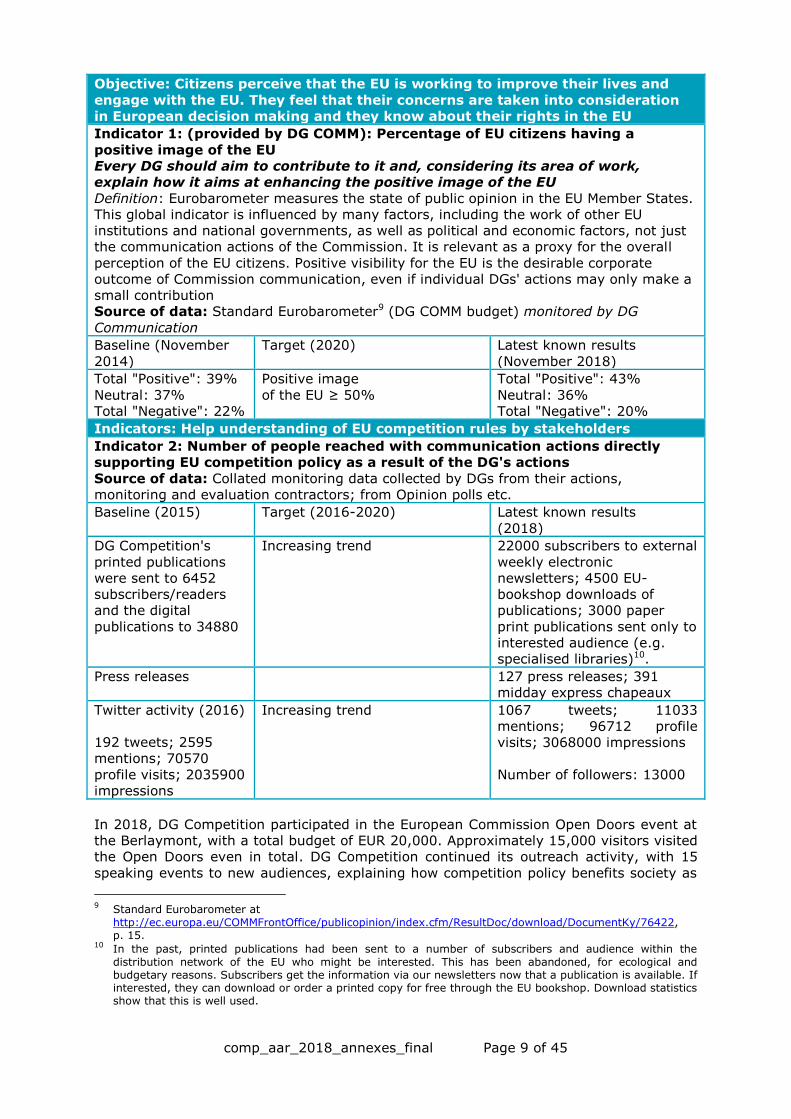
Objective: Citizens perceive that the EU is working to improve their lives and
engage with the EU. They feel that their concerns are taken into consideration
in European decision making and they know about their rights in the EU
Indicator 1: (provided by DG COMM): Percentage of EU citizens having a
positive image of the EU
Every DG should aim to contribute to it and, considering its area of work,
explain how it aims at enhancing the positive image of the EU
Definition: Eurobarometer measures the state of public opinion in the EU Member States.
This global indicator is influenced by many factors, including the work of other EU
institutions and national governments, as well as political and economic factors, not just
the communication actions of the Commission. It is relevant as a proxy for the overall
perception of the EU citizens. Positive visibility for the EU is the desirable corporate
outcome of Commission communication, even if individual DGs' actions may only make a
small contribution
Source of data: Standard Eurobarometer9 (DG COMM budget) monitored by DG
Communication
Baseline (November
2014)
Target (2020) Latest known results
(November 2018)
Total "Positive": 39%
Neutral: 37%
Total "Negative": 22%
Positive image
of the EU ≥ 50%
Total "Positive": 43%
Neutral: 36%
Total "Negative": 20%
Indicators: Help understanding of EU competition rules by stakeholders
Indicator 2: Number of people reached with communication actions directly
supporting EU competition policy as a result of the DG's actions
Source of data: Collated monitoring data collected by DGs from their actions,
monitoring and evaluation contractors; from Opinion polls etc.
Baseline (2015) Target (2016-2020) Latest known results
(2018)
DG Competition's
printed publications
were sent to 6452
subscribers/readers
and the digital
publications to 34880
Increasing trend 22000 subscribers to external
weekly electronic
newsletters; 4500 EU-
bookshop downloads of
publications; 3000 paper
print publications sent only to
interested audience (e.g.
specialised libraries)10.
Press releases 127 press releases; 391
midday express chapeaux
Twitter activity (2016)
192 tweets; 2595
mentions; 70570
profile visits; 2035900
impressions
Increasing trend 1067 tweets; 11033
mentions; 96712 profile
visits; 3068000 impressions
Number of followers: 13000
In 2018, DG Competition participated in the European Commission Open Doors event at
the Berlaymont, with a total budget of EUR 20,000. Approximately 15,000 visitors visited
the Open Doors even in total. DG Competition continued its outreach activity, with 15
speaking events to new audiences, explaining how competition policy benefits society as
9 Standard Eurobarometer at
http://ec.europa.eu/COMMFrontOffice/publicopinion/index.cfm/ResultDoc/download/DocumentKy/76422, p. 15.
10 In the past, printed publications had been sent to a number of subscribers and audience within the
distribution network of the EU who might be interested. This has been abandoned, for ecological and budgetary reasons. Subscribers get the information via our newsletters now that a publication is available. If interested, they can download or order a printed copy for free through the EU bookshop. Download statistics show that this is well used.

comp_aar_2018_annexes_final Page 10 of 45
a whole, and how competition policy can help stakeholders. DG COMP staff also spoke to
50 groups in the Commission Visitors’ Centre.

comp_aar_2018_annexes_final Page 11 of 45
ANNEX 3: Draft annual accounts and financial reports
Annex 3 Financial Reports - DG COMP - Financial Year 2018
Table 13 : Building Contracts
Table 14 : Contracts declared Secret
Table 15 : FPA duration exceeds 4 years
Table 1 : Commitments
Table 2 : Payments
Table 3 : Commitments to be settled
Table 8 : Recovery of undue Payments
Table 9 : Ageing Balance of Recovery Orders
Table 10 : Waivers of Recovery Orders
Table 11 : Negotiated Procedures (excluding Building Contracts)
Table 12 : Summary of Procedures (excluding Building Contracts)
Table 4 : Balance Sheet
Table 5 : Statement of Financial Performance
Table 5 Bis: Off Balance Sheet
Table 6 : Average Payment Times
Table 7 : Income

comp_aar_2018_annexes_final Page 12 of 45
* Commitment appropriations authorised include, in addition to the budget voted by the legislative authority, appropriations carried over from the previous exercise, budget amendments as well as miscellaneous commitment appropriations for the period (e.g. internal and external assigned revenue).
0%
20%
40%
60%
80%
100%
120%
03 01 05 01 11 01 11 06 16 01 33 03
=”% Outturn on commitment appropriations”
Commitment
appropriations
authorised*
Commitments
made%
1 2 3=2/1
03 03 01Administrative expenditure of the
'Competition' policy area12,26 10,92 89,08 %
12,26 10,92 89,08 %
05 05 01Administrative expenditure of the 'Agriculture
and rural development' policy area0,10 0,10 100,00 %
0,10 0,10 100,00 %
11 11 01Administrative expenditure of the 'Maritime
affairs and fisheries' policy area0,05 0,05 100,00 %
11 06European Maritime and Fisheries Fund
(EMFF)0,05 0,05 100,00 %
0,10 0,10 100,00 %
16 16 01Administrative expenditure of the
'Communication' policy area0,12 0,12 100,00 %
0,12 0,12 100,00 %
33 33 03 Justice 1,00 1,00 100,00 %
1,00 1,00 100,00 %
13,58 12,24 90,14 %
Title 33 Justice and consumers
TABLE 1: OUTTURN ON COMMITMENT APPROPRIATIONS IN 2018 (in Mio €)
Total Title 33
Total DG COMP
Title 03 Competition
Total Title 03
Title 05 Agriculture and rural development
Total Title 05
Title 11 Maritime affairs and fisheries
Total Title 11
Title 16 Communication
Total Title 16

comp_aar_2018_annexes_final Page 13 of 45
* Payment appropriations authorised include, in addition to the budget voted by the legislative authority, appropriations carried over from the previous exercise, budget amendments as well as miscellaneous payment appropriations for the period (e.g. internal and external assigned revenue).
Payment
appropriations
authorised *
Payments
made%
1 2 3=2/1
03 03 01 Administrative expenditure of the 'Competition' policy area 18,42 7,66 41,59 %
18,42 7,66 41,59 %
05 05 01Administrative expenditure of the 'Agriculture and rural
development' policy area0,15 0,05 31,00 %
0,15 0,05 31,00 %
11 11 01Administrative expenditure of the 'Maritime affairs and
fisheries' policy area0,10 0,05 48,98 %
11 06 European Maritime and Fisheries Fund (EMFF) 0,02 0,01 57,36 %
0,12 0,06 50,59 %
16 16 01Administrative expenditure of the 'Communication' policy
area0,23 0,15 65,79 %
0,23 0,15 65,79 %
20 20 02 Trade policy 0,15 0,15 100,00 %
0,15 0,15 100,00 %
33 33 03 Justice 1,24 0,55 44,16 %
1,24 0,55 44,16 %
20,31 8,62 42,42 %
TABLE 2: OUTTURN ON PAYMENT APPROPRIATIONS IN 2018 (in Mio €)
Total DG COMP
Chapter
Title 03 Competition
Title 05 Agriculture and rural development
Title 11 Maritime affairs and fisheries
Title 16 Communication
Title 20 Trade
Title 33 Justice and consumers
Total Title 03
Total Title 05
Total Title 11
Total Title 16
Total Title 20
Total Title 33

comp_aar_2018_annexes_final Page 14 of 45
Commitments to
be settled from
Total of
commitments to
be settled at end
Total of
commitments to
be settled at end
Commitments
2018
Payments
2018RAL 2018 % to be settled
financial years
previous to
2018
of financial year
2018
of financial year
2017
1 2 3=1-2 4=1-2/1 5 6=3+5 7
03 03 01 10,92 3,12 7,80 71,46 % 0,00 7,80 6,41
10,92 3,12 7,80 71,46 % 0,00 7,80 6,41
05 05 01 0,10 0,00 0,10 100,00 % 0,00 0,10 0,05
0,10 0,00 0,10 100,00 % 0,00 0,10 0,05
11 11 01 0,05 0,00 0,05 100,00 % 0,00 0,05 0,05
11 06 0,05 0,00 0,05 100,00 % 0,04 0,09 0,05
0,10 0,00 0,10 100,00 % 0,04 0,14 0,10
16 16 01 0,12 0,05 0,07 54,47 % 0,00 0,07 0,11
0,12 0,05 0,07 54,47 % 0,00 0,07 0,11
20 20 02 0,00 0,00 0,00 0,00 % 0,00 0,00 0,15
0,00 0,00 0,00 0,00 % 0,00 0,00 0,15
33 33 03 1,00 0,00 1,00 100,00 % 2,84 3,84 3,39
1,00 0,00 1,00 100,00 % 2,84 3,84 3,39
12,24 3,17 9,07 74,09 % 2,88 11,95 10,21Total DG COMP
Chapter
Administrative expenditure of the
'Agriculture and rural development' policy
area
Administrative expenditure of the
'Maritime affairs and fisheries' policy area
European Maritime and Fisheries Fund
(EMFF)
Administrative expenditure of the
'Communication' policy area
Trade policy
Justice
Administrative expenditure of the
'Competition' policy area
2018 Commitments to be settled
Title 05 Agriculture and rural development
Title 11 Maritime affairs and fisheries
Title 16 Communication
Total Title 03
TABLE 3 : BREAKDOWN OF COMMITMENTS TO BE SETTLED AT 31/12/2018 (in Mio €)
Title 03 Competition
Total Title 05
Total Title 11
Total Title 16
Total Title 20
Total Title 33
Title 20 Trade
Title 33 Justice and consumers
0
1
2
3
4
5
6
7
8
9
03 01 05 01 11 01 11 06 16 01 20 02 33 03
=”Breakdown of commitments to be settled at 31/12/2018 (in Mio €)”

comp_aar_2018_annexes_final Page 15 of 45
It should be noted that the balance sheet and statement of financial performance presented in Annex 3 to this Annual Activity Report, represent only the assets, liabilities, expenses and revenues that are under the control of this Directorate General. Significant amounts such as own resource revenues and cash held in Commission bank accounts are not included in this Directorate General's accounts since they are managed centrally by DG Budget, on whose balance sheet and statement of financial performance they appear. Furthermore, since the accumulated result of the Commission is not split amongst the various Directorates General, it can be seen that the balance sheet presented here is not in equilibrium. Additionally, the figures included in tables 4 and 5 are provisional since they are, at this date, still subject to audit by the Court of Auditors. It is thus possible that amounts included in these tables may have to be adjusted following this audit.
2018 2017
4.937.603,94 1.373.426,94
4.937.603,94 1.373.426,94
11.891.752.037,42 6.421.226.831,46
818.797,44 619.272,01
11.890.933.239,98 6.420.607.559,45
11.896.689.641,36 6.422.600.258,40
0,00 -27.276.000,00
0,00 -27.276.000,00
-468.192,11 -359.852,47
0,00
-468.192,11 -359.852,47
0,00 0,00
-468.192,11 -27.635.852,47
11.896.221.449,25 6.394.964.405,93
-11.647.658.103,01 -7.163.505.061,62
-248.563.346,24 768.540.655,69
0,00 0,00
TABLE 4 : BALANCE SHEET COMP
BALANCE SHEET
A.I. NON CURRENT ASSETS
A.II. CURRENT ASSETS
P.I.2. Non-Current Provisions
A.I.1. Intangible Assets
A.II.2. Current Pre-Financing
A.II.3. Curr Exch Receiv &Non-Ex Recoverables
TOTAL
ASSETS
P.I. NON CURRENT LIABILITIES
P.II. CURRENT LIABILITIES
LIABILITIES
NET ASSETS (ASSETS less LIABILITIES)
P.II.2. Current Provisions
P.II.4. Current Payables
P.II.5. Current Accrued Charges &Defrd Income
P.III.2. Accumulated Surplus/Deficit
Non-allocated central (surplus)/deficit*
A.I. NON CURRENT ASSETS
A.II. CURRENT ASSETS
P.I. NON CURRENT LIABILITIES
P.II. CURRENT LIABILITIES

comp_aar_2018_annexes_final Page 16 of 45
It should be noted that the balance sheet and statement of financial performance presented in Annex 3 to this Annual Activity Report, represent only the assets, liabilities, expenses and revenues that are under the control
of this Directorate General. Significant amounts such as own resource revenues and cash held in Commission bank accounts are not included in this Directorate General's accounts since they are managed centrally by DG Budget, on whose balance sheet and statement of financial performance they appear. Furthermore, since the accumulated result of the Commission is not split amongst the various Directorates General, it can be seen that the balance sheet presented here is not in equilibrium. Additionally, the figures included in tables 4 and 5 are provisional since they are, at this date, still subject to audit by the Court of Auditors. It is thus possible that amounts included in these tables may have to be adjusted following this audit.
STATEMENT OF FINANCIAL PERFORMANCE 2018 2017
II.1 REVENUES -6.568.250.847,40 -4.562.186.558,51
II.1.1. NON-EXCHANGE REVENUES -6.561.211.000,00 -4.555.901.000,00
II.1.1.4. FINES -6.533.935.000,00 -4.555.901.000,00
II.1.1.6. OTHER NON-EXCHANGE REVENUES -27.276.000,00
II.1.2. EXCHANGE REVENUES -7.039.847,40 -6.285.558,51
II.1.2.2. OTHER EXCHANGE REVENUE -7.039.847,40 -6.285.558,51
II.2. EXPENSES 8.617.553,33 78.033.517,12
II.2. EXPENSES 8.617.553,33 78.033.517,12
II.2.10.OTHER EXPENSES 8.664.482,64 78.435.536,71
II.2.2. EXP IMPLEM BY COMMISS&EX.AGENC. (DM) 374.910,37 403.645,41
II.2.6. STAFF AND PENSION COSTS -422.040,00 -805.665,00
II.2.8. FINANCE COSTS 200,32
STATEMENT OF FINANCIAL PERFORMANCE -6.559.633.294,07 -4.484.153.041,39
TABLE 5 : STATEMENT OF FINANCIAL PERFORMANCE COMP
OFF BALANCE 2018 2017
OB.2. Contingent Liabilities -1.742.400.000,00
OB.2.7. CL Legal cases OTHER -1.742.400.000,00
OB.4. Balancing Accounts 1.742.400.000,00 589.515.221,00
OB.4. Balancing Accounts 1.742.400.000,00 589.515.221,00
OFF BALANCE 0,00 589.515.221,00
TABLE 5bis : OFF BALANCE SHEET COMP

comp_aar_2018_annexes_final Page 17 of 45
Percentage
Average
Payment
Times
(Days)
Nbr of Late
PaymentsPercentage
97,49 % 13,43 10 2,51 %
100,00 % 26,95
97,62 % 10 2,38 %
14,12
15,48
% of Total
Number
Total
Number of
Payments
Amount of
Suspended
Payments
% of Total
Amount
3,33 % 420 1.073.754,69 9,56 %
15,41
16,73
Average
Payment
Suspension
Days
40
Number of
Suspended
Payments
14
60
Total Number
of Payments
21
420
21
410
68,2
68,2
Total Paid Amount
11.229.976,71
TABLE 6: AVERAGE PAYMENT TIMES FOR 2018 - DG COMP
Legal Times
Maximum
Payment Time
(Days)
30
Total Number
of Payments
399
Nbr of
Payments
within Time
Limit
389
Average Payment
Times (Days)
68,2
Average Net
Payment Time
Average Gross
Payment Time
Suspensions
Average
Report
Approval
Suspension
Days
0

comp_aar_2018_annexes_final Page 18 of 45
Outstanding
Chapter Current year RO Carried over RO Total Current Year RO Carried over RO Total balance
1 2 3=1+2 4 5 6=4+5 7=3-6
57
OTHER CONTRIBUTIONS AND REFUNDS IN
CONNECTION WITH THE ADMINISTRATIVE
OPERATION OF THE INSTITUTION
174.137,83 0,00 174.137,83 174.137,83 0,00 174.137,83 0,00
66 OTHER CONTRIBUTIONS AND REFUNDS 0,00 2.806.244,94 2.806.244,94 0,00 95.878,25 95.878,25 2.710.366,69
71 FINES AND PENALTIES 6.523.291.001,00 7.712.173.333,94 14.235.464.334,94 692.834.304,45 510.399.225,77 1.203.233.530,22 13.032.230.804,72
6.523.465.138,83 7.714.979.578,88 14.238.444.717,71 693.008.442,28 510.495.104,02 1.203.503.546,30 13.034.941.171,41
TABLE 7 : SITUATION ON REVENUE AND INCOME IN 2018
Total DG COMP
Revenue and income recognized Revenue and income cashed from
Year of Origin
(commitment)Nbr RO Amount Nbr RO Amount
Sub-Total
EXPENSES BUDGET
Nbr Amount Nbr Nbr Amount Nbr Amount Nbr Amount Nbr Amount
INCOME LINES IN
INVOICES
NON ELIGIBLE IN COST
CLAIMS3 49.736,72
CREDIT NOTES 5 169.085,32
Sub-Total 8 218.822,04
GRAND TOTAL 8 218.822,04
RO Amount
OLAF Notified
Amount
TABLE 8 : RECOVERY OF PAYMENTS
(Number of Recovery Contexts and corresponding Transaction Amount)
Total undue
payments recovered
Error
Total transactions in
recovery context
(incl. non-qualified)
Nbr
Irregularity
% Qualified/Total RC
Total undue payments
recovered
Total transactions in
recovery context
(incl. non-qualified)
% Qualified/Total RC

comp_aar_2018_annexes_final Page 19 of 45
Number at
01/01/2018Evolution
Open Amount (Eur)
at 01/01/2018
2003 1 0,00 % 1.060.000,00
2005 1 0,00 % 670.000,00
2006 1 0,00 % 11.500.000,00
2009 5 -20,00 % 1.089.577.168,72
2010 25 -48,00 % 188.087.631,94
2011 3 -33,33 % 145.473.194,00
2012 12 -100,00 % 135.093.000,00
2013 13 -7,69 % 253.403.000,00
2014 38 -13,16 % 923.280.508,00
2015 30 -13,33 % 238.811.000,00
2016 5 0,00 % 496.847.000,00
2017 36 -33,33 % 4.239.586.076,22
2018
170 -18,82 % 7.723.388.578,88
-0,47 %
-0,23 %
-1,37 %
68,88 %
-89,79 %
-100,00 %
-0,45 %
-5,82 %
Evolution
0,00 %
0,00 %
0,00 %
-1,89 %
-58,05 %
5.830.456.696,55
13.043.350.171,41
Open Amount (Eur)
at 31/12/2018
1.060.000,00
670.000,00
11.500.000,00
1.068.981.290,47
78.895.783,13
252.271.000,00
869.549.126,21
237.691.000,00
495.721.467,68
4.181.698.076,22
138
Number at
31/12/2018
1
1
1
4
13
33
26
5
24
16
TABLE 9: AGEING BALANCE OF RECOVERY ORDERS AT 31/12/2018 FOR COMP
2
12
14.855.731,15
Waiver Central
Key
Linked RO
Central KeyComments
Commission
Decision
TABLE 10 : RECOVERY ORDER WAIVERS IN 2018 >= EUR 60.000
Number of RO waivers
RO Accepted
Amount
(Eur)
LE Account Group
0

comp_aar_2018_annexes_final Page 20 of 45
N/A
N/A
N/A
Internal Procedures > € 60,000
Negotiated Procedure Legal baseNumber of
ProceduresAmount (€)
Art. 134.1(b) (Without prior publication) Technical or artistic reasons, or reasons
connected with the protection of exclusive rights1 90.000,00
Total 1 90.000,00
TABLE 11 : CENSUS OF NEGOTIATED PROCEDURES - DG COMP - 2018
Procedure legal baseNumber of
proceduresAmount (€)
Exceptional Negotiated Procedure without publication of a contract notice (Art. 134 RAP) 1 90.000,00
Negotiated Procedure with at least five candidates below Directive thresholds (Art. 136a RAP) 2 273.800,00
Open Procedure (Art. 104(1) (a) FR) 4 5.143.406,50
Total 7 5.507.206,50
TABLE 12 : SUMMARY OF PROCEDURES OF DG COMP EXCLUDING BUILDING CONTRACTS
TABLE 13 : BUILDING CONTRACTS
TABLE 14 : CONTRACTS DECLARED SECRET
TABLE 15 : FPA duration exceeds 4 years - COMP

comp_aar_2018_annexes_final Page 21 of 45
ANNEX 4: Materiality criteria
In conformity with the current guidelines, DG Competition applies the following
quantitative and qualitative materiality criteria, in order to assess the overall impact of a
weakness and judge whether it is material enough to have an impact on the assurance.
Qualitative assessment
Competition policy is implemented through enforcement and involves predominantly
procedural (case-handling) and advocacy activities, involving a very modest level of
financial management.
Qualitative criteria cover significant reputational risks for the DG or the Commission and
significant weaknesses in the internal control systems. For assessing the significance of
the weakness, the nature and scope, duration, existence of mitigating controls and/or
remedial actions are taken into account.
For weaknesses, which are considered significant in qualitative terms but not in
quantitative terms, DG Competition takes into account the possible reputational impact
they may entail to the image of DG Competition and the Commission. They will be
assessed according to context and nature of the impact, awareness and duration.
Quantitative assessment
As regards legality and regularity, the proposed standard quantitative materiality
threshold of 2% of the residual error rate of the executed payments is applied.
DG Competition considers it an appropriate threshold above which weaknesses detected
should be considered “material”.
In DG Competition, this applies to all non-compliance events detected throughout the
year and with a quantifiable impact on legality and regularity.

comp_aar_2018_annexes_final Page 22 of 45
ANNEX 5: Relevant Control System
Enforcement
Security of IT-systems
Main control objectives: Ensuring that the Commission protects and maintains its IT security
Main risks Mitigating controls Coverage, frequency and
depth of controls Cost-Effectiveness
indicators Sensitive information is disclosed or its integrity breached (data altered) due to security of IT systems and/or information processes not being fully effective.
Security of IT systems and information safeguarding ‘culture’: appropriate design of IT systems and/or information processes;
Update of the IT Risk Register
Formal procedures to add, manage and remove user access rights to IT applications.
Security rules and culture to be adjusted in view of latest technical developments and ‘possibilities’. DG’s IT governance body to evaluate the probability and impact of IT risks at least once per year and to discuss mitigation actions. Continuous risk management of each project according to the PM2 methodology; Daily access rights management of the case management applications and related applications
Reputational events during the reporting year linked to issues of data security and the protection of confidential and/or sensitive information.
EU competition policy and enforcement
Main internal control objectives: Ensuring that EU competition policy and enforcement actions are of high quality
Main risks Mitigating controls
Coverage, frequency and depth
of controls
Cost-
Effectiveness
indicators
Challenges before courts potentially leading to significant reputational risks, excessive legal costs, annulments of decisions and (monetary) compensation claims of high value.
A dedicated team in DG Competition continuously updates instrument specific Manuals of Procedures (ManProc) for antitrust/cartels, mergers and State aid.
Instrument-based ManProcs and the Working Arrangements with the Commissioner provide guidance to the staff of DG Competition about the different roles, procedures, required consultations and procedurals steps to be followed in the daily operations.
The case support Units contribute to ensuring policy consistency and high quality of draft decisions in terms of substance and clarity. They participate in the weekly meetings with the Commissioner and instrument management meetings contributing to the uniform application of the rules and regulations by the case teams.
Chief Economist Team (CET) offers an expert economic view for policy development and provides independent guidance in individual cases in all 3 instruments (anti-trust, mergers and State aid) throughout the investigation process and a final written advice on a formal proposal which is to be submitted for decision to the Commissioner.
Peer review panel assures internal scrutiny organised for major antitrust, merger and State aid cases, covering all or certain aspects of the case (factual basis, legal reasoning and economic analysis).
Legal Service (an independent Commission service operating under the control and authority of the
Coverage: 100%
Number of control failures, Number and value of annulments of Competition decisions decided by courts Number and value of claims for damages Number and value of claims for damages upheld by courts Reputational damage out of the annulments and claims for damages upheld by courts.

comp_aar_2018_annexes_final Page 23 of 45
Main risks Mitigating controls
Coverage,
frequency
and depth of controls
Cost-Effectiveness
indicators
President of the Commission) ensures high quality output in terms of theory of harm and legal reasoning in enforcement cases and policy documents.
Independent Hearing Officers chair oral hearings and oversee the procedural fairness of competition proceedings in the field of antitrust, cartels and mergers and provide a final opinion published in the Official Journal when the Commission decision is taken.
The Principal Adviser strengthens the capacity of DG Competition to carry out economic evaluations of the EU's competition policy.
Senior Management Meeting (SMM) chaired by the
Director General discusses inter alia major developments in on-going cases and jurisprudence of the General Court and the Court of Justice.
Operations Committee Meeting – Policy (OCM/P), chaired by the Director General discusses major on-going cases and decides on the granting of priority and ensuring adequate staffing in a case in close cooperation with the Commissioner.
Weekly instruments management meetings review and decide on the planning of ongoing cases and horizontal policy initiatives and ensure adequate staffing of cases.
Knowledge Management and information sharing tools like 'COMPWiki' allow staff to share knowledge and best practices within the DG.
Document Management and Case Management Applications support key business processes.
Weekly meetings between the Commissioner, the Cabinet and DG Competition monitor important developments in competition cases and horizontal policy initiatives.
Quarterly, or ad-hoc multiannual meetings, strategic meetings of the Commissioner with the Senior Management and Directorates of DG Competition are regularly updated on the progress in the most important enforcement cases in all instruments.
Fines imposed in the area of Competition
Main control objectives: Ensuring that the Commission establishes its revenue entitlements and correctly registers its revenue entitlements, reliable reporting (true and fair)
Main risks Mitigating controls Coverage, frequency and depth of controls
Cost-Effectiveness indicators
The Commission decision embeds weaknesses that would undermine the Commission's legal rights in terms of revenue entitlements such as decision not addressed to the correct legal
entity.
• Main parameters of the fines are discussed before the SO is finalised in a meeting chaired by the DDG Antitrust in which A1, CET, LS and CAB participate • Experienced case handlers verify calculations (fresh pair of eyes)
Coverage: 100%
in-depth panel review for draft COMP-decisions on fines
Effectiveness: Value of the rights concerned (e.g. decision on fine overruled by CoJ) Benefits: The (average annual) total value of the significant errors detected/avoided - and thus prevented in terms of the
Commission's rights
EU accounting rules are not respected and
Commission Decisions being followed-up by concerned services
Coverage: 100% monthly for new
decisions
Effectiveness: Value of the rights concerned Benefits: The accounts

comp_aar_2018_annexes_final Page 24 of 45
Main risks Mitigating controls Coverage, frequency and depth of controls
Cost-Effectiveness indicators
that the accounts do not reflect the reality.
quarterly for follow-up of fines before Court of Justice
at year-end give a true and fair view. Economy (costs): estimation of cost of staff involved in the controls.
Security of information
Main control objectives: Ensuring that the Commission protects and maintains its information security
Main risks It may happen (again) that…
Mitigating controls Coverage, frequency and depth of controls
Cost-Effectiveness indicators
Sensitive information is disclosed in the course of proceedings
• Local Security Officer (LSO) • Detailed manuals of procedures • Daily enforcement of DG COMP's security measures: own marking system, reporting and risk assessment of incidents, security of buildings and staff (access controls) • Regular follow-up and monitoring of information security incidents in order to identify systematic issues and help to avoid similar situations in the future • LISO's prior approval of, and timely follow up reporting by, DG DIGIT's investigation of suspicious activities on COMP workstations • Staff awareness actions
Coverage: 100% Systematic (access controls, training sessions for newcomers, reporting and follow-up of disclosures), and ad –hoc (update of internal guidance documents, communication of events and policies, information sessions)
Cost: estimate of cost of staff involved. Effectiveness: staff awareness of security rules and best practices. Number of disclosures reported (accidental or leaks).
Fraud, Insider trading, Conflict of interests
Main control objectives: Ensuring that staff behaves according to the highest professional standards.
Main risks It may happen (again) that…
Mitigating controls Coverage, frequency and depth of controls
Cost-Effectiveness indicators
The reputation of the Commission is damaged due to the misconduct of staff.
• Training and awareness sessions on ethics for staff. Systematic training of newcomers, including trainees and visiting staff
• Conflict of Interest checks in Case Management applications
Systematic (conflict of interests declarations for all cases, training sessions for all newcomers), and ad–hoc information sessions)
Cost: estimate of cost of staff involved. Benefits: staff awareness about the ethical rules, no reports of unethical behaviour, number of IDOC/OLAF investigations.
Management of administrative expenditures
Main control objectives: Ensuring that the implementation of the contract is in compliance with the signed contract before payment
Main risks It may happen (again) that…
Mitigating controls Coverage, frequency and depth of controls
Cost-Effectiveness indicators
The goods/services/ works foreseen are not, totally or partially, provided in accordance with
Operational and financial checks in accordance with the financial circuits.
Operation authorisation by the
100% of the contracts are controlled Depth: All underlying documents
Error rate < 2% Payment times Deterrents & systematic weaknesses corrected.

comp_aar_2018_annexes_final Page 25 of 45
Main risks It may happen (again) that…
Mitigating controls Coverage, frequency and depth of controls
Cost-Effectiveness indicators
the technical description and requirements foreseen in the contract and/or the amounts paid exceed that due in accordance with the applicable contractual and regulatory provisions. DG unable to meet some objectives and priorities because contractor unable to deliver.
AO.
Network in place for co-ordination, monitoring and follow-up of contracts.
Benefits: Controls performed comply with the base line requirements of the Financial Regulation.
Main control objectives: Ensuring that any weakness in the procedures (tender and financial transactions) is corrected
Main risks It may happen (again) that…
Mitigating controls Coverage, frequency and depth of controls
Cost-Effectiveness indicators
An error or non-compliance with regulatory and contractual provisions, including technical specifications, or a fraud, is not detected by ex-ante control, prior to payment.
Review of procurements and financial transactions through ex-post audits performed by the ICC.
Review of reported exceptions.
Representative coverage. Depth: all underlying documents.
Amounts detected associated with fraud & error. Potential irregularities, errors and overpayments prevented. Benefits: Controls performed comply with the base line requirements of the Financial Regulation. Potential irregularities, errors and overpayments prevented. Number of cases referred to OLAF. Number of instances of overriding controls or
deviations from established procedure

comp_aar_2018_annexes_final Page 26 of 45
ANNEX 6: Implementation through national or
international public-sector bodies and bodies governed by private law with a public sector mission (not applicable)
ANNEX 7: EAMR of the Union Delegations (not applicable)
ANNEX 8: Decentralised agencies (not applicable)

comp_aar_2018_annexes_final Page 27 of 45
ANNEX 9: Evaluations and other studies finalised or
cancelled during the year
1. Id 7145
2. Study project ID 7145
3. Title of the study
Producer Organisations and their activities in the olive oil, beef and veal, arable crops sectors.
Evaluation of the EU Framework applicable to regional aid in 2014-2020
4. Study internal ID O R
5. Study overview
Producer Organisations and their activities in the olive oil, beef and veal, arable crops sectors. The study provides an inventory of POs and APOs in the EU in the given sectors as well as, as its core element, a survey of a representative sample of POs and APOs commercialising products. The survey focuses on comprehensive information concerning the activities, the benefits and disadvantages of these activities and on the difficulties that POs and APOs face when carrying them out. The study is accompanied by a limited number of specific detailed examples of POs and APOs commercialising products, whose purpose is to deepen understanding of the information obtained in the inventory and the survey.
The current rules for assessing the compatibility of regional State aid are set out in the Regional Aid Guidelines and the General Block Exemption Regulation. These rules expire in 2020. In order to prepare for their review, the Commission will launch an evaluation of the current framework, including the method for the definition of regional aid maps and the compatibility criteria for regional investment and operating aid.
6. Study reason O R
7. Associated services - -
8. Study cost 333.800,00 € -
9. Note Study to provide an inventory of Producer Organisation and their activities in certain sectors
Abandoned, since it became part of the Fitness check of the 2012 State aid modernisation package, railways guidelines and short term export credit insurance
10. Title of the deliverable
Producer Organisations and their activities in the olive oil, beef and veal, arable crops sectors.
Evaluation of the EU Framework applicable to regional aid in 2014-2020

comp_aar_2018_annexes_final Page 28 of 45
ANNEX 10: Specific annexes related to "Financial Management"
Overview of the estimated cost of controls at Commission (EC) level:
Relevant control system 1 - IT-security
Ex ante controls Ex post controls Total
EC total costs
(in EUR)
funds managed (in
EUR)
Ratio (%):
Total ex ante control
cost in EUR ÷ funds managed in EUR
EC total costs
(in EUR)
total value
verified and/or
audited (in EUR)
Ratio (%):
Total ex post control
cost in EUR ÷ total value verified and/or
audited in EUR
EC total estimated
cost of controls (in
EUR)
Ratio (%):
Total cost of controls ÷
funds managed
117 530 € N/A N/A N/A N/A N/A 117 530 € N/A
Relevant control system 2 – EU competition policy and enforcement actions
Ex ante controls Ex post controls Total
EC total cost
(in EUR)
funds managed (in
EUR)*
Ratio (%):
Total ex ante control
cost in EUR ÷ funds
managed in EUR
EC total costs
(in EUR)
total value
verified and/or
audited (in EUR)
Ratio (%):
Total ex post control
cost in EUR ÷ total
value verified and/or audited in EUR
EC total estimated
cost of controls (in
EUR)
Ratio (%)*:
Total cost of controls ÷
funds managed
7 940 400 € 109 841 980 € N/A N/A N/A N/A 7 940 400 € 7,23%
Relevant control system 3 - Fines imposed in the area of competition
Ex ante controls Ex post controls Total
EC total cost
(in EUR)
funds managed (in
EUR)
Ratio (%):
Total ex ante control
cost in EUR ÷ funds
managed in EUR
EC total costs
(in EUR)
total value
verified and/or
audited (in EUR)
Ratio (%):
Total ex post control
cost in EUR ÷ total
value verified and/or
audited in EUR
EC total estimated
cost of controls (in
EUR)
Ratio (%):
Total cost of controls ÷
funds managed
N/A N/A N/A N/A N/A N/A N/A N/A
Relevant control system 4 - Security of information
Ex ante controls Ex post controls Total
EC total cost
(in EUR)
funds managed (in
EUR)
Ratio (%)*:
Total ex ante control
cost in EUR ÷ funds
managed in EUR
EC total costs
(in EUR)
total value
verified and/or
audited (in EUR)
Ratio (%):
Total ex post control
cost in EUR ÷ total
value verified and/or
audited in EUR
EC total estimated
cost of controls (in
EUR)
Ratio (%):
Total cost of controls ÷
funds managed
55 407 N/A N/A N/A N/A N/A 55 407 N/A

comp_aar_2018_annexes_final Page 29 of 45
Relevant control system 5 - Fraud, Insider trading, Conflict of interests
Ex ante controls Ex post controls Total
EC total cost
(in EUR)
funds managed (in
EUR)
Ratio (%):
Total ex ante control
cost in EUR ÷ funds
managed in EUR
EC total costs
(in EUR)
total value
verified and/or
audited (in EUR)
Ratio (%):
Total ex post control
cost in EUR ÷ total
value verified and/or
audited in EUR
EC total estimated
cost of controls (in
EUR)
Ratio (%):
Total cost of controls ÷
funds managed
38 617 € N/A N/A N/A N/A N/A 38 617 € N/A
Relevant control system 6 - Financial management - administrative expenditures
Ex ante controls Ex post controls Total
EC total cost
(in EUR)
funds managed (in
EUR)**
Ratio (%)*:
Total ex ante control
cost in EUR ÷ funds
managed in EUR
EC total costs
(in EUR)
total value
verified and/or
audited (in EUR)
Ratio (%):
Total ex post control
cost in EUR ÷ total
value verified and/or
audited in EUR
EC total estimated
cost of controls (in
EUR)
Ratio (%)**:
Total cost of controls ÷
funds managed
217 000 € 8 620 000 € 2,5% 78 010 € 4 486 078,38 € 1,74% 295 010 € 3,42%
OVERALL estimated cost of control at EC level
Ex ante controls Ex post controls Total
EC total cost
(in EUR)
funds managed (in
EUR)*
Ratio (%)*:
Total ex ante control
cost in EUR ÷ funds
managed in EUR
EC total costs
(in EUR)
total value
verified and/or
audited (in EUR)
Ratio (%):
Total ex post control
cost in EUR ÷ total
value verified and/or
audited in EUR
EC total estimated
cost of controls (in
EUR)
Ratio (%)*:
Total cost of controls ÷
funds managed
8 368 954 € 109 841 980 € 7,62% 78 010 € 4 486 078,38 € 1,74% 8 446 964 € 7,69%
* Ratio for total estimated cost is based on the total budget for title 3 “Administrative expenditure of the Competition policy area”, which includes the budget for staff. This
allows for correct ratio of cost of controls as competition policy is implemented through human resources rather than through financial resources. ** Ratio for total estimated costs based on part of title 3, “Other administrative expenditures”, which are managed directly by DG COMP.

comp_aar_2018_annexes_final Page 30 of 45
ANNEX 11: Specific annexes related to "Assessment of the effectiveness of the internal control systems" (not applicable)

comp_aar_2018_annexes_final Page 31 of 45
ANNEX 12: Performance tables
General objective: A New Boost for Jobs, Growth and Investment
Impact indicator 1: GDP growth
Source of data: Eurostat
Baseline
(2014)
Target (2020) Latest known results
(2017)
1.8% Increasing Trend
Bookmark11
2.4%
Antitrust and cartels
Specific objective 1: Effective enforcement of antitrust rules with a view to
protecting consumer welfare (Antitrust and cartels)
Result indicator 1: Estimate of customer benefits resulting from Commission
decisions prohibiting cartels (KPI 1)
Rationale: Quantitative indicator to ensure positive impact of competition enforcement on
consumer welfare
Source of data: DG Competition calculation12
Baseline
(2015)
Target Latest known results
(2018)
EUR 1.0-1.5
bn12
No target12 EUR 1.3-1.9 bn
Result indicator 2: Deterrent effect of the Commission's fines
Rationale: The Commission can impose fines on companies to punish infringements of
antitrust rules and to deter future infringements.
Source of data: DG Competition Stakeholder Survey 2014
Baseline
(2014)
Target (2019) Latest known results
201413
> 50%14 Maintain > 50%
Output indicator 1: Intervention rate15
Source of data: DG Competition case management system (Natacha)
Baseline
(2017)
Target Latest known results
(2018)
11 No target17 14
11 Please note that Eurostat periodically revises its published data to reflect new or improved
information, also for previous years. The latest published data is available by clicking on "bookmark". The "latest known value" column reflects the data that was available at the time of the preparation of the AARs 2016 and it is the reference point for the AARs of Commission services.
12 Please refer to footnote 23 of the main document for a comprehensive explanation on the
calculation methodology and target setting of this indicator. 13 This survey is carried out once per Commission mandate. 14 Eurobarometer Standard Qualitative Study – DG Competition Stakeholder Survey (2014),
Aggregate Report, published in 2015, p. 35, "Overall, most participants believed that fines, especially larger fines, are an effective deterrent for companies, which try to avoid being in a position where they could be penalised. A national competition authority and some companies mentioned that fines have increased considerably in recent years and have become even more effective". Senior Management decision to repeat the survey once in a mandate.
15 Intervention rate consists of antitrust interventions (decisions) by the Commission. In 2017, 11
interventions by the Commission included 4 antitrust decisions (1 commitment decision and 3
prohibition decisions), 7 cartel prohibition decisions (4 settlement decisions, 2 prohibition decisions and 1 hybrid decision (normal procedure)).

comp_aar_2018_annexes_final Page 32 of 45
Main outputs in 2018:
Policy–related outputs
Description Indicator Target date Latest known results
(situation on
31/12/2018)
Conduct of
investigations and
adoption of
Commission decisions
in the field of antitrust
and cartels in
accordance with EU
competition law
Intervention rate16 2018 (no
target17)
14
Specific objective 2: Effective and coherent application of EU competition law by
the national competition authorities (Antitrust and cartels)
Result indicator 1: Number of cases signalled to the European Competition
Network (ECN)18
Rationale: Benchmark for the level of the ECN activity to ensure coherent application of EU
competition law
Source of data: ECN case system
Baseline
(2015)
Target Latest known results
(2018)
179 No target17 165
Result indicator 2: Number of envisaged enforcement decisions and similar case
consultations in the European Competition Network (ECN)19
Rationale: Benchmark for the level of the ECN activity to ensure coherent application of EU
competition law
Source of data: ECN case system
Baseline
(2015)
Target Latest known results
(2018)
100 No target 79
16
Intervention rate consists of final antitrust and cartel decisions by the Commission. 17
It is not meaningful to set numerical targets for competition policy enforcement. Most of the
indicators used to measure the Commission's performance include trends as targets (stable, increase, decrease, no target). On-going investigation by the Commission is always without prejudice to the final decision to be taken by the Commission in the case. However, DG Competition, like most competition authorities, provides the number of decisions (or intervention rate) to indicate the level of activity and output for the preceding year, also for deterrence purposes. As regards antitrust and cartel enforcement, a target would also depend on factors beyond the Commission's control (decisions of the parties or other market players to disclose infringements through the leniency programme, whistleblowing, complaints or the availability of information to the Commission to detect infringements ex officio). In each and every case, the Commission must fully respect the rights of defence of the parties.
18 Please note that number of cases signalled to the ECN is dependent on a number of factors such
as priorities set by the national competition authorities, complexities and number of already on-going cases as well as changes in the competition structure of each market.
19 Please note that the number of envisaged decisions varies depending on the level of output by the
NCAs.

comp_aar_2018_annexes_final Page 33 of 45
Output indicator 1: Regular contacts to support NCAs on individual cases with a
view to ensure coherent and effective application of Articles 101 and 102 TFEU
Source of data: DG Competition statistics
Baseline (2017) Target Latest known results
(2018)
Regular contacts No target Regular contacts
Output indicator 2: Half-yearly meetings of the heads of the NCAs with the
Director General of DG Competition, regular meetings of ECN Plenary, ECN
working groups and sectorial subgroups.
Source of data: DG Competition statistics
Baseline (2017) Target Latest known results
(2018)
Regular meetings, half-
yearly for heads of NCAs
with the Director General of
DG Competition, regular
meetings of ECN Plenary,
ECN working groups and
sectorial subgroups.
No target Regular meetings, half-
yearly for heads of NCAs
with the Director General
of DG Competition, regular
meetings of ECN Plenary,
ECN working groups and
sectorial subgroups all
held.
Main outputs in 2018:
All new initiatives and REFIT initiatives from the Commission
Work Programme
Description Indicator Target Latest known results
(situation on 31/12/2018)
Proposal for a
Directive on
empowering the
National Competition
Authorities to be more
effective enforcers
(ECN+)
Adoption by the
European Parliament
and the Council
2018/2019 The Proposal for a
Directive on empowering
the National Competition
Authorities to be more
effective enforcers (ECN+)
has been adopted by the
Council on 11 December
2018, following an
agreement reached with
the European Parliament at
first reading20. In
December 2018, the
publication in the Official
Journal was pending.
20
Directive (EU) 2019/1 of the European Parliament and of the Council of 11 December 2018 to
empower the competition authorities of the Member States to be more effective enforcers and to ensure the proper functioning of the internal market, OJ L 11, 14.01.2019, pp. 3–33 https://www.consilium.europa.eu/en/press/press-releases/2018/12/04/eu-adopts-rules-to-enable-national-competition-authorities-to-become-more-effective-enforcers/.

comp_aar_2018_annexes_final Page 34 of 45
Specific objective 2: Effective and coherent application of EU competition law by
national courts (Antitrust and cartels)
Result indicator 1: Compliance rate of national judgments with Commission
replies to requests for opinions (Article 15(1) of Regulation 1/2003)
Rationale: Benchmark for coherence of the activities by the courts and the Commission to
ensure coherent private enforcement of EU competition law
Source of data: DG Competition statistics on the basis of national judgments transmitted
Baseline
(2004-2015)
Target Latest known results
(2004-2018)
18/21:
100%
compliance
rate possible
Maintain 100% compliance rate in the long term to
ensure coherent application of EU competition
rules
24/24
Result indicator 2: Compliance rate of national judgments with Commission
'amicus curiae' briefs (Article 15 (3) of Regulation 1/2003)
Rationale: Benchmark for coherence of the activities by the courts and the Commission to
ensure coherent private enforcement of EU competition law
Source of data: DG Competition statistics on the basis of national judgments transmitted
Baseline
(2006-2015)
Target Latest known results
(2006-2018)
12/12 Maintain 100% compliance rate in the long term to
ensure coherent application of EU competition
rules
15/15
Result indicator 3: Number of Member States having fully implemented the
Directive ensuring the right for victims of EU competition law infringements to
obtain compensation through national courts
Rationale: Benchmark for ensuring equal opportunities to obtain compensation for
competition law infringements in all Member States
Source of data: DG Competition statistics based on evaluation
Baseline
(2014)
Target
Latest known results
(2018)
- 100% of Member States implemented by 27
December 2016
All Member States
implemented the
Directive by 2018.
Output indicator 1: Information and opinions provided to national courts
concerning the application of the EU antitrust rules
Rationale: Support to national courts in individual cases pending before them
Source of data: DG Competition statistics
Baseline
(2017)
Target Latest known results
(2018)
Information
and opinions
provided
No target17 Information and
opinions provided

comp_aar_2018_annexes_final Page 35 of 45
Main outputs in 2018:
Policy–related outputs
Description Indicator Target date Latest known results
(situation on
31/12/2018)
Guidelines for national
courts on quantifying
passing-on effects in
antitrust damages
actions
Adoption No target From July to October
2018, the European
Commission run a
targeted public
consultation on the
draft Guidelines.
Specific objective 3: EU competition law instruments maintained aligned with
market realities and contemporary economic and legal thinking
(Antitrust and cartels)
Result indicator 1: Stakeholder consultation on new rules (Eurobarometer 2014)
Rationale: Benchmark for a key quality parameter related to DG Competition's work
Source of data: Eurobarometer Standard Qualitative Study – DG Competition Stakeholder
Survey (2014)
Baseline
(2014)
Target (2019) Latest known results
(2014) 21
5.5/7.022 Stable Trend23 5.5/7.0
Main outputs in 2018:
Policy–related outputs
Description Indicator Target date Latest known results
(situation on
31/12/2018)
Guidance on the use of
voluntary
confidentiality rings
Publication 2018 Published on
12/12/2018
Updated guidance on
confidentiality claims
in access to file
Publication 2018 Published on
12/12/2018
21 This survey is carried out once per Commission mandate. 22 See Eurobarometer Standard Qualitative Study – DG Competition Stakeholder Survey (2014),
Aggregate Report p. 27, "There was a high overall level of satisfaction with DG Competition’s consultation on new rules, although some participants felt that their views are not always taken
into account." http://ec.europa.eu/competition/publications/reports/surveys_en.html. 23 Senior Management decision of 1 February 2016: Increasing trend for <5/7 and stable trend
≥ 5/7.

comp_aar_2018_annexes_final Page 36 of 45
Merger control
Specific objective 4: Facilitating smooth market restructuring by assessing non-
harmful mergers in a streamlined manner (Merger control)
Result indicator 1: Ratio of merger decisions adopted in a simplified procedure
Rationale: Quantitative indicator demonstrating reduced regulatory burden facilitating
smooth market restructuring
Source of data: DG Competition calculation
Baseline
(2017)
Target Latest known results
(2018)
ca. 75% Stable Trend ca. 77%
Output indicator 1: Number of Commission decisions adopted in a simplified
procedure
Source of data: DG Competition calculation
Baseline
(2017)
Target Latest known results
(2018)
280 No target 302
Specific objective 5: Prevention of anticompetitive effects of mergers with a view
to protecting consumer welfare (Merger control)
Result indicator 1: Estimate of customer benefits resulting from merger
interventions (KPI 2)
Rationale: Quantitative indicator to ensure positive impact of competition enforcement on
consumer welfare
Source of data: DG Competition calculation24
Baseline
(2015)
Target Latest known results
(2018)
EUR 1.7-2.9
bn
No target EUR 15.0-25.0 bn
Output indicator 1: Number of merger decisions per year
Source of data: DG Competition calculation
Baseline
(2017)
Target
Latest known results
(2018)
375 No target17 393
Output indicator 2: Intervention rate25
Source of data: DG Competition calculation
Baseline
(2017)
Target
Latest known results
(2018)
24 No target 25
Output indicator 3: Number of merger decisions adopted by the Commission
("non-simplified") per year
Source of data: DG Competition calculation
Baseline
(2017)
Target
Latest known results
(2018)
95 No target17 91
24 Please refer to footnote 24 of the main document for a comprehensive explanation on the
calculation methodology and target setting of this indicator. 25 Intervention rate indicator includes prohibition decisions and mergers approved subject to
commitments, as well as withdrawals during second phase investigation (in-depth investigation by the Commission).

comp_aar_2018_annexes_final Page 37 of 45
Specific objective 6: EU competition law instruments maintained aligned with
market realities and contemporary economic and legal thinking
(Merger control)
Result indicator 1: Stakeholder consultation on new rules (Eurobarometer 2014)
Rationale: Benchmark for a key quality parameter related to DG Competition's work
Source of data: Eurobarometer Standard Qualitative Study – DG Competition Stakeholder
Survey (2014)
Baseline
(2014)
Target (2019) Latest known results
(2014) 26
5.5/7.027 Stable Trend 5.5/7.0
Main outputs in 2018:
Policy–related outputs
Description Indicator Target date Latest known results
(situation on
31/12/2018)
Evaluation of selected
procedural and
jurisdictional aspects
of EU merger control
(2017/COMP/003)
Publication of
Evaluation Staff
Working Document
2019 Preparation of Staff
Working Document
State aid control
Specific objective 7: Overall effectiveness of State aid modernisation, increasing
share of better targeted growth-enhancing aid (State aid control)
Result indicator 1: The share of GBER expenditure over total expenditure on State
aid (KPI 3)
Source of data: State Aid Scoreboard
Link: http://ec.europa.eu/competition/state_aid/scoreboard/index_en.html
Baseline
(2014)
Target (2016-2020) Latest known results
(2017)
38% Maintain or increase 47%
Result indicator 2: Percentage of State aid granted by Member States for
horizontal objectives of common interest.
Rationale: Indicator to ensure that state aid is targeted at horizontal objectives of
Community interest, such as regional development, employment, environmental
protection, promotion of research and development and innovation, risk capital and
development of SMEs.
Source of data: State Aid Scoreboard – The information is based on the annual reports
provided by Member States pursuant to Article 6(1) of Commission Regulation (EC)
794/2004 and comprises expenditure granted by Member States through existing aid
measures which fall into scope of Article 107(1) TFEU.
Link: http://ec.europa.eu/competition/state_aid/scoreboard/index_en.html
Baseline
(2014)
Target (2017) Latest known results
(2017)
85% Maintain or increase 94%
26 This survey is carried out once per Commission mandate. 27 See Eurobarometer Standard Qualitative Study – DG Competition Stakeholder Survey (2014),
Aggregate Report p. 27, "There was a high overall level of satisfaction with DG Competition’s
consultation on new rules, although some participants felt that their views are not always taken into account." http://ec.europa.eu/competition/publications/reports/surveys_en.html.

comp_aar_2018_annexes_final Page 38 of 45
Output indicator 1: Number of opening decisions per year
Source of data: DG Competition calculation
Baseline
(2017)
Target Latest known results
(2018)
7 No target17 9
Specific objective 8: Compliance of renewable support schemes and capacity
remuneration mechanisms with State aid rules (State aid control)
Result indicator 1: Number of EEAG-based decisions28 on operating support
schemes for renewable electricity
Rationale: The compliance of the renewable energy support schemes with EEAG ensures a
level playing field in the internal electricity market.
Source of data: DG Competition calculation29
Link: http://ec.europa.eu/competition/elojade/isef/index.cfm
Baseline (2014-
2015)
Target (2016-2020) Latest known results
(2018)
11 decisions Increase 60 decisions
Result indicator 2: Number of EEAG-compatible capacity mechanisms as share of
all existing capacity mechanisms
Rationale: The compliance of the capacity mechanisms with EEAG ensures a level playing
field in the internal electricity market.
Source of data: DG Competition calculation
Link: http://ec.europa.eu/competition/elojade/isef/index.cfm
Baseline (2014-
2015)
Target (2019) Latest known results
(2017)
5% of capacity
mechanisms
70% 50%
Output indicator 1: Adoption of Commission decisions in the field of State aid in
accordance with EU State aid rules
Source of data: DG Competition calculation
Baseline (2017) Target
Latest known results
(2018)
21 No target17 18
Specific objective 9: Stability and promotion of competition in the banking sector
Result indicator 1: Ratio of (a) State aid to all banks in the EU in the form of
capital-relevant instruments to (b) primary equity issuance within the EU for
banks30
Rationale: A lower ratio indicates that the share of State aid is falling compared against the
total volume of equity issuance in a given year which is better for financial stability.
Source of data: For the numerator DG COMP calculation. For the denominator Bloomberg31
data.
Baseline
(2014)
(2015) (2016) (2017) Target (2016-2020) Latest known results
(2018)
12.39% 26.38% 0.82% 27.17%32 Decrease 20.92%
28 EEAG, Communication from the Commission — Guidelines on State aid for environmental
protection and energy 2014-2020, OJ C 200, 28.6.2014, p. 1-55, http://eur-lex.europa.eu/legal-content/EN/TXT/?uri=CELEX%3A52014XC0628(01).
29 Number of Commission decisions under EEAG on operating schemes for RES-electricity;
individual/ad hoc aid is not considered; trend should be increasing in view of cumulative decisions. 30
The denominator "primary equity issuance within the EU for banks" has a wider scope compared to
the indicator used in the AAR 2016 report. The denominator now also includes capital increases through right offerings. The ratios for previous years have been adjusted accordingly.
31 For more information on Bloomberg, please refer to https://www.bloomberg.com/europe.
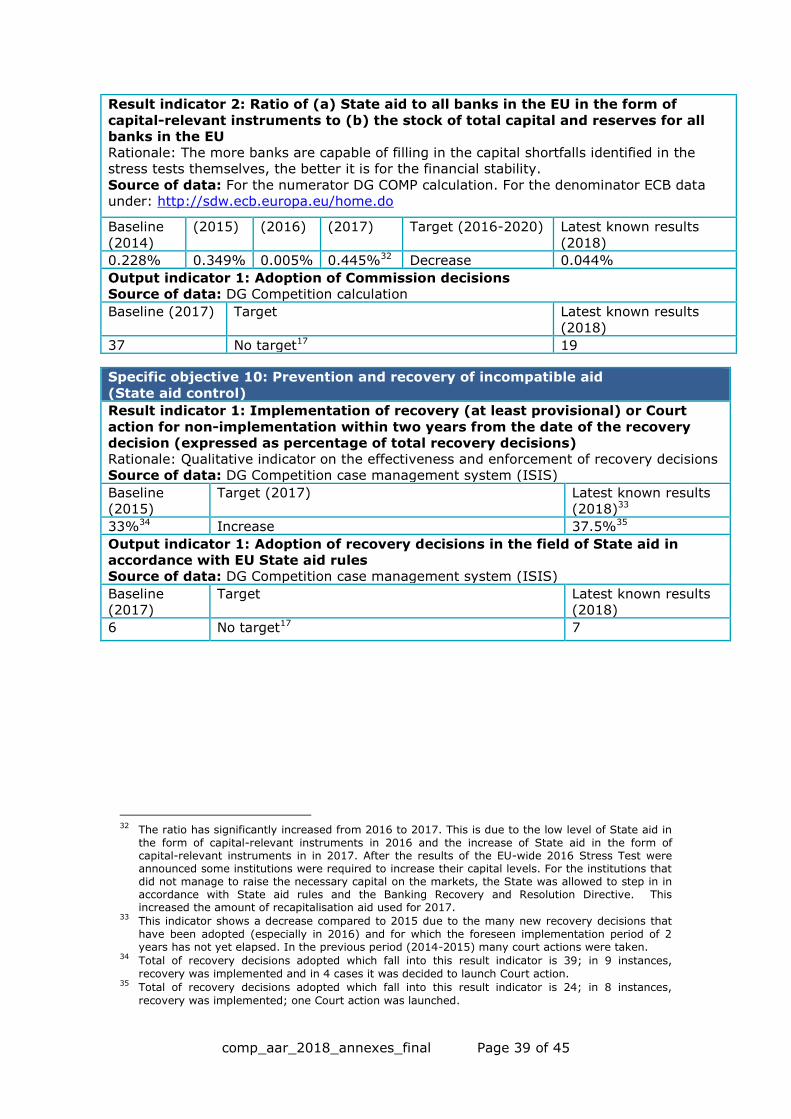
comp_aar_2018_annexes_final Page 39 of 45
Result indicator 2: Ratio of (a) State aid to all banks in the EU in the form of
capital-relevant instruments to (b) the stock of total capital and reserves for all
banks in the EU
Rationale: The more banks are capable of filling in the capital shortfalls identified in the
stress tests themselves, the better it is for the financial stability.
Source of data: For the numerator DG COMP calculation. For the denominator ECB data
under: http://sdw.ecb.europa.eu/home.do
Baseline
(2014)
(2015) (2016) (2017) Target (2016-2020) Latest known results
(2018)
0.228% 0.349% 0.005% 0.445%32 Decrease 0.044%
Output indicator 1: Adoption of Commission decisions
Source of data: DG Competition calculation
Baseline (2017) Target
Latest known results
(2018)
37 No target17 19
Specific objective 10: Prevention and recovery of incompatible aid
(State aid control)
Result indicator 1: Implementation of recovery (at least provisional) or Court
action for non-implementation within two years from the date of the recovery
decision (expressed as percentage of total recovery decisions)
Rationale: Qualitative indicator on the effectiveness and enforcement of recovery decisions
Source of data: DG Competition case management system (ISIS)
Baseline
(2015)
Target (2017) Latest known results
(2018)33
33%34 Increase 37.5%35
Output indicator 1: Adoption of recovery decisions in the field of State aid in
accordance with EU State aid rules
Source of data: DG Competition case management system (ISIS)
Baseline
(2017)
Target Latest known results
(2018)
6 No target17 7
32 The ratio has significantly increased from 2016 to 2017. This is due to the low level of State aid in
the form of capital-relevant instruments in 2016 and the increase of State aid in the form of capital-relevant instruments in in 2017. After the results of the EU-wide 2016 Stress Test were announced some institutions were required to increase their capital levels. For the institutions that did not manage to raise the necessary capital on the markets, the State was allowed to step in in accordance with State aid rules and the Banking Recovery and Resolution Directive. This increased the amount of recapitalisation aid used for 2017.
33 This indicator shows a decrease compared to 2015 due to the many new recovery decisions that
have been adopted (especially in 2016) and for which the foreseen implementation period of 2 years has not yet elapsed. In the previous period (2014-2015) many court actions were taken.
34 Total of recovery decisions adopted which fall into this result indicator is 39; in 9 instances,
recovery was implemented and in 4 cases it was decided to launch Court action. 35 Total of recovery decisions adopted which fall into this result indicator is 24; in 8 instances,
recovery was implemented; one Court action was launched.

comp_aar_2018_annexes_final Page 40 of 45
Specific objective 11: Monitoring of aid measures
(State aid control)
Result indicator 1: Number of aid measures subject to ex-post monitoring
Rationale: Stable indicator ensuring a reasonable number of aid measures (mainly
schemes) subject to ex-post monitoring in every annual monitoring cycle.
Source of data: DG Competition calculation
Baseline (2015) Target (2017) Latest known results
(2018)
96 aid schemes
monitored
At least 75 aid measures (mainly
schemes) subject to ex-post monitoring
5036
Specific objective 12: EU competition law instruments maintained aligned with
market realities and contemporary economic and legal thinking
(State aid control)
Result indicator 1: Stakeholder consultation on new rules (Eurobarometer 2014)
Rationale: Benchmark for a key quality parameter related to DG Competition's work
Source of data: Eurobarometer Standard Qualitative Study – DG Competition Stakeholder
Survey (2014)
Baseline
(2014)
Target (2019) Latest known results
(2014) 37
5.5/7.038 Stable Trend 5.5/7.0
Main outputs in 2018:
All new initiatives and REFIT initiatives from the Commission Work Programme
Description Indicator Target date Latest known results
(situation on
31/12/2018)
Best Practices Code Adoption of a
Commission notice
2018 Adoption 2018
36 Fewer schemes were monitored since the focus of monitoring has been on schemes with high
expenditure whereby it can be noted that Member States had granted less aid overall in such schemes, which as a result reduced the number of candidate schemes for monitoring. Nevertheless, the possible distortion of competition could be expected to be higher from large expenditure schemes than examining more schemes but with smaller expenditure.
37 This survey is carried out once per Commission mandate. 38 See Eurobarometer Standard Qualitative Study – DG Competition Stakeholder Survey (2014),
Aggregate Report, p. 27, "There was a high overall level of satisfaction with DG Competition’s
consultation on new rules, although some participants felt that their views are not always taken into account."http://ec.europa.eu/competition/publications/reports/surveys_en.html.

comp_aar_2018_annexes_final Page 41 of 45
Promoting competition culture and international cooperation
in the area of competition policy: maintaining and strengthening the Commission's reputation world-wide
Specific objective 13: Competition advocacy contributing to a pro-competitive
regulatory framework at EU and national level
Result indicator 1: Readiness to engage and contribute with high quality input to
other DG's policy projects (Ensuring collegiality)
Rationale: Benchmark for a key quality parameter related to DG Competition's work
Source of data: Other DGs' Survey by DG Competition (2014)
Baseline
(2014)
Target (2019) Latest known results
(2014) 39
5.0/7.0 Stable Trend 5.0/7.0
Result indicator 2: Relevance of input to other DGs' policy projects (Ensuring
collegiality)
Rationale: Benchmark for a key quality parameter related to DG Competition's work
Source of data: Other DGs' Survey by DG Competition (2014)
Baseline
(2014)
Target (2019) Latest known results
(2014) 39
5.2/7.0 Stable Trend 5.2/7.0
Output indicator 1: Number of substantial replies to Commission inter-service
consultations
Source of data: DG Competition calculation
Baseline
(2017)
Target Latest known results
(2018)
154 Stable Level 192
Output indicator 2: Number of country specific recommendations promoted or
followed by DG Competition
Source of data: DG Competition calculation
Baseline
(2017)
Target Latest known results
(2018)
30 Stable Level 25
Main outputs in 2018:
Policy–related outputs
Description Indicator Target date Latest known results
(situation on
31/12/2018)
ECN Communication
and Advocacy Working
Group
Annual meeting 2018 Postponed until 2019
as Eurobarometer
Citizens' Survey
results not available
yet.
39 This survey is carried out once per Commission mandate.

comp_aar_2018_annexes_final Page 42 of 45
Specific objective 14: Explaining competition policy and its benefits
Result indicator 1: Percentage of positive replies in surveys conducted among
citizens agreeing that effective competition has a positive impact on them as
consumers
Rationale: Indicator to measure citizens' view of competition and competition policy
Source of data: Eurobarometer Flash Citizens' Survey
Baseline (2015) Target (2019) Latest known results
(2019) 40
74% Increasing Trend 78%
Main outputs in 2018:
Other important outputs
Description Indicator Target date Latest known results
(situation on
31/12/2018)
Actions to explain EU
competition rules to
stakeholders
Number of people
reached with
communication
actions directly
supporting EU
competition policy41
Throughout 2018 13000 Twitter
followers + 50 groups
of visitors DG Comp
staff has spoken to +
15 speaking events to
new audiences +
participation in the
European Commission
Open Doors event with
approximately 15000
visitors
DG Competition's
publications
Number of
subscribers/readers
of DG Competition's
publications 42
Increasing trend 22 00043 subscribers
to the newsletters;
4500 EU Bookshop
downloads of
publications; 9000
downloads of
publications from DG
Comp website;
distribution of around
3000 printed copies of
various publications
sent only to interested
audience (e.g.
specialised libraries)
40 This survey is carried out once per Commission mandate. See
http://ec.europa.eu/competition/publications/reports/surveys_en.html 41 Collated monitoring data collected by DGs from their actions, from monitoring and evaluation
contractors, from Opinion polls etc. (DG Competition calculation). 42
Baseline 2015 – DG Competition's publications sent to 6 452 subscribers/readers and the digital
publications to 34 880. 43 These figures are not comparable with the 2015 baseline due to clean up of the mailing lists when
transferring to a new system. However, the number of subscribers to the newsletters has gone up by around 10% each year.

comp_aar_2018_annexes_final Page 43 of 45
Conduct
Eurobarometer Flash
Citizens' Survey on
Competition Policy
Percentage of
positive replies
agreeing that
effective competition
has a positive impact
on consumers
2018 In 2018, the
Eurobarometer Flash
Citizen Survey on
Citizens’ perception of
competition policy was
re-launched with
results to be published
in spring 2019.
Specific objective 15: Promoting international cooperation and convergence in
the area of competition policy and greater transparency and basic disciplines on
subsidies control internationally
Result indicator 1: Promotion of competition culture and policy convergence at
international level
Rationale: Benchmark for a key quality parameter related to DG Competition's work
Source of data: Eurobarometer Standard Qualitative Study – DG Competition Stakeholder
Survey (2014)40
Baseline (2014) Target (2019) Latest known results
(2014) 44
4.9/7.0 Increasing Trend 4.9/7.0
Output indicator 1: Number of competition cooperation agreements and free
trade agreements containing competition and State aid clauses
Rationale: Provides a benchmark for the increased level of convergence with third
countries' competition authorities
Source of data: DG Competition's statistics
Baseline (2017) Target (2019) Latest known results
(2018)
23 agreements 37 agreements 24 agreements
Output indicator 2: Number of contributions to OECD, ICN and UNCTAD
Rationale: Provides a benchmark for the activity of the Commission in contributing to
increased international convergence of competition policy on multilateral fora
Source of data: DG Competition's statistics
Baseline (2017) Target (2018-2020) Latest known results
(2018)
8 (OECD), 5 (ICN), 3
(UNCTAD)
15-20 21 contributions in
total (OECD 13, ICN
7, UNCTAD 1)
Output indicator 3: Number of technical assistance workshops organised with
third countries
Rationale: Provides a benchmark for the activity of the Commission in contributing to
increased international convergence of competition policy bilaterally
Source of data: DG Competition's statistics
Baseline (2017) Target (2018-2022) Latest known results
(2018)
China (8) India (5),
Brazil (1)
China (12) Brazil (1), Japan, Korea, India,
ASEAN (min. 2),
China (2), India (1)
44 This survey is carried out once per Commission mandate.

comp_aar_2018_annexes_final Page 44 of 45
Specific objective 16: Ensuring the highest standards in the enforcement of
competition policy45
Result indicator 1: Legal soundness of Commission decisions in competition cases
Rationale: Benchmark for a key quality parameter related to DG Competition's work
Source of data: Eurobarometer Standard Qualitative Study – DG Competition Stakeholder
Survey (2014)
Baseline (2014) Target (2019) Latest known results
(2014)
5.3/7.046 Stable Trend 5.3/7.0
Result indicator 2: Quality of economic analysis
Rationale: Benchmark for a key quality parameter related to DG Competition's work
Source of data: Eurobarometer Standard Qualitative Study – DG Competition Stakeholder
Survey (2014)
Baseline (2014) Target (2019) Latest known results
(2014)
4.9/7.047 Increasing Trend 4.9/7.0
Result indicator 3: Market knowledge
Rationale: Benchmark for a key quality parameter related to DG Competition's work
Source of data: Eurobarometer Standard Qualitative Study – DG Competition Stakeholder
Survey (2014)
Baseline (2014) Target (2019) Latest known results
(2014)
5.0/7.048 Stable Trend 5.0/7.0
Result indicator 4: Impact on the markets
Rationale: Benchmark for a key quality parameter related to DG Competition's work
Source of data: Eurobarometer Standard Qualitative Study – DG Competition Stakeholder
Survey (2014)
Baseline (2014) Target (2019) Latest known results
(2014)
4.8/7.049 Increasing Trend 4.8/7.0
Result indicator 5: Timeliness of decisions
Rationale: Benchmark for a key quality parameter related to DG Competition's work
Source of data: Eurobarometer Standard Qualitative Study – DG Competition Stakeholder
Survey (2014)
Baseline (2014) Target (2019) Latest known results
(2014)
4.0/7.050 Increasing Trend 4.0/7.0
Result indicator 6: Informing in a timely manner
Rationale: Benchmark for a key quality parameter related to DG Competition's work
Source of data: Eurobarometer Standard Qualitative Study – DG Competition Stakeholder
Survey (2014)
Baseline (2014) Target (2019) Latest known results
(2014)
4.9/7.051 Increasing Trend 4.9/7.0
45 For the result indicators of this specific objective, data collection takes place once per Commission
mandate. 46 See Eurobarometer Standard Qualitative Study – DG Competition Stakeholder Survey (2014),
Aggregate Report, p. 12. 47 Ibid. p. 19. 48 Ibid. p. 17. 49 Ibid. p. 42. 50 Ibid. p. 37. 51 Ibid. p. 24.

comp_aar_2018_annexes_final Page 45 of 45
Main outputs in 2018:
Other important outputs
Description Indicator Target date Latest known results
(situation on
31/12/2018)
Conduct
Eurobarometer
Qualitative Study DG
Competition
Stakeholder Survey
Indicators included in
DG Competition
Strategic Plan 2016-
2020:
1. Legal soundness of
Commission
decisions in
competition cases
2. Quality of
economic analysis
3. Market knowledge
4. Impact on the
markets
5. Timeliness of
decisions
6.Informing in a
timely manner
2018 Due to unavailability in
2018 of the respective
Commission
Framework Contract, it
was not possible to
repeat the Qualitative
survey in 2018.
However, the
Eurobarometer Flash
Citizen Survey on
Citizens’ perception of
competition policy was
re-launched in 2018
with results to be
published in spring
2019.