2018 – 2020 zoning and feeder pattern revision proposal€¦ · 2018 – 2020 zoning and feeder...
TRANSCRIPT
2018 – 2020 ZONING AND FEEDER PATTERN REVISION PROPOSAL
JULY 24, 2018 BIRMINGHAM CITY SCHOOLS
2015 Park Place Birmingham, AL 35203

1
Table of Contents
Rationale for Feeder Pattern Alignment ......................................................................................... 2
Rationale for School Reconfiguration ............................................................................................. 3
Feeder Pattern Revision Proposal ................................................................................................... 4
Enrollment Summary Definitions .................................................................................................... 5
Specialty School Locations and Zones if Applicable: ...................................................................... 6
Current District and Specialty School Enrollment Summary .......................................................... 7
District Enrollment: ................................................................................................................................... 7
Specialty Schools: (Capacity) ..................................................................................................................... 7
High School Zones with 2-mile radius ............................................................................................. 8
Distance between High Schools (driving distance in miles): .................................................................... 8
Current High Schools Enrollment: (Capacity) ................................................................................. 9
Current Middle & K8 School Zones with High School 2-mile radius overlay ................................ 10
Distance between Middle & K8 and High Schools (driving distance in miles): ....................................... 11
Current Middle Schools Enrollment: (Capacity) ........................................................................... 12
Current K8 Schools Enrollment: (Capacity) ................................................................................... 13
Current Elementary & K8 School Zones with High School 2-mile radius overlay ......................... 14
Miles between Elementary and High Schools (driving distance): ........................................................... 15
Elementary Schools Enrollment: (Capacity).................................................................................. 16
General Zone Changes .................................................................................................................. 17
General Zone Change 1: .......................................................................................................................... 17
General Zone Change 2: .......................................................................................................................... 18
General Zone Change 3: .......................................................................................................................... 19
General Zone Change 4: .......................................................................................................................... 20
General Zone Change 5: .......................................................................................................................... 21
Next Steps: .................................................................................................................................... 22
SY 2018-2019: Stakeholder Input ........................................................................................................... 22
SY 2019-2020: Implementation .............................................................................................................. 22
Appendix A: FY2019 LEA Unit Breakdown .................................................................................... 23
Appendix B: Grade Divisors........................................................................................................... 25

2
Rationale for Feeder Pattern Alignment
Several of Birmingham City Schools have been closed during the past decade without detailed
consideration of the zones associated with these schools. Often school zones were combined
without consideration of the feeder pattern from elementary to middle to high school. This has
evolved into a situation in which students may attend elementary together and split between
two different middle schools and return to the same high school or they may attend middle
school together and then split to three high schools. Some children are bused by one high
school to attend another on the opposite side of the city. We even have one school that does
not sit inside its own zone.
In a summary of research on school feeder patterns, Hanover Research found the following:
Transitioning between schools is difficult for many students. Students advancing from
one level of education to the next face more difficult coursework and stricter grading
standards at each level of schooling. School becomes progressively more impersonal,
academically challenging, and socially complex as students move from elementary to
middle to high school. (p. 4)
The following benefits of a direct feeder pattern from Pre-Kindergarten through 12th grade will
be felt by all stakeholders in Birmingham City Schools.
1. Direct feeder patterns are the least disruptive to students’ academic and social stability
2. Direct feeder patterns make planning for transitions from one school to the next easier
for parents, students, teacher and school district employees.
3. Direct feeder patterns allow schools to work together from grades Pre-Kindergarten
through twelfth grade to create a unified educational experience through instructional
vertical planning and instill a common school culture.
4. Direct feeder patterns assist with the continuance of services for students.
5. Direct feeder patterns facilitate the student’s ability to maintain social relationships.
6. Direct feeder patterns strengthen the link between eighth and ninth grade performance.
7. Direct feeder patterns allow for effective planning and implementation of school
orientations.
8. Direct feeder patterns provide a sense of stability for students and parents (Hanover
Research, 2014).
In addition to eliminating split pathways from Pre-Kindergarten to twelfth grade, several other
factors have been taken into consideration in the development of the feeder pattern proposals.
Items such as school capacity, student proximity to school, transportation costs, neighborhood
locations, and natural boundaries such as interstates, highways, railways and waterways have
also been analyzed in the preparation of these proposals.
Hanover Research, (2014, May). School Feeder Patterns: Overview and Impacts. Retrieved April 4, 2018, from
https://www.napls.us/site/handlers/filedownload.ashx?moduleinstanceid=4047&dataid=8331&FileName=School
Feeder Patterns- Overview and Impacts.pdf

3
Rationale for School Reconfiguration
Statistical research related to the reconfiguration of school grade levels and pedagogy is
inconsistent. Some research studies show a positive impact of the grade level structure of a
school while others show a negative impact or no impact at all. Instructional leadership and
high expectations are commonly cited to be the main factors in the success of a school (Dove,
Pearson & Hooper, 2010; Williamson, 2012). “When schools focus on implementing ideas
correctly and with fidelity, positive results can be achieved. Middle schools need to revisit the
middle school philosophy to ensure they are carrying it out completely. (Johnson, 2017 pg. 6)”
With inconclusive research to review, BCS must make decisions for our students based upon
our unique needs in Birmingham.
The Alabama State Department of Education (ALSDE) bases school funding and units on the
grade configuration and enrollment at the school. The ALSDE funds four school types,
elementary, middle, high and career technical centers. This structure negatively impacts our
schools that are configured with grades K through 8 because they are funded as elementary
schools. The base enrollment size for a fully elementary school is 500 students and for a fully
funded middle school is 300 students. Our K-8 schools are often not able to provide the
students in grades 6 through 8 with elective courses that our students in traditional middles
schools are able to access. Often times our 7th and 8th grade students are with the same set of
core academic teachers for both years because of lack of teacher units. Sometimes this even
trickles down to 5th and 6th grade sharing core academic teachers. Additionally funding for
assistant principals, counselors and library/media units are based on the elementary scale
which means that most do earn a full unit. This results in schools utilizing Federal Title funds to
fill in the gaps.
Carolan, B. V., & Chesky, N. Z. (2012). The relationship among grade configuration, school attachment, and
achievement. Middle School Journal, 43(4), 32-39. Retrieved from https://sites.newpaltz.edu/ncate/wp-
content/uploads/sites/21/2014/06/Example-Chesky.pdf
Dove, M. J., Pearson, L. C., & Hooper, H. (2010). Relationship between grade span configuration and academic
achievement. Journal Of Advanced Academics, 21(2), 272-298 Retrieved from URL
https://files.eric.ed.gov/fulltext/EJ880581.pdf
Johnston, K. (2017). Does grade configuration affect middle school students' achievement? (Master's thesis,
Northwestern College, Orange City, IA). Retrieved from URL
http://nwcommons.nwciowa.edu/education_masters/36/
Williamson, R. (2012). Grade configuration. Education Partnerships, Inc. Retrieved from
https://eric.ed.gov/?id=ED538738

4
Feeder Pattern Revision Proposal
Given the history of the Birmingham City Schools zone planning along with changes with housing in the
City of Birmingham combined with research on best practices for school design, it is recommended that
approval be granted for the implementation of a multi-year Feeder Pattern Revision Project beginning with
the 2018-2019 school year with a targeted completion of 2019-2020. The goals of this project are as follows:
Provide clear feeder patterns that are easily understood by all stakeholders.
Increase ALSDE funded units by thoughtfully restructuring schools to meet requirements for additional Assistant Principal, Counselor and Library/Media units.
Increase teacher units, in both core and elective areas by redirecting expenditures.
Decrease transportation costs by reducing travel distances.
Provide equitable course offerings for students.
To achieve these goals the following timeline of events will be implemented with multiple points of
evaluation of the progress.
SY 2017-2018: Initial Investigation
Review research related to school structure and feeder patterns
Conduct In-depth analysis of current enrollment and zones
Create recommendations
Solicit input from principals and stakeholders
SY 2018-2019: Stakeholder Input
Implement General Zone Changes
Select Steering Committee from applications via the website
Set rezoning criteria and develop process
Develop zoning options
Present options to BOE and Community for feedback
Develop and present final recommendation
SY 2019-2020: Implementation
Select Implementation Committee from Steering Committee
Identify areas of change, develop process and timeline
Monitor implementation
Measure success, recommend areas for improvement
5
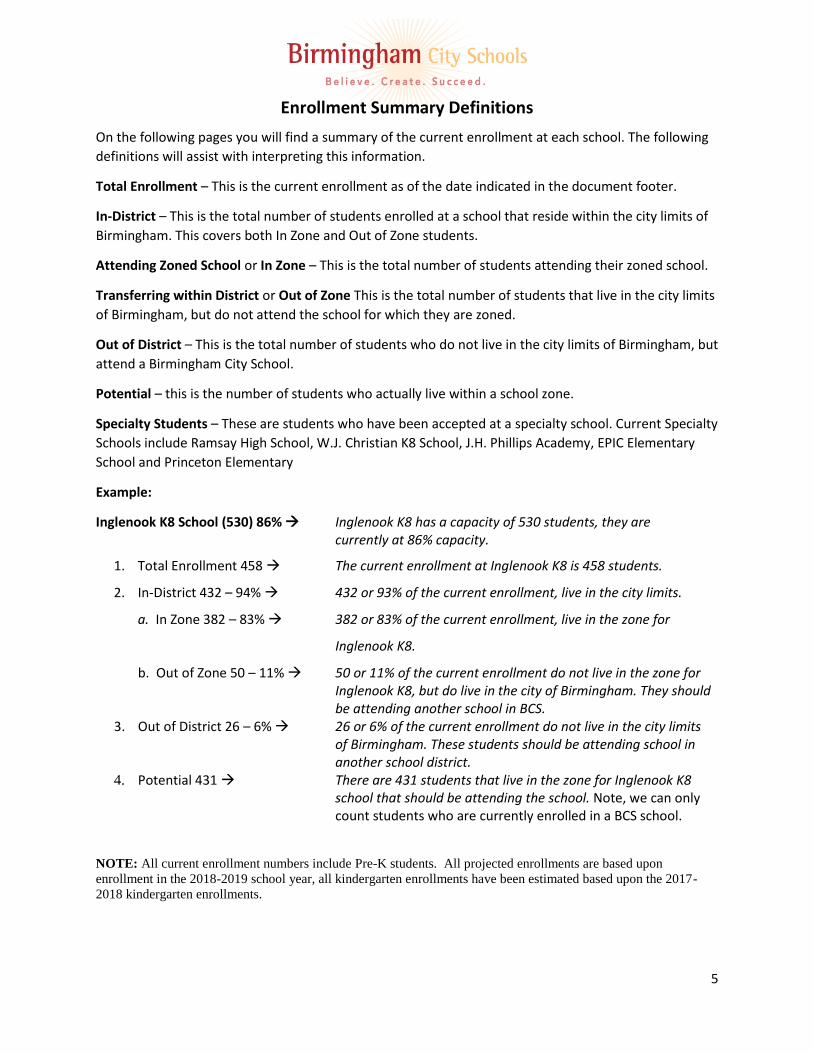
Enrollment Summary Definitions
On the following pages you will find a summary of the current enrollment at each school. The following
definitions will assist with interpreting this information.
Total Enrollment – This is the current enrollment as of the date indicated in the document footer.
In-District – This is the total number of students enrolled at a school that reside within the city limits of
Birmingham. This covers both In Zone and Out of Zone students.
Attending Zoned School or In Zone – This is the total number of students attending their zoned school.
Transferring within District or Out of Zone This is the total number of students that live in the city limits
of Birmingham, but do not attend the school for which they are zoned.
Out of District – This is the total number of students who do not live in the city limits of Birmingham, but
attend a Birmingham City School.
Potential – this is the number of students who actually live within a school zone.
Specialty Students – These are students who have been accepted at a specialty school. Current Specialty
Schools include Ramsay High School, W.J. Christian K8 School, J.H. Phillips Academy, EPIC Elementary
School and Princeton Elementary
Example:
Inglenook K8 School (530) 86% Inglenook K8 has a capacity of 530 students, they are currently at 86% capacity.
1. Total Enrollment 458 The current enrollment at Inglenook K8 is 458 students.
2. In-District 432 – 94% 432 or 93% of the current enrollment, live in the city limits.
a. In Zone 382 – 83% 382 or 83% of the current enrollment, live in the zone for
Inglenook K8.
b. Out of Zone 50 – 11% 50 or 11% of the current enrollment do not live in the zone for Inglenook K8, but do live in the city of Birmingham. They should be attending another school in BCS.
3. Out of District 26 – 6% 26 or 6% of the current enrollment do not live in the city limits of Birmingham. These students should be attending school in another school district.
4. Potential 431 There are 431 students that live in the zone for Inglenook K8 school that should be attending the school. Note, we can only count students who are currently enrolled in a BCS school.
NOTE: All current enrollment numbers include Pre-K students. All projected enrollments are based upon
enrollment in the 2018-2019 school year, all kindergarten enrollments have been estimated based upon the 2017-
2018 kindergarten enrollments.

6
Specialty School Locations and Zones if Applicable:
All specialty schools have a clearly defined procedure with criteria for selecting students into
the school. A student’s geographic location is not a part of the selection process.
Ramsay high school serves students in grade 9 – 12 and does not have a defined zoned.
W.J. Christian K8 and J.H. Phillips Academy serve students in grades Pre-Kindergarten to 8th.
Both schools have zones for the elementary students and select all students in grades 6 - 8.
They also select students to completely fill the elementary portion of their schools. In the
image below, the elementary zone for W.J. Christian is shaded green and the elementary zone
for J.H. Phillips is shaded yellow.
EPIC and Princeton elementary schools serve students in grades Pre-Kindergarten to 5th and do
not have a defined zone.
W. J. Christian K8
J.H. Phillips Academy
Ramsay High
Princeton Elementary
EPIC Elementary
Western portion of district
No students impacted

7
Current District and Specialty School Enrollment Summary
The following enrollment data is based upon enrollment on April 1, 2017.
District Enrollment:
1. Total Enrollment 23,508 2. In-District
a. In Zone 17,996 – 77% b. Out of Zone 4,854 – 21%
3. Out of District 658 – 3%
Specialty Schools: (Capacity)
Ramsay (750) 105% 1. Total Enrollment 787 2. In-District 685 – 87% 3. Out of District 102 – 13%
W.J. Christian K8 (648) 100% 1. Total Enrollment 648 2. In-District 603 – 93%
a. In Zone 248 – 38% i. Elementary 222 – 34%
ii. Middle 26 – 4% b. Out of Zone 400 – 62%
i. Elementary 160 – 25% ii. Middle 240 – 37%
3. Out of District 45 – 7%
EPIC (650) 63% 1. Total Enrollment 410 2. In-District 381 – 93% 3. Out of District 29 – 7%
J.H. Phillips Academy K8 (750) 94% 1. Total Enrollment 703 2. In-District 632 – 90%
a. In Zone Students 116 – 16% i. Elementary 106 – 14%
ii. Middle 9 – 1% b. Out of Zone 588 – 84%
i. Elementary 278 – 44% ii. Middle 310 – 44%
3. Out of District 72 – 10%
Princeton (286) 86% 1. Total Enrollment 247 2. In-District 227 – 91% 3. Out of District 20 – 8%

8
High School Zones with 2-mile radius
Distance between High Schools (driving distance in miles):
School Carver Huffman Jackson-Olin Parker Wenonah Woodlawn
Carver (red) 0 11.3 6.8 4.9 11.5 7.6
Huffman (yellow) 11.3 0 16.7 11.9 19.4 6.5
Jackson-Olin (brown) 6.8 16.7 0 4.3 5.4 10.3
Parker (green) 4.9 11.9 4.3 0 6.2 5.5
Wenonah (blue) 11.5 19.4 5.4 6.2 0 10.4
Woodlawn (purple) 7.6 6.5 10.3 5.5 10.4 0
Western portion of district
No students impacted
Parker High
Wenonah High
Jackson Olin High
Carver High
Woodlawn High
Huffman High

9
Current High Schools Enrollment: (Capacity)
The following enrollment data is based upon enrollment on April 1, 2017. The number of Ramsay High Schools
students that live in the zone are not included in any of the school totals.
Carver High School (2000) 38% 1. Total Enrollment 763 2. In-District 736 – 96%
a. In Zone 579 – 79% b. Out of Zone 157 – 21%
3. Out of District 27 – 4% 4. Unknown Location 13 – 2% 5. Potential 675 6. Ramsay 64
Huffman High School (1500) 91%
1. Total Enrollment 1,365 2. In-District 1284 – 94%
a. In Zone 1,125 – 82% b. Out of Zone 159 – 12%
3. Out of District 81 – 6% 4. Potential 1261 5. Ramsay 243
Jackson-Olin High School (1700) 49%
1. Total Enrollment 825 2. In-District 820 – 99%
a. In Zone 795 – 96% b. Out of Zone 25 – 3%
3. Out of District 5 – <1% 4. Potential 968 5. Ramsay 160
Parker High School (1200) 56% 1. Total Enrollment 675 2. In-District 668 – 99%
a. In Zone 520 – 77% b. Out of Zone 148 – 22%
3. Out of District 7 – 1% 4. Potential 643 5. Ramsay 80 6. 2019 PreK Units = 2 (Tuggle)
Wenonah High School (1200) 59%
1. Total Enrollment 712 2. In-District 684 – 96%
a. In Zone 612 – 86% b. Out of Zone 72 – 10%
3. Out of District 24 – 3% 4. Unknown Location 4 – <1% 5. Potential 674 6. Ramsay 74
Woodlawn High School (1250) 59%
1. Total Enrollment 743 2. In-District 719 – 97%
a. In Zone 676 – 91% b. Out of Zone 43 – 6%
3. Out of District 24 – 3% 4. Potential 835 5. Ramsay 62
10
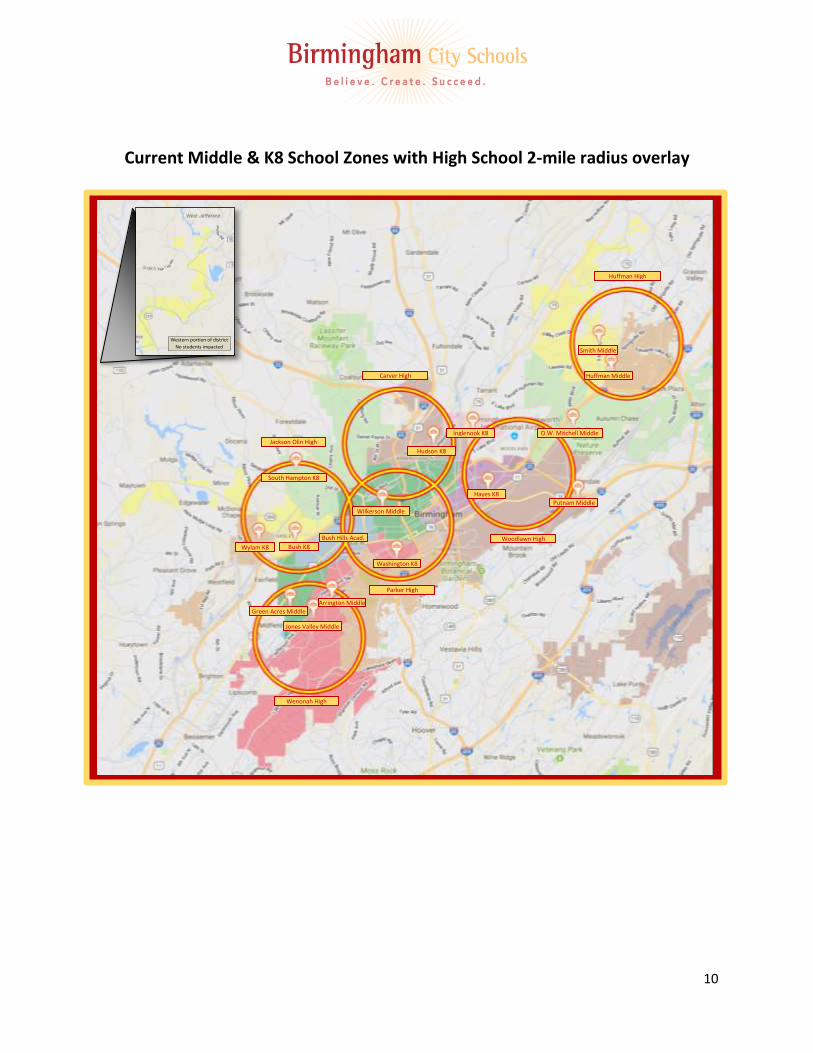
Current Middle & K8 School Zones with High School 2-mile radius overlay
Western portion of district
No students impacted
Huffman High
Parker High
Wenonah High
Jackson Olin High
Carver High
Woodlawn High
Smith Middle
Huffman Middle
Putnam Middle
O.W. Mitchell Middle
Hayes K8
Inglenook K8
Hudson K8
South Hampton K8
Wylam K8 Bush K8
Wilkerson Middle
Green Acres Middle
Jones Valley Middle
Arrington Middle
Washington K8
Bush Hills Acad.

11
Distance between Middle & K8 and High Schools (driving distance in miles):
School Carver Huffman Jackson-Olin Parker Wenonah Woodlawn
Arrington 4.1 2.5
Bush K8 1.2 4.1
Bush Hills
Academy 2.4 2.2
Green Acres 4.1 2.1
Hayes 3.9 1.6
Hudson 1.9 4.0
Huffman MS 1.3
Inglenook 4.4 4.1
Jones Valley 4.9 0.7
Ossie Ware
Mitchell 4.1 2.8
Putnam 3.3
Smith 1.9
South
Hampton 2.2 5.0
Washington 5.2 1.8
Wilkerson 3.6 1.0
Wylam 4.5 5.5
12
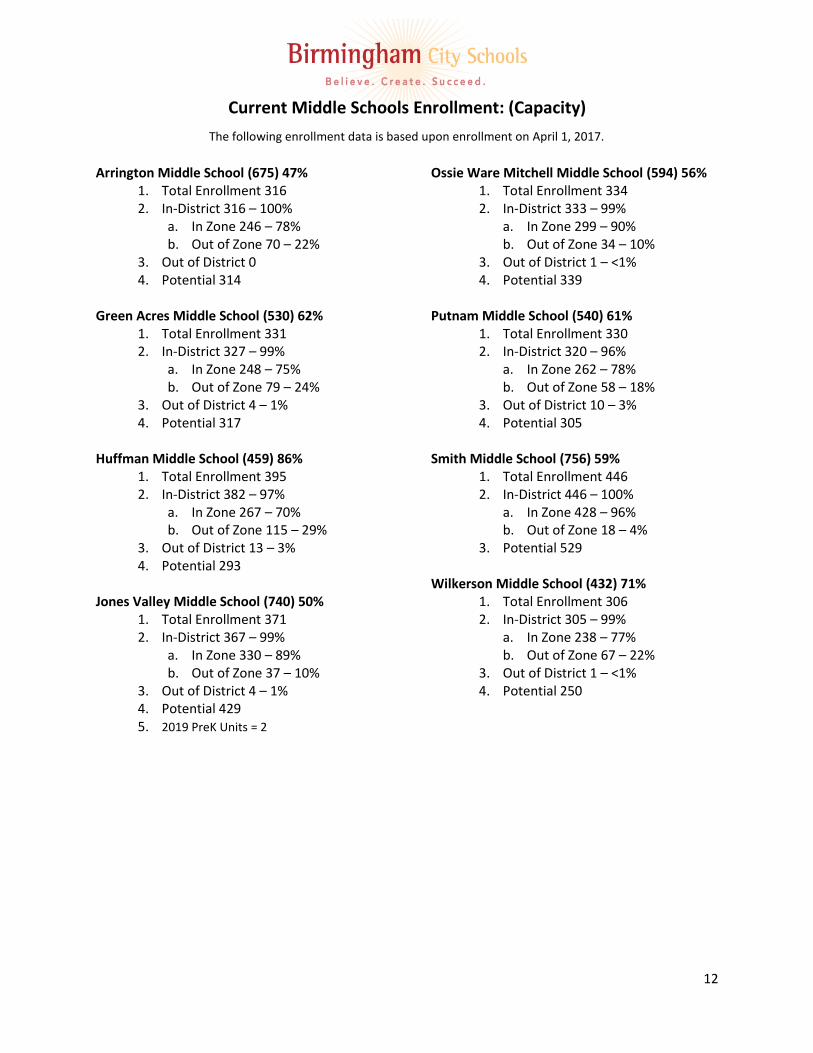
Current Middle Schools Enrollment: (Capacity)
The following enrollment data is based upon enrollment on April 1, 2017.
Arrington Middle School (675) 47%
1. Total Enrollment 316 2. In-District 316 – 100%
a. In Zone 246 – 78% b. Out of Zone 70 – 22%
3. Out of District 0 4. Potential 314
Green Acres Middle School (530) 62%
1. Total Enrollment 331 2. In-District 327 – 99%
a. In Zone 248 – 75% b. Out of Zone 79 – 24%
3. Out of District 4 – 1% 4. Potential 317
Huffman Middle School (459) 86%
1. Total Enrollment 395 2. In-District 382 – 97%
a. In Zone 267 – 70% b. Out of Zone 115 – 29%
3. Out of District 13 – 3% 4. Potential 293
Jones Valley Middle School (740) 50%
1. Total Enrollment 371 2. In-District 367 – 99%
a. In Zone 330 – 89% b. Out of Zone 37 – 10%
3. Out of District 4 – 1% 4. Potential 429 5. 2019 PreK Units = 2
Ossie Ware Mitchell Middle School (594) 56% 1. Total Enrollment 334 2. In-District 333 – 99%
a. In Zone 299 – 90% b. Out of Zone 34 – 10%
3. Out of District 1 – <1% 4. Potential 339
Putnam Middle School (540) 61%
1. Total Enrollment 330 2. In-District 320 – 96%
a. In Zone 262 – 78% b. Out of Zone 58 – 18%
3. Out of District 10 – 3% 4. Potential 305
Smith Middle School (756) 59%
1. Total Enrollment 446 2. In-District 446 – 100%
a. In Zone 428 – 96% b. Out of Zone 18 – 4%
3. Potential 529 Wilkerson Middle School (432) 71%
1. Total Enrollment 306 2. In-District 305 – 99%
a. In Zone 238 – 77% b. Out of Zone 67 – 22%
3. Out of District 1 – <1% 4. Potential 250
13
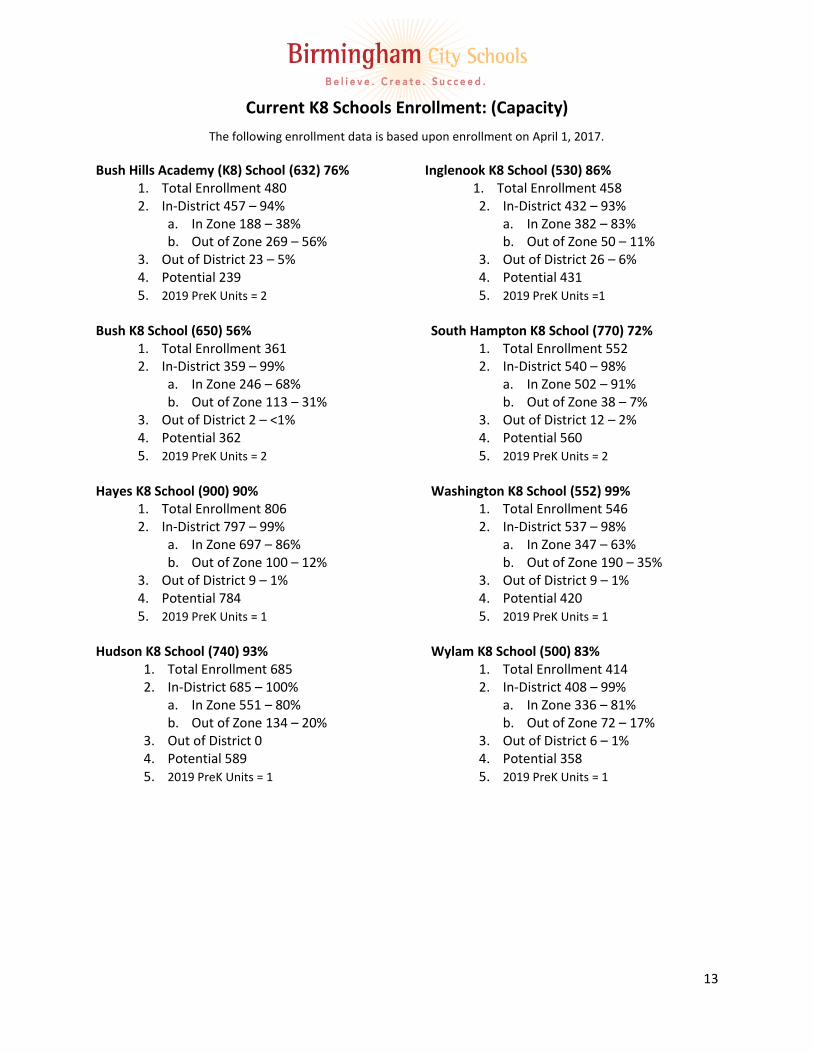
Current K8 Schools Enrollment: (Capacity)
The following enrollment data is based upon enrollment on April 1, 2017.
Bush Hills Academy (K8) School (632) 76% 1. Total Enrollment 480 2. In-District 457 – 94%
a. In Zone 188 – 38% b. Out of Zone 269 – 56%
3. Out of District 23 – 5% 4. Potential 239 5. 2019 PreK Units = 2
Bush K8 School (650) 56%
1. Total Enrollment 361 2. In-District 359 – 99%
a. In Zone 246 – 68% b. Out of Zone 113 – 31%
3. Out of District 2 – <1% 4. Potential 362 5. 2019 PreK Units = 2
Hayes K8 School (900) 90%
1. Total Enrollment 806 2. In-District 797 – 99%
a. In Zone 697 – 86% b. Out of Zone 100 – 12%
3. Out of District 9 – 1% 4. Potential 784 5. 2019 PreK Units = 1
Hudson K8 School (740) 93%
1. Total Enrollment 685 2. In-District 685 – 100%
a. In Zone 551 – 80% b. Out of Zone 134 – 20%
3. Out of District 0 4. Potential 589 5. 2019 PreK Units = 1
Inglenook K8 School (530) 86% 1. Total Enrollment 458 2. In-District 432 – 93%
a. In Zone 382 – 83% b. Out of Zone 50 – 11%
3. Out of District 26 – 6% 4. Potential 431 5. 2019 PreK Units =1
South Hampton K8 School (770) 72%
1. Total Enrollment 552 2. In-District 540 – 98%
a. In Zone 502 – 91% b. Out of Zone 38 – 7%
3. Out of District 12 – 2% 4. Potential 560 5. 2019 PreK Units = 2
Washington K8 School (552) 99%
1. Total Enrollment 546 2. In-District 537 – 98%
a. In Zone 347 – 63% b. Out of Zone 190 – 35%
3. Out of District 9 – 1% 4. Potential 420 5. 2019 PreK Units = 1
Wylam K8 School (500) 83%
1. Total Enrollment 414 2. In-District 408 – 99%
a. In Zone 336 – 81% b. Out of Zone 72 – 17%
3. Out of District 6 – 1% 4. Potential 358 5. 2019 PreK Units = 1

14
Current Elementary & K8 School Zones with High School 2-mile radius overlay
Western portion of district
No students impacted
Hayes K8
Inglenook K8
Hudson K8
South Hampton K8
Wylam K8 Bush K8
Washington K8
Bush Hills Acad.
Parker High
Wenonah High
Jackson Olin High
Carver High
Woodlawn High
Huffman High
Minor ES
Brown ES Central Park ES West End Acad.
Hemphill ES
Oxmoor Valley ES
Glen Iris ES
Norwood ES
Tuggle ES
Avondale ES
Phillips Acad.
Sun Valley ES
Huffman Academy
Christian K8
Martha Gaskins ES
Robinson ES
Barrett ES
Oliver ES

15
Miles between Elementary and High Schools (driving distance):
School Carver Huffman Jackson-Olin Parker Wenonah Woodlawn
Avondale 2.6
Barrett 1.9
Brown 2.8 3.3
Central Park 3.0 3.0
Christian 2.8 5.1
Glen Iris 2.3
Hemphill 3.8 3.7
Huffman
Academy 1.4
Martha
Gaskins 2.2
Minor 1.6
Norwood 3.2 3.4
Oliver 1.6
Phillips 3.3 1.7
Robinson 3.0
Sun Valley 3.9
Tuggle 3.1 1.0
West End
Academy 3.6 2.5

16
Elementary Schools Enrollment: (Capacity) The following enrollment data is based upon enrollment on April 1, 2017.
Avondale School (638) 91% 1. Total Enrollment 579 2. In-District 566 – 98%
a. In Zone 445 – 77% b. Out of Zone 121 – 21%
3. Out of District 13 – 2% 4. Potential 505 5. 2019 PreK Units = 3
Barrett School (792) 57% 1. Total Enrollment 452 2. In-District 448 – 99%
a. In Zone 410 – 91% b. Out of Zone 38 – 8%
3. Out of District 4 – <1% 4. Potential 515 5. 2019 PreK Units = 2
Brown School (500) 82% 1. Total Enrollment 408 2. In-District 399 – 97%
a. In Zone 302 – 74% b. Out of Zone 97 – 24%
3. Out of District 9 – 2% 4. Potential 388 5. 2019 PreK Units = 2
Central Park School (924) 54% 1. Total Enrollment 498 2. In-District 493 – 99%
a. In Zone 404 – 81% b. Out of Zone 89 – 18%
3. Out of District 5 – 1% 4. Potential 479 5. 2019 PreK Units = 3
Glen Iris School (858) 85% 1. Total Enrollment 733 2. In-District 725– 99%
a. In Zone 642 – 87% b. Out of Zone 83 – 11%
3. Out of District 8 – 1% 4. Potential 796 5. 2019 PreK Units = 1
Hemphill School (792) 63% 1. Total Enrollment 499 2. In-District 490 – 98%
a. In Zone 419 – 84% b. Out of Zone 71 – 14%
3. Out of District 9 – 2% 4. Potential 562 5. 2019 PreK Units = 1
Huffman Academy School (900) 95% 1. Total Enrollment 858 2. In-District 852 – 99%
a. In Zone 815 –95% b. Out of Zone 37 – 4%
3. Out of District 6 – 1% 4. Potential 873 5. 2019 PreK Units = 2
Martha Gaskins School (486) 108% 1. Total Enrollment 525 2. In-District 519 – 98%
a. In Zone 475 – 90% b. Out of Zone 44 – 8%
3. Out of District 6 – 1% 4. Potential 553 5. 2019 PreK Units = 1
Minor School (638) 68% 1. Total Enrollment 437 2. In-District 426 – 99%
a. In Zone 344 – 78% b. Out of Zone 82 –19%
3. Out of District 11 –3% 4. Potential 602 5. 2019 PreK Units = 2
Norwood School (310) 98% 1. Total Enrollment 304 2. In-District 303 – 100%
a. In Zone 289 – 95% b. Out of Zone 14 – 5%
3. Out of District 1 – <1% 4. Potential 494 5. 2019 PreK Units = 1
Oliver School (500) 89% 1. Total Enrollment 444 2. In-District 442 – 99%
a. In Zone 389 – 87% b. Out of Zone 53 – 12%
3. Out of District 2 – <1% 4. Potential 425 5. 2019 PreK Units = 2
Oxmoor Valley School (500) 105% 1. Total Enrollment 526 2. In-District 517 – 98%
a. In Zone 464 – 88% b. Out of Zone 53 – 10%
3. Out of District 9 – 2% 4. Potential 520 5. 2019 PreK Units = 1
Robinson School (572) 78% 1. Total Enrollment 445 2. In-District 445 – 100%
a. In Zone 396 – 89% b. Out of Zone 49 – 11%
3. Out of District 0 4. Potential 462 5. 2019 PreK Units = 2
Sun Valley School (748) 84% 1. Total Enrollment 626 2. In-District 595 – 95%
a. In Zone 560 – 89% b. Out of Zone 35 – 6%
3. Out of District 31 – 5% 4. Potential 640 5. 2019 PreK Units = 2
Tuggle School (528) 101% 1. Total Enrollment 533 2. In-District 529 – 99%
a. In Zone 412 – 77% b. Out of Zone 117 – 22%
3. Out of District 4 – 1% 4. Potential 495 5. 2019 PreK Units = 1
West End Academy School (775) 80% 1. Total Enrollment 623 2. In-District 621 – 100%
a. In Zone 577 – 93% b. Out of Zone 44 – 7%
3. Out of District 2 – <1%
4. Potential 698
5. 2019 PreK Units = 3

17
osal
General Zone Changes
These zone changes are common amongst all of the proposals. These changes address current zone problems such as
overcrowding and misaligned elementary to middle and middle to high school lines.
General Zone Change 1:
Norwood zone has 494 students and the capacity at Norwood is 310.
Norwood zone is split for middle school between Hudson and Wilkerson
Hudson has a different zone for Middle and Elementary students.
Contributing factor: Lewis and North Birmingham were closed and the zones combined into Norwood.
Solution: The portion of Norwood’s zone that lies within the boundaries of the Hudson Middle school
zone (1. see area shaded in pink within the yellow/red line) is changed to Hudson. Thus Hudson
will have one zoned area for Elementary and Middle and relieve potential overcrowding at
Norwood.
Impact: 99 elementary students from Norwood would be rezoned to Hudson K8. Hudson K8 zoned
enrollment would increase to 688 students. Norwood’s zoned enrollment would decrease to
395 students.
Hudson K8
Norwood
Outline: Hudson K-8
Pink: Norwood K-5
Tan: Hudson K-5
-------------------------------------------
Students living in zone:
Hudson K8:
589 + 99 = 688
Norwood:
494 -99 = 395

18
General Zone Change 2:
Bush Hills Academy has two zones, one for middle school and one for elementary school. The
eastern boundary for the middle school extends further than the elementary boundary. i.e.
students who are zoned to Tuggle for elementary school are being zoned to Bush Hills Academy
for middle school.
Solution: 2A. The portion of Bush Hills Academy not contained in the boundary below (the portion east of
Arkadelphia/ Princeton Parkway will be rezoned to Tuggle/Wilkerson).
2B. An additional change will be made to the portion that is east of Princeton Parkway, but in
the boundary. This portion will also be rezoned to Tuggle/Wilkerson.
Impact: 2A affects 10 students who will go to Tuggle.
2B affects 15, 10 students will go to Tuggle and 5 students who will go to Wilkerson.
Bush Hills Academy
Wilkerson
Outline: Tuggle K-5
Pink: Bush Hills Acad. 6 - 8
Green: Wilkerson 6 – 8
-------------------------------------Students living in zone: Wilkerson Middle: 250 +10 = 260
Bush Hills Academy: 239 – 10 = 229
Outline: Section of Bush Hills Acad. to be rezoned
Red: Bush Hills Acad. 6 - 8
Brown: Tuggle K – 5
--------------------------------------- Students living in zone: Wilkerson Middle: 250+ 5 = 255
Tuggle Elementary: 505 + 10 = 515
Bush Hills Academy: 229 -15 = 213

19
General Zone Change 3:
Students that live in the Dolomite Community are attending Wylam K8, but then moving on to
Wenonah High School.
Solution: Rezone the Dolomite Community to Jackson-Olin for High School. Current Wenonah students
can grandfather out, i.e. only applicable to current 8th graders at Wylam (currently there are 24
students at Wenonah).
Impact: There are currently 21 students in this area that attend Wenonah High School. They will be
grandfathered out of Wenonah. All current 8th graders in this area will go to Jackson-Olin next
year (currently there are two (2) 8th graders).
20
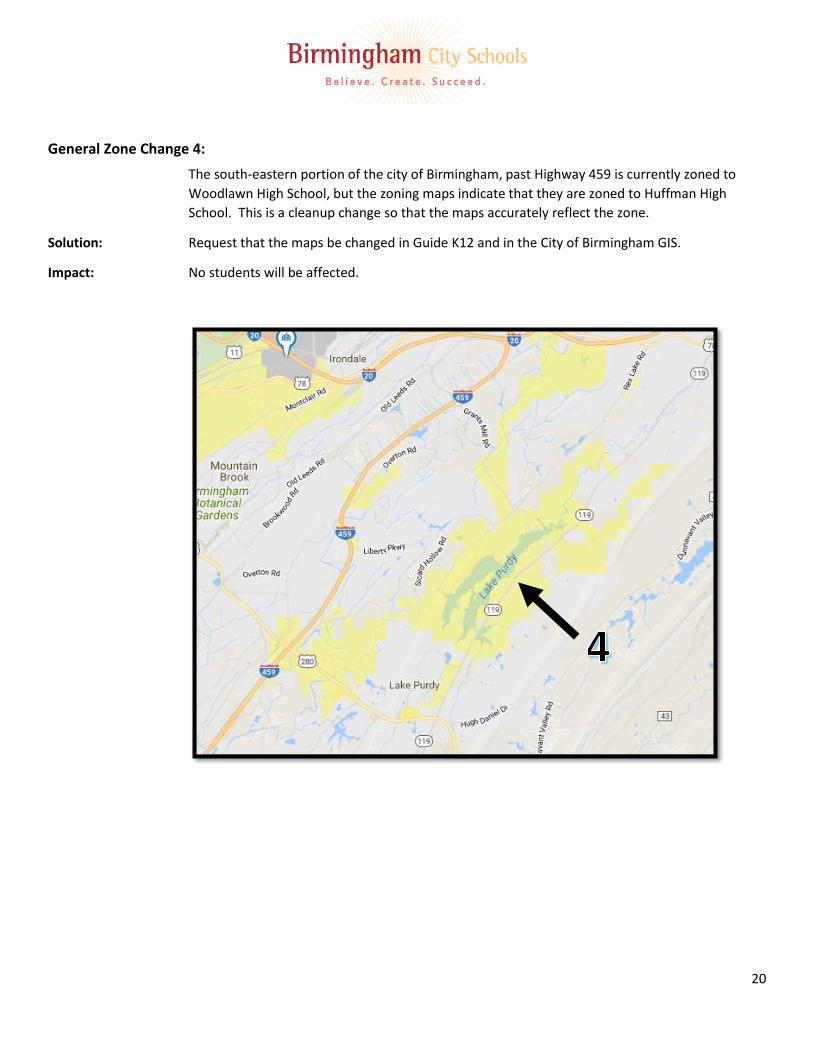
General Zone Change 4:
The south-eastern portion of the city of Birmingham, past Highway 459 is currently zoned to
Woodlawn High School, but the zoning maps indicate that they are zoned to Huffman High
School. This is a cleanup change so that the maps accurately reflect the zone.
Solution: Request that the maps be changed in Guide K12 and in the City of Birmingham GIS.
Impact: No students will be affected.
21
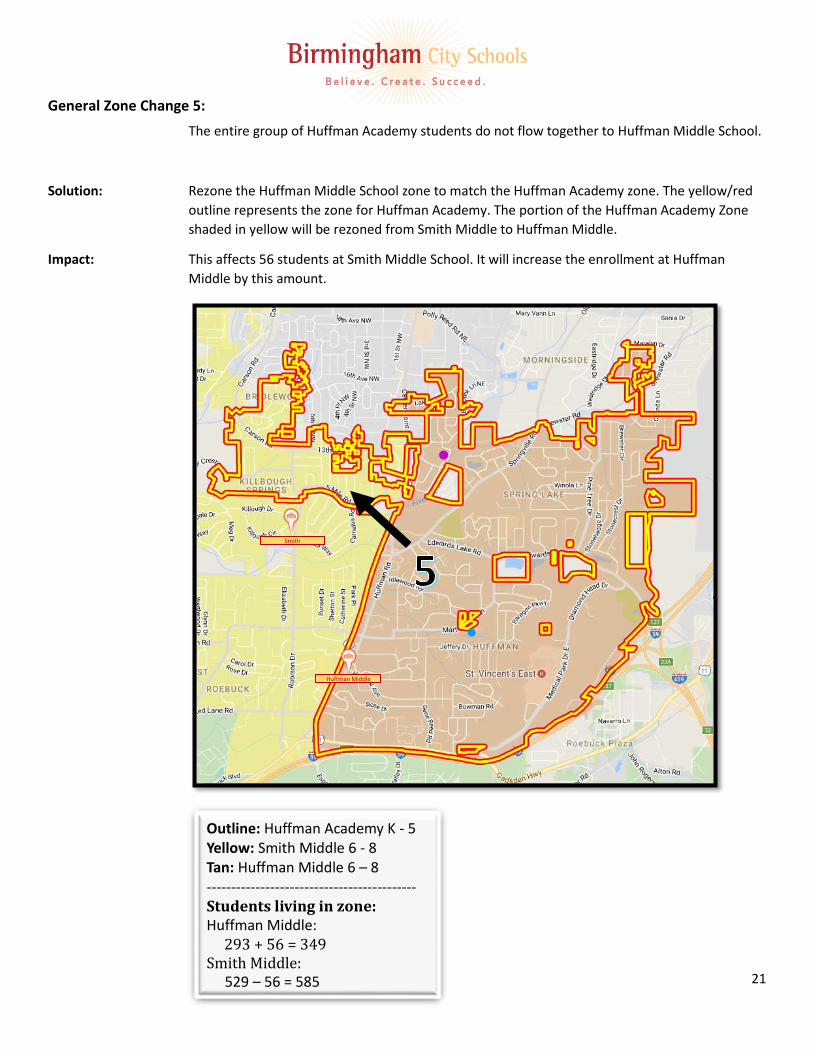
General Zone Change 5:
The entire group of Huffman Academy students do not flow together to Huffman Middle School.
Solution: Rezone the Huffman Middle School zone to match the Huffman Academy zone. The yellow/red
outline represents the zone for Huffman Academy. The portion of the Huffman Academy Zone
shaded in yellow will be rezoned from Smith Middle to Huffman Middle.
Impact: This affects 56 students at Smith Middle School. It will increase the enrollment at Huffman
Middle by this amount.
Smith
Huffman Middle
Outline: Huffman Academy K - 5
Yellow: Smith Middle 6 - 8
Tan: Huffman Middle 6 – 8
------------------------------------------- Students living in zone: Huffman Middle: 293 + 56 = 349
Smith Middle: 529 – 56 = 585
22
Next Steps:
SY 2018-2019: Stakeholder Input
August 2018:
Establish a Steering Committee
Steering Committee Meeting #1: Set criteria and develop process
Solicit stakeholder input via community meetings and online survey
September 2018: Steering Committee Meeting #2: Develop zoning options
October 2018: Provide the BOE with a progress update during work session
November 2018: Steering Committee Meeting #3: Review and Revise zoning options
December 2018: Community Dialogue: Present options to board and community for feedback
January 2019: Present final recommendation for approval at BOE meeting
SY 2019-2020: Implementation
February 2019: Select an Implementation Committee (sub-committee of steering committee)
March 2019:
Implementation Committee Meeting #1: Identify areas for change, develop process and timeline
Share final plan with parents and community stakeholders
April 2019: Implementation Committee Meeting #2: Review process and monitor timeline progress
May 2019:
Implementation Committee Meeting #3: Review process and monitor timeline progress
Provide update at BOE work session
June 2019: Implementation Committee Meeting #4: Review process and monitor timeline progress
August 2019: Begin school year with new zones and configurations
September 2019: Implementation Committee Meeting #5: Review student enrollment figures and
identify areas of success, areas for improvement and next steps if applicable

23
Appendix A: FY2019 LEA Unit Breakdown
Retrieved on 5/21/2018 from:
http://www.alsde.edu/dept/data/Foundation%20Reports%20Tabbed/FY%202019%20LEA%20Units.pdf

24

25
Appendix B: Grade Divisors