· 2018. 7. 24. · provincial overview, page 1 % disposed under 8 months % disposed over 8 months...
TRANSCRIPT

Provincial Overview, Page 1
% Disposed Under 8 Months
% Disposed Over 8 Months
% Disposed Over 12 Months
For Cases Disposed
Before Trial Date
For Cases Disposed at Trial Without
Trial
For Cases Disposed
Following a Trial
For All Cases
2011/Jul 90.5% 9.5% 3.4% 5.3 92 274 344 1052011/Aug 89.7% 10.3% 3.1% 5.1 95 286 339 1082011/Sep 87.7% 12.4% 4.3% 5.6 102 307 357 1182011/Oct 90.2% 9.8% 3.8% 5.6 95 300 291 1082011/Nov 89.6% 10.4% 4.5% 5.6 100 261 342 1132011/Dec 88.7% 11.3% 4.3% 5.6 100 296 430 1162012/Jan 89.6% 10.4% 3.9% 5.5 99 280 294 1132012/Feb 88.2% 11.9% 4.4% 5.8 106 287 355 1212012/Mar 87.8% 12.3% 3.5% 5.6 101 293 336 1172012/Apr 86.4% 13.6% 4.2% 5.7 108 323 367 1242012/May 88.7% 11.3% 4.0% 5.7 107 285 345 1202012/Jun 87.4% 12.6% 4.4% 6.0 105 306 361 121Jul '11 to Jun '12 Total 88.7% 11.3% 4.0% 5.6 101 291 345 1152012/Jul 88.9% 11.1% 3.4% 5.4 101 282 376 1132012/Aug 89.4% 10.6% 3.3% 5.3 99 318 293 1122012/Sep 87.0% 13.0% 4.0% 5.7 103 311 369 1202012/Oct 88.2% 11.8% 4.9% 5.6 108 295 316 1212012/Nov 87.1% 12.9% 4.7% 5.7 107 296 363 1232012/Dec 86.3% 13.7% 5.0% 5.9 112 300 324 1262013/Jan 87.5% 12.5% 4.1% 5.4 100 311 382 1192013/Feb 85.4% 14.6% 4.9% 6.0 113 317 344 1292013/Mar 85.0% 15.0% 5.0% 5.7 115 325 308 1272013/Apr 88.0% 12.1% 4.0% 5.8 110 313 271 1262013/May 85.7% 14.3% 5.2% 6.0 123 299 312 1362013/Jun 83.4% 16.6% 6.2% 6.2 117 296 297 133Jul '12 to Jun '13 Total 86.9% 13.1% 4.5% 5.7 109 305 329 123
Average Appearances to Disposition: Average of all appearances from the first to last court appearance.
Case: Refers to all charges on an Information for each single accused.
Information: The document that sets out the name(s) of the accused and all the charges against the accused.
Date
% of Cases Disposed (for cases without bench warrants)
Average Appearances to
Disposition (for cases
without bench warrants)
Average Days to Disposition (for cases without bench warrants)
Cases Disposed: Refers to Cases completed in the Ontario Court of Justice including those committed for trial in the Superior Court of Justice.
Average Days to Disposition: Average number of days from when the first court appearance was scheduled to the date of the final court appearance.
Disposition Rate StatisticsYouth Criminal Cases
Ontario Court of Justice
July 2011 to June 2013Provincial Overview

Central East Overview, Page 2
% Disposed Under 8 Months
% Disposed Over 8 Months
% Disposed Over 12 Months
For Cases Disposed
Before Trial Date
For Cases Disposed at Trial Without
Trial
For Cases Disposed
Following a Trial
For All Cases
2011/Jul 93.0% 7.0% 2.2% 4.2 89 303 444 962011/Aug 91.7% 8.3% 2.5% 4.6 96 494 760 1052011/Sep 93.2% 6.8% 2.2% 4.7 90 245 367 942011/Oct 92.9% 7.1% 2.2% 4.9 94 377 178 982011/Nov 90.0% 10.0% 3.7% 5.0 100 342 309 1062011/Dec 94.3% 5.7% 2.6% 4.8 92 233 555 1022012/Jan 95.6% 4.4% 1.9% 4.3 93 199 348 982012/Feb 92.8% 7.2% 1.3% 4.9 99 155 388 1032012/Mar 92.9% 7.1% 1.3% 4.4 90 223 378 962012/Apr 88.6% 11.4% 4.0% 5.0 114 243 361 1222012/May 95.2% 4.8% 0.6% 4.1 92 110 343 932012/Jun 89.4% 10.6% 2.6% 5.2 103 294 296 117Jul '11 to Jun '12 Total 92.5% 7.5% 2.3% 4.7 96 263 387 1022012/Jul 94.3% 5.7% 1.4% 4.4 98 224 327 1042012/Aug 92.9% 7.1% 1.8% 4.4 98 271 166 1012012/Sep 92.0% 8.1% 2.8% 5.0 114 302 488 1202012/Oct 91.0% 9.0% 4.2% 4.6 107 298 292 1152012/Nov 89.5% 10.5% 1.7% 4.7 103 278 249 1082012/Dec 88.2% 11.8% 3.1% 5.0 109 302 449 1212013/Jan 90.7% 9.3% 3.6% 4.4 96 367 324 1142013/Feb 90.2% 9.8% 3.6% 4.8 100 385 376 1122013/Mar 90.6% 9.4% 1.8% 5.0 109 362 268 1122013/Apr 88.8% 11.2% 3.9% 5.6 117 351 208 1262013/May 88.7% 11.3% 2.6% 5.3 119 269 238 1222013/Jun 88.5% 11.5% 4.2% 5.1 109 247 307 117Jul '12 to Jun '13 Total 90.5% 9.5% 2.9% 4.9 106 306 312 114
Average Appearances to Disposition: Average of all appearances from the first to last court appearance.
Case: Refers to all charges on an Information for each single accused.
Information: The document that sets out the name(s) of the accused and all the charges against the accused.
Date
% of Cases Disposed (for cases without bench warrants)
Average Appearances to
Disposition (for cases
without bench warrants)
Average Days to Disposition (for cases without bench warrants)
Cases Disposed: Refers to Cases completed in the Ontario Court of Justice including those committed for trial in the Superior Court of Justice.
Average Days to Disposition: Average number of days from when the first court appearance was scheduled to the date of the final court appearance.
Disposition Rate StatisticsYouth Criminal Cases
Ontario Court of Justice
July 2011 to June 2013Central East Overview

Barrie, Page 3
% Disposed Under 8 Months
% Disposed Over 8 Months
% Disposed Over 12 Months
For Cases Disposed
Before Trial Date
For Cases Disposed at Trial Without
Trial
For Cases Disposed
Following a Trial
For All Cases
2011/Jul 91.2% 8.8% 3.5% 4.7 101 356 756 1172011/Aug 91.7% 8.3% 1.0% 4.1 91 294 932011/Sep 94.8% 5.2% 2.6% 4.7 106 147 388 1112011/Oct 96.6% 3.4% 0.0% 4.4 99 352 1032011/Nov 88.8% 11.3% 7.5% 4.9 111 295 1162011/Dec 96.5% 3.5% 1.2% 4.9 106 1,281 1202012/Jan 94.1% 5.9% 1.5% 4.3 90 555 1032012/Feb 95.7% 4.4% 0.0% 4.0 101 159 1042012/Mar 94.7% 5.3% 1.1% 4.5 112 322 1142012/Apr 98.3% 1.8% 0.0% 4.6 107 236 1092012/May 93.9% 6.1% 0.0% 4.2 96 234 982012/Jun 88.3% 11.7% 1.7% 5.3 126 126Jul '11 to Jun '12 Total 93.7% 6.3% 1.7% 4.5 103 222 707 1092012/Jul 97.5% 2.5% 1.3% 4.9 100 198 1012012/Aug 93.2% 6.8% 2.3% 4.3 108 265 135 1102012/Sep 97.8% 2.3% 0.0% 5.0 113 1132012/Oct 97.3% 2.7% 0.0% 3.7 100 289 229 1042012/Nov 89.9% 10.1% 0.0% 4.6 106 291 1092012/Dec 80.0% 20.0% 1.4% 5.5 139 198 310 1432013/Jan 93.6% 6.5% 1.6% 4.6 106 376 1102013/Feb 93.4% 6.6% 0.0% 4.4 105 1052013/Mar 94.7% 5.3% 0.0% 4.5 111 298 268 1152013/Apr 89.2% 10.8% 2.7% 5.6 126 441 330 1332013/May 83.9% 16.1% 3.6% 5.3 142 325 1492013/Jun 85.3% 14.7% 6.7% 5.6 134 239 257 144Jul '12 to Jun '13 Total 91.7% 8.3% 1.6% 4.8 115 270 279 119
Average Appearances to Disposition: Average of all appearances from the first to last court appearance.
Case: Refers to all charges on an Information for each single accused.
Information: The document that sets out the name(s) of the accused and all the charges against the accused.
Date
% of Cases Disposed (for cases without bench warrants)
Average Appearances to
Disposition (for cases
without bench warrants)
Average Days to Disposition (for cases without bench warrants)
Cases Disposed: Refers to Cases completed in the Ontario Court of Justice including those committed for trial in the Superior Court of Justice.
Average Days to Disposition: Average number of days from when the first court appearance was scheduled to the date of the final court appearance.
Disposition Rate StatisticsYouth Criminal Cases
Ontario Court of Justice
July 2011 to June 2013Barrie

Bracebridge, Page 4
% Disposed Under 8 Months
% Disposed Over 8 Months
% Disposed Over 12 Months
For Cases Disposed
Before Trial Date
For Cases Disposed at Trial Without
Trial
For Cases Disposed
Following a Trial
For All Cases
2011/Jul 0.0% 0.0% 3.4 94 942011/Aug 80.0% 20.0% 6.7% 5.1 138 1382011/Sep 88.9% 11.1% 11.1% 3.3 71 712011/Oct 0.0% 0.0% 2.0 41 412011/Nov 36.4% 63.6% 36.4% 8.5 155 390 429 2692011/Dec 0.0% 0.0% 2.8 44 442012/Jan 0.0% 0.0% 3.1 55 552012/Feb 93.8% 6.3% 0.0% 3.7 85 852012/Mar 0.0% 0.0% 1.3 38 382012/Apr 88.9% 11.1% 0.0% 4.8 113 154 1172012/May 91.7% 8.3% 0.0% 3.3 85 852012/Jun 54.6% 45.5% 45.5% 8.6 140 397 516 267Jul '11 to Jun '12 Total 85.3% 14.7% 8.5% 4.3 88 364 458 1142012/Jul 71.4% 28.6% 0.0% 5.3 97 235 1562012/Aug 84.6% 15.4% 7.7% 4.7 68 553 1052012/Sep 0.0% 0.0% 2.3 36 362012/Oct 0.0% 0.0% 3.3 40 402012/Nov 0.0% 0.0% 3.8 75 752012/Dec 0.0% 0.0% 4.1 128 1282013/Jan 0.0% 0.0% 1.9 38 382013/Feb 0.0% 0.0% 3.2 47 472013/Mar 0.0% 0.0% 2.4 49 492013/Apr 91.7% 8.3% 0.0% 3.0 64 642013/May 0.0% 0.0% 3.3 117 1172013/Jun 0.0% 0.0% 3.3 77 77Jul '12 to Jun '13 Total 95.3% 4.7% 0.9% 3.4 76 315 85
Average Appearances to Disposition: Average of all appearances from the first to last court appearance.
Case: Refers to all charges on an Information for each single accused.
Information: The document that sets out the name(s) of the accused and all the charges against the accused.
Date
% of Cases Disposed (for cases without bench warrants)
Average Appearances to
Disposition (for cases
without bench warrants)
Average Days to Disposition (for cases without bench warrants)
Cases Disposed: Refers to Cases completed in the Ontario Court of Justice including those committed for trial in the Superior Court of Justice.
Average Days to Disposition: Average number of days from when the first court appearance was scheduled to the date of the final court appearance.
Disposition Rate StatisticsYouth Criminal Cases
Ontario Court of Justice
July 2011 to June 2013Bracebridge

Cobourg, Page 5
% Disposed Under 8 Months
% Disposed Over 8 Months
% Disposed Over 12 Months
For Cases Disposed
Before Trial Date
For Cases Disposed at Trial Without
Trial
For Cases Disposed
Following a Trial
For All Cases
2011/Jul 0.0% 0.0% 4.0 82 219 892011/Aug 93.3% 6.7% 0.0% 4.8 91 912011/Sep 94.7% 5.3% 0.0% 5.7 80 331 932011/Oct 57.1% 42.9% 7.1% 7.5 160 283 27 1682011/Nov 0.0% 0.0% 4.0 79 792011/Dec 0.0% 0.0% 4.6 104 1042012/Jan 0.0% 0.0% 4.5 142 1422012/Feb 0.0% 0.0% 7.8 125 1252012/Mar 90.9% 9.1% 9.1% 3.9 46 548 912012/Apr 63.6% 36.4% 9.1% 6.2 168 286 286 1902012/May 93.3% 6.7% 0.0% 4.7 67 343 852012/Jun 76.2% 23.8% 4.8% 7.2 115 273 319 164Jul '11 to Jun '12 Total 88.8% 11.2% 2.4% 5.6 100 277 307 1172012/Jul 0.0% 0.0% 4.8 75 752012/Aug 0.0% 0.0% 3.3 78 782012/Sep 0.0% 0.0% 3.0 86 862012/Oct 81.8% 18.2% 18.2% 5.2 130 366 1522012/Nov 0.0% 0.0% 3.4 57 572012/Dec 85.7% 14.3% 14.3% 4.0 115 1152013/Jan 0.0% 0.0% 2.8 86 862013/Feb 92.3% 7.7% 7.7% 6.2 117 442 1422013/Mar 90.0% 10.0% 10.0% 6.3 173 1732013/Apr 0.0% 0.0% 6.3 74 88 792013/May 0.0% 0.0% 3.5 15 152013/Jun 0.0% 0.0% 6.4 107 107Jul '12 to Jun '13 Total 94.8% 5.2% 5.2% 4.8 102 299 109
Average Appearances to Disposition: Average of all appearances from the first to last court appearance.
Case: Refers to all charges on an Information for each single accused.
Information: The document that sets out the name(s) of the accused and all the charges against the accused.
Date
% of Cases Disposed (for cases without bench warrants)
Average Appearances to
Disposition (for cases
without bench warrants)
Average Days to Disposition (for cases without bench warrants)
Cases Disposed: Refers to Cases completed in the Ontario Court of Justice including those committed for trial in the Superior Court of Justice.
Average Days to Disposition: Average number of days from when the first court appearance was scheduled to the date of the final court appearance.
Disposition Rate StatisticsYouth Criminal Cases
Ontario Court of Justice
July 2011 to June 2013Cobourg

Durham, Page 6
% Disposed Under 8 Months
% Disposed Over 8 Months
% Disposed Over 12 Months
For Cases Disposed
Before Trial Date
For Cases Disposed at Trial Without
Trial
For Cases Disposed
Following a Trial
For All Cases
2011/Jul 92.7% 7.3% 2.8% 5.1 75 230 381 852011/Aug 94.4% 5.6% 0.8% 4.4 86 315 882011/Sep 96.7% 3.3% 0.8% 4.2 70 357 752011/Oct 95.4% 4.6% 1.9% 4.6 63 640 372 712011/Nov 95.2% 4.8% 2.1% 5.3 76 499 164 802011/Dec 96.0% 4.0% 3.0% 5.6 71 151 542 832012/Jan 95.0% 5.0% 2.0% 4.5 79 204 249 862012/Feb 98.3% 1.7% 0.0% 4.5 76 113 216 792012/Mar 95.1% 5.0% 1.7% 3.8 66 181 378 752012/Apr 82.1% 17.9% 7.4% 5.5 128 325 250 1372012/May 96.9% 3.1% 0.0% 4.2 88 27 872012/Jun 89.8% 10.2% 0.8% 5.1 96 282 207 107Jul '11 to Jun '12 Total 94.2% 5.8% 1.8% 4.7 80 217 315 872012/Jul 92.7% 7.3% 3.2% 4.4 95 296 327 1062012/Aug 95.2% 4.8% 0.0% 4.6 77 238 182 842012/Sep 93.4% 6.6% 3.3% 4.3 98 134 541 1082012/Oct 93.6% 6.4% 1.8% 4.3 96 377 243 1002012/Nov 86.7% 13.3% 4.0% 4.6 105 234 1112012/Dec 94.3% 5.7% 1.1% 3.6 84 243 962013/Jan 91.1% 8.9% 0.0% 4.5 95 179 307 1112013/Feb 88.0% 12.1% 6.0% 4.4 74 396 356 1012013/Mar 94.4% 5.6% 1.9% 4.8 87 426 942013/Apr 89.4% 10.6% 7.1% 5.6 103 392 117 1232013/May 92.7% 7.3% 0.8% 4.9 88 130 194 922013/Jun 91.7% 8.3% 1.7% 3.7 68 256 387 85Jul '12 to Jun '13 Total 92.1% 7.9% 2.6% 4.5 90 286 298 101
Average Appearances to Disposition: Average of all appearances from the first to last court appearance.
Case: Refers to all charges on an Information for each single accused.
Information: The document that sets out the name(s) of the accused and all the charges against the accused.
Date
% of Cases Disposed (for cases without bench warrants)
Average Appearances to
Disposition (for cases
without bench warrants)
Average Days to Disposition (for cases without bench warrants)
Cases Disposed: Refers to Cases completed in the Ontario Court of Justice including those committed for trial in the Superior Court of Justice.
Average Days to Disposition: Average number of days from when the first court appearance was scheduled to the date of the final court appearance.
Disposition Rate StatisticsYouth Criminal Cases
Ontario Court of Justice
July 2011 to June 2013Durham
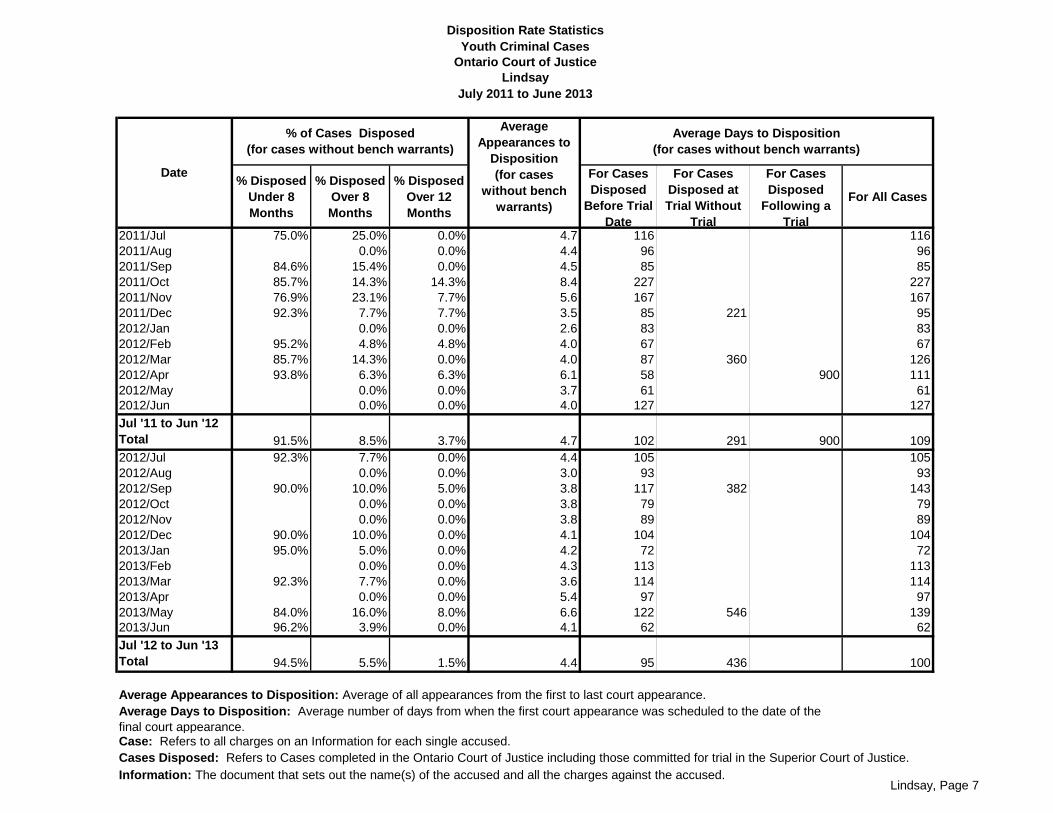
Lindsay, Page 7
% Disposed Under 8 Months
% Disposed Over 8 Months
% Disposed Over 12 Months
For Cases Disposed
Before Trial Date
For Cases Disposed at Trial Without
Trial
For Cases Disposed
Following a Trial
For All Cases
2011/Jul 75.0% 25.0% 0.0% 4.7 116 1162011/Aug 0.0% 0.0% 4.4 96 962011/Sep 84.6% 15.4% 0.0% 4.5 85 852011/Oct 85.7% 14.3% 14.3% 8.4 227 2272011/Nov 76.9% 23.1% 7.7% 5.6 167 1672011/Dec 92.3% 7.7% 7.7% 3.5 85 221 952012/Jan 0.0% 0.0% 2.6 83 832012/Feb 95.2% 4.8% 4.8% 4.0 67 672012/Mar 85.7% 14.3% 0.0% 4.0 87 360 1262012/Apr 93.8% 6.3% 6.3% 6.1 58 900 1112012/May 0.0% 0.0% 3.7 61 612012/Jun 0.0% 0.0% 4.0 127 127Jul '11 to Jun '12 Total 91.5% 8.5% 3.7% 4.7 102 291 900 1092012/Jul 92.3% 7.7% 0.0% 4.4 105 1052012/Aug 0.0% 0.0% 3.0 93 932012/Sep 90.0% 10.0% 5.0% 3.8 117 382 1432012/Oct 0.0% 0.0% 3.8 79 792012/Nov 0.0% 0.0% 3.8 89 892012/Dec 90.0% 10.0% 0.0% 4.1 104 1042013/Jan 95.0% 5.0% 0.0% 4.2 72 722013/Feb 0.0% 0.0% 4.3 113 1132013/Mar 92.3% 7.7% 0.0% 3.6 114 1142013/Apr 0.0% 0.0% 5.4 97 972013/May 84.0% 16.0% 8.0% 6.6 122 546 1392013/Jun 96.2% 3.9% 0.0% 4.1 62 62Jul '12 to Jun '13 Total 94.5% 5.5% 1.5% 4.4 95 436 100
Average Appearances to Disposition: Average of all appearances from the first to last court appearance.
Case: Refers to all charges on an Information for each single accused.
Information: The document that sets out the name(s) of the accused and all the charges against the accused.
Date
% of Cases Disposed (for cases without bench warrants)
Average Appearances to
Disposition (for cases
without bench warrants)
Average Days to Disposition (for cases without bench warrants)
Cases Disposed: Refers to Cases completed in the Ontario Court of Justice including those committed for trial in the Superior Court of Justice.
Average Days to Disposition: Average number of days from when the first court appearance was scheduled to the date of the final court appearance.
Disposition Rate StatisticsYouth Criminal Cases
Ontario Court of Justice
July 2011 to June 2013Lindsay

Newmarket, Page 8
% Disposed Under 8 Months
% Disposed Over 8 Months
% Disposed Over 12 Months
For Cases Disposed
Before Trial Date
For Cases Disposed at Trial Without
Trial
For Cases Disposed
Following a Trial
For All Cases
2011/Jul 95.6% 4.4% 1.9% 3.7 91 408 319 942011/Aug 89.1% 10.9% 5.1% 5.0 109 578 1,315 1282011/Sep 93.3% 6.7% 3.0% 5.1 100 450 1022011/Oct 91.4% 8.6% 2.2% 4.8 103 326 135 1052011/Nov 89.7% 10.3% 2.1% 5.0 106 240 359 1102011/Dec 91.4% 8.6% 1.0% 4.7 96 228 322 1042012/Jan 95.1% 5.0% 4.0% 4.9 124 131 1242012/Feb 80.2% 19.8% 4.2% 6.7 136 257 559 1422012/Mar 89.3% 10.7% 0.8% 5.7 117 1172012/Apr 88.1% 11.9% 3.4% 5.3 127 147 1282012/May 91.2% 8.8% 2.9% 4.3 114 279 1172012/Jun 94.6% 5.4% 1.1% 4.9 93 250 103Jul '11 to Jun '12 Total 91.0% 9.0% 2.6% 5.0 108 314 420 1132012/Jul 95.1% 4.9% 0.0% 4.1 109 168 1102012/Aug 89.9% 10.1% 3.4% 4.4 116 115 1162012/Sep 83.5% 16.5% 5.1% 6.5 141 306 1452012/Oct 79.1% 20.9% 13.4% 6.4 150 185 475 1562012/Nov 87.8% 12.2% 2.0% 5.2 114 337 302 1212012/Dec 81.7% 18.3% 8.5% 7.5 116 561 603 1492013/Jan 86.7% 13.3% 7.6% 4.6 97 414 1332013/Feb 85.8% 14.2% 5.8% 5.3 105 366 370 1232013/Mar 84.7% 15.3% 3.5% 5.8 123 1232013/Apr 84.0% 16.0% 3.2% 6.9 141 280 254 1482013/May 81.5% 18.5% 4.4% 6.3 149 1492013/Jun 87.6% 12.4% 4.5% 5.5 121 157 302 126Jul '12 to Jun '13 Total 86.1% 13.9% 4.8% 5.6 122 343 396 131
Average Appearances to Disposition: Average of all appearances from the first to last court appearance.
Case: Refers to all charges on an Information for each single accused.
Information: The document that sets out the name(s) of the accused and all the charges against the accused.
Date
% of Cases Disposed (for cases without bench warrants)
Average Appearances to
Disposition (for cases
without bench warrants)
Average Days to Disposition (for cases without bench warrants)
Cases Disposed: Refers to Cases completed in the Ontario Court of Justice including those committed for trial in the Superior Court of Justice.
Average Days to Disposition: Average number of days from when the first court appearance was scheduled to the date of the final court appearance.
Disposition Rate StatisticsYouth Criminal Cases
Ontario Court of Justice
July 2011 to June 2013Newmarket

Orillia, Page 9
% Disposed Under 8 Months
% Disposed Over 8 Months
% Disposed Over 12 Months
For Cases Disposed
Before Trial Date
For Cases Disposed at Trial Without
Trial
For Cases Disposed
Following a Trial
For All Cases
2011/Jul 75.0% 25.0% 5.0% 3.6 130 1302011/Aug 50.0% 50.0% 25.0% 8.0 171 617 2822011/Sep 77.8% 22.2% 5.6% 4.9 120 1202011/Oct 90.0% 10.0% 5.0% 4.2 129 1292011/Nov 82.6% 17.4% 0.0% 3.6 133 1332011/Dec 82.4% 17.7% 17.7% 4.8 134 495 1552012/Jan 96.8% 3.2% 0.0% 3.2 71 183 752012/Feb 0.0% 0.0% 3.0 87 872012/Mar 76.9% 23.1% 0.0% 4.9 116 243 1262012/Apr 0.0% 0.0% 2.2 54 542012/May 0.0% 0.0% 2.3 109 1092012/Jun 0.0% 0.0% 3.0 94 94Jul '11 to Jun '12 Total 87.3% 12.7% 3.7% 3.8 108 385 1142012/Jul 91.7% 8.3% 0.0% 3.7 97 195 1302012/Aug 88.9% 11.1% 0.0% 3.4 117 1172012/Sep 92.9% 7.1% 0.0% 4.2 124 1242012/Oct 93.8% 6.3% 6.3% 3.5 112 350 1572012/Nov 0.0% 0.0% 3.4 95 952012/Dec 0.0% 0.0% 3.7 101 1012013/Jan 90.9% 9.1% 9.1% 5.2 133 1332013/Feb 92.9% 7.1% 0.0% 4.4 165 1652013/Mar 63.6% 36.4% 0.0% 5.6 157 1572013/Apr 75.0% 25.0% 12.5% 4.2 167 225 1712013/May 0.0% 0.0% 4.5 140 1402013/Jun 76.9% 23.1% 7.7% 4.2 152 341 167Jul '12 to Jun '13 Total 88.7% 11.3% 3.1% 4.1 131 266 138
Average Appearances to Disposition: Average of all appearances from the first to last court appearance.
Case: Refers to all charges on an Information for each single accused.
Information: The document that sets out the name(s) of the accused and all the charges against the accused.
Date
% of Cases Disposed (for cases without bench warrants)
Average Appearances to
Disposition (for cases
without bench warrants)
Average Days to Disposition (for cases without bench warrants)
Cases Disposed: Refers to Cases completed in the Ontario Court of Justice including those committed for trial in the Superior Court of Justice.
Average Days to Disposition: Average number of days from when the first court appearance was scheduled to the date of the final court appearance.
Disposition Rate StatisticsYouth Criminal Cases
Ontario Court of Justice
July 2011 to June 2013Orillia

Peterborough, Page 10
% Disposed Under 8 Months
% Disposed Over 8 Months
% Disposed Over 12 Months
For Cases Disposed
Before Trial Date
For Cases Disposed at Trial Without
Trial
For Cases Disposed
Following a Trial
For All Cases
2011/Jul 0.0% 0.0% 4.1 63 632011/Aug 0.0% 0.0% 4.5 67 204 722011/Sep 85.0% 15.0% 0.0% 5.1 81 812011/Oct 98.0% 2.0% 0.0% 5.1 77 772011/Nov 96.6% 3.5% 0.0% 4.2 96 962011/Dec 0.0% 0.0% 2.8 96 962012/Jan 96.4% 3.6% 0.0% 4.2 89 892012/Feb 95.0% 5.0% 0.0% 3.6 80 246 892012/Mar 0.0% 0.0% 3.3 61 208 702012/Apr 0.0% 0.0% 4.1 83 119 872012/May 0.0% 0.0% 3.6 50 68 522012/Jun 88.9% 11.1% 0.0% 5.3 88 88Jul '11 to Jun '12 Total 96.5% 3.5% 0.0% 4.3 79 157 177 812012/Jul 95.0% 5.0% 0.0% 3.7 55 552012/Aug 96.8% 3.2% 0.0% 4.9 71 246 772012/Sep 85.7% 14.3% 7.1% 6.8 106 382 1262012/Oct 87.9% 12.1% 0.0% 5.1 89 301 218 1032012/Nov 92.0% 8.0% 0.0% 4.4 69 222 812012/Dec 0.0% 0.0% 3.1 71 125 742013/Jan 88.9% 11.1% 0.0% 4.6 93 932013/Feb 0.0% 0.0% 4.7 92 922013/Mar 96.7% 3.3% 0.0% 5.2 83 832013/Apr 97.0% 3.0% 0.0% 4.0 79 792013/May 0.0% 0.0% 3.8 90 902013/Jun 85.3% 14.7% 5.9% 6.7 123 123Jul '12 to Jun '13 Total 93.6% 6.4% 1.1% 4.8 85 274 231 90
Average Appearances to Disposition: Average of all appearances from the first to last court appearance.
Case: Refers to all charges on an Information for each single accused.
Information: The document that sets out the name(s) of the accused and all the charges against the accused.
Date
% of Cases Disposed (for cases without bench warrants)
Average Appearances to
Disposition (for cases
without bench warrants)
Average Days to Disposition (for cases without bench warrants)
Cases Disposed: Refers to Cases completed in the Ontario Court of Justice including those committed for trial in the Superior Court of Justice.
Average Days to Disposition: Average number of days from when the first court appearance was scheduled to the date of the final court appearance.
Disposition Rate StatisticsYouth Criminal Cases
Ontario Court of Justice
July 2011 to June 2013Peterborough

Central West Overview, Page 11
% Disposed Under 8 Months
% Disposed Over 8 Months
% Disposed Over 12 Months
For Cases Disposed
Before Trial Date
For Cases Disposed at Trial Without
Trial
For Cases Disposed
Following a Trial
For All Cases
2011/Jul 89.8% 10.2% 5.1% 5.6 101 282 340 1162011/Aug 85.6% 14.4% 4.9% 5.4 109 318 326 1272011/Sep 82.7% 17.3% 5.9% 6.1 113 368 432 1392011/Oct 85.8% 14.3% 6.1% 5.9 105 338 386 1312011/Nov 87.3% 12.7% 6.0% 6.2 105 279 407 1252011/Dec 83.9% 16.1% 7.5% 5.9 102 362 692 1332012/Jan 84.0% 16.0% 6.8% 6.0 109 353 401 1312012/Feb 85.1% 14.9% 5.6% 5.8 113 366 402 1362012/Mar 82.5% 17.6% 6.5% 6.0 107 346 490 1372012/Apr 86.8% 13.2% 4.6% 5.6 114 345 406 1302012/May 84.2% 15.8% 7.1% 7.0 126 314 542 1472012/Jun 84.9% 15.1% 6.7% 6.2 107 378 489 132Jul '11 to Jun '12 Total 85.2% 14.8% 6.1% 6.0 110 337 433 1322012/Jul 82.3% 17.7% 5.6% 5.6 119 358 418 1392012/Aug 85.8% 14.3% 5.3% 5.3 108 371 250 1232012/Sep 81.6% 18.4% 4.7% 6.0 106 328 366 1282012/Oct 81.6% 18.4% 7.2% 6.5 126 373 294 1402012/Nov 81.8% 18.2% 10.1% 6.7 132 352 528 1542012/Dec 81.0% 19.0% 8.6% 6.4 135 332 425 1522013/Jan 83.3% 16.7% 5.1% 5.9 113 309 404 1302013/Feb 81.3% 18.7% 5.7% 7.3 130 320 397 1492013/Mar 76.9% 23.1% 10.1% 6.7 143 378 269 1582013/Apr 80.5% 19.5% 7.5% 6.6 131 457 271 1572013/May 80.6% 19.4% 8.8% 6.1 155 348 306 1732013/Jun 80.5% 19.5% 7.7% 6.3 122 325 420 142Jul '12 to Jun '13 Total 81.4% 18.6% 7.2% 6.3 127 356 366 146
Average Appearances to Disposition: Average of all appearances from the first to last court appearance.
Case: Refers to all charges on an Information for each single accused.
Information: The document that sets out the name(s) of the accused and all the charges against the accused.
Date
% of Cases Disposed (for cases without bench warrants)
Average Appearances to
Disposition (for cases
without bench warrants)
Average Days to Disposition (for cases without bench warrants)
Cases Disposed: Refers to Cases completed in the Ontario Court of Justice including those committed for trial in the Superior Court of Justice.
Average Days to Disposition: Average number of days from when the first court appearance was scheduled to the date of the final court appearance.
Disposition Rate StatisticsYouth Criminal Cases
Ontario Court of Justice
July 2011 to June 2013Central West Overview

Brampton, Page 12
% Disposed Under 8 Months
% Disposed Over 8 Months
% Disposed Over 12 Months
For Cases Disposed
Before Trial Date
For Cases Disposed at Trial Without
Trial
For Cases Disposed
Following a Trial
For All Cases
2011/Jul 82.6% 17.4% 9.0% 5.7 121 500 340 1492011/Aug 81.9% 18.1% 4.8% 5.1 114 322 330 1352011/Sep 78.4% 21.6% 9.9% 6.1 121 375 516 1662011/Oct 83.6% 16.5% 5.9% 6.1 124 312 353 1482011/Nov 85.1% 15.0% 6.2% 5.4 95 306 394 1292011/Dec 87.8% 12.2% 3.7% 4.9 102 374 576 1182012/Jan 83.3% 16.7% 8.0% 6.2 102 336 435 1332012/Feb 87.2% 12.9% 3.4% 5.4 109 304 267 1222012/Mar 83.5% 16.5% 5.9% 5.6 97 349 342 1292012/Apr 87.6% 12.4% 4.7% 5.2 113 365 406 1302012/May 83.9% 16.1% 11.5% 6.6 117 334 609 1582012/Jun 79.3% 20.7% 10.1% 6.6 108 380 497 146Jul '11 to Jun '12 Total 83.7% 16.3% 6.9% 5.7 110 349 413 1382012/Jul 80.0% 20.0% 6.5% 5.7 122 327 440 1492012/Aug 86.4% 13.6% 5.0% 5.5 118 337 1342012/Sep 75.7% 24.3% 8.3% 6.0 115 367 344 1492012/Oct 81.6% 18.4% 5.8% 6.5 131 363 356 1452012/Nov 81.9% 18.1% 11.5% 6.4 134 399 611 1652012/Dec 79.9% 20.1% 8.5% 6.4 130 300 351 1482013/Jan 84.5% 15.5% 6.9% 5.5 104 330 375 1332013/Feb 77.7% 22.3% 8.6% 6.8 134 337 365 1602013/Mar 76.6% 23.4% 9.2% 6.5 139 356 251 1572013/Apr 79.8% 20.3% 10.1% 6.1 123 367 278 1512013/May 79.1% 20.9% 9.2% 5.7 160 317 314 1812013/Jun 77.5% 22.5% 9.2% 5.9 121 321 406 150Jul '12 to Jun '13 Total 80.0% 20.0% 8.3% 6.1 129 344 362 153
Average Appearances to Disposition: Average of all appearances from the first to last court appearance.
Case: Refers to all charges on an Information for each single accused.
Information: The document that sets out the name(s) of the accused and all the charges against the accused.
Date
% of Cases Disposed (for cases without bench warrants)
Average Appearances to
Disposition (for cases
without bench warrants)
Average Days to Disposition (for cases without bench warrants)
Cases Disposed: Refers to Cases completed in the Ontario Court of Justice including those committed for trial in the Superior Court of Justice.
Average Days to Disposition: Average number of days from when the first court appearance was scheduled to the date of the final court appearance.
Disposition Rate StatisticsYouth Criminal Cases
Ontario Court of Justice
July 2011 to June 2013Brampton

Brantford, Page 13
% Disposed Under 8 Months
% Disposed Over 8 Months
% Disposed Over 12 Months
For Cases Disposed
Before Trial Date
For Cases Disposed at Trial Without
Trial
For Cases Disposed
Following a Trial
For All Cases
2011/Jul 94.6% 5.4% 5.4% 5.7 107 1072011/Aug 88.5% 11.5% 7.7% 5.3 105 562 404 1252011/Sep 96.8% 3.2% 3.2% 5.0 67 626 449 822011/Oct 91.2% 8.8% 5.3% 5.1 80 457 1002011/Nov 92.1% 7.9% 4.8% 5.5 97 153 1032011/Dec 83.3% 16.7% 10.0% 5.7 58 358 1182012/Jan 86.2% 13.8% 5.2% 6.1 99 391 1192012/Feb 89.7% 10.3% 10.3% 4.9 92 480 736 1282012/Mar 93.3% 6.7% 0.0% 6.0 109 168 1132012/Apr 88.9% 11.1% 3.7% 5.3 91 346 1192012/May 94.7% 5.3% 3.5% 5.0 105 320 1132012/Jun 93.8% 6.3% 2.1% 4.5 84 107 554 94Jul '11 to Jun '12 Total 91.5% 8.5% 4.9% 5.3 92 326 509 1082012/Jul 92.3% 7.7% 2.6% 4.5 93 932012/Aug 90.6% 9.4% 3.8% 4.2 91 539 992012/Sep 85.7% 14.3% 2.4% 4.5 84 294 1092012/Oct 82.1% 17.9% 0.0% 6.1 138 1382012/Nov 85.7% 14.3% 4.1% 6.3 113 299 1172012/Dec 83.3% 16.7% 11.1% 6.3 155 1552013/Jan 89.3% 10.7% 0.0% 5.8 105 190 1082013/Feb 92.5% 7.5% 0.0% 5.2 107 236 1102013/Mar 91.3% 8.7% 2.2% 4.9 99 336 1042013/Apr 88.0% 12.0% 0.0% 6.1 126 232 1282013/May 96.2% 3.9% 0.0% 5.8 95 235 202 1022013/Jun 92.3% 7.7% 7.7% 5.5 106 385 117Jul '12 to Jun '13 Total 89.6% 10.4% 2.2% 5.4 106 294 217 112
Average Appearances to Disposition: Average of all appearances from the first to last court appearance.
Case: Refers to all charges on an Information for each single accused.
Information: The document that sets out the name(s) of the accused and all the charges against the accused.
Date
% of Cases Disposed (for cases without bench warrants)
Average Appearances to
Disposition (for cases
without bench warrants)
Average Days to Disposition (for cases without bench warrants)
Cases Disposed: Refers to Cases completed in the Ontario Court of Justice including those committed for trial in the Superior Court of Justice.
Average Days to Disposition: Average number of days from when the first court appearance was scheduled to the date of the final court appearance.
Disposition Rate StatisticsYouth Criminal Cases
Ontario Court of Justice
July 2011 to June 2013Brantford

Cayuga, Page 14
% Disposed Under 8 Months
% Disposed Over 8 Months
% Disposed Over 12 Months
For Cases Disposed
Before Trial Date
For Cases Disposed at Trial Without
Trial
For Cases Disposed
Following a Trial
For All Cases
2011/Jul 0.0% 0.0% 5.4 100 105 1012011/Aug 50.0% 50.0% 14.3% 5.1 205 244 2112011/Sep 0.0% 0.0% 4.5 47 119 652011/Oct 45.5% 54.6% 36.4% 7.3 208 418 3032011/Nov 0.0% 0.0% 4.3 107 1072011/Dec 33.3% 66.7% 66.7% 11.0 389 3892012/Jan 0.0% 0.0% 4.2 136 164 1412012/Feb 58.8% 41.2% 0.0% 6.4 164 315 1992012/Mar 75.0% 25.0% 12.5% 4.6 136 300 1572012/Apr 2012/May 75.0% 25.0% 0.0% 6.5 245 2452012/Jun 81.8% 18.2% 9.1% 6.0 154 154Jul '11 to Jun '12 Total 72.7% 27.3% 10.1% 5.8 162 286 164 1822012/Jul 71.4% 28.6% 14.3% 6.3 205 2052012/Aug 0.0% 0.0% 2.7 83 832012/Sep 0.0% 0.0% 3.0 48 482012/Oct 57.1% 42.9% 0.0% 6.7 193 1932012/Nov 0.0% 0.0% 2.3 30 302012/Dec 66.7% 33.3% 0.0% 5.3 202 2022013/Jan 0.0% 0.0% 2.5 20 202013/Feb 84.6% 15.4% 7.7% 5.3 89 220 435 1352013/Mar 50.0% 50.0% 0.0% 4.8 208 2082013/Apr 40.0% 60.0% 0.0% 6.2 188 1882013/May 43.8% 56.3% 50.0% 5.0 545 5452013/Jun 83.3% 16.7% 0.0% 7.2 178 178Jul '12 to Jun '13 Total 68.9% 31.1% 13.5% 5.2 231 220 435 234
Average Appearances to Disposition: Average of all appearances from the first to last court appearance.
Case: Refers to all charges on an Information for each single accused.
Information: The document that sets out the name(s) of the accused and all the charges against the accused.
Date
% of Cases Disposed (for cases without bench warrants)
Average Appearances to
Disposition (for cases
without bench warrants)
Average Days to Disposition (for cases without bench warrants)
Cases Disposed: Refers to Cases completed in the Ontario Court of Justice including those committed for trial in the Superior Court of Justice.
Average Days to Disposition: Average number of days from when the first court appearance was scheduled to the date of the final court appearance.
Disposition Rate StatisticsYouth Criminal Cases
Ontario Court of Justice
July 2011 to June 2013Cayuga

Hamilton, Page 15
% Disposed Under 8 Months
% Disposed Over 8 Months
% Disposed Over 12 Months
For Cases Disposed
Before Trial Date
For Cases Disposed at Trial Without
Trial
For Cases Disposed
Following a Trial
For All Cases
2011/Jul 89.7% 10.3% 3.5% 5.7 86 200 1002011/Aug 87.5% 12.5% 5.0% 5.9 101 333 1122011/Sep 76.1% 23.9% 3.0% 7.7 133 404 1412011/Oct 91.4% 8.6% 3.5% 7.1 95 265 1062011/Nov 92.7% 7.3% 4.9% 7.4 113 182 1142011/Dec 82.2% 17.8% 8.9% 7.8 107 317 1352012/Jan 85.4% 14.6% 8.3% 7.0 123 388 1402012/Feb 82.8% 17.2% 8.6% 7.0 117 398 711 1512012/Mar 75.5% 24.5% 0.0% 5.8 112 277 326 1282012/Apr 81.1% 18.9% 10.8% 6.4 143 363 1612012/May 80.0% 20.0% 7.8% 10.2 145 309 308 1602012/Jun 85.1% 14.9% 6.4% 7.8 122 399 139Jul '11 to Jun '12 Total 84.2% 15.8% 5.7% 7.3 118 311 413 1332012/Jul 84.4% 15.6% 2.2% 5.1 99 101 992012/Aug 76.4% 23.6% 5.6% 5.9 122 368 250 1342012/Sep 93.9% 6.1% 0.0% 7.5 82 822012/Oct 86.5% 13.5% 5.8% 7.0 85 364 1012012/Nov 77.8% 22.2% 3.7% 8.5 126 284 410 1522012/Dec 69.4% 30.6% 13.9% 7.6 157 349 684 1972013/Jan 73.5% 26.5% 5.9% 7.8 153 243 1642013/Feb 86.8% 13.2% 2.6% 8.6 139 275 1502013/Mar 77.2% 22.8% 7.0% 7.8 146 321 1652013/Apr 86.7% 13.3% 2.2% 7.1 137 190 1382013/May 82.6% 17.4% 4.4% 6.9 114 326 1422013/Jun 86.3% 13.7% 5.9% 5.9 102 303 118Jul '12 to Jun '13 Total 81.5% 18.5% 5.0% 7.0 121 302 507 136
Average Appearances to Disposition: Average of all appearances from the first to last court appearance.
Case: Refers to all charges on an Information for each single accused.
Information: The document that sets out the name(s) of the accused and all the charges against the accused.
Date
% of Cases Disposed (for cases without bench warrants)
Average Appearances to
Disposition (for cases
without bench warrants)
Average Days to Disposition (for cases without bench warrants)
Cases Disposed: Refers to Cases completed in the Ontario Court of Justice including those committed for trial in the Superior Court of Justice.
Average Days to Disposition: Average number of days from when the first court appearance was scheduled to the date of the final court appearance.
Disposition Rate StatisticsYouth Criminal Cases
Ontario Court of Justice
July 2011 to June 2013Hamilton

Milton, Page 16
% Disposed Under 8 Months
% Disposed Over 8 Months
% Disposed Over 12 Months
For Cases Disposed
Before Trial Date
For Cases Disposed at Trial Without
Trial
For Cases Disposed
Following a Trial
For All Cases
2011/Jul 0.0% 0.0% 5.0 65 652011/Aug 95.7% 4.3% 2.1% 6.1 87 529 113 1062011/Sep 84.2% 15.8% 7.9% 4.8 132 276 128 1432011/Oct 90.4% 9.6% 3.9% 4.5 82 365 504 1092011/Nov 95.1% 4.9% 0.0% 6.0 84 350 912011/Dec 80.0% 20.0% 14.0% 6.3 97 702 809 1622012/Jan 86.8% 13.2% 5.3% 4.1 102 385 383 1242012/Feb 89.2% 10.8% 10.8% 4.9 85 515 1202012/Mar 77.6% 22.5% 16.3% 6.1 78 460 731 1682012/Apr 81.8% 18.2% 0.0% 7.6 135 1352012/May 92.6% 7.4% 0.0% 4.3 104 216 1132012/Jun 87.1% 12.9% 0.0% 5.4 137 137Jul '11 to Jun '12 Total 88.5% 11.6% 5.7% 5.4 95 441 560 1232012/Jul 80.0% 20.0% 8.6% 5.1 128 514 1502012/Aug 86.1% 14.0% 9.3% 5.1 77 429 1102012/Sep 90.5% 9.5% 2.4% 5.0 93 433 1092012/Oct 79.6% 20.5% 18.2% 7.1 138 354 211 1642012/Nov 77.3% 22.7% 9.1% 5.4 114 326 534 1622012/Dec 88.0% 12.0% 12.0% 5.4 150 1502013/Jan 92.0% 8.0% 4.0% 5.8 84 455 992013/Feb 77.3% 22.7% 9.1% 9.7 136 485 485 1682013/Mar 82.4% 17.7% 13.7% 5.5 128 644 379 1432013/Apr 58.8% 41.2% 26.5% 6.9 139 668 273 2752013/May 85.7% 14.3% 0.0% 4.4 85 339 942013/Jun 83.3% 16.7% 11.1% 5.5 116 385 532 154Jul '12 to Jun '13 Total 81.8% 18.3% 10.8% 5.8 115 487 383 147
Average Appearances to Disposition: Average of all appearances from the first to last court appearance.
Case: Refers to all charges on an Information for each single accused.
Information: The document that sets out the name(s) of the accused and all the charges against the accused.
Date
% of Cases Disposed (for cases without bench warrants)
Average Appearances to
Disposition (for cases
without bench warrants)
Average Days to Disposition (for cases without bench warrants)
Cases Disposed: Refers to Cases completed in the Ontario Court of Justice including those committed for trial in the Superior Court of Justice.
Average Days to Disposition: Average number of days from when the first court appearance was scheduled to the date of the final court appearance.
Disposition Rate StatisticsYouth Criminal Cases
Ontario Court of Justice
July 2011 to June 2013Milton

Orangeville, Page 17
% Disposed Under 8 Months
% Disposed Over 8 Months
% Disposed Over 12 Months
For Cases Disposed
Before Trial Date
For Cases Disposed at Trial Without
Trial
For Cases Disposed
Following a Trial
For All Cases
2011/Jul 0.0% 0.0% 5.3 128 1282011/Aug 84.6% 15.4% 0.0% 5.3 125 356 1432011/Sep 81.8% 18.2% 0.0% 5.1 89 308 301 1282011/Oct 0.0% 0.0% 4.0 58 582011/Nov 91.3% 8.7% 4.4% 5.5 115 1152011/Dec 81.8% 18.2% 0.0% 5.7 120 1202012/Jan 78.6% 21.4% 0.0% 5.3 139 260 1482012/Feb 83.3% 16.7% 16.7% 4.8 91 438 1492012/Mar 70.6% 29.4% 17.7% 6.7 179 491 1972012/Apr 90.0% 10.0% 10.0% 4.9 101 415 1332012/May 90.0% 10.0% 0.0% 6.7 158 1582012/Jun 93.3% 6.7% 6.7% 5.5 109 552 138Jul '11 to Jun '12 Total 87.4% 12.6% 4.4% 5.4 120 369 412 1342012/Jul 77.8% 22.2% 0.0% 6.6 150 1502012/Aug 93.8% 6.3% 0.0% 4.6 117 1172012/Sep 66.7% 33.3% 0.0% 6.1 142 244 1652012/Oct 82.4% 17.7% 11.8% 6.4 124 468 191 1682012/Nov 95.8% 4.2% 4.2% 6.2 140 1402012/Dec 85.0% 15.0% 5.0% 5.1 142 279 1492013/Jan 75.0% 25.0% 3.6% 5.3 119 396 1392013/Feb 93.3% 6.7% 0.0% 4.2 73 732013/Mar 57.1% 42.9% 23.8% 7.7 199 393 2082013/Apr 73.7% 26.3% 0.0% 9.3 151 1512013/May 80.0% 20.0% 0.0% 11.4 180 1802013/Jun 63.6% 36.4% 9.1% 9.5 173 173Jul '12 to Jun '13 Total 79.3% 20.7% 5.2% 6.7 142 373 235 151
Average Appearances to Disposition: Average of all appearances from the first to last court appearance.
Case: Refers to all charges on an Information for each single accused.
Information: The document that sets out the name(s) of the accused and all the charges against the accused.
Date
% of Cases Disposed (for cases without bench warrants)
Average Appearances to
Disposition (for cases
without bench warrants)
Average Days to Disposition (for cases without bench warrants)
Cases Disposed: Refers to Cases completed in the Ontario Court of Justice including those committed for trial in the Superior Court of Justice.
Average Days to Disposition: Average number of days from when the first court appearance was scheduled to the date of the final court appearance.
Disposition Rate StatisticsYouth Criminal Cases
Ontario Court of Justice
July 2011 to June 2013Orangeville

Simcoe, Page 18
% Disposed Under 8 Months
% Disposed Over 8 Months
% Disposed Over 12 Months
For Cases Disposed
Before Trial Date
For Cases Disposed at Trial Without
Trial
For Cases Disposed
Following a Trial
For All Cases
2011/Jul 0.0% 0.0% 6.0 138 1382011/Aug 0.0% 0.0% 3.6 51 512011/Sep 0.0% 0.0% 3.2 55 552011/Oct 0.0% 0.0% 3.5 64 642011/Nov 80.0% 20.0% 0.0% 6.4 138 1382011/Dec 0.0% 0.0% 4.0 64 642012/Jan 83.3% 16.7% 0.0% 5.2 118 1182012/Feb 0.0% 0.0% 4.9 111 1112012/Mar 80.0% 20.0% 20.0% 3.4 23 393 972012/Apr 0.0% 0.0% 4.9 75 752012/May 94.7% 5.3% 0.0% 5.2 89 892012/Jun 94.7% 5.3% 5.3% 5.4 43 713 78Jul '11 to Jun '12 Total 94.4% 5.6% 1.9% 4.8 78 553 872012/Jul 0.0% 0.0% 4.5 110 1102012/Aug 0.0% 0.0% 3.8 34 196 532012/Sep 66.7% 33.3% 0.0% 5.2 166 1662012/Oct 80.0% 20.0% 6.7% 5.6 121 1212012/Nov 0.0% 0.0% 3.8 51 512012/Dec 87.5% 12.5% 12.5% 9.5 128 773 2092013/Jan 93.3% 6.7% 6.7% 4.2 50 547 842013/Feb 2013/Mar 28.6% 71.4% 57.1% 12.9 278 739 3442013/Apr 0.0% 0.0% 6.2 102 1022013/May 0.0% 0.0% 3.4 78 782013/Jun 0.0% 0.0% 3.7 70 70Jul '12 to Jun '13 Total 88.1% 11.9% 6.9% 5.4 95 476 547 115
Average Appearances to Disposition: Average of all appearances from the first to last court appearance.
Case: Refers to all charges on an Information for each single accused.
Information: The document that sets out the name(s) of the accused and all the charges against the accused.
Date
% of Cases Disposed (for cases without bench warrants)
Average Appearances to
Disposition (for cases
without bench warrants)
Average Days to Disposition (for cases without bench warrants)
Cases Disposed: Refers to Cases completed in the Ontario Court of Justice including those committed for trial in the Superior Court of Justice.
Average Days to Disposition: Average number of days from when the first court appearance was scheduled to the date of the final court appearance.
Disposition Rate StatisticsYouth Criminal Cases
Ontario Court of Justice
July 2011 to June 2013Simcoe
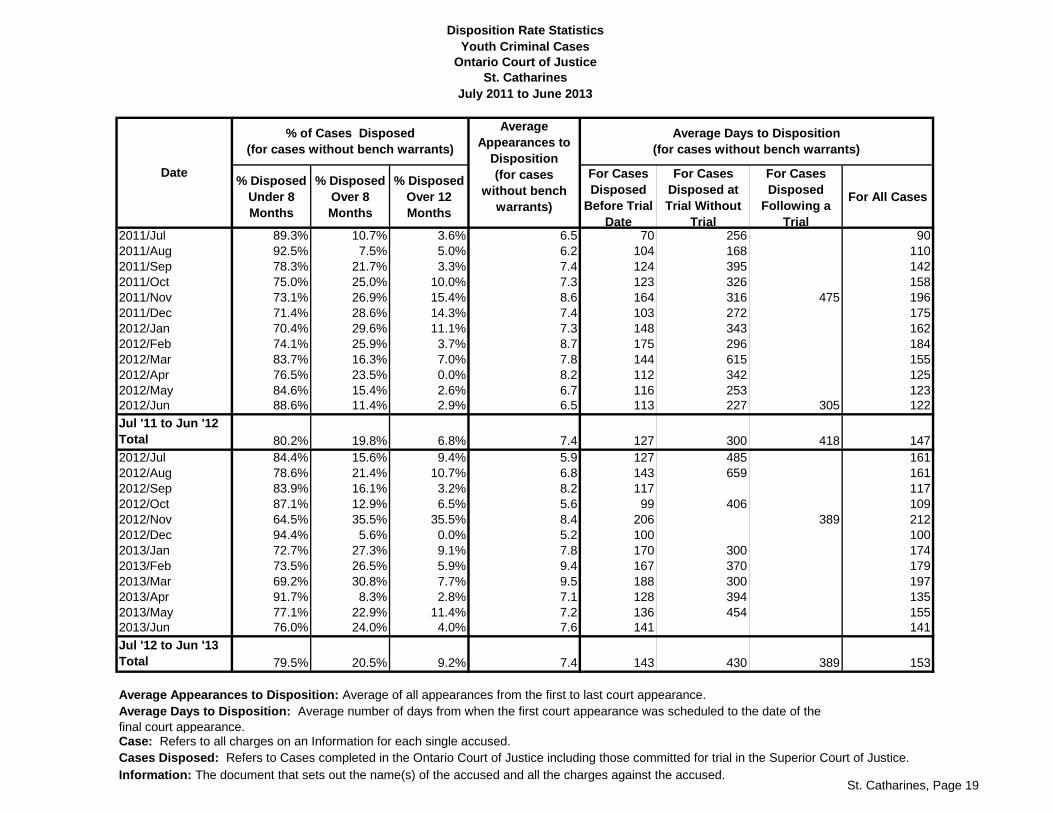
St. Catharines, Page 19
% Disposed Under 8 Months
% Disposed Over 8 Months
% Disposed Over 12 Months
For Cases Disposed
Before Trial Date
For Cases Disposed at Trial Without
Trial
For Cases Disposed
Following a Trial
For All Cases
2011/Jul 89.3% 10.7% 3.6% 6.5 70 256 902011/Aug 92.5% 7.5% 5.0% 6.2 104 168 1102011/Sep 78.3% 21.7% 3.3% 7.4 124 395 1422011/Oct 75.0% 25.0% 10.0% 7.3 123 326 1582011/Nov 73.1% 26.9% 15.4% 8.6 164 316 475 1962011/Dec 71.4% 28.6% 14.3% 7.4 103 272 1752012/Jan 70.4% 29.6% 11.1% 7.3 148 343 1622012/Feb 74.1% 25.9% 3.7% 8.7 175 296 1842012/Mar 83.7% 16.3% 7.0% 7.8 144 615 1552012/Apr 76.5% 23.5% 0.0% 8.2 112 342 1252012/May 84.6% 15.4% 2.6% 6.7 116 253 1232012/Jun 88.6% 11.4% 2.9% 6.5 113 227 305 122Jul '11 to Jun '12 Total 80.2% 19.8% 6.8% 7.4 127 300 418 1472012/Jul 84.4% 15.6% 9.4% 5.9 127 485 1612012/Aug 78.6% 21.4% 10.7% 6.8 143 659 1612012/Sep 83.9% 16.1% 3.2% 8.2 117 1172012/Oct 87.1% 12.9% 6.5% 5.6 99 406 1092012/Nov 64.5% 35.5% 35.5% 8.4 206 389 2122012/Dec 94.4% 5.6% 0.0% 5.2 100 1002013/Jan 72.7% 27.3% 9.1% 7.8 170 300 1742013/Feb 73.5% 26.5% 5.9% 9.4 167 370 1792013/Mar 69.2% 30.8% 7.7% 9.5 188 300 1972013/Apr 91.7% 8.3% 2.8% 7.1 128 394 1352013/May 77.1% 22.9% 11.4% 7.2 136 454 1552013/Jun 76.0% 24.0% 4.0% 7.6 141 141Jul '12 to Jun '13 Total 79.5% 20.5% 9.2% 7.4 143 430 389 153
Average Appearances to Disposition: Average of all appearances from the first to last court appearance.
Case: Refers to all charges on an Information for each single accused.
Information: The document that sets out the name(s) of the accused and all the charges against the accused.
Date
% of Cases Disposed (for cases without bench warrants)
Average Appearances to
Disposition (for cases
without bench warrants)
Average Days to Disposition (for cases without bench warrants)
Cases Disposed: Refers to Cases completed in the Ontario Court of Justice including those committed for trial in the Superior Court of Justice.
Average Days to Disposition: Average number of days from when the first court appearance was scheduled to the date of the final court appearance.
Disposition Rate StatisticsYouth Criminal Cases
Ontario Court of Justice
July 2011 to June 2013St. Catharines

Welland, Page 20
% Disposed Under 8 Months
% Disposed Over 8 Months
% Disposed Over 12 Months
For Cases Disposed
Before Trial Date
For Cases Disposed at Trial Without
Trial
For Cases Disposed
Following a Trial
For All Cases
2011/Jul 0.0% 0.0% 5.1 66 158 772011/Aug 0.0% 0.0% 5.4 112 1122011/Sep 0.0% 0.0% 5.7 109 1092011/Oct 0.0% 0.0% 4.0 124 181 1432011/Nov 92.9% 7.1% 7.1% 6.4 42 442 702011/Dec 83.3% 16.7% 0.0% 7.3 152 1522012/Jan 0.0% 0.0% 4.0 63 632012/Feb 0.0% 0.0% 5.5 155 1552012/Mar 0.0% 0.0% 7.0 116 1162012/Apr 0.0% 0.0% 5.3 98 107 992012/May 47.1% 52.9% 5.9% 7.9 235 2352012/Jun 0.0% 0.0% 5.4 84 84Jul '11 to Jun '12 Total 89.9% 10.1% 1.8% 6.0 117 222 1212012/Jul 87.5% 12.5% 0.0% 8.4 100 269 223 1362012/Aug 0.0% 0.0% 3.3 112 1122012/Sep 80.0% 20.0% 0.0% 7.5 132 132 1322012/Oct 57.1% 42.9% 14.3% 8.9 215 2152012/Nov 90.9% 9.1% 0.0% 5.5 101 294 1182012/Dec 90.0% 10.0% 0.0% 8.1 121 1212013/Jan 83.3% 16.7% 0.0% 4.3 127 1272013/Feb 78.6% 21.4% 0.0% 11.4 142 259 1512013/Mar 83.3% 16.7% 0.0% 8.0 179 1792013/Apr 85.7% 14.3% 0.0% 6.6 179 1792013/May 70.6% 29.4% 23.5% 6.9 158 556 2282013/Jun 66.7% 33.3% 11.1% 11.0 200 200Jul '12 to Jun '13 Total 80.4% 19.6% 5.4% 7.7 147 375 223 161
Average Appearances to Disposition: Average of all appearances from the first to last court appearance.
Case: Refers to all charges on an Information for each single accused.
Information: The document that sets out the name(s) of the accused and all the charges against the accused.
Date
% of Cases Disposed (for cases without bench warrants)
Average Appearances to
Disposition (for cases
without bench warrants)
Average Days to Disposition (for cases without bench warrants)
Cases Disposed: Refers to Cases completed in the Ontario Court of Justice including those committed for trial in the Superior Court of Justice.
Average Days to Disposition: Average number of days from when the first court appearance was scheduled to the date of the final court appearance.
Disposition Rate StatisticsYouth Criminal Cases
Ontario Court of Justice
July 2011 to June 2013Welland

East Overview, Page 21
% Disposed Under 8 Months
% Disposed Over 8 Months
% Disposed Over 12 Months
For Cases Disposed
Before Trial Date
For Cases Disposed at Trial Without
Trial
For Cases Disposed
Following a Trial
For All Cases
2011/Jul 93.5% 6.5% 1.9% 5.7 86 279 343 972011/Aug 89.7% 10.3% 1.2% 4.8 85 236 293 962011/Sep 85.7% 14.3% 6.8% 6.8 113 290 401 1362011/Oct 88.2% 11.8% 4.8% 6.2 87 294 369 1092011/Nov 87.2% 12.8% 6.1% 5.9 105 227 309 1192011/Dec 85.1% 14.9% 6.2% 6.1 111 257 348 1262012/Jan 88.3% 11.7% 4.0% 6.3 105 234 241 1142012/Feb 85.9% 14.1% 6.1% 6.1 113 280 375 1252012/Mar 81.9% 18.1% 3.5% 7.3 129 220 169 1412012/Apr 79.6% 20.4% 5.1% 6.4 122 331 394 1492012/May 86.9% 13.1% 4.0% 6.2 108 239 333 1222012/Jun 83.3% 16.7% 5.8% 6.2 107 300 402 130Jul '11 to Jun '12 Total 86.4% 13.6% 4.7% 6.2 105 265 328 1222012/Jul 90.4% 9.6% 3.1% 5.2 88 244 320 962012/Aug 85.8% 14.2% 4.9% 5.9 109 271 408 1272012/Sep 81.2% 18.8% 6.4% 6.5 114 316 408 1342012/Oct 85.7% 14.3% 6.4% 6.2 113 242 388 1322012/Nov 87.9% 12.1% 5.5% 5.8 103 346 228 1252012/Dec 88.7% 11.3% 4.8% 6.9 119 240 254 1292013/Jan 84.2% 15.8% 6.4% 5.4 96 304 487 1352013/Feb 82.1% 17.9% 7.1% 6.0 114 234 288 1282013/Mar 78.1% 21.9% 7.0% 5.9 115 344 289 1302013/Apr 86.1% 14.0% 4.7% 6.2 112 232 351 1282013/May 86.2% 13.8% 2.3% 6.1 111 273 352 1242013/Jun 75.3% 24.8% 8.9% 7.1 136 328 251 156Jul '12 to Jun '13 Total 84.6% 15.4% 5.5% 6.1 110 287 340 128
Average Appearances to Disposition: Average of all appearances from the first to last court appearance.
Case: Refers to all charges on an Information for each single accused.
Information: The document that sets out the name(s) of the accused and all the charges against the accused.
Date
% of Cases Disposed (for cases without bench warrants)
Average Appearances to
Disposition (for cases
without bench warrants)
Average Days to Disposition (for cases without bench warrants)
Cases Disposed: Refers to Cases completed in the Ontario Court of Justice including those committed for trial in the Superior Court of Justice.
Average Days to Disposition: Average number of days from when the first court appearance was scheduled to the date of the final court appearance.
Disposition Rate StatisticsYouth Criminal Cases
Ontario Court of Justice
July 2011 to June 2013East Overview

Belleville, Page 22
% Disposed Under 8 Months
% Disposed Over 8 Months
% Disposed Over 12 Months
For Cases Disposed
Before Trial Date
For Cases Disposed at Trial Without
Trial
For Cases Disposed
Following a Trial
For All Cases
2011/Jul 97.7% 2.3% 0.0% 5.8 118 1182011/Aug 88.9% 11.1% 0.0% 5.3 113 302 1202011/Sep 90.0% 10.0% 5.0% 7.2 128 702 1562011/Oct 85.2% 14.8% 7.4% 6.9 108 309 400 1332011/Nov 89.7% 10.3% 0.0% 4.8 118 46 1162011/Dec 93.8% 6.3% 0.0% 3.6 102 1022012/Jan 0.0% 0.0% 4.9 94 942012/Feb 90.0% 10.0% 0.0% 5.1 85 287 952012/Mar 85.0% 15.0% 1.7% 8.9 123 191 208 1472012/Apr 85.0% 15.0% 0.0% 5.3 110 272 1182012/May 95.0% 5.0% 0.0% 6.0 116 159 1192012/Jun 84.6% 15.4% 0.0% 6.1 93 330 219 121Jul '11 to Jun '12 Total 90.0% 10.0% 1.3% 6.2 112 221 264 1242012/Jul 83.8% 16.2% 2.7% 6.7 80 326 932012/Aug 91.2% 8.8% 0.0% 6.1 121 1212012/Sep 80.8% 19.2% 7.7% 7.7 113 367 1322012/Oct 83.3% 16.7% 0.0% 6.2 140 312 254 1522012/Nov 0.0% 0.0% 5.6 94 942012/Dec 86.4% 13.6% 4.6% 6.7 136 287 1432013/Jan 86.7% 13.3% 0.0% 5.5 130 302 1412013/Feb 76.9% 23.1% 0.0% 5.5 81 172 194 1192013/Mar 42.9% 57.1% 7.1% 10.3 216 262 2262013/Apr 82.1% 17.9% 3.6% 7.5 149 287 175 1542013/May 83.3% 16.7% 3.3% 7.1 133 1332013/Jun 78.3% 21.7% 0.0% 7.8 166 334 173Jul '12 to Jun '13 Total 83.0% 17.0% 2.4% 6.9 126 267 263 135
Average Appearances to Disposition: Average of all appearances from the first to last court appearance.
Case: Refers to all charges on an Information for each single accused.
Information: The document that sets out the name(s) of the accused and all the charges against the accused.
Date
% of Cases Disposed (for cases without bench warrants)
Average Appearances to
Disposition (for cases
without bench warrants)
Average Days to Disposition (for cases without bench warrants)
Cases Disposed: Refers to Cases completed in the Ontario Court of Justice including those committed for trial in the Superior Court of Justice.
Average Days to Disposition: Average number of days from when the first court appearance was scheduled to the date of the final court appearance.
Disposition Rate StatisticsYouth Criminal Cases
Ontario Court of Justice
July 2011 to June 2013Belleville

Brockville, Page 23
% Disposed Under 8 Months
% Disposed Over 8 Months
% Disposed Over 12 Months
For Cases Disposed
Before Trial Date
For Cases Disposed at Trial Without
Trial
For Cases Disposed
Following a Trial
For All Cases
2011/Jul 0.0% 0.0% 3.0 64 197 752011/Aug 84.6% 15.4% 0.0% 4.5 62 242 266 1112011/Sep 0.0% 0.0% 4.0 107 177 1352011/Oct 85.7% 14.3% 14.3% 7.1 128 400 1542011/Nov 85.7% 14.3% 9.5% 5.2 128 1282011/Dec 80.0% 20.0% 10.0% 4.1 86 329 399 1422012/Jan 84.2% 15.8% 15.8% 5.6 177 421 1902012/Feb 95.2% 4.8% 0.0% 4.6 83 832012/Mar 76.5% 23.5% 11.8% 5.7 187 1872012/Apr 81.3% 18.8% 6.3% 6.4 146 480 1672012/May 76.2% 23.8% 14.3% 6.8 126 368 584 1712012/Jun 87.5% 12.5% 4.2% 5.2 150 150Jul '11 to Jun '12 Total 85.5% 14.6% 7.5% 5.4 125 286 432 1422012/Jul 83.3% 16.7% 11.1% 6.6 135 49 110 1292012/Aug 87.5% 12.5% 6.3% 6.2 118 291 405 1382012/Sep 62.5% 37.5% 12.5% 4.9 30 276 396 1372012/Oct 75.0% 25.0% 25.0% 6.3 182 218 1862012/Nov 96.2% 3.9% 0.0% 4.2 86 210 912012/Dec 76.9% 23.1% 0.0% 5.5 106 276 1192013/Jan 0.0% 0.0% 2.6 52 522013/Feb 60.0% 40.0% 20.0% 4.4 186 1862013/Mar 0.0% 0.0% 4.7 90 902013/Apr 87.5% 12.5% 0.0% 5.4 82 822013/May 95.5% 4.6% 0.0% 5.4 97 330 1082013/Jun 75.0% 25.0% 16.7% 5.5 138 138Jul '12 to Jun '13 Total 86.6% 13.5% 5.9% 5.3 107 236 310 118
Average Appearances to Disposition: Average of all appearances from the first to last court appearance.
Case: Refers to all charges on an Information for each single accused.
Information: The document that sets out the name(s) of the accused and all the charges against the accused.
Date
% of Cases Disposed (for cases without bench warrants)
Average Appearances to
Disposition (for cases
without bench warrants)
Average Days to Disposition (for cases without bench warrants)
Cases Disposed: Refers to Cases completed in the Ontario Court of Justice including those committed for trial in the Superior Court of Justice.
Average Days to Disposition: Average number of days from when the first court appearance was scheduled to the date of the final court appearance.
Disposition Rate StatisticsYouth Criminal Cases
Ontario Court of Justice
July 2011 to June 2013Brockville

Cornwall, Page 24
% Disposed Under 8 Months
% Disposed Over 8 Months
% Disposed Over 12 Months
For Cases Disposed
Before Trial Date
For Cases Disposed at Trial Without
Trial
For Cases Disposed
Following a Trial
For All Cases
2011/Jul 85.5% 14.6% 3.6% 7.9 116 493 1232011/Aug 96.8% 3.2% 3.2% 3.0 72 722011/Sep 85.7% 14.3% 1.4% 6.5 109 389 1212011/Oct 84.1% 15.9% 0.0% 6.8 90 902011/Nov 77.6% 22.5% 18.4% 6.5 116 415 422 1602011/Dec 73.8% 26.2% 9.8% 7.8 150 248 431 1612012/Jan 94.6% 5.5% 0.0% 5.8 81 272 111 892012/Feb 78.5% 21.5% 10.8% 6.0 121 429 1402012/Mar 57.7% 42.3% 7.7% 6.8 202 294 2052012/Apr 72.4% 27.6% 24.1% 6.4 72 496 516 2052012/May 88.9% 11.1% 1.9% 8.3 119 279 319 1262012/Jun 84.2% 15.8% 5.3% 6.5 112 224 553 129Jul '11 to Jun '12 Total 82.6% 17.5% 6.5% 6.6 114 408 396 1322012/Jul 88.6% 11.4% 0.0% 4.7 113 1132012/Aug 75.0% 25.0% 10.7% 6.2 89 454 643 1612012/Sep 75.7% 24.3% 13.5% 6.0 122 449 553 1512012/Oct 88.6% 11.4% 4.6% 4.6 82 242 536 1032012/Nov 88.1% 11.9% 10.2% 6.0 102 532 1382012/Dec 95.2% 4.8% 4.8% 6.8 114 641 1272013/Jan 90.5% 9.5% 9.5% 5.1 95 481 1322013/Feb 90.9% 9.1% 0.0% 4.6 70 702013/Mar 65.4% 34.6% 19.2% 5.0 159 1592013/Apr 82.7% 17.3% 1.9% 6.0 120 415 1322013/May 74.1% 25.9% 0.0% 5.8 136 1362013/Jun 67.5% 32.5% 17.5% 5.9 115 617 368 178Jul '12 to Jun '13 Total 82.8% 17.2% 7.3% 5.6 109 490 504 132
Average Appearances to Disposition: Average of all appearances from the first to last court appearance.
Case: Refers to all charges on an Information for each single accused.
Information: The document that sets out the name(s) of the accused and all the charges against the accused.
Date
% of Cases Disposed (for cases without bench warrants)
Average Appearances to
Disposition (for cases
without bench warrants)
Average Days to Disposition (for cases without bench warrants)
Cases Disposed: Refers to Cases completed in the Ontario Court of Justice including those committed for trial in the Superior Court of Justice.
Average Days to Disposition: Average number of days from when the first court appearance was scheduled to the date of the final court appearance.
Disposition Rate StatisticsYouth Criminal Cases
Ontario Court of Justice
July 2011 to June 2013Cornwall

Kingston, Page 25
% Disposed Under 8 Months
% Disposed Over 8 Months
% Disposed Over 12 Months
For Cases Disposed
Before Trial Date
For Cases Disposed at Trial Without
Trial
For Cases Disposed
Following a Trial
For All Cases
2011/Jul 89.5% 10.5% 0.0% 5.0 56 245 762011/Aug 91.3% 8.7% 4.4% 3.0 49 370 632011/Sep 83.3% 16.7% 16.7% 6.8 146 1462011/Oct 82.4% 17.7% 8.8% 6.1 85 273 507 1272011/Nov 0.0% 0.0% 4.9 71 712011/Dec 81.8% 18.2% 9.1% 6.4 97 369 1222012/Jan 0.0% 0.0% 5.3 77 79 782012/Feb 96.7% 3.3% 0.0% 5.8 108 1082012/Mar 90.5% 9.5% 0.0% 5.7 83 327 952012/Apr 96.0% 4.0% 0.0% 6.3 121 198 1272012/May 96.3% 3.7% 0.0% 4.4 118 134 1232012/Jun 72.2% 27.8% 5.6% 6.2 90 451 334 144Jul '11 to Jun '12 Total 91.5% 8.5% 2.8% 5.4 89 216 429 1032012/Jul 87.0% 13.0% 8.7% 4.7 82 341 312 1152012/Aug 94.7% 5.3% 0.0% 4.0 73 732012/Sep 66.7% 33.3% 0.0% 8.6 169 320 1792012/Oct 94.1% 5.9% 0.0% 4.7 91 912012/Nov 92.1% 7.9% 5.3% 4.8 59 390 852012/Dec 77.8% 22.2% 11.1% 6.2 124 490 1652013/Jan 85.7% 14.3% 9.5% 4.8 73 253 565 1232013/Feb 73.1% 26.9% 11.5% 6.9 131 164 543 1652013/Mar 78.3% 21.7% 4.4% 6.1 122 1222013/Apr 95.2% 4.8% 4.8% 5.1 88 200 1092013/May 76.2% 23.8% 0.0% 7.0 92 329 1262013/Jun 0.0% 0.0% 5.3 88 88Jul '12 to Jun '13 Total 85.3% 14.8% 4.9% 5.6 95 278 462 117
Average Appearances to Disposition: Average of all appearances from the first to last court appearance.
Case: Refers to all charges on an Information for each single accused.
Information: The document that sets out the name(s) of the accused and all the charges against the accused.
Date
% of Cases Disposed (for cases without bench warrants)
Average Appearances to
Disposition (for cases
without bench warrants)
Average Days to Disposition (for cases without bench warrants)
Cases Disposed: Refers to Cases completed in the Ontario Court of Justice including those committed for trial in the Superior Court of Justice.
Average Days to Disposition: Average number of days from when the first court appearance was scheduled to the date of the final court appearance.
Disposition Rate StatisticsYouth Criminal Cases
Ontario Court of Justice
July 2011 to June 2013Kingston

L'Orignal, Page 26
% Disposed Under 8 Months
% Disposed Over 8 Months
% Disposed Over 12 Months
For Cases Disposed
Before Trial Date
For Cases Disposed at Trial Without
Trial
For Cases Disposed
Following a Trial
For All Cases
2011/Jul 0.0% 0.0% 2.7 28 282011/Aug 0.0% 0.0% 4.1 78 782011/Sep 85.7% 14.3% 14.3% 4.1 44 373 912011/Oct 0.0% 0.0% 3.0 56 562011/Nov 0.0% 0.0% 3.5 60 168 782011/Dec 0.0% 0.0% 2.6 50 502012/Jan 0.0% 0.0% 3.0 83 832012/Feb 0.0% 0.0% 2.7 76 762012/Mar 0.0% 0.0% 5.2 89 892012/Apr 0.0% 0.0% 3.5 81 812012/May 0.0% 0.0% 4.0 88 169 922012/Jun 94.7% 5.3% 5.3% 3.0 83 209 90Jul '11 to Jun '12 Total 98.5% 1.5% 1.5% 3.4 71 168 250 762012/Jul 0.0% 0.0% 2.7 51 512012/Aug 52.6% 47.4% 31.6% 7.5 262 329 2662012/Sep 0.0% 0.0% 2.7 63 195 712012/Oct 63.2% 36.8% 31.6% 4.8 190 273 2032012/Nov 0.0% 0.0% 4.3 112 1122012/Dec 0.0% 0.0% 4.5 82 87 98 832013/Jan 80.0% 20.0% 10.0% 3.9 65 250 463 1232013/Feb 88.9% 11.1% 5.6% 3.5 94 204 1002013/Mar 0.0% 0.0% 3.3 50 502013/Apr 0.0% 0.0% 5.0 86 218 1082013/May 93.8% 6.3% 0.0% 3.8 89 218 1052013/Jun 75.0% 25.0% 0.0% 3.8 168 168Jul '12 to Jun '13 Total 86.3% 13.7% 8.7% 4.3 114 200 264 124
Average Appearances to Disposition: Average of all appearances from the first to last court appearance.
Case: Refers to all charges on an Information for each single accused.
Information: The document that sets out the name(s) of the accused and all the charges against the accused.
Date
% of Cases Disposed (for cases without bench warrants)
Average Appearances to
Disposition (for cases
without bench warrants)
Average Days to Disposition (for cases without bench warrants)
Cases Disposed: Refers to Cases completed in the Ontario Court of Justice including those committed for trial in the Superior Court of Justice.
Average Days to Disposition: Average number of days from when the first court appearance was scheduled to the date of the final court appearance.
Disposition Rate StatisticsYouth Criminal Cases
Ontario Court of Justice
July 2011 to June 2013L'Orignal

Napanee, Page 27
% Disposed Under 8 Months
% Disposed Over 8 Months
% Disposed Over 12 Months
For Cases Disposed
Before Trial Date
For Cases Disposed at Trial Without
Trial
For Cases Disposed
Following a Trial
For All Cases
2011/Jul 0.0% 0.0% 3.5 45 101 492011/Aug 0.0% 0.0% 2.1 19 192011/Sep 0.0% 0.0% 4.9 93 238 1012011/Oct 0.0% 0.0% 1.8 22 13 222011/Nov 0.0% 0.0% 2.1 35 68 382011/Dec 0.0% 0.0% 3.9 55 552012/Jan 0.0% 0.0% 3.8 53 81 178 702012/Feb 0.0% 0.0% 3.3 50 33 77 512012/Mar 0.0% 0.0% 2.0 5 52012/Apr 0.0% 0.0% 4.2 87 182 922012/May 0.0% 0.0% 2.3 44 442012/Jun 0.0% 0.0% 6.0 110 110Jul '11 to Jun '12 Total 0.0% 0.0% 3.5 58 102 128 612012/Jul 0.0% 0.0% 3.2 60 175 692012/Aug 0.0% 0.0% 4.1 57 173 952012/Sep 0.0% 0.0% 3.3 61 165 852012/Oct 0.0% 0.0% 2.6 56 562012/Nov 88.9% 11.1% 0.0% 2.8 46 184 292 1042012/Dec 0.0% 0.0% 3.8 49 492013/Jan 0.0% 0.0% 3.6 47 472013/Feb 92.3% 7.7% 0.0% 3.6 63 168 105 982013/Mar 0.0% 0.0% 3.4 58 582013/Apr 0.0% 0.0% 1.4 13 132013/May 0.0% 0.0% 2.7 28 89 482013/Jun 0.0% 0.0% 2.6 36 100 61Jul '12 to Jun '13 Total 98.3% 1.7% 0.0% 3.2 52 154 199 70
Average Appearances to Disposition: Average of all appearances from the first to last court appearance.
Case: Refers to all charges on an Information for each single accused.
Information: The document that sets out the name(s) of the accused and all the charges against the accused.
Date
% of Cases Disposed (for cases without bench warrants)
Average Appearances to
Disposition (for cases
without bench warrants)
Average Days to Disposition (for cases without bench warrants)
Cases Disposed: Refers to Cases completed in the Ontario Court of Justice including those committed for trial in the Superior Court of Justice.
Average Days to Disposition: Average number of days from when the first court appearance was scheduled to the date of the final court appearance.
Disposition Rate StatisticsYouth Criminal Cases
Ontario Court of Justice
July 2011 to June 2013Napanee

Ottawa, Page 28
% Disposed Under 8 Months
% Disposed Over 8 Months
% Disposed Over 12 Months
For Cases Disposed
Before Trial Date
For Cases Disposed at Trial Without
Trial
For Cases Disposed
Following a Trial
For All Cases
2011/Jul 93.2% 6.8% 2.7% 6.3 75 256 343 962011/Aug 89.7% 10.3% 1.5% 6.0 101 302 1062011/Sep 77.7% 22.4% 11.8% 8.3 145 166 464 1732011/Oct 88.0% 12.1% 6.0% 7.7 99 310 366 1292011/Nov 81.3% 18.7% 6.5% 7.0 115 238 197 1292011/Dec 83.8% 16.2% 9.5% 8.0 130 258 229 1482012/Jan 74.7% 25.3% 8.4% 8.6 126 300 322 1442012/Feb 77.3% 22.7% 11.4% 8.5 154 212 503 1692012/Mar 76.2% 23.8% 4.8% 8.7 131 322 166 1482012/Apr 60.7% 39.3% 6.6% 8.5 140 277 520 1642012/May 77.9% 22.1% 7.8% 6.9 115 373 331 1312012/Jun 81.2% 18.8% 10.6% 7.7 100 300 493 135Jul '11 to Jun '12 Total 80.4% 19.6% 7.5% 7.7 119 268 356 1402012/Jul 91.4% 8.6% 4.3% 6.0 82 315 423 952012/Aug 88.8% 11.2% 2.3% 6.0 96 273 69 1082012/Sep 80.7% 19.4% 8.1% 8.1 117 415 364 1402012/Oct 87.2% 12.8% 5.5% 7.6 110 251 510 1342012/Nov 78.1% 21.9% 7.8% 8.2 137 334 238 1562012/Dec 83.1% 16.9% 8.4% 8.9 141 249 260 1532013/Jan 73.2% 26.8% 10.7% 6.9 105 381 515 1712013/Feb 76.0% 24.1% 12.7% 7.8 142 382 269 1592013/Mar 78.7% 21.3% 4.0% 6.5 87 344 309 1272013/Apr 86.3% 13.7% 8.2% 6.4 105 502 500 1272013/May 86.6% 13.4% 6.0% 7.4 108 351 413 1322013/Jun 70.0% 30.0% 10.0% 8.8 155 272 239 170Jul '12 to Jun '13 Total 81.9% 18.1% 7.2% 7.4 116 321 367 139
Average Appearances to Disposition: Average of all appearances from the first to last court appearance.
Case: Refers to all charges on an Information for each single accused.
Information: The document that sets out the name(s) of the accused and all the charges against the accused.
Date
% of Cases Disposed (for cases without bench warrants)
Average Appearances to
Disposition (for cases
without bench warrants)
Average Days to Disposition (for cases without bench warrants)
Cases Disposed: Refers to Cases completed in the Ontario Court of Justice including those committed for trial in the Superior Court of Justice.
Average Days to Disposition: Average number of days from when the first court appearance was scheduled to the date of the final court appearance.
Disposition Rate StatisticsYouth Criminal Cases
Ontario Court of Justice
July 2011 to June 2013Ottawa

Pembroke, Page 29
% Disposed Under 8 Months
% Disposed Over 8 Months
% Disposed Over 12 Months
For Cases Disposed
Before Trial Date
For Cases Disposed at Trial Without
Trial
For Cases Disposed
Following a Trial
For All Cases
2011/Jul 0.0% 0.0% 2.9 60 602011/Aug 94.1% 5.9% 0.0% 4.3 67 184 812011/Sep 0.0% 0.0% 2.6 53 175 582011/Oct 97.1% 2.9% 0.0% 3.8 50 269 692011/Nov 0.0% 0.0% 3.6 72 722011/Dec 97.1% 2.9% 0.0% 3.4 59 287 652012/Jan 0.0% 0.0% 2.8 66 176 722012/Feb 91.7% 8.3% 0.0% 3.7 84 311 1032012/Mar 0.0% 0.0% 4.6 38 142 682012/Apr 63.6% 36.4% 0.0% 4.8 164 240 228 1762012/May 83.3% 16.7% 4.2% 4.7 52 320 383 912012/Jun 92.3% 7.7% 0.0% 3.8 67 211 184 93Jul '11 to Jun '12 Total 93.4% 6.6% 0.4% 3.7 68 238 216 832012/Jul 95.8% 4.2% 0.0% 4.2 68 682012/Aug 90.9% 9.1% 0.0% 4.8 90 322 1112012/Sep 0.0% 0.0% 2.3 84 842012/Oct 77.8% 22.2% 0.0% 6.8 101 214 351 1542012/Nov 88.9% 11.1% 5.6% 4.9 111 144 153 1172012/Dec 0.0% 0.0% 4.0 78 76 153 832013/Jan 88.9% 11.1% 0.0% 5.3 119 197 1362013/Feb 0.0% 0.0% 4.7 56 562013/Mar 0.0% 0.0% 2.6 71 712013/Apr 81.8% 18.2% 0.0% 5.7 115 120 214 1342013/May 92.9% 7.1% 0.0% 2.9 79 253 912013/Jun 0.0% 0.0% 4.6 70 203 74 82Jul '12 to Jun '13 Total 93.5% 6.5% 0.7% 4.3 84 163 217 96
Average Appearances to Disposition: Average of all appearances from the first to last court appearance.
Case: Refers to all charges on an Information for each single accused.
Information: The document that sets out the name(s) of the accused and all the charges against the accused.
Date
% of Cases Disposed (for cases without bench warrants)
Average Appearances to
Disposition (for cases
without bench warrants)
Average Days to Disposition (for cases without bench warrants)
Cases Disposed: Refers to Cases completed in the Ontario Court of Justice including those committed for trial in the Superior Court of Justice.
Average Days to Disposition: Average number of days from when the first court appearance was scheduled to the date of the final court appearance.
Disposition Rate StatisticsYouth Criminal Cases
Ontario Court of Justice
July 2011 to June 2013Pembroke

Perth, Page 30
% Disposed Under 8 Months
% Disposed Over 8 Months
% Disposed Over 12 Months
For Cases Disposed
Before Trial Date
For Cases Disposed at Trial Without
Trial
For Cases Disposed
Following a Trial
For All Cases
2011/Jul 0.0% 0.0% 6.6 87 135 932011/Aug 85.7% 14.3% 0.0% 5.8 82 220 1022011/Sep 87.5% 12.5% 12.5% 9.1 80 398 212 1392011/Oct 0.0% 0.0% 3.1 54 542011/Nov 93.1% 6.9% 3.5% 8.0 118 214 1382011/Dec 88.9% 11.1% 0.0% 6.1 130 220 1602012/Jan 0.0% 0.0% 6.1 99 992012/Feb 90.0% 10.0% 5.0% 6.5 98 982012/Mar 93.8% 6.3% 0.0% 5.1 125 1252012/Apr 0.0% 0.0% 7.7 139 1392012/May 91.3% 8.7% 0.0% 5.6 126 160 1272012/Jun 61.9% 38.1% 4.8% 6.9 160 350 178Jul '11 to Jun '12 Total 89.4% 10.7% 2.8% 6.7 111 257 212 1262012/Jul 91.7% 8.3% 0.0% 4.6 98 982012/Aug 88.2% 11.8% 0.0% 6.7 83 320 133 1142012/Sep 76.5% 23.5% 0.0% 7.3 159 210 1622012/Oct 85.7% 14.3% 0.0% 9.3 166 216 148 1702012/Nov 82.4% 17.7% 0.0% 5.7 119 309 197 1682012/Dec 77.8% 22.2% 0.0% 8.3 169 180 1702013/Jan 83.3% 16.7% 0.0% 4.3 114 264 1392013/Feb 92.9% 7.1% 0.0% 5.4 110 1102013/Mar 70.0% 30.0% 20.0% 7.0 186 1862013/Apr 88.9% 11.1% 11.1% 8.9 176 168 223 1802013/May 91.7% 8.3% 0.0% 6.2 147 1472013/Jun 0.0% 0.0% 5.0 68 149 84Jul '12 to Jun '13 Total 84.1% 15.9% 3.5% 6.5 136 265 170 147
Average Appearances to Disposition: Average of all appearances from the first to last court appearance.
Case: Refers to all charges on an Information for each single accused.
Information: The document that sets out the name(s) of the accused and all the charges against the accused.
Date
% of Cases Disposed (for cases without bench warrants)
Average Appearances to
Disposition (for cases
without bench warrants)
Average Days to Disposition (for cases without bench warrants)
Cases Disposed: Refers to Cases completed in the Ontario Court of Justice including those committed for trial in the Superior Court of Justice.
Average Days to Disposition: Average number of days from when the first court appearance was scheduled to the date of the final court appearance.
Disposition Rate StatisticsYouth Criminal Cases
Ontario Court of Justice
July 2011 to June 2013Perth

Picton, Page 31
% Disposed Under 8 Months
% Disposed Over 8 Months
% Disposed Over 12 Months
For Cases Disposed
Before Trial Date
For Cases Disposed at Trial Without
Trial
For Cases Disposed
Following a Trial
For All Cases
2011/Jul 75.0% 25.0% 25.0% 6.5 79 634 2182011/Aug 42.9% 57.1% 0.0% 5.9 205 2052011/Sep 0.0% 100.0% 0.0% 8.0 284 2842011/Oct 66.7% 33.3% 0.0% 7.7 99 272 1562011/Nov 88.9% 11.1% 0.0% 4.0 107 1072011/Dec 66.7% 33.3% 0.0% 4.0 154 1542012/Jan 75.0% 25.0% 0.0% 5.9 149 1492012/Feb 0.0% 0.0% 2.3 75 752012/Mar 0.0% 0.0% 5.0 103 179 1412012/Apr 80.0% 20.0% 0.0% 4.4 178 210 1842012/May 2012/Jun 0.0% 0.0% 4.7 97 97Jul '11 to Jun '12 Total 76.5% 23.5% 2.0% 5.1 136 324 1512012/Jul 0.0% 0.0% 4.2 105 1052012/Aug 85.7% 14.3% 0.0% 3.7 84 842012/Sep 0.0% 0.0% 2.0 82 822012/Oct 0.0% 0.0% 4.0 165 1652012/Nov 77.8% 22.2% 11.1% 4.8 133 1332012/Dec 0.0% 0.0% 3.0 89 892013/Jan 91.7% 8.3% 0.0% 5.8 138 1382013/Feb 0.0% 0.0% 6.3 138 1382013/Mar 0.0% 0.0% 2.0 73 732013/Apr 50.0% 50.0% 0.0% 6.0 74 335 2052013/May 0.0% 0.0% 6.0 193 1932013/Jun 0.0% 100.0% 0.0% 7.0 259 259Jul '12 to Jun '13 Total 88.2% 11.8% 2.0% 4.8 124 335 128
Average Appearances to Disposition: Average of all appearances from the first to last court appearance.
Case: Refers to all charges on an Information for each single accused.
Information: The document that sets out the name(s) of the accused and all the charges against the accused.
Date
% of Cases Disposed (for cases without bench warrants)
Average Appearances to
Disposition (for cases
without bench warrants)
Average Days to Disposition (for cases without bench warrants)
Cases Disposed: Refers to Cases completed in the Ontario Court of Justice including those committed for trial in the Superior Court of Justice.
Average Days to Disposition: Average number of days from when the first court appearance was scheduled to the date of the final court appearance.
Disposition Rate StatisticsYouth Criminal Cases
Ontario Court of Justice
July 2011 to June 2013Picton

Northeast Overview, Page 32
% Disposed Under 8 Months
% Disposed Over 8 Months
% Disposed Over 12 Months
For Cases Disposed
Before Trial Date
For Cases Disposed at Trial Without
Trial
For Cases Disposed
Following a Trial
For All Cases
2011/Jul 95.0% 5.0% 3.3% 3.9 68 342 148 782011/Aug 93.6% 6.5% 2.6% 4.7 89 219 932011/Sep 94.6% 5.4% 0.5% 4.7 78 235 89 852011/Oct 92.2% 7.8% 2.0% 4.8 92 268 274 1012011/Nov 95.7% 4.4% 0.5% 4.5 79 176 197 862011/Dec 93.1% 6.9% 2.0% 4.4 84 210 380 902012/Jan 91.9% 8.1% 3.1% 4.7 80 262 160 912012/Feb 96.0% 4.0% 1.1% 4.1 81 139 428 902012/Mar 93.1% 6.9% 1.0% 4.0 80 135 355 852012/Apr 92.6% 7.4% 1.9% 4.4 87 336 982012/May 92.6% 7.4% 0.7% 4.3 88 240 912012/Jun 88.0% 12.1% 4.8% 4.6 98 276 97 112Jul '11 to Jun '12 Total 93.3% 6.7% 1.9% 4.4 83 230 243 912012/Jul 91.5% 8.5% 3.7% 4.8 81 329 912012/Aug 93.5% 6.5% 0.7% 4.2 75 228 188 802012/Sep 92.0% 8.0% 1.7% 4.1 85 189 169 922012/Oct 95.3% 4.7% 2.1% 4.0 77 375 426 842012/Nov 95.7% 4.3% 1.0% 3.9 69 226 318 782012/Dec 92.5% 7.5% 2.3% 3.7 79 257 832013/Jan 89.9% 10.1% 3.2% 4.2 80 226 407 892013/Feb 94.2% 5.8% 1.9% 4.3 84 266 294 992013/Mar 94.3% 5.7% 1.9% 4.1 72 293 752013/Apr 92.4% 7.7% 2.4% 4.4 75 280 127 862013/May 92.0% 8.1% 1.3% 3.6 75 342 252 842013/Jun 94.4% 5.6% 2.8% 3.9 64 290 399 75Jul '12 to Jun '13 Total 93.2% 6.8% 2.0% 4.1 76 265 290 85
Average Appearances to Disposition: Average of all appearances from the first to last court appearance.
Case: Refers to all charges on an Information for each single accused.
Information: The document that sets out the name(s) of the accused and all the charges against the accused.
Date
% of Cases Disposed (for cases without bench warrants)
Average Appearances to
Disposition (for cases
without bench warrants)
Average Days to Disposition (for cases without bench warrants)
Cases Disposed: Refers to Cases completed in the Ontario Court of Justice including those committed for trial in the Superior Court of Justice.
Average Days to Disposition: Average number of days from when the first court appearance was scheduled to the date of the final court appearance.
Disposition Rate StatisticsYouth Criminal Cases
Ontario Court of Justice
July 2011 to June 2013Northeast Overview

Cochrane, Page 33
% Disposed Under 8 Months
% Disposed Over 8 Months
% Disposed Over 12 Months
For Cases Disposed
Before Trial Date
For Cases Disposed at Trial Without
Trial
For Cases Disposed
Following a Trial
For All Cases
2011/Jul 0.0% 0.0% 4.1 100 1002011/Aug 0.0% 0.0% 3.2 52 522011/Sep 0.0% 0.0% 3.0 80 802011/Oct 81.8% 18.2% 0.0% 4.7 150 308 1642011/Nov 90.9% 9.1% 0.0% 3.1 110 1102011/Dec 92.3% 7.7% 7.7% 4.3 125 1252012/Jan 87.5% 12.5% 0.0% 4.0 65 301 942012/Feb 0.0% 0.0% 3.0 89 892012/Mar 0.0% 0.0% 3.7 98 982012/Apr 0.0% 0.0% 4.0 36 362012/May 0.0% 0.0% 4.4 86 167 922012/Jun 75.0% 25.0% 0.0% 3.3 96 96Jul '11 to Jun '12 Total 94.7% 5.3% 0.9% 3.9 99 259 1032012/Jul 83.3% 16.7% 0.0% 6.0 81 812012/Aug 87.5% 12.5% 0.0% 3.1 51 512012/Sep 90.0% 10.0% 0.0% 4.8 125 1252012/Oct 88.9% 11.1% 0.0% 4.7 142 1422012/Nov 95.0% 5.0% 0.0% 3.5 108 347 1202012/Dec 0.0% 0.0% 2.3 127 1272013/Jan 77.8% 22.2% 0.0% 3.4 116 1162013/Feb 0.0% 0.0% 3.1 78 126 882013/Mar 79.0% 21.1% 0.0% 5.5 115 1152013/Apr 0.0% 0.0% 4.0 77 772013/May 95.2% 4.8% 0.0% 3.3 82 822013/Jun 0.0% 0.0% 2.5 40 40Jul '12 to Jun '13 Total 90.4% 9.6% 0.0% 4.0 101 347 126 104
Average Appearances to Disposition: Average of all appearances from the first to last court appearance.
Case: Refers to all charges on an Information for each single accused.
Information: The document that sets out the name(s) of the accused and all the charges against the accused.
Date
% of Cases Disposed (for cases without bench warrants)
Average Appearances to
Disposition (for cases
without bench warrants)
Average Days to Disposition (for cases without bench warrants)
Cases Disposed: Refers to Cases completed in the Ontario Court of Justice including those committed for trial in the Superior Court of Justice.
Average Days to Disposition: Average number of days from when the first court appearance was scheduled to the date of the final court appearance.
Disposition Rate StatisticsYouth Criminal Cases
Ontario Court of Justice
July 2011 to June 2013Cochrane
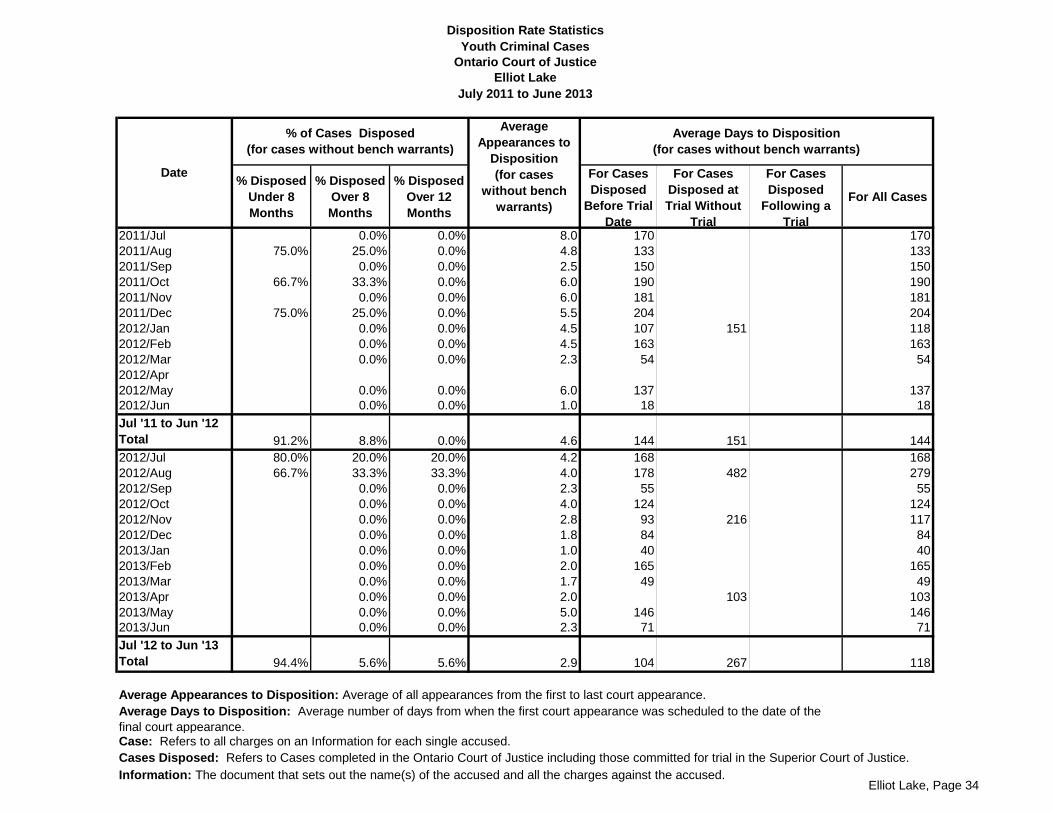
Elliot Lake, Page 34
% Disposed Under 8 Months
% Disposed Over 8 Months
% Disposed Over 12 Months
For Cases Disposed
Before Trial Date
For Cases Disposed at Trial Without
Trial
For Cases Disposed
Following a Trial
For All Cases
2011/Jul 0.0% 0.0% 8.0 170 1702011/Aug 75.0% 25.0% 0.0% 4.8 133 1332011/Sep 0.0% 0.0% 2.5 150 1502011/Oct 66.7% 33.3% 0.0% 6.0 190 1902011/Nov 0.0% 0.0% 6.0 181 1812011/Dec 75.0% 25.0% 0.0% 5.5 204 2042012/Jan 0.0% 0.0% 4.5 107 151 1182012/Feb 0.0% 0.0% 4.5 163 1632012/Mar 0.0% 0.0% 2.3 54 542012/Apr 2012/May 0.0% 0.0% 6.0 137 1372012/Jun 0.0% 0.0% 1.0 18 18Jul '11 to Jun '12 Total 91.2% 8.8% 0.0% 4.6 144 151 1442012/Jul 80.0% 20.0% 20.0% 4.2 168 1682012/Aug 66.7% 33.3% 33.3% 4.0 178 482 2792012/Sep 0.0% 0.0% 2.3 55 552012/Oct 0.0% 0.0% 4.0 124 1242012/Nov 0.0% 0.0% 2.8 93 216 1172012/Dec 0.0% 0.0% 1.8 84 842013/Jan 0.0% 0.0% 1.0 40 402013/Feb 0.0% 0.0% 2.0 165 1652013/Mar 0.0% 0.0% 1.7 49 492013/Apr 0.0% 0.0% 2.0 103 1032013/May 0.0% 0.0% 5.0 146 1462013/Jun 0.0% 0.0% 2.3 71 71Jul '12 to Jun '13 Total 94.4% 5.6% 5.6% 2.9 104 267 118
Average Appearances to Disposition: Average of all appearances from the first to last court appearance.
Case: Refers to all charges on an Information for each single accused.
Information: The document that sets out the name(s) of the accused and all the charges against the accused.
Date
% of Cases Disposed (for cases without bench warrants)
Average Appearances to
Disposition (for cases
without bench warrants)
Average Days to Disposition (for cases without bench warrants)
Cases Disposed: Refers to Cases completed in the Ontario Court of Justice including those committed for trial in the Superior Court of Justice.
Average Days to Disposition: Average number of days from when the first court appearance was scheduled to the date of the final court appearance.
Disposition Rate StatisticsYouth Criminal Cases
Ontario Court of Justice
July 2011 to June 2013Elliot Lake

Espanola, Page 35
% Disposed Under 8 Months
% Disposed Over 8 Months
% Disposed Over 12 Months
For Cases Disposed
Before Trial Date
For Cases Disposed at Trial Without
Trial
For Cases Disposed
Following a Trial
For All Cases
2011/Jul 0.0% 0.0% 3.1 112 1122011/Aug 0.0% 0.0% 2.4 79 792011/Sep 33.3% 66.7% 0.0% 9.0 234 2342011/Oct 50.0% 50.0% 50.0% 7.3 254 378 2852011/Nov 83.3% 16.7% 0.0% 2.8 66 252 972011/Dec 50.0% 50.0% 16.7% 5.5 190 224 2012012/Jan 2012/Feb 0.0% 0.0% 1.3 42 422012/Mar 62.5% 37.5% 0.0% 5.4 144 1442012/Apr 0.0% 0.0% 4.8 132 1322012/May 85.7% 14.3% 0.0% 4.7 167 1672012/Jun 62.5% 37.5% 31.3% 7.6 255 297 266Jul '11 to Jun '12 Total 75.7% 24.3% 10.8% 5.0 152 283 1662012/Jul 50.0% 50.0% 0.0% 5.0 82 343 2132012/Aug 2012/Sep 66.7% 33.3% 22.2% 5.0 189 319 2032012/Oct 0.0% 0.0% 3.8 99 992012/Nov 87.5% 12.5% 0.0% 6.9 115 350 1442012/Dec 50.0% 50.0% 16.7% 3.8 230 2302013/Jan 0.0% 100.0% 100.0% 13.0 559 5592013/Feb 2013/Mar 0.0% 0.0% 1.8 27 272013/Apr 50.0% 50.0% 0.0% 7.5 190 1902013/May 75.0% 25.0% 0.0% 4.8 96 260 1372013/Jun 71.4% 28.6% 28.6% 5.4 162 294 237Jul '12 to Jun '13 Total 72.2% 27.8% 11.1% 5.2 141 301 559 175
Average Appearances to Disposition: Average of all appearances from the first to last court appearance.
Case: Refers to all charges on an Information for each single accused.
Information: The document that sets out the name(s) of the accused and all the charges against the accused.
Date
% of Cases Disposed (for cases without bench warrants)
Average Appearances to
Disposition (for cases
without bench warrants)
Average Days to Disposition (for cases without bench warrants)
Cases Disposed: Refers to Cases completed in the Ontario Court of Justice including those committed for trial in the Superior Court of Justice.
Average Days to Disposition: Average number of days from when the first court appearance was scheduled to the date of the final court appearance.
Disposition Rate StatisticsYouth Criminal Cases
Ontario Court of Justice
July 2011 to June 2013Espanola

Gore Bay, Page 36
% Disposed Under 8 Months
% Disposed Over 8 Months
% Disposed Over 12 Months
For Cases Disposed
Before Trial Date
For Cases Disposed at Trial Without
Trial
For Cases Disposed
Following a Trial
For All Cases
2011/Jul 90.0% 10.0% 0.0% 4.2 53 273 752011/Aug 60.0% 40.0% 30.0% 10.2 257 2572011/Sep 0.0% 0.0% 5.5 99 992011/Oct 0.0% 0.0% 3.0 50 502011/Nov 0.0% 0.0% 5.7 79 792011/Dec 88.2% 11.8% 0.0% 3.7 84 57 822012/Jan 57.1% 42.9% 0.0% 5.7 140 1402012/Feb 70.0% 30.0% 10.0% 6.8 215 92 1412012/Mar 88.9% 11.1% 11.1% 4.6 71 712012/Apr 50.0% 50.0% 0.0% 8.3 181 1812012/May 0.0% 0.0% 5.2 137 1372012/Jun 0.0% 0.0% 3.7 43 43Jul '11 to Jun '12 Total 84.5% 15.5% 4.9% 5.4 113 87 273 1132012/Jul 0.0% 0.0% 4.5 98 982012/Aug 50.0% 50.0% 0.0% 6.8 133 299 1752012/Sep 70.0% 30.0% 10.0% 6.5 145 91 5 1252012/Oct 0.0% 0.0% 4.3 122 1222012/Nov 0.0% 100.0% 100.0% 14.0 488 4882012/Dec 0.0% 0.0% 8.0 191 1912013/Jan 60.0% 40.0% 20.0% 7.8 167 254 1842013/Feb 0.0% 0.0% 4.2 84 842013/Mar 92.9% 7.1% 0.0% 5.1 83 832013/Apr 88.9% 11.1% 0.0% 5.0 131 1312013/May 33.3% 66.7% 33.3% 6.3 229 252 2372013/Jun 0.0% 0.0% 2.0 55 55Jul '12 to Jun '13 Total 81.8% 18.2% 6.1% 5.6 124 195 170 128
Average Appearances to Disposition: Average of all appearances from the first to last court appearance.
Case: Refers to all charges on an Information for each single accused.
Information: The document that sets out the name(s) of the accused and all the charges against the accused.
Date
% of Cases Disposed (for cases without bench warrants)
Average Appearances to
Disposition (for cases
without bench warrants)
Average Days to Disposition (for cases without bench warrants)
Cases Disposed: Refers to Cases completed in the Ontario Court of Justice including those committed for trial in the Superior Court of Justice.
Average Days to Disposition: Average number of days from when the first court appearance was scheduled to the date of the final court appearance.
Disposition Rate StatisticsYouth Criminal Cases
Ontario Court of Justice
July 2011 to June 2013Gore Bay

Haileybury, Page 37
% Disposed Under 8 Months
% Disposed Over 8 Months
% Disposed Over 12 Months
For Cases Disposed
Before Trial Date
For Cases Disposed at Trial Without
Trial
For Cases Disposed
Following a Trial
For All Cases
2011/Jul 2011/Aug 2011/Sep 2011/Oct 2011/Nov 2011/Dec 2012/Jan 2012/Feb 2012/Mar 2012/Apr 2012/May 2012/Jun Jul '11 to Jun '12 Total 2012/Jul 2012/Aug 2012/Sep 2012/Oct 2012/Nov 2012/Dec 2013/Jan 2013/Feb 2013/Mar 2013/Apr 2013/May 2013/Jun Jul '12 to Jun '13 Total
Average Appearances to Disposition: Average of all appearances from the first to last court appearance.
Case: Refers to all charges on an Information for each single accused.
Information: The document that sets out the name(s) of the accused and all the charges against the accused.
Date
% of Cases Disposed (for cases without bench warrants)
Average Appearances to
Disposition (for cases
without bench warrants)
Average Days to Disposition (for cases without bench warrants)
Cases Disposed: Refers to Cases completed in the Ontario Court of Justice including those committed for trial in the Superior Court of Justice.
Average Days to Disposition: Average number of days from when the first court appearance was scheduled to the date of the final court appearance.
Disposition Rate StatisticsYouth Criminal Cases
Ontario Court of Justice
July 2011 to June 2013Haileybury

Kirkland Lake, Page 38
% Disposed Under 8 Months
% Disposed Over 8 Months
% Disposed Over 12 Months
For Cases Disposed
Before Trial Date
For Cases Disposed at Trial Without
Trial
For Cases Disposed
Following a Trial
For All Cases
2011/Jul 0.0% 0.0% 4.1 78 782011/Aug 0.0% 0.0% 2.5 106 1062011/Sep 95.2% 4.8% 0.0% 3.5 99 992011/Oct 0.0% 0.0% 2.8 83 832011/Nov 95.7% 4.4% 4.4% 4.1 94 153 962011/Dec 0.0% 0.0% 3.8 102 1022012/Jan 2012/Feb 0.0% 0.0% 2.7 92 922012/Mar 71.4% 28.6% 4.8% 4.9 135 391 1592012/Apr 82.4% 17.7% 5.9% 5.7 157 165 1592012/May 50.0% 50.0% 0.0% 8.0 200 2002012/Jun 80.8% 19.2% 0.0% 4.2 119 257 124Jul '11 to Jun '12 Total 87.5% 12.5% 1.9% 4.3 114 178 391 1202012/Jul 63.6% 36.4% 18.2% 5.4 166 439 1912012/Aug 0.0% 0.0% 2.2 62 622012/Sep 0.0% 0.0% 2.0 75 752012/Oct 94.1% 5.9% 5.9% 3.4 82 822012/Nov 86.7% 13.3% 6.7% 3.7 90 378 1092012/Dec 92.9% 7.1% 7.1% 4.2 79 792013/Jan 73.7% 26.3% 15.8% 5.8 130 767 1632013/Feb 0.0% 0.0% 2.8 54 542013/Mar 87.5% 12.5% 12.5% 4.6 137 1372013/Apr 0.0% 0.0% 2.0 42 422013/May 0.0% 0.0% 4.1 101 1012013/Jun 0.0% 0.0% 3.0 69 69Jul '12 to Jun '13 Total 90.1% 9.9% 6.3% 3.7 89 603 378 99
Average Appearances to Disposition: Average of all appearances from the first to last court appearance.
Case: Refers to all charges on an Information for each single accused.
Information: The document that sets out the name(s) of the accused and all the charges against the accused.
Date
% of Cases Disposed (for cases without bench warrants)
Average Appearances to
Disposition (for cases
without bench warrants)
Average Days to Disposition (for cases without bench warrants)
Cases Disposed: Refers to Cases completed in the Ontario Court of Justice including those committed for trial in the Superior Court of Justice.
Average Days to Disposition: Average number of days from when the first court appearance was scheduled to the date of the final court appearance.
Disposition Rate StatisticsYouth Criminal Cases
Ontario Court of Justice
July 2011 to June 2013Kirkland Lake

North Bay, Page 39
% Disposed Under 8 Months
% Disposed Over 8 Months
% Disposed Over 12 Months
For Cases Disposed
Before Trial Date
For Cases Disposed at Trial Without
Trial
For Cases Disposed
Following a Trial
For All Cases
2011/Jul 95.0% 5.0% 5.0% 3.5 48 497 702011/Aug 0.0% 0.0% 3.7 26 187 422011/Sep 0.0% 0.0% 6.4 62 158 126 762011/Oct 91.3% 8.7% 0.0% 5.4 57 305 324 792011/Nov 0.0% 0.0% 4.7 47 472011/Dec 0.0% 0.0% 7.1 93 185 982012/Jan 76.9% 23.1% 15.4% 6.8 69 397 1452012/Feb 95.5% 4.6% 4.6% 5.2 56 165 428 1042012/Mar 0.0% 0.0% 4.9 99 71 952012/Apr 88.9% 11.1% 5.6% 4.7 80 1,027 1322012/May 83.3% 16.7% 0.0% 4.6 66 256 772012/Jun 71.4% 28.6% 28.6% 7.3 56 512 186Jul '11 to Jun '12 Total 92.9% 7.1% 3.6% 5.3 64 312 326 922012/Jul 78.6% 21.4% 7.1% 8.1 68 318 1222012/Aug 88.2% 11.8% 0.0% 5.0 94 66 912012/Sep 87.5% 12.5% 0.0% 5.5 48 185 333 1002012/Oct 96.0% 4.0% 4.0% 5.3 64 431 782012/Nov 95.2% 4.8% 0.0% 5.9 61 234 258 872012/Dec 92.3% 7.7% 0.0% 5.9 99 264 1242013/Jan 94.4% 5.6% 0.0% 4.9 72 216 882013/Feb 80.0% 20.0% 13.3% 7.8 69 456 624 1572013/Mar 0.0% 0.0% 4.3 49 492013/Apr 88.9% 11.1% 11.1% 3.6 72 722013/May 93.8% 6.3% 0.0% 5.4 99 265 1092013/Jun 77.8% 22.2% 11.1% 5.7 63 275 399 124Jul '12 to Jun '13 Total 90.5% 9.6% 3.0% 5.6 70 247 404 97
Average Appearances to Disposition: Average of all appearances from the first to last court appearance.
Case: Refers to all charges on an Information for each single accused.
Information: The document that sets out the name(s) of the accused and all the charges against the accused.
Date
% of Cases Disposed (for cases without bench warrants)
Average Appearances to
Disposition (for cases
without bench warrants)
Average Days to Disposition (for cases without bench warrants)
Cases Disposed: Refers to Cases completed in the Ontario Court of Justice including those committed for trial in the Superior Court of Justice.
Average Days to Disposition: Average number of days from when the first court appearance was scheduled to the date of the final court appearance.
Disposition Rate StatisticsYouth Criminal Cases
Ontario Court of Justice
July 2011 to June 2013North Bay

Parry Sound, Page 40
% Disposed Under 8 Months
% Disposed Over 8 Months
% Disposed Over 12 Months
For Cases Disposed
Before Trial Date
For Cases Disposed at Trial Without
Trial
For Cases Disposed
Following a Trial
For All Cases
2011/Jul 0.0% 0.0% 1.6 56 562011/Aug 0.0% 0.0% 2.3 57 91 602011/Sep 0.0% 0.0% 2.5 75 752011/Oct 0.0% 0.0% 3.8 29 224 622011/Nov 0.0% 0.0% 5.6 178 1782011/Dec 94.7% 5.3% 0.0% 3.2 58 582012/Jan 0.0% 0.0% 3.6 28 127 99 822012/Feb 92.3% 7.7% 0.0% 4.3 84 229 1292012/Mar 0.0% 0.0% 2.1 51 512012/Apr 0.0% 0.0% 2.7 69 692012/May 0.0% 0.0% 2.0 12 122012/Jun 0.0% 0.0% 3.0 70 97 84Jul '11 to Jun '12 Total 97.9% 2.1% 0.0% 3.1 57 180 140 752012/Jul 0.0% 0.0% 3.2 71 192 912012/Aug 0.0% 0.0% 3.5 51 188 652012/Sep 0.0% 0.0% 2.4 49 492012/Oct 0.0% 0.0% 2.8 58 582012/Nov 88.9% 11.1% 0.0% 2.7 59 592012/Dec 90.0% 10.0% 0.0% 2.9 68 682013/Jan 0.0% 0.0% 2.6 27 272013/Feb 0.0% 0.0% 3.0 37 169 612013/Mar 0.0% 0.0% 2.8 103 1032013/Apr 0.0% 0.0% 1.8 59 592013/May 90.9% 9.1% 9.1% 3.7 77 583 1232013/Jun 66.7% 33.3% 0.0% 5.0 122 122Jul '12 to Jun '13 Total 94.4% 5.6% 0.9% 3.1 63 278 188 72
Average Appearances to Disposition: Average of all appearances from the first to last court appearance.
Case: Refers to all charges on an Information for each single accused.
Information: The document that sets out the name(s) of the accused and all the charges against the accused.
Date
% of Cases Disposed (for cases without bench warrants)
Average Appearances to
Disposition (for cases
without bench warrants)
Average Days to Disposition (for cases without bench warrants)
Cases Disposed: Refers to Cases completed in the Ontario Court of Justice including those committed for trial in the Superior Court of Justice.
Average Days to Disposition: Average number of days from when the first court appearance was scheduled to the date of the final court appearance.
Disposition Rate StatisticsYouth Criminal Cases
Ontario Court of Justice
July 2011 to June 2013Parry Sound
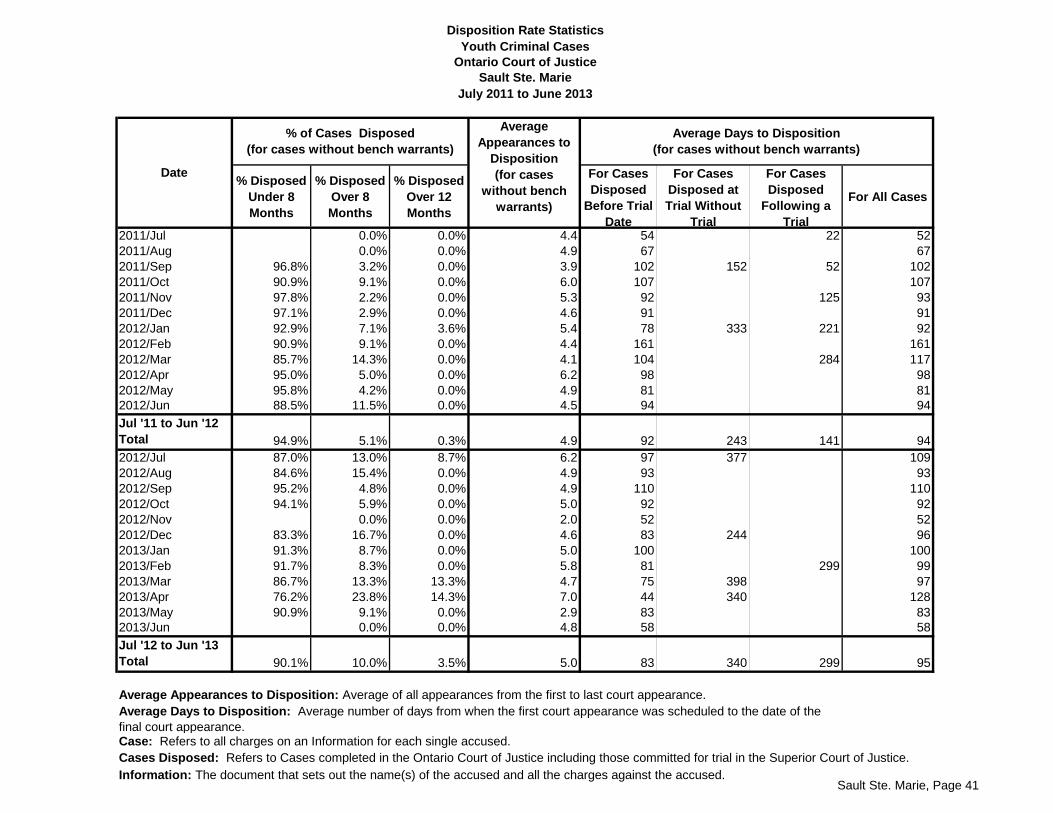
Sault Ste. Marie, Page 41
% Disposed Under 8 Months
% Disposed Over 8 Months
% Disposed Over 12 Months
For Cases Disposed
Before Trial Date
For Cases Disposed at Trial Without
Trial
For Cases Disposed
Following a Trial
For All Cases
2011/Jul 0.0% 0.0% 4.4 54 22 522011/Aug 0.0% 0.0% 4.9 67 672011/Sep 96.8% 3.2% 0.0% 3.9 102 152 52 1022011/Oct 90.9% 9.1% 0.0% 6.0 107 1072011/Nov 97.8% 2.2% 0.0% 5.3 92 125 932011/Dec 97.1% 2.9% 0.0% 4.6 91 912012/Jan 92.9% 7.1% 3.6% 5.4 78 333 221 922012/Feb 90.9% 9.1% 0.0% 4.4 161 1612012/Mar 85.7% 14.3% 0.0% 4.1 104 284 1172012/Apr 95.0% 5.0% 0.0% 6.2 98 982012/May 95.8% 4.2% 0.0% 4.9 81 812012/Jun 88.5% 11.5% 0.0% 4.5 94 94Jul '11 to Jun '12 Total 94.9% 5.1% 0.3% 4.9 92 243 141 942012/Jul 87.0% 13.0% 8.7% 6.2 97 377 1092012/Aug 84.6% 15.4% 0.0% 4.9 93 932012/Sep 95.2% 4.8% 0.0% 4.9 110 1102012/Oct 94.1% 5.9% 0.0% 5.0 92 922012/Nov 0.0% 0.0% 2.0 52 522012/Dec 83.3% 16.7% 0.0% 4.6 83 244 962013/Jan 91.3% 8.7% 0.0% 5.0 100 1002013/Feb 91.7% 8.3% 0.0% 5.8 81 299 992013/Mar 86.7% 13.3% 13.3% 4.7 75 398 972013/Apr 76.2% 23.8% 14.3% 7.0 44 340 1282013/May 90.9% 9.1% 0.0% 2.9 83 832013/Jun 0.0% 0.0% 4.8 58 58Jul '12 to Jun '13 Total 90.1% 10.0% 3.5% 5.0 83 340 299 95
Average Appearances to Disposition: Average of all appearances from the first to last court appearance.
Case: Refers to all charges on an Information for each single accused.
Information: The document that sets out the name(s) of the accused and all the charges against the accused.
Date
% of Cases Disposed (for cases without bench warrants)
Average Appearances to
Disposition (for cases
without bench warrants)
Average Days to Disposition (for cases without bench warrants)
Cases Disposed: Refers to Cases completed in the Ontario Court of Justice including those committed for trial in the Superior Court of Justice.
Average Days to Disposition: Average number of days from when the first court appearance was scheduled to the date of the final court appearance.
Disposition Rate StatisticsYouth Criminal Cases
Ontario Court of Justice
July 2011 to June 2013Sault Ste. Marie

Sudbury, Page 42
% Disposed Under 8 Months
% Disposed Over 8 Months
% Disposed Over 12 Months
For Cases Disposed
Before Trial Date
For Cases Disposed at Trial Without
Trial
For Cases Disposed
Following a Trial
For All Cases
2011/Jul 92.4% 7.6% 6.1% 4.1 66 269 782011/Aug 98.0% 2.0% 2.0% 5.0 86 371 972011/Sep 96.4% 3.6% 0.0% 5.3 63 221 692011/Oct 0.0% 0.0% 4.9 80 110 802011/Nov 94.3% 5.7% 0.0% 4.1 58 73 269 612011/Dec 98.3% 1.7% 0.0% 4.1 60 602012/Jan 96.7% 3.3% 0.0% 4.2 75 752012/Feb 98.3% 1.7% 0.0% 4.2 65 652012/Mar 98.7% 1.3% 0.0% 3.9 61 612012/Apr 98.0% 2.0% 0.0% 3.5 68 682012/May 94.3% 5.7% 2.9% 3.3 46 298 532012/Jun 96.6% 3.5% 1.7% 4.4 84 96 84Jul '11 to Jun '12 Total 96.8% 3.2% 1.0% 4.3 67 225 269 712012/Jul 0.0% 0.0% 4.8 66 662012/Aug 96.4% 3.6% 0.0% 4.8 84 842012/Sep 96.0% 4.0% 0.0% 3.5 77 772012/Oct 0.0% 0.0% 4.1 66 662012/Nov 97.7% 2.3% 0.0% 3.7 59 164 642012/Dec 0.0% 0.0% 3.7 43 432013/Jan 0.0% 0.0% 3.3 49 492013/Feb 97.9% 2.1% 0.0% 4.0 91 912013/Mar 0.0% 0.0% 3.9 57 572013/Apr 0.0% 0.0% 4.1 63 127 642013/May 96.1% 3.9% 0.0% 3.1 46 462013/Jun 0.0% 0.0% 3.5 53 53Jul '12 to Jun '13 Total 98.5% 1.5% 0.0% 3.9 64 164 127 64
Average Appearances to Disposition: Average of all appearances from the first to last court appearance.
Case: Refers to all charges on an Information for each single accused.
Information: The document that sets out the name(s) of the accused and all the charges against the accused.
Date
% of Cases Disposed (for cases without bench warrants)
Average Appearances to
Disposition (for cases
without bench warrants)
Average Days to Disposition (for cases without bench warrants)
Cases Disposed: Refers to Cases completed in the Ontario Court of Justice including those committed for trial in the Superior Court of Justice.
Average Days to Disposition: Average number of days from when the first court appearance was scheduled to the date of the final court appearance.
Disposition Rate StatisticsYouth Criminal Cases
Ontario Court of Justice
July 2011 to June 2013Sudbury

Timmins, Page 43
% Disposed Under 8 Months
% Disposed Over 8 Months
% Disposed Over 12 Months
For Cases Disposed
Before Trial Date
For Cases Disposed at Trial Without
Trial
For Cases Disposed
Following a Trial
For All Cases
2011/Jul 90.0% 10.0% 5.0% 3.4 56 482 772011/Aug 89.5% 10.5% 0.0% 4.3 85 76 852011/Sep 84.0% 16.0% 4.0% 3.6 47 327 802011/Oct 90.0% 10.0% 3.3% 3.4 99 254 1092011/Nov 96.2% 3.9% 0.0% 4.9 101 185 1142011/Dec 80.0% 20.0% 10.0% 4.1 78 260 380 1202012/Jan 94.4% 5.6% 5.6% 4.3 86 130 872012/Feb 0.0% 0.0% 3.3 69 84 712012/Mar 96.9% 3.1% 0.0% 3.6 67 264 732012/Apr 92.5% 7.5% 2.5% 3.8 76 334 892012/May 0.0% 0.0% 3.5 93 932012/Jun 94.1% 5.9% 0.0% 3.6 42 231 86Jul '11 to Jun '12 Total 92.6% 7.4% 2.4% 3.8 77 232 380 902012/Jul 97.4% 2.6% 0.0% 2.8 64 642012/Aug 0.0% 0.0% 3.4 50 502012/Sep 0.0% 0.0% 1.8 39 392012/Oct 88.2% 11.8% 5.9% 2.9 54 347 426 822012/Nov 0.0% 0.0% 3.4 49 492012/Dec 92.3% 7.7% 3.9% 2.2 73 732013/Jan 87.0% 13.0% 0.0% 3.6 88 52 832013/Feb 90.5% 9.5% 2.4% 4.1 97 220 1092013/Mar 95.5% 4.6% 0.0% 2.9 63 188 692013/Apr 88.6% 11.4% 0.0% 4.8 106 190 1112013/May 86.7% 13.3% 0.0% 2.4 78 782013/Jun 96.9% 3.1% 3.1% 3.4 64 64Jul '12 to Jun '13 Total 93.6% 6.4% 1.5% 3.3 70 191 426 75
Average Appearances to Disposition: Average of all appearances from the first to last court appearance.
Case: Refers to all charges on an Information for each single accused.
Information: The document that sets out the name(s) of the accused and all the charges against the accused.
Date
% of Cases Disposed (for cases without bench warrants)
Average Appearances to
Disposition (for cases
without bench warrants)
Average Days to Disposition (for cases without bench warrants)
Cases Disposed: Refers to Cases completed in the Ontario Court of Justice including those committed for trial in the Superior Court of Justice.
Average Days to Disposition: Average number of days from when the first court appearance was scheduled to the date of the final court appearance.
Disposition Rate StatisticsYouth Criminal Cases
Ontario Court of Justice
July 2011 to June 2013Timmins
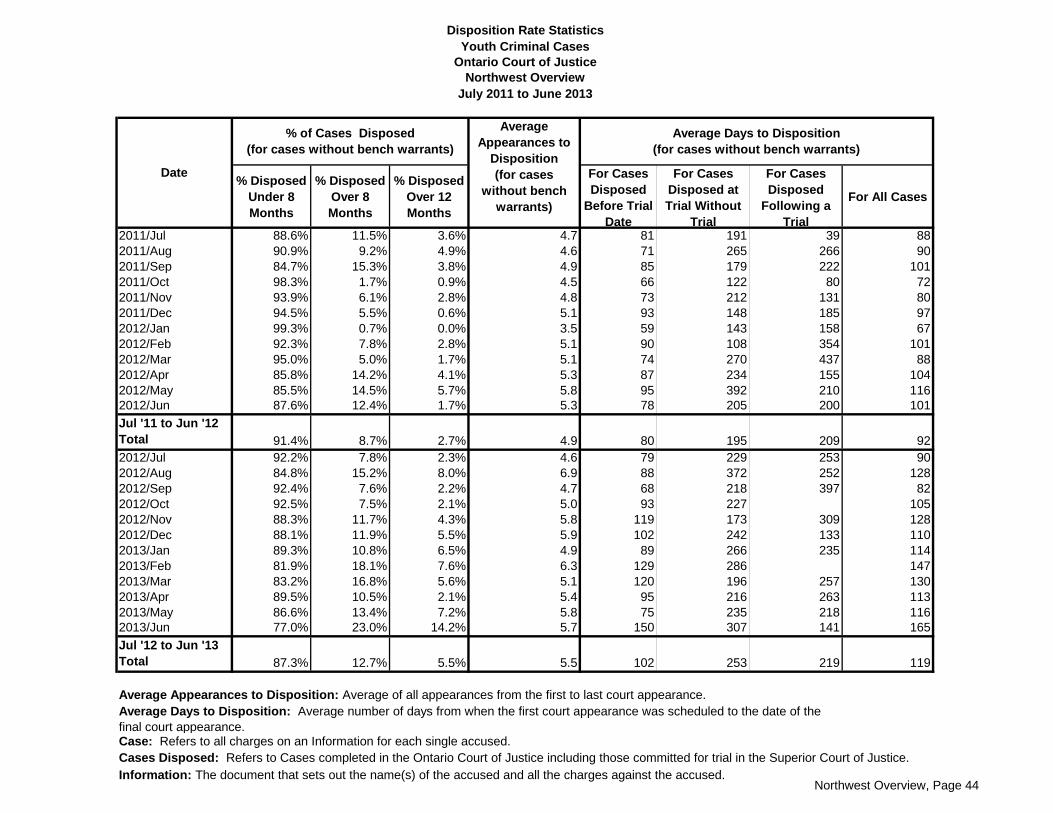
Northwest Overview, Page 44
% Disposed Under 8 Months
% Disposed Over 8 Months
% Disposed Over 12 Months
For Cases Disposed
Before Trial Date
For Cases Disposed at Trial Without
Trial
For Cases Disposed
Following a Trial
For All Cases
2011/Jul 88.6% 11.5% 3.6% 4.7 81 191 39 882011/Aug 90.9% 9.2% 4.9% 4.6 71 265 266 902011/Sep 84.7% 15.3% 3.8% 4.9 85 179 222 1012011/Oct 98.3% 1.7% 0.9% 4.5 66 122 80 722011/Nov 93.9% 6.1% 2.8% 4.8 73 212 131 802011/Dec 94.5% 5.5% 0.6% 5.1 93 148 185 972012/Jan 99.3% 0.7% 0.0% 3.5 59 143 158 672012/Feb 92.3% 7.8% 2.8% 5.1 90 108 354 1012012/Mar 95.0% 5.0% 1.7% 5.1 74 270 437 882012/Apr 85.8% 14.2% 4.1% 5.3 87 234 155 1042012/May 85.5% 14.5% 5.7% 5.8 95 392 210 1162012/Jun 87.6% 12.4% 1.7% 5.3 78 205 200 101Jul '11 to Jun '12 Total 91.4% 8.7% 2.7% 4.9 80 195 209 922012/Jul 92.2% 7.8% 2.3% 4.6 79 229 253 902012/Aug 84.8% 15.2% 8.0% 6.9 88 372 252 1282012/Sep 92.4% 7.6% 2.2% 4.7 68 218 397 822012/Oct 92.5% 7.5% 2.1% 5.0 93 227 1052012/Nov 88.3% 11.7% 4.3% 5.8 119 173 309 1282012/Dec 88.1% 11.9% 5.5% 5.9 102 242 133 1102013/Jan 89.3% 10.8% 6.5% 4.9 89 266 235 1142013/Feb 81.9% 18.1% 7.6% 6.3 129 286 1472013/Mar 83.2% 16.8% 5.6% 5.1 120 196 257 1302013/Apr 89.5% 10.5% 2.1% 5.4 95 216 263 1132013/May 86.6% 13.4% 7.2% 5.8 75 235 218 1162013/Jun 77.0% 23.0% 14.2% 5.7 150 307 141 165Jul '12 to Jun '13 Total 87.3% 12.7% 5.5% 5.5 102 253 219 119
Average Appearances to Disposition: Average of all appearances from the first to last court appearance.
Case: Refers to all charges on an Information for each single accused.
Information: The document that sets out the name(s) of the accused and all the charges against the accused.
Date
% of Cases Disposed (for cases without bench warrants)
Average Appearances to
Disposition (for cases
without bench warrants)
Average Days to Disposition (for cases without bench warrants)
Cases Disposed: Refers to Cases completed in the Ontario Court of Justice including those committed for trial in the Superior Court of Justice.
Average Days to Disposition: Average number of days from when the first court appearance was scheduled to the date of the final court appearance.
Disposition Rate StatisticsYouth Criminal Cases
Ontario Court of Justice
July 2011 to June 2013Northwest Overview

Dryden, Page 45
% Disposed Under 8 Months
% Disposed Over 8 Months
% Disposed Over 12 Months
For Cases Disposed
Before Trial Date
For Cases Disposed at Trial Without
Trial
For Cases Disposed
Following a Trial
For All Cases
2011/Jul 84.6% 15.4% 7.7% 4.3 81 194 1032011/Aug 0.0% 0.0% 3.2 42 48 432011/Sep 0.0% 0.0% 4.1 61 104 662011/Oct 0.0% 0.0% 4.5 74 108 71 792011/Nov 0.0% 0.0% 4.6 52 46 522011/Dec 0.0% 0.0% 3.8 62 133 134 752012/Jan 0.0% 0.0% 3.4 47 136 128 632012/Feb 0.0% 0.0% 4.1 60 111 702012/Mar 93.8% 6.3% 0.0% 3.1 84 842012/Apr 84.4% 15.6% 0.0% 6.3 53 234 922012/May 84.2% 15.8% 5.3% 3.2 80 247 309 1012012/Jun 75.0% 25.0% 0.0% 4.5 64 238 114Jul '11 to Jun '12 Total 93.9% 6.1% 1.0% 4.2 63 159 161 772012/Jul 96.2% 3.9% 0.0% 3.1 51 120 542012/Aug 94.4% 5.6% 0.0% 4.8 62 189 762012/Sep 81.8% 18.2% 0.0% 2.8 79 233 1002012/Oct 0.0% 0.0% 5.5 108 102 1072012/Nov 96.4% 3.6% 0.0% 4.8 102 96 1022012/Dec 84.4% 15.6% 6.3% 4.5 109 242 84 1242013/Jan 73.9% 26.1% 13.0% 5.8 120 344 1882013/Feb 0.0% 0.0% 4.0 70 702013/Mar 79.0% 21.1% 0.0% 4.9 94 165 331 1342013/Apr 94.1% 5.9% 0.0% 3.7 55 140 702013/May 0.0% 0.0% 3.3 51 76 562013/Jun 0.0% 0.0% 2.9 54 54Jul '12 to Jun '13 Total 91.2% 8.9% 1.9% 4.3 81 191 207 98
Average Appearances to Disposition: Average of all appearances from the first to last court appearance.
Case: Refers to all charges on an Information for each single accused.
Information: The document that sets out the name(s) of the accused and all the charges against the accused.
Date
% of Cases Disposed (for cases without bench warrants)
Average Appearances to
Disposition (for cases
without bench warrants)
Average Days to Disposition (for cases without bench warrants)
Cases Disposed: Refers to Cases completed in the Ontario Court of Justice including those committed for trial in the Superior Court of Justice.
Average Days to Disposition: Average number of days from when the first court appearance was scheduled to the date of the final court appearance.
Disposition Rate StatisticsYouth Criminal Cases
Ontario Court of Justice
July 2011 to June 2013Dryden

Fort Frances, Page 46
% Disposed Under 8 Months
% Disposed Over 8 Months
% Disposed Over 12 Months
For Cases Disposed
Before Trial Date
For Cases Disposed at Trial Without
Trial
For Cases Disposed
Following a Trial
For All Cases
2011/Jul 0.0% 0.0% 4.0 84 842011/Aug 0.0% 0.0% 2.8 57 572011/Sep 0.0% 0.0% 3.0 58 582011/Oct 0.0% 0.0% 3.0 110 1102011/Nov 0.0% 0.0% 4.3 103 1032011/Dec 0.0% 0.0% 5.6 92 922012/Jan 0.0% 0.0% 2.8 49 492012/Feb 91.7% 8.3% 0.0% 5.1 132 1322012/Mar 0.0% 0.0% 2.0 62 622012/Apr 0.0% 0.0% 3.3 34 127 412012/May 0.0% 0.0% 4.5 79 792012/Jun 0.0% 0.0% 3.1 59 114 66Jul '11 to Jun '12 Total 98.8% 1.2% 0.0% 4.0 79 121 802012/Jul 0.0% 0.0% 2.5 34 99 502012/Aug 0.0% 0.0% 3.8 88 882012/Sep 0.0% 0.0% 1.5 36 362012/Oct 0.0% 0.0% 3.5 55 552012/Nov 0.0% 0.0% 4.4 88 882012/Dec 0.0% 0.0% 3.0 52 522013/Jan 66.7% 33.3% 33.3% 8.0 207 2072013/Feb 60.0% 40.0% 40.0% 8.2 230 289 2542013/Mar 77.8% 22.2% 11.1% 7.7 198 140 1852013/Apr 66.7% 33.3% 0.0% 4.8 106 253 1302013/May 0.0% 0.0% 4.8 97 210 1252013/Jun 85.7% 14.3% 0.0% 6.1 140 140Jul '12 to Jun '13 Total 88.9% 11.1% 5.6% 5.0 109 203 118
Average Appearances to Disposition: Average of all appearances from the first to last court appearance.
Case: Refers to all charges on an Information for each single accused.
Information: The document that sets out the name(s) of the accused and all the charges against the accused.
Date
% of Cases Disposed (for cases without bench warrants)
Average Appearances to
Disposition (for cases
without bench warrants)
Average Days to Disposition (for cases without bench warrants)
Cases Disposed: Refers to Cases completed in the Ontario Court of Justice including those committed for trial in the Superior Court of Justice.
Average Days to Disposition: Average number of days from when the first court appearance was scheduled to the date of the final court appearance.
Disposition Rate StatisticsYouth Criminal Cases
Ontario Court of Justice
July 2011 to June 2013Fort Frances

Kenora, Page 47
% Disposed Under 8 Months
% Disposed Over 8 Months
% Disposed Over 12 Months
For Cases Disposed
Before Trial Date
For Cases Disposed at Trial Without
Trial
For Cases Disposed
Following a Trial
For All Cases
2011/Jul 87.1% 12.9% 2.9% 4.6 88 245 11 982011/Aug 88.7% 11.3% 1.9% 4.0 70 282 266 932011/Sep 76.4% 23.6% 5.5% 5.0 81 251 217 1172011/Oct 96.2% 3.9% 0.0% 4.7 82 159 82 942011/Nov 89.7% 10.3% 5.2% 4.8 80 335 172 952011/Dec 86.1% 14.0% 0.0% 6.0 128 172 286 1352012/Jan 97.0% 3.0% 0.0% 4.2 66 172 792012/Feb 86.8% 13.2% 3.8% 5.8 115 111 178 1182012/Mar 88.0% 12.0% 8.0% 6.5 81 292 437 1322012/Apr 86.7% 13.3% 3.3% 4.8 74 256 155 1162012/May 75.0% 25.0% 12.5% 5.0 89 510 185 1502012/Jun 90.2% 9.8% 2.0% 6.5 94 172 170 109Jul '11 to Jun '12 Total 87.0% 13.0% 3.6% 5.1 88 235 196 1102012/Jul 85.0% 15.0% 10.0% 4.3 83 361 1242012/Aug 73.9% 26.1% 15.2% 8.4 105 382 1592012/Sep 84.6% 15.4% 7.7% 5.0 56 342 397 1042012/Oct 87.2% 12.8% 4.3% 5.5 94 328 1192012/Nov 86.7% 13.3% 6.7% 6.2 138 190 318 1542012/Dec 86.7% 13.3% 6.7% 10.2 142 158 1432013/Jan 0.0% 0.0% 4.1 67 156 235 912013/Feb 68.8% 31.3% 8.3% 8.3 168 301 1932013/Mar 0.0% 0.0% 4.1 97 110 982013/Apr 87.5% 12.5% 5.0% 7.2 115 239 263 1472013/May 80.0% 20.0% 5.0% 5.5 63 262 218 1202013/Jun 80.0% 20.0% 15.0% 6.8 153 312 141 179Jul '12 to Jun '13 Total 82.7% 17.3% 7.8% 6.7 115 291 216 145
Average Appearances to Disposition: Average of all appearances from the first to last court appearance.
Case: Refers to all charges on an Information for each single accused.
Information: The document that sets out the name(s) of the accused and all the charges against the accused.
Date
% of Cases Disposed (for cases without bench warrants)
Average Appearances to
Disposition (for cases
without bench warrants)
Average Days to Disposition (for cases without bench warrants)
Cases Disposed: Refers to Cases completed in the Ontario Court of Justice including those committed for trial in the Superior Court of Justice.
Average Days to Disposition: Average number of days from when the first court appearance was scheduled to the date of the final court appearance.
Disposition Rate StatisticsYouth Criminal Cases
Ontario Court of Justice
July 2011 to June 2013Kenora

Thunder Bay, Page 48
% Disposed Under 8 Months
% Disposed Over 8 Months
% Disposed Over 12 Months
For Cases Disposed
Before Trial Date
For Cases Disposed at Trial Without
Trial
For Cases Disposed
Following a Trial
For All Cases
2011/Jul 90.0% 10.0% 3.3% 5.3 72 53 67 712011/Aug 88.3% 11.7% 10.0% 5.7 84 469 1092011/Sep 83.7% 16.3% 4.7% 5.5 109 56 226 1102011/Oct 98.3% 1.7% 1.7% 4.5 56 91 582011/Nov 94.1% 6.0% 2.4% 4.9 76 162 90 812011/Dec 95.8% 4.2% 1.4% 5.1 85 134 862012/Jan 0.0% 0.0% 3.3 60 112 187 632012/Feb 94.6% 5.5% 3.6% 4.8 69 98 619 912012/Mar 97.3% 2.7% 0.0% 5.3 70 259 752012/Apr 83.6% 16.4% 6.9% 5.4 113 218 1162012/May 89.9% 10.1% 2.9% 6.9 102 228 186 1062012/Jun 89.5% 10.5% 2.6% 4.8 71 221 274 90Jul '11 to Jun '12 Total 92.5% 7.5% 3.2% 5.1 80 181 264 872012/Jul 92.3% 7.7% 1.3% 5.3 89 178 253 952012/Aug 89.7% 10.3% 5.1% 6.8 82 443 252 1232012/Sep 98.1% 1.9% 1.9% 5.7 69 135 722012/Oct 92.8% 7.3% 1.5% 4.5 91 267 992012/Nov 84.6% 15.4% 5.1% 6.1 121 213 281 1272012/Dec 90.9% 9.1% 4.6% 4.1 75 246 182 812013/Jan 93.9% 6.1% 4.1% 4.6 78 155 812013/Feb 93.8% 6.3% 6.3% 4.3 110 143 1112013/Mar 82.1% 17.9% 7.5% 5.0 121 316 1272013/Apr 93.8% 6.3% 0.0% 4.3 91 912013/May 86.8% 13.2% 13.2% 7.2 95 260 1342013/Jun 66.0% 34.0% 20.0% 5.7 183 299 193Jul '12 to Jun '13 Total 88.4% 11.6% 5.6% 5.3 102 260 242 111
Average Appearances to Disposition: Average of all appearances from the first to last court appearance.
Case: Refers to all charges on an Information for each single accused.
Information: The document that sets out the name(s) of the accused and all the charges against the accused.
Date
% of Cases Disposed (for cases without bench warrants)
Average Appearances to
Disposition (for cases
without bench warrants)
Average Days to Disposition (for cases without bench warrants)
Cases Disposed: Refers to Cases completed in the Ontario Court of Justice including those committed for trial in the Superior Court of Justice.
Average Days to Disposition: Average number of days from when the first court appearance was scheduled to the date of the final court appearance.
Disposition Rate StatisticsYouth Criminal Cases
Ontario Court of Justice
July 2011 to June 2013Thunder Bay

Toronto Overview, Page 49
% Disposed Under 8 Months
% Disposed Over 8 Months
% Disposed Over 12 Months
For Cases Disposed
Before Trial Date
For Cases Disposed at Trial Without
Trial
For Cases Disposed
Following a Trial
For All Cases
2011/Jul 83.5% 16.5% 5.0% 6.7 131 286 374 1462011/Aug 85.1% 14.9% 3.9% 5.7 123 267 382 1372011/Sep 80.7% 19.3% 6.4% 6.5 138 347 304 1522011/Oct 85.1% 14.9% 6.6% 6.6 124 323 294 1372011/Nov 85.0% 15.0% 7.2% 6.5 134 266 438 1512011/Dec 79.0% 21.0% 7.2% 7.1 142 404 472 1662012/Jan 81.1% 18.9% 7.0% 7.3 140 353 262 1612012/Feb 78.8% 21.2% 8.6% 7.8 139 452 371 1702012/Mar 83.7% 16.3% 5.8% 6.2 125 392 264 1442012/Apr 80.3% 19.7% 6.6% 6.7 138 412 334 1562012/May 84.4% 15.6% 6.2% 6.0 133 319 343 1462012/Jun 84.4% 15.6% 5.7% 6.8 130 325 427 142Jul '11 to Jun '12 Total 82.7% 17.3% 6.3% 6.6 133 344 352 1502012/Jul 80.5% 19.5% 6.5% 7.1 142 350 370 1572012/Aug 85.7% 14.3% 3.7% 6.2 120 325 288 1382012/Sep 79.7% 20.3% 6.6% 7.1 128 358 230 1552012/Oct 88.7% 11.3% 3.2% 6.1 123 268 244 1352012/Nov 80.7% 19.3% 5.8% 6.3 126 308 420 1522012/Dec 78.6% 21.4% 6.6% 7.0 130 325 357 1522013/Jan 83.4% 16.6% 5.0% 6.4 126 360 277 1462013/Feb 75.3% 24.8% 9.4% 7.5 146 354 424 1702013/Mar 83.4% 16.6% 5.1% 6.5 131 346 421 1482013/Apr 85.8% 14.2% 3.6% 6.3 132 296 343 1452013/May 81.9% 18.1% 7.1% 7.5 142 348 256 1582013/Jun 77.0% 23.0% 6.6% 8.1 153 268 298 165Jul '12 to Jun '13 Total 81.8% 18.2% 5.7% 6.8 133 325 333 151
Average Appearances to Disposition: Average of all appearances from the first to last court appearance.
Case: Refers to all charges on an Information for each single accused.
Information: The document that sets out the name(s) of the accused and all the charges against the accused.
Date
% of Cases Disposed (for cases without bench warrants)
Average Appearances to
Disposition (for cases
without bench warrants)
Average Days to Disposition (for cases without bench warrants)
Cases Disposed: Refers to Cases completed in the Ontario Court of Justice including those committed for trial in the Superior Court of Justice.
Average Days to Disposition: Average number of days from when the first court appearance was scheduled to the date of the final court appearance.
Disposition Rate StatisticsYouth Criminal Cases
Ontario Court of Justice
July 2011 to June 2013Toronto Overview

1000 Finch, Page 50
% Disposed Under 8 Months
% Disposed Over 8 Months
% Disposed Over 12 Months
For Cases Disposed
Before Trial Date
For Cases Disposed at Trial Without
Trial
For Cases Disposed
Following a Trial
For All Cases
2011/Jul 2011/Aug 2011/Sep 0.0% 100.0% 0.0% 2.0 315 3152011/Oct 2011/Nov 2011/Dec 2012/Jan 2012/Feb 2012/Mar 2012/Apr 2012/May 2012/Jun Jul '11 to Jun '12 Total 0.0% 100.0% 0.0% 2.0 315 3152012/Jul 2012/Aug 2012/Sep 2012/Oct 2012/Nov 2012/Dec 2013/Jan 2013/Feb 2013/Mar 2013/Apr 2013/May 2013/Jun 0.0% 0.0% 13.0 232 232Jul '12 to Jun '13 Total 0.0% 0.0% 13.0 232 232
Average Appearances to Disposition: Average of all appearances from the first to last court appearance.
Case: Refers to all charges on an Information for each single accused.
Information: The document that sets out the name(s) of the accused and all the charges against the accused.
Date
% of Cases Disposed (for cases without bench warrants)
Average Appearances to
Disposition (for cases
without bench warrants)
Average Days to Disposition (for cases without bench warrants)
Cases Disposed: Refers to Cases completed in the Ontario Court of Justice including those committed for trial in the Superior Court of Justice.
Average Days to Disposition: Average number of days from when the first court appearance was scheduled to the date of the final court appearance.
Disposition Rate StatisticsYouth Criminal Cases
Ontario Court of Justice
July 2011 to June 20131000 Finch

1911 Eglinton, Page 51
% Disposed Under 8 Months
% Disposed Over 8 Months
% Disposed Over 12 Months
For Cases Disposed
Before Trial Date
For Cases Disposed at Trial Without
Trial
For Cases Disposed
Following a Trial
For All Cases
2011/Jul 88.2% 11.8% 2.2% 6.2 136 212 1392011/Aug 84.6% 15.4% 1.7% 6.2 137 206 1392011/Sep 82.0% 18.0% 5.0% 7.2 140 373 285 1512011/Oct 93.9% 6.2% 0.0% 6.4 114 174 195 1172011/Nov 86.7% 13.3% 6.7% 7.3 143 226 364 1482011/Dec 74.5% 25.5% 7.5% 8.5 163 360 218 1762012/Jan 80.9% 19.1% 5.9% 7.7 136 461 1552012/Feb 88.4% 11.6% 3.5% 6.7 127 357 303 1442012/Mar 87.2% 12.8% 6.4% 6.3 127 382 1412012/Apr 78.9% 21.2% 4.8% 8.0 172 430 287 1812012/May 86.7% 13.3% 3.3% 6.4 140 340 364 1472012/Jun 82.1% 18.0% 2.6% 7.7 141 276 149Jul '11 to Jun '12 Total 84.2% 15.8% 4.2% 7.1 140 332 288 1502012/Jul 75.3% 24.7% 6.5% 8.7 166 300 348 1792012/Aug 83.7% 16.3% 1.2% 7.0 125 383 293 1392012/Sep 88.1% 11.9% 1.5% 9.1 141 348 1502012/Oct 90.7% 9.3% 3.1% 7.6 126 360 141 1402012/Nov 80.0% 20.0% 4.0% 7.8 129 273 1582012/Dec 82.9% 17.1% 6.6% 7.4 133 354 398 1582013/Jan 79.5% 20.5% 7.7% 8.5 136 424 300 1732013/Feb 71.7% 28.3% 13.0% 9.9 166 382 339 1962013/Mar 80.2% 19.8% 5.8% 8.2 141 411 228 1642013/Apr 92.0% 8.1% 0.0% 6.8 129 126 230 1302013/May 86.0% 14.0% 4.4% 8.7 136 299 1492013/Jun 80.3% 19.7% 6.8% 8.4 150 229 386 162Jul '12 to Jun '13 Total 82.6% 17.4% 5.1% 8.2 140 317 325 158
Average Appearances to Disposition: Average of all appearances from the first to last court appearance.
Case: Refers to all charges on an Information for each single accused.
Information: The document that sets out the name(s) of the accused and all the charges against the accused.
Date
% of Cases Disposed (for cases without bench warrants)
Average Appearances to
Disposition (for cases
without bench warrants)
Average Days to Disposition (for cases without bench warrants)
Cases Disposed: Refers to Cases completed in the Ontario Court of Justice including those committed for trial in the Superior Court of Justice.
Average Days to Disposition: Average number of days from when the first court appearance was scheduled to the date of the final court appearance.
Disposition Rate StatisticsYouth Criminal Cases
Ontario Court of Justice
July 2011 to June 20131911 Eglinton

2201 Finch, Page 52
% Disposed Under 8 Months
% Disposed Over 8 Months
% Disposed Over 12 Months
For Cases Disposed
Before Trial Date
For Cases Disposed at Trial Without
Trial
For Cases Disposed
Following a Trial
For All Cases
2011/Jul 80.0% 20.0% 5.0% 6.2 134 310 357 1482011/Aug 84.7% 15.3% 4.0% 5.4 127 330 425 1392011/Sep 76.7% 23.3% 10.9% 6.9 153 480 349 1752011/Oct 80.4% 19.6% 12.0% 8.1 139 479 1582011/Nov 84.9% 15.1% 7.6% 5.9 136 324 458 1562011/Dec 77.7% 22.3% 10.7% 7.1 142 555 472 1832012/Jan 71.7% 28.3% 13.1% 9.1 172 426 293 2032012/Feb 71.8% 28.2% 13.6% 7.9 149 401 459 1872012/Mar 87.4% 12.6% 4.6% 6.2 130 492 147 1382012/Apr 84.3% 15.7% 8.5% 5.5 115 452 516 1392012/May 80.0% 20.0% 11.7% 5.2 131 445 401 1542012/Jun 88.2% 11.8% 4.2% 5.8 129 280 676 141Jul '11 to Jun '12 Total 81.2% 18.8% 8.3% 6.5 136 418 377 1582012/Jul 76.4% 23.6% 10.6% 7.0 147 403 388 1742012/Aug 88.2% 11.8% 5.0% 6.0 120 375 140 1342012/Sep 66.7% 33.3% 15.3% 7.8 147 397 269 1952012/Oct 88.4% 11.6% 4.2% 5.6 142 193 1462012/Nov 79.7% 20.3% 9.4% 5.6 122 404 447 1592012/Dec 77.4% 22.6% 10.7% 7.3 123 379 358 1562013/Jan 81.6% 18.4% 6.6% 5.6 130 431 276 1462013/Feb 78.8% 21.2% 9.1% 7.0 151 367 642 1722013/Mar 84.0% 16.0% 5.3% 4.9 129 226 725 1402013/Apr 81.0% 19.0% 6.3% 5.6 144 428 351 1572013/May 74.7% 25.3% 7.7% 7.0 156 383 328 1762013/Jun 76.0% 24.0% 6.3% 7.9 156 295 289 167Jul '12 to Jun '13 Total 79.6% 20.4% 8.1% 6.5 138 368 372 160
Average Appearances to Disposition: Average of all appearances from the first to last court appearance.
Case: Refers to all charges on an Information for each single accused.
Information: The document that sets out the name(s) of the accused and all the charges against the accused.
Date
% of Cases Disposed (for cases without bench warrants)
Average Appearances to
Disposition (for cases
without bench warrants)
Average Days to Disposition (for cases without bench warrants)
Cases Disposed: Refers to Cases completed in the Ontario Court of Justice including those committed for trial in the Superior Court of Justice.
Average Days to Disposition: Average number of days from when the first court appearance was scheduled to the date of the final court appearance.
Disposition Rate StatisticsYouth Criminal Cases
Ontario Court of Justice
July 2011 to June 20132201 Finch
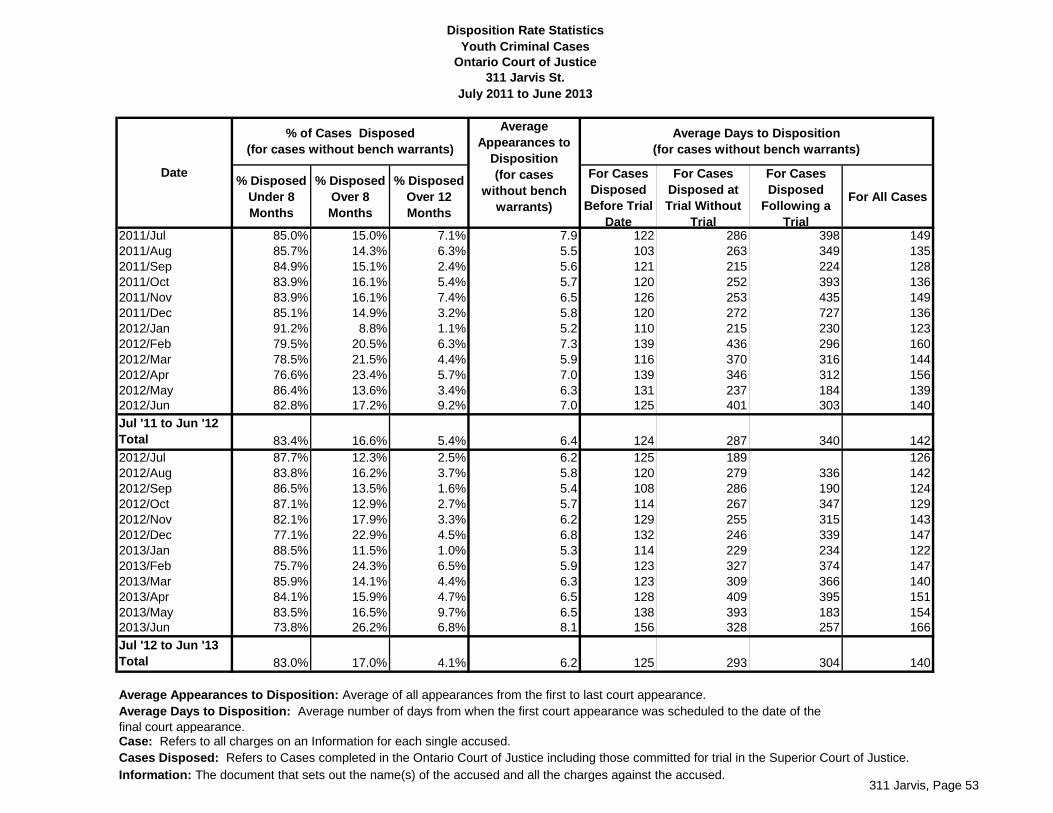
311 Jarvis, Page 53
% Disposed Under 8 Months
% Disposed Over 8 Months
% Disposed Over 12 Months
For Cases Disposed
Before Trial Date
For Cases Disposed at Trial Without
Trial
For Cases Disposed
Following a Trial
For All Cases
2011/Jul 85.0% 15.0% 7.1% 7.9 122 286 398 1492011/Aug 85.7% 14.3% 6.3% 5.5 103 263 349 1352011/Sep 84.9% 15.1% 2.4% 5.6 121 215 224 1282011/Oct 83.9% 16.1% 5.4% 5.7 120 252 393 1362011/Nov 83.9% 16.1% 7.4% 6.5 126 253 435 1492011/Dec 85.1% 14.9% 3.2% 5.8 120 272 727 1362012/Jan 91.2% 8.8% 1.1% 5.2 110 215 230 1232012/Feb 79.5% 20.5% 6.3% 7.3 139 436 296 1602012/Mar 78.5% 21.5% 4.4% 5.9 116 370 316 1442012/Apr 76.6% 23.4% 5.7% 7.0 139 346 312 1562012/May 86.4% 13.6% 3.4% 6.3 131 237 184 1392012/Jun 82.8% 17.2% 9.2% 7.0 125 401 303 140Jul '11 to Jun '12 Total 83.4% 16.6% 5.4% 6.4 124 287 340 1422012/Jul 87.7% 12.3% 2.5% 6.2 125 189 1262012/Aug 83.8% 16.2% 3.7% 5.8 120 279 336 1422012/Sep 86.5% 13.5% 1.6% 5.4 108 286 190 1242012/Oct 87.1% 12.9% 2.7% 5.7 114 267 347 1292012/Nov 82.1% 17.9% 3.3% 6.2 129 255 315 1432012/Dec 77.1% 22.9% 4.5% 6.8 132 246 339 1472013/Jan 88.5% 11.5% 1.0% 5.3 114 229 234 1222013/Feb 75.7% 24.3% 6.5% 5.9 123 327 374 1472013/Mar 85.9% 14.1% 4.4% 6.3 123 309 366 1402013/Apr 84.1% 15.9% 4.7% 6.5 128 409 395 1512013/May 83.5% 16.5% 9.7% 6.5 138 393 183 1542013/Jun 73.8% 26.2% 6.8% 8.1 156 328 257 166Jul '12 to Jun '13 Total 83.0% 17.0% 4.1% 6.2 125 293 304 140
Average Appearances to Disposition: Average of all appearances from the first to last court appearance.
Case: Refers to all charges on an Information for each single accused.
Information: The document that sets out the name(s) of the accused and all the charges against the accused.
Date
% of Cases Disposed (for cases without bench warrants)
Average Appearances to
Disposition (for cases
without bench warrants)
Average Days to Disposition (for cases without bench warrants)
Cases Disposed: Refers to Cases completed in the Ontario Court of Justice including those committed for trial in the Superior Court of Justice.
Average Days to Disposition: Average number of days from when the first court appearance was scheduled to the date of the final court appearance.
Disposition Rate StatisticsYouth Criminal Cases
Ontario Court of Justice
July 2011 to June 2013311 Jarvis St.

College Park, Page 54
% Disposed Under 8 Months
% Disposed Over 8 Months
% Disposed Over 12 Months
For Cases Disposed
Before Trial Date
For Cases Disposed at Trial Without
Trial
For Cases Disposed
Following a Trial
For All Cases
2011/Jul 2011/Aug 2011/Sep 2011/Oct 0.0% 100.0% 100.0% 15.0 413 4132011/Nov 0.0% 0.0% 5.0 78 782011/Dec 2012/Jan 2012/Feb 2012/Mar 50.0% 50.0% 50.0% 6.5 219 374 2972012/Apr 2012/May 2012/Jun Jul '11 to Jun '12 Total 50.0% 50.0% 50.0% 8.3 237 374 2712012/Jul 2012/Aug 2012/Sep 2012/Oct 0.0% 0.0% 1.0 0 02012/Nov 2012/Dec 2013/Jan 0.0% 100.0% 100.0% 10.0 438 4382013/Feb 2013/Mar 2013/Apr 0.0% 0.0% 1.0 0 02013/May 2013/Jun Jul '12 to Jun '13 Total 66.7% 33.3% 33.3% 4.0 146 146
Average Appearances to Disposition: Average of all appearances from the first to last court appearance.
Case: Refers to all charges on an Information for each single accused.
Information: The document that sets out the name(s) of the accused and all the charges against the accused.
Date
% of Cases Disposed (for cases without bench warrants)
Average Appearances to
Disposition (for cases
without bench warrants)
Average Days to Disposition (for cases without bench warrants)
Cases Disposed: Refers to Cases completed in the Ontario Court of Justice including those committed for trial in the Superior Court of Justice.
Average Days to Disposition: Average number of days from when the first court appearance was scheduled to the date of the final court appearance.
Disposition Rate StatisticsYouth Criminal Cases
Ontario Court of Justice
July 2011 to June 2013College Park

Old City Hall, Page 55
% Disposed Under 8 Months
% Disposed Over 8 Months
% Disposed Over 12 Months
For Cases Disposed
Before Trial Date
For Cases Disposed at Trial Without
Trial
For Cases Disposed
Following a Trial
For All Cases
2011/Jul 2011/Aug 0.0% 0.0% 1.0 12 122011/Sep 50.0% 50.0% 50.0% 6.5 0 388 1942011/Oct 0.0% 0.0% 1.0 0 02011/Nov 2011/Dec 2012/Jan 0.0% 0.0% 1.0 0 02012/Feb 0.0% 100.0% 100.0% 69.5 1,019 1,0192012/Mar 0.0% 100.0% 100.0% 19.5 519 5192012/Apr 2012/May 0.0% 0.0% 3.0 113 1132012/Jun 0.0% 0.0% 1.0 0 0Jul '11 to Jun '12 Total 68.8% 31.3% 31.3% 12.7 12 809 519 2252012/Jul 0.0% 0.0% 1.0 0 02012/Aug 0.0% 0.0% 1.0 0 02012/Sep 0.0% 0.0% 1.0 0 02012/Oct 0.0% 0.0% 1.5 14 142012/Nov 0.0% 0.0% 1.0 0 02012/Dec 0.0% 0.0% 1.0 0 02013/Jan 2013/Feb 0.0% 100.0% 0.0% 11.0 265 2652013/Mar 2013/Apr 0.0% 0.0% 1.0 0 02013/May 0.0% 0.0% 1.0 0 02013/Jun 0.0% 0.0% 1.0 13 13Jul '12 to Jun '13 Total 92.3% 7.7% 0.0% 1.9 6 265 26
Average Appearances to Disposition: Average of all appearances from the first to last court appearance.
Case: Refers to all charges on an Information for each single accused.
Information: The document that sets out the name(s) of the accused and all the charges against the accused.
Date
% of Cases Disposed (for cases without bench warrants)
Average Appearances to
Disposition (for cases
without bench warrants)
Average Days to Disposition (for cases without bench warrants)
Cases Disposed: Refers to Cases completed in the Ontario Court of Justice including those committed for trial in the Superior Court of Justice.
Average Days to Disposition: Average number of days from when the first court appearance was scheduled to the date of the final court appearance.
Disposition Rate StatisticsYouth Criminal Cases
Ontario Court of Justice
July 2011 to June 2013Old City Hall

West Overview, Page 56
% Disposed Under 8 Months
% Disposed Over 8 Months
% Disposed Over 12 Months
For Cases Disposed
Before Trial Date
For Cases Disposed at Trial Without
Trial
For Cases Disposed
Following a Trial
For All Cases
2011/Jul 92.4% 7.6% 2.6% 5.0 70 271 381 872011/Aug 93.4% 6.6% 2.0% 5.2 76 265 279 882011/Sep 92.6% 7.4% 3.2% 5.0 83 352 455 972011/Oct 93.6% 6.4% 2.2% 5.3 82 326 308 912011/Nov 92.6% 7.4% 2.9% 5.3 88 302 233 982011/Dec 92.6% 7.4% 2.5% 5.1 79 214 322 902012/Jan 91.7% 8.3% 2.2% 5.6 83 244 258 1002012/Feb 91.1% 8.9% 3.3% 5.6 88 323 217 992012/Mar 90.3% 9.7% 2.0% 5.8 88 268 378 1032012/Apr 92.2% 7.8% 2.1% 5.4 79 301 405 932012/May 93.9% 6.1% 1.8% 5.5 85 265 234 962012/Jun 93.4% 6.7% 2.4% 6.0 87 366 325 97Jul '11 to Jun '12 Total 92.5% 7.5% 2.4% 5.4 82 284 313 952012/Jul 93.4% 6.6% 1.6% 5.2 79 234 459 902012/Aug 95.8% 4.2% 1.1% 5.1 76 249 263 842012/Sep 93.8% 6.2% 2.3% 5.2 81 276 400 932012/Oct 88.6% 11.4% 6.1% 5.7 96 320 257 1092012/Nov 90.6% 9.4% 2.4% 5.6 89 229 446 982012/Dec 93.6% 6.4% 2.0% 5.3 85 303 231 942013/Jan 91.5% 8.5% 2.0% 5.6 90 269 340 1012013/Feb 93.0% 7.0% 0.3% 5.6 91 335 284 972013/Mar 90.7% 9.3% 2.1% 5.7 99 281 334 1102013/Apr 95.3% 4.7% 1.8% 5.4 86 252 96 972013/May 89.4% 10.6% 4.6% 6.4 111 236 577 1212013/Jun 90.8% 9.2% 2.8% 5.9 84 289 280 105Jul '12 to Jun '13 Total 92.2% 7.8% 2.4% 5.5 89 268 321 100
Average Appearances to Disposition: Average of all appearances from the first to last court appearance.
Case: Refers to all charges on an Information for each single accused.
Information: The document that sets out the name(s) of the accused and all the charges against the accused.
Date
% of Cases Disposed (for cases without bench warrants)
Average Appearances to
Disposition (for cases
without bench warrants)
Average Days to Disposition (for cases without bench warrants)
Cases Disposed: Refers to Cases completed in the Ontario Court of Justice including those committed for trial in the Superior Court of Justice.
Average Days to Disposition: Average number of days from when the first court appearance was scheduled to the date of the final court appearance.
Disposition Rate StatisticsYouth Criminal Cases
Ontario Court of Justice
July 2011 to June 2013West Overview

Chatham, Page 57
% Disposed Under 8 Months
% Disposed Over 8 Months
% Disposed Over 12 Months
For Cases Disposed
Before Trial Date
For Cases Disposed at Trial Without
Trial
For Cases Disposed
Following a Trial
For All Cases
2011/Jul 85.7% 14.3% 4.8% 5.0 62 305 852011/Aug 87.0% 13.0% 8.7% 3.9 62 518 550 1032011/Sep 93.1% 6.9% 3.5% 3.6 44 384 562011/Oct 91.3% 8.7% 0.0% 6.0 102 140 1042011/Nov 64.7% 35.3% 23.5% 6.5 149 396 1642011/Dec 85.7% 14.3% 0.0% 4.7 97 255 1122012/Jan 90.5% 9.5% 0.0% 5.2 98 244 1052012/Feb 94.1% 5.9% 5.9% 4.6 86 171 237 1002012/Mar 92.3% 7.7% 0.0% 4.5 57 250 722012/Apr 79.0% 21.1% 5.3% 5.8 80 370 300 1372012/May 94.1% 5.9% 5.9% 6.6 116 1162012/Jun 95.5% 4.6% 0.0% 4.7 61 61Jul '11 to Jun '12 Total 88.1% 11.9% 4.5% 5.0 82 353 289 992012/Jul 92.3% 7.7% 0.0% 4.5 56 339 782012/Aug 91.7% 8.3% 8.3% 5.0 76 390 1022012/Sep 90.0% 10.0% 10.0% 5.9 121 1212012/Oct 96.2% 3.9% 0.0% 4.5 76 762012/Nov 95.8% 4.2% 0.0% 5.3 52 146 602012/Dec 93.8% 6.3% 0.0% 3.8 60 602013/Jan 95.0% 5.0% 0.0% 3.7 47 221 266 672013/Feb 0.0% 0.0% 4.8 70 702013/Mar 92.3% 7.7% 7.7% 5.3 112 1122013/Apr 92.9% 7.1% 0.0% 4.4 70 294 862013/May 87.0% 13.0% 0.0% 5.7 102 131 1032013/Jun 0.0% 0.0% 3.9 60 60Jul '12 to Jun '13 Total 94.5% 5.5% 1.3% 4.7 72 251 266 79
Average Appearances to Disposition: Average of all appearances from the first to last court appearance.
Case: Refers to all charges on an Information for each single accused.
Information: The document that sets out the name(s) of the accused and all the charges against the accused.
Date
% of Cases Disposed (for cases without bench warrants)
Average Appearances to
Disposition (for cases
without bench warrants)
Average Days to Disposition (for cases without bench warrants)
Cases Disposed: Refers to Cases completed in the Ontario Court of Justice including those committed for trial in the Superior Court of Justice.
Average Days to Disposition: Average number of days from when the first court appearance was scheduled to the date of the final court appearance.
Disposition Rate StatisticsYouth Criminal Cases
Ontario Court of Justice
July 2011 to June 2013Chatham

Goderich, Page 58
% Disposed Under 8 Months
% Disposed Over 8 Months
% Disposed Over 12 Months
For Cases Disposed
Before Trial Date
For Cases Disposed at Trial Without
Trial
For Cases Disposed
Following a Trial
For All Cases
2011/Jul 95.5% 4.6% 0.0% 4.4 90 189 1032011/Aug 92.3% 7.7% 7.7% 3.7 43 352 912011/Sep 0.0% 0.0% 6.0 125 1252011/Oct 0.0% 0.0% 4.2 88 882011/Nov 0.0% 0.0% 3.3 84 842011/Dec 85.7% 14.3% 0.0% 3.1 99 992012/Jan 0.0% 0.0% 3.4 61 230 992012/Feb 0.0% 0.0% 3.3 86 862012/Mar 0.0% 0.0% 1.0 36 362012/Apr 0.0% 0.0% 7.0 175 1752012/May 0.0% 0.0% 3.6 105 1052012/Jun 0.0% 0.0% 3.2 32 32Jul '11 to Jun '12 Total 96.9% 3.1% 1.0% 3.8 77 247 892012/Jul 94.4% 5.6% 5.6% 5.9 82 412 1012012/Aug 0.0% 0.0% 3.0 70 702012/Sep 84.2% 15.8% 0.0% 3.9 99 317 1222012/Oct 92.3% 7.7% 7.7% 5.9 45 559 852012/Nov 88.9% 11.1% 0.0% 5.6 114 205 1242012/Dec 0.0% 0.0% 1.8 99 992013/Jan 0.0% 0.0% 3.2 99 113 1002013/Feb 92.3% 7.7% 0.0% 3.9 87 872013/Mar 86.7% 13.3% 0.0% 5.4 90 247 1222013/Apr 0.0% 0.0% 8.8 166 166 1662013/May 0.0% 0.0% 3.7 76 219 882013/Jun 83.3% 16.7% 0.0% 3.5 69 261 101Jul '12 to Jun '13 Total 92.8% 7.3% 1.5% 4.8 89 229 412 109
Average Appearances to Disposition: Average of all appearances from the first to last court appearance.
Case: Refers to all charges on an Information for each single accused.
Information: The document that sets out the name(s) of the accused and all the charges against the accused.
Date
% of Cases Disposed (for cases without bench warrants)
Average Appearances to
Disposition (for cases
without bench warrants)
Average Days to Disposition (for cases without bench warrants)
Cases Disposed: Refers to Cases completed in the Ontario Court of Justice including those committed for trial in the Superior Court of Justice.
Average Days to Disposition: Average number of days from when the first court appearance was scheduled to the date of the final court appearance.
Disposition Rate StatisticsYouth Criminal Cases
Ontario Court of Justice
July 2011 to June 2013Goderich

Guelph, Page 59
% Disposed Under 8 Months
% Disposed Over 8 Months
% Disposed Over 12 Months
For Cases Disposed
Before Trial Date
For Cases Disposed at Trial Without
Trial
For Cases Disposed
Following a Trial
For All Cases
2011/Jul 87.5% 12.5% 4.2% 6.2 56 240 423 1022011/Aug 89.6% 10.4% 6.3% 4.8 71 243 407 892011/Sep 82.6% 17.4% 4.4% 6.2 102 349 1242011/Oct 91.1% 8.9% 2.2% 5.0 69 273 732011/Nov 96.2% 3.9% 3.9% 3.0 49 184 363 662011/Dec 87.0% 13.0% 0.0% 5.0 107 135 1112012/Jan 92.1% 7.9% 2.6% 4.8 69 227 122 822012/Feb 97.5% 2.5% 2.5% 4.7 85 138 862012/Mar 88.9% 11.1% 7.4% 6.0 91 400 1142012/Apr 0.0% 0.0% 6.8 74 105 762012/May 93.2% 6.8% 2.3% 5.3 77 358 892012/Jun 89.1% 10.9% 0.0% 7.0 85 338 101Jul '11 to Jun '12 Total 91.2% 8.8% 3.0% 5.4 76 251 285 922012/Jul 95.7% 4.3% 1.4% 4.5 75 131 772012/Aug 0.0% 0.0% 3.3 45 452012/Sep 96.2% 3.9% 3.9% 3.2 41 391 552012/Oct 97.1% 2.9% 2.9% 5.7 63 487 149 812012/Nov 85.2% 14.8% 3.7% 5.6 87 872012/Dec 0.0% 0.0% 5.9 94 942013/Jan 90.2% 9.8% 0.0% 6.4 101 244 1042013/Feb 85.0% 15.0% 0.0% 7.5 122 160 1242013/Mar 0.0% 0.0% 4.4 90 902013/Apr 92.6% 7.4% 0.0% 4.3 78 207 832013/May 0.0% 0.0% 5.7 107 1072013/Jun 97.4% 2.6% 0.0% 5.7 74 74Jul '12 to Jun '13 Total 94.8% 5.2% 1.1% 5.2 81 251 181 84
Average Appearances to Disposition: Average of all appearances from the first to last court appearance.
Case: Refers to all charges on an Information for each single accused.
Information: The document that sets out the name(s) of the accused and all the charges against the accused.
Date
% of Cases Disposed (for cases without bench warrants)
Average Appearances to
Disposition (for cases
without bench warrants)
Average Days to Disposition (for cases without bench warrants)
Cases Disposed: Refers to Cases completed in the Ontario Court of Justice including those committed for trial in the Superior Court of Justice.
Average Days to Disposition: Average number of days from when the first court appearance was scheduled to the date of the final court appearance.
Disposition Rate StatisticsYouth Criminal Cases
Ontario Court of Justice
July 2011 to June 2013Guelph

Kitchener, Page 60
% Disposed Under 8 Months
% Disposed Over 8 Months
% Disposed Over 12 Months
For Cases Disposed
Before Trial Date
For Cases Disposed at Trial Without
Trial
For Cases Disposed
Following a Trial
For All Cases
2011/Jul 98.9% 1.1% 0.0% 3.5 59 592011/Aug 97.9% 2.2% 1.1% 5.3 69 120 189 732011/Sep 95.9% 4.1% 2.1% 4.1 91 427 942011/Oct 93.3% 6.7% 1.0% 5.0 96 276 1012011/Nov 95.5% 4.5% 0.0% 5.0 76 239 812011/Dec 97.1% 2.9% 1.0% 5.0 61 225 496 722012/Jan 94.8% 5.2% 1.3% 5.1 77 172 782012/Feb 94.9% 5.2% 1.0% 4.9 74 277 782012/Mar 95.6% 4.4% 1.1% 6.1 86 332 199 942012/Apr 96.1% 3.9% 2.0% 5.4 75 312 611 872012/May 94.6% 5.4% 1.1% 6.0 84 208 241 912012/Jun 97.0% 3.0% 1.0% 6.0 85 85Jul '11 to Jun '12 Total 96.0% 4.1% 1.1% 5.1 78 242 331 832012/Jul 95.4% 4.7% 0.0% 4.9 84 281 892012/Aug 97.9% 2.1% 0.0% 5.0 85 852012/Sep 97.1% 2.9% 1.4% 5.2 82 339 504 912012/Oct 86.1% 13.9% 1.4% 4.4 93 307 962012/Nov 92.9% 7.1% 1.2% 5.6 94 208 167 992012/Dec 91.4% 8.6% 3.5% 5.2 79 256 183 932013/Jan 87.5% 12.5% 2.3% 5.0 101 274 427 1112013/Feb 96.1% 3.9% 0.0% 4.9 83 323 882013/Mar 94.0% 6.0% 0.0% 5.4 98 251 1002013/Apr 93.7% 6.3% 2.1% 6.4 90 352 1012013/May 95.2% 4.8% 0.0% 5.7 89 189 248 932013/Jun 95.5% 4.5% 0.0% 5.7 92 196 342 105Jul '12 to Jun '13 Total 93.5% 6.5% 1.0% 5.3 90 258 283 96
Average Appearances to Disposition: Average of all appearances from the first to last court appearance.
Case: Refers to all charges on an Information for each single accused.
Information: The document that sets out the name(s) of the accused and all the charges against the accused.
Date
% of Cases Disposed (for cases without bench warrants)
Average Appearances to
Disposition (for cases
without bench warrants)
Average Days to Disposition (for cases without bench warrants)
Cases Disposed: Refers to Cases completed in the Ontario Court of Justice including those committed for trial in the Superior Court of Justice.
Average Days to Disposition: Average number of days from when the first court appearance was scheduled to the date of the final court appearance.
Disposition Rate StatisticsYouth Criminal Cases
Ontario Court of Justice
July 2011 to June 2013Kitchener

London, Page 61
% Disposed Under 8 Months
% Disposed Over 8 Months
% Disposed Over 12 Months
For Cases Disposed
Before Trial Date
For Cases Disposed at Trial Without
Trial
For Cases Disposed
Following a Trial
For All Cases
2011/Jul 86.8% 13.3% 3.6% 7.2 96 337 438 1162011/Aug 88.7% 11.3% 0.0% 6.6 100 118 259 1052011/Sep 80.9% 19.2% 8.5% 6.0 70 388 499 1292011/Oct 92.1% 7.9% 4.0% 6.0 79 536 651 942011/Nov 91.9% 8.1% 4.7% 6.9 103 272 168 1142011/Dec 88.9% 11.1% 6.9% 6.0 85 304 281 972012/Jan 88.0% 12.1% 3.6% 6.4 82 339 321 1152012/Feb 80.0% 20.0% 2.9% 7.2 110 351 1312012/Mar 90.3% 9.7% 1.4% 5.4 87 276 952012/Apr 91.6% 8.4% 1.1% 5.6 73 292 285 872012/May 94.3% 5.7% 0.0% 4.9 94 246 972012/Jun 92.0% 8.0% 3.6% 7.3 99 377 180 112Jul '11 to Jun '12 Total 89.3% 10.8% 3.2% 6.4 90 330 334 1062012/Jul 94.1% 5.9% 2.0% 6.5 82 234 539 1022012/Aug 98.7% 1.3% 1.3% 5.4 79 199 842012/Sep 91.8% 8.2% 6.1% 7.0 82 286 521 1212012/Oct 89.8% 10.2% 5.7% 6.5 110 222 145 1162012/Nov 94.6% 5.4% 0.0% 7.3 93 311 972012/Dec 97.4% 2.6% 0.0% 5.4 95 952013/Jan 97.9% 2.1% 0.0% 6.4 88 198 892013/Feb 83.3% 16.7% 1.9% 6.9 112 473 1262013/Mar 81.4% 18.6% 7.0% 6.8 109 370 224 1292013/Apr 97.3% 2.7% 1.4% 4.8 101 273 94 1052013/May 97.1% 2.9% 1.5% 5.8 89 64 892013/Jun 87.5% 12.5% 6.3% 8.3 92 451 253 153Jul '12 to Jun '13 Total 93.6% 6.4% 2.3% 6.3 94 294 268 105
Average Appearances to Disposition: Average of all appearances from the first to last court appearance.
Case: Refers to all charges on an Information for each single accused.
Information: The document that sets out the name(s) of the accused and all the charges against the accused.
Date
% of Cases Disposed (for cases without bench warrants)
Average Appearances to
Disposition (for cases
without bench warrants)
Average Days to Disposition (for cases without bench warrants)
Cases Disposed: Refers to Cases completed in the Ontario Court of Justice including those committed for trial in the Superior Court of Justice.
Average Days to Disposition: Average number of days from when the first court appearance was scheduled to the date of the final court appearance.
Disposition Rate StatisticsYouth Criminal Cases
Ontario Court of Justice
July 2011 to June 2013London

Owen Sound, Page 62
% Disposed Under 8 Months
% Disposed Over 8 Months
% Disposed Over 12 Months
For Cases Disposed
Before Trial Date
For Cases Disposed at Trial Without
Trial
For Cases Disposed
Following a Trial
For All Cases
2011/Jul 0.0% 0.0% 4.2 69 692011/Aug 0.0% 0.0% 2.9 62 126 652011/Sep 97.8% 2.2% 2.2% 4.8 75 53 539 852011/Oct 0.0% 0.0% 4.3 69 182 812011/Nov 90.0% 10.0% 0.0% 4.9 110 259 1172011/Dec 81.8% 18.2% 0.0% 3.4 86 197 962012/Jan 0.0% 0.0% 4.0 113 1132012/Feb 0.0% 0.0% 3.5 87 872012/Mar 76.9% 23.1% 0.0% 4.5 119 272 1302012/Apr 77.8% 22.2% 0.0% 4.1 101 1012012/May 0.0% 0.0% 3.3 100 1002012/Jun 0.0% 0.0% 3.6 60 60Jul '11 to Jun '12 Total 95.5% 4.5% 0.5% 4.1 84 174 312 892012/Jul 94.1% 5.9% 5.9% 3.3 70 363 872012/Aug 76.9% 23.1% 15.4% 4.5 97 422 422 1472012/Sep 0.0% 0.0% 2.6 17 172012/Oct 0.0% 0.0% 2.7 59 592012/Nov 87.5% 12.5% 4.2% 3.3 91 311 1002012/Dec 0.0% 0.0% 2.4 73 732013/Jan 0.0% 0.0% 3.7 84 842013/Feb 0.0% 0.0% 3.9 63 632013/Mar 0.0% 0.0% 5.3 91 912013/Apr 0.0% 0.0% 4.1 52 206 612013/May 60.0% 40.0% 20.0% 5.0 190 1902013/Jun 0.0% 0.0% 5.3 71 71Jul '12 to Jun '13 Total 94.9% 5.1% 2.8% 3.8 73 326 422 81
Average Appearances to Disposition: Average of all appearances from the first to last court appearance.
Case: Refers to all charges on an Information for each single accused.
Information: The document that sets out the name(s) of the accused and all the charges against the accused.
Date
% of Cases Disposed (for cases without bench warrants)
Average Appearances to
Disposition (for cases
without bench warrants)
Average Days to Disposition (for cases without bench warrants)
Cases Disposed: Refers to Cases completed in the Ontario Court of Justice including those committed for trial in the Superior Court of Justice.
Average Days to Disposition: Average number of days from when the first court appearance was scheduled to the date of the final court appearance.
Disposition Rate StatisticsYouth Criminal Cases
Ontario Court of Justice
July 2011 to June 2013Owen Sound

Sarnia, Page 63
% Disposed Under 8 Months
% Disposed Over 8 Months
% Disposed Over 12 Months
For Cases Disposed
Before Trial Date
For Cases Disposed at Trial Without
Trial
For Cases Disposed
Following a Trial
For All Cases
2011/Jul 93.3% 6.7% 0.0% 4.6 59 209 310 722011/Aug 0.0% 0.0% 5.7 63 110 642011/Sep 0.0% 0.0% 6.0 73 732011/Oct 0.0% 0.0% 5.4 60 602011/Nov 89.5% 10.5% 2.6% 5.3 85 210 952011/Dec 91.7% 8.3% 2.8% 6.5 96 125 406 1062012/Jan 85.3% 14.7% 2.9% 6.0 93 174 294 1172012/Feb 0.0% 0.0% 6.2 68 179 722012/Mar 93.8% 6.3% 0.0% 5.1 61 211 842012/Apr 82.6% 17.4% 13.0% 5.8 100 292 343 1402012/May 91.3% 8.7% 0.0% 5.9 68 220 328 1042012/Jun 91.7% 8.3% 8.3% 6.0 96 336 116Jul '11 to Jun '12 Total 93.9% 6.1% 2.0% 5.7 76 196 320 892012/Jul 94.3% 5.7% 0.0% 5.4 67 240 822012/Aug 92.1% 7.9% 0.0% 7.4 83 237 922012/Sep 0.0% 0.0% 4.6 58 166 237 792012/Oct 95.4% 4.7% 0.0% 5.4 69 119 259 792012/Nov 0.0% 0.0% 5.5 64 642012/Dec 95.8% 4.2% 4.2% 7.1 64 471 812013/Jan 92.6% 7.4% 3.7% 5.7 58 294 623 882013/Feb 92.6% 7.4% 0.0% 6.1 78 247 324 932013/Mar 83.3% 16.7% 0.0% 5.9 108 300 147 1322013/Apr 89.5% 10.5% 5.3% 4.8 74 372 1052013/May 93.3% 6.7% 2.2% 4.7 49 275 338 762013/Jun 95.5% 4.6% 0.0% 4.7 44 233 61Jul '12 to Jun '13 Total 93.7% 6.3% 1.1% 5.8 68 263 312 85
Average Appearances to Disposition: Average of all appearances from the first to last court appearance.
Case: Refers to all charges on an Information for each single accused.
Information: The document that sets out the name(s) of the accused and all the charges against the accused.
Date
% of Cases Disposed (for cases without bench warrants)
Average Appearances to
Disposition (for cases
without bench warrants)
Average Days to Disposition (for cases without bench warrants)
Cases Disposed: Refers to Cases completed in the Ontario Court of Justice including those committed for trial in the Superior Court of Justice.
Average Days to Disposition: Average number of days from when the first court appearance was scheduled to the date of the final court appearance.
Disposition Rate StatisticsYouth Criminal Cases
Ontario Court of Justice
July 2011 to June 2013Sarnia

St. Thomas, Page 64
% Disposed Under 8 Months
% Disposed Over 8 Months
% Disposed Over 12 Months
For Cases Disposed
Before Trial Date
For Cases Disposed at Trial Without
Trial
For Cases Disposed
Following a Trial
For All Cases
2011/Jul 0.0% 0.0% 3.5 6 62011/Aug 90.9% 9.1% 9.1% 4.6 78 725 1372011/Sep 83.3% 16.7% 0.0% 7.7 118 1182011/Oct 0.0% 0.0% 5.7 59 220 862011/Nov 95.5% 4.6% 0.0% 3.5 70 702011/Dec 0.0% 0.0% 7.6 76 222 972012/Jan 0.0% 0.0% 6.0 108 1082012/Feb 0.0% 0.0% 5.0 105 1052012/Mar 75.0% 25.0% 0.0% 6.0 43 350 1202012/Apr 91.7% 8.3% 0.0% 4.1 74 301 832012/May 0.0% 0.0% 3.4 25 240 382012/Jun 0.0% 0.0% 3.6 89 89Jul '11 to Jun '12 Total 95.0% 5.0% 1.4% 4.7 73 493 258 902012/Jul 0.0% 0.0% 7.0 86 862012/Aug 87.5% 12.5% 0.0% 5.6 74 309 1032012/Sep 0.0% 0.0% 3.3 41 412012/Oct 63.6% 36.4% 31.8% 9.0 273 140 2672012/Nov 0.0% 0.0% 4.4 66 662012/Dec 80.0% 20.0% 0.0% 5.7 114 1142013/Jan 0.0% 0.0% 3.2 99 992013/Feb 91.7% 8.3% 0.0% 5.4 143 1432013/Mar 75.0% 25.0% 0.0% 4.9 129 259 1392013/Apr 0.0% 0.0% 7.0 115 1152013/May 91.7% 8.3% 0.0% 5.9 102 1022013/Jun 77.8% 22.2% 22.2% 7.3 93 455 447 173Jul '12 to Jun '13 Total 85.7% 14.3% 7.1% 6.1 129 285 378 136
Average Appearances to Disposition: Average of all appearances from the first to last court appearance.
Case: Refers to all charges on an Information for each single accused.
Information: The document that sets out the name(s) of the accused and all the charges against the accused.
Date
% of Cases Disposed (for cases without bench warrants)
Average Appearances to
Disposition (for cases
without bench warrants)
Average Days to Disposition (for cases without bench warrants)
Cases Disposed: Refers to Cases completed in the Ontario Court of Justice including those committed for trial in the Superior Court of Justice.
Average Days to Disposition: Average number of days from when the first court appearance was scheduled to the date of the final court appearance.
Disposition Rate StatisticsYouth Criminal Cases
Ontario Court of Justice
July 2011 to June 2013St.Thomas

Stratford, Page 65
% Disposed Under 8 Months
% Disposed Over 8 Months
% Disposed Over 12 Months
For Cases Disposed
Before Trial Date
For Cases Disposed at Trial Without
Trial
For Cases Disposed
Following a Trial
For All Cases
2011/Jul 0.0% 0.0% 2.3 45 452011/Aug 0.0% 0.0% 8.0 136 201 1692011/Sep 0.0% 0.0% 1.8 32 322011/Oct 0.0% 0.0% 1.3 8 82011/Nov 0.0% 0.0% 4.8 50 502011/Dec 0.0% 0.0% 1.8 23 232012/Jan 83.3% 16.7% 0.0% 2.5 32 253 692012/Feb 0.0% 0.0% 1.4 15 152012/Mar 0.0% 0.0% 1.7 26 262012/Apr 0.0% 0.0% 2.0 45 452012/May 0.0% 0.0% 2.1 34 342012/Jun 0.0% 0.0% 2.8 41 41Jul '11 to Jun '12 Total 99.1% 0.9% 0.0% 2.6 36 227 392012/Jul 0.0% 0.0% 2.0 38 382012/Aug 0.0% 0.0% 2.5 12 196 179 1002012/Sep 0.0% 0.0% 4.9 93 216 1072012/Oct 0.0% 0.0% 2.3 30 302012/Nov 0.0% 0.0% 2.0 26 262012/Dec 87.5% 12.5% 0.0% 1.5 55 552013/Jan 87.5% 12.5% 0.0% 3.8 63 632013/Feb 0.0% 0.0% 2.9 25 252013/Mar 0.0% 0.0% 2.6 32 322013/Apr 0.0% 0.0% 3.0 25 34 262013/May 0.0% 0.0% 3.9 50 502013/Jun 0.0% 0.0% 3.0 31 99 37Jul '12 to Jun '13 Total 98.2% 1.8% 0.0% 3.0 41 196 132 45
Average Appearances to Disposition: Average of all appearances from the first to last court appearance.
Case: Refers to all charges on an Information for each single accused.
Information: The document that sets out the name(s) of the accused and all the charges against the accused.
Date
% of Cases Disposed (for cases without bench warrants)
Average Appearances to
Disposition (for cases
without bench warrants)
Average Days to Disposition (for cases without bench warrants)
Cases Disposed: Refers to Cases completed in the Ontario Court of Justice including those committed for trial in the Superior Court of Justice.
Average Days to Disposition: Average number of days from when the first court appearance was scheduled to the date of the final court appearance.
Disposition Rate StatisticsYouth Criminal Cases
Ontario Court of Justice
July 2011 to June 2013Stratford
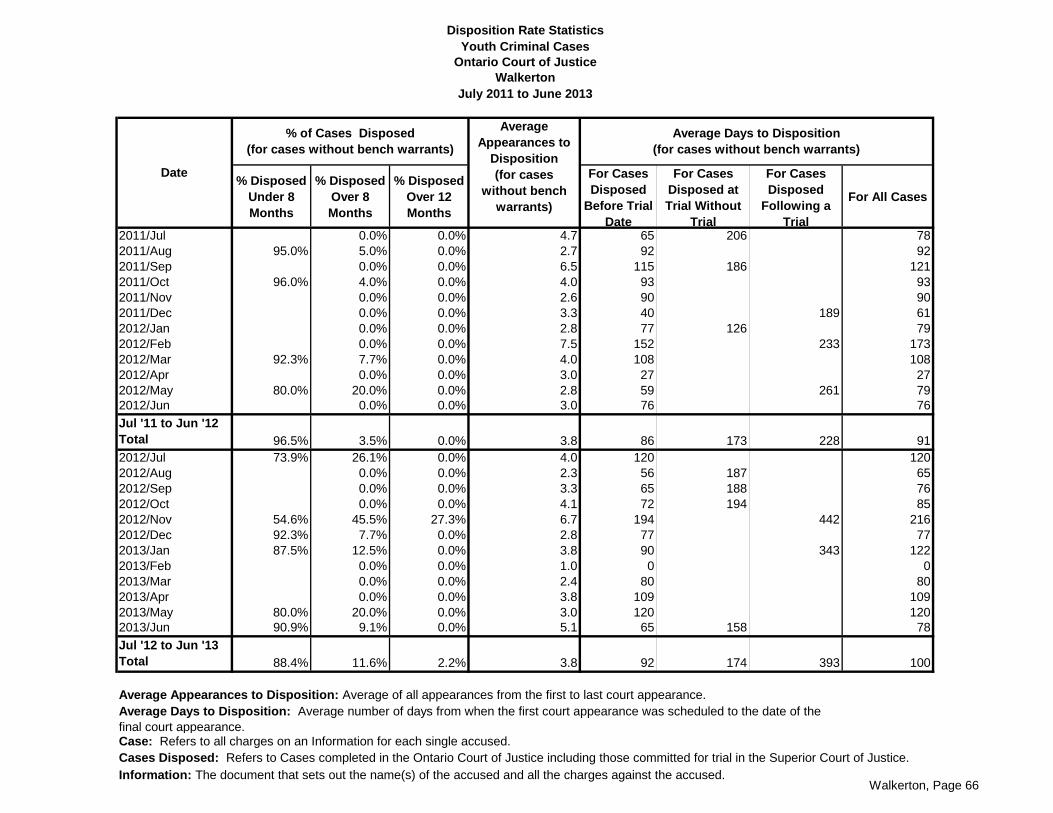
Walkerton, Page 66
% Disposed Under 8 Months
% Disposed Over 8 Months
% Disposed Over 12 Months
For Cases Disposed
Before Trial Date
For Cases Disposed at Trial Without
Trial
For Cases Disposed
Following a Trial
For All Cases
2011/Jul 0.0% 0.0% 4.7 65 206 782011/Aug 95.0% 5.0% 0.0% 2.7 92 922011/Sep 0.0% 0.0% 6.5 115 186 1212011/Oct 96.0% 4.0% 0.0% 4.0 93 932011/Nov 0.0% 0.0% 2.6 90 902011/Dec 0.0% 0.0% 3.3 40 189 612012/Jan 0.0% 0.0% 2.8 77 126 792012/Feb 0.0% 0.0% 7.5 152 233 1732012/Mar 92.3% 7.7% 0.0% 4.0 108 1082012/Apr 0.0% 0.0% 3.0 27 272012/May 80.0% 20.0% 0.0% 2.8 59 261 792012/Jun 0.0% 0.0% 3.0 76 76Jul '11 to Jun '12 Total 96.5% 3.5% 0.0% 3.8 86 173 228 912012/Jul 73.9% 26.1% 0.0% 4.0 120 1202012/Aug 0.0% 0.0% 2.3 56 187 652012/Sep 0.0% 0.0% 3.3 65 188 762012/Oct 0.0% 0.0% 4.1 72 194 852012/Nov 54.6% 45.5% 27.3% 6.7 194 442 2162012/Dec 92.3% 7.7% 0.0% 2.8 77 772013/Jan 87.5% 12.5% 0.0% 3.8 90 343 1222013/Feb 0.0% 0.0% 1.0 0 02013/Mar 0.0% 0.0% 2.4 80 802013/Apr 0.0% 0.0% 3.8 109 1092013/May 80.0% 20.0% 0.0% 3.0 120 1202013/Jun 90.9% 9.1% 0.0% 5.1 65 158 78Jul '12 to Jun '13 Total 88.4% 11.6% 2.2% 3.8 92 174 393 100
Average Appearances to Disposition: Average of all appearances from the first to last court appearance.
Case: Refers to all charges on an Information for each single accused.
Information: The document that sets out the name(s) of the accused and all the charges against the accused.
Date
% of Cases Disposed (for cases without bench warrants)
Average Appearances to
Disposition (for cases
without bench warrants)
Average Days to Disposition (for cases without bench warrants)
Cases Disposed: Refers to Cases completed in the Ontario Court of Justice including those committed for trial in the Superior Court of Justice.
Average Days to Disposition: Average number of days from when the first court appearance was scheduled to the date of the final court appearance.
Disposition Rate StatisticsYouth Criminal Cases
Ontario Court of Justice
July 2011 to June 2013Walkerton

Windsor, Page 67
% Disposed Under 8 Months
% Disposed Over 8 Months
% Disposed Over 12 Months
For Cases Disposed
Before Trial Date
For Cases Disposed at Trial Without
Trial
For Cases Disposed
Following a Trial
For All Cases
2011/Jul 81.4% 18.6% 11.6% 6.0 81 363 394 1222011/Aug 93.2% 6.8% 0.0% 5.7 71 224 349 842011/Sep 83.3% 16.7% 8.3% 6.6 119 428 285 1412011/Oct 91.4% 8.6% 8.6% 6.1 83 832011/Nov 91.9% 8.1% 1.6% 6.1 99 316 1062011/Dec 90.9% 9.1% 4.6% 5.5 98 273 370 1082012/Jan 86.5% 13.5% 5.4% 8.3 87 226 331 1192012/Feb 73.8% 26.2% 16.7% 8.3 132 397 258 1632012/Mar 82.3% 17.7% 3.2% 7.7 110 241 641 1382012/Apr 91.7% 8.3% 2.1% 6.0 93 290 972012/May 88.6% 11.4% 8.6% 7.7 111 284 155 1392012/Jun 90.9% 9.1% 2.3% 5.0 99 289 103Jul '11 to Jun '12 Total 87.2% 12.8% 5.6% 6.6 98 299 337 1172012/Jul 90.7% 9.3% 3.7% 6.1 79 206 427 922012/Aug 89.5% 10.5% 0.0% 5.1 59 100 333 762012/Sep 86.5% 13.5% 2.7% 7.6 98 982012/Oct 64.5% 35.5% 25.8% 8.9 88 402 387 1782012/Nov 76.9% 23.1% 5.1% 7.3 102 252 588 1422012/Dec 80.7% 19.4% 9.7% 7.0 107 318 304 1402013/Jan 78.6% 21.4% 9.5% 8.0 115 309 176 1452013/Feb 96.6% 3.5% 0.0% 7.2 97 265 1092013/Mar 87.5% 12.5% 3.1% 7.9 115 223 666 1352013/Apr 88.5% 11.5% 7.7% 6.5 74 245 161 1032013/May 63.3% 36.7% 22.5% 12.6 267 297 1,189 2872013/Jun 66.7% 33.3% 12.1% 8.2 145 354 272 182Jul '12 to Jun '13 Total 80.1% 19.9% 9.0% 7.9 119 298 390 146
Average Appearances to Disposition: Average of all appearances from the first to last court appearance.
Case: Refers to all charges on an Information for each single accused.
Information: The document that sets out the name(s) of the accused and all the charges against the accused.
Date
% of Cases Disposed (for cases without bench warrants)
Average Appearances to
Disposition (for cases
without bench warrants)
Average Days to Disposition (for cases without bench warrants)
Cases Disposed: Refers to Cases completed in the Ontario Court of Justice including those committed for trial in the Superior Court of Justice.
Average Days to Disposition: Average number of days from when the first court appearance was scheduled to the date of the final court appearance.
Disposition Rate StatisticsYouth Criminal Cases
Ontario Court of Justice
July 2011 to June 2013Windsor

Woodstock, Page 68
% Disposed Under 8 Months
% Disposed Over 8 Months
% Disposed Over 12 Months
For Cases Disposed
Before Trial Date
For Cases Disposed at Trial Without
Trial
For Cases Disposed
Following a Trial
For All Cases
2011/Jul 0.0% 0.0% 2.8 62 622011/Aug 0.0% 0.0% 2.8 43 97 482011/Sep 90.9% 9.1% 0.0% 2.9 67 672011/Oct 90.0% 10.0% 0.0% 4.3 92 279 1202011/Nov 95.0% 5.0% 5.0% 5.4 89 965 1332011/Dec 0.0% 0.0% 3.6 75 179 802012/Jan 0.0% 0.0% 4.8 106 182 1132012/Feb 0.0% 0.0% 3.3 59 99 612012/Mar 92.3% 7.7% 7.7% 4.9 108 470 1362012/Apr 94.3% 5.7% 0.0% 4.6 77 348 842012/May 0.0% 0.0% 6.1 129 1292012/Jun 86.2% 13.8% 6.9% 6.5 112 390 366 139Jul '11 to Jun '12 Total 95.0% 5.0% 1.8% 4.4 83 310 401 972012/Jul 0.0% 0.0% 2.4 48 71 512012/Aug 0.0% 0.0% 2.9 60 602012/Sep 91.2% 8.8% 0.0% 4.4 116 1162012/Oct 0.0% 0.0% 4.9 107 1072012/Nov 0.0% 0.0% 3.3 75 752012/Dec 0.0% 0.0% 4.4 74 231 822013/Jan 91.7% 8.3% 4.2% 4.5 73 262 465 982013/Feb 92.9% 7.1% 0.0% 5.3 111 1112013/Mar 94.7% 5.3% 5.3% 5.5 74 519 982013/Apr 0.0% 0.0% 5.0 102 1022013/May 86.7% 13.3% 6.7% 5.0 92 532 1212013/Jun 93.8% 6.3% 0.0% 5.7 102 143 105Jul '12 to Jun '13 Total 95.6% 4.4% 1.2% 4.5 89 177 505 96
Average Appearances to Disposition: Average of all appearances from the first to last court appearance.
Case: Refers to all charges on an Information for each single accused.
Information: The document that sets out the name(s) of the accused and all the charges against the accused.
Date
% of Cases Disposed (for cases without bench warrants)
Average Appearances to
Disposition (for cases
without bench warrants)
Average Days to Disposition (for cases without bench warrants)
Cases Disposed: Refers to Cases completed in the Ontario Court of Justice including those committed for trial in the Superior Court of Justice.
Average Days to Disposition: Average number of days from when the first court appearance was scheduled to the date of the final court appearance.
Disposition Rate StatisticsYouth Criminal Cases
Ontario Court of Justice
July 2011 to June 2013Woodstock