2018-2019 influenza surveillance report week 447864,199,789,pdf/...2018 – 2019 influenza season |...
TRANSCRIPT

About our flu activity reporting
MSDH relies upon selected sentinel health practitioners across the state to report the percentage of total patient visits consistent with an influenza-like illness (ILI: fever of 100°F or higher AND cough and/or sore throat). Also, providers are supplied with specimen collection kits. Samples are submitted to the Mississippi Public Health Laboratory for influenza PCR testing. Reports are used to estimate the state’s ILI rate and the magnitude of the state’s influenza activity. Reports represent only the distribution of flu in the state, not an actual count of all flu cases statewide. Information is provisional only and may change depending on additional reporting from sentinel providers. Content
State ILI Surveillance
Influenza Outbreaks
Flu Testing Reports
National and Mississippi Pediatric Mortality Surveillance
National ILI Surveillance
Appendix
• Figure 1 (Statewide ILI Data, Current Season compared to Previous Season)
• Figure 2 (Percentage of ILI Cases by Age Group, Mississippi)
• Figure 3 (Mississippi ILI Rates, 2018-2019 and Previous Seasons)
• Figure 4 (State ILI Rates 2014-2018 (YTD))
• Figure 5 (Comparison of the BioSense and Statewide ILI Rates)
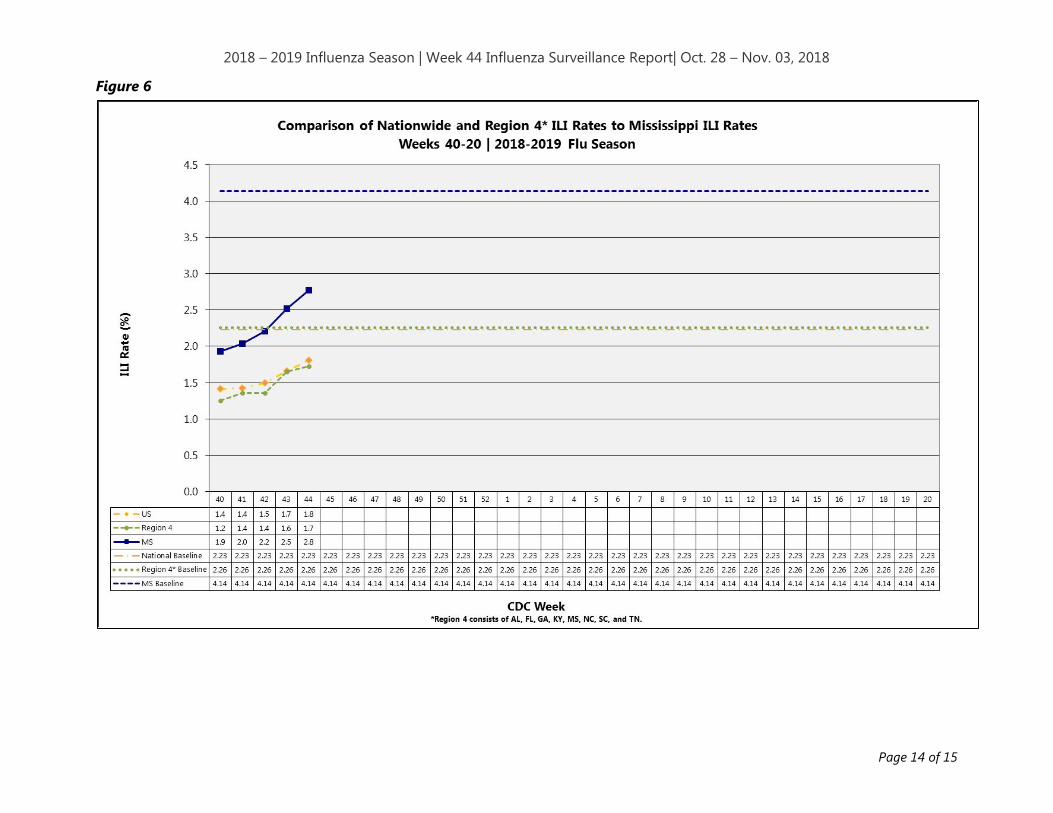
• Figure 6 (Comparison of Nationwide and Region 4 ILI Rates to Mississippi ILI Rates)
• Figure 7 (CDC FluView Weekly Influenza Activity Map)
2018-2019 Influenza Surveillance Report
Week 44 Oct. 28 – Nov. 3, 2018

2018 – 2019 Influenza Season | Week 44 Influenza Surveillance Report| Oct. 28 – Nov. 03, 2018
Page 2 of 15
State ILI Surveillance
During week 44
(10/28/18-
11/03/18), the
overall state ILI
rate (2.8%) was
comparable to
the previous
week (2.5%),
but was lower
than this time
last year (3.4%).
The state ILI has
slowly trended upward since the 2018 – 2019 season began on Sept. 30th. | Figure 1
Total number of patients treated by sentinel providers in the last three weeks.| Table 1
During week 44, three districts (1, 2, and 9) had an increase
in ILI activity, while three districts (4, 6, and 7) had a decrease.
The remaining three districts (3, 5, and 8) remained about the
same. Information is provisional only and may change depending
on additional reporting from sentinel providers. | Table 2
2018-2019 Influenza Season
CDC Week Week
Ending
Number of reports received from
Sentinel Providers Total patients ILI symptoms ILI Rate (%)
44 Nov. 3 153 15554 431 2.8 43 Oct. 27 158 16598 418 2.5 42 Oct. 20 157 17959 397 2.2
MSDH District ILI Rates (%) 2018-2019
District Week 43 Week 44
State 2.5 2.8 I 2.2 4.2 II 1.9 2.8
III 1.5 1.1 IV 4.1 2.9 V 1.9 2.0
VI 3.4 2.7
VII 4.0 3.4 VIII 2.0 2.4 IX 2.4 3.0

2018 – 2019 Influenza Season | Week 44 Influenza Surveillance Report| Oct. 28 – Nov. 03, 2018
Page 3 of 15
Overall, the
percentage of
reported ILI
cases has been
highest among
those in the 0-4
and 5-24 years
of age groups.
During week 44,
however, the
percentage of
ILI cases was
highest among those in the 5-24 years of age group. | Figure 2
The 2018-19 state ILI rate was above the national and Region 4 baselines, but was below the state baseline, for week 44. | Figure 3

2018 – 2019 Influenza Season | Week 44 Influenza Surveillance Report| Oct. 28 – Nov. 03, 2018
Page 4 of 15
Mississippi ILI Rates 2014-2018 | Figure 4
Syndromic ILI Surveillance
The Mississippi State Department of Health also collects influenza syndromic surveillance data through the CDC BioSense Platform. This data is comprised of chief complaints and diagnosis codes and is submitted electronically by participating hospitals and clinics throughout the state in near real-time. The BioSense data is an additional tool to monitor influenza activity in Mississippi.
The
percentage
of patients
with a chief
complaint
or
diagnosis of
influenza-
like illness
has remained steady thus far in the 2018 – 2019 season, while the statewide ILI rate has slightly
increased since week 41. | Figure 5
2018 – 2019 Influenza Season | Week 44 Influenza Surveillance Report| Oct. 28 – Nov. 03, 2018
Page 5 of 15
Influenza Outbreaks
Outbreaks are reportable in Mississippi as a Class 1A event and must be reported by telephone within 24 hours of first knowledge or suspicion to the Mississippi State Department of Health. For more information on reportable diseases and conditions, please refer to the MSDH List of Reportable Diseases and Conditions.
No influenza outbreaks were reported to MSDH during week 44 (week ending November 3rd).
For additional information on infection control measures in health care facilities and managing influenza outbreaks in long-term care facilities, please refer to the CDC’s webpages: https://www.cdc.gov/flu/professionals/infectioncontrol/index.htm and https://www.cdc.gov/flu/professionals/infectioncontrol/ltc-facility-guidance.htm, respectively.
Flu Testing Reports
During week 44 (week ending November 3rd), there were no laboratory confirmed influenza cases identified by MSDH Public Health Laboratory.
National and Mississippi Pediatric Mortality Surveillance
Nationally, no influenza-associated pediatric deaths were reported to CDC during week 44. Two influenza-associated pediatric deaths have been reported to CDC for the 2018-2019 season.
Mississippi has had no influenza-associated pediatric deaths reported during this influenza season.
For additional information on influenza-associated pediatric deaths, please refer to the CDC’s FluView.

2018 – 2019 Influenza Season | Week 44 Influenza Surveillance Report| Oct. 28 – Nov. 03, 2018
Page 6 of 15
National ILI Surveillance
During week 44, the Mississippi (2.8%), national (1.8%) and Region 4 (1.7%) ILI rates remained about the same as the previous week and were below their respective baselines. | Figure 6

2018 – 2019 Influenza Season | Week 44 Influenza Surveillance Report| Oct. 28 – Nov. 03, 2018
Page 7 of 15
During week 44, influenza activity remained low in the United States, although small increases in activity were reported.1 | Figure 7
1For up-to-date information on flu activity nationwide, please refer to the CDC’s website: http://www.cdc.gov/flu/weekly/fluactivitysurv.htm.
Mississippi reported “No Activity” for the influenza activity during week 44. | Table 3
Level of Flu Activity
Definition
No Activity Overall clinical activity remains low and there are no lab confirmed cases.
Sporadic Isolated cases of lab confirmed influenza in the state; ILI activity is not increased OR A lab-confirmed outbreak in a single institution in the state; ILI activity is not increased.
Local Increased ILI within a single region AND recent (within the past 3 weeks) laboratory evidence of influenza in that region. ILI activity in other regions is not increased OR two of more institutional outbreaks (ILI or lab confirmed) within a single region AND recent (within the past 3 weeks) lab confirmed influenza in that region. Other regions do not have increased ILI and virus activity is no greater than sporadic in those regions
Regional Increased ILI in at least 2 regions but fewer than half of the regions AND recent (within the past 3 weeks) lab confirmed influenza in the affected regions OR Institutional outbreaks (ILI or lab confirmed) in at least 2 regions but fewer than half of the regions AND recent lab confirmed influenza in the affected regions.
2018 – 2019 Influenza Season | Week 44 Influenza Surveillance Report| Oct. 28 – Nov. 03, 2018
Page 8 of 15
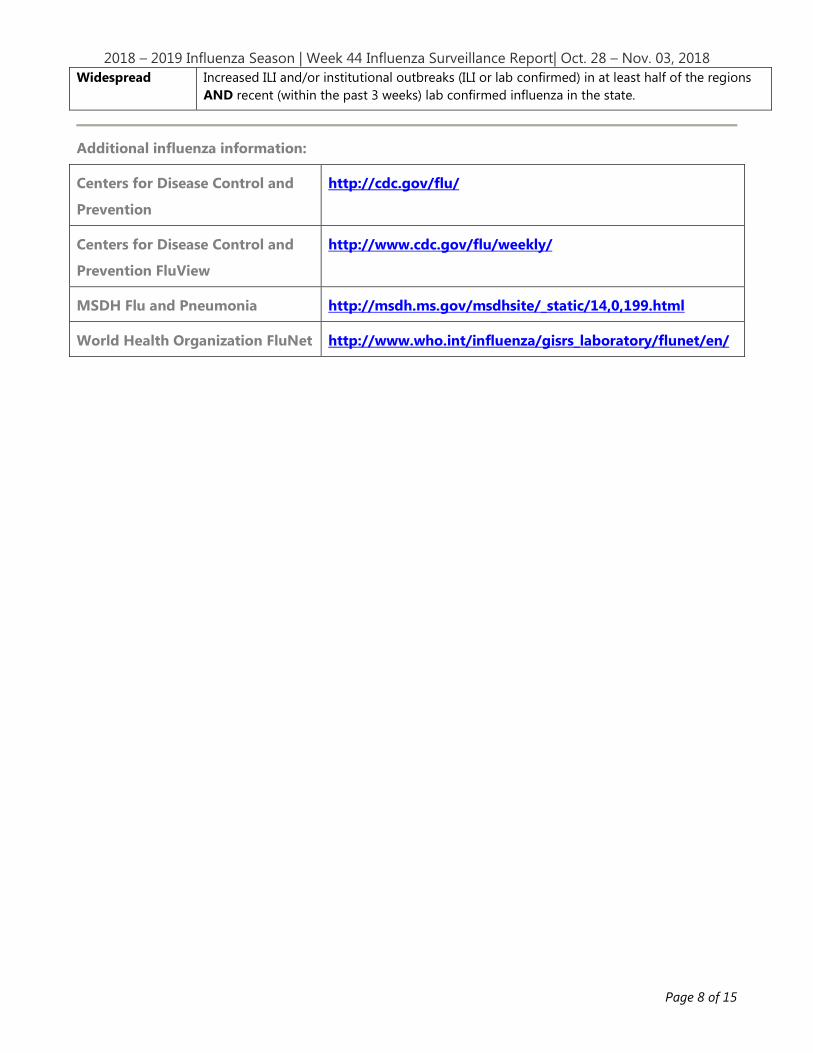
Widespread Increased ILI and/or institutional outbreaks (ILI or lab confirmed) in at least half of the regions AND recent (within the past 3 weeks) lab confirmed influenza in the state.
Additional influenza information:
Centers for Disease Control and
Prevention
http://cdc.gov/flu/
Centers for Disease Control and
Prevention FluView
http://www.cdc.gov/flu/weekly/
MSDH Flu and Pneumonia http://msdh.ms.gov/msdhsite/_static/14,0,199.html
World Health Organization FluNet http://www.who.int/influenza/gisrs_laboratory/flunet/en/

2018 – 2019 Influenza Season | Week 44 Influenza Surveillance Report| Oct. 28 – Nov. 03, 2018
Page 9 of 15
Appendix
Figure 1

2018 – 2019 Influenza Season | Week 44 Influenza Surveillance Report| Oct. 28 – Nov. 03, 2018
Page 10 of 15
Figure 2

2018 – 2019 Influenza Season | Week 44 Influenza Surveillance Report| Oct. 28 – Nov. 03, 2018
Page 11 of 15
Figure 3

2018 – 2019 Influenza Season | Week 44 Influenza Surveillance Report| Oct. 28 – Nov. 03, 2018
Page 12 of 15
Figure 4

2018 – 2019 Influenza Season | Week 44 Influenza Surveillance Report| Oct. 28 – Nov. 03, 2018
Page 13 of 15
Figure 5
2018 – 2019 Influenza Season | Week 44 Influenza Surveillance Report| Oct. 28 – Nov. 03, 2018
Page 14 of 15
Figure 6

2018 – 2019 Influenza Season | Week 44 Influenza Surveillance Report| Oct. 28 – Nov. 03, 2018
Page 15 of 15
Figure 7