2018-19 residential hvac impact evaluation final report
TRANSCRIPT
2018-19 Residential HVAC Impact Evaluation Final Report
B O N N E V I L L E P O W E R A D M I N I S T R A T I O N


page1
TABLEOFCONTENTS
1 EXECUTIVESUMMARY...........................................................................................11.1 BILLINGREGRESSIONANALYSISRESULTS................................................................................................11.2 DHPSURVEYRESULTS................................................................................................................................2
2 INTRODUCTION........................................................................................................42.1 BACKGROUND................................................................................................................................................42.2 STUDYOBJECTIVES.......................................................................................................................................4
3 METHODS...................................................................................................................53.1 BILLINGANALYSIS........................................................................................................................................5
3.1.1 ComparisonGroupAnalysis...................................................................................................................................53.1.2 Post-OnlywithComparisonGroupRegressionModel................................................................................73.1.3 VariableBaseDegreeDay(VBDD)RegressionModel................................................................................7
3.2 DHPCUSTOMERSURVEY............................................................................................................................83.2.1 SurveyApproach.........................................................................................................................................................93.2.2 SamplingandWeightingApproach.....................................................................................................................9
4 BILLINGREGRESSIONANALYSISRESULTS...................................................114.1 DHP’SREPLACINGZONAL–SUMMARYOFRESULTS...........................................................................114.2 DHP’SREPLACINGELECTRICFORCEDAIRFURNACES–SUMMARYOFRESULTS............................134.3 AIRSOURCEHEATPUMPS–SUMMARYOFRESULTS............................................................................134.4 VARIABLESPEEDHEATPUMPS–SUMMARYOFRESULTS...................................................................164.5 DUCTSEALING–SUMMARYOFRESULTS................................................................................................19
5 DHPCUSTOMERSURVEYRESULTS.................................................................235.1 SUMMARYOFRESULTS..............................................................................................................................235.2 BACKGROUND..............................................................................................................................................245.3 DECISIONMAKING.....................................................................................................................................255.4 SYSTEMUSAGE...........................................................................................................................................305.5 SELF-REPORTEDCHANGESINUSAGEANDENERGYBILLS..................................................................325.6 COMFORT,QUALITY,ANDSATISFACTIONWITHDHP..........................................................................425.7 HOUSEHOLDCHARACTERISTICS...............................................................................................................455.8 COMPARINGSURVEYRESPONSESTOENERGYUSE...............................................................................49
5.8.1 StatisticallySignificantResults............................................................................................................................495.8.2 ResultsThatWereNotStatisticallySignificant............................................................................................50
6 APPENDIXA:MODELINGRESULTSFROMPOST-ONLYBILLINGREGRESSIONS..............................................................................................................557 APPENDIXA:DHPCUSTOMERMAILSURVEYINSTRUMENT..................63

page1
1 EXECUTIVESUMMARYThisreportpresentsresultsfromimpactevaluationactivitiesconductedon2018-2019residentialHVACmeasuresfortheBonnevillePowerAdministration(BPA),addressingthefollowingmeasuregroups:
1. Ductlessheatpumps(DHPs)replacingelectriczonalinheatingzones2and32. DHPsreplacingelectricforcedairfurnacesinheatingzone33. Air-sourceheatpump(ASHP)conversionsinallheatingzones4. Variablespeedheatpump(VSHP)conversionsinallheatingzones5. Prescriptiveductsealinginallheatingzones
EvergreenconductedbillinganalysisfromresidentialcustomersofasampleofutilitiesintheregionservedbyBPAtoestimateelectricitysavingsassociatedwitheachoftheprogrammeasureslistedabove.
EvergreenalsoconductedamailcustomersurveyinFebruary2020withasampleofhouseholdsthatreceivedutilityrebatesandinstalledDHPstoreplaceelectriczonalheatinginheatingzones2and3(measuregroup1inthelistabove)tobetterunderstandthevariationinsavingsforthismeasure.
1.1 BILLINGREGRESSIONANALYSISRESULTSEvergreenestimatedtheimpactthateachoftheHVACmeasureshadonaveragedailyandannualelectricityconsumption.Forallmeasures,wefoundthatparticipantsusedlesselectricityonaverageafterinstallation;however,thedegreeofreductiondifferedconsiderablyamongthemeasures(Table1).
Table1:Estimatedannualchangeinelectricityuse(inkWh)afterinstallingHVACmeasure
Row Measure HeatingZone1
HeatingZone2
HeatingZone3
1 DHPReplacingZonalHeating NA -912 -827
2 DHPReplacingElectricForcedAirFurnace NA NA -1,813
3 ASHPwithDuctSealing -2,422 -2,620 NA
4 ASHPwithoutDuctSealing -4,162 -3,748 -3,748
5 VSHPwithDuctSealing -5,473 -5,473 NA
6 VSHPwithoutDuctSealing -1,198 -776 -776
7 DuctSealing(withoutanothermeasure) -3,062 -2,198 -1,844
Source:AnalysisbyEvergreenEconomicsofdatareceivedfromBPAutilities.
page2
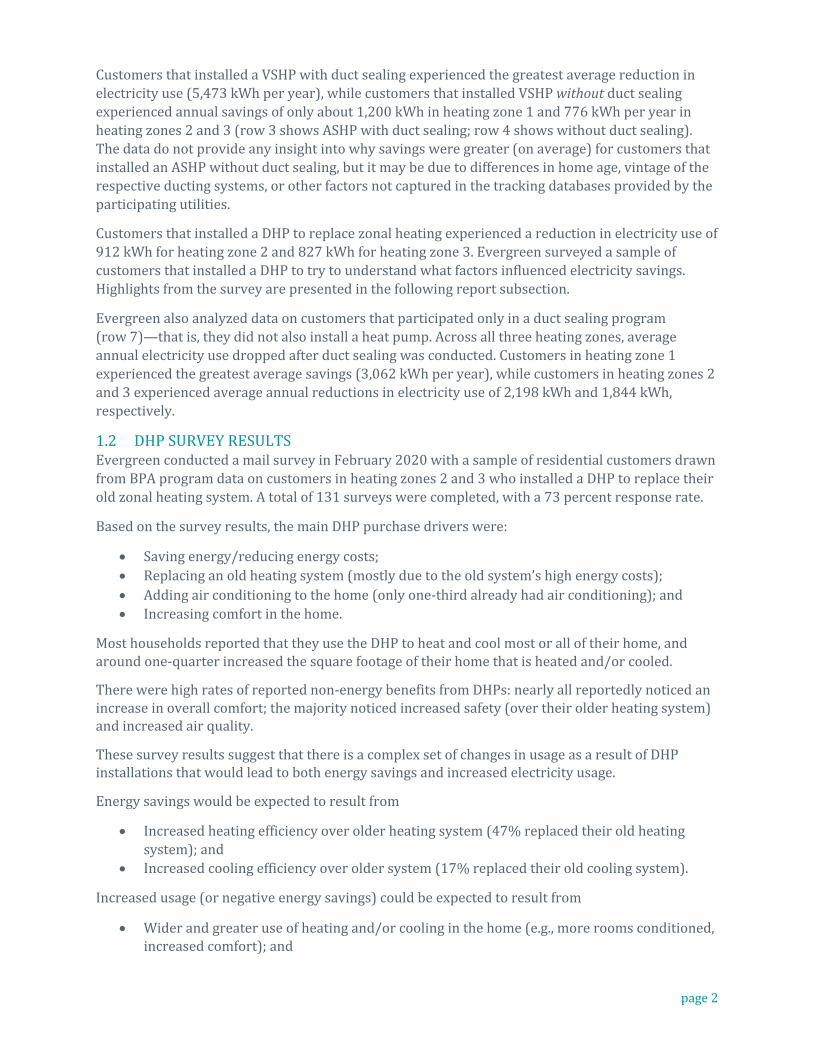
CustomersthatinstalledaVSHPwithductsealingexperiencedthegreatestaveragereductioninelectricityuse(5,473kWhperyear),whilecustomersthatinstalledVSHPwithoutductsealingexperiencedannualsavingsofonlyabout1,200kWhinheatingzone1and776kWhperyearinheatingzones2and3(row3showsASHPwithductsealing;row4showswithoutductsealing).Thedatadonotprovideanyinsightintowhysavingsweregreater(onaverage)forcustomersthatinstalledanASHPwithoutductsealing,butitmaybeduetodifferencesinhomeage,vintageoftherespectiveductingsystems,orotherfactorsnotcapturedinthetrackingdatabasesprovidedbytheparticipatingutilities.
CustomersthatinstalledaDHPtoreplacezonalheatingexperiencedareductioninelectricityuseof912kWhforheatingzone2and827kWhforheatingzone3.EvergreensurveyedasampleofcustomersthatinstalledaDHPtotrytounderstandwhatfactorsinfluencedelectricitysavings.Highlightsfromthesurveyarepresentedinthefollowingreportsubsection.
Evergreenalsoanalyzeddataoncustomersthatparticipatedonlyinaductsealingprogram(row7)—thatis,theydidnotalsoinstallaheatpump.Acrossallthreeheatingzones,averageannualelectricityusedroppedafterductsealingwasconducted.Customersinheatingzone1experiencedthegreatestaveragesavings(3,062kWhperyear),whilecustomersinheatingzones2and3experiencedaverageannualreductionsinelectricityuseof2,198kWhand1,844kWh,respectively.
1.2 DHPSURVEYRESULTSEvergreenconductedamailsurveyinFebruary2020withasampleofresidentialcustomersdrawnfromBPAprogramdataoncustomersinheatingzones2and3whoinstalledaDHPtoreplacetheiroldzonalheatingsystem.Atotalof131surveyswerecompleted,witha73percentresponserate.
Basedonthesurveyresults,themainDHPpurchasedriverswere:
• Savingenergy/reducingenergycosts;• Replacinganoldheatingsystem(mostlyduetotheoldsystem’shighenergycosts);• Addingairconditioningtothehome(onlyone-thirdalreadyhadairconditioning);and• Increasingcomfortinthehome.
MosthouseholdsreportedthattheyusetheDHPtoheatandcoolmostoralloftheirhome,andaroundone-quarterincreasedthesquarefootageoftheirhomethatisheatedand/orcooled.
Therewerehighratesofreportednon-energybenefitsfromDHPs:nearlyallreportedlynoticedanincreaseinoverallcomfort;themajoritynoticedincreasedsafety(overtheirolderheatingsystem)andincreasedairquality.
ThesesurveyresultssuggestthatthereisacomplexsetofchangesinusageasaresultofDHPinstallationsthatwouldleadtobothenergysavingsandincreasedelectricityusage.
Energysavingswouldbeexpectedtoresultfrom
• Increasedheatingefficiencyoverolderheatingsystem(47%replacedtheiroldheatingsystem);and
• Increasedcoolingefficiencyoveroldersystem(17%replacedtheiroldcoolingsystem).
Increasedusage(ornegativeenergysavings)couldbeexpectedtoresultfrom
• Widerandgreateruseofheatingand/orcoolinginthehome(e.g.,moreroomsconditioned,increasedcomfort);and

page3
• Addedairconditioningwherenonewaspresentbefore(66%didnothaveairconditioningpriortoinstallingtheDHP).
However,ifcomparedtowhatcustomersreportedtheywouldhavedoneinabsenceofbuyingtheDHP,overone-thirdwhodidnothaveairconditioningpriorsaidtheywouldhaveboughtadifferentcoolingsystem(mostcommonlyawindowAC)thatmayhavebeenlessefficientatcoolingthantheDHP.
Evergreencomparedsurveyresponsestochangesinelectricitybills(pre-andpost-DHPinstallation)andidentifiedahandfulofstatisticallysignificantresultsthathelpexplainthevariationinpre/postbills:
• CustomersthatreportedheatingtheirhomewithwoodorwoodpelletsincreasedtheirelectricityusageafterinstallingaDHP(adifferenceof15.6kWhperdayduringwintercomparedtoparticipantsthatdidnotreportusingwoodorwoodpellets).
• CustomersthatreportedhavingnaturalgasservicedecreasedtheirelectricityuseafterinstallingaDHPonaverageby15.4kWhperdayduringthewinter.Incontrast,customerswhoreportedhavingpropane/bottledgasserviceincreasedtheirelectricityusebynearly10kWhperday.However,thisstatisticalresultisjustforgasservice,anddoesnotindicatewhetherthepropane/bottlegasservicewasusedforheating,oronlyforotherpurposessuchascookingorwaterheating.
Evergreenalsoidentifiedsomeresultsthatwerenotstatisticallysignificantinexplainingchangesinpre/postbills:
• MailsurveyrespondentswhodidnothavecoolingbeforeaddingaDHPdidnotincreasetheirsummertimeelectricityuseafterinstallingaDHP.
• ThereisnostatisticallysignificantcorrelationbetweenthenumberofindoorDHPheadsandthechangeinelectricityusageafterinstallingtheDHPinthemailsurveysample.
• Therewasnodifferenceinelectricitysavingsbetweencustomersthatreportedinthesurveythattheycontinuedtousetheiroldheatingsystem(s)(ofanytype(s))afterinstallingaDHPandcustomersthatstoppedusingtheiroldheatingsystem(s)oncetheyinstalledtheDHP.
ThesurveyresultsoncustomersaddingACcombinedwiththesavingsanalysisonhomeswithwoodheatsuggestthatsavingsestimatesbasedoncomparingpreandpostbillsmayunderstatethecomprehensivesavingsandbenefitsattributabletoDHPs.Thisresearchcouldsupportupdatestobaselineassumptionsforhouseholdsthatusewoodheatand/orwereplanningtoaddcentralAC,andtocost/benefitanalysesthataddressparticipantcostsavingsandnon-energybenefitsassociatedwithreducingtheuseofwoodheating.

page4
2 INTRODUCTIONThisreportpresentsresultsfromimpactevaluationactivitiesconductedon2018-2019residentialHVACmeasuresfortheBonnevillePowerAdministration(BPA).
2.1 BACKGROUNDBPA,alongwithitspublicpowerutilitypartners,acquiressavingsfromaportfolioofenergyefficiencyprogramsandmeasures,includingUnitEnergySavings(UES)measuresutilizingaconstantsavingsvalueforeachmeasureapplication.
Inearly2018,BPAidentifiedselectheatpumpmeasuresasfocusareasforthe2018-2019evaluationefforts.Theresultsofthe2018evaluationworkidentifiedadditionalresidentialHVACmeasureswhoseresultswereinconclusiveduetoasmallsampleofprojects.1BPAidentifiedasubsetoftheseresidentialUESmeasuresasprioritiestobeevaluatedagaininanattempttogetconclusiveresults.
2.2 STUDYOBJECTIVESThisevaluationwasdesignedtocarryoutresearchactivitiesforselectmeasures,buildingontheguidanceprovidedinthe2018-2019EvaluationPlan.2Theevaluationandresearchactivitieswereintendedtoaddressthefollowingmeasuregroups:
1. Ductlessheatpumps(DHPs)replacingelectriczonalinheatingzones2and32. DHPsreplacingelectricforcedairfurnacesinheatingzone33. Air-sourceheatpump(ASHP)conversionsinallheatingzones4. Variablespeedheatpump(VSHP)conversionsinallheatingzones5. Prescriptiveductsealinginallheatingzones
Thestudyobjectivesweretodevelopthefollowingresultsforeachmeasuregroup:
1. Claimedsavings:claimedunitsandclaimedperunitsavings2. Evaluatedsavings(billinganalysisresults)3. Realizationrates
a. Billinganalysisresultsvs.claimedsavingsb. Billinganalysisresultsvs.best-availableUES
4. Savingsasapercentofheating/coolingandtotalenergyconsumption
1https://www.bpa.gov/EE/Utility/Evaluation/Evaluation/Impact_Evaluation_of_Res_DHP_and_Prescriptive_Duct_Sealing_Measures_draft_report.pdf2https://www.bpa.gov/EE/Utility/Evaluation/Documents/BPA_2020-21_Impact_Evaluation_Plan.pdf

page5
3 METHODS
3.1 BILLINGANALYSISEvergreenconductedbillinganalysisonasampleofresidentialcustomersthatinstalledtheHVACmeasureslistedinSection2.2throughNorthwestutilitiesservedbyBPA.
3.1.1 COMPARISONGROUPANALYSISEvergreendevelopedacomparisongroupforeachenergyefficiencymeasureevaluatedthroughbillinganalysis.Thecomparisongroupdoesnotmeetthestandardsforacontrolgroupunderarandomizedcontrolledtrial(RCT)experimentaldesign,butdoesprovideabaselinefromwhichtomeasuretheimpactofinstallingeachrespectiveenergyefficiencymeasure.3
Customersinacomparisongroupplayanimportantroleintheestimationofelectricitysavingimpactsfromanenergyefficiencyprogram.Withoutacomparisongroup,anychangeinenergyconsumptionbetweenthepre-andpost-periodsthatisnotassociatedwithdifferencesinelectricityuseinthepre-periodortemperature(asrepresentedbyheatingdegree-day[HDD]andcoolingdegree-day[CDD])isassumedtobeduetotheinstallationoftheenergyefficiencymeasure.However,changesinenergyconsumptionbetweenthepre-andpost-periodsmaybeduetooneormoresystematicfactorsoutsideofthemodel,suchaschangesintheeconomy,supplyshockswithintheregionalelectricitymarket,orsociety-widechangesinresidentialenergyuse.
Byincludingcomparisonsitesinthebillingregressionmodelthataresimilartoparticipantsiteswithrespecttogeographiclocation,electricityusage,andparticipationinthesameenergyefficiencyprogram(ateitheranearlierorlaterdate),wewereabletocontrolfortheexistenceofanysystematicexternalfactorsthatmightaffectelectricityusage,aswellaseliminateinitialgroupdifferencesasanexplanationforpost-installationchangesinelectricityusagebyprogramparticipants.
Assignmentofaresidentialcustomertothecomparisongroupisnotrandom,butratherdeterminedbasedononeormorecriteria(e.g.,monthlyenergyconsumption).Becauseofthis,werefertotheanalysisasaquasi-experimentaldesign,therebyacknowledgingthatthecomparisongroupdoesnotmeetthestandardofacontrolgroupwithinanRCTexperimentaldesign.
Whileallofthecustomersthatinstalledoneofthefiveenergyefficiencymeasuresofferedthroughanyofthe26utilitiesthatprovideddataforthisprojectareprogramparticipants,forthepurposeofthebillinganalysis,wesegmentcustomersintooneoftwogroupsbasedonthenumberofmonthsofbillingdatabeforeandafterinstallationoftheenergyefficiencymeasure:
1. The“participant”groupincludescustomerswithatleast12monthsofbillingdatapriortoinstallationoftheenergyefficiencymeasureandatleast12monthsofbillingdataafterinstallation.
2. The“comparison”groupincludescustomerswithatleast24monthsofbillingdatapriortoinstallationoftheenergyefficiencymeasureoratleast24monthsofbillingdataafterinstallationoftheenergyefficiencymeasure.
3ItisimportanttorecognizethatbecausetheevaluationisnotbasedonanRCT(orsimilar)experimentaldesign,thetreatmentandcomparisongroupsareonlyapproximatelyequivalenteventhoughtheymayhaveverysimilarmonthlyelectricityusage.

page6
Customersthatdidnotmeeteitheroftheseselectioncriteriaweredroppedfromthebillinganalysisbecausewedidnothaveenoughmonthsofdataofelectricityusagetoestimatethechangeinelectricityuseassociatedwitharespectiveenergyefficiencymeasure(andthereforedonotmeetthecriteriaofa“participant”),nordotheyhaveenoughbillingdatatoactasacomparisonhometoaparticipant.
Figure1isarepresentationofhowresidentialcustomersthatparticipatedinanenergyefficiencyprograminoneyearcanbeusedasacomparisonforcustomersthatparticipatedinanearlieryear.Thefirstrowinthefigurerepresentstheprogramparticipanttobeevaluated,whilethesecondrowrepresentsthecomparisongroup.
Figure1:Integratingcomparisonhouseholdsintotheexperimentaldesign
Forthesakeofsimplicity,thefigureshowsathree-yearperiodinwhichYear(t)representsthe12-monthperiodimmediatelybeforeacustomerintheparticipantgroupinstalledtheHVACequipment.Italsorepresentsthefirst12monthsofthe24-monthperiodbeforeacustomerinthecomparisongroupinstalledtheHVACequipment.
Year(t+1)representsthe12-monthperiodaftertheenergyefficiencymeasurewasinstalledinthehomeoftheprogramparticipant(thepost-participantperiod)andrepresentsthe12-monthperiodimmediatelybeforeacustomerinthecomparisongroupinstalledtheHVACequipment.
Finally,Year(t+2)representsthe12-monthperiodaftertheenergyefficiencymeasurewasinstalledinthehomesofcustomersinthecomparisongroup.4Inthisexample,onlydataforbillingperiodsinYear(t)andYear(t+1)areusedforstatisticalmodeling.Year(3)isincludedinthefigureonlytoshowthatthecomparisongroupiscomposedofcustomersthatinstalledthesameorsimilarenergyefficiencymeasureatalaterdate.
4Whenworkingwithmonthlybillingdata,asweareforthisproject,theidealistohave12monthsofbillingdatapriortoinstallationoftheenergyefficiencymeasureand12monthsofbillingdataafterthemeasurehasbeeninstalled(anddataforthecomparisongroupforthesesametwo12-monthperiods).

page7
Evergreenmatchedeachcustomerintheparticipantgrouptoacustomerinthecomparisongroupbasedonhowcloselythemonthlyelectricityusageofthetwocustomersalignedduringthe12monthspriortotheparticipantinstallingtheenergyefficiencymeasure.5
3.1.2 POST-ONLYWITHCOMPARISONGROUPREGRESSIONMODELEvergreenusedapost-onlywithcomparisongroup(POCG)regressionmodeltoevaluatetheimpactofinstallinganyoftheHVACmeasureslistedinSection2.2StudyObjectivesinthehomesofresidentialcustomersthatparticipatedinoneormoreenergyefficiencyprogramssponsoredbyaNorthwestutilityservedbyBPA.ThePOCGmodelisappropriateforstudydesigns,suchasimpactevaluationsofenergyefficiencyprograms,whereindividualsself-selectintotheprogramandanalysisoftheenergyimpactsisconductedafter(“post”)installationofthemeasure.Inaddition,thecustomerscomprisingthecomparisongrouparesimilartoparticipantsinthattheyarefromthesamegeographicarea,aresimilarwithrespectto(monthly)electricityuse,andtheyparticipatedinthesameorsimilarenergyefficiencyprogram—eitheratanearlierorlaterdate.6
WeconsiderednumerousPOCGmodelspecificationsofvaryingcomplexity,andsettledonthefollowingspecification:
𝑘𝑊ℎ$,& = 𝛽*𝐶𝐷𝐷$,& +𝛽.𝐻𝐷𝐷$,& + ∑ 𝛽1𝑀𝑡&*.14* × 𝑘𝑊ℎ$,&6*. + ∑ 𝛽7𝑀𝑡&*.
74* × 𝑘𝑊ℎ$,&6*. × 𝑃𝑡$ +𝜀$,&
Where:
𝑘𝑊ℎ$,& = 𝐴𝑣𝑒𝑟𝑎𝑔𝑒𝑑𝑎𝑖𝑙𝑦𝑘𝑊ℎ𝑜𝑓𝑐𝑢𝑠𝑡𝑜𝑚𝑒𝑟𝑖𝑖𝑛𝑚𝑜𝑛𝑡ℎ𝑡ofthepostperiod
𝐶𝐷𝐷$,& = 𝐴𝑣𝑒𝑟𝑎𝑔𝑒𝑐𝑜𝑜𝑙𝑖𝑛𝑔𝑑𝑒𝑔𝑟𝑒𝑒𝑑𝑎𝑦𝑠𝑓𝑜𝑟𝑝𝑎𝑟𝑡𝑖𝑐𝑖𝑝𝑎𝑛𝑡𝑖𝑖𝑛𝑚𝑜𝑛𝑡ℎ𝑡
𝐻𝐷𝐷$,& = 𝐴𝑣𝑒𝑟𝑎𝑔𝑒ℎ𝑒𝑎𝑡𝑖𝑛𝑔𝑑𝑒𝑔𝑟𝑒𝑒𝑑𝑎𝑦𝑠𝑓𝑜𝑟𝑝𝑎𝑟𝑡𝑖𝑐𝑖𝑝𝑎𝑛𝑡𝑖𝑖𝑛𝑚𝑜𝑛𝑡ℎ𝑡
𝑀𝑡& = 𝐼𝑛𝑑𝑖𝑐𝑎𝑡𝑜𝑟𝑣𝑎𝑟𝑖𝑎𝑏𝑙𝑒𝑡ℎ𝑎𝑡𝑒𝑞𝑢𝑎𝑙𝑠1𝑓𝑜𝑟𝑚𝑜𝑛𝑡ℎ𝑡, 𝑒𝑙𝑠𝑒0
𝑃𝑡$ = 𝐼𝑛𝑑𝑖𝑐𝑎𝑡𝑜𝑟𝑣𝑎𝑟𝑖𝑎𝑏𝑙𝑒𝑡ℎ𝑎𝑡𝑒𝑞𝑢𝑎𝑙𝑠1𝑖𝑓𝑐𝑢𝑠𝑡𝑜𝑚𝑒𝑟𝑖𝑖𝑠𝑎𝑝𝑎𝑟𝑡𝑖𝑐𝑖𝑝𝑎𝑛𝑡, 𝑒𝑙𝑠𝑒0
𝑘𝑊ℎ$,&6*. = 𝐴𝑣𝑒𝑟𝑎𝑔𝑒𝑑𝑎𝑖𝑙𝑦𝑘𝑊ℎ𝑜𝑓𝑐𝑢𝑠𝑡𝑜𝑚𝑒𝑟𝑖𝑖𝑛𝑚𝑜𝑛𝑡ℎ𝑡𝑜𝑓𝑝𝑟𝑒𝑣𝑖𝑜𝑢𝑠𝑦𝑒𝑎𝑟
𝛽*, 𝛽., … = 𝑃𝑎𝑟𝑎𝑚𝑒𝑡𝑒𝑟𝑠𝑡𝑜𝑏𝑒𝑒𝑠𝑡𝑖𝑚𝑎𝑡𝑒𝑑𝑖𝑛𝑡ℎ𝑒𝑚𝑜𝑑𝑒𝑙
𝜀$,& = 𝑅𝑎𝑛𝑑𝑜𝑚𝑒𝑟𝑟𝑜𝑟𝑡𝑒𝑟𝑚
Byspecifyingthemodelwithanarrayofmonthlyindicatorvariables(𝑀𝑡&)interactedwithelectricityusageinthepre-period(𝑘𝑊ℎ$,&6*.)andanindicatorvariableforparticipant(𝑃𝑡$),wewereabletoestimateenergyimpactsfortheprogramforeachcalendarmonth.
3.1.3 VARIABLEBASEDEGREEDAY(VBDD)REGRESSIONMODELTheVBDDmodelingapproachdiffersfromthePOCGregressionmodelinthatitfitsindividualregressionmodelsforeachcustomer’spre-installationbillingdataandthecustomer’spost-installationbillingdata.Thismeansthatweestimatedtworegressionmodelsforeachcustomerintheparticipantgroup.
5Wewillchoosethecustomerfromthecomparisongroupthatminimizesthesumofsquarederrorsinmonthlyelectricityconsumption.6Thisisincontrasttoadesignedexperiment,suchasRCT,whereinformationisknownontheindividualsbeforetheybeginparticipatinginthestudyandthesubjectsofthestudyarerandomlyassignedtoeitheraparticipantorcontrolgroup.

page8
TheVBDDmodelisspecifiedasfollows:
𝑘𝑊ℎS = 𝛼 + 𝛽*𝐶𝐷𝐷U,S + 𝛽.𝐻𝐷𝐷U,S + 𝜀S
Where:
𝑘𝑊ℎS = 𝐴𝑣𝑒𝑟𝑎𝑔𝑒𝑑𝑎𝑖𝑙𝑦𝑘𝑊ℎ𝑖𝑛𝑚𝑜𝑛𝑡ℎ𝑚
𝐶𝐷𝐷U,S = 𝐴𝑣𝑒𝑟𝑎𝑔𝑒𝑐𝑜𝑜𝑙𝑖𝑛𝑔𝑑𝑒𝑔𝑟𝑒𝑒𝑑𝑎𝑦𝑠𝑎𝑡𝑟𝑒𝑓𝑒𝑟𝑒𝑛𝑐𝑒𝑡𝑒𝑚𝑝𝑒𝑟𝑎𝑡𝑢𝑟𝑒𝑇𝑖𝑛𝑚𝑜𝑛𝑡ℎ𝑚
𝐻𝐷𝐷U,S = 𝐴𝑣𝑒𝑟𝑎𝑔𝑒ℎ𝑒𝑎𝑡𝑖𝑛𝑔𝑑𝑒𝑔𝑟𝑒𝑒𝑑𝑎𝑦𝑠𝑎𝑡𝑟𝑒𝑓𝑒𝑟𝑒𝑛𝑐𝑒𝑡𝑒𝑚𝑝𝑒𝑟𝑎𝑡𝑢𝑟𝑒𝑇𝑖𝑛𝑚𝑜𝑛𝑡ℎ𝑚
𝛼 = 𝐸𝑠𝑡𝑖𝑚𝑎𝑡𝑎𝑑𝑝𝑎𝑟𝑎𝑚𝑒𝑡𝑒𝑟𝑟𝑒𝑝𝑟𝑒𝑠𝑒𝑛𝑡𝑖𝑛𝑔𝑑𝑎𝑖𝑙𝑦𝑏𝑎𝑠𝑒𝑙𝑜𝑎𝑑𝑒𝑙𝑒𝑐𝑡𝑟𝑖𝑐𝑖𝑡𝑦𝑢𝑠𝑎𝑔𝑒
𝛽*, 𝛽. = 𝑃𝑎𝑟𝑎𝑚𝑒𝑡𝑒𝑟𝑠𝑡𝑜𝑏𝑒𝑒𝑠𝑡𝑖𝑚𝑎𝑡𝑒𝑑𝑖𝑛𝑡ℎ𝑒𝑚𝑜𝑑𝑒𝑙
𝜀S = 𝑅𝑎𝑛𝑑𝑜𝑚𝑒𝑟𝑟𝑜𝑟𝑡𝑒𝑟𝑚
Usingtheestimatedcoefficientsfromeachcustomer’spre-andpost-periodmodels,wecomputedtheweathernormalizedaverageconsumptionforthepre-andpost-periods.Wethencomputedthedifferencebetweenthepre-andpost-periodweathernormalizedaverageconsumptionforeachparticipantcustomer.7
TheprimarypurposeofestimatingVBDDmodelsforprogramparticipantswastoexaminethedistributionofchangesindailyelectricityuseamongparticipants.Whereasthepost-onlymodelprovidesestimatesoftheprogramlevelimpactofinstallingaspecificpieceofequipment(aswellastheimpactfortheaverageparticipant),theVBDDmodelsimplymeasuresthechangeinaveragedailyelectricityuseforeachparticipantwhilecontrollingfordifferencesintemperaturebetweenthepreandpostperiods.Anychangeinelectricityusageforanindividualparticipantmaybedueentirelyorinparttoenergysavingsassociatedwithinstallingthemeasure.However,becausetheVBDDmodelprecludestheuseofacomparisongroup,itisnotpossibletoattributeachangeinelectricityusetotheinstallationoftheenergyefficiencymeasure.
3.2 DHPCUSTOMERSURVEYEvergreenconductedamailcustomersurveyinFebruary2020withasampleofhouseholdsthatreceivedutilityrebatesandinstalledDHPstoreplaceelectriczonalheatinginheatingzones2and3.Thesurveywasintendedtomeetthefollowingobjectives:
• Objective1–UnderstandinghouseholdusageofDHPs(how,when,whereinthehome,etc.)
• Objective2–CharacterizingchangeinheatingandcoolingusagesinceDHPinstallation(previousheatingandcoolingequipmentandusage,howthosesystemsareusedwithDHPs)
• Objective3–Characterizingthefactorsthatinfluencedthecustomer’sdecisiontopurchaseaDHP
• Objective4–Assessingcustomersatisfaction,comfortlevels,andpotentialnon-energybenefits(NEBs)associatedwithDHPinstallation
• Objective5–Verifyingprojectdelivery
7SinceeachVBDDmodelisestimatedusingdataforasinglehome(i.e.,a“sampleofone”),wedidnotdifferentiatetheestimatedchangeindailyelectricityusageforeachcomparisonhomefromtheestimatedchangeindailyelectricityuseforeachparticipanthome.

page9
• Objective6–Identifyinghouseholdcharacteristicsthatmayaffectenergyuse(e.g.,numberinhousehold)
• Objective7–Categorizingbuildingcharacteristicsthatwillbeneededtoconductacalibratedsimulation(homesize,vintage,supplementalheatingandcoolingequipment,etc.)
• Objective8–Documentingchangestohouseholdand/orbuildingsinceinstallationthatmayhaveasignificanteffectonenergyuse(e.g.,remodels,changeinhouseholdsize).
3.2.1 SURVEYAPPROACHEvergreenusedawritten,papermailplatformtoadministertheDHPcustomersurvey.Thestepsbelowoutlinetherecruitmentanddatacollectionstrategy.
1. Coordinatewithparticipatingutilities(January2020):EvergreendevelopedprotocolsforcontactingutilitycustomerswithBPAandparticipatingutilities.
2. Mailinitialsurveypackage(earlyFebruary2020):EvergreenmailedsampledresidentialDHPprogramparticipantsapackagecontainingaletterdescribingthestudybackgroundandincentive($25)forreturningacompletedsurveyandprovidingEvergreenandBPAcontactinformationforquestions,writtensurveyinstruments,one$5billasapre-incentive,andareturnenvelope(withpostage).
3. Mailfollow-uppackage(mid-February2020):EvergreenmailedafollowuppackagetoanyDHPhouseholdsthathadnotsubmittedcompletedsurveysorcalledintothestudyline.Themailingincludedanothercopyofthewrittensurvey,areturnenvelope,andapostcardforrespondentstoprovidetheirinformationfortheincentivecheck.
4. Enterandanalyzesurveyresponses(late-FebruarythroughMarch2020):Evergreenconducteddataentryandqualitycontrolonallreturnedsurveysandanalyzedsurveyresponses.
3.2.2 SAMPLINGANDWEIGHTINGAPPROACHEvergreendevelopedasampleframebasedonresidentialDHPparticipantswhoreplacedelectriczonalheatinginzones2and3.Weidentifiedthetopfiveutilitieswiththehighestnumberofparticipantstocomprisethesampleframe.Afterinitialutilityoutreach(ajointeffortbetweenBPAandEvergreen),oneofthefiveutilitiesdroppedout,leavingfourutilitiesand223customers.Thegoalwastogetupto100returnedsurveys.
Afteraccountingfor43surveysthatwerereturnedtothesender,theresponseratewas73percentwith131completedsurveys(seeTable2).Evergreenappliedsamplehouseholdweightstothe131completedsurveystorepresentthetargetpopulationof223participatinghouseholds.

page10
Table2:Surveysampleandresponsebyutility
Utility ParticipantPopulation(InitialMailing)
AdjustedSample(Subtractingreturnedtosendersurveys)
CompletedSurveys
ResponseRate
Flathead 129 101 69 68%
IdahoFalls 18 14 8 57%
Lincoln 28 24 19 79%
MissionValley 48 41 35 85%
Total 223 180 131 73%

page11
4 BILLINGREGRESSIONANALYSISRESULTSEvergreenestimatedthechangeinelectricityusageforresidentialcustomersthatinstalledoneormoreoftheHVACmeasuresshowninTable3throughanenergyefficiencyprogramoperatedbytheirelectricutilityduringthe2016,2017,or2018programyears.Forthetwoductlessheatpump(DHP)measures,thefocusofouranalysiswasheatingzones2and3.ForDHPsreplacingzonal,thereweresufficientdatatoestimateseparatemodelsforheatingzones2and3,whereasforDHPsreplacingelectricforcedairfurnaces(EFAFs),thesampleofparticipantswasnotsufficienttomodelheatingzones2and3separately.Forvariable-speedheatpumps(VSHPs)andair-sourceheatpumps(ASHPs),weestimatedmodelsthatincludedallparticipants,aswellasseparatemodelsforparticipantsinheatingzone1andparticipantsinheatingzones2and3(combined).ManyofthecustomersthatinstalledVSHPsandASHPsalsoparticipatedintheductsealingprogram.Forthesecustomers,wedevelopedseparateestimatesofsavingsforthosethatdidanddidnotincludeductsealing.Finally,wealsoestimatedbillingmodelsforductsealingforallparticipants,aswellasforparticipantsineachheatingzone.
Table3:Billingregressionmodelsestimatedbymeasure
Measure HeatingZone(HZ)
AllHZs HZ2&HZ3
HZ1 HZ-2 HZ-3
DHPsReplacingZonal X X X
DHPsReplacingEFAFs X
VSHPs X X X
ASHPs X X X
DuctSealing(w/oHeatPump) X X X XWeusedapost-only(withcomparisongroup)regressionmodeldescribedinSection3.1.2toestimateelectricitysavingsfromtheinstallationofeachofthesemeasures.DetailedtablesoftheoutputfromeachregressionareincludedinSectionError!Referencesourcenotfound..
4.1 DHP’SREPLACINGZONAL–SUMMARYOFRESULTSOfthe853residentialcustomersinoursamplethatinstalledaDHPthroughaBPA-affiliatedutilitytoreplaceelectriczonalheating,450mettherequirementstobeconsideredaparticipantformodelingpurposes(atleast12monthsofpre-installationandpost-installationbillingdata).Theremainingcustomerswereincludedinthepoolofcomparisonsitesifthecustomerhadatleast24monthsofpre-installationorpost-installationbillingdata.Allparticipantandcomparisoncustomersarelocatedinheatingzones2and3.
Table4showsourestimatesoftheaveragedailychangeinelectricityuseforcustomersthatreplacedelectriczonalheatingwithaDHP.Weestimatethatonaverage,customersinheatingzones2and3reducedtheirelectricityusageby2.48kWhperdayor903kWhperyearafter

page12
installingaDHP.8TheimpactsofinstallingaDHPdifferbymonth,withthegreatestsavingsoccurringinthewintershouldermonthsofMarch,April,October,andNovember,whicharetypicallyheatingmonths,butaregenerallymilderthanDecember,January,orFebruary.Itisnotclearwhysavingsweregreaterinthewintershoulderperiodsthaninthewinter,butitmaybeduetothewaycustomersusetheirDHPinconjunctionwithothertypesofheatingequipment.ItmayalsoberelatedtocustomerattitudesabouttheefficacyofDHPsduringthecoldesttimesoftheyear.
Onaverage,installingaDHPdidnotincreaseelectricityloadsforcustomersduringthesummermonthsand,infact,customersreducedtheirelectricityuseduringtheearlypartofsummer(JuneandJuly).9
Table4:EstimatedaveragedailychangeinelectricityusageforcustomersthatinstalledaDHPreplacingzonalheating
Month HZ2&HZ3(n=450) HZ2(n=256) HZ3(n=194)ChangeinkWh*
StatisticalSignificance**
ChangeinkWh*
StatisticalSignificance**
ChangeinkWh*
StatisticalSignificance**
January -1.77 10% -2.21 10% -0.95 NS
February -1.64 10% -2.95 5% 0.41 NS
March -4.08 1% -5.25 1% -2.32 NS
April -3.07 1% -4.53 1% -0.97 NS
May -2.04 5% -1.70 NS -2.45 10%
June -2.17 5% -2.37 5% -1.89 NS
July -2.21 5% -2.19 10% -2.36 10%
August -0.66 NS -0.20 NS -1.39 NS
September -0.77 NS 0.19 NS -1.78 NS
October -3.65 1% -3.54 1% -3.52 1%
November -4.77 1% -3.56 1% -6.01 1%
December -2.86 1% -1.65 NS -3.97 1%
AverageDaily -2.48 1% -2.50 1% -2.27 1%
AverageAnnual -903 1% -912 1% -827 1%
Source:AnalysisbyEvergreenEconomicsofdatareceivedfromBPAutilities.*Negativevaluesindicatereductioninelectricityusage;positivevaluesindicateincreaseduseofelectricity.**Thelowerthevalue(i.e.,1%),thegreaterthestatisticalsignificance.“NS”indicatesnotstatisticallysignificantlydifferentfromzero.
8Estimatesofthechangeinelectricityuseholdotherfactors,suchastemperatureandeconomywidefactorsconstantand,therefore,representsavingsattributabletotheinstallationofaDHP.9ThecoefficientsforAugustandSeptemberarenegative–suggestingenergysavings–buttheestimatesarenotstatisticallysignificantlydifferentfromzero.

page13
4.2 DHP’SREPLACINGELECTRICFORCEDAIRFURNACES–SUMMARYOFRESULTSOfthe71customersthatinstalledaDHPtoreplaceanEFAF,39metthecriteriatobeconsideredaparticipantforthepurposesofmodeling.Eachofthe39participantcustomersarelocatedinheatingzone3.Onaverage,customersreducedtheirelectricityusagebynearly5kWhperday(1,813kWhperyear)asshowninTable5.Estimatedelectricitysavingsvariedconsiderablybymonthwiththehighestpointestimatesofelectricitysavingsoccurringduringthewintermonths(DecemberthroughMarch).Thesewerealsotheonlymonthsinwhichtheestimatesofelectricitysavingsarestatisticallysignificantlygreaterthanzero.Fortheothermonths,theestimatedchangeinelectricityusagesuggestscustomerssavedenergy;however,theestimatesarenotstatisticallysignificantlydifferentfromzeroandsowecannotconcludesavingsoccurredinthosemonths.
Table5:Estimatedaveragedailyelectricitysavings–DHPreplacingEFAF
Month HeatingZone3(n=39)ChangeinkWh* StatisticalSignificance**
January -9.84 1%
February -6.44 10%
March -9.30 5%
April -4.40 NS
May -3.38 NS
June -0.87 NS
July -3.17 NS
August -2.40 NS
September -3.78 NS
October -5.24 NS
November -4.33 NS
December -6.45 5%
AverageDaily -4.97 1%
AverageAnnual -1,813 1%
Source:AnalysisbyEvergreenEconomicsofdatareceivedfromBPAutilities.*Negativevaluesindicatereductioninelectricityusage;positivevaluesindicateincreaseduseofelectricity.**Thelowerthevalue(i.e.,1%),thegreaterthestatisticalsignificance.“NS”indicatesnotstatisticallysignificantlydifferentfromzero.
4.3 AIRSOURCEHEATPUMPS–SUMMARYOFRESULTSTherewere647residentialcustomersinoursamplethatinstalledanASHPthroughaBPA-affiliatedutility.Ofthesecustomers,211hadsufficientpre-installationandpost-installationelectricitybillingrecords(atleast12monthsofeach)tobecategorizedasparticipantsforthepurposesofmodeling.Table6showsthenumberofparticipantsthatinstalledanASHPbyheatingzoneandbywhether

page14
thecustomeralsoparticipatedinductsealing.Ofthe211participants,only35alsoreceivedductsealingservicesinadditiontoinstallinganASHP.Nearlyallofthemarelocatedinheatingzone2.Ofthe176participantsthatdidnotalsoreceiveductsealing,most(147)arelocatedinheatingzone1.
Table6:ParticipanthomesthatinstalledanASHPbyheatingzone
HeatingZone WithDuctSealing
WithoutDuctSealing
TotalParticipants
HeatingZone1 3 147 150
HeatingZone2 32 14 46
HeatingZone3 0 15 15
AllHeatingZones 35 176 211TodevelopestimatesoftheimpactofinstallingASHPsonelectricityuse,weestimatedseparatebillingmodelsforparticipantsthatincludedductsealingwhentheyinstalledanASHPandthosethatdidnotincludeductsealing.Table7showstheestimatedchangeinelectricityuseforcustomersthatinstalledanASHPwithductsealing.Weestimatethatallparticipantsreducedtheirelectricityuseonaverageby6.64kWhperday(2,422peryear).Consideringonlythe32(of35)customerslocatedinheatingzone2,weestimatesavingsof7.18kWhperday(2,620kWhperyear).

page15
Table7:EstimatedaveragedailychangeinelectricityusageforcustomersthatinstalledanASHPwithductsealing
Month HZ1&HZ2(n=35) HZ2(n=32)ChangeinkWh*
StatisticalSignificance**
ChangeinkWh*
StatisticalSignificance**
January -17.63 1% -19.39 1%
February -19.96 1% -21.74 1%
March -16.52 1% -16.81 1%
April -7.58 10% -8.07 10%
May 0.72 NS 0.63 NS
June 1.87 NS 1.94 NS
July 0.45 NS 0.45 NS
August 0.75 NS 0.79 NS
September 0.71 NS 0.84 NS
October -1.80 NS -1.90 NS
November -6.79 NS -7.59 NS
December -13.84 1% -15.27 1%
AverageDaily -6.64 1% -7.18 1%
AverageAnnual -2,422 1% -2,620 1%
Source:AnalysisbyEvergreenEconomicsofdatareceivedfromBPAutilities.*Negativevaluesindicatereductioninelectricityusage;positivevaluesindicateincreaseduseofelectricity.**Thelowerthevalue(i.e.,1%),thegreaterthestatisticalsignificance.“NS”indicatesnotstatisticallysignificantlydifferentfromzero.
Table8showsourestimatesofelectricitysavingsforcustomersthatinstalledanASHP,butdidnotincludeductsealing.Weestimatethatthesecustomersreducedtheirelectricityuseonaverageby11.54kWhperday(4,213kWhperyear).Customersreducedtheirelectricityuseinallmonths,butsavingswereparticularlygreatinthewinterandwintershouldermonths.Forthefive-monthperiodfromOctoberthroughMarch,weestimatethatcustomersreducedtheirelectricityusagebyabout17to19kWhperday.
Wealsoestimatedseparatemodelsforcustomersinheatingzone1andinheatingzones2and3.Mostcustomerswedesignatedasparticipantsarelocatedinheatingzone1(147of176),andourestimatesofthechangeinenergyuseforcustomersinheatingzone1closelyaligntoourestimatesforallcustomers.Forcustomersinheatingzones2and3,weestimatereducedelectricityusageinthemonthsofJanuarythroughAprilandOctoberthroughDecemberthatrangedfrom10tonearly
page16
28kWhperday.However,forthemonthsofMaythroughSeptember,wefindnostatisticallysignificantevidencethatelectricityusechanged.10
Table8:EstimatedaveragedailychangeinelectricityusageforcustomersthatinstalledanASHPwithoutductsealing
Month AllCustomers(n=176) HZ1(n=147) HZ2&HZ3(n=29)ChangeinkWh*
StatisticalSignificance**
ChangeinkWh*
StatisticalSignificance**
ChangeinkWh*
StatisticalSignificance**
January -16.70 1% -18.62 1% -10.12 10%
February -19.26 1% -20.92 1% -11.67 5%
March -16.76 1% -16.02 1% -22.43 1%
April -9.94 1% -7.08 1% -21.92 1%
May -3.44 5% -3.25 5% -1.47 NS
June -5.45 1% -6.55 1% 3.43 NS
July -7.69 1% -9.29 1% 3.67 NS
August -5.93 1% -7.17 1% 4.28 NS
September -3.49 5% -3.50 5% -1.96 NS
October -10.98 1% -9.88 1% -13.13 1%
November -19.46 1% -17.11 1% -24.24 1%
December -19.41 1% -17.45 1% -27.67 1%
AverageDaily -11.54 1% -11.40 1% -10.27 1%
AverageAnnual -4,213 1% -4,162 1% -3,748 1%
Source:AnalysisbyEvergreenEconomicsofdatareceivedfromBPAutilities.*Negativevaluesindicatereductioninelectricityusage;positivevaluesindicateincreaseduseofelectricity.**Thelowerthevalue(i.e.,1%),thegreaterthestatisticalsignificance.“NS”indicatesnotstatisticallysignificantlydifferentfromzero.4.4 VARIABLESPEEDHEATPUMPS–SUMMARYOFRESULTSTherewere193residentialcustomersinoursamplethatinstalledaVSHPthroughtheirBPA-affiliatedutility;70hadsufficientpre-installationandpost-installationelectricitybillingrecords(atleast12monthsofeach)tobecategorizedasparticipantsforthepurposesofmodeling.
10Note:ourestimateoftheaveragedailychangeinelectricityuseforallcustomers(-11.54)isslightlygreaterinabsolutevaluethanourestimatesofthechangeinelectricityusefortheregionsindividually.Whilethisdoesnotseemimprobableorevenimpossible,theseestimatesarefromseparatestatisticalmodelsandarenotstatisticallysignificantlydifferent.

page17
Table9showsthenumberofparticipantsthatinstalledaVSHPbyheatingzoneandbywhethertheyalsoparticipatedinductsealing.Ofthe70customersthatinstalledaVSHP,22alsoreceivedductsealingservices.Mostcustomerswereinheatingzone1,andonlythreecustomerswereinheatingzone3.
Table9:ParticipanthomesthatinstalledaVSHPbyheatingzone
HeatingZone WithDuctSealing
WithoutDuctSealing
TotalParticipants
HeatingZone1 8 37 45
HeatingZone2 14 8 22
HeatingZone3 0 3 3
AllHeatingZones 22 48 70
Table10showstheestimatedchangeinelectricityusagebymonthforcustomersthatinstalledaVSHPwithductsealing.Giventhesmallnumberofcustomerswithsufficientbillingdatatobeconsideredaparticipant,weonlyestimatedasinglebillingregressionmodel.Overall,weestimatecustomerssavedabout15kWhperday(5,473kWhperyear).

page18
Table10:EstimatedaveragedailychangeinelectricityusageforcustomersthatinstalledaVSHPwithductsealing
Month AllCustomers(n=22)ChangeinkWh*
StatisticalSignificance**
January -22.47 1%
February -23.51 1%
March -18.65 1%
April -13.85 1%
May -12.67 1%
June -5.68 NS
July -6.89 NS
August -5.01 NS
September -10.69 5%
October -17.15 1%
November -19.42 1%
December -23.95 1%
AverageDaily -14.99 1%
AverageAnnual -5,473 1%
Source:AnalysisbyEvergreenEconomicsofdatareceivedfromBPAutilities.*Negativevaluesindicatereductioninelectricityusage;positivevaluesindicateincreaseduseofelectricity.**Thelowerthevalue(i.e.,1%),thegreaterthestatisticalsignificance.“NS”indicatesnotstatisticallysignificantlydifferentfromzero.
Electricitysavingsdifferedgreatlybymonth,withreductionsinelectricityuseofgreaterthan22kWhperdayduringthemonthsofDecember,January,andFebruary,andnostatisticallysignificantchangeinelectricityuseforthemonthsofJune,July,andAugust.11
Table11showsestimatesofchangeinelectricityuseforcustomersthatinstalledaVSHP,butdidnotparticipateinductsealing.Acrossallcustomers,wedonotfindsufficientevidencethatinstallingaVSHPwithoutductsealingledtoachangeinelectricityuse.12Wedofindevidencethatforspecificmonths(i.e.,January,February,November,December),customersexperiencedareductioninelectricityuse,butforothermonths,theestimatedchangesarenotstatisticallysignificant.
11Note:WhileourpointestimatesofthechangeinelectricityuseforJune,July,andAugustrangefrom5kWhto6.9kWhperday,theyarenotstatisticallysignificantlydifferentfromzero.12Theaveragedailyestimatedchangeof-2.13kWhisnotstatisticallysignificantlydifferentfromzero.

page19
Table11:EstimatedaveragedailychangeinelectricityusageforcustomersthatinstalledaVSHPwithoutductsealing
Month AllCustomers(n=48) HZ1(n=37)ChangeinkWh*
StatisticalSignificance**
ChangeinkWh*
StatisticalSignificance**
January -7.18 5% -10.01 1%
February -5.37 10% -9.85 1%
March -2.77 NS -8.79 1%
April -0.56 NS -0.96 NS
May -4.20 NS -4.13 NS
June -2.41 NS -0.77 NS
July 0.80 NS 2.54 NS
August 2.51 NS 3.03 NS
September 3.30 NS 3.55 NS
October 0.83 NS 0.10 NS
November -5.50 5% -6.57 5%
December -4.97 10% -7.54 1%
AverageDaily -2.13 NS -3.28 5%
AverageAnnual -776 NS -1,198 5%
Source:AnalysisbyEvergreenEconomicsofdatareceivedfromBPAutilities.*Negativevaluesindicatereductioninelectricityusage;positivevaluesindicateincreaseduseofelectricity.**Thelowerthevalue(i.e.,1%),thegreaterthestatisticalsignificance.“NS”indicatesnotstatisticallysignificantlydifferentfromzero.
Wedofindevidencethatcustomersinheatingzone1didreducetheirelectricityusebyjustover3kWhperday(1,200kWhperyear)afterinstallingaVSHP.SavingsareconcentratedinjusttheheatingmonthsofNovemberthroughMarch.Wedidnotestimateaseparatebillingregressionmodelforcustomersinheatingzones2and3duetothesmallnumberofparticipanthomesinthesezones(11customers).
4.5 DUCTSEALING–SUMMARYOFRESULTSEvergreenanalyzedtheimpactofductsealingforcustomersthatdidnotalsoinstalleitheraVSHPorASHP.Therewere594residentialcustomersinoursamplethatreceivedductsealing(withoutinstallingaVSHPorASHP)throughtheirBPA-affiliatedutility,and238hadsufficientpre-andpost-installationbillingdata(atleast12monthsofeach)tobecategorizedasparticipantsforthe

page20
purposesofmodeling.Table12showsthenumberofparticipantsthatreceivedductsealingbyheatingzone.Participationwasgreatestinheatingzone2.
Table12:Customersthatparticipatedinductsealing,butdidnotinstallaVSHPorASHPbyheatingzone
HeatingZone ParticipantsHeatingZone1 66
HeatingZone2 145
HeatingZone3 27
AllHeatingZones 238Table13showsestimatesofchangeinelectricityuseforallcustomersthatonlyreceivedductsealing.Onaverage,weestimatethatcustomersthatreceivedductsealingreducedtheirelectricityusebynearly7kWhperday(2,531kWhperyear).
Table13:Estimatedaveragedailychangeinelectricityusageforcustomersthatreceivedductsealing,butnotaVSHPorASHP
Month AllCustomers(n=238)ChangeinkWh* StatisticalSignificance**
January -12.18 1%February -8.99 1%
March -8.50 1%
April -10.66 1%
May -5.02 1%June -9.40 1%
July -4.64 1%
August -4.78 1%
September -0.99 NotSigOctober -1.44 NotSig
November -7.14 1%
December -9.47 1%AverageDaily -6.94 1%
AverageAnnual -2,531 1%
Source:AnalysisbyEvergreenEconomicsofdatareceivedfromBPAutilities.*Negativevaluesindicatereductioninelectricityusage;positivevaluesindicateincreaseduseofelectricity.**Thelowerthevalue(i.e.,1%),thegreaterthestatisticalsignificance.“NS”indicatesnotstatisticallysignificantlydifferentfromzero.

page21
Table14showsestimatesofchangesinelectricityusebyheatingzoneforcustomersthatreceivedonlyductsealing.Acrossallthreeheatingzones,weestimatethatcustomersonaveragereducedtheirelectricityusage,withthegreatestreductionoccurringinheatingzone1.Electricitysavingsforcustomersinheatingzone1occurredinallmonthsexceptSeptember,whencustomersactuallyincreasedtheirelectricityuse,andOctober,whentherewasnostatisticallysignificantchangeinuse.Savingstendedtobegreatestinthewintermonths,butcustomersinheatingzone1experiencedtheirgreatestsavingsinJune.Table14:Estimatedaveragedailychangeinelectricityusageforcustomersthatreceived
ductsealing,butnotaVSHPorASHP
Month HZ1(n=66) HZ2(n=145) HZ3(n=27)ChangeinkWh*
StatisticalSignificance**
ChangeinkWh*
StatisticalSignificance**
ChangeinkWh*
StatisticalSignificance**
January -11.06 1% -14.35 1% -2.82 NotSig
February -10.30 1% -9.49 1% -2.43 NotSig
March -13.08 1% -8.06 1% 2.97 NotSig
April -14.18 1% -9.25 1% -4.76 NotSig
May -7.27 1% -4.16 5% -5.30 NotSig
June -17.15 1% -3.44 10% -2.47 NotSig
July -10.59 1% -1.80 NotSig -2.97 NotSig
August -8.01 1% -1.48 NotSig -11.93 1%
September 5.07 5% -0.90 NotSig -12.21 1%
October 3.35 NotSig -2.38 NotSig -5.59 NotSig
November -7.38 1% -6.44 1% -9.48 5%
December -10.06 1% -10.52 1% -3.62 NotSig
AverageDaily -8.39 1% -6.02 1% -5.05 1%
AverageAnnual -3,062 1% -2,198 1% -1,844 1%
Source:AnalysisbyEvergreenEconomicsofdatareceivedfromBPAutilities.*Negativevaluesindicatereductioninelectricityusage;positivevaluesindicateincreaseduseofelectricity.**Thelowerthevalue(i.e.,1%),thegreaterthestatisticalsignificance.“NS”indicatesnotstatisticallysignificantlydifferentfromzero.

page22
Customersinheatingzones2and3alsoexperiencedreductionsinelectricityuse,buttoalesserextentthancustomersinheatingzone1.Acrossallthreeheatingzones,therewaslittle-to-noconsistencyinsavingsbymonth.Forexample,thegreatestreductioninelectricityuseforcustomersinheatingzone3occurredinAugustandSeptember,whilethereisnostatisticalevidencethatcustomersinheatingzone2experiencedanychangeinelectricityuse.

page23
5 DHPCUSTOMERSURVEYRESULTSThissectionpresentsresultsfromtheductlessheatpump(DHP)customersurveyfieldedinFebruary2020.ThesurveywasintendedtosupporttheassessmentofDHPsavingsandbuildsontheguidanceprovidedinthe2018-2019EvaluationPlan.ThesurveywasdistributedtocustomerswhoinstalledDHPstoreplaceelectriczonalheatinginheatingzones2and3.13
Samplesizesarereportedforeachresult,uptoamaximumof131totalresponses.Somequestionswereleftblankorrespondentsweredirectedtoskipcertainquestionsthatdonotapplytothembasedontheirpriorresponses.
5.1 SUMMARYOFRESULTS
PURCHASEMOTIVATIONWhenaskedtopofmindwhytheyboughttheDHP,savingenergy/reducingenergycostswas#1(53%),followedbygettingAC(35%).Whenpromptedwithalistofpotentialbenefits,comfortwasalsoatopreasonforpurchase(73%saiditwasextremelyorveryimportant).
Abouthalf(47%)saidtheyboughttheDHPtoreplaceanoldheatingsystem.Themostcommonlycitedreason(whenpromptedwithalistofpotentialreasons)wasthattheoldsystem’senergycostsweretooexpensive(85%ofthosethatboughttheDHPtoreplaceanoldheatingsystem).
Few(17%)boughttheDHPtoreplaceanoldcoolingsystem.
DHPUSAGEMostrespondents(72%)wereinitiallyinterestedinbuyingaDHPforbothheatingandAC,andanother11percentforjustAC.Only15percentsaidtheywereonlyinterestedinitforheatingwhile35percentofDHPpurchaserswereintendingtoaddcoolingtotheirhome,whichwouldresultinanincreaseincoolingusage.
MostrespondentsusetheirDHPtoheatandcoolthewholehouseormostofthehouse.Thosethatuseitonlyforoneortworoomsmostlyuseitforthelivingroom.
WhenpromptedwithaseriesofquestionsaroundhowtheyhavechangedtheircoolingandheatingsinceinstallingtheDHP,most(77%)saidtheyuseACmorefrequentlyanduseitatalowertemperaturethanbefore(61%).Alowerpercentagehavechangedhowtheyheattheirhome,with48percentheatingmorefrequentlyand37percentheatingatahighertemperature.
OLDSYSTEMUSAGEBeforeinstallingtheDHP,themostcommonheatsourcewaselectricbaseboardheating(56%),followedbywood-burningstove(31%).14Two-thirds(65%)continuedtousetheirolderheatingsystemafterinstallingtheDHP.Wood-burningstove(33%)andelectricbaseboardheating(32%)arethemostcommonlyusedsystemsinconjunctionwiththeDHP.Abouthalfofthoserespondents
13 ThiseffortispartofabroaderanalysisthatEvergreenisconductingforBPAofresidentialHVACmeasuresincludingair-sourceheatpumpconversions,variablespeedheatpumpsconversions,DHPsreplacingelectricforcedairfurnacesinheatingzone3,DHPsreplacingelectriczonalheatinginheatingzones2and3,andprescriptiveductsealinginallheatingzones.EvergreenpreviouslysubmittedresultsfromthebillinganalysisconductedonallprogrammeasuresviamemoinSeptember2019. 14Mostwhohaveawoodstovealsohadanotherheatingsource.Only4percentofsurveyrespondentshadjustawoodstovepriortoinstallingaDHP.

page24
(thatcontinuedtousetheirolderheatingsystem)reportedlyuseitlessthantheyusetheDHP,15percentsaidtheyuseitthesame,and16percentuseitmore.
BeforeinstallingtheDHP,one-thirdofrespondentshadAC.Ofthose,only11percentreportedthattheycontinuetousetheoldersystemsinceinstallingtheDHP.
ACTIONSTAKENHADTHEYNOTBOUGHTADHPNearlyall(82%)surveyrespondentswouldhavecontinuedusingtheiroldheatingsystem,hadtheynotboughtaDHP.
Three-quarterssaidtheywouldhavepurchasedacoolingsystemhadtheynotboughtaDHP,whichimpactsDHPbaselineassumptions.EventhoughmanyaddedcoolingusagebypurchasingaDHP,mostreportedthattheyweregoingtobuysomeothertypeofcoolingsystemhadtheynotboughttheDHP.
CHANGESINBILLSHalfofrespondents(53%)saidtheyhadlowerheatingbillssinceinstallingtheDHP,while25percentsaidtheyexperiencednochangeand22percentsaidtheyhadhigherbills.ChangesincoolingbillsdependedonwhethertherespondenthadpriorACornot.ThosethatdidnothavepriorAChadfairlysimilarresponsesregardingachangeincoolingbillsastheheatingresponses.ThosethatdidnothavepriorACweremuchmorelikelytosaytheircoolingbillswentup(44%).
NON-ENERGYBENEFITSNearlyallDHPpurchasers(92%)indicatedthatyes,theynoticed“anincreaseinoverallcomfort,”and66percentnoticed“anincreaseinsafetycomparedtootherheatingsystemstheyhaveusedinthepastorarecurrentlyusingnow.”15Half(50percent)indicatedtheynoticedanimprovementinairquality.Satisfactionwiththequalityoftheheatingandcoolingishigh—93percentarehighlysatisfiedwiththequalityofcooling,and82percentarehighlysatisfiedwiththequalityofheating.
5.2 BACKGROUNDAllornearlyallrespondinghouseholds:
• HavetheDHPstillinstalled(100%n=128,Q2)• InstalledtheDHPinaprimaryresidence(96%n=128,Q3)• OwnedthehomeinwhichtheDHPwasinstalled(100%n=128,Q4)• UsetheDHPforheating(99%n=128,Q5)• UsetheDHPforairconditioning(98%n=128,Q6)
Thoughonly42respondentsansweredthequestion,justoverhalfofrespondentsreportedhavinganindoorsingleheadDHP(see
15Surveyrespondentswerenotdirectlyaskedtoexplainwhytheyfeltanincreaseinsafety,butonerespondentwroteinafree-responsesectionthattheDHPwas“lesslikelytoburnthehousedown.”

page25
Figure2)(anexamplewasshownonthesurvey).Presumably,thesurveyparticipantsthatdidnotrespond(n=89)werenotsure.

page26
Figure2:Numberofindoorunits(heads)(n=42,Q7)
5.3 DECISIONMAKINGRespondentsweresplitalmost50/50regardingdecision-making(n=126,Q8),with49percentsayingtheydecidedwithotherfamilymemberstobuyaDHP,and50percentsayingtheyweretheprimarydecisionmaker(1%saidtheywerenotinvolvedinthedecision.)
Figure3displaystheresultsofanopen-endedquestion:“Inyourownwords,whatwasyourmainreasonforseekingoutanewsystem?”
Wereportuptotworeasonsperrespondent,categorizingtheverbatimresponses.Morethanhalf(53%)boughttheDHPforenergyefficiencyoreconomicreasons,whileoverone-third(35%)boughtittogetairconditioning(about13%saidbothofthosereasons).
Figure3:Mainreason(s)forseekingoutanewsystem(n=131,Q9,multipleresponsesallowed,open-ended)

page27
Belowareselectverbatimresponsesthatareillustrativeoftheresponsesforthemostcommonlycitedreasons:
Saveenergy/money,moreefficientunit:
• “Ductlessheatpumpsaremoreenergyefficientthanelectricbaseboards.”• “Helpwithmyelectricbill.”• “Highefficiencyforalowcost.”
Fortheairconditioning:
• “ThemainfactorforinstallingtheminisplitsystemwastheAC.Welikedtheheattoo.”• “Wewantedairconditioningforsummer.Ourcondodidnothaveone.Thisseemedtobea
greatoption.”• “WifewantedsomekindofACforthesummer.”
Bothtosaveenergy/efficiencyandfortheairconditioning:
• “WepurchasedthisunitprimarilyforAC;thecostsavingsforheatwasabonus.”• “NeededbetterheatingforhomethantheoldelectricbaseboardIhad.ACwas[an]added
benefit.”• “TosaveonheatingcostinthewinterandprovideACinthesummer.”
Tostop/reduceburningwoodforheat:
• “Moreenergyefficient,tiredofchoppingwood.”• “Tiredofdealingwithawoodstoveasmainheat.Chimneycreosoteissue.Smokebackup
issues.”• “Advancedagecannotcontinuetoheatwithwood”
Respondentswerealsoaskedtoranktheimportanceofeightfactorsinchoosinganewsystem.Thisquestioncontrastswiththepriorquestion,whichwasunprompted,whererespondentsprovidedaverbatimresponseregardingthemainfactor.Thispromptedquestionpresentedalistofpotentialfactorsandascaleofimportance:extremely,very,somewhat,alittle,ornotatallimportant.
Thepromptedresults(Figure4)areconsistentwiththeunpromptedresultspresentedpreviouslywhereenergy/costsavingsandaddingairconditioningweretopmotivationsfortheDHPpurchase.Differencesinresponsesbetweenthetwoquestionsaremainlyaroundcomfort—whererespondentswereprompted,theywereverylikelytosaythatcomfortwasextremelyorveryimportanttotheirpurchasedecision.Whilecomfortwasnotthemaintopofmindpurchasemotivation(savingenergywasthe#1unpromptedreason),itisclearlyanimportantbenefitassociatedwithaddingairconditioningandbeingabletoheatmoreofthehome.

page28
Figure4:Mainreason(s)forseekingoutanewsystem(n=131,Q15)
Overtwo-thirdsofrespondents(72%)initiallylookedatbuyinganewDHPforbothheatingandcooling(seeFigure5).
Figure5:InitialinterestinbuyingDHP–forcooling,heating,orboth(n=123,Q10)
.
Abouthalfofrespondents(47%n=122,Q11)saidtheyboughtaDHPtoreplaceanoldheatingsystem.Fewer(17%n=122,Q13)saidtheyboughtaDHPtoreplaceanoldcoolingsystem.
RespondentswereaskedtoindicateyesornotoasetofactionsthattheywouldhavetakeniftheyhadnotpurchasedaDHP(

page29
Figure6).Mostrespondents(82%)saidtheywouldhavecontinuedtousetheiroldheatingsystem.Many(42%)saidtheywouldbuyawindowairconditioner,while39percentwouldkeepusingtheirexistingcoolingsystem.

page30
Figure6:Whataction(s)wouldhavebeentakenhadtheynotboughtaDHP(nvaries,Q16)
Lookingacrossthecoolingsystemresponses,70percentsaidtheywouldeithercontinuetousetheircurrentcoolingsystemorbuyanewcoolingsystem.
REPLACINGOLDHEATINGSYSTEM(N=57)Thissectionisfocusedonthe47percentofrespondentsthatsaidtheypurchasedaDHPtoreplaceanoldheatingsystem(Q11).
Thissubsetwasaskedaseriesofyes/noquestionsaboutpotentialreasonsthatrespondentscitedforwantingtoreplacetheiroldheatingsystemwithanewDHP(

page31
Figure7).ThemostcommoncitedreasonthatrespondentssaidtheywantedtoreplacetheiroldheatingsystemwithanewDHPwasbecausetheoldsystem’senergycostsweretooexpensive(85%).Thenextmostcommonlycitedreasonwastotakeadvantageoftheutilityrebate(73%),followedbytheoldsystemnotprovidingadequatecomfort(65%).(Seetheopen-endedresponsesbelowFigure7regardingmotivationsforbuyingtheDHPforadditionalreasonsforreplacingtheolderheatingsystem,includingissueswithwoodburningstoves.)

page32
Figure7:Reason(s)forreplacingoldheatingsystem(yes/noquestions-%yesreported,n=57,Q12)
Theverbatimresponsesforrespondentswhochose“other”included:
• “Addvaluetohome”• “Bettersystem(compared)toelectricbaseboard”• “Convenience”• “Didnothaveairconditioning”• “Existingsystemwouldn'tallowair(flow)”• “Helptofilterandcoolduringsmokydays”• “Oldsystemwasold”• “Toolargeofareaforwallheaters(toheat)”• “(Won’tneedto)washfilters”• “Woodheat-timeconsumingandmessy”• “Woodstove”
REPLACINGOLDCOOLINGSYSTEM(N=22)Thissectionisfocusedonthe17percentofrespondentswhosaidtheypurchasedaDHPtoreplaceanoldcoolingsystem(Q13).Similartotheoldheatingsystemsurveyquestions,thissubsetwasaskedaseriesofyes/noquestionsaboutpotentialreasonsthatrespondentssaidtheywantedtoreplacetheiroldcoolingsystemwithanewDHP(

page33
Figure8).ThemostcommonreasonthatrespondentscitedforwantingtoreplacetheiroldcoolingsystemwithanewDHPwastotakeadvantageoftheutilityrebate(64%),followedbytheoldsystemnotprovidingadequatecomfort(56%).Nearlyhalfindicatedthattheoldsystem’senergycostsweretooexpensive(47%).

page34
Figure8:Reason(s)forreplacingoldcoolingsystem(n=22,Q14,multipleresponsesallowed)
Theverbatimresponsesforrespondentswhochose“other”wereasfollows:
• “Addedvaluetohome”• “Evaporatorsdidnotfitwell”• “Replacewindowunits”• “WouldhaveonlyhadwindowAC”
5.4 SYSTEMUSAGE
AREASERVEDBYDHPRespondentsindicatedwhichroomsareservedbytheDHP(Figure9).Themostcommonresponsewasthewholehouse(33%),followedby3to4roomtypes(26%)—mostoftenincludingthekitchen,dining,andlivingroom(s).One-quarter(24%)ofrespondentsreportedlyusetheDHPinonlyoneortworooms,thevastmajorityincludingthelivingroom.

page35
Figure9:Room(s)servedbyDHP(n=127,Q17)
Asmallportion(27%)ofrespondentssaidthattheareathatiscooledintheirhomehasincreased,withamedianincreaseof1,050squarefeet,andfewer(8%)saidtheareathatisheatedhasincreased,withamedianincreaseof400squarefeet(seeTable15).Manyrespondentsthatreportedanincreaseinspacecooledhadpreviouslynotcooledtheirhomeusinganothersystem,whereasrespondentsthatreportedanincreaseinspaceheatedhadalreadybeenheatingtheirhomesusinganothersystem.Thiscouldexplainthelargerincreasesinsquarefootageforcooledspace.
Table15:Increaseinspacecooled(n=113,Q18)andheated(n=110,Q19)sinceinstallingDHP
Utility
%thatIncreasedthespacethatiscooled/heated
AverageSquareFootageIncrease
MedianSquareFootageIncrease
Cooling 27%(n=113) 1,200(n=30) 1,050(n=30)
Heating 8%(n=110) 675(n=9) 400(n=9)
CONTROLSNearlyall(87%)respondentssaidtheyuseonlyaremotecontrolfortheirDHP(Figure10).Asmallfraction(6%)useaprogrammablethermostat,whilefewer(3%)saidtheyusebotharemotecontrolandcontrolsontheunit.Theremainder(“other”inFigure10)usejustthecontrolsontheunit,aremotecontrolwithaprogrammablethermostat,oramanualwall-mountedthermostat.

page36
Figure10:DHPcontrolsinuse(multipleresponsesallowed,n=127,Q20)
Ofthoserespondentsthatcontinuetousetheiroldheatingsystem(s),themostcommonlyusedcontrolsareamanualthermostat,followedbyaprogrammablethermostat(Figure11).Thirteenpercentusethecontrolsontheunit.
Figure11:Oldheatingsystem(stillinuse)controls(multipleresponsesallowed,n=86,Q21)
5.5 SELF-REPORTEDCHANGESINUSAGEANDENERGYBILLSRespondentswereaskedaseriesofyes/noquestionsregardinghowtheyhavechangedthewaytheyheatandcooltheirhomessinceinstallingtheDHP.AsshowninFigure12,themostcommonly

page37
citedchangewastoairconditionroomsmorefrequently(77%),followedbyairconditioningroomsatalowertemperature(61%).Changesinheatingwerereportedlessfrequently;48percentheatroomsmorefrequentlyand37percentsaidtheyheatroomsatahighertemperature.
Figure12:SinceinstallingDHP,percentthatchangedheatingandcoolingusage(yes/noquestions-%yesreported,nvaries,Q24)
AbouthalfofrespondentsreportedthattheirheatingbillswerelowersinceinstallingtheDHP,comparedtoonly24percentthatsaidtheircoolingbillswerelower(Figure13).
Figure13:Self-reportedchangeinenergybillsduringcooler(n=126,Q42)andhotter(n=126,Q43)timesoftheyear
Perceivedchangesinsummercoolingbillsbasedonrespondentself-report(notverifiedbasedonactualbills)dependedonwhetherhouseholdshadairconditioningpriortoinstallingtheDHP(Figure14).HouseholdsthatalreadyhadACweremostlikelytosaytheirsummerbillswentdown

page38
(41%),whilethosethatdidnotpreviouslyhaveACweremostlikelytosaytheirbillswentup(44%).
Figure14:Perceivedchangeinenergybills(self-reported)duringcoolertimes/winter(n=126,Q42/Q43)andhottertimes/summer(nopriorACn=81,priorACn=44,Q34)
Intuitively,householdsthatincreasedthespacecooledinthehottertimesoftheyearweremorelikely(53%)toreporthigherenergybillswhencomparedtothosethatcooledthesameamountofspaceasbeforeDHPinstallation(seeFigure15).

page39
Figure15:Perceivedchangeinenergybills(self-reported)forhouseholdswithnochangeinspacecooled(n=81,Q18)vs.householdsthatincreasedspacecooled(n=29,Q18)during
hottertimesoftheyear(n=110,Q43)
Incontrasttothecoolingresults,forhouseholdsthatincreasedtheirspaceheated,therewasasignificant(64%)reportoflowerenergybills(seeFigure16).Ofthoserespondentswithincreasedspaceanddecreasedenergybills(n=5),fourrespondedthattheyeitherremovedtheiroldheatingsystem,ortheyuseitsignificantlylessthantheDHP(Q31).
Figure16:Self-reportedchangeinenergybillsforhouseholdswithnochangeinspaceheated(n=98,Q19)vs.householdsthatincreasedspaceheated(n=9,Q19)duringcoolertimesoftheyear(n=107,Q42)

page40
USAGEOFPRIORHEATINGSYSTEMRespondentswereaskedaseriesofquestionsabouthowtheyusedtheirheatingsystembeforeandafterinstallingtheDHP.Forthisnextsection,thesurveypromptedrespondentstoconsiderallpriorheatingsourcesastheir“oldheatingsystem.”
First,respondentsindicatedwhattypeofheatingsystem(s)theyusedtoheattheirhomepriortogettingtheDHP(Table16).Most(56%)homesusedelectricbaseboardheating,and31percentusedwood-burningstoves.Respondentsthatselected“Other”wrotein“radiantheating,”“pelletstoves,”and“dieselstoves”aspriorheatingsources,forexample.
Table16:HeatingsystemusedpriortoDHP(n=128,multipleresponsesallowed,Q25)
OldHeatingSystem %ofRespondents
ElectricBaseboardHeating 56%
Wood-BurningStove 31%
ElectricWallFan 29%
ElectricSpaceHeater 26%
GasFireplace 20%
Wood-BurningFireplace 12%
GasFurnaceorBoiler 6%
ElectricFurnace 3%
NoOldSystem 1%
Other 12%
Ifrespondentsusedmorethanoneheatingoption,theyindicatedtheirprimarysource(Table17).Theprimaryheatingsourcewasawood-burningstove(32%),followedbyelectricbaseboardheating(24%).
Table17:PrimaryheatsourcepriortoDHP,ifmultiple(n=80,Q27)
PrimaryHeatSource %ofRespondents
WoodBurningStove 32%
ElectricBaseboard 24%
GasFireplace 17%
ElectricWallFan 13%
Other 13%
Total 100%

page41
Then,respondentswereaskedhowoftentheyusednon-electricheatpriortogettingtheDHP.Fortypercentsaideither“never,”“almostnever,”or“rarely,”while46percentanswered“almostallthetime,”or“mostofthetime.”Fourteenpercentofrespondentsansweredthattheyusednon-electricheat“abouthalfofthetime”(n=126,Q26).
OncetheDHPwasinstalled,77percentofrespondentsansweredthattheDHPisusedtoheattheexactsameroomsoftheirhouseastheydidwiththeiroldheatingsystem(n=124,Q28).
Next,respondentswereaskedabouttheiroldheatingsystemusageafterinstallingtheDHP.Most(65%)respondedthattheycontinuedtouseotherformsofheatinginadditiontotheDHP(Figure17).
Figure17:OldheatingsystemusageafterDHPinstallation(n=126,Q30)
Iftheycontinuedtousetheiroldheatingsystem,respondentswereaskedwhichheatingsystemstheycontinuedtouse(Table18).Wood-burningstovesandelectricbaseboardheatingwereusedmostfrequently,at33percentand32percent,respectively.
65%3%
32% Continued to use other forms ofheating in addition to DHP
Stopped using the old heatingsystem and removed
Stopped using the old heatingsystem but didn't remove

page42
Table18:OtherheatingsystemsusedsinceDHPinstallation
HeatingSystem %ofRespondents
Wood-BurningStove 33%
ElectricBaseboardHeating 32%
GasFireplace 23%
ElectricWallFan 21%
ElectricSpaceHeater 19%
Wood-BurningFireplace 8%
ElectricFurnace 3%
GasFurnaceorBoiler 2%
ElectricHeatPump 1%
Other 10%
Forrespondentsthatcontinuedtouseotherformsofheating,theywereaskedhowoftentheyusedtheiroldheatingsystemincomparisontotheDHP(Table19).MosthomesusetheoldsystemslessthantheDHP(42%significantlyless,and11%slightlyless),and15percentusebothsystemsaboutthesame.
Table19:OldsystemusageincomparisontoDHP(n=103,Q31)
%ofRespondents
SignificantlylessthanDHP 42%
SlightlylessthanDHP 11%
AboutthesameasDHP 15%
SlightlymorethanDHP 4%
SignificantlymorethanDHP 12%
Nooldsystemusage 16%
Total 100%

page43
RespondentswhousetheiroldheatingsystemmorethantheDHPwerethenaskedwhy(open-ended).The29responsesarecategorizedbelow(Figure18).
Figure18:ReasonsforoldheatingsystemusemorethanDHP(n=29,Q32)
Whenaskedabouthowhomesdecideonwhichheatingsystemtouse(open-ended),respondentsgavearangeofanswerscategorizedbelow(Figure19).
Figure19:Howhomesdecidewhichsystemtouse(n=62,Q33)

page44
Belowareselectverbatimresponsesthatareillustrativeofthemostcommonlycitedreasonsfordecidingwhichsystemtouse.
Temperature:
• "IfitisverycoldIusebothsystems."• "OnthecoldestdaystheDHPdoesnotquitekeepthehousetotallycomfortablesowe
supplementitwithwoodheat.”
Spacetobeheated:
• "MostlyuseDHPtoheatspecificrooms.Usegasfireplacetohelpwithlivingroom.”• “TheDHPdoesnotreachallofourbedrooms.”
Enjoyswood:
• "Ilikethewoodheat.”
Whetherornottheyarehome:
• "WemaintainalevelwithDHPthenwarmupwithwoodstovewhenoccupied.”• “BurnwoodwhenI'mhome.Ductlessrunsupstairsduringtheday+night.”
Other:
• “Electricwallcadetteforashorttimetoheatbedroomquicklywithdoorshut.”• “Trytoconsiderenergycosts.”
USAGEOFPRIORCOOLINGSYSTEMRespondentswerealsoaskedaseriesofquestionsabouthowtheyusedtheircoolingsystembeforeandafterinstallingtheDHP.
First,respondentsindicatedwhattypeofcoolingsystem(s)theyusedtoheattheirhomepriortogettingtheDHP(Figure20).Mostrespondents(66%)hadnocoolingsysteminplacepriortoDHPinstallation,and33percentusedroom/windowACunits.

page45
Figure20:CoolingsystemusedpriortoDHPinstallation(n=127,Q34,multipleresponsesallowed)
Next,respondentsthathadacoolingsysteminplacepriortoDHPinstallationwereaskedanumberofquestionstounderstandusageoftheDHPsystemincooling.
WhenrespondentswereaskediftheDHPisusedtocooltheexactsameroomsoftheirhouseastheydidwiththeiroldcoolingsystem,64percentsaidyes(n=55,Q35).Ofthosewhoansweredno,writeinanswersnotedthattheDHPcoolsmorespacesthantheirpriorsystem.
RespondentswerealsoaskedabouttheiroldcoolingusageafterinstallingtheDHP.Most(63%)respondedthattheystoppedusageoftheiroldsystemandremoveditfromtheirhome,whileonly11percentcontinuedtousebothsystems(Figure21).
Figure21:OldcoolingsystemusageafterDHPinstallation(n=51,Q36)
1% 1%
33%
66%
Evaporative cooler
Electric heat pump
Room/window air conditioner
I did not have air conditioning
63%
19%
11%
7%Stopped using the old system andremoved it from my house
Stopped using the old system but didn’t remove it
Continued to use old cooling systemin addition to my ductless heatpump
Don’t know

page46
OfthehomesthatuseboththeiroldcoolingsystemandtheDHP,75percentofrespondentsansweredthattheyusetheiroldsystemsignificantlylessorslightlyless(65%and10%,respectively)thantheDHPforcooling.10percentstatedthattheyusetheiroldsystemmorethantheDHP,and15percentansweredthattheyusebothsystemsaboutthesame(n=11,Q37).
Respondentswereasked(open-ended)howtheydecidewhichairconditioningsystemtouseintheirhome,andtheeightanswerswerecategorizedintotworeasons:temperatureandlocation.Half(52%)ofrespondentsansweredthatthetemperatureoutsideinfluencedtheirdecision,andtheotherhalf(48%)statedthatthespacetobecooledwasanimportantfactor.Examplesofverbatimresponsesarebelow:
Temperature:
• "Whenithits90+outside."• "Whatistheoutsidetemp(erature).”
Spacetobecooled:
• "UseoldsystemACinanotherareaofhome.”• “Ionlycoolupstairsrooms.”
5.6 COMFORT,QUALITY,ANDSATISFACTIONWITHDHPRespondentswereaskedaseriesofquestionsaboutotherpotentialbenefitsassociatedwithinstallingaDHP.Figure22belowshowstheresponsestoaseriesofyes/noquestionsaskingaboutpotentialimprovementsincomfort,safety,andairqualitysinceinstallingtheDHP.Nearlyall(92%)saidtheynoticedanincreaseincomfort.Aroundtwo-thirds(66%)reportednoticinganincreaseinsafetycomparedtootherheatingsystemstheyhaveusedinthepastorareusingnow.
Someverbatimresponsesthatcategorizefeelingsaroundsafetyarelistedbelow:
• “Lessconcernaboutthesafetyaspectsofbaseboardheaters”• “Lesslikelytoburnthehousedown”
Half(50%)noticedanimprovementinairqualityintheirhome.
Figure22:Noticedimprovementsinairquality,comfort,andsafetysinceinstallingDHP(yes/noquestions-%yesreported,nvaries,Q44/45)

page47
RespondentswereaskedtodescribetheircomfortleveloncoldandhotdayscomparedtotheircomfortpriortohavingaDHP.Asshown(Figure23),nearlyallrespondents(93%)saidtheyaremorecomfortableonhotdays,andthree-quarterssaidtheyaremorecomfortableoncolddays.
Figure23:ComfortwithDHPoncold(n=125,Q22)andhot(n=126,Q23)days
RespondentsalsoindicatedhowsatisfiedtheywerewiththequalityoftheDHP’sheatingandcooling(Figure24).Satisfactionlevelsarequitehigh,withsatisfactionofthecoolinghigherthantheheating.
Figure24:SatisfactionwithqualityofheatingandcoolingprovidedbyDHP

page48
AfterbeingpromptedtoidentifyadditionalbenefitsassociatedwiththeDHP,respondentswereasked(open-ended)iftheyhadnoticedanyothereffects(positiveornegative).Figure25categorizesthe44responsesprovided,withblueshadingindicatingapositiveattributeandorangeanegativeattribute.TenpercentofallrespondentsindicatedthattheDHPwasconvenientoreasytouse,while7percentnotedthatcomfortwasincreased(thoughthisquestionwasintendedtoidentifyadditionalbenefitsnotalreadymentioned).FivepercentofrespondentssaidtheDHPofferednoisereduction,while4percentsaidtheDHPwasnoisy.
Figure25:Othereffectsnoticed(positive–blue;negative–orange,n=131,Q46)(open-ended,responsescategorized)
Belowareselectverbatimresponsesthatareillustrativeofthemostcommonlycitedeffects.NotethattheimprovementsinairqualityencompassbothreductioninwoodsmokeinsidethehomeandalsotheabilitytousetheACtofilterthehomeduringfireseason.
Convenience/easeofuse:
• "Remotecontrolaspectisgreat.Quickfilterwashisaplus."• "Welovetheconsistencywhetherhomeornot."
Comfort:
• "Greatercomfortlevelintheopenareasofthemainfloor."• "Moreevenheatdistribution."
Noisereduction:
• "Ilovehowquietitis."• "Itdoesnotmakeasmuchnoise(aspriorunit)."
Noisy:
• "Itwillsometimesmakesometerriblehighpitchbuzzingnoise."
3%
3%
3%
3%
4%
4%
5%
7%
10%
0% 10%
Other dissatisfied
Doesn't work wellin extreme cold
Energy/EconomicEfficiency
AC
Air Quality
Noisy
Noise Reduction
Comfort
Convenience/Easeof Use

page49
• “Thedefrostcycleisrathernoisy.”
Airquality:
• "Duringfireseasonitkeepstheairinmyhousemuchcleaner."• "Stopusingwoodstovehelpedmysinusissues.Myhousedoesnotgetblackfilmbuildupon
windowsfromwoodstove."
AC:
• “Veryniceforcoolinginsummer."• "GreatforAC."
Energy/economicefficiency:
• "Cutbackourbillsduringthewinter."• "Wearejustmorecomfortableknowingwecanhavetheheatonmoreofthetimeandthat
thebillwillbelower."
Doesnotworkwellinextremecold:
• "Whenthetemperaturedropsbelow20,theheatpumpsarenotveryeffective."• “DHPdoesn'tkeepupwhentheoutsidetempsareverylow.Almostneedanalternativefor
thesetimes.”
Otherdissatisfied:
• “Icebuildsuparoundoutsideunitduringwintermonths.”• “Billsarehighernowinsummerbecausewebasicallyhadnocoolingbefore.Higherinthe
winterbecausetheunitisusedtoheatthewholehouse.Beforeweusedheatunitsonlyinroomswewereusing.”
5.7 HOUSEHOLDCHARACTERISTICSThissectionsummarizesthecharacteristicsofhouseholdsanddwellingsthatrespondentsself-reported.(Homeattributeswerenotvalidated.)
• NearlyallDHPsareinstalledinSingleFamilyDetachedHomes(Table20).• MostDHPsareinstalledinhomesbuiltbetween1940and1979(Table21).• 62percentofrespondentshavedoubleortriple-panedwindows(Table25).• Nearlyallhomesreportedatticandwallinsulation,andmorethanthree-quartershave
weather-stripping(Table26).

page50
Table20:Self-reportedtypeofhome(n=128,Q51)
TypeofHome %ofRespondents
SingleFamilyDetached 64%
SingleFamilyAttached 29%
SmallMultifamily(2–4units) 2%
Multifamily(morethan4units) 1%
Manufactured 1%
Other 2%
Total 100%
Table21:Self-reportedageofhome(n=129,Q52)
YearBuilt %ofRespondents
Priorto1920 3%
1920-1939 7%
1940-1959 29%
1960-1979 38%
1980-1999 18%
2001-2019 4%
Total 100%
Table22:Self-reportedsizeofhome(n=129,Q54)
SquareFootage %ofRespondents
0–999 7%
1000–1999 42%
2000–2999 35%
3000–3999 12%
4000+ 2%
Total 100%

page51
Table23:Self-reportedyearsoccupiedhome(n=129,Q53)
YearsOccupied %ofRespondents
Lessthan3years 11%
3–6years 22%
7–10years 6%
10–15years 12%
Morethan15years 50%
Total 100%
Table24:Self-reportedgasserviceinhome(n=128,Q55)
GasType %ofRespondents
Naturalgas 17%
Propaneorotherbottledgas 19%
Nogas 63%
Total 100%
Table25:Self-reporteddoublepaneortriplepanewindowsinhome(n=127,Q56)
%ofAllWindowsinHomeThatAreDoubleorTriplePane
%ofRespondents
0%-24% 5%
25%-49% 3%
50%-74% 8%
75%-99% 17%
100% 62%
Don’tknow 6%
Total 100%

page52
Table26:Self-reportedhomefeatures(n=126,Q57,multiplementionsallowed)
Feature %ofRespondentswithFeature
AtticInsulation 94%
FloorInsulation 41%
WallInsulation 94%
Door/WindowWeather-Stripping 77%
Table27:NumberofpeoplemovedintohomesinceinstallingDHP(n=129,Q47)
NumberofPeopleMovedIn %ofRespondents
0 89%
1–2 7%
3ormore 4%
Total 100%
Table28:NumberofpeoplemovedoutofhomesinceinstallingDHP(n=129,Q48)
NumberofPeopleMovedOut %ofRespondents
0 91%
1–2 7%
3ormore 2%
Total 100%

page53
Table29:Self-reportedhomeimprovementmeasurestaken(nvaries,Q49/50/58)
Improvement %ofRespondents n
Addedsquarefootagepriortoinstallation 2% 128
Replacedoldappliancesafterinstallation 16% 125
Installedsolarpanelsbeforeorafterinstallation 0% 126
5.8 COMPARINGSURVEYRESPONSESTOENERGYUSEEvergreencomparedparticipants’surveyresponsestotheirchangeinelectricityuseafterinstallingtheDHP.16ThegoalofthiscomparativeanalysiswastodetermineiftherearecharacteristicsoftheparticipantortheirhomethathelpexplainwhysomecustomersthatinstallaDHPreducetheirelectricityconsumption,whileelectricityuseforotherseitherdoesnotchangeoractuallyincreases.Weusedthepre-installationandpost-installationVBDDmodelsforeachcustomertocomputethreemeasuresofchangeinelectricityuseintheyearaftertheDHPwasinstalled:
1. Anytime–AveragedailychangeinkWhinyearafterinstallingDHP2. Winter–AveragedailychangeinkWhduringthewintermonths(December,January,
February)inyearafterinstallingDHP3. Summer–AveragedailychangeinkWhduringthesummermonths(June,July,August)in
yearafterinstallingDHP
Thenumberofcustomerssurveyedwasrelativelysmall,andanydifferencesinelectricityusebetweensubgroupsofcustomerswouldneedtobepronouncedtobegreaterthanthesamplingerror.Formostsurveyquestions,wefoundnostatisticallysignificantrelationshipbetweencustomers’responsesandtheirchangeinelectricityuseafterinstallingaDHP.Insomeinstances,aswedescribebelow,thelackofstatisticalsignificanceisanimportantfinding.TherewerealsoasmallnumberofsurveyquestionsthatwerestatisticallysignificantandthathelpedexplainwhysomecustomersdecreasedelectricityconsumptionwhileothersincreasedtheirelectricityconsumptionafterinstallingaDHP.
Theremainderofthissectiondescribeskeyfindingsrelatedtothefollowingcharacteristics:
5.8.1 STATISTICALLYSIGNIFICANTRESULTS1. Woodandwoodpellets–Customersthatheatedtheirhomewithwoodorwoodpellets
(solelyorincombinationwithotherformsofheating)priortoinstallingaDHPincreasedtheirelectricityusageafterinstallingaDHP.
2. Gasservice-a. Propaneorotherbottledgasservice–Customersthathavepropaneorother
bottledgasservicedeliveredtotheirhomeincreasedtheirelectricityusageafterinstallingaDHP.
b. Naturalgasservice–CustomersthathavenaturalgasservicetotheirhomedecreasedtheirelectricityusageafterinstallingaDHP.
16 Changeinelectricityusagewascomputedastheweathernormalizeddifferenceinaveragedailyusage,measuredinkWh,betweenthe12monthspriortoinstallingtheDHPandthe12monthsafterinstallation.

page54
3. Perceivedchangeinenergybills-Customerswereconsistentinhowtheyperceivedtheirelectricitybillchangedduringthewinterandhowtheiractualuseofelectricityactuallychanged.Forthesummermonths,wedidnotfindanyrelationshipbetweenelectricityusageandperceptionsofelectricityusage.
5.8.2 RESULTSTHATWERENOTSTATISTICALLYSIGNIFICANT
4. Resultsthatwerenotstatisticallysignificant-CustomersthatdidnothavecoolingbeforeaddingaDHPdidnotincreasetheirsummertimeelectricityuseafterinstallingaDHP.WealsofoundthattherewasnotacleardistinctionbetweenthenumberofindoorDHPheadsandthechangeinelectricityusageafterinstallingtheDHP.WealsofoundnodifferenceinelectricitysavingsbetweencustomersthatcontinuedtousetheiroldheatingsystemafterinstallingaDHPandcustomersthatstoppedusingtheiroldheatingsystem.
CUSTOMERSTHATHEATEDWITHWOODPRIORTOINSTALLINGDHPSurveyrespondentswereprovidedwithalistofhomeheatingequipmentandaskedtoindicatewhichequipmenttheyusedpriortoinstallingtheDHP.Eachtypeofequipmentinthelistincludedtheoperatingfuel(electric,gas,wood).Respondentswereaskedto“checkallthatapply”andwereprovidedwithspacetowriteinanyotherheatingequipmentnotonthelist.Mostsurveyrespondentsindicatedthattheyusedtwoormoretypesofheatingequipment.
Evergreenidentifiedallrespondentsthatindicatedthattheyheatedwithwoodorwoodpellet(eitherastheirsolesourceofheatorincombinationwithanothersource)andcomparedtheirchangeinelectricityusetorespondentsthatdidnotindicatetheyheatedwithwoodorwoodpelletspriortoinstallingtheDHP.Table30showstheaveragechangeinelectricityuseforsurveyrespondentsthatreportedheatingwithwoodorwoodpelletspriortoinstallingaDHPandthosethatreportedtheydidnot.
Table30:Averagedailychangeinelectricityusagebythosewhoheatedwithwoodorwoodpelletsvs.thosewhodidnot
DidyouusewoodorpellettoheatyourhomepriortoinstallingDHP?
Count TimeofYear
MeanChangeinDailykWh
StandardError
Yes–IDidHeatwithWoodorWoodPellets 55
Anytime 1.45 1.77
Winter 5.70 3.54
No–IDidNotHeatwithWoodorWoodPellets 76
Anytime -5.03 1.53
Winter -9.90 2.82Notsurprisingly,customersthatreportedheatingwithwoodorwoodpelletsincreasedtheirelectricityusageafterinstallingtheDHP.Despitethefactthatallbutoneofthesecustomersreportedkeepingtheirwood/pelletstoveorfireplace,itisclearthattheconvenienceofaDHP—relativetotheoperationandmaintenanceofawood/pelletstoveorfireplace—ledthesecustomerstorelylessonwoodtoheattheirhomeandmoreonelectricity.Infact,64percentofcustomersthat

page55
heatedwithwoodorwoodpelletsreportedusingtheiroldsystemlessornotatallafterinstallingtheDHP.
Table31showsthedifferenceinmeandailyelectricityusagebetweencustomersthatheatedwithwoodandthosethatdidnot.Weestimatedthatcustomersthatdidnotheatwithwoodorwoodpelletssavedonaverage6.6kWhmoreperdayintheyearafterinstallingtheDHPand15.6kWhmoreperdayduringthewinter.Table31alsoshowsthelowerandupperboundsofthe90percentconfidenceintervalfortheactualdifferenceinmeans,whichrangesfrom8.2kWhperdaytoasmuchas23.0kWhperdayduringthewintermonths.
Table31:DifferenceinmeansbetweencustomersthatheatedwithwoodpriortoinstallingaDHPandhomesthatdidnot,90%confidenceinterval
TimeofYear DifferenceinMeans*
StandardErrorofDifference
LowerBound90%CI
UpperBound90%CI
Anytime 6.5 2.35 2.6 10.4
Winter(Dec,Jan,Feb) 15.6 4.48 8.2 23.0
*CalculatedasabsolutevalueofdifferenceinMeanChangeinDailykWhshowninTable30.
ThedifferenceinelectricityusebetweencustomersthatheatedwithwoodandcustomersthatdidnotnarrowedafterinstallingaDHP.
PriortoDHPinstallation,customersthatheatedwithwoodorwoodpellets(eitherastheirsolesourceofheatorincombinationwithanothersource)usedonaverage66kWhperdayduringthewintermonths.Customersthatdidnotheatwithwoodused88kWhperdayonaverage.
AfterinstallationofaDHP,averagedailyelectricityuseduringthewinterincreasedto72kWhforcustomersthatheatedwithwood(adifferenceof6kWhperday,whileitdecreasedto78kWhforcustomersthatdidnotheatwithwood(adifferenceof10kWhperday).
IMPACTOFGASSERVICEThenextsignificantsurveyresultofnoteistherelationshipbetweenresidentialgasserviceandthechangeinelectricityconsumptionafterinstallingaDHP.Respondentswereaskediftheyhadnaturalgasservicetotheirhome,hadpropaneorotherbottledgas,orhadnogasservice.Table32showsthenumberofrespondentsbyresponseandaveragedropindailyelectricityusageduringwintermonths.Mostrespondents(82)didnothaveanygasserviceand,whilenotstatisticallysignificantlydifferentfromzero,theaveragedropindailyelectricityuseforthesesampledhomeswasabout3.7kWh.

page56
Table32:Averagechangeinelectricityuseduringwintermonthsbyparticipantswithandwithoutgasservice,90%confidenceinterval
ResponsefromProgramParticipant
SampleSize
MeanChangeinDailykWh*
StandardError
LowerBound
UpperBound
NoGasService 82 -3.67 2.99 -1.31 8.65
NaturalGasService(1) 20 -15.42 3.75 8.95 21.88
PropaneorOtherBottledGas(2) 26 9.88 4.66 -1.93 -17.83
1.StatisticallysignificantreductioninaveragedailykWhduringwinter.2.StatisticallysignificantincreaseinaveragedailykWhduringwinter.*Wintermonths(Dec,Jan,Feb)only.
Theresultsforrespondentswithgasserviceareparticularlyinterestingand,atleastonthesurface,seemcontradictory.Participantswithnaturalgasservicedecreasedtheirelectricityuseonaverageby15.4kWhperdayduringthewinter.Thisdropishighlystatisticallysignificant:the90percentconfidenceintervalfortheactualdropinelectricityuserangedfromabout9kWhtonearly22kWhperday.Incomparison,participantswithpropane(orotherbottledgas)serviceincreasedtheirelectricityusebynearly10kWhperday(90percentconfidenceintervalforactualincreaserangesfromabout2kWhtonearly18kWhperday).
Sowhydidparticipantswithnaturalgassubstantiallyreducetheirelectricityusage,whileparticipantswithpropaneincreasedtheirusage?OurassumptionwasthatthedifferencewasduetocustomerswithpropaneservicealsoheatingwithwoodorwoodpelletspriortoinstallingaDHP.Wedidfindthatalargerproportionofhomeswithpropanealsoheatedwithwoodorwoodpelletsthandidhomeswithnaturalgas(45%versus15%).However,evenwhenwerecomputethechangeinelectricityusageafterfirstremovingfromtheanalysiscustomersthatheatwithwoodorwoodpellets,theresultsdonotmateriallychange.17Thosewithnaturalgasservicedecreasedtheirelectricityuse,andcustomerswithpropaneincreasedtheirusage.CustomerswithnaturalgasservicedidusemoreelectricitypriortoinstallingaDHPthandidcustomerswithpropaneservice(87kWhversus75kWhduringthewintermonths).TherewasnodiscernabledifferencebetweenthetwogroupsofcustomerswithrespecttotheirresponsesregardinghowtheyheatedtheirhomespriortoinstallingtheDHP.Nearlyallcustomersindicatedthattheyheatedwithelectricbaseboards,wallfans,andspaceheatersinadditiontootherformsofheatingsuchasagasfireplaceorwood-burningstove.
CHANGEINENERGYBILLS–PERCEPTIONVERSUSREALITYThesurveyalsoaskedprogramparticipantshowtheirenergybillschangedduringcoolerandhottertimesoftheyearafterinstallingtheDHP.Respondentswereprovidedwithfiveoptionsrangingfrom“Muchlowerenergybill”to“Muchhigherenergybill.”Table33showsthenumberofrespondentsthatchoseeachoptionandtheaveragedailydropinkWhbasedonouranalysisofthe
17Forcustomerswithnaturalgasservice,changeindailyelectricityusagegoesfrom-15.42kWhto-16.40kWh,andforcustomerswithpropaneorotherbottledgas,changeindailyelectricityusagegoesfrom9.88kWhto-9.22kWh.Theprecisionoftheestimatesalsodoesnotmateriallychange.Forcustomerswithoutanygasservice,estimatedelectricitysavingsincreasedto12.3kWhperdayduringthewinterandishighlystatisticallysignificantwhenexcludingcustomersthatheatedwithwood.

page57
respondents’actualbillingdata.Theresultsshowthatwithrespecttowintermonths,respondentsonaveragewereabletoaccuratelydetermineiftheirenergybillschanged,thedirectiontheirbillchanged(upordown),andthemagnitudeofthechange.
Table33:Sinceinstallingtheductlessheatpump,howhaveyourenergybillschangedduringcoolertimesoftheyear?90%confidenceinterval
ResponsefromProgramParticipant
SampleSize
MeanChangeinDailykWh*
StandardError
LowerBound
UpperBound
1-Muchlowerenergybill(1) 29 -10.70 4.57 2.94 18.46
2-Slightlylowerenergybill 37 -4.37 3.11 -0.88 9.62
3-Aboutthesame 31 -2.25 5.45 -6.99 11.49
4-Slightlyhigherenergybill(2) 18 7.42 4.22 -14.73 -0.11
5-Muchhigherenergybill 11 9.97 9.48 -26.99 7.051.StatisticallysignificantreductioninaveragedailykWhduringwinter.2.StatisticallysignificantincreaseinaveragedailykWhduringwinter.*Wintermonths(Dec,Jan,Feb)only.
Withtherelativelysmallnumberofresponsesperoption(rangingfrom11for“Muchhigherenergybill”to37for“Slightlylowerenergybill”),theresultsareonlystatisticallysignificantforrespondentsthatreportedMuchlowerenergybillorreportedSlightlyhigherenergybill.Nevertheless,theresultsshowninTable33indicatethat,atleastduringtheheatingseason,participantsgenerallyunderstoodtheimpactontheirenergybills.
Table34showsthesameinformation,butforhottertimesoftheyear.Programparticipantstendtousemuchlesselectricityduringthesummermonthsastheydointhewinter,whichmayexplainwhyrespondentsweregenerallynotabletodeterminethedirectionormagnitudeofchangeintheirenergyuseafterinstallingaDHP.Noneoftheresultswerestatisticallysignificant.
Table34:Sinceinstallingtheductlessheatpump,howhaveyourenergybillschangedduringhottertimesoftheyear?90%confidenceinterval
ResponsefromProgramParticipant
SampleSize
MeanChangeinDailykWh*
StandardError
LowerBound
UpperBound
1-Muchlowerenergybill 15 2.70 3.67 -9.13 3.73
2-Slightlylowerenergybill 17 -3.43 2.69 -1.24 8.11
3-Aboutthesame 46 0.11 1.31 -2.32 2.09
4-Slightlyhigherenergybill 39 -1.19 1.35 -1.08 3.46
5-Muchhigherenergybill 9 -2.89 4.47 -5.30 11.08*Summermonths(June,July,August)only.

page58
CHARACTERISTICSTHATWERENOTSTATISTICALLYSIGNIFICANTEquallyimportantaresomeoftheresultsthatwerenotstatisticallysignificant.WefoundthatcustomersthatdidnothavecoolingbeforeaddingaDHPdidnotincreasetheirsummertimeelectricityuseafterinstallingaDHP.ThisfindingsuggeststhatDHPsdonotaddtosummertimeloadsinheatingzones2and3.WealsofoundthatthereisnotacleardistinctionbetweenthenumberofindoorDHPheadsandthechangeinelectricityusageafterinstallingtheDHP.Mostcustomers(89)reportedinstallingasingleindoorhead,while23reportedinstallingtwoheads,and12reportedinstallingthreeorfourDHPheads.
WealsofoundnodifferenceinelectricitysavingsbetweencustomersthatcontinuedtousetheiroldheatingsystemafterinstallingaDHPandcustomersthatstoppedusingtheiroldheatingsystem.Ofthe44customersthatreportedthattheystoppedusingtheiroldheatingequipment,fourindicatedthattheoldequipmentwasremovedfromtheirhome.Onaverage,thesecustomersreducedtheirdailyelectricityusageby10.6kWh,which,thoughseeminglysubstantial,isnotstatisticallysignificantlydifferentfromparticipantsthatstoppedusing,butdidnotremove,theiroldheatingequipment.

page59
6 APPENDIXA:MODELINGRESULTSFROMPOST-ONLYBILLINGREGRESSIONS
Table35throughTable42showtheestimatedcoefficientsandstandarderrorsforeachregressionmodel,aswellasthenumberofparticipants,samplesize,adjustedR2andF-statistic.
Table35:ModelingresultsforDHPreplacingzonalheating
Variable HeatingZones2&3 HeatingZone2 HeatingZone3
Coefficient Std.Error Coefficient Std.Error Coefficient Std.Error
Intercept 3.818 0.538 2.319 0.712 5.858 0.846CDD 0.398 0.094 0.479 0.121 0.318 0.155HDD 0.386 0.022 0.467 0.031 0.282 0.033Pre-kWh*Jan 0.637 0.008 0.641 0.012 0.633 0.012Pre-kWh*Feb 0.780 0.010 0.776 0.015 0.784 0.015Pre-kWh*Mar 0.883 0.013 0.889 0.017 0.876 0.018Pre-kWh*Apr 0.811 0.016 0.805 0.022 0.815 0.024Pre-kWh*May 0.786 0.021 0.785 0.028 0.783 0.032Pre-kWh*Jun 0.820 0.023 0.840 0.031 0.788 0.036Pre-kWh*Jul 0.873 0.025 0.904 0.032 0.825 0.039Pre-kWh*Aug 0.849 0.023 0.860 0.031 0.827 0.036Pre-kWh*Sep 0.811 0.022 0.817 0.030 0.796 0.032Pre-kWh*Oct 0.832 0.017 0.831 0.024 0.830 0.025Pre-kWh*Nov 0.865 0.012 0.849 0.017 0.883 0.018Pre-kWh*Dec 0.692 0.008 0.676 0.012 0.709 0.011Part*Pre-kWh*Jan -0.020 0.011 -0.027 0.015 -0.010 0.015Part*Pre-kWh*Feb -0.024 0.013 -0.046 0.018 0.005 0.019Part*Pre-kWh*Mar -0.074 0.016 -0.101 0.023 -0.039 0.024Part*Pre-kWh*Apr -0.070 0.021 -0.107 0.028 -0.021 0.030Part*Pre-kWh*May -0.060 0.027 -0.051 0.036 -0.071 0.040Part*Pre-kWh*Jun -0.071 0.029 -0.078 0.039 -0.062 0.045Part*Pre-kWh*Jul -0.072 0.029 -0.073 0.038 -0.075 0.044Part*Pre-kWh*Aug -0.022 0.029 -0.007 0.039 -0.043 0.043Part*Pre-kWh*Sep -0.024 0.028 0.006 0.039 -0.053 0.040Part*Pre-kWh*Oct -0.091 0.022 -0.092 0.030 -0.083 0.031Part*Pre-kWh*Nov -0.090 0.015 -0.069 0.021 -0.107 0.022Part*Pre-kWh*Dec -0.036 0.010 -0.022 0.014 -0.045 0.014Participants 450 256 194SampleSize 12,472 6,970 5,502AdjustedR-Square 0.73 0.73 0.74F-Statistic 1,329 716 609

page60
Table36:ModelingresultsforDHPreplacingelectricforced-airfurnace
Variable HeatingZones3
Coefficient Std.Error
Intercept 3.222 2.371
CDD 1.017 0.421
HDD 0.782 0.086
Pre-kWh*Jan 0.564 0.029
Pre-kWh*Feb 0.635 0.036
Pre-kWh*Mar 0.706 0.045
Pre-kWh*Apr 0.629 0.060
Pre-kWh*May 0.679 0.094
Pre-kWh*Jun 0.741 0.115
Pre-kWh*Jul 0.731 0.123
Pre-kWh*Aug 0.756 0.113
Pre-kWh*Sep 0.726 0.091
Pre-kWh*Oct 0.649 0.060
Pre-kWh*Nov 0.657 0.042
Pre-kWh*Dec 0.518 0.027
Part*Pre-kWh*Jan -0.098 0.037
Part*Pre-kWh*Feb -0.080 0.044
Part*Pre-kWh*Mar -0.150 0.058
Part*Pre-kWh*Apr -0.093 0.078
Part*Pre-kWh*May -0.103 0.115
Part*Pre-kWh*Jun -0.031 0.142
Part*Pre-kWh*Jul -0.104 0.128
Part*Pre-kWh*Aug -0.081 0.126
Part*Pre-kWh*Sep -0.114 0.109
Part*Pre-kWh*Oct -0.115 0.077
Part*Pre-kWh*Nov -0.071 0.055
Part*Pre-kWh*Dec -0.067 0.033
Participants 39
SampleSize 1,036
AdjustedR-Square 0.67
F-Statistic 82
page61
Table37:ModelingresultsforVSHPwithductsealing
Variable HeatingZones1&2 Coefficient Std.Error
Intercept -1.721 2.768CDD 0.964 0.505HDD 1.035 0.136Pre-kWh*Jan 0.538 0.035Pre-kWh*Feb 0.627 0.045Pre-kWh*Mar 0.750 0.053Pre-kWh*Apr 0.693 0.065Pre-kWh*May 0.810 0.092Pre-kWh*Jun 0.833 0.107Pre-kWh*Jul 0.898 0.110Pre-kWh*Aug 0.949 0.097Pre-kWh*Sep 0.868 0.087Pre-kWh*Oct 0.742 0.069Pre-kWh*Nov 0.779 0.053Pre-kWh*Dec 0.563 0.034Part*Pre-kWh*Jan -0.188 0.041Part*Pre-kWh*Feb -0.260 0.054Part*Pre-kWh*Mar -0.261 0.067Part*Pre-kWh*Apr -0.261 0.085Part*Pre-kWh*May -0.313 0.115Part*Pre-kWh*Jun -0.156 0.131Part*Pre-kWh*Jul -0.184 0.124Part*Pre-kWh*Aug -0.135 0.113Part*Pre-kWh*Sep -0.284 0.112Part*Pre-kWh*Oct -0.334 0.087Part*Pre-kWh*Nov -0.309 0.065Part*Pre-kWh*Dec -0.220 0.036Participants 22SampleSize 616AdjustedR-Square 0.71F-Statistic 60

page62
Table38:ModelingresultsforVSHPwithoutductsealing
Variable AllHeatingZones HeatingZone1 HeatingZone2&3 Coefficient Std.Error Coefficient Std.Error Coefficient Std.Error
Intercept -2.380 1.598 3.056 1.682 -8.931 4.309
CDD 0.606 0.232 0.230 0.242 1.543 0.685
HDD 1.024 0.085 0.685 0.092 1.693 0.185
Pre-kWh*Jan 0.520 0.027 0.495 0.030 0.493 0.053
Pre-kWh*Feb 0.577 0.035 0.584 0.040 0.500 0.060
Pre-kWh*Mar 0.656 0.040 0.706 0.050 0.516 0.062
Pre-kWh*Apr 0.695 0.047 0.674 0.053 0.632 0.085
Pre-kWh*May 0.840 0.049 0.785 0.051 0.857 0.118
Pre-kWh*Jun 0.937 0.048 0.886 0.049 0.946 0.131
Pre-kWh*Jul 0.946 0.050 0.897 0.051 1.078 0.135
Pre-kWh*Aug 0.860 0.050 0.805 0.049 1.004 0.167
Pre-kWh*Sep 0.854 0.062 0.791 0.063 0.842 0.154
Pre-kWh*Oct 0.723 0.052 0.732 0.054 0.593 0.119
Pre-kWh*Nov 0.675 0.041 0.683 0.045 0.641 0.080
Pre-kWh*Dec 0.504 0.029 0.534 0.032 0.437 0.056
Part*Pre-kWh*Jan -0.071 0.030 -0.105 0.035 -0.012 0.051
Part*Pre-kWh*Feb -0.069 0.037 -0.139 0.044 0.032 0.059
Part*Pre-kWh*Mar -0.045 0.048 -0.164 0.060 0.114 0.072
Part*Pre-kWh*Apr -0.011 0.060 -0.021 0.068 0.021 0.104
Part*Pre-kWh*May -0.094 0.062 -0.091 0.065 -0.045 0.136
Part*Pre-kWh*Jun -0.054 0.060 -0.017 0.061 -0.229 0.151
Part*Pre-kWh*Jul 0.018 0.059 0.054 0.059 -0.360 0.179
Part*Pre-kWh*Aug 0.059 0.061 0.067 0.060 -0.114 0.229
Part*Pre-kWh*Sep 0.095 0.078 0.100 0.080 0.026 0.191
Part*Pre-kWh*Oct 0.020 0.065 0.002 0.068 0.036 0.144
Part*Pre-kWh*Nov -0.095 0.046 -0.118 0.050 -0.074 0.091
Part*Pre-kWh*Dec -0.055 0.029 -0.087 0.032 -0.006 0.055
Participants 48 37 11
SampleSize 1,320 1,014 306
AdjustedR-Square 0.70 0.70 0.80
F-Statistic 118 80 49

page63
Table39:ModelingresultsforASHPwithductsealing
Variable HeatingZones1&2 HeatingZone2 Coefficient Std.Error Coefficient Std.Error
Intercept 2.340 2.916 3.854 3.213CDD 1.414 0.478 1.300 0.521HDD 0.945 0.135 0.884 0.146Pre-kWh*Jan 0.545 0.035 0.559 0.036Pre-kWh*Feb 0.638 0.045 0.651 0.047Pre-kWh*Mar 0.822 0.054 0.829 0.056Pre-kWh*Apr 0.707 0.072 0.710 0.074Pre-kWh*May 0.736 0.094 0.719 0.098Pre-kWh*Jun 0.746 0.105 0.724 0.110Pre-kWh*Jul 0.693 0.120 0.688 0.126Pre-kWh*Aug 0.708 0.116 0.695 0.120Pre-kWh*Sep 0.712 0.105 0.694 0.109Pre-kWh*Oct 0.698 0.077 0.696 0.080Pre-kWh*Nov 0.678 0.055 0.686 0.057Pre-kWh*Dec 0.528 0.037 0.544 0.038Part*Pre-kWh*Jan -0.153 0.041 -0.165 0.042Part*Pre-kWh*Feb -0.220 0.050 -0.234 0.052Part*Pre-kWh*Mar -0.265 0.068 -0.269 0.070Part*Pre-kWh*Apr -0.152 0.090 -0.159 0.093Part*Pre-kWh*May 0.019 0.116 0.017 0.120Part*Pre-kWh*Jun 0.057 0.129 0.058 0.133Part*Pre-kWh*Jul 0.015 0.133 0.015 0.138Part*Pre-kWh*Aug 0.023 0.129 0.024 0.134Part*Pre-kWh*Sep 0.019 0.125 0.023 0.129Part*Pre-kWh*Oct -0.040 0.096 -0.041 0.099Part*Pre-kWh*Nov -0.104 0.066 -0.112 0.069Part*Pre-kWh*Dec -0.124 0.039 -0.134 0.041Participants 35 32SampleSize 1,002 934AdjustedR-Square 0.58 0.58F-Statistic 54 50

page64
Table40:ModelingresultsforASHPwithoutductsealing
Variable AllHeatingZones HeatingZone1 HeatingZone2&3 Coefficient Std.Error Coefficient Std.Error Coefficient Std.Error
Intercept 4.120 1.013 6.263 1.034 10.813 3.417CDD 0.323 0.142 0.221 0.137 0.142 0.672HDD 0.290 0.048 0.469 0.050 -0.273 0.137Pre-kWh*Jan 0.610 0.013 0.518 0.014 0.772 0.032Pre-kWh*Feb 0.799 0.017 0.682 0.018 0.982 0.041Pre-kWh*Mar 0.955 0.023 0.794 0.024 1.186 0.052Pre-kWh*Apr 0.900 0.028 0.741 0.030 1.107 0.067Pre-kWh*May 0.852 0.033 0.815 0.034 0.713 0.090Pre-kWh*Jun 0.851 0.032 0.820 0.031 0.681 0.110Pre-kWh*Jul 0.880 0.032 0.866 0.030 0.727 0.126Pre-kWh*Aug 0.831 0.032 0.800 0.030 0.742 0.122Pre-kWh*Sep 0.847 0.034 0.782 0.033 0.800 0.106Pre-kWh*Oct 0.941 0.028 0.829 0.030 1.001 0.063Pre-kWh*Nov 0.935 0.019 0.795 0.020 1.156 0.047Pre-kWh*Dec 0.705 0.013 0.587 0.013 0.954 0.032Part*Pre-kWh*Jan -0.140 0.016 -0.164 0.016 -0.069 0.038Part*Pre-kWh*Feb -0.219 0.020 -0.255 0.021 -0.099 0.048Part*Pre-kWh*Mar -0.278 0.029 -0.293 0.031 -0.254 0.065Part*Pre-kWh*Apr -0.224 0.037 -0.179 0.039 -0.315 0.084Part*Pre-kWh*May -0.089 0.042 -0.090 0.042 -0.029 0.109Part*Pre-kWh*Jun -0.129 0.040 -0.154 0.038 0.086 0.134Part*Pre-kWh*Jul -0.160 0.035 -0.187 0.033 0.090 0.130Part*Pre-kWh*Aug -0.132 0.037 -0.157 0.035 0.108 0.136Part*Pre-kWh*Sep -0.095 0.043 -0.099 0.041 -0.044 0.128Part*Pre-kWh*Oct -0.250 0.035 -0.243 0.037 -0.217 0.081Part*Pre-kWh*Nov -0.302 0.023 -0.280 0.023 -0.302 0.059Part*Pre-kWh*Dec -0.185 0.014 -0.174 0.014 -0.217 0.036Participants 176 147 29SampleSize 5,046 4,286 760AdjustedR-Square 0.68 0.64 0.79F-Statistic 418 299 114

page65
Table41:Modelingresultsforductsealing(andnoothermeasures)
Variable AllHeatingZones
Coefficient Std.Error
Intercept 2.296 0.859CDD 0.350 0.142HDD 0.614 0.039Pre-kWh*Jan 0.561 0.011Pre-kWh*Feb 0.691 0.015Pre-kWh*Mar 0.836 0.019Pre-kWh*Apr 0.822 0.023Pre-kWh*May 0.842 0.029Pre-kWh*Jun 0.884 0.031Pre-kWh*Jul 0.935 0.033Pre-kWh*Aug 0.904 0.030Pre-kWh*Sep 0.821 0.030Pre-kWh*Oct 0.778 0.024Pre-kWh*Nov 0.802 0.017Pre-kWh*Dec 0.616 0.011Part*Pre-kWh*Jan -0.107 0.013Part*Pre-kWh*Feb -0.105 0.018Part*Pre-kWh*Mar -0.136 0.023Part*Pre-kWh*Apr -0.213 0.029Part*Pre-kWh*May -0.128 0.037Part*Pre-kWh*Jun -0.253 0.037Part*Pre-kWh*Jul -0.122 0.038Part*Pre-kWh*Aug -0.126 0.035Part*Pre-kWh*Sep -0.027 0.037Part*Pre-kWh*Oct -0.032 0.031Part*Pre-kWh*Nov -0.115 0.022Part*Pre-kWh*Dec -0.090 0.012Participants 238SampleSize 6,570AdjustedR-Square 0.71F-Statistic 614

page66
Table42:Modelingresultsforductsealing(andnoothermeasures)
Variable HeatingZones2&3 HeatingZone2 HeatingZone3
Coefficient Std.Error Coefficient Std.Error Coefficient Std.Error
Intercept 6.413 1.396 -0.033 1.200 4.393 2.836
CDD 0.039 0.225 0.388 0.191 1.040 0.528
HDD 0.699 0.071 0.614 0.054 0.718 0.115
Pre-kWh*Jan 0.462 0.021 0.595 0.013 0.519 0.043
Pre-kWh*Feb 0.601 0.029 0.722 0.018 0.583 0.057
Pre-kWh*Mar 0.702 0.036 0.881 0.022 0.724 0.069
Pre-kWh*Apr 0.704 0.044 0.868 0.028 0.680 0.087
Pre-kWh*May 0.797 0.048 0.874 0.037 0.702 0.117
Pre-kWh*Jun 0.822 0.047 0.935 0.041 0.697 0.130
Pre-kWh*Jul 0.893 0.052 0.989 0.043 0.585 0.189
Pre-kWh*Aug 0.882 0.046 0.937 0.040 0.713 0.135
Pre-kWh*Sep 0.740 0.051 0.864 0.038 0.731 0.116
Pre-kWh*Oct 0.638 0.043 0.830 0.029 0.697 0.091
Pre-kWh*Nov 0.695 0.033 0.841 0.021 0.704 0.063
Pre-kWh*Dec 0.494 0.020 0.675 0.014 0.466 0.038
Part*Pre-kWh*Jan -0.102 0.025 -0.119 0.016 -0.032 0.053
Part*Pre-kWh*Feb -0.128 0.033 -0.104 0.022 -0.036 0.066
Part*Pre-kWh*Mar -0.227 0.044 -0.120 0.028 0.057 0.086
Part*Pre-kWh*Apr -0.305 0.053 -0.175 0.036 -0.113 0.110
Part*Pre-kWh*May -0.184 0.063 -0.103 0.047 -0.173 0.159
Part*Pre-kWh*Jun -0.405 0.054 -0.094 0.051 -0.098 0.195
Part*Pre-kWh*Jul -0.250 0.058 -0.048 0.048 -0.119 0.213
Part*Pre-kWh*Aug -0.183 0.054 -0.040 0.047 -0.384 0.132
Part*Pre-kWh*Sep 0.130 0.065 -0.024 0.047 -0.376 0.123
Part*Pre-kWh*Oct 0.071 0.056 -0.053 0.038 -0.152 0.108
Part*Pre-kWh*Nov -0.112 0.039 -0.104 0.027 -0.179 0.075
Part*Pre-kWh*Dec -0.091 0.021 -0.098 0.015 -0.042 0.041
Participants 66 145 27
SampleSize 1,774 4,098 698
AdjustedR-Square 0.67 0.74 0.60
F-Statistic 137 460 42

page67
7 APPENDIXA:DHPCUSTOMERMAILSURVEYINSTRUMENT
The Survey Begins Here
1. Our records show that you purchased a ductless heat pump system for your home at
some point between December 2016 and January 2018 and that you received a rebate from your utility. Is that correct?
¨ Yes ¨ No è Thank you, please return this survey in the attached envelope.
If you answered “Yes” to Question 1, the following questions will ask you about your experiences with the ductless heat pump. Your input will help us better understand how customers use ductless heat pumps in their homes and help improve household utility programs going forward. Unless otherwise indicated, please select one answer for each question. Please watch for responses that include “skip to” instructions. If you complete the survey and mail it back to us, we will send you an additional $25 check to thank you for your time. Background
2. As of January 1, 2019, was the ductless heat pump still installed in your home? ¨ Yes ¨ No
3. We’d like to know about your home and where the ductless heat pump was installed. Is
the home in which the ductless heat pump was installed a primary residence, a vacation/second home, or a rental property?
¨ Primary residence ¨ Secondary residence/vacation home ¨ Rental property
4. As of January 1, 2019, did you own the home in which the ductless heat pump was
installed? ¨ Yes ¨ No
5. Do you use the ductless heat pump for heating? Please select “Yes” even if you only use
it rarely. ¨ Yes ¨ No
6. Do you use the ductless heat pump for air conditioning? Please select “Yes” even if you
only use it rarely. ¨ Yes ¨ No

page68
2
Ductless Heat Pump Customer Survey
7. How many indoor units (“heads”) does your ductless heat pump system have (see example)?
¨ 1 ¨ 2 ¨ 3 ¨ More than 3 ¨ Don’t know
Your Decision to Purchase a Ductless Heat Pump
8. What was your role in the household’s decision to purchase a ductless heat pump? ¨ I was the primary decision maker ¨ I decided with other family members ¨ I was not involved in the decision (please skip to Question 17)
9. In your own words, what was your main reason for seeking out a new system?
10. When you first started thinking about buying a new ductless heat pump, were you initially looking for something that would primarily provide heat, air conditioning, or both?
¨ Heating ¨ Air conditioning ¨ Both Heating and Air conditioning
11. Did you purchase a ductless heat pump to replace an old heating system?
¨ Yes ¨ No (skip to Question 13)
12. What were the reasons you wanted to replace your old heating system?
(Select YES or NO for each) YES NO Old system did not work; beyond repair YES NO Old system needed repairs; wasn’t functioning properly YES NO Old system was not providing adequate comfort YES NO Old system’s energy costs were too expensive YES NO Wanted to take advantage of utility rebate for new system YES NO Part of a larger home remodel YES NO Wanted to heat a new part of home YES NO Old system was not safe or healthy YES NO Other ____________________________

page69
3
Ductless Heat Pump Customer Survey
13. Did you purchase a ductless heat pump to replace an old cooling system? ¨ Yes ¨ No (skip to Question 15)
14. What were the reasons you wanted to replace an old cooling system? (Select YES or
NO for each) YES NO Old system did not work; beyond repair YES NO Old system needed repairs; wasn’t functioning properly YES NO Old system was not providing adequate comfort YES NO Old system’s energy costs were too expensive YES NO Wanted to take advantage of utility rebate for new system YES NO Part of a larger home remodel YES NO Wanted to cool a new part of home YES NO Old system was not safe or healthy YES NO Other ____________________________
15. How important were each of the following when choosing a new system
Extremely important
Very important
Somewhat important
A little important
Not at all important NA
Wanting to replace an old system � � � � � � Increasing comfort during the winter � � � � � � Increasing comfort during the summer � � � � � � Adding heating to an existing space that previously did not have it � � � � � �
Adding cooling to an existing space that previously did not have it � � � � � �
Adding heating to a newly built space � � � � � � Adding cooling to a newly built space � � � � � � Wanting to save energy or reduce your energy bills � � � � � �
16. If you had not purchased a ductless heat pump, what would you likely have done
instead? (Select YES or NO for each) YES NO Continued to use my old system for heating YES NO Continued to use my old system for cooling YES NO Purchased a central / ducted furnace to heat the house YES NO Purchased space heater(s) to heat selected rooms YES NO Purchased a central / ducted heat pump to heat the house YES NO Purchased a central / ducted heat pump to cool the house YES NO Purchased window air conditioner(s) to cool selected rooms YES NO Purchased a through-the-wall room air conditioner YES NO Purchased a through-the-wall mini-split air conditioner

page70
4
Ductless Heat Pump Customer Survey
Where in Your Home You Use Your Ductless Heat Pump
17. Which rooms in your home are served by the ductless heat pump? (Check all that apply)
¨ Whole house ¨ Kitchen ¨ Dining room ¨ Living room/family room/den ¨ Bedrooms(s) ¨ Bathroom(s) ¨ Office ¨ Entry/foyer/mudroom ¨ Laundry room ¨ Other ____________________________
18. Has the amount of square footage that is cooled in your home increased since you
installed the ductless heat pump? ¨ Yes (Amount of increased cooling area = ______ square feet) ¨ No ¨ Don’t know
19. Has the amount of square footage that is heated in your home increased since you
installed the ductless heat pump? ¨ Yes (Amount of increased heating area = ______ square feet) ¨ No ¨ Don’t know
20. How do you control your ductless heat pump? (Check all that apply)
¨ Remote control ¨ Controls on unit ¨ Wall-mounted programmable thermostat ¨ Wall-mounted manual (non-programmable) thermostat ¨ Other ____________________________
21. If you continue to use your old heating system, how do you control your old system?
(Check all that apply) ¨ Remote control ¨ Controls on unit ¨ Wall-mounted programmable thermostat ¨ Wall-mounted manual (non-programmable) thermostat ¨ Other ____________________________ ¨ Not applicable, I no longer use my old heating system

page71
5
Ductless Heat Pump Customer Survey
22. Since installing the ductless heat pump, how would you describe your comfort level on cold days compared to your comfort prior to having the ductless heat pump?
¨ 1 – Much less comfortable since installing the ductless heat pump ¨ 2 – Somewhat less comfortable since installing the ductless heat pump ¨ 3 – About the same comfort level since installing the ductless heat pump ¨ 4 – Somewhat more comfortable since installing the ductless heat pump ¨ 5 – Much more comfortable since installing the ductless heat pump
23. Since installing the ductless heat pump, how would you describe your comfort
level on hot days compared to your comfort prior to having the ductless heat pump? ¨ 1 – Much less comfortable since installing the ductless heat pump ¨ 2 – Somewhat less comfortable since installing the ductless heat pump ¨ 3 – About the same comfort level since installing the ductless heat pump ¨ 4 – Somewhat more comfortable since installing the ductless heat pump ¨ 5 – Much more comfortable since installing the ductless heat pump
24. Since installing the ductless heat pump, which of the following statements apply to
rooms heated and/or cooled by the ductless heat pump: (Select YES or NO) YES NO I now heat rooms more frequently than before I installed my ductless
heat pump. YES NO I heat rooms at higher temperature than before I installed my ductless
heat pump. YES NO I air condition rooms more frequently than before I installed my ductless
heat pump. YES NO I air condition rooms at lower temperature than before I installed my
ductless heat pump. Heating Before and After you Installed your Ductless Heat Pump
25. Which of the following, if any, did you use to heat your home prior to installing the ductless heat pump? (Check all that apply)
¨ I did not have any heating system (Skip to Question 34) ¨ Electric furnace ¨ Electric baseboard heating ¨ Electric wall fan ¨ Electric space heater ¨ Electric heat pump ¨ Gas furnace or boiler ¨ Gas fireplace ¨ Wood-burning stove ¨ Wood-burning fireplace ¨ Other ____________________________

page72
6
Ductless Heat Pump Customer Survey
26. Prior to installing the ductless heat pump, on days when you needed to heat your home, how often did you use non-electric heat (e.g. gas furnace/boiler, gas fireplace, or wood stove/fireplace)?
¨ Almost all of the time ¨ Most of the time ¨ About half of the time ¨ Rarely ¨ Almost never ¨ I do not use non-electric heat
27. Please refer to your answers to Question 25. If you used more than one heating option
in Question 25, which source did you use most frequently?
28. Do you use the ductless heat pump to heat the exact same rooms of your house as
you did with your old heating system? ¨ Yes ¨ No (please explain) _______________________________
29. Since you installed the ductless heat pump, have you ever used any of the following to
heat your home? (Check all that apply) ¨ Electric furnace ¨ Electric baseboard heating ¨ Electric wall fan ¨ Electric Space heater ¨ Electric heat pump ¨ Gas furnace or boiler ¨ Gas fireplace ¨ Wood-burning stove ¨ Wood-burning fireplace ¨ Other ____________________________
For the remainder of the survey, “old heating system” refers to the sources of heating you selected in Question 25
30. Which of the following best describes what you did with your old heating system after
installing a ductless heat pump? ¨ Stopped using the old heating system and removed it from my house (skip to
Question 34) ¨ Stopped using the old heating system but didn’t remove it (skip to Question 34) ¨ Continued to use other forms of heating in addition to my ductless heat pump
(continue to Question 31) ¨ Don’t know (skip to Question 34)

page73
7
Ductless Heat Pump Customer Survey
31. When you are heating your home, how often do you use the old system in comparison to the ductless heat pump?
¨ Significantly less than ductless heat pump (skip to Question 33) ¨ Slightly less than ductless heat pump (skip to Question 33) ¨ About the same as ductless heat pump (skip to Question 33) ¨ Slightly more than ductless heat pump (continue to Question 32) ¨ Significantly more than ductless heat pump (continue to Question 32) ¨ I do not continue to use my old heating system (skip to Question 34)
32. If you use your old heating system more than your ductless heat pump, why do you typically
use your old heating system more than your ductless heat pump?
33. How do you decide which heating system to use when you need to heat your home?
Cooling Before and After you Installed your Ductless Heat Pump
34. Which of the following, if any, did you use to air-condition (cool) your home prior to installing the ductless heat pump? (Check all that apply)
¨ I did not have air conditioning (skip to Question 40) ¨ Centrally ducted air conditioner ¨ Room/window air conditioner ¨ Electric heat pump ¨ Other ____________________________ ¨ Don’t know (skip to Question 40)
35. Does the new ductless heat pump cool the exact same rooms of your house as your
prior cooling system? ¨ Yes ¨ No (please explain) _______________________________
36. What did you do with your old cooling system after installing the ductless heat pump?
¨ Stopped using the old system and removed it from my house (skip to Question 40) ¨ Stopped using the old system but didn’t remove it (skip to Question 40) ¨ Continued to use old cooling system in addition to my ductless heat pump (continue
to Question 37) ¨ Don’t know (skip to Question 40)

page74
8
Ductless Heat Pump Customer Survey
37. When you are cooling your home, how often do you use the old cooling system in comparison to the ductless heat pump?
¨ Significantly less than ductless heat pump (skip to Question 39) ¨ Slightly less than ductless heat pump (skip to Question 39) ¨ About the same as ductless heat pump (skip to Question 39) ¨ Slightly more than ductless heat pump (continue to Question 38) ¨ Significantly more than ductless heat pump (continue to Question 38) ¨ I did not continue to use my old cooling system (skip to Question 40)
38. If you use your old cooling system more than your ductless heat pump, why do you
typically use your old cooling system more often than your ductless heat pump?
39. How do you decide which air conditioning system to use when you need to cool your
home?
Satisfaction with your Ductless Heat Pump
40. Overall, how satisfied are you with the quality of the heating provided by the ductless heat pump?
¨ Extremely satisfied ¨ Very satisfied ¨ Somewhat satisfied ¨ A little satisfied ¨ Not at all satisfied ¨ I do not use my ductless heat pump for heating
41. Overall, how satisfied are you with the quality of the cooling provided by the ductless
heat pump? ¨ Extremely satisfied ¨ Very satisfied ¨ Somewhat satisfied ¨ A little satisfied ¨ Not at all satisfied ¨ I do not use my ductless heat pump for cooling

page75
9
Ductless Heat Pump Customer Survey
42. Since installing the ductless heat pump, how have your energy bills changed during cooler times of the year?
¨ Much higher energy bill ¨ Slightly higher energy bill ¨ About the same ¨ Slightly lower energy bill ¨ Much lower energy bill
43. Since installing the ductless heat pump, how have your energy bills changed during
hotter times of the year? ¨ Much higher energy bill ¨ Slightly higher energy bill ¨ About the same ¨ Slightly lower energy bill ¨ Much lower energy bill
44. Since installing the ductless heat pump, have you noticed an improvement in the air
quality in your home? ¨ Yes ¨ No
45. Since installing the ductless heat pump, which of the following have you noticed? (Select
YES or NO for each) YES NO An increase in overall comfort YES NO An increase in safety compared to other heating systems you have used
in the past or are currently using now
46. Have you noticed any other effects (positive or negative)?
Household Characteristics
47. In the 12 months immediately after you installed your ductless heat pump, how many people moved into your home?
¨ 0 people moved in ¨ 1-2 people moved in ¨ 3 or more people moved in

page76
10
Ductless Heat Pump Customer Survey
48. In the 12 months immediately after you installed your ductless heat pump, how many people moved out of your home?
¨ 0 people moved out ¨ 1-2 people moved out ¨ 3 or more people moved out
49. During the 12 months immediately before and after you installed your ductless heat
pump, did you add square footage to your home that is heated and/or cooled (check all that apply)?
¨ Yes, added square footage prior to installation of ductless heat pump ¨ Yes, added square footage after installation of ductless heat pump ¨ No, did not add square footage heated and/or cooled square footage
50. In the 12 months immediately after you installed your ductless heat pump, did you
replace any old appliances with new appliances? ¨ Yes (please list) __________________________________________ ¨ No
51. Which best describes the home in which you installed the ductless heat pump?
¨ Single Family Detached ¨ Single Family Attached ¨ Small Multifamily (building contains 2-4 units) ¨ Multifamily (building contains more than 4 units) ¨ Manufactured or pre-built home ¨ Other
52. Approximately what year was this home built?
¨ Prior to 1920 ¨ 1920-1939 ¨ 1940-1959 ¨ 1960-1979 ¨ 1980-1999 ¨ 2001-2019
53. Approximately how long have you occupied this home?
¨ Less than 3 years ¨ 3 – 6 years ¨ 7 – 10 years ¨ 10 – 15 years ¨ More than 15 years
54. Approximately how big is this home?
¨ 0 – 999 Sq. ft. ¨ 1000 – 1999 sq. ft. ¨ 2000 – 2999 sq. ft. ¨ 3000 – 3999 sq. ft. ¨ 4000+ sq. ft.

page77
11
Ductless Heat Pump Customer Survey
55. Does the home have gas service? ¨ Yes; natural gas ¨ Yes; propane or other bottled gas ¨ No ¨ Don’t know
56. Approximately what percentage of the windows in your home are double (or triple)
pane? ¨ 0% - 24% ¨ 25% - 49% ¨ 50% - 74% ¨ 75% - 99% ¨ 100%. All windows are double (or triple) pane. ¨ Don’t know
57. Which of the following does your home have?
Yes No Not Sure NA Attic insulation � � � � Floor insulation � � � � Wall insulation � � � � Door / window weather-stripping � � � �
58. Are solar panels installed at this home?
¨ Yes, installed prior to 2018 ¨ Yes, installed in 2018 ¨ Yes, installed in 2019 or later ¨ No
Thank you for completing the survey! Please put the completed survey into the included envelope. Once we receive your survey, we will send a check for $25 to person and address you list below. What is the name that should appear on the check for $25?
Where should we send the $25 check? ¨ To the address listed to the right ¨ To the address listed below:
According to our records, your current address is:

page78
12
Ductless Heat Pump Customer Survey
This section can be used for any additional comments