2017/18 hornbach baumarkt · 1042.7 + 3.9% + 4.0% + 4.6% 900.9 936.5 746.7 781.2 1058.9 1130.3...
TRANSCRIPT

A N N U A L R E P O R T2 0 1 7 / 1 8
HORNBACHBAUMARKT
A G G r o u p

CONTENTS
COMPANY PROFILE 5
TO OUR SHAREHOLDERS 6Letter from the CEO 6Report of the Supervisory Board 8Directors and Officers 12Corporate Governance Report with Corporate Governance Declaration 14Compensation Report 27The HORNBACH Baumarkt Share 30
COMBINED MANAGEMENT REPORT 34Group Fundamentals 34Business Report 39 Macroeconomic and Sector-Specific Framework 39 Summary of 2017/18 Business Performance 41 Earnings Position 44 Financial Position 53 Asset Position 58 Notes to the Annual Financial Statements of HORNBACH Baumarkt AG (HGB) 60Non-Financial Statement 64Events After the Balance Sheet Date 64Risk Report 65Opportunity Report 73Outlook 78Other Disclosures 83
CONSOLIDATED FINANCIAL STATEMENTS 87Income Statement 87Balance Sheet 88Statement of Changes in Equity 89Cash Flow Statement 90Notes to the Consolidated Financial Statements 91 Explanatory Notes on the Principles and Methods Applied 91 Segment Reporting 108 Notes on the Consolidated Income Statement 111 Notes on the Consolidated Balance Sheet 119 Other Disclosures 140
RESPONSIBILITY STATEMENT 158AUDITOR’S REPORT 159OUR LOCATIONS 166
IMPRINT 168

Key Group, Financial and Operating Data
Key Group, Financial and Operating Data
Change IFRS
financial year
Amounts shown in € million 2017/18 2017/18 2016/17 2015/16 2014/15 2013/14 2012/13 2011/12 2010/11 2009/10 2008/09
unless otherwise stated
on previous
year
Sales and earnings figures
Net sales 4.9 % 3,891 3,710 3,535 3,357 3,152 3,020 3,001 2,836 2,686 2,599
of which in other European countries 9.0 % 1,820 1,670 1,524 1,390 1,325 1,279 1,272 1,195 1,109 1,065
Sales growth as % of net sales 4.9 5.0 5.3 6.5 4.4 0.6 5.8 5.6 3.4 5.2
EBITDA 5.2 % 183 174 162 167 161 156 184 173 169 193
as % of net sales 4.7 4.7 4.6 5.0 5.1 5.2 6.1 6.1 6.3 7.4
EBIT 5.1 % 102 98 90 110 105 99 128 119 115 137
as % of net sales 2.6 2.6 2.6 3.3 3.3 3.3 4.3 4.2 4.3 5.3
Adjusted EBIT 1) 7.0 % 110 103 99 115 111 101 132 120 115 102
as % of net sales 2.8 2.8 2.8 3.4 3.5 3.3 4.4 4.2 4.3 3.9
Earnings before taxes 2.0 % 81 79 78 95 87 74 106 102 96 122
as % of net sales 2.1 2.1 2.2 2.8 2.8 2.5 3.5 3.6 3.6 4.7
Net income for the year 11.0 % 59 53 72 70 56 52 77 76 68 95
as % of net sales 1.5 1.4 2.0 2.1 1.8 1.7 2.6 2.7 2.5 3.7
Gross margin as % of net sales 37.3 37.2 37.7 38.0 37.4 37.3 37.4 37.4 36.8 36.6
Store expenses as % of net sales 29.6 29.8 30.2 29.8 29.4 29.7 29.0 29.3 29.6 29.1
Costs of central administration as % of net sales 5.3 5.0 5.0 4.7 4.5 4.7 4.3 4.2 4.1 4.1
Pre-opening expenses as % of net sales 0.1 0.2 0.3 0.4 0.3 0.3 0.2 0.1 0.1 0.3
Cash flow figures
Cash flow from operating activities 16.4 % 134 115 107 107 144 95 104 153 156 124
Investments 2) (18.0)% 129 157 139 100 72 117 104 68 68 82
Proceeds from divestments 2 2 2 1 5 3 11 38 3 66
Earnings potential 3) 14.8 % 139 121 117 122 155 105 111 158 160 132
as % of net sales 3.6 3.3 3.3 3.6 4.9 3.5 3.7 5.6 6.0 5.1
Dividend distribution 0.0 % 21.6 21.6 19.1 19.1 15.9 15.9 15.9 15.9 13.7 13.7
Balance sheet and financial figures
Total assets 1.9 % 1,998 1,960 1,986 1,731 1,670 1,597 1,628 1,592 1,439 1,425
Non-current assets 3.6 % 1,165 1,124 1,023 786 729 722 668 621 601 565
Inventories 5.1 % 658 626 588 533 505 482 476 459 428 496
Cash and cash equivalents (9.6)% 102 113 283 335 371 317 404 423 296 236
Shareholders' equity 3.8 % 1,049 1,011 973 922 862 823 792 730 655 591
Shareholders' equity as % of total assets 52.5 51.6 49.0 53.3 51.6 51.5 48.6 45.9 45.5 41.5
Return on shareholders' equity
based on net income - in % 5.7 5.5 7.6 7.8 6.7 6.5 10.2 10.9 11.0 17.1
Net working capital (0.4)% 469 471 408 382 345 349 358 319 312 349
Additions to non-current assets (26.9)% 129 176 312 100 72 117 104 68 68 84
Inventory turnover rate per year 3.8 3.9 4.0 4.1 4.0 4.0 4.0 4.0 3.7 3.4
Retail store data
Number of stores 156 155 153 146 141 138 134 133 131 129
of which in Germany 98 98 99 97 92 92 91 92 92 92
of which in other European countries 58 57 54 49 49 46 43 41 39 37
Like-for-like sales growth in % 3.6 3.0 2.6 4.4 2.7 (1.4) 2.8 2.6 0.7 1.4
Sales area in m² (based on BHB) 0.9 % 1,821,807 1,805,729 1,771,480 1,704,187 1,646,712 1,597,949 1,549,085 1,513,722 1,480,216 1,446,794
Weighted average net sales per m² in € 3.2 % 2,135 2,068 2,023 1,985 1,940 1,912 1,933 1,903 1,828 1,839
Average store size in m² 0.2 % 11,678 11,650 11,578 11,673 11,679 11,579 11,560 11,381 11,299 11,215
Weighted average sales per store 24.9 24.1 23.4 23.2 22.7 22.1 22.3 21.7 20.7 20.6
Other information
Employees - annual average - converted into full-time
equivalents 2.8 % 15,431 15,016 14,570 13,967 13,390 12,674 12,188 11,520 11,357 11,005
Sales per employee in € 000s 2.0 % 252 247 243 240 239 238 246 246 237 236
Number of shares 4) 31,807,000 31,807,000 31,807,000 31,807,000 31,807,000 31,807,000 31,807,000 15,903,500 15,903,500 15,740,060
Earnings per share in € 4) 1.84 1.66 2.28 2.19 1.77 1.64 2.43 4.76 4.32 6.04
1) Adjusted for non-operating earnings items 2) Excluding investment in short-term financial deposits (2016/17 financial year: € 30 million) 3) Cash flow from operating activities plus pre-opening expenses 4) Starting in the 2011/12 financial year: change in number of shares following issue of bonus shares as of July 29, 2011

Assets Equity and liabilities
1,960 1,9601,998 1,998
Cash and cash equivalents 113 / 102
Current liabilities453 / 446
Inventories, trade receivables and other assets 715 / 722
Non-current liabilities496 / 503
Non-current assets1,132 / 1,173
Shareholders’ equity1,049 / 1,011
2.28.2018 2.28.2018 (rounded up/down to nearest € million)2.28.2017 2.28.2017
Structure of consolidated balance sheet(€ million)
Financial year
16 | 17
17 | 18
13 | 14
14 | 15
15 | 16
20 40 60 80 100 120 140
Earnings before interest and taxes(€ million)
Financial year
16 | 17
17 | 18
13 | 14
14 | 15
15 | 16
10 20 30 40 50 60 70 80 90 100
Net income for the year(€ million)
0
0
Financial year
16 | 17
17 | 18
13 | 14
14 | 15
15 | 16
20 40 60 80 100 120 140
Adjusted EBIT(€ million)
Sales and growth by quarter(€ million / %)
0
Financial year
1003.6
1042.7 + 3.9% + 4.0% + 4.6%
900.9
936.5
746.7
781.2
1058.9
1130.3
2016/17
Q1 Q2 Q3 Q4
2017/18
3710.1
3890.7
+ 6.7%
+ 4.9%

Company ProfileHORNBACH is one of the leading DIY retail groups in Germany and Europe, with 156 DIY stores and garden centers in nine European countries. HORNBACH’s megastores and online shops offer DIY enthusiasts and professionals a broad product range of around 150,000 high-quality articles at permanently low prices. HORNBACH supplements its products with a wide range of project-based advice and services.
Germany98 stores
1,051,900 qm
Sweden5 stores
72,900 qm
156 locations in EuropeStatus: February 28, 2018
Netherlands13 stores
164,500 qm
Luxembourg1 store
12,100 qm
Switzerland6 stores
78,100 qm
Czech Republic10 stores
140,900 qm
Slovakia3 stores
46,100 qm
Austria14 stores
168,900 qm
Romania6 stores
86,400 qm
Dividend gemSince its IPO in 1993, HORNBACH Baumarkt AG Group has each year distributed a dividend at least as high as the year before.
No. 1HORNBACH regularly receives top rankings for its product range and prices in customer satisfaction surveys.
57%HORNBACH owns more than half the properties used for its retail operations.
50 yearsThe first combined DIY store and garden center opens its doors in Bornheim/Pfalz in 1968.
€ 3.9 billionConsolidated sales rise by 4.9 % to more than € 3.9 billion in 2017/18 financial year.
€ 2,135HORNBACH is the German DIY market leader in terms of sales per square meter.

6 TO OUR SHAREHOLDERS Letter from the CEO
TO OUR SHAREHOLDERS Letter from the CEO
Dear Shareholders, In the past 2017/18 financial year, the HORNBACH Baumarkt AG Group successfully asserted itself against its competitors in the European countries in which it operates while also pressing energetically ahead with the digital transformation of its business model. I deliberately made both those points in the same sentence. That is because I am convinced that – at this time when digitization is advancing into all areas of life – one is no longer possible without the other. It goes without saying that this will give rise to a conflict of objectives – at least in the short term. On the other hand, we have to formulate sales and earnings forecasts that are also acceptable to the capital market. The fact that investors and entrepreneurs do not always have the same horizon of expectations will not come as any surprise. Nevertheless, we have to make substantial advance investments, and absorb the resultant costs, to make our company fit for the future. We have to find a healthy balance for these two factors. The sales and earnings targets we set ourselves a year ago took due account of this conflict of economic objec-tives. We met our targets for the 2017/18 financial year. Here are the main highlights: Having opened new stores in The Hague in the Netherlands and Halle (Saale) and closed one store in Ha-
nau, we operated a group-wide total of 156 retail stores at the balance sheet date on February 28, 2018, of which 98 in Germany and 58 in other European countries. Alongside our stationary store network, in the second half of the year we also launched operations at the online shops previously still outstanding in Slovakia, Sweden, and Romania.
We increased our consolidated sales, i.e. our total net sales in Germany and abroad, by 4.9 % to
€ 3,891 million. We owe this growth not only to the robust performance of our stationary DIY stores with garden centers, but also to pleasing sales momentum at our online shops. The relevant sector statistics show that, of the ten largest German DIY store operators, HORNBACH posted by far the highest growth in the past year. The average growth rate (excluding HORNBACH) came to 1.4 %.
We are undisputedly the most productive DIY store operator among Germany's "Top 10". Over the past ten
years, our net sales per store rose by a fifth from € 20.6 million to € 24.9 million most recently. Over the same period, we improved our surface productivity (excluding sales tax) by more than 16 % from € 1,839 to € 2,135 per square meter. Just to compare: The other "Top 10" competitors achieved surface sales averaging just under € 1,350 per square meter in their international retail businesses in 2017. That is just 4 % more than ten years ago and 37 % less than HORNBACH.

TO OUR SHAREHOLDERS Letter from the CEO 7
On a like-for-like basis and net of currency items, we increased our net sales by 3.6 % in the 2017/18 financial year, following growth of 3.0% one year earlier. This was driven both by the Germany region and by the Other European countries region. In Germany, we generated cumulative like-for-like sales growth of 1.5 %, and that despite fewer business days. We generated the greatest sales momentum once again in other European countries, where like-for-like sales net of currency items grew by 6.1 %.
We also met our expectations on the earnings front. Adjusted EBIT, which serves as the key indicator for
our operating earnings strength, rose by 7.0 % to € 110 million. This was due to our pleasing sales growth, stable gross margin, and improved store cost ratios. We maintained our adjusted EBIT margin at a stable 2.8 %. Our consolidated net income and earnings per share grew by around 11 %.
Once again in the 2017/18 financial year, our stable operating earnings strength enabled us to channel sub-stantial resources into digitizing our business model within our multichannel strategy. We take "multichannel retail" to mean the customer-oriented interaction of our 156 high-performance stationary stores across Europe with our e-commerce channels. Notwithstanding all the energy we are investing in our digital transformation, we have not lost sight of our traditional virtues. Our permanent low price strategy remains a key cornerstone of our success – and it applies both offline and online. We offer the same prices across all channels and deliberately avoid discounts or campaign pricing. That creates trust and enables us to boost our position compared with pure players, par-ticular when customers wish to inexpensively implement larger-scale DIY projects on an ongoing basis. As the "project DIY store", we have also set ourselves the standard of being viewed by our customers as the best in the sector when it comes to advice. This takes well-trained employees able to offer competent advice across all product ranges, even for trickier projects. Video tutorials, which have been well received by our customers, are a sensible addition here, but are certainly no substitute for good one-to-one advice. Our success in maintaining this "balancing act" between traditional strengths and innovative solutions is reflected in our strong performance in renowned customer surveys. As in previous years, in 2017 HORNBACH was awarded top rankings in all European countries for which results are available, and especially in the cri-teria of product range, prices, and specialist advice. In view of this, we can look to the future with confidence. Operations in our established stationary retail busi-ness are successful and profitable. We will therefore continue to open new stationary HORNBACH stores. In the first quarter of 2018/19, we already launched operations at two DIY stores with garden centers – in Zwolle in the Netherlands and Affoltern in Switzerland. At the same time, we will continue to invest in future as well in further expanding our multichannel retail across all HORNBACH regions. I am grateful and proud that our employees, now numbering nearly 19,000 across the Group, are willing to face new challenges each and every day, and that with great enthusiasm and dedication. And I would like to thank you, our shareholders, for the trust you have placed in us. Steffen Hornbach CEO HORNBACH Baumarkt AG

8 TO OUR SHAREHOLDERS Report of the Supervisory Board
Report of the Supervisory Board
Albrecht Hornbach
Dear Ladies and Gentlemen,
In the past 2017/18 financial year we dealt in great detail with the company’s situation, perspectives, and strategic alignment. We advised the Board of Management in its management of the company and monitored its conduct in accordance with the requirements of the law, the Articles of Association and the Code of Procedure. At our meetings, the Board of Management provided us with regular, prompt and extensive written and oral reports on the business performance and the economic situation of the company and its subsidiaries. The Supervisory Board was involved in decisions of major significance for the company. Moreover, as Supervisory Board Chairman I was in regular contact with the Board of Management, and especially with the Chief Executive Officer, outside the framework of meetings to discuss significant issues and also to hold a number of working meetings.
Meetings of the Supervisory Board In the 2017/18 financial year, the Supervisory Board and the Audit Committee held a total of four and five meetings respectively. Apart from the exceptions referred to in the following sentence, all members attended at least half the meetings of the Supervisory Board and of the committees to which they belonged in the year under report. Due to sickness, Martin Fischer was able to attend only two meetings of the Supervisory Board, but participated in all resolutions by way of voice messages. Average attendance at the meetings of the Super-visory Board and of its committees amounted to around 95 % and 98 % respectively. Individualized disclosure of the meeting attendance by Supervisory Board members can be found in the Corporate Governance Report. No conflicts of interest arose in the year under report. At our meetings, we referred to the oral and written reports provided by the Board of Management and dealt in detail with the economic situation of the company, its business performance, corporate strategy and plan-

TO OUR SHAREHOLDERS Report of the Supervisory Board 9
ning, investment and financial policy, opportunity and risk situation, risk management, and corporate gov-ernance and discussed these matters with the Board of Management. The Board of Management also provided regular written and oral reports on the company’s current situation, and in particular on the development in its earnings and financial situation compared with the previous year and the budget. Budget variances were discussed and substantiated. At the meeting held in May 2017 to approve the annual financial statements, we examined the annual and consolidated financial statements in great detail in the presence of the auditor, as was also the case in May 2018. Furthermore, the Audit Committee also reported on its work and the findings of its audit. All ques-tions raised by Supervisory Board members were answered in detail by the auditors. The report of the Super-visory Board, the joint corporate governance report of the Board of Management and the Supervisory Board, the risk report, and the compliance report were also discussed and approved at this meeting. The agenda for the Annual General Meeting, including the proposed resolutions, was approved. Furthermore, at its meeting in May 2017 the Supervisory Board also set the target for the share of women on the Board of Management to be achieved by February 28, 2022. At the meeting held directly before the Annual General Meeting in July 2017, the Board of Management reported on the current situation of the Group. Further topics included meeting dates and various matters relating to corporate governance. Both the employee and the shareholder representatives spoke out in favor of the overall gender quota for the Supervisory Board elections in 2018 being met separately for both groups of members. In December 2017, the current business situation, risk report, and compliance report were discussed. Further-more, at the recommendation of the Audit Committee the Supervisory Board approved the premature extension and increase in a syndicated loan facility to € 350 million. Moreover, the Supervisory Board adopted amendments to the Codes of Procedure of the Board of Management and Supervisory Board, elected the members of the newly established Nomination Committee and, following in-depth discussions, laid down its objectives for the composition of the Supervisory Board and a competence profile for the overall board. The same meeting dealt with the efficiency review of supervisory board activities and adopted the updated Declaration of Conformity with the German Corporate Governance Code pursuant to § 161 of the German Stock Corporation Act (AktG). This was made permanently available on the company's homepage. HORNBACH Baumarkt AG has largely com-plied with and continues to comply with the recommendations of the German Corporate Governance Code with only a few exceptions. Further information about corporate governance at HORNBACH Baumarkt AG can be found in the joint report of the Board of Management and Supervisory Board in the "Corporate Governance" chapter. At its final meeting in the past 2017/18 financial year, held in February 2018, the Supervisory Board discussed the Group's current business situation, and discussed and adopted the budget for the financial years 2018/19 to 2022/23. Furthermore, it laid down diversity concepts for the Board of Management and the Supervisory Board.
Committees and committee meetings The Supervisory Board has established four committees. The current composition of the committees can be found in the "Directors and Officers" chapter of this Annual Report. The Audit Committee met five times in the year under report, namely in May, June, September, December, and February.
Corporate Governance Corporate Governance Declaration
www.hornbach-group.com Investor Relations > Corporate Governance > Declarations of Conformity
Directors and Officers Supervisory Board committees

10 TO OUR SHAREHOLDERS Report of the Supervisory Board
In May 2017, the Audit Committee discussed the annual financial statements of HORNBACH Baumarkt AG and the consolidated financial statements, management reports, proposed appropriation of profits, and au-dit reports, including the dependent company report, in the presence of the auditor and members of the Board of Management. Key focuses of discussion at this meeting also included the risk and compliance reports of the Board of Management, group internal audit reports, reports from the Board of Management on the company's financial situation, and the candidate to be proposed for election as auditor. At the June meeting the statement for the first quarter was discussed and in September 2017 the half-year financial report was addressed in the presence of the auditors. The Committee was informed by the Board of Management about major technology-related projects. In December 2017, key focuses for the audit of the consolidated financial statements were determined together with the auditors. The Committee held detailed discussions concerning the proposal to prematurely extend and increase a syndicated loan to € 350 million. At the same meeting, the Committee dealt with the statement on the first nine months, as well as the risk report, compliance report, and the company's financial situation. In February 2018, the budget for the finan-cial years 2018/19 to 2022/23 was addressed in detail, as were logistics-related topics. The internal audit plan for the 2018/19 financial year was adopted at the same meeting. The Audit Committee Chairman reported in detail on the work of the committee to the full Supervisory Board meetings. The Personnel Committee did not hold any meetings in the year under report. The Nomination Committee held one meeting in the past financial year. At this, it elected Albrecht Hornbach as Committee Chairman and discussed shareholder representative candidates for the regular elections to the Supervisory Board due to take place at the Annual General Meeting in July 2018. In selecting candidates, the Committee took due account of the composition-related objectives adopted by the Supervisory Board on December 19, 2017 and aims to meet the competence profile adopted by the Supervisory Board for the board as a whole. Outside this meeting, the members of the Nomination Committee also reviewed potential Supervisory Board candidates and held corresponding talks. It was not necessary to convene the Mediation Committee established pursuant to § 27 (3) of the German Codetermination Act (MitbestimmG).
Supervisory Board composition We regret to report the loss of our Supervisory Board member Hans Kroha, who passed away on April 5, 2017 following severe illness. He had represented the trade union ver.di on our Supervisory Board since July 2013. We will always honor his memory. Monika Di Silvestre replaced Hans Kroha on the company's Supervisory Board as of April 5, 2017.
Annual and consolidated financial statements KPMG AG Wirtschaftsprüfungsgesellschaft, Berlin (KPMG), audited the annual financial statements and the consolidated financial statements of HORNBACH Baumarkt AG as of February 28, 2018, as well as the com-bined management report and group management report of HORNBACH Baumarkt AG for the 2017/18 finan-cial year and provided them each with an unqualified audit opinion. The consolidated financial statements were prepared in accordance with International Financial Reporting Standards (IFRS) as adopted by the EU. Moreover, KPMG confirmed that the Board of Management had suitably implemented the measures required by § 91 (2) of the German Stock Corporation Act (AktG), particularly those concerning the establishment of an early warning risk management system, and that the monitoring system was suitable for the early detection of any developments that could threaten the company's continued existence.

TO OUR SHAREHOLDERS Report of the Supervisory Board 11
Key focuses of the audit in the 2017/18 financial year included the measurement of inventories and ongoing value of stores in respect of the consolidated financial statements and the measurement of inventories in respect of the annual financial statements. The financial statements and audit reports were provided to all Supervisory Board members in good time. They were examined in detail at the meeting of the Audit Committee on May 17, 2018 and at the subsequent meeting of the Supervisory Board held the same day to approve the financial statements. The auditor took part in these discussions. He reported on the principal audit findings and was available to provide further information and to answer questions. Based on the findings of the preliminary audit performed by the Audit Committee and of our own examination of the documents provided by the Board of Management and the auditor, we do not raise any objections and endorse KPMG’s audit findings. We approve the annual and consolidated financial statements of HORNBACH Baumarkt AG prepared by the Board of Management as of February 28, 2018; the annual financial statements of HORNBACH Baumarkt AG are thus adopted. We endorse the appropriation of profits proposed by the Board of Management. Furthermore, the Supervisory Board reviewed the report from the Board of Management on relationships with associated companies pursuant to § 312 of the German Stock Corporation Act (AktG). Neither this review nor KPMG’s audit gave rise to objections. KPMG granted the following audit opinion: "Based on the audit and assessment we have undertaken in accordance with professional standards, we confirm that 1. the factual disclosures made in the report are correct 2. the performance of the company in the transactions listed in the report was not incommensurately high 3. for the transactions listed in the report no circumstances indicate any assessment materially different to that by the Board of Management." Based on the conclusive findings of its audit, the Supervisory Board has no objections to the statement provided by the Board of Management at the end of its report pursuant to § 312 of the German Stock Corpo-ration Act (AktG). In a market climate which remains highly price-sensitive and competitive, and that both in Germany and abroad, the HORNBACH Baumarkt AG Group asserted itself well and defended or expanded its market share. This was due not least to its online activities in all regions. The substantial investments made in digitizing the business model are beginning to pay off. Non-operating earnings, on the other hand, were held back by write-downs and additions to provisions. Overall, however, the company fully met its sales and earnings targets. The Supervisory Board thanks the Board of Management and all employees in Germany and abroad for the great commitment shown in the past financial year. Bornheim, May 2018 Supervisory Board Albrecht Hornbach Chairman

12 TO OUR SHAREHOLDERS Directors and Officers
Directors and Officers
Supervisory Board
Albrecht Hornbach Chairman Chief Executive Officer HORNBACH Management AG Kay Strelow* Deputy Chairman Section Manager, Berlin-Marzahn Store Dr. Wolfgang Rupf Further Deputy Chairman Managing Partner, Rupf Industries GmbH, Rupf Engineering GmbH and Rupf ATG Casting GmbH Monika Di Silvestre* (since April 5, 2017) State Retail Section Head at ver.di Rheinland-Pfalz-Saarland Mohamed Elaouch* Section Manager, Mainz Store Dr. John Feldmann Supervisory Board Chairman of KION Group AG Former Executive Board member of BASF SE Martin Fischer* Professional Customer Advisor, Kempten Store Christian Garrecht* Operative Head of Workplace Safety and Fire Prevention Erich Harsch CEO dm-drogerie markt GmbH & Co. KG Kerstin Holfert* Section Manager, Dresden Store Georg Hornbach Head of Controlling Department and Head of Finance and Procurement Division Universitätsklinikum Köln
Martin Hornbach Managing Partner Corivus Gruppe GmbH Hans Kroha* († April 5, 2017) State Retail Section Head at ver.di Rheinland-Pfalz-Saarland Brigitte Mauer* Section Manager, Tübingen Store Michael Reiland* Sales Director at HORNBACH Compact and Regional Director Joerg Walter Sost Managing Partner J. S. Consulting GmbH Prof. Dr.-Ing. Jens P. Wulfsberg Professor of Production Technology Helmut-Schmidt-Universität/Universität der Bundeswehr Hamburg
* Employee representative

TO OUR SHAREHOLDERS Directors and Officers 13
Supervisory Board Committees
Audit Committee Dr. Wolfgang Rupf Chairman Dr. John Feldmann Erich Harsch Albrecht Hornbach Martin Hornbach Michael Reiland Joerg Walter Sost Kay Strelow
Personnel Committee Dr. Wolfgang Rupf Chairman Christian Garrecht Erich Harsch Michael Reiland Joerg Walter Sost
Mediation Committee Dr. Wolfgang Rupf Chairman Kerstin Holfert Albrecht Hornbach Kay Strelow
Nomination Committee (since December 19, 2017) Albrecht Hornbach Chairman (since February 22, 2018) Dr. John Feldmann Martin Hornbach Dr. Wolfgang Rupf
Board of Management
Members and their areas of responsibility Steffen Hornbach Chief Executive Officer Strategic Development, Operative Store Management, Sales and Services Roland Pelka Deputy Chairman Finance, Accounting, Tax, Controlling, Risk Management, Loss Prevention, Group Communications Susanne Jäger Procurement, Imports, Store Planning, Store Development, Quality Assurance, Environmental Issues Wolfger Ketzler Labor Director Personnel, Real Estate, Construction, Technical Procurement, Internal Audit, Legal, Compliance Karsten Kühn Marketing, Market Research, Internal Communications Ingo Leiner Logistics Dr. Andreas Schobert Technology
CVs of Directors and Officers CVs of the members of the Board of Management and Supervisory Board can be found under "Corporate Governance" in the "Investor Relations" section of our website (see "Board of Manage-ment" and "Supervisory Board" in the item overview).
www.hornbach-group.com

14 TO OUR SHAREHOLDERS Corporate Governance Report with Corporate Governance Declaration
Corporate Governance Report with Corporate Governance Declaration
Our actions are guided by the principles of responsible, transparent corporate management and control (corporate governance). HORNBACH has always accorded priority to high-quality corporate governance. It forms the basis for sustainable economic success and helps us enhance the trust placed in our company by our customers, business partners, investors, employees, and the financial markets. The standards and guidelines we adhere to over and above legal requirements are summarized in the Corporate Governance Declaration (§ 289a HGB), which includes the Corporate Governance Report of the Board of Management and the Supervisory Board (Point 3.10 DCGK).
1. Declaration of Conformity with the German Corporate Governance Code pursuant to § 161 AktG dated December 2017
The Board of Management and Supervisory Board of HORNBACH Baumarkt AG hereby declare pursuant to § 161 of the German Stock Corporation Act (AktG):
I. Future-related section The recommendations of the "German Corporate Governance Code" in the version dated February 7, 2017 and published in the Federal Official Gazette on April 24, 2017 will basically be complied with in future. No application will be made of the recommendations in Points 3.8 (3), 4.2.3 (2) Sentence 3, 4.2.5 (3), 5.4.2 Sentence 3, and 5.4.6 (3) Sentence 1. These deviations from the recommendations are due to the following considerations: a) Point 3.8 (3): In Point 3.8 (3), the Code recommends agreeing a specified deductible in any D&O insurance policy taken out for supervisory board members. No such deductible has been agreed at the expense of Supervisory Board members. This would reduce the attractiveness of Supervisory Board activities, and thus also the company’s chances in the competition to attract qualified candidates. Furthermore, it would also improperly apply to employee representatives. The recommendation made in Point 3.8 (3) is therefore not followed. b) Point 4.2.3 (2) Sentence 3: According to Point 4.2.3 (2) Sentence 3, variable components of management board compensation should generally have a multiple-year assessment basis that essentially has forward-looking characteristics. The employment contracts currently in place deviate from this new Code recommendation. The adjustments to the employment contracts with members of the Board of Management required to comply with this recom-mendation at a later point in time are nevertheless in preparation. c) Point 4.2.5 (3): The compensation paid to the Board of Management is not presented separately for each member. The Annual General Meeting held on July 7, 2016 resolved to uphold the more guarded approach towards reporting man-agement board compensation. For the same reason, no use is made of the "model tables" included in the "German Corporate Governance Code".

TO OUR SHAREHOLDERS Corporate Governance Report with Corporate Governance Declaration 15
d) Point 5.4.2 Sentence 3: In Point 5.4.2 Sentence 3, the Code recommends that the supervisory board should not include more than two former management board members. This is intended to ensure the autonomy of the supervisory board in its advising and monitoring of the management board. However, the Code does not stipulate any number of years for which a former member of the management board is impaired in this respect following his departure from the management board. As a matter of precaution, the company therefore declares that it deviates from the recommendation made in Point 5.4.2 Sentence 3, even though Dr. Wolfgang Rupf, Albrecht Hornbach and Martin Hornbach retired from their positions on the Board of Management of HORNBACH Baumarkt AG on October 31, 1996, October 31, 2001 and December 31, 2001 respectively. e) Point 5.4.6 (3) Sentence 1: In Point 5.4.6 (3) Sentence 1, the Code recommends that the compensation of supervisory board members be reported in the notes to the financial statements or the management report on an individual basis and broken down into its constituent components. Given that the amount of compensation paid to the Supervisory Board is governed by the Articles of Association, we see no need to disclose individual compensation packages.
II. Past-related section 1. Period since submission of previous Declaration of Conformity in December 2016 through to publication
of new version of Code on April 24, 2017 The recommendations of the "German Corporate Governance Code" in the version dated May 5, 2015 and published in the Federal Official Gazette on June 12, 2015 were basically complied with in the period since the submission of the previous Declaration of Conformity dated December 2016 through to publication of the new version of the Code on April 24, 2017 with the exception of the deviations listed below. No application was made of the following recommendations included in the old version: Points 3.8 (3), 4.1.5 Sentence 1, 4.2.3 (4) and (5), 4.2.5 (3), 4.3.3 Sentence 4, 5.3.3, 5.4.1 (2) and (3), 5.4.2 Sentence 3, and 5.4.6 (3) Sentence 1. These deviations from the recommendations were due to the following factors: a) Point 3.8 (3) old version: In Point 3.8 (3), the previous version of the Code recommended agreeing a specified deductible in any D&O insurance policy taken out for supervisory board members. No such deductible was agreed at the expense of Supervisory Board members. This would reduce the attractiveness of Supervisory Board activities, and thus also the company’s chances in the competition to attract qualified candidates. Furthermore, it would also improperly apply to employee representatives. The recommendation made in Point 3.8 (3) of the old version was therefore not followed. b) Point 4.2.3 (4) and (5) old version: Furthermore, no application was made of the recommendations made in the previous versions of Point 4.2.3 (4) ("severance payment cap") and (5) ("change of control compensation cap") of the Code. These deviations were due to competition-related factors. c) Point 4.2.5 (3) old version: The compensation paid to the Board of Management was not presented separately for each member. The An-nual General Meeting held on July 7, 2016 resolved to uphold the more guarded approach towards reporting management board compensation. For the same reason, no use was made of the "model tables" included in the "German Corporate Governance Code".
16 TO OUR SHAREHOLDERS Corporate Governance Report with Corporate Governance Declaration
d) Point 4.3.3 Sentence 4 old version: As a matter of precaution, the previous Declaration of Conformity included a deviation to the former version of Point 4.3.3. Due to application of the accounting standard IAS 24, however, the company had already ensured transparency concerning such transactions for many years. e) Point 5.3.3 old version: In Point 5.3.3, the previous version of the Code recommended that the supervisory board should form a nomination committee composed exclusively of shareholder representatives which should propose suitable candidates to the supervisory board for its election proposals to the Annual General Meeting. The company’s Supervisory Board had not formed such a committee. Based on our previous experience, the establishment of such a committee did not appear to be necessary. f) Point 5.4.1 (2) and (3) old version and Point 4.1.5 Sentence 1 old version: Overall, the company deviated from the recommendations made in the previous versions of Point 5.4.1 (2) and (3). In the interests of the company, in terms of the composition of its Board of Management and Supervisory Board, HORNBACH Baumarkt AG accorded priority above all to the knowledge, ability and expert experience of the individual in question. The same applied when the Board of Management selected candi-dates for management positions at the company (Point 4.1.5 Sentence 1 old version). g) Point 5.4.2 Sentence 3 old version: In Point 5.4.2 Sentence 3, the previous version of the Code recommended that the supervisory board should not include more than two former management board members. This was intended to ensure the autonomy of the supervisory board in its advising and monitoring of the management board. However, the Code did not stipulate any number of years for which a former member of the management board was impaired in this respect following his departure from the management board. As a matter of precaution, the company there-fore declared that it deviated from the recommendation made in Point 5.4.2 Sentence 3, even though Dr. Wolfgang Rupf, Albrecht Hornbach and Martin Hornbach retired from their positions on the Board of Management of HORNBACH Baumarkt AG on October 31, 1996, October 31, 2001 and December 31, 2001 respectively. h) Point 5.4.6 (3) Sentence 1 old version: In Point 5.4.6 (3) Sentence 1, the previous version of the Code recommended that the compensation of super-visory board members be reported in the notes to the financial statements or the management report on an individual basis and broken down into its constituent components. Given that the amount of compensation paid to the Supervisory Board is governed by the Articles of Association, we saw no need to disclose individual compensation packages. 2. Period since publication of new version of Code on April 24, 2017 The recommendations of the "German Corporate Governance Code" in the version dated February 7, 2017 and published in the Federal Official Gazette on April 24, 2017 were basically complied with apart from the deviations already listed and substantiated for the future in Section I. Furthermore, the company also did not comply with the recommendations included in Point 4.1.5 Sentence 1, 4.2.3 (4) and (5), 4.3.3 Sentence 4, 5.3.3, and 5.4.1 (2) to (4). These deviations from the recommendations were due to the following considerations: a) Point 4.2.3 (4) and (5): No application was made of the recommendations in Point 4.2.3 (4) ("severance payment cap") and (5) ("change of control compensation cap") of the Code. These deviations were due to competition-related factors.

TO OUR SHAREHOLDERS Corporate Governance Report with Corporate Governance Declaration 17
b) Point 4.3.3 Sentence 4: As a matter of precaution, a deviation from the unchanged recommendation in Point 4.3.3 Sentence 4 was declared in the previous Declaration of Conformity. Due to application of the accounting standard IAS 24, however, the company had already ensured transparency concerning such transactions for many years. c) Point 5.3.3: In Point 5.3.3, the Code recommended that the supervisory board should form a nomination committee com-posed exclusively of shareholder representatives which should propose suitable candidates to the supervisory board for its election proposals to the Annual General Meeting. The company’s Supervisory Board had not formed such a committee. Based on our previous experience, the establishment of such a committee did not appear to be necessary. d) Point 5.4.1 (2) to (4) and Point 4.1.5 Sentence 1: Overall, the company deviated from the recommendations made in Point 5.4.1 (2) to (4). In the interests of the company, in terms of the composition of its Board of Management and Supervisory Board, HORNBACH Baumarkt AG accorded priority above all to the knowledge, ability and expert experience of the individual in question. The same applied when the Board of Management selected candidates for management positions at the company (Point 4.1.5 Sentence 1). Bornheim bei Landau, December 2017 HORNBACH Baumarkt AG Supervisory Board Board of Management The above Declaration of Conformity dated December 2017 has been published on our website together with all earlier Declarations of Conformity and is also available as a download.
www.hornbach-group.com Investor Relations > Corporate Governance > Declaration of Conformity

18 TO OUR SHAREHOLDERS Corporate Governance Report with Corporate Governance Declaration
2. Share Capital and Share Class
The share capital of HORNBACH Baumarkt AG amounts to € 95,421,000 and is divided into 31,807,000 no-par ordinary bearer shares with a prorated amount of share capital of € 3.00 per share.
3. Structure and Modus Operandi of Company Boards
HORNBACH Baumarkt AG, based in Bornheim bei Landau, is governed by the requirements of German law, as well as by the provisions of its own Articles of Association. Accordingly, HORNBACH Baumarkt AG has a dualistic management structure, which assigns management of the company to the Board of Management and super-vision of the company to the Supervisory Board.
3.1 Supervisory Board The Supervisory Board of HORNBACH Baumarkt AG consists of sixteen members and, consistent with the German Codetermination Act (MitBestimmG), includes equal numbers of shareholder and employee representatives. The CVs of the Supervisory Board members have been published on our website. Shareholder representatives are elected by the Annual General Meeting. The Supervisory Board Chairman coordinates the work of the Supervisory Board and attends to the affairs of the Supervisory Board externally. In the event of a parity of votes in the Supervisory Board, the Supervisory Board Chairman has the casting vote in the second round, if renewed voting also produces a parity. The Board of Management and Supervisory Board work together closely in the interests of the company. The Supervisory Board monitors the management of the company and accompanies the Board of Management in an advisory capacity. It appoints members of the Board of Management, dismisses them, and is responsible for concluding, amending and terminating their employment contracts. Any actions by the Board of Management that could materially influence the company’s net asset, financial or earnings position require prior approval by the Supervisory Board. The Code of Procedure for the Supervisory Board contains a catalog of the transactions and actions requiring such approval. The Supervisory Board may at any time resolve to extend or reduce the list of such transactions. Supervisory Board members are solely bound by the company’s best interests. They are not dependent on any assignments or instructions. In their decisions, they may not pursue personal interests or exploit business opportunities available to the company for their personal benefit. Supervisory Board members are obliged to disclose any conflicts of interest to the Supervisory Board Chairman, especially any such conflicts arising due to their performing any consultant or directorship function at customers, suppliers, lenders or other business partners of the company. Any conflicts of interest on the part of a Supervisory Board member that are material and not only temporary should result in the termination of the mandate. No conflicts of interest arose in the year under report. Advisory and other service agreements and contracts for work between a Supervisory Board member and the company require approval by the Supervisory Board. There were no contracts requiring such approval with Supervisory Board members of HORNBACH Baumarkt AG in the 2017/18 financial year.

TO OUR SHAREHOLDERS Corporate Governance Report with Corporate Governance Declaration 19
The Supervisory Board has the following committees: Mediation Committee Personnel Committee Audit Committee Nomination Committee The composition of the committees and a detailed description of their activities have been provided in the "Directors and Officers" and "Report of the Supervisory Board" chapters.
3.1.1 Targets for the composition of the Supervisory Board, competence profile, diversity concept, and manner of implementation
Taking due account of the recommendations made in Point 5.4.1 of the German Corporate Governance Code, on December 19, 2017 the Supervisory Board adopted the targets for its composition, including a competence profile for the overall board. The corresponding Supervisory Board resolution also includes the diversity concept for the Supervisory Board, which has set the objective of creating space for younger members without losing experienced members. Given the diverse composition thereby envisaged and the resultant variety of viewpoints and perspectives accounted for, the concept is intended to ensure that the Supervisory Board can optimally perform its tasks. Pursuant to the competence profile, the Supervisory Board of HORNBACH Baumarkt AG must possess the expertise needed to fulfill its supervisory function and to assess and monitor the transactions performed by the company. To this end, the Supervisory Board members must collectively be familiar with the sector in which the company operates. This particularly includes knowledge, skills, and professional expertise in operating large-scale retail stores, especially DIY stores and home improvement centers, with or without garden centers, specialist stores, other specialist retail businesses, and e-commerce. This also includes expertise in the fields of digitization and technology, as well as in accounting, auditing, financing, and corresponding legal expertise, including expertise in the field of tax law. In view of these factors, and to compile its competence profile, the Supervisory Board listed the following objectives for its composition which are both specific and tailored to the company's individual situation: Supervisory Board members must be reliable, possess the expertise needed to fulfill their supervisory
function and to assess and monitor the transactions performed by HORNBACH Baumarkt AG, and must have sufficient time to dedicate to their duties as members of the Supervisory Board.
The Supervisory Board must collectively have the knowledge, skills, and professional expertise required to properly perform its duties. In particular, expertise in matters relating to the operation of a retail company must be available in the Supervisory Board, as must management experience, experience in managing and organizing companies, and experience in working in Supervisory Boards.
The Supervisory Board must avoid potential conflicts of interest, and will continue to do so in future. The Supervisory Board should not include any members who hold directorships or perform advisory func-
tions at any significant competitors. The composition of the Supervisory Board accounts for the diversity criterion, in particular with regard to
the ages, genders, educational and career backgrounds of its members. As a general rule, the Supervisory Board should only include individuals who were no older than 70 at the
time of their election. As a general rule, the Supervisory Board should only include individuals who have not been members of
the Supervisory Board for four full terms already at the time of their election.
Directors and Officers Supervisory Board committees Report of the Supervisory Board Committees and committee meetings

20 TO OUR SHAREHOLDERS Corporate Governance Report with Corporate Governance Declaration
The Supervisory Board should include a suitable number of independent members. The Supervisory Board believes that it is sufficient in this respect if at least half of its members are independent.
Shareholder representatives who have been members of the Supervisory Board for more than three terms in office are now no longer deemed as independent in this respect.
Supervisory Board proposals to the Annual General Meeting should – and will – take due account of these objectives and the diversity concept, while at the same time endeavoring to ensure that the competence profile for the Board as a whole is satisfied.
3.1.2 Implementation status for (i) the objectives underlying the composition of the Supervisory Board, (ii) the diversity concept, and (iii) the competence profile, as well as the disclosures on the inde-pendence of shareholder representatives on the Supervisory Board
Subject to the share of women (c.f. Section "2.3 Share of Women in Senior Management Positions"), the current composition of the Supervisory Board meets the aforementioned composition-related objectives, complies with the diversity concept, and satisfies the competence profile. The members of the Supervisory Board complement one another in terms of their ages, educational, and career backgrounds, experience, and expertise in such a way that the Board as a whole can draw on a highly varied wealth of experience and broad range of skills. No members of the Supervisory Board of HORNBACH Baumarkt AG hold any directorships or perform advisory functions at significant competitors. The regular periods of membership and regular age limits are laid down in the Code of Procedure of the Supervisory Board and are complied with. Assuming that the holding of a Supervisory Board mandate as an employee representative does not give rise to any doubts concerning satisfaction of the independence criteria set out in Point 5.4.2 of the Code, the Supervisory Board currently includes twelve independent members, of which four shareholder representa-tives. These are Dr. John Feldmann, Erich Harsch, Joerg Walter Sost, and Prof. Dr. Jens Wulfsberg.

TO OUR SHAREHOLDERS Corporate Governance Report with Corporate Governance Declaration 21
3.1.3 Individualized disclosure of meeting attendance
Supervisory Board Meetings attended
Attendance in %
Albrecht Hornbach, Chairman 4/4 100.00 Dr. Wolfgang Rupf, Deputy Chairman 4/4 100.00 Kay Strelow, Deputy Chairman 4/4 100.00 Dr. John Feldmann 4/4 100.00 Erich Harsch 4/4 100.00 Martin Hornbach 4/4 100.00 Michael Reiland 4/4 100.00 Joerg Walter Sost 4/4 100.00 Mohamed Elaouch 4/4 100.00 Martin Fischer 2/4 50.00 Christian Garrecht 4/4 100.00 Kerstin Holfert 4/4 100.00 Georg Hornbach 4/4 100.00 Monika Di Silvestre 3/4 75.00 Brigitte Mauer 4/4 100.00 Prof. Dr. Jens Wulfsberg 4/4 100.00 Total 95.31
Audit Committee Meetings
attended Attendance
in %
Dr. Wolfgang Rupf, Chairman 5/5 100.00 Dr. John Feldmann 4/5 80.00 Erich Harsch 5/5 100.00 Albrecht Hornbach 5/5 100.00 Martin Hornbach 5/5 100.00 Michael Reiland 5/5 100.00 Joerg Walter Sost 5/5 100.00 Kay Strelow 5/5 100.00 Total 97.5
Nomination Committee Meetings
attended Attendance
in %
Albrecht Hornbach, Chairman 1/1 100.00 Dr. John Feldmann 1/1 100.00 Martin Hornbach 1/1 100.00 Dr. Wolfgang Rupf 1/1 100.00 Total 100.00

22 TO OUR SHAREHOLDERS Corporate Governance Report with Corporate Governance Declaration
3.2 Board of Management The Board of Management of HORNBACH Baumarkt AG has a Chairman and a Deputy Chairman and consisted of seven members at the end of the 2017/18 financial year. The Board of Management has a self-imposed Code of Procedure. The management of the company’s business is the joint responsibility of all of its mem-bers. Compliance activities to ensure that the company adheres to laws, legal requirements, and its own in-ternal guidelines represent a key management task. The Board of Management usually meets once a week, or on an ad-hoc basis when necessary. The Board of Management provides the Supervisory Board with regular, prompt and extensive information on all matters relevant to the company’s corporate strategy, planning, business performance, financial and earnings position, risk situation and risk management. Furthermore, it presents the group investment, financial and earnings budgets to the Supervisory Board both for the forthcoming financial year and for the medium term (five years). The Chief Executive Officer provides immediate report to the Supervisory Board Chairman of any significant events of material relevance for any assessment of the situation, development, and management of the company. Transactions and measures requiring approval by the Supervisory Board are presented to the Supervisory Board in good time. Members of the Board of Management are obliged to disclose conflicts of interest to the Supervisory Board without delay and to inform other members of the Board of Management. Members of the Board of Management may only pursue sideline activities, in particular Supervisory Board mandates outside the Group, with the approval of the Supervisory Board Chairman. The CVs of the members of the Board of Management have been published on our website.
Objectives for the composition of the Board of Management, diversity concept, and manner and status of implementation The Supervisory Board adopted its objectives for the composition of the Board of Management and a diversity concept for the Board of Management on December 19, 2017. Accordingly, the composition of the Board of Management must take due account of the challenges faced by the company in its specific situation and of long-term succession planning. Alongside customary specialist qualifications, the criteria to be referred to when selecting candidates particularly include their leadership qualities and achievements to date. Due account should be taken of diversity, particularly with regard to the educational and professional backgrounds, gender, and age of candidates: The members of the Board of Management should collectively have longstanding experience in the fields
of store operations, finance, procurement, personnel management, logistics, marketing, and technology, and should be able to contribute experience from a variety of professions.
The Supervisory Board has laid down a target for the share of women on the Board of Management. This should be complied with.
The regular age limit for members of the Board of Management is 65. The diversity concept aims on the one hand to retain experienced members of the Board of Management and on the other hand to create space for younger members. The diversity of composition accounted for in the concept is intended to ensure that the company is optimally managed on account of the resultant variety of viewpoints and perspectives. In its decisions concerning the appointment of members of the Board of Management, the Supervisory Board should and will take due account of these objectives and implement the diversity concept. We are convinced that the aforementioned objectives were fully satisfied in the year under report and that the diversity concept has been suitable implemented.
Directors and Officers Members of the Board of Management and their areas of responsibility

TO OUR SHAREHOLDERS Corporate Governance Report with Corporate Governance Declaration 23
Overall, the Board of Management, which also includes one woman, has the knowledge, skills and professional expertise needed to properly perform its duties. No member of the Board of Management exceeds the targeted regular age limit.
3.3 Share of women in senior management positions HORNBACH Baumarkt AG is obliged under the "Act on the Equal Participation of Men and Women in Private-Sector and Public-Sector Management Positions" to set targets for the share of women on its Board of Manage-ment and next two senior management tiers. The company set its first targets in this respect in summer 2015. These were to be met by June 30, 2017. In the meantime, the company has reviewed these targets and extended them through to February 28, 2022. With regard to the share of women on the Supervisory Board, the fact that HORNBACH Baumarkt AG is subject to codetermination and publicly listed means that it applies the statutory requirement of a fixed minimum quote of 30 %. Specifically:
3.3.1 Women on the Board of Management and Supervisory Board At its meeting on July 8, 2015, the company's Supervisory Board had set the target share of women on the Board of Management to be reached by June 30, 2017 at no less than 1/7 pursuant to § 111 (5) AktG. At its meeting on May 23, 2017, the company's Supervisory Board confirmed this target, which was actually achieved, and extended the target of no less than 1/7, while upholding the current status, through to February 28, 2022. The Supervisory Board currently includes three female members (status: May 2018). As there has so far not been any occasion to elect new members, the minimum share provided for in § 92 (2) AktG is currently not complied with. However, this share will be met at the next Supervisory Board elections in July 2018, taking due account of the decision taken that both employee and shareholder representatives should separately meet the respective share.
3.3.2 Women in the two management tiers below the Board of Management In May 2017, the Board of Management of HORNBACH Baumarkt AG adopted a resolution pursuant to § 76 (4) AktG which set the share of women to be achieved in the two management tiers below the Board of Management by February 28, 2022, while upholding the current status, at no less than 9 % in the first management tier and no less than 13 % in the second management tier. The target of 6 % adopted on August 31, 2015 for the share of women in the first management tier was achieved by June 30, 2017. The target for the second management tier, which was set at 14 % by June 30, 2017, was not met. However, this was solely due to the fact that the framework also used to determine the share of women was itself amended as of March 1, 2016. The previously applicable functional level model was rescinded. Management staff are now differentiated by reference to their management level.
3.4 Annual General Meeting Shareholders of HORNBACH Baumarkt AG exercise their rights, including their voting rights, at the Annual General Meeting. Each ordinary share in HORNBACH Baumarkt AG grants one vote. The Annual General Meeting resolves in particular on the appropriation of profits and approval of the actions of the Board of Management and Supervisory Board, and elects shareholder representatives to the Supervisory Board, as well as the auditor. Shareholders are regularly informed of all significant dates by means of the financial calendar published in the annual and quarterly reports and on the company’s homepage. The Annual General Meeting is generally chaired by the Supervisory Board Chairman. HORNBACH Baumarkt AG provides its shareholders with the ser-vices of a voting proxy bound to vote in line with instructions.

24 TO OUR SHAREHOLDERS Corporate Governance Report with Corporate Governance Declaration
4. Reporting and Auditing of Annual Financial Statements
The HORNBACH Baumarkt AG Group prepares its financial reports in accordance with International Financial Reporting Standards (IFRS) as adopted by the EU. The separate financial statements of HORNBACH Baumarkt AG are prepared in accordance with the German Commercial Code (HGB). In line with legal requirements, the auditor is elected by the Annual General Meeting. The Audit Committee prepares the Supervisory Board’s proposal to the Annual General Meeting with regard to the auditor to be elected. The auditor is independent and is responsible for the audit of the consolidated and separate financial statements, as well as for the audit review of half-year financial reports. HORNBACH Baumarkt AG has a risk management system that is continually enhanced and updated to account for changes in conditions. The functionality of the early warning risk manage-ment system is checked by the auditors.
5. Transparency
The company’s shareholders, all capital market participants, financial analysts, investors, shareholder asso-ciations, and the media are regularly provided with up-to-date information about the company’s situation, results, and any material changes in its business situation. The HORNBACH Baumarkt AG Group reports in its Quarterly financial reports Half-year financial report Annual report Annual results press conference Conference calls with international financial analysts and investors Events with financial analysts and investors in Germany and abroad. The documents and dates of relevance to the company’s regular financial reporting activities are published on our homepage. Alongside this regular reporting, any information arising at HORNBACH Baumarkt AG which is not publicly known and which is likely to influence the company’s share price significantly is pub-lished in the form of ad-hoc announcements as insider information pursuant to Article 17 of the Market Abuse Regulation (MAR). All individuals working on behalf of the company and with access to insider infor-mation in the course of their activities are informed of the resultant obligations for them under insider law. Members of the Board of Management and the Supervisory Board of HORNBACH Baumarkt AG, and individuals closely related to such, are required by Article 19 of the Market Abuse Regulation (MAR) to disclose transactions involving shares in the company or related financial instruments. In the year under report, the company was not notified of any own-account transactions by directors or individuals closely related to such.
www.hornbach-group.com Investor Relations and Financial Calendar
TO OUR SHAREHOLDERS Corporate Governance Report with Corporate Governance Declaration 25
6. Relevant Corporate Governance Practices
We base our entrepreneurial activities on the legal frameworks valid in the various countries in which we op-erate. This places a wide variety of obligations on the HORNBACH Baumarkt AG Group and its employees in Germany and abroad. As well as managing the company responsibly in accordance with the relevant laws, ordinances and other guidelines we have also compiled internal group guidelines setting out the system of values and management principles we adhere to at the Group. We have published the information referred to below on our website.
6.1 Our system of values: the HORNBACH Foundation HORNBACH is a forward-looking, family-managed company and is characterized by a clear system of values. The values on which this system is based are honesty, credibility, reliability, clarity and trust in people. This sys-tem of values, which had already been lived over many decades, was summarized in the so-called "HORNBACH Foundation" in 2004. This model forms the cornerstone for our group strategy, everyday behavior, and corporate social responsibility. It lays down the basic values governing how we behave towards our customers, as well how our employees behave towards each other. Moreover, this foundation helps our shareholders, customers, and the general public, as well as our employees, to understand what the basis of our business success is.
6.2 Compliance In a competitive climate, only those companies which manage to convince their customers with their innovation, quality, reliability, dependability, and fairness on an ongoing basis will succeed in the long term. Here, we see compliance with legal requirements, internal company guidelines and ethical principles (compliance) as abso-lutely crucial. HORNBACH’s corporate culture is based on these principles. HORNBACH has a value-based compliance system which primarily pursues the objective of preventing compliance infringements before they arise, where possible. The "HORNBACH Foundation" forms the basis for HORNBACH's system of values. The principles included in the "HORNBACH Foundation" are fleshed out in the "HORNBACH Values". These formulate the standards of conduct expected of managers and employees with regard to the stakeholder groups of "Government and Society", "Managers and Employees", "Customers, Suppliers and Competitors", and "Providers of Equity and Debt Capital". Among other factors, they set out how we meet our responsibility towards society, treat each other with respect, are committed to fair competi-tion, act with integrity, and manage our financial reporting. The "HORNBACH Values" have been translated into all languages relevant to the Group and made available to all employees. The "Accepting and Granting Gratuities" code of conduct sets out guiding principles which make clear what HORNBACH expects of its managers and employees in this regard. This code of conduct has been communi-cated on a top-down basis and distributed to employees in the form of a leaflet compiled in the relevant national language. Upon joining the company, our employees are informed about compliance-related topics with the assistance of the HORNBACH Values and the codes of conduct. The Board of Management bears overall responsibility for compliance. One core component of HORNBACH's compliance system is the Compliance Committee, which acts as the topmost advisory body for compliance organization. The Chief Compliance Officer is responsible for coordinating group-wide compliance activities. This officer reports to the Board of Management and is responsible for permanently optimizing the Group’s compliance organization and structures. The Chief Compliance Officer is supported by compliance officers operating on a decentralized basis in all of HORNBACH’s regions and departments. HORNBACH's compliance system is subject to regular reviews and enhancements.
www.hornbach-group.com Investor Relations > Corporate Governance
www.hornbach-group.com Investor Relations > Corporate Governance > Compliance

26 TO OUR SHAREHOLDERS Corporate Governance Report with Corporate Governance Declaration
Compliance activities have a particular focus on the risks of "Improper conduct/corruption" and "Cartel law violations". Compliance officers are required to report on a half-yearly basis on the development in these risks and the potential materialization of new risks. Suitable measures have been laid down to reduce such risks. Since mid-2017, the compliance system has been supported by an internet-based whistleblower system. This provides employees, service providers, and suppliers in all countries in which HORNBACH operates with the possibility of communicating directly with the Chief Compliance Officer. This way, potential infringements of compliance requirements can be reported, also anonymously if preferred. Notifications received via the whistleblower system are assessed by the Chief Compliance Officer on an on-going basis. Where there is legitimate reason to suspect a compliance-related infringement, the Group Inter-nal Audit department investigates the matter. Where compliance infringements are actually detected, the company initiates labor law, criminal law, and civil law proceedings. In the year under report, there was a low single-digit number of confirmed compliance infringements at the HORNBACH Group.

TO OUR SHAREHOLDERS Compensation Report 27
Compensation Report
The compensation report presents the basic features and structure of the compensation of the Board of Management and the Supervisory Board. It forms a constituent component of the group management report and, apart from the disclosure of individual compensation, is based on the recommendations of the German Corporate Governance Code.
1. Compensation of Board of Management
1.1 Compensation system at HORNBACH Baumarkt AG Compensation of members of the Board of Management is determined in line with the requirements of stock corporation law and of the Act on the Appropriateness of Management Board Compensation (VorstAG), taking due account of levels of compensation customary in the market. Total compensation of members of the Board of Management comprises the components of fixed annual salary, annual variable compensation, plus ancillary benefits customary to the market and the company. Total compensation is regularly reviewed by the Supervi-sory Board in terms of its appropriateness. Fixed annual salary:
Members of the Board of Management receive a fixed annual salary laid down in their individual contracts, which is paid monthly in twelve equal portions at the end of each calendar month. Fixed salaries are graded at different levels for the Chairman, Deputy Chairman, and regular members of the Board of Management.
Variable compensation:
Alongside fixed annual salaries, members of the Board of Management also receive annual variable compensation in line with the company’s sustainable performance. This is based both on company targets and on targets agreed for individual members of the Board of Management. The key performance factor used to determine variable compensation is average consolidated net income (IFRS) at HORNBACH Baumarkt AG. Variable compensation is calculated on the basis of the three-year average level of consoli-dated net income (IFRS) at HORNBACH Baumarkt AG. Individual variable compensation is separately graded at different levels for the Chairman, Deputy Chairman and for each regular member of the Board of Management. For no individual member of the Board of Management does it exceed 1 % of the three-year average level of consolidated net income (IFRS) at HORNBACH Baumarkt AG. Of variable compensation calculated on the basis of average consolidated net income (IFRS), up to 25 % is calculated and determined in several stages following achievement of the targets individually set for each member of the Board of Management for the respective financial year. This process is based on targets individually agreed in advance for each member of the Board of Manage-ment. To set these targets, the Supervisory Board of HORNBACH Baumarkt AG and the respective member of the Board of Management reach a target agreement before the beginning of each financial year in which the individual targets, their respective percentage weighting and the respective degree of target achievement are determined by the full Supervisory Board. Following completion of the financial year, the full Supervisory Board determines the degree of individual target achievement for the respective member of the Board of Management. The remaining 75 % of variable compensation is determined on the sole basis of the average level of consolidated net income (IFRS) at HORNBACH Baumarkt AG for the past three years. For all members of

28 TO OUR SHAREHOLDERS Compensation Report
the Board of Management, the level of variable compensation is capped at a maximum of 150 % of the respective fixed salary of the individual member of the Board of Management. No further variable compensation is granted.
1.2 Internal ratio of compensation components: No specific ratio of fixed salary to variable compensation components has been stipulated. In particular, apart from the cap at a maximum of 150 % of the fixed salary, no specific relationship has been determined for the amount of fixed annual salary compared with the amount of annual variable compensation. The structure of annual variable compensation ensures that the overwhelming share of such compensation (75 %) is based on long-term factors, complying with the predominantly multiyear nature called for in the relevant legislation. In individual cases, the compensation system may be adapted by the full Supervisory Board, taking account of legal requirements, to the extent deemed necessary to account for the duties and performance of the respective member of the Board of Management.
1.3 Retirement and pension commitment Members of the Board of Management of HORNBACH Baumarkt AG are granted individual contractually agreed pension commitments. These consist of a defined contribution pension scheme amounting to 25 % of their fixed salaries, payable in two equal shares of 50 % as of August 31 and February 28/29 of each year. The de-fined contribution pension scheme involves the following key aspects: Direct, defined contribution capital commitment executed by way of direct commitment Accumulation of policy reserve and netting with pension provisions in balance sheet Retirement pension payable upon retirement from age 65 or earlier if appropriate, but at the earliest
from age 60 in line with the Supervisory Board resolution either as a one-off payment, in several annual installments or as a pension, one-off payment of pension capital upon death or invalidity
Guaranteed return on pension capital of 2 % p.a. plus excess return on capital commitment The claims are vested for all current members of the Board of Management Insurance against insolvency via the Pension Assurance Association (PSVaG), Cologne, with additional
cover by recognizing trust assets for the pension contributions Annual 1 % indexing in current pensions Voluntary contributions permitted by members of Board of Management from fixed and variable compensa-
tion components due in future in unspecified amounts up to a maximum of one total annual compensation package.
1.4 Regulations governing premature departure from the company (severance pay regulations) From January 2018, employment contracts newly agreed or extended with members of the Board of Manage-ment will provide for caps on the compensation paid in the event of their activity on the Board of Management being terminated prematurely. The recommendations made in Point 4.2.3 (4) of the German Corporate Governance Code will therefore be complied with in future.

TO OUR SHAREHOLDERS Compensation Report 29
1.5 Additional benefits Members of the Board of Management of HORNBACH Baumarkt AG receive the following further specific benefits to an extent customary to the market and the Group. Some of these are deemed benefits in kind and taxed accordingly: Reimbursement of travel and other expenses incurred in the interests of HORNBACH Baumarkt AG based
on the actual amounts incurred Grants towards private health insurance, voluntary retirement pension scheme or alternatively contributions
to a private life insurance policy Accident insurance covering fatality and invalidity Temporary continuation of payment of compensation in event of sickness or death Claim to provision of a company car for work-related and private use or to settlement based on the average
monthly costs of providing a company car.
1.6 Compensation of the Board of Management for the 2017/18 financial year Total compensation of the Board of Management for the 2017/18 financial year amounted to € 5,535k. Of this sum, € 2,828k constituted fixed compensation and € 2,707k involved performance-related components. Post-employment benefits of € 663k were incurred for active members of the Board of Management in the 2017/18 financial year (pension provision endowment). Pension provisions for former members of the Board of Management total € 1,246k. All pension provisions are offset by corresponding value credits. Given the company’s size and its market position, we believe that the total compensation of the Board of Management is appropriate. At the 2016 Annual General Meeting, shareholders voted with a three-quarters majority to forego the disclosure of the compensation of members of the Board of Management on an individual basis up to and including the 2020/21 financial year (opting-out clause).
2. Compensation of the Supervisory Board
Supervisory Board compensation is governed by § 15 of the Articles of Association of HORNBACH Baumarkt AG. As well as reimbursement of expenses, each Supervisory Board member receives fixed compensation of € 20,000 retrospectively payable on the day after the Annual General Meeting acknowledging the annual financial statements for the financial year. The Chairman receives two-and-a-half times and the Deputy Chairman twice the fixed compensation. Supervisory Board members who also sit on a Supervisory Board committee receive additional fixed committee compensation of € 9,000 for the Audit Committee, € 6,000 for the Personnel Committee, and € 4,000 for the Mediation Committee, should this be convened. This compensation is retrospectively payable together with the fixed compensation. Supervisory Board members who chair a Supervisory Board committee receive two-and-a-half times the respective committee compensation. The compensation of the Supervisory Board for the 2017/18 financial year totals € 515k. Of this, € 390k is basic compensation and € 125k for committee activity. Compensation totaling € 362k was paid for the 2017/18 financial year for further Supervisory Board positions at HORNBACH Holding AG & Co. KGaA or HORNBACH Management AG (basic: € 245k; committee: € 117k).

30 TO OUR SHAREHOLDERS The HORNBACH Baumarkt Share
The HORNBACH Baumarkt Share
1) In Xetra trading 2) Year-end price ÷ earnings per share 3) Year-end price ÷ book value per share 4) Year-end price ÷ cash flow from operating activities per share
5) 2017/18: proposal to 2018 Annual General Meeting 6) Dividend per share ÷ earnings per share 7) Dividend per share ÷ year-end price
2017/18 on the Stock Markets
Hangover in the wake of record high For equity investors, the 2017 calendar year developed more pleasingly than expected. Benefiting from a climate of persistently favorable interest rates, robust global economic growth, and rising corporate earnings, all major stock indices reported substantial increases. Volatility fell to historic lows, and that despite distinct political risks in connection with elections in Europe, the Brexit negotiations, and uncertainty surrounding the future political course of the USA. The DAX, Germany's lead index, reached a record high of more than 13,500 points in November, but nevertheless had to absorb slight losses once again at the end of the year. 2018 began on a promising note, with a clear upward trend in global stock markets and new record highs in January. This was followed by a marked drop in prices in February. The DAX fell around 11 % from 13,560 points to 12,107 points, closing at 12,436 points at the end of February.
HORNBACH Baumarkt share price performance The HORNBACH Baumarkt share price rose by 2.6 % during the 2017/18 financial year (March 1, 2017 to February 28, 2018). Including the distribution, and assuming reinvestment of the dividend, the share price rose by 4.8 %. It thus fell short of its comparative indices: DAX (+5.1 %), SDAX (+21.0 %), and the DAXSector All Retail Performance Index (+14.5 %).
Key figures for the HORNBACH Baumarkt share 2017/18 2016/17 2015/16 2014/15 2013/14
Year-end price1) € 30.50 29.72 25.77 32.60 30.50 12-month high1) € 33.32 31.50 38.60 34.98 31.10 12-month low1) € 28.90 23.69 24.51 26.56 24.00 Shares issued Number 31,807,000 31,807,000 31,807,000 31,807,000 31,807,000 Market capitalization € 000s 970,114 945,304 819,666 1,036,908 970,114 Earnings per share € 1.84 1.66 2.28 2.19 1.77 Price / earnings ratio2) 16.6 13.0 11.3 14.9 17.2 Book value per share € 32.97 30.59 30.59 29.02 27.10 Price-to-book ratio3) 0.9 1.0 0.8 1.1 1.1 Cash flow from operating activities per share € 4.22 3.62 3.35 3.38 4.54 Price / cash flow ratio4) 7.2 8.2 7.7 9.7 6.7 Dividend per share5) € 0.68 0.68 0.68 0.60 0.60 Distribution total5) € 000s 21,629 21,629 21,629 19,084 19,084 Payout ratio5),6) % 37.0 41.0 29.8 27.4 33.9 Dividend yield7) % 2.2 2.3 2.6 1.8 2.0 Performance including dividend % 4.8 18.6 -19.5 8.9 19.7 Performance excluding dividend % 2.6 15.3 -21.0 6.9 17.3 Average daily trading volume1) Number 5,399 8,201 10,246 10,476 2,968

TO OUR SHAREHOLDERS The HORNBACH Baumarkt Share 31
At the beginning of the financial year, the HORNBACH Baumarkt AG share initially performed more weakly than the German stock market and reached its annual low at € 28.90 on April 13. The share recovered during the summer months, posting its annual high at € 33.32 on September 1. Following a slight downward trend in the second half of the financial year, a development due in part to the difficult market climate, the share closed at € 30.57 in Xetra trading on the balance sheet date on February 28, 2018 (2016/17: € 29.72). The market capitalization therefore amounted to € 970 million at the end of the financial year (2016/17: € 945 million).
Interesting for value investors The parent company HORNBACH Holding AG & Co. KGaA still owns 76.4 % of the total of around 31.8 million ordinary shares issued. Based on the definition of the German stock exchange, the free float therefore amounted to 23.6 % at the end of the financial year. These shares are held in particular by international institutional investors. HORNBACH shares are especially interesting to value investors with a long-term focus, as they see the further sustainable growth potential harbored by the business model.
Share buyback for employee stock program The annual issue of employee shares has a long tradition at HORNBACH. Since the 1993/94 financial year, the year of the company's IPO, employees entitled to subscribe have been offered the opportunity to acquire shares in HORNBACH Baumarkt at advantageous prices and thus to benefit from the company's sustainable business performance and long-term success. A total of 2,459 HORNBACH Group employees participated in last year's employee stock program, with 46,960 shares being transferred in all.
March
2017 >>
April May June
Share price performance: March 1, 2017 to February 28, 2018
110
130
120
100
90
Index (100 = base February 28, 2017)
July August September October November December January
2018 >>
February
80
HORNBACH Baumarkt AG (Xetra) SDAX DAX

32 TO OUR SHAREHOLDERS The HORNBACH Baumarkt Share
Analyst assessments As of the balance sheet date on February 28, 2018, the HORNBACH Baumarkt share was regularly covered by four financial analysts (2016/17: five) in research reports and studies. Of these analysts, two recommended buying and two holding the share as of the balance sheet date. Their average share price target of € 35.50 implies upward potential of 16 % compared with the closing price at the end of our 2017/18 financial year. The current list of banks and research institutes regularly reporting on HORNBACH and their respective recommendations for the share can be viewed at the HORNBACH Group's website.
Dividend policy HORNBACH pursues a continuity-based dividend policy which aims to maintain a fair balance between shareholders’ interests on the one hand and financing the company’s growth on the other hand. The Board of Management and Supervisory Board of HORNBACH Baumarkt AG will propose a dividend of € 0.68 per share with dividend entitlement, and thus at the same level as in the previous year, for approval by the Annual General Meeting on July 5, 2018. The distribution total of € 21,629k corresponds to a distribution quota of 37.0 % (2016/17: 41.0 %) of earnings per share.
Financial communications Our investor relations activities provided shareholders, analysts, the financial media, and the general public with prompt information on the business performance of the HORNBACH Baumarkt AG Group in the past financial year. All quarterly statements, annual reports, press releases, and additional financial information were published on the website of the HORNBACH Group. The Annual General Meeting, the annual results press conference, analysts’ press conferences, and meetings with investors give us the opportunity to main-tain our dialog with the capital markets. Moreover, we draw on personal contacts to investors and the media to present our company’s objectives and strategy. Key data about the HORNBACH Baumarkt share Type of share No-par ordinary bearer shares Stock exchanges Frankfurt, Xetra Market segment Prime Standard Security identification number (WKN) 608440 ISIN DE0006084403 Stock market ticker HBM Bloomberg HBM GY Reuters (Xetra) HBMG.DE Financial year March 1 to February 28 (29) Initial public offering 11.15.1993 Number of shares 31,807,000 Share capital € 95,421,000
www.hornbach-group.com Investor Relations > Shares > Analysts Recommenda-tions
www.hornbach-group.com Investor Relations

TO OUR SHAREHOLDERS The HORNBACH Baumarkt Share 33
FINANCIAL CALENDAR 2018
May 24, 2018 Annual Results Press Conference 2017/18
Publication of Annual Report DVFA Analysts' Conference
June 22, 2018 Quarterly Statement: 1st Quarter of 2018/19 as of May 31, 2018
July 5, 2018 Annual General Meeting Festhalle Landau, Landau/Pfalz
September 27, 2018 Half-Year Financial Report 2018/19 as of August 31, 2018
December 20, 2018 Quarterly Statement: 3rd Quarter of 2018/19 as of November 30, 2018 Investor Relations Axel Müller Tel: (+49) 0 63 48 / 60 - 24 44 Fax: (+49) 0 63 48 / 60 - 42 99 [email protected] Internet: www.hornbach-group.com

34 COMBINED MANAGEMENT REPORT Group Fundamentals
COMBINED MANAGEMENT REPORT Group Fundamentals
1. The Group at a Glance
The HORNBACH Baumarkt AG Group (hereinafter "HORNBACH") is one of Europe's leading do-it-yourself (DIY) retail companies. At the balance sheet date on February 28, 2018, the Group operated 156 DIY megastores with garden centers with a uniform market presence in nine countries. Of these, 98 locations are in Germany. A further 58 stores are located in the following other European countries: Austria (14), the Netherlands (13), Luxembourg (1), the Czech Republic (10), Switzerland (6), Sweden (5), Slovakia (3), and Romania (6). With total sales areas of more than 1.8 million m², the average size of a HORNBACH DIY store with a garden center amounts to around 11,700 m². In all of the countries in which it operates, HORNBACH combines its stationary retail business with its online stores (e-commerce) to act as a multichannel DIY retailer, an approach we also refer to as interconnected retail. In the 2017/18 financial year (March 1, 2017 to February 28, 2018), the HORNBACH Baumarkt AG Group gener-ated net sales of around € 3.9 billion. This makes HORNBACH the third-largest retail group in the German DIY sector and the fifth-largest player in Europe. At the balance sheet date on February 28, 2018, the Group had a total of 18,721 employees (2016/17: 18,002), of which 8,201 outside Germany (2016/17: 7,693). The diagram on Page 35 presents the current group structure and provides an overview of the most important shareholdings of HORNBACH Baumarkt AG. Full details about the scope of consolidation and consolidated shareholdings are provided in the notes to the consolidated financial statements. HORNBACH Baumarkt AG is a listed stock corporation. Its parent company HORNBACH Holding AG & Co. KGaA holds 76.4 % of the total of around 31.8 million ordinary shares in the company (ISIN DE0006084403, Prime Standard). 23.6 % of its shares are in free float (status: February 28, 2018). The company was founded in 1877 and is still family-managed, now in the fifth generation.
2. Group Business Model
2.1 Retail activities HORNBACH has decades of experience in operating DIY megastores with garden centers in major regional catchment areas. The company relies on the strengths offered by organic growth. Its portfolio in Germany and abroad is highly homogenous. Most of the Group's stores have sales areas in excess of 10,000 m². This ena-bles HORNBACH to benefit from economies of scale in its operations and conceptual store enhancement measures, as well as in its group logistics. The company is relying not just on its stationary retail business, but is also drawing on the potential harbored by e-commerce. Since January 2018, HORNBACH's online store – a high-performing virtual DIY store and garden center – has been rolled out to all of the countries in which we have stationary DIY retail operations.
156 locations across Europe
€ 3.9 bn consolidated sales
Scope of Consolidation (Page 95 ff)

COMBINED MANAGEMENT REPORT Group Fundamentals 35
HORNBACH has an absolute focus on project customers. On the one hand, those are home improvement en-thusiasts and professional customers wishing to implement extensive renovation and construction projects under their own steam in their houses, apartments, or gardens (do-it-yourself). On the other hand, they also include customers wishing to select their products themselves, but then to have all of the work involved in their project, including all services, performed by a competent partner (do-it-for-me). All of the company's stationary and online activities are tailored to these target groups. HORNBACH thus particularly offers its customers a broad and deep product range stocked in sufficiently large quantities and meeting high quality standards, reliable and transparent permanently low prices, and professional advice and project-related ser-vices. Thanks not least to its innovative advertising, HORNBACH has successfully established itself as a brand among DIY customers and is regularly awarded the best customer satisfaction results in well-known consumer surveys. The product range at HORNBACH stores encompasses around 50,000 articles on average, with up to 150,000 articles available online. Products are structured in the five following divisions: Hard-ware/Electrical, Paint/Wallpaper/Flooring, Construction Materials/Timber/Prefabricated Components, Sani-tary/Tiles, and Garden.
* Plus further shareholdings as presented in the complete overview provided in the notes to the consolidated financial statements. Status: February 28, 2018
Key focus on project customers
HORNBACH Baumarkt AG* Bornheim
HORNBACH Baumarkt GmbH Wiener Neudorf,
Austria
14 megastores
HORNBACH Holding B.V. Amsterdam, Netherlands
13 megastores
HORNBACH Baumarkt CS spol s.r.o.
Prague, Czech Republic
10 megastores
HORNBACH Baumarkt Luxemburg SARL
Bertrange, Luxembourg
1 megastore
HORNBACH Baumarkt (Schweiz) AG
Oberkirch, Switzerland
6 megastores
HORNBACHByggmarknad AB
Gothenburg, Sweden
5 megastores
HORNBACH Baumarkt SK spol s.r.o.
Bratislava, Slovakia
3 megastores
HORNBACH Centrala SRL Domnesti, Romania
6 megastores
98 megastores withgarden centers in Germany
HORNBACH International GmbH Bornheim58 DIY megastores with garden centers in
other European countries

36 COMBINED MANAGEMENT REPORT Group Fundamentals
2.2 Real estate activities The HORNBACH Baumarkt AG Group has a substantial real estate portfolio. This predominantly relates to re-tail properties used by the company itself. At the balance sheet date on February 28, 2018, 29 % of sales ar-eas were owned by the Group. HORNBACH Immobilien AG and its subsidiaries owned a further 28 % of the Group's DIY sales areas. The overriding strategy is for the overall HORNBACH Holding AG & Co. KGaA Group to retain ownership of at least half of the real estate, measured in terms of sales areas, used for operating pur-poses.
2.3 Reporting segments The delineation of business segments is consistent with the internal reporting structures used by the Board of Management of the HORNBACH Baumarkt AG Group to manage the company. The "Retail" segment com-prises the 156 DIY megastores with garden centers pooled at the HORNBACH Baumarkt AG Group (2016/17: 155) and our e-commerce retail activities. Sales at the HORNBACH Baumarkt AG Group are primarily gener-ated in the Retail segment, i.e. in the operating retail business. The "Real estate" segment comprises the re-tail properties owned by the HORNBACH Baumarkt AG Group. In this segment, imputed rental payments are charged on at customary market conditions within the Group. In the segment report, the income from this im-puted charging on of rental payments is fully consolidated as "Rental income from affiliated companies". Administration and consolidation items not attributable to segments are summarized in the "Headquarters and consolidation" reconciliation column.
3. Management System
The key management figures outlined below are used to manage both the HORNBACH Baumarkt AG Group and HORNBACH Baumarkt AG.
3.1 Most important key management figures For a retail company like the HORNBACH Baumarkt AG Group, sales are the central management figure for its operating business. This figure directly indicates our success with customers. Our sales performance is re-ported as net total sales in euros. Up to and including the 2017/18 financial year, operating earnings (EBIT) have been the central key earn-ings figure for the Group. EBIT stands for earnings before interest and taxes. In the income statement, EBIT is calculated as gross profit in euros less costs (selling, store, pre-opening, and administration expenses) plus other income and expenses. EBIT also includes earnings items which HORNBACH is unable either to forecast or to influence directly. Non-operating, unscheduled one-off items may therefore lead this key figure to fluc-tuate substantially between individual reporting periods. This is particularly true in respect of impairment tests. The meaningfulness of the EBIT key figure for group management purposes is therefore severely im-paired at times, as in the year under report. From the beginning of the 2018/19 financial year (March 1, 2018 to February 28, 2019), EBIT will be commented on as an alternative key performance figure in the presenta-tion of the earnings position, but will no longer be used as a key management figure in the company's plan-ning or as the central reporting figure for budget/actual comparisons or annual earnings forecasts.
Group Management Report Business Report Earnings Position

COMBINED MANAGEMENT REPORT Group Fundamentals 37
For the internal management of the Group, as well as for the external communication of its current and future earnings performance, the operating business activities relevant for controlling purposes play a particularly important role. The most important key performance figure we use to plan, measure, and manage the Group's operating earnings performance is adjusted EBIT (adjusted operating earnings). To calculate this key figure, EBIT is adjusted to exclude non-operating earnings items. Non-operating expenses (e.g. impairment losses on non-current assets, additions to provisions for onerous contracts) are added to EBIT, while non-operating income (e.g. income from disposals of properties, income from write-ups of assets impaired in previous years) are deducted. Adjusted EBIT is therefore particularly useful for management purposes and for comparing the operating earnings performance over time or in forecasts.
3.2 Alternative key performance figures In this Annual Report, we also refer to alternative key performance figures not defined in accordance with IFRS when commenting on our asset, financial, and earnings position. In terms of our DIY stores with garden centers, the rate of change in like-for-like sales net of currency items is presented as an alternative key performance figure. This figure serves to measure the performance of our operating business and as an indicator of the organic growth of our retail activities (stationary stores and online shops). The calculation of like-for-like sales is based on all DIY stores with garden centers that have been in opera-tion for at least one full year. By contrast, no account is taken of stores newly opened, closed, or subject to substantial conversion work in the past twelve months. Like-for-like sales are calculated without sales tax (net) and based on the local currency for the reporting period under comparison (currency-adjusted). As a performance indicator, the rate of change in like-for-like sales net of currency items is therefore independent of currency factors. In addition, we also calculate like-for-like sales on a euro basis and including currency items in the non-euro countries within our European store network. Selling, store, pre-opening, and administration expenses are key parameters for assessing the Group's earn-ings strength. We use cost ratios calculated as percentages of net sales as alternative key performance fig-ures and also as cost trend indicators. Since the 2016/17 reporting year, allocable non-operating income and expenses have been recognized in the relevant functional expense items (previously: under other income and expenses). To comment on our operating earnings performance, we also report where necessary on functional expense items net of non-operating earnings items. The store expense ratio corresponds to selling and store expenses divided by net sales. Selling and store ex-penses involve those costs incurred in connection with operating stationary DIY stores with garden centers and online shops. These mainly involve personnel expenses, costs of premises and advertising expenses, as well as depreciation and amortization. Moreover, this item also includes general operating expenses, such as transport costs, expenses, maintenance and upkeep. The pre-opening expense ratio is obtained by dividing pre-opening expenses by net sales. Pre-opening ex-penses relate to those expenses arising at or close to the time of the construction up to the opening of new stationary DIY stores with garden centers. Pre-opening expenses mainly consist of personnel expenses, costs of premises, and administration expenses. The administration expense ratio corresponds to the quotient of administration expenses and net sales. General and administration expenses include all costs incurred by administration departments in connection with the operation or construction of stationary DIY stores with garden centers and with the development and operation of online retail (e-commerce) which cannot be directly allocated to such. They mainly consist of
38 COMBINED MANAGEMENT REPORT Group Fundamentals
personnel expenses, legal and advisory expenses, depreciation and amortization, costs of premises, and IT, travel and vehicle expenses. As well as purely administrative administration expenses, these expenses also include project-related expenses, and in particular expenses relating to the increasing digitization of our business model. EBITDA serves as an alternative key performance figure to comment on the earnings performance in the pe-riod under report. EBITDA, which stands for earnings before interest, taxes, depreciation and amortization, has a cash flow character, as non-cash-effective depreciation and amortization are added to operating earn-ings (EBIT). To comment on our asset position, we refer to the equity ratio. This corresponds to shareholders' equity as posted in the balance sheet divided by total capital (total assets). The Group has not set any defined target for its shareholders' equity. To safeguard our financial stability and independence, our basic objective is ra-ther to permanently ensure a stable, high equity ratio. Net financial debt is an alternative key performance figure used to comment on the financial position. This key figure is calculated as total current and non-current financial debt less cash and cash equivalents and – where applicable – less current financial assets (financial investments). To avoid negative interest on cash investments, starting at the beginning of the 2016/17 financial year the Group channeled part of its cash and cash equivalents into near-liquid short-term financial investments with terms of between more than three months and a maximum of twelve months. These fixed-term deposits were repaid in full as of Novem-ber 30, 2017. The inclusion of current financial assets in the calculation of net financial debt enhances com-parability with the previous reporting period.
3.3 Further key management figures The development in the gross margin offers information about our gross trading performance. This margin is defined as gross profit (net balance of sales and cost of goods sold) as a percentage of net sales. This key management figure is chiefly influenced by developments in procurement and retail prices, changes in the product mix, and currency items resulting from international procurement. In managing its financial and asset position, the HORNBACH Baumarkt AG Group pursues the objective of safeguarding the Group's liquidity at all times and covering the financing requirements for the Group's sus-tainable growth at the least possible expense. Other key management figures relevant in this respect include cash-effective investments in land, buildings, plant and operating equipment for new and existing DIY stores with garden centers, and intangible assets. Here, we aim to strike a balance between our operating cash flow and our budgeted investments. For retail companies, the inventory turnover rate is an important indicator of merchandising efficiency. We define inventory turnover as the ratio of material input costs to average inventories. The arithmetic mean of the period opening and period closing balances is taken as the average volume of inventories. The higher the inventory turnover rate, the lower the inventories and thus the volume of liquidity committed. Our aim is therefore to sustainably improve our inventory turnover rate at an above-average high level compared with competitors while also ensuring product availability.

COMBINED MANAGEMENT REPORT Business Report 39
Business Report
1. Macroeconomic and Sector-Specific Framework
1.1 International framework The European economy showed stronger growth in the 2017 calendar year than one year earlier. Based on fig-ures released by the European Union statistics authority (Eurostat), gross domestic product (GDP) grew by 2.4 % in the European Union as a whole (EU 28) and by 2.3 % in the euro area. The nine European countries in which HORNBACH operates also showed a uniformly positive picture in terms of their economic develop-ments. Based on the data available upon completion of this report, the GDP growth rates achieved in 2017 were ahead of the previous year's figures. Private consumer spending in the EU 28 and euro area countries grew by 2.0 % and 1.7 % respectively in real terms. At 1.4 %, the annual HICP rate of inflation for the euro area in December 2017 was notably higher than in the previous year (+1.1 %). This increase was driven above all by higher energy prices. The European construction sector continues to pursue a course of solid growth. According to estimates com-piled by Eurostat, construction output grew by 3.5 % in the EU 28 and by 2.4 % in the euro area. Based on the assessment of the Euroconstruct Group, European construction volumes in its 19 partner countries grew by 3.5 % in 2017, with a growth rate of 3.9 % reported for building construction. As in the previous year, the greatest momentum came from new housing construction. By contrast, construction volumes in the moderni-zation market, which plays a more significant role for the DIY retail business than new construction, grew at a significantly lower pace, with growth rates of between one and two percent in the past three years. Non-food retail volumes grew by 3.7 % in the EU 28 and by 2.7 % in the euro area in 2017. In terms of the countries in which HORNBACH operates, the retail sector reported sales growth in all countries except Luxem-bourg and Switzerland. The figures for Romania, the Czech Republic, and Slovakia were significantly ahead of the European average. The indicators available from sector surveys also point to a successful performance of the DIY store and garden center sector in 2017. In most European countries for which data was available, nominal and like-for-like sales in do-it-yourself (DIY) retail showed positive growth, in some cases substan-tial, compared with 2016.
Table GDP growth rates
GDP growth rates in countries with HORNBACH DIY megastores and garden centers Percentage change on previous quarter 1st Quarter 2nd Quarter 3rd Quarter 4th Quarter Calendar Year Source: Eurostat (calendar year figures) 2017 2017 2017 2017 2017 vs. 2016
Germany 0.9 0.6 0.7 0.6 2.2 Luxembourg (0.9) 0.9 1.8 (0.1) 2.3 Netherlands 0.7 1.5 0.4 0.8 3.1 Austria 1.2 0.7 0.8 0.8 2.9 Romania 2.0 1.7 2.4 0.6 7.0 Slovakia 0.8 1.0 0.8 0.9 3.4 Sweden 0.4 1.2 0.8 0.9 2.4 Switzerland 0.2 0.5 0.7 0.6 1.0 Czech Republic 1.5 2.4 0.7 0.8 4.4 Euro area (EA 19) 0.6 0.7 0.7 0.6 2.3 EU28 0.6 0.7 0.7 0.6 2.4
40 COMBINED MANAGEMENT REPORT Business Report
1.2 Business framework in Germany
1.2.1 Macroeconomic climate Germany's economic growth gained further momentum in 2017. Based on calculations compiled by the Fed-eral Statistical Office, real-term gross domestic product (GDP) rose by an annual average of 2.2 % in 2017 (2016: +1.9 %). This upturn was driven both by strong levels of domestic demand, as well as by increased demand for German goods from abroad. Private consumer spending (+1.9 %) benefited from the favorable situation on the labor market, although income from employment showed only moderate growth. Real-term disposable incomes increased by 3.9 %.
1.2.2 Construction activity and construction trade The positive macroeconomic framework accompanied by strong demand for real estate and low interest rates provided the construction sector with additional momentum in the past year. Given persistently favorable in-terest rates, new private housing construction acted as the key growth driver. According to calculations com-piled by the German Institute for Economic Research (DIW), housing construction volumes rose by 7.4 % in nominal terms in 2017, with clearly disproportionate growth of 12.9 % in new construction volumes. By con-trast, the market for refurbishment, renovation, and modernization measures at existing buildings, which is more relevant for the DIY store sector, only grew by 4.7 %. Overall, the share of construction output attributa-ble to existing buildings fell consistently from 75 % in 2011 to 66 % in 2017, while new construction volumes rose over the same period from 25 % to 34 %. The high level of capacity utilization in the construction industry is reflected in rising prices for construction work, as a result of which the real-term growth rates were significantly lower. The real-term growth rate in the main construction trade came to 3.3 % in 2017, while the finishing trade grew by 2.2 %. The boom in new construction in Germany seems to have passed its zenith in 2017. Among the indicators supporting this sup-position is the 7.3 % reduction in the number of building permits issued in this period.
1.2.3 Retail and DIY Boosted by pleasing economic developments, German retail sales rose further in 2017. Based on figures re-leased by the Association of German Retailers (HDE), net aggregate sales increased to € 512.8 billion. Sector sales therefore grew by 4.1 % in nominal terms and by 2.6 % in real terms compared with 2016. Online retail (e-commerce) showed further strong growth of 10.2 % to € 48.7 billion (2016: € 44.2 billion). Online sales thus accounted for a 9.5 % share of total retail sales in 2017 (2016: 9.0 %). The German DIY sector benefited only in part from these positive developments. Based on figures from the BHB sector association, large-scale DIY stores with sales areas of more than 1,000 m² increased their gross nominal sales by 1.1 % to € 18.45 billion in the 2017 calendar year (2016: € 18.24 billion). On a like-for-like basis, i.e. excluding stores newly opened, closed or subject to substantial conversion measures in the year under report, the sector reported slight sales growth of 0.7 %. Gross sales at smaller-scale DIY stores (DIY shops with sales areas of up to 1,000 m²) rose by 2.0 % to € 3.92 billion (2016: € 3.84 billion). The market volume of all DIY and home improvement stores thus grew by 1.3 % to € 22.37 billion in 2017. Notably more dynamic more growth was reported for e-commerce with home improvement, construction materi-als, and garden product ranges. According to figures compiled by market researchers at Teipel Research & Consulting, the online shops of stationary retailers, mail order players, and pure online retailers generated gross sales of € 3.27 billion with DIY products in Germany in 2017 (2016: € 2.87 billion). That represents growth of 14.1 % compared with 2016. Key growth drivers here particularly included DIY store chains with stationary operations, which reported disproportionate growth in their online sales of around 25 % to more than € 600 million.

COMBINED MANAGEMENT REPORT Business Report 41
2. Summary of 2017/18 Business Performance
2.1 Overall assessment of the Group's economic position Overall, the macroeconomic framework developed positively in the 2017/18 financial year (March 1, 2017 to February 28, 2018) and benefited business activities in the countries across Europe in which the HORNBACH Baumarkt AG Group operates. The sector-specific competitive climate remained challenging and was influ-enced more clearly than in the past by increasing digitization and online competition in the DIY retail busi-ness. Against this backdrop, the Group can look back on what was overall a positive 2017/18 financial year in which we met our sales and earnings forecasts. We increased our consolidated (net) sales by 4.9 % to € 3,891 million in the 2017/18 financial year. At 3.6 %, the Group's like-for-like sales growth net of currency items was ahead of the previous year's level. This growth was driven both by the Germany and the Other European countries regions. In Germany, we increased our like-for-like sales in all quarters and on a cumulative basis slightly exceeded the previous year's figure despite a lower number of business days. We again generated the strongest growth in other European countries, where our like-for-like sales net of currency items once more clearly exceeded the high previous year's figure. As a result, the share of consolidated sales contributed by the international stores rose significantly from 45.0 % to 46.8 %. We further boosted the effectiveness of our core operating business. The average HORNBACH DIY store and garden center generated annual sales of € 24.9 million (2016/17: € 24.1 million). Sales area productivity, i.e. weighted net sales per square meter of sales area, rose from € 2,068 to € 2,135 (+3.2 %). Online retail, which we dovetail closely with our stationary retail activities, contributed clearly double-digit percentage growth to the Group's overall performance. We significantly stepped up our forward-looking investments in digitization in the 2017/18 financial year. These are intended to sustainably boost our strategic competitive position in the European DIY market with an online presence now available in all HORNBACH regions. EBIT adjusted for non-operating one-off items – the key indicator of our operating earnings strength – grew by 7.0 % to € 110.0 million. This increase was driven above all by pleasing like-for-like sales growth in con-junction with a stable gross margin, improved cost ratios in store operations and pre-opening expenses, and an increase in other income and expenses. These factors more than offset the higher volume of digitization-related expenses. Consolidated operating earnings grew by 5.1 % to € 102.5 million. Operating earnings include non-operating one-off charges on earnings in connection with IAS 36 impairments and provisions for onerous contracts. These items rose from € 5.0 million in the 2016/17 financial year to € 7.7 million in the 2017/18 year under report. Due mainly to a lower tax charge than in the previous year, consolidated net income increased by 11.0 % to € 58.7 million. The equity ratio rose from 51.6 % to 52.5 % at the balance sheet date and thus remains high. Net financial debt decreased slightly from € 339.9 million to € 321.9 million at the balance sheet date. In view of our broad spectrum of financing sources, we enjoy a high degree of security and flexibility to finance our further growth. All in all, the Group's economic position in the 2017/18 financial year was satisfactory.

42 COMBINED MANAGEMENT REPORT Business Report
2.2 Major events
2.2.1 Development in HORNBACH's stationary store network In April 2017, we opened a new DIY megastore with a garden center in The Hague with sales areas of around 12, 300 m². This is the 13th HORNBACH location in the Netherlands. As planned, we ceased operations at our store in Hanau at the end of October 2017 as the requirements for extending and modernizing the old loca-tion, with sales areas of around 5,000 m², could not be met. In November 2017, we launched operations at a new location with sales areas of around 8,000 m² in Halle (Saale). This is our second location in the state of Saxony-Anhalt. Including stores newly opened and closed in the year under report, we operated a group-wide total of 156 re-tail stores as of February 28, 2018 (February 28, 2017: 155), of which 98 (98) in Germany and 58 (57) in other European countries. Total sales areas at the HORNBACH Baumarkt AG Group amounted to more than 1.82 million m² as of February 28, 2018 (February 28, 2017: around 1.81 million m²).
2.2.2 Development in HORNBACH's online stores HORNBACH launched operations in the 2017/18 financial year with the online stores planned for Slovakia (August 2017), Sweden (October 2017), and Romania (January 2018). As planned, the multichannel retail approach was therefore rolled out throughout the Group's European network by the end of the 2017/18 finan-cial year.
2.2.3 Development in infrastructure We further expanded our logistics network in the 2017/18 financial year. In January 2018, we launched oper-ations at our first logistics center outside Germany, in this case close to Vienna. The new cross-docking cen-ter in Enzersdorf an der Fischa will now supply merchandise to the HORNBACH stores in Austria, Romania, the Czech Republic, and Slovakia. This should considerably shorten the delivery routes and times for the stores in Central and Eastern Europe. As of the balance sheet date on February 28, 2018, HORNBACH there-fore worked with a group-wide total of eight logistics centers to supply its stores. In the year under report, the logistics center in Vilshofen near Passau was extended with a cross-docking center for mass and bulky goods. The hall of 10,000 m² and outdoor area of 7,000 m² were built on the site of the logistics center opened in 2005. Since February 2018, HORNBACH has been supplying its stores in Southern Germany and neighboring countries with heavy and bulky goods too large for the usual euro pallets, such as kitchen counters up to six meters long, from this center.

COMBINED MANAGEMENT REPORT Business Report 43
2.3 Target achievement in 2017/18 The HORNBACH Baumarkt AG Group met the targets it set itself for the 2017/18 financial year. The compari-son of the actual with the forecast business performance is summarized in the following table.
2.3.1 Targets and results of the HORNBACH Baumarkt AG Group in the 2017/18 financial year
Targets for 2017/18 Results in 2017/18
Expansion Stationary DIY business: 2 new store openings 1 closure HORNBACH online shops: Launch of operations in Slovakia, Sweden, and Romania
Stationary DIY business: The Hague (Netherlands) and Halle
(Saale) opened Hanau closed Rollout of online shops in all countries in HORNBACH's network now completed
Investments Between € 120 million and € 140 million € 129 million Sales performance Consolidated sales Growth in medium single-digit
percentage range + 4.9 % to € 3.89 billion
Like-for-like and currency-adjusted sales
Group-wide growth in low to medium single-digit percentage range
Higher sales growth in Other European countries than in Germany
Group: + 3.6 %
Germany: + 1.5 % Other European countries: + 6.1 %
Earnings performance
EBIT Slightly up on previous year's figure (2016/17: € 97.5 million)
+ 5.1 % to € 102.5 million
Adjusted EBIT At around the previous year's level (2016/17: € 102.8 million)
+ 7.0 % to € 110.0 million
Note: For sales "at previous year's level" refers to changes of -1 % to +1 %, while "slight" changes involve changes of 2 % to 5 %. To enhance the distinctions within the "slight" category, we use the phrase "in a low single-digit percentage range" to refer to changes of 2 % to 3 % and the phrase "in a medium single-digit percentage range" to refer to changes of 4 % to 5 %. "Significant" corresponds to changes of 6 % upwards. For earnings figures, "at previous year's level" refers to changes of -1 % to +1 %. "Slight" corresponds to changes of 2 % to10 %, while "significant" is equivalent to changes of 11 % upwards.
2.3.2 Budget/actual comparison for separate financial statements (HGB) In the separate financial statements of HORNBACH Baumarkt AG, which are shaped by the business per-formance of the HORNBACH DIY stores with garden centers in Germany, our sales forecast for the 2017/18 financial year envisaged sales growth in a low to medium single-digit percentage range. With sales growth of 3.2 % to € 2,514 million, we met this target. Assuming that the volume of earnings transferred from HORNBACH International GmbH would remain constant, we expected the annual net surplus on the level of HORNBACH Baumarkt AG in the 2017/18 forecast period to more or less match the previous year's figure. The actual annual net surplus of € 14.0 million fell substantially short of the equivalent figure of € 53.6 million for the 2016/17 financial year. This was due to a marked fall in income from investments mainly resulting from the write-down of the carrying amount of the investment in a Swedish subsidiary of HORNBACH Interna-tional GmbH.

44 COMBINED MANAGEMENT REPORT Business Report
3. Earnings Position
3.1 Sales performance The HORNBACH Baumarkt AG Group's sales are primarily generated in the Retail segment (please see seg-ment report in the notes to the consolidated financial statements). Sales in the Real estate segment princi-pally involve rental income from the group-internal letting of DIY store properties to the Retail segment. This income is fully consolidated in the segment report as "Rental income from affiliated companies". In view of this, the following comments refer exclusively to the sales performance of the Retail segment. When com-menting on our sales performance, we also subdivide our sales into geographical segments, namely "Ger-many" and "Other European countries", where our activities in eight countries outside Germany are summa-rized.
3.1.1 Seasonal and calendar-related fluctuations The 2017/18 year under report had an average of 3.2 business days fewer than the previous year. The resultant calendar effect was distributed among the quarters as follows: 1st quarter (Q1): plus 0.7 business days 2nd quarter (Q2): minus 1.4 business days 3rd quarter (Q3): minus 0.9 business days 4th quarter (Q4): minus 1.6 business days Weather conditions had an uneven effect on HORNBACH's European network in the year under report. In Q1 (March to May 2017), weather conditions were overwhelmingly favorable for the DIY retail business in Germany and the eight countries in our Other European countries region, with unusually high temperatures in March and summery weather in May 2017. By contrast, weather conditions were more mixed in Q2 (June to August 2017). In June 2017, periods of very dry weather with record high temperatures were followed by numerous storms with record volumes of rain in some areas. Regional variations were very marked. Stable summer weather suitable for extensive construction and renovation projects was something of an exception in 2017. In Q3 (September to November 2017), large parts of Europe witnessed higher volumes of precipitation than in the previous year, and more than the long-term average. In retrospect, Q4 (December 2017 to February 2018) was also highly changeable. A snowy December with a record number of overcast days was followed by a wet and very mild January. February closed the quarter with a great deal of sunshine and icy temperatures.
Financial year
16 | 17
17 | 18
13 | 14
14 | 15
15 | 16
20 40 60 80 100 120 140
Adjusted EBIT(€ million)
Sales and growth by quarter(€ million / %)
0
Financial year
1003.6
1042.7 + 3.9% + 4.0% + 4.6%
900.9
936.5
746.7
781.2
1058.9
1130.3
2016/17
Q1 Q2 Q3 Q4
2017/18
3710.1
3890.7
+ 6.7%
+ 4.9%
Financial year
16 | 17
17 | 18
13 | 14
14 | 15
15 | 16
20 40 60 80 100 120 140
Adjusted EBIT(€ million)
Sales and growth by quarter(€ million / %)
0
Financial year
1003.6
1042.7 + 3.9% + 4.0% + 4.6%
900.9
936.5
746.7
781.2
1058.9
1130.3
2016/17
Q1 Q2 Q3 Q4
2017/18
3710.1
3890.7
+ 6.7%
+ 4.9%

COMBINED MANAGEMENT REPORT Business Report 45
3.1.2 Net sales The HORNBACH Baumarkt AG Group increased its net sales by 4.9 % to € 3,891 million in the 2017/18 finan-cial year (2016/17: € 3,710 million). Net sales in the Germany region grew by 1.5 % to € 2,071 million in the period under report (2016/17: € 2,040 million). Outside Germany (Other European countries region) and includ-ing one newly opened DIY megastore, we reported sales growth of 9.0 % to € 1,820 million (2016/17: € 1,670 million). Due to the higher rate of growth compared with Germany, the international stores' share of consolidated sales increased from 45.0 % to 46.8 %.
3.1.3 Like-for-like sales The following comments refer to the development in currency-adjusted like-for-like sales at the HORNBACH Bau-markt AG Group, which thus take no account of stores newly opened or closed in the past twelve months. The pre-vious year's figures can be seen in the quarter-by-quarter overview provided in the table. The Group's like-for-like sales rose by 3.6 % in the 2017/18 financial year net of currency items (including currency items: 3.3 %). As is apparent in the table below, the first and fourth quarters provided the greatest seasonal growth momentum. From a geographical perspective, both the Germany region and the Other European countries region further increased their like-for-like sales. As in the previous year, the strongest growth momen-tum came from our store network outside Germany. Like-for-like sales performance* by quarter (in percent)
* excluding currency items
Germany
The HORNBACH DIY stores and garden centers in the Germany region increased their like-for-like sales by 1.5 % in the 2017/18 financial year, with positive growth rates in all four quarters. It should also be noted that the year under report had around four fewer business days than the previous year. Based on our calculations, HORNBACH once again outperformed the DIY sector average in Germany in the period covered by our financial year (March 2017 to February 2018). In its "DIY Total Store Report", the GfK determines the sales performance of German DIY stores and garden centers for the calendar year on behalf of the BHB sector association. According to this report, like-for-like sales in the DIY sector showed average like-for-like growth of 0.7 % in the period from January to December 2017. Based on a direct comparison, HORNBACH achieved a growth rate of 0.9 % over the same period. It should be noted, however, HORNBACH's basis for comparison is significantly higher. If the 1998 calendar year is taken as an index value of 100 %, by 2017 HORNBACH had increased its like-for-like sales in Germany to 136 %. By contrast, the overall sector only reached 89 % in 2017.
2017/18 financial year 1st Quarter 2nd Quarter 3rd Quarter 4th Quarter Total 2016/17 financial year
Group 5.4 2.6 2.7 3.3 3.6 4.4 4.5 3.0 (0.7) 3.0 Germany 3.8 0.3 0.5 0.9 1.5 2.7 2.2 2.2 (2.3) 1.4 Other European countries 7.5 5.3 5.4 6.2 6.1 6.6 7.7 3.9 1.3 5.1

46 COMBINED MANAGEMENT REPORT Business Report
This longstanding outperformance of the sector is also increasingly attributable to the significance of our DIY multichannel approach. The aim is to accompany our customers throughout their customer journeys and, at every point along the way, to offer them what they happen to be looking for and need for their construction or renovation projects. Customers can inform themselves about articles, their prices, and availability on our website, for example, and also compare articles. Not only that, they can have their arti-cles delivered directly to their homes by mail order or opt for our "Reserve online and pick up at the store" service. Professional customers in particular see the benefits of being able to collect all articles available at their desired HORNBACH store no later than two hours after reservation. HORNBACH's positive sales performance continues to be driven by the great popularity of its DIY stores and garden centers among home improvement enthusiasts and construction professionals in Germany. In Kundenmonitor Deutschland, Germany's most prestigious consumer survey for the retail sector, HORNBACH achieved top rankings once again in 2017. The company was ranked first in twelve and second in fourteen of the total of 46 assessment categories. Customers awarded us the best grades in individual criteria including "Selection and Product Variety", "Product Quality", "Clarity of Specialist Advice", and "Media Assistance with Using the Materials/Tools Bought". When compared with its competitors, HORNBACH is also viewed by German DIY customers as leading the field in the "Product Range", "Prices", "Specialist Advice", and "Advertising" criteria. Based on the aggregate gross sales at all DIY stores and garden centers in Germany (including online sales at stationary DIY competitors), we upheld our position in the 2017 calendar year, and that even though we reported less sales area growth than the sector as a whole. Following the opening of our new location in Halle (Saxony-Anhalt) and the closure of our Hanau store, our sales areas in Germany grew by 0.3 %, while the total number of stores remained unchanged. We maintained our market share in Germany at a consistent level. Based on aggregate sales at all DIY stores and garden centers (2017: around € 22.4 billion), our share came to 11.0 %. In the segment of Ger-man DIY stores and garden centers with sales areas of more than 1,000 m² (2017: € 18.4 billion), we have a market share of 13.4 %.
Like-for-like sales performance in Germany (Index: 1998 = 100 %, calendar year)
2017/18
Like-for-like sales(by calendar year, cumulative)
-11%
+36%
DIY sector Hornbach
100
120
140
80
60
19991998 2000 2001 2002 2003 2004 2005 2006 2007 2008 2009 2010 2011 2012 2013 2014 2015 20172016

COMBINED MANAGEMENT REPORT Business Report 47
Other European countries The development in sales in our international business in the 2017/18 year under report latched seam-lessly onto the performance seen in the past two financial years. Growth rates in the Other European countries region were significantly higher than in the Germany region and also beat the previous year's high level. In the eight countries outside Germany, HORNBACH's DIY stores and garden centers increased their like-for-like sales net of currency items by 6.1 % in the 2017/18 financial year (2016/17: 5.1 %). In-cluding currency items, like-for-like sales grew by 5.6 % (2016/17: 4.6 %). HORNBACH further boosted its market position in other European countries in the past financial year, as is apparent when our sales performance is compared with sector developments in individual countries. Based on the sales indications available to us for five countries in our network outside Germany, we out-performed the relevant DIY sector averages, in most cases significantly so, in the 2017 calendar year. This is now due not only to our established stationary DIY stores and garden centers but increasingly to our e-commerce activities as well. Having successfully launched its online stores in Slovakia, Sweden, and Romania in the 2017/18 financial year, HORNBACH now operates its multichannel DIY retail ap-proach in all of the countries in its network. Thanks to our retail format, we benefited once again in 2017 from the growth in the European construc-tion sector which was in turn mainly driven by housing construction. As a project partner, HORNBACH enjoys a strong reputation among customers in all of the countries in which it operates, particularly when it comes to larger-scale modernization and renovation projects in their houses, apartments, and gardens. Numerous international consumer surveys, such as Kundenmonitor Österreich and its Swiss counterpart, document the high level of customer satisfaction with the HORNBACH brand once again in the past 2017/18 financial year. Top marks for the assessment criteria of "Overall Satisfaction", "Selection and Product Variety", "Prices Compared with Competitors", "Value for Money", and "Specialist Advice" are the common thread running through all of our survey results in recent years.

48 COMBINED MANAGEMENT REPORT Business Report
Key earnings figures of the HORNBACH Baumarkt AG Group
(Differences due to rounding up or down to nearest € million)
3.2 Earnings performance In the 2017/18 financial year, we increased the earnings of the HORNBACH Baumarkt AG Group compared with the previous year and improved our operating earnings strength. Adjusted EBIT, i.e. operating earnings before non-operating one-off items, showed slightly disproportionate growth compared with sales, rising by 7.0 % to € 110.0 million. This increase was largely due to the pleasing level of like-for-like sales growth at HORNBACH's DIY stores with garden centers (currency-adjusted growth of 3.6 %) in conjunction with a stable gross margin. Furthermore, our positive earnings performance also benefited from more favorable operating cost ratios for our selling and store and pre-opening expenses, as well as from higher other income and expenses. These factors more than offset the disproportionate rise in administration expenses, which were influenced once again by increased forward-looking expenses for the Group's digitization. Operating earnings (EBIT) including non-operating earnings items grew by 5.1 % to € 102.5 million in the year under report. Thanks to a lower tax charge, consolidated net income and earnings per Baumarkt share each rose more than 10 % compared with the previous year.
3.2.1 Earnings performance of the HORNBACH Baumarkt AG Group Consolidated earnings before interest, taxes, depreciation, and amortization (EBITDA) grew by 5.2 % to € 182.7 million (2016/17: € 173.6 million). At 4.7 %, the EBITDA margin (as a percentage of net sales) was at the previous year's level. EBIT adjusted for non-operating one-off items increased by 7.0 % to € 110.0 million (2016/17: € 102.8 million). The adjusted EBIT margin was reported at a consistent level of 2.8 %. Despite higher extraordinary non-operating earnings items, EBIT grew by 5.1 % to € 102.5 million (2016/17: € 97.5 million). The EBIT margin remained unchanged at 2.6 %. The following table presents the reconciliation of consolidated operating earnings (EBIT) with adjusted EBIT, i.e. EBIT adjusted for non-operating one-off items (please see Note 10).
Key figure (€ million, unless otherwise stated)
2017/18 2016/17 Change
Net sales 3,891 3,710 4.9 % EBITDA 182.7 173.6 5.2 % EBIT 102.5 97.5 5.1 % Adjusted EBIT 110.0 102.8 7.0 % Consolidated earnings before taxes 80.9 79.3 2.0 % Consolidated net income 58.7 52.9 11.0 % EBITDA margin 4.7 % 4.7 % EBIT margin 2.6 % 2.6 % Tax rate 27.5 % 33.3 %
Notes to Consolidated Financial Statements Note (10)

COMBINED MANAGEMENT REPORT Business Report 49
Reconciliation of consolidated operating earnings (EBIT) with adjusted EBIT by segment
(Differences due to rounding up or down to nearest € million)
Net financial expenses deteriorated from minus € 18.2 million in the previous year to minus € 21.6 million in the year under report. This was mainly due to negative currency items, which rose from minus € 0.5 million to minus € 4.8 million. Not only that, the interest result improved only slightly by 4.9 % to minus € 16.8 million (2016/17: minus € 17.7 million). As a result of these factors, earnings before taxes rose by 2.0 %, and thus less rapidly than sales, to € 80.9 million (2016/17: € 79.3 million). Consolidated net income, by contrast, showed disproportionate growth of 11.0 % to € 58.7 million (2016/17: € 52.9 million). Taxes on income fell significantly from € 26.4 million to € 22.2 million. As a result, the effec-tive tax rate on Group level decreased from 33.3 % to 27.5 %. The main reason for this was the turnaround in deferred taxes from minus € 4.7 million in the previous year to plus € 2.7 million in the year under report, a development mainly due to write-downs of the deferred taxes on losses carried forward reported in the previ-ous year. The return on sales after taxes rose from 1.4 % to 1.5 %. Earnings per Baumarkt share are reported at € 1.84 (2016/17: € 1.66).
3.2.2 Earnings performance of the Retail segment The Retail segment comprises the operating retail business within the Group. At the balance sheet date on February 28, 2018, we operated a total of 156 DIY retail outlets across Europe (2016/17: 155) and online shops in the nine countries within our European network. Net sales in this segment increased by 4.9 % to € 3,889 million in the 2017/18 financial year (2016/17: € 3,708 million). Key earnings figures developed positively prior to the extraordinary non-operating charges on earnings of € 7.6 million. Including these one-off items, earnings in the Retail segment decreased slightly over the same period. Gross margin:
Gross profit rose by 5.0 %, and thus in line with sales, to € 1,448.7 million in the 2017/18 financial year (2016/17: € 1,379.6 million). The gross margin therefore remained unchanged at 37.2 %. Positive and neg-ative factors cancelled each other out within this key figure. Gross profit was held back by, among other factors, less favorable procurement terms and increased write-downs. Positive factors related above all to changes in the product mix, margin benefits due to the rising share of sales generated with private labels, and retail price adjustments.
2017/18 in € million 2016/17 in € million
Retail segment Real estate segment
Headquarters and
consolidation
HORNBACH Baumarkt AG
Group Earnings before interest and taxes (EBIT) 40.4 74.3 (12.2) 102.5 41.1 67.3 (10.9) 97.5 Non-operating earnings items 7.6 (0.1) 0.0 7.5 5.0 0.3 0.0 5.3 Adjusted EBIT 48.0 74.2 (12.2) 110.0 46.2 67.6 (10.9) 102.8
Notes to Consolidated Financial Statements Notes (8) and (9)

50 COMBINED MANAGEMENT REPORT Business Report
Key earnings figures of the Retail segment
(Differences due to rounding up or down to nearest € million)
Selling and store, pre-opening and administration expenses:
Selling and store expenses in the Retail segment grew slightly less rapidly than sales, rising by 4.5 % to € 1,222.6 million (2016/17: € 1,170.3 million). The store expense ratio fell from 31.6 % to 31.4 %. This was mainly due to the disproportionate rise in operating expenses, while personnel expenses (excluding bonuses), rental and advertising expenses grew less rapidly than sales and utility expenses even showed a slight reduction in absolute terms. Selling and store expenses include non-operating earnings items of around € 7.7 million (2016/17: € 5.0 million). These mainly involve provisions for onerous contracts and im-pairment losses (IAS 36). Adjusted to exclude these items, the store expense ratio decreased from 31.4 % to 31.2 % in the 2017/18 financial year. At € 5.5 million, pre-opening expenses fell slightly short of the previous year's figure of € 5.7 million in the 2017/18 financial year. The pre-opening expense ratio fell from 0.2 % to 0.1 %. The pre-opening ex-penses reported for the previous year included one-off non-operating expenses of € 0.3 million. The ad-justed pre-opening expense ratio remained unchanged at 0.1 %. Administration expenses grew by 10.2 % from € 174.7 million to € 192.6 million. The administration ex-pense ratio rose significantly from 4.7 % to 5.0 %. This increase was particularly due to forward-looking investments in digitizing our business model, which were significantly stepped up once again in the year under report, as well as to further innovation projects. These mainly involved expenses for operating online retail and the infrastructure, including customer service centers, needed for multichannel retail.
EBITDA, adjusted EBIT, and EBIT: At € 79.9 million, EBITDA in the Retail segment in the 2017/18 financial year virtually matched the previ-ous year's figure (2016/17: € 80.7 million). That corresponds to an EBITDA margin of 2.1 % (2016/17: 2.2 %). Adjusted for non-operating expense items, EBIT in this segment came to € 48.0 million (2016/17: € 46.2 million). The adjusted EBIT margin was unchanged at 1.2 %. Operating earnings (EBIT) fell by 1.9 % to € 40.4 million (2016/17: € 41.1 million). The EBIT margin amounted to 1.0 % (2016/17: 1.1 %).
Key figure (€ million, unless otherwise stated)
2017/18 2016/17 Change
Net sales 3,889 3,708 4.9 % of which: in Germany 2,071 2,041 1.5 % of which in other European countries 1,818 1,668 9.0 %
Like-for-like sales growth 3.6 % 3.0 % EBITDA 79.9 80.7 (1.0)% EBIT 40.4 41.1 (1.9)% Adjusted EBIT 48.0 46.2 3.9 % EBIT margin 1.0 % 1.1 % Adjusted EBIT margin 1.2 % 1.2 % Gross margin 37.2 % 37.2 % Store expenses as % of net sales 31.4 % 31.6 % Pre-opening expenses as % of net sales 0.1 % 0.2 % General and administration expenses as % of net sales 5.0 % 4.7 %
Notes to Consolidated Financial Statements Note (4)

COMBINED MANAGEMENT REPORT Business Report 51
Key earnings figure of the Real estate segment
(Differences due to rounding up or down to nearest € million)
3.2.3 Earnings performance of the Real estate segment All the real estate activities of the HORNBACH Baumarkt AG Group are pooled in the Real estate segment. Its main business activities involve building and subsequently letting DIY store properties within the Group. These either remain in group ownership or are sold following construction to an external investor and then leased back. The respective DIY store properties are charged to the Retail segment on rental and other terms customary to the market. Earnings in the Real estate segment rose sharply compared with the previous year. This earnings growth was chiefly due to higher rental income and unchanged real estate expenses. Earnings from rental activities and real estate earnings:
In line with the Group's expansion, rental income in the Real estate segment, 99 % of which comprises in-ternal rental income, rose by 3.1 % to € 172.8 million in the year under report (2016/17: € 167.6 million), while real estate expenses remained virtually unchanged at € 99.0 million (2016/17: € 99.3 million). Earnings from rental activities increased by 7.9 % to € 73.7 million in the 2017/18 financial year (2016/17: € 68.4 million). Given negligible real estate disposal losses, net real estate income improved by 7.9 % to € 73.7 million (2016/17: € 68.3 million).
EBITDA, adjusted EBIT and EBIT: Earnings before interest, taxes, depreciation and amortization (EBITDA) grew by 9.2 % to € 106.0 million in the reporting period from March 1, 2017 to February 28, 2018 (2016/17: € 97.1 million). EBIT adjusted for non-operating one-off items increased by 9.9 % to € 74.3 million (2016/17: € 67.6 million). EBIT in the Real Estate segment rose by 10.4 % to € 74.3 million (2016/17: € 67.3 million).
3.2.4 Earnings performance by geographical regions The Germany region and the Other European countries region reported disparate earnings performances in the 2017/18 financial year. In Germany, EBIT and adjusted EBIT both fell significantly compared with the previous year. This contrasted with the significant growth in key figures for Other European countries. The significance of the international activities for the Group's earnings performance rose considerably compared with the previous year. EBITDA in Germany fell by 10.1 % to € 51.5 million (2016/17: € 57.3 million). The domestic share of the Group's EBITDA decreased from 33 % to 28 %. EBIT in the Germany region dropped from € 12.2 million to € 3.9 million. This reduction was primarily due to non-operating earnings charges mainly involving provisions for onerous contracts and IAS 36 impairment losses which together amounted to € 7.5 million (2016/17:
Key figure (€ million, unless otherwise stated)
2017/18 2016/17 Change
Rental income 172.8 167.6 3.1 % Real estate expenses 99.0 99.3 (0.2)% Net rental income 73.7 68.4 7.9 % Disposal gains/losses 0.0 0.0 (8.8)% Net real estate income 73.7 68.3 7.9 % EBITDA 106.0 97.1 9.2 % EBIT 74.3 67.3 10.4 % Adjusted EBIT 74.3 67.6 9.9 %

52 COMBINED MANAGEMENT REPORT Business Report
€ 4.1 million). In the year under report, these items were charged exclusively to the domestic earnings perfor-mance. The domestic share of operating earnings therefore fell from 13 % to 4 %. The EBIT margin for Ger-many came to 0.2 % (2016/17: € 0.6 %). EBIT for the Germany region adjusted for non-operating earnings items decreased from € 16.3 million to € 11.4 million in the 2017/18 financial year. The adjusted EBIT margin in Germany amounted to 0.6 % (2017/18: 0.8 %). Other European countries generated EBITDA of € 131.1 million (2016/17: € 116.5 million), and thus ac-counted for around 72 % of the HORNBACH Baumarkt AG Group's EBITDA in the period under report (2016/17: 67 %). EBIT outside Germany rose by 15.3 % to € 98.5 million (2016/17: € 85.4 million). The international share of EBIT increased from 87 % to 96 %. The EBIT margin for Other European countries came to 5.4 % (2016/17: 5.1 %). Non-operating earnings items, which reduced the previous year's figure by € 1.2 million, were negligible in the 2017/18 financial year. Adjusted EBIT for the Other European countries region amounted to € 98.5 million (2016/17: € 86.7 million). The adjusted EBIT margin outside Germany therefore came to 5.4 % in the 2017/18 financial year (2016/17: 5.2 %).
3.3 Dividend proposal The Board of Management and Supervisory Board of HORNBACH Baumarkt AG will propose an unchanged divi-dend of € 0.68 per share with dividend entitlement for approval by the Annual General Meeting on July 5, 2018. Taking due account of the company's performance capacity, HORNBACH will thus uphold its principle of divi-dend continuity. Subject to the resolution adopted by the Annual General Meeting on the appropriation of unap-propriated net profit, the distribution quota (distribution total as a percentage of consolidated net income) would then reach 37 % in the 2017/18 financial year (2016/17: 41 %). The company would thus contribute to-wards meeting the distribution policy on the level of HORNBACH Holding AG & Co. KGaA, which provides for a target distribution quota of 30 %.

COMBINED MANAGEMENT REPORT Business Report 53
4. Financial Position
4.1 Principles and objectives of financial management Financing measures are coordinated by Group Treasury at HORNBACH Baumarkt AG in close liaison with the group company financing the respective measure. Central organization of financial management enables the HORNBACH Group to maintain a uniform presence on financial markets and to provide centralized liquidity management for the overall Group. HORNBACH Baumarkt AG grants financial assistance in the form of guarantees and letters of comfort only for its subsidiaries. The information required for efficient liquidity management is provided by rolling group financial planning covering all relevant companies, which is updated monthly and has a budgeting horizon of twelve months, as well as by short-term financial forecasting updated daily. Based on the information available, the financing requirements of individual units within the Group are initially settled using surplus liquidity from other group companies by means of a cash pooling system. Such liquidity bears interest at market rates on the basis of internal group loan agreements. Where long-term financing requirements are covered internally, these facili-ties take the form of long-term internal loan agreements charging interest at congruent market rates. External financing requirements are covered by taking up loans from banks and on the capital market. More-over, to date DIY store properties have been sold to investors upon completion, with utilization secured by rental agreements (sale and leaseback). Here, efforts were made to meet the IAS 17 criteria governing classi-fication as "operating leases". As a result of contracts extended and newly concluded for existing sale and leaseback agreements, individual locations were reclassified as "finance leases" in the 2015/16 and 2016/17 financial years. Due to the forthcoming amendments to lease accounting under IFRS 16 and the dis-continuation of the "operating lease" classification, in future – and at the latest from the 2019/20 financial year – lease transactions will be reported in a manner basically comparable to that used for finance leases pursuant to IAS 17. External financing generally takes the form of unsecured loans and real estate sales (sale and leaseback). Consistent with HORNBACH’s forward-looking financial policy, financial liabilities due to mature are re-financed where necessary at the earliest opportunity. In line with internal risk principles, derivative financial instruments are held solely for hedging purposes. The nominal values and measurement of existing derivative financial instruments are presented in the notes on the consolidated balance sheet in the notes to the financial statements.
4.2 Financial debt The HORNBACH Baumarkt AG Group had financial debt of € 424.1 million at the balance sheet date on Febru-ary 28, 2018 (2016/17: € 452.9 million). This reduction was due to debt repayments and the avoidance of new borrowing. Net financial debt also decreased, in this case from € 339.9 million to € 321.9 million. Due in particular to funds being channeled into the Group's expansion, cash and cash equivalents decreased from € 113.0 million in the previous year to € 102.1 million in the year under report. The specific composition of financial debt is presented in the following table.
Notes to Consolidated Financial Statements Note (12)

54 COMBINED MANAGEMENT REPORT Business Report
Financial debt of the HORNBACH Baumarkt AG Group
(Differences due to rounding up or down to nearest € million) 1) Financing facilities with nominal terms of under one year and interest deferrals 2) The costs relating to the taking up of the corporate bond have been spread pro rata temporis over the respective terms.
The current financial debt (up to 1 year) of € 11.4 million (2016/17: € 28.6 million) comprises the portion of long-term financing facilities maturing in the short term, at € 10.9 million (2016/17: € 13.3 million), interest deferrals of € 0.4 million (2016/17: € 0.4 million), the measurement of derivative financial instruments, at € 0.1 million (2016/17: € 1.4 million), and short-term financing facilities of € 0.0 million (2016/17: € 13.5 million). HORNBACH enjoys great financing flexibility and draws on a wide range of different financing instruments. At the balance sheet date on February 28, 2018, one key financing facility was the corporate bond of € 250 million at HORNBACH Baumarkt AG with a term running until February 15, 2020 and an interest rate of 3.875 %. Furthermore, the Group now only has one financing facility of € 0.6 million (2016/17: € 3.6 million) which is secured by land charges of € 12.5 million (2016/17: € 36.6 million).
4.2.1 Credit lines At the balance sheet date on February 28, 2018, the HORNBACH Baumarkt AG Group had free credit lines amounting to € 418.1 million (2016/17: € 321.0 million) on customary market terms. These include an as yet unused syndicated credit line of € 350 million at HORNBACH Baumarkt AG, which was agreed in December 2017 with a term running until December 22, 2022. This new facility serves the premature refinancing on improved conditions of the existing syndicated credit line of € 250 million with a regular term running until April 15, 2019. The remaining deferred costs of the previous credit line now terminated were charged to earnings in the past financial year. To ensure the maximum possible degree of flexibility, all major group companies have credit lines denominated in local currencies, generally at local banks.
4.2.2 Covenants No assets have been provided as security for the credit lines or the bond. The relevant contractual arrange-ments nevertheless require compliance with customary bank covenants, non-compliance with which could
Type of financing Liabilities broken down into remaining terms 2.28.2018 2.28.2017 € million < 1 year 1 to 2
years 2 to 3 years
3 to 4 years
4 to 5 years
> 5 years Total Total
Short-term bank debt1) 0.4 0.0 0.0 0.0 0.0 0.0 0.4 13.9 Mortgage loans 0.6 0.0 0.0 0.0 0.0 0.0 0.6 3.6 Corporate bonds2) 0.0 248.8 0.0 0.0 0.0 0.0 248.8 248.2 Negative fair values of derivative financial instruments 0.1 0.0 0.0 0.0 0.0 0.0 0.1 1.4 Finance leases 10.3 10.8 11.3 11.7 12.3 117.7 174.1 185.7 Total financial debt 11.4 259.6 11.3 11.7 12.3 117.7 424.1 452.9 Cash and cash equivalents 102.1 113.0 Net financial debt 321.9 339.9
€ 418 m free credit lines
COMBINED MANAGEMENT REPORT Business Report 55
lead to a premature repayment obligation. These regularly involve pari passu clauses and negative pledge declarations, as well as cross default arrangements for major financing facilities. In the case of the syndicated credit line at HORNBACH Baumarkt AG, they also require compliance with specific financial ratios. These key financial ratios are based on consolidated figures at the HORNBACH Baumarkt AG Group and require interest cover of at least 2.25 times and an equity ratio of at least 25 %. Maximum limits for financing facilities secured by land charges and financing facilities taken up by subsidi-aries were also agreed. In the case of the aforementioned new syndicated loan agreement, account was taken of the forthcoming IFRS 16 lease accounting amendments and the discontinuation of the "operating lease" classification. Pursuant to the definition in the syndicated loan agreement, lease liabilities classified as "operating leases" under IFRS principles prior to January 1, 2019 will not be viewed as financial liabilities. As a result, these obligations will not be included in the calculation of key financial ratios for the term of the loan facility. The interest cover, net debt/EBITDA ratio, equity ratio, agreed financing limits, and company liquidity (cash and cash equivalents, plus unutilized committed credit lines) are regularly monitored within the internal risk management framework. Further key figures are calculated on a quarterly basis. Should the values fall short of certain target levels, then countermeasures are initiated at an early stage. All covenants were complied with at all times in the year under report. Further information about financial debt can be found in the notes to the consolidated financial statements.
4.3 Cash and cash equivalents The Group still accords high priority to maintaining an extensive supply of liquidity in the form of cash and cash equivalents and free credit lines. Given the ongoing policy of expansive interest rates at the ECB, how-ever, it has become increasingly difficult to avoid negative interest rates on deposits which, to be reported under cash and cash equivalents, may not have terms longer than three months. To ease this investment situation, cash and cash equivalents were reduced further from € 113.0 million in the previous year to € 102.1 million at the balance sheet date. To achieve this, the Group's liquid funds were used to cover investments without drawing on external financing facilities, while existing financing facilities were repaid upon maturity without refinancing. The funds of € 30 million invested in current fi-nancial assets in the previous year were released in the past financial year and returned to cash and cash equivalents. In the cash flow statement, this reclassification has been reported as an inflow of funds from investing activities and recognized in the "Cash flow for investments in connection with short-term finance planning" line item.
Key financial figures of the HORNBACH Baumarkt AG Group
Key figure Definition 2.28.2018 2.28.2017
Net financial debt Current financial debt + non-current financial debt – cash and cash equivalents
€ million 321.9 339.9
Interest cover Adjusted* EBITDA / Gross interest expenses 11.0 9.8 Net debt / EBITDA Net financial debt / Adjusted* EBITDA 1.7 1.9
* EBITDA excluding changes in non-current provisions and gains/losses on the disposal of non-current assets as reported in the cash flow statement
By distributing the company's liquidity broadly and reducing the volume of liquid funds in the aforemen-tioned manner, it has so far been possible to avoid negative investment rates or the "custody fees" preva-lent on current accounts without amending the company's security-driven investment strategy.
Notes to Consolidated Financial Statements Note (23)
56 COMBINED MANAGEMENT REPORT Business Report
Within financial management activities, the reduction in liquid funds by € 10.9 million was accompanied by an increase in the syndicated credit line by € 100 million to € 350 million. With this line, which acts exclu-sively as a backup, the company has maintained the necessary high degree of security for its liquidity.
4.4 Cash flow statement and investments
Cash flow statement (abridged) 2017/18 2016/17 € million
Cash flow from operating activities 134.1 115.2 of which: funds from operations1) 145.3 144.3 of which change in working capital2) (11.2) (29.1)
Cash flow from investing activities (96.2) (185.4) Cash flow from financing activities (47.7) (100.1) Cash-effective change in cash and cash equivalents (9.8) (170.4)
(Differences due to rounding up or down to nearest € million) 1) Consolidated earnings after taxes, plus depreciation of non-current assets and changes in provisions, minus gains/plus losses on the disposal of non-
current assets, plus/minus other non-cash expenses/income 2) Difference between "Change in inventories, trade receivables and other assets" and "Change in trade payables and other liabilities”
The HORNBACH Baumarkt AG Group invested a total of € 128.7 million in the 2017/18 financial year (2016/17: € 157.0 million), mainly in land, buildings and plant and office equipment at existing DIY stores with garden centers, and at stores under construction. The funds of € 128.7 million (2016/17: € 157.0 mil-lion) required for cash-effective investments were fully acquired from the cash flow of € 134.1 million from operating activities (2016/17: € 115.2 million). Around 56 % of total investments were channeled into new real estate, including properties under construction, while around 44 % were invested largely in replacing and expanding plant and office equipment. Of total investments, € 43.8 million related to the Retail seg-ment, mainly to replace and expand plant and office equipment (2016/17: € 37.6 million), € 71.1 million re-lated to the Real estate segment and was invested in new real estate, including properties under construc-tion (2016/17: € 94.1 million), and € 13.7 million was invested at head office departments and consolidation (2016/17: € 25.4 million). The most significant investment projects related to construction work on DIY stores with garden centers opened in the past financial year or due to be opened in subsequent financial years, the conversion and ex-tension of existing stores, the acquisition of land for the Group's further expansion, investments in plant and office equipment, and in intangible assets, especially software. The inflow of funds from operating activities rose from € 115.2 million in the previous year to € 134.1 million in the 2017/18 financial year. At € 145.3 million, the inflow of funds from operations re-mained virtually unchanged (2016/17: € 144.3 million). Higher inflows of funds due to like-for-like sales growth and favorable operating cost ratios were countered by a reduction of € 2.3 million due to other non-cash income and expense items (2016/17: inflow of € 6.9 million). The change in working capital resulted in an outflow of funds of € 11.2 million (2016/17: outflow of € 29.1 million). This in turn was mainly due to the expansion-related increase in inventories, which was offset only in part by the increase in trade payables. The outflow of funds for investing activities decreased from € 185.4 million to € 96.2 million. Here, the reduction in investments by € 28.3 million to € 128.7 million was opposed by proceeds of € 2.4 million from disposals of non-current assets (2016/17: € 1.6 million). Furthermore, cash and cash equivalents of € 30 million with an
€ 129 m investments
€ 134 m cash flow from operating activities

COMBINED MANAGEMENT REPORT Business Report 57
original term of more than three months were reclassified as liquid funds in the period under report and recog-nized as an inflow of funds from financial assets in connection with short-term finance planning. As in the previous year, no DIY stores with garden centers were disposed of within sale and leaseback transactions in the 2017/18 financial year. The outflow of funds for financing activities totaled € 47.7 million in the 2017/18 financial year, compared with an outflow of € 100.1 million in the previous year. Scheduled repayments of € 3.1 million were made for non-current financial debt but no new long-term borrowing was taken up. Current financial loans and finance lease liabilities decreased by € 23.0 million, having risen by € 5.1 million in the previous year. At € 21.6 million, the dividends paid to shareholders remained at the previous year's level.
4.5 Rating Since 2004, the creditworthiness of the HORNBACH Baumarkt AG Group has been rated by the leading inter-national rating agencies Standard & Poor’s and Moody’s Investors Service. Upon completion of this report, both agencies had in their most recent publications confirmed their ratings at "BB+" with a stable outlook in the case of Standard & Poor’s and "Ba1" and a stable outlook at Moody’s.
BB+/Ba1 Rating of HORNBACH Baumarkt AG Group

58 COMBINED MANAGEMENT REPORT Business Report
5. Asset Position
Balance sheet of the HORNBACH Baumarkt AG Group (abridged version)
(Differences due to rounding up or down to nearest € million)
Total assets at the Group showed a slight year-on-year increase of € 37.9 million (+1.9 %) to € 1,997.7 million. The equity of the Group as stated in the balance sheet amounted to € 1,048.8 million at the end of the finan-cial year (2016/17: € 1,010.6 million). The equity ratio rose from 51.6 % in the previous year to 52.5 % at the end of the 2017/18 financial year.
5.1 Non-current and current assets Non-current assets amounted to € 1,173.2 million at the balance sheet date (2016/17: € 1,131.7 million) and thus accounted for around 59 % (2016/17: 58 %) of total assets. Property, plant and equipment and invest-ment property rose by € 35.8 million (plus 3.2 %) from € 1,103.3 million to € 1,139.1 million. Additions of € 120.9 million to property, plant and equipment were countered by depreciation of € 76.2 million, reclassifi-cations of minus € 0.3 million, and disposals of assets amounting to € 2.0 million. Adjustments to account for exchange rate movements led property, plant and equipment and investment property to decrease by € 6.6 million. Other non-current receivables and assets mainly involve deposits to secure potential claims to purchase price reductions. The change in deferred tax assets was chiefly due to adjustments to temporary measure-ment differences arising upon the recognition of provisions and for finance leases. Current assets decreased by 0.4 % from € 828.2 million to € 824.5 million, or to around 41 % of total assets (2016/17: 42 %). Due to the Group's expansion, inventories rose from € 626.1 million to € 657.8 million. By contrast, cash and cash equivalents decreased from € 113.0 million in the previous year to € 102.1 million in the year under report. Despite the increase in inventories, it was possible to maintain the inventory turnover rate at 3.84, and thus almost at the previous year's high level (3.87). Current receivables and other assets (in-cluding income tax receivables, excluding current financial assets) increased by € 5.5 million to € 64.6 million. This was mainly due to the increase in other receivables, a factor opposed by lower current income tax receivables.
5.2 Non-current and current liabilities Liabilities, including provisions, amounted to € 948.9 million at the balance sheet date, as against € 949.2 million in the previous year. Non-current liabilities fell from € 503.4 million to € 496.3 million. This was mainly due to the reduction in non-current financial debt from € 424.3 million to € 412.6 million as a result of the decrease in leasing liabilities pursuant to IAS 17. The Group no longer had any non-current lia-bilities to banks as of the balance sheet date (2016/17: € 0.6 million). Provisions for pensions fell from € 15.2 million in the previous year to € 10.8 million. Non-current liabilities also include deferred tax liabil-ities of € 26.0 million (2016/17: € 27.5 million). Opposing developments were shown by other non-current
€ million 2.28.2018 2.28.2017 Change
Non-current assets 1,173.2 1,131.7 3.7 % Current assets 824.5 828.2 (0.4) % Assets 1,997.7 1,959.9 1.9 % Shareholders' equity 1,048.8 1,010.6 3.8 % Non-current liabilities 496.3 503.4 (1.4) % Current liabilities 452.6 445.8 1.5 % Equity and liabilities 1,997.7 1,959.9 1.9 %
COMBINED MANAGEMENT REPORT Business Report 59
liabilities, which rose year-on-year from € 36.4 million to € 46.9 million. Current liabilities grew from € 445.8 million to € 452.6 million. Due mainly to lower current liabilities to banks, current financial debt fell from € 28.6 million to € 11.4 million. Trade payables and other liabilities totaled € 341.7 million at the balance sheet date, as against € 327.1 million in the previous year. Other provisions and accrued liabilities rose by € 11.1 million from € 76.7 million to € 87.8 million, a development chiefly due to higher provisions for em-ployee bonuses and other personnel-related provisions for outstanding vacation entitlement, vacation allow-ances, and Christmas bonuses. The net debt of the HORNBACH Baumarkt AG Group, i.e. financial debt less cash and cash equivalents, fell from € 339.9 million to € 321.9 million.
5.3 Off-balance sheet financing instruments and rental obligations In addition to the DIY megastores with garden centers owned by the HORNBACH Baumarkt AG Group and 11 DIY stores with garden centers used on the basis of a finance lease agreements (2016/17: 12), there are 43 stores (2016/17: 43) and one logistics center that are let from the associate company HORNBACH Immobilien AG or its subsidiaries, as well as 57 DIY megastores with garden centers that are let from third parties (2016/17: 56). Moreover, the Group also has a small number of additional land leasehold, leasing and rental agreements. Obligations under rental, hiring, leasehold and leasing contracts relate exclusively to rental agreements for which the companies of the HORNBACH Baumarkt AG Group are not the economic owners of the assets thereby leased pursuant to IFRS accounting standards (Operating Lease). The rental agreements principally relate to DIY stores with garden centers in Germany and other countries. The terms of the rental agreements usually amount to between 15 and 20 years, with subsequent rental extension options. The respective agree-ments include rent adjustment clauses. As of February 28, 2018, obligations under rental, hiring, leasehold and leasing contracts totaled € 985.0 million (2016/17: € 1,013.1 million).
Key balance sheet figures of the HORNBACH Baumarkt AG Group
1) Net operating profit after tax, defined as EBIT minus unchanged standardized tax rate of 30 % at the HORNBACH Group 2) Average total capital, defined as average equity plus average net debt
Key figure Definition 2.28.2018 2.28.2017
Equity ratio Equity / Total assets % 52.5 51.6 Return on equity Annual net income / Average equity % 5.7 5.3 Return on total capital NOPAT1)/ Average total capital2) % 5.3 5.4 Debt / equity ratio (gearing) Net debt / Equity % 30.7 33.6 Additions to non-current assets, including advance payments for land
Additions to non-current assets, including advance payments for land € million 128.7 176.1
Net working capital Inventories and receivables less trade payables € million 468.7 470.7
Inventory turnover rate Cost of goods sold / Average inventories 3.8 3.9

60 COMBINED MANAGEMENT REPORT Business Report
6. Notes to the Annual Financial Statements of HORNBACH Baumarkt AG (HGB)
Income statement of HORNBACH Baumarkt AG pursuant to HGB (abridged version)
(Differences due to rounding up or down to nearest € million)
HORNBACH Baumarkt AG, whose legal domicile is in Bornheim (Pfalz), prepares its annual financial state-ments in line with the requirements of the German Commercial Code (HGB) and supplementary provisions of the German Stock Corporation Act (AktG). It is the parent company of the HORNBACH Baumarkt AG Group. HORNBACH Baumarkt AG includes the operating retail business at the HORNBACH DIY stores with garden centers in Germany and head office functions at the Group, such as finance, accounting, information technol-ogy, tax, legal, and personnel.
6.1 Business framework The macroeconomic and sector-specific framework for our operating business in Germany is described in detail in Chapter 1. "Macroeconomic and Sector-Specific Framework" of this Business Report.
6.2 Development in the store network In the 2017/18 reporting year, HORNBACH opened one new DIY store with a garden center in Halle (Saxony-Anhalt). As previously planned, the location in Hanau (Hessen) was closed due to the lack of extension options. We thus operated a total of 98 retail outlets across Germany as of February 28, 2018 (February 28, 2017: 98). Sales areas in Germany totaled around 1,052,000 m² (2016/17: 1,049,000 m²).
€ 000s 2017/18 2016/17 Sales 2,514,096 2,436,132 Other own work capitalized 622 378 Other operating income 14,090 12,144 Cost of materials 1,702,936 1,649,262 Gross profit 825,872 799,392 Personnel expenses 414,974 395,720 Depreciation and amortization 37,630 34,870 Other operating expenses 370,823 355,521 Operating result 2,445 13,281 Financial result 15,180 44,572 Taxes 2,592 3,280 Earnings after taxes 15,033 54,573 Other taxes 1,004 935 Annual net surplus 14,029 53,638 Withdrawal from (2016/17: allocation to) revenue reserves 7,600 (26,818) Net profit 21,629 26,820
Group Management Report Business Report Macroeconomic and Sector-Specific Framework

COMBINED MANAGEMENT REPORT Business Report 61
6.3 Earnings position
6.3.1 Sales performance Net sales (excluding sales tax) at HORNBACH Baumarkt AG grew by 3.2 % from € 2,436 million to € 2,514 million in the 2017/18 year under report. Sales include an amount of € 378 million for deliveries from HORNBACH logistics centers to our foreign subsidiaries (2016/17: € 349 million). The business performance of HORNBACH Baumarkt AG is largely determined by the development in domestic like-for-like sales, which we have explained in detail in Chapter 3.1.3 "Like-for-like sales".
6.3.2 Earnings performance The other operating income reported in the income statement, which mainly consists of income from reversals of provisions and exchange rate gains, increased by € 2.0 million to € 14.1 million (2016/17: € 12.1 million). Cost of materials rose by 3.3 % to € 1,702.9 million (2016/17: € 1,649.3 million). Gross profit totaled € 825.9 million, or 32.8 % of net sales, as against € 799.4 million, or 32.8 %, in the previous year. Due mainly to the company's growth and to higher bonus provisions, personnel expenses increased as a propor-tion of net sales, rising by 4.9 % from € 395.7 million to € 415.0 million. At € 37.6 million, depreciation and amortization were 7.9 % higher than in the previous year (€ 34.9 million). Other operating expenses increased to € 370.8 million, up from € 355.5 million in the previous year. This was mainly due to increased exchange rate losses, higher external advisory expenses, and increased maintenance expenses. At € 2.4 million, the operating result was significantly lower than in the previous year (€ 13.3 million). This was mainly due to higher personnel expenses (plus € 19.3 million), an increase in other operating expenses (plus € 15.3 million), and higher depreciation and amortization (plus € 2.8 million). The financial result (including income from investments) fell by € 29.4 million to € 15.2 million in the year under report (2016/17: € 44.6 million). This reduction was mainly due to the decrease in income from in-vestments from € 55.5 million to € 24.6 million as a result of a lower transfer of profit from HORNBACH International GmbH. In the 2017/18 financial year, HORNBACH Baumarkt (Schweiz) AG, Switzerland, HORNBACH Baumarkt CS spol s.r.o., Czech Republic, and HORNBACH Baumarkt Luxemburg SARL, Luxembourg, distributed profit total-ing € 49.1 million to HORNBACH International GmbH (2016/17: € 54.1 million). In the 2017/18 year under report, HORNBACH International GmbH was additionally affected by a write-down, with a corresponding charge to earnings, of the carrying amount of the investment in the Swedish subsidiary HORNBACH Byggmarknad AB. This amounted to € 25.7 million and led to a corresponding reduction in the profit transferred to HORNBACH Baumarkt AG. Interest income and income from loans of financial assets rose from € 2.9 million to € 3.2 million. At € 12.7 million, interest expenses in the year under report were 8.6 % lower than the previous year's figure (€ 13.9 million). In view of the factors outlined above, the annual net surplus decreased from € 53.6 million to € 14.0 million in the 2017/18 financial year.
Group Management Report Business Report Earnings Position

62 COMBINED MANAGEMENT REPORT Business Report
Balance sheet of HORNBACH Baumarkt AG pursuant to HGB (abridged version)
6.4 Asset position At € 1,212.0 million, total assets as of February 28, 2018 were € 18.9 million, or 1.6 %, higher than the previous year's figure (€ 1,193.1 million). Non-current assets amounted to € 583.2 million, or 48.1 % of total assets, at the balance sheet date (2016/17: € 523.3 million / 43.9 %). Mainly due to investments of € 37.0 million accompanied by deprecia-tion of € 33.0 million and retirements of € 1.2 million, property, plant and equipment rose to € 291.3 million (2016/17: € 288.5 million). Financial assets rose from € 223.6 million to € 277.9 million. Of this increase, a net total of € 44.4 million was due to long-term loans to two Dutch group companies, while € 10.0 million was due to an increase in the shareholding in HORNBACH International GmbH. Current assets amounted to € 618.1 million at the balance sheet date (2016/17: € 660.0 million). Due to the company's growth, inventories rose by 3.9 %, or € 15.8 million, to € 416.9 million (2016/17: € 401.1 million). At 4.2, the inventory turnover rate in the 2017/18 financial year was at the same level as in the previous year. Receivables from affiliated companies decreased by € 30.0 million to € 100.0 million (2016/17: € 130.1 million). The reduction in receivables in the 2017/18 financial year was chiefly attributable to the year-on-year decrease in short-term financing of group companies. Due in particular to the granting of long-term loans to two group companies, cash and cash equivalents fell by € 35.4 million to € 58.2 million (2016/17: € 93.5 million). At € 5.4 million, deferred tax assets were higher than in the previous year (2016/17: € 4.4 million).
Assets 2.28.2018 2.28.2017 € 000s € 000s Intangible assets 13,935 11,276 Property, plant and equipment 291,338 288,492 Financial assets 277,922 223,564 Non-current assets 583,195 523,332 Inventories 416,903 401,122 Receivables and other assets 143,042 165,362 Cash holdings, credit balances at banks, and checks 58,159 93,540 Current assets 618,104 660,024 Deferred expenses and accrued income 5,295 5,422 Deferred tax assets 5,421 4,350 Total assets 1,212,015 1,193,128 Equity and liabilities Shareholders' equity 608,639 616,296 Provisions 66,842 57,679 Liabilities 527,300 510,202 Deferred income and accrued expenses 9,234 8,951 Total equity and liabilities 1,212,015 1,193,128
COMBINED MANAGEMENT REPORT Business Report 63
At € 608.6 million, shareholders' equity as of February 28, 2018 was 1.2 % lower than in the previous year (€ 616.3 million). The equity ratio is reported at 50.2 % (2016/17: 51.7 %). Provisions increased from € 57.7 million to € 66.8 million at the balance sheet date. This largely resulted from higher provisions for bonuses. At € 527.3 million, liabilities were € 17.1 million higher at the balance sheet date than the previous year's figure (€ 510.2 million). Due to scheduled repayments, liabilities to banks decreased from € 13.7 million in the previous year to € 0.4 million. At € 174.9 million, trade payables were at the previous year's level. Liabili-ties to affiliated companies, mainly resulting from group financing, rose from € 33.2 million to € 60.1 million in the 2017/18 financial year.
6.5 Financial position Information about the principles and objectives of financial management, an explanation of financial debt and the capital structure can be found in Chapter 4.1. Shareholders' equity (after the planned dividend distribution) covers around 104 % of non-current assets. In the 2017/18 financial year, HORNBACH Baumarkt AG invested a total of € 44.3 million (2016/17: € 58.0 million) in intangible assets, land, buildings, and plant and office equipment. Investments in land and buildings totaled € 12.0 million, while a further sum of € 25.0 million was channeled into replacing and expanding plant and office equipment. Of total investments, € 7.3 million (2016/17: € 6.5 million) related to intangible assets acquired in return for payment. Furthermore, financial assets also rose, with this being largely due to the granting of long-term loans to two group companies and to one capital increase.
6.6 Overall assessment of earnings, asset, and financial position of HORNBACH Baumarkt AG Despite a positive sales performance, the operating earnings of HORNBACH Baumarkt AG fell significantly in the 2017/18 financial year. This was largely due to a disproportionate increase in personnel expenses, depreci-ation and amortization, and other operating expenses. The sharp reduction in the annual net surplus from € 53.6 million to € 14.0 million largely resulted from the marked fall in earnings transferred from HORNBACH International GmbH to HORNBACH Baumarkt AG. This in turn was due to the write-down of € 25.7 million recognized on the carrying amount of the investment in a Swedish subsidiary. Non-current assets and around 45 % of current assets are financed on a long-term basis by shareholders' equity (after the planned dividend distribution) and non-current debt capital. Overall, the company's economic position is satisfactory.
6.7 Proposed appropriation of net profit of HORNBACH Baumarkt AG HORNBACH Baumarkt AG concluded the 2017/18 financial year with an annual net surplus of € 14,028,890.30. Following the withdrawal of € 7,599,869.70 from other revenue reserves, the Board of Management proposes to appropriate the net profit of € 21,628,760.00 as follows: € 0.68 dividend per share with a nominal amount of € 3.00 on 31,807,000 ordinary shares Dividend distribution: € 21,628,760.00.
Group Management Report Business Report Financial Position

64 COMBINED MANAGEMENT REPORT Non-Financial Statement
Non-Financial Statement
HORNBACH Baumarkt AG has drawn on the option provided for in § 289b (2) and § 315b (2) HGB of exempting itself from the obligation to extend the combined management report with a combined non-financial state-ment. HORNBACH Baumarkt AG is included in the group management report of its parent company HORNBACH Holding AG & Co. KGaA. HORNBACH Holding AG & Co. KGaA has submitted a non-financial statement for the 2017/18 financial year pursuant to § 315b HGB. This will be published at the same time as the Annual Report as a separate non-financial group report on the company's homepage (www.hornbach-group.com/NFS).
Events After the Balance Sheet Date
No events that could be of material significance for the assessment of the earnings, financial, or net asset position of HORNBACH Baumarkt AG or of the HORNBACH Baumarkt AG Group occurred between the balance sheet date on February 28, 2018 and the date of preparation of this report.
www.hornbach-group.com/NFS

COMBINED MANAGEMENT REPORT Risk Report 65
Risk Report
1. Risk Management at the Group
All entrepreneurial activity directly involves opportunities and risks. Effectively managing opportunities and risks therefore represents a critical success factor in sustainably securing the company’s value. The Board of Management of HORNBACH Baumarkt AG is committed to risk-conscious corporate management which ac-cords top priority at all times to safeguarding the continued existence of the overall company and its subsidi-aries. The risk management system (RMS) implemented by the Board of Management is intended to achieve ongoing enhancements in the early identification of risks with the aim of proactively managing such risks, as well as continuously optimizing the company’s opportunity/risk profile. On this basis, the Board of Manage-ment has adopted the following principles.
2. Risk Policy Principles
Generating economic profit necessarily involves risk taking. Nonetheless, no action or decision may entail any existential risk, i.e. any threat to the continued existence of the company or any of its operations. As a matter of principle, the Group does not enter into any risks which relate neither to its core processes nor to its support processes. Core processes involve developing and implementing the respective business models, procuring merchandise and services, location decisions, safeguarding liquidity, and developing specialist and man-agement personnel. Any earnings risks entered into have to be justified by an appropriate level of expected return. The relevant key figures are based on the return on capital employed. Unavoidable risks have to be insured against, where this is possible and economically expedient. Residual risks have to be controlled by means of a range of risk management instruments.
3. Organization and Process
The risk management system in place at the HORNBACH Baumarkt AG Group forms an integral part of the company’s management structure. It consists of the central components of early risk identification, control-ling and planning processes, reporting and an internal control system, and is continually enhanced and optimized. Responsibility for establishing, organizing and maintaining a suitable, target-based risk manage-ment system, and the internal control system in particular, lies with the Board of Management. In terms of the organization and maintenance of the system, the Board of Management is supported by the Director of Group Controlling / Risk Management. The Board of Management has appointed risk managers at the Group's operations in Germany and abroad. These are charged with identifying and reporting risks in their areas of responsibility and managing such risks with appropriate measures. These responsibilities and accountabilities are clearly defined at the Group and reflect our company structure. When identifying and evaluating risks and determining appropriate measures to manage such risks, risk managers are supported by a central risk controller responsible for co-ordinating risk management processes.

66 COMBINED MANAGEMENT REPORT Risk Report
Company risk assessment categories in ascending order
Probability of occurrence Potential implications (in €)
improbable ≤ 1 % marginal ≤ 5.0 million rare > 1 % - ≤ 5 % moderate > 5.0 million - ≤ 10.0 million
occasional > 5 % - ≤ 20 % noticeable > 10.0 million - ≤ 50.0 million possible > 20 % - ≤ 50 % severe > 50.0 million - ≤ 100.0 million frequent > 50 % critical > 100.0 million
Earnings risks are analyzed with the assistance of a risk matrix. This records both the probability of occurrence and the potential level of damages of the relevant risks. This way, we can assess the existence and extent of any need for action. Where risks cannot be quantified, they are assessed in terms of their qualitative impli-cations. The principles and regulations underlying the risk management system are documented in a risk management handbook. This sets out principles for the overall Group concerning the structures and processes necessary for the early detection of risks. To support the risk management process, a standard software solu-tion has been implemented across the Group which offers assistance in recording and documenting risks and the relevant risk management measures. Risks are updated quarterly and reported to the Board of Management. The Supervisory Board and Audit Committee discuss the current risk situation on a half-yearly basis. Alongside this scheduled reporting, ad-hoc reporting structures are also in place and have been implemented in the risk management process for risks arising unexpectedly. The internal control system currently in place is based on standardized documentation requirements at the Group for all checks on processes and related risks which could impact materially on the financial reporting process. The internal control system is based in this respect on the relevant work instructions and handbooks available on the Group’s intranet. Within the framework of its activities, the Group Internal Audit Department regularly audits the functionality of the existing risk management system. When auditing the annual financial statements, the external auditor also assesses whether the early warning risk identification system is suitable to provide early warning of any developments that could threaten the continued existence of the company.
4. Internal Control and Risk Management System in respect of the Group Financial Reporting Process (pursuant to § 315 (2) No. 5 HGB)
The objective of the internal control and risk management (IKS) system in respect of the financial reporting process is to identify and evaluate those risks which could prevent the consolidated financial statements from conforming to the relevant requirements. Corresponding control measures and clear responsibilities are allocated for the risks thereby identified. These are intended to provide reasonable assurance of the possibil-ity of preparing financial statements for the overall Group and those subsidiaries requiring consolidation that conform to the relevant requirements in spite of the risks thereby identified. At the HORNBACH Baumarkt AG Group, the existing internal control (IKS) system in respect of the financial reporting process and associated risk matrix are documented on a group-wide basis. Country-specific fea-tures deviating from group processes are described by the subsidiaries and added to the documentation. The appointment of IKS managers at the country companies and parent company ensures that material process changes are documented and suitable checks implemented. In this respect, IKS managers are required to submit annual declarations of conformity. The existing IKS system is continually being developed further.

COMBINED MANAGEMENT REPORT Risk Report 67
Alongside defined control mechanisms, such as technical system and manual agreement processes, key ele-ments of the internal control system include the separation of functions and the existence of guidelines and work instructions, and compliance with such. The principle of dual control is applied throughout the financial reporting process, and compliance is required with specified approval processes. Clearly defined company and management structures, clearly allocated responsibilities and adequate regulations governing access to the information and accounting systems relevant to the financial statements based on a standard authoriza-tion concept valid for the entire Group serve to further manage and control risks. These principal control measures are integrated into financial reporting processes. Group companies prepare their financial statements locally. They are responsible for taking due account of lo-cal requirements and compliance with group-wide guidelines in the form of work instructions and accounting and organization handbooks, as well as for the correct reconciliation of local separate financial statements with the IFRS financial statements prepared in accordance with group-wide uniform accounting policies. The accounting handbook in particular sets out clear instructions limiting employees’ discretionary scope in terms of the recognition, measurement and disclosure of assets and liabilities, thus reducing the risk of accounting inconsistencies within the Group. The managers responsible for the accounting treatment of the relevant items at individual group companies submit quarterly group-internal declarations of completeness confirming the correctness and completeness of the respective separate financial statements. On group level, the Group Accounting Department and Group Controlling Department perform further checks on the plausibility and correctness of the accounting data input into the financial statements. The process of preparing consolidated financial statements is centrally coordinated by way of a specified deadline and activity plan and monitored both centrally and locally. Sub-sidiaries are supported by central contact partners throughout the entire financial reporting process. Major changes to financial reporting processes due to new laws, legislative amendments or changes in inter-nal processes are discussed prior to implementation at sometimes international finance conferences for all managers with significant involvement in the group financial reporting process. Specialist accounting or financial reporting issues and complex matters either involving particular risks or requiring special expertise are monitored and processed centrally. External experts, such as chartered surveyors, are drawn on in partic-ular to assess the fair values of real estate for impairment tests or to measure pension provisions. All significant processes relevant to financial reporting are uniformly portrayed across the Group in a common IT system. This complete integration of all major finance systems within a uniform IT system ensures the integrity of the data on which the separate and consolidated financial statements are based. In conjunction with the accounting handbook valid for the whole Group, the use of uniform account codes across the Group and central management of the account system ensure uniform accounting treatment of transactions of the same nature. This also serves as a basis for group consolidation in accordance with the relevant requirements. Consolidation measures and the necessary agreement activities are performed centrally by a consolidation department. The checks to be undertaken in the consolidation processes, such as the consolidation of liabili-ties, expenses or revenues, are performed both automatically by the IT system and manually. The risk of system breakdowns or data loss is minimized by centrally managing and monitoring all signifi-cant IT systems involved in the financial reporting process and regularly performing system backups. As an integral component of the internal control system, the Group Internal Audit Department regularly audits the effectiveness of the internal control system in respect of the financial reporting process on the basis of trial samples reviewed in line with a risk-oriented audit plan. However, even suitable functional systems cannot provide absolute assurance concerning the identification and management of risks.

68 COMBINED MANAGEMENT REPORT Risk Report
Overview of overall risks*
Probability of occurrence Potential implications
Financial risks Foreign currency risks possible moderate Liquidity risks rare critical Credit risks rare moderate External risks Macroeconomic and sector-specific risks frequent noticeable Natural hazards improbable severe Operating risks Location and sales risks possible noticeable Procurement risks occasional moderate Legal risks Legislative and regulatory risks occasional severe Risks relating to legal disputes possible low Management and organizational risks IT risks improbable critical Personnel risks possible low
* Unless otherwise stated, the risks hereby listed apply both to the "Retail" segment and to the "Real estate" segment.
5. Financial Risks
The Group’s financial risks comprise exchange rate, liquidity, and credit risks. Responsibility for managing these risks lies with the Treasury department.
5.1 Exchange rate risks In general, HORNBACH is exposed to exchange rate risks on account of its activities in countries with curren-cies other than the euro. Specifically, these involve Swiss francs, Czech crowns, Swedish crowns, Romanian leis, and Hong Kong dollars. Any depreciation in a foreign currency against the euro can lead to a reduction in consolidated earnings when translating the separate financial statements of foreign subsidiaries into euros, the Group’s currency. These risks are not hedged at the Group. Furthermore, the increasingly international business activities of the Group result in rising foreign currency requirements both for handling international merchandise procurement and for financing objects of investment in foreign currencies. Any change in the exchange rate between the respective national currency and the procurement currencies (chiefly EUR and USD) could have a direct negative impact on earnings. Open foreign currency positions in USD are largely secured by hedging transactions (USD fixed-term and time deposits). Where possible, investments are externally financed on a long-term basis in the functional currency of the respective country company (natural hedging). Open foreign currency positions arising at the Group in EUR, which mainly relate to intragroup deliveries and services invoiced in EUR and intragroup EUR loans, are not hedged.
5.2 Liquidity risks The acquisition of land, investments in DIY stores with garden centers and procurement of large quantities of merchandise require high volumes of liquidity to be permanently available. The financing of the company's further expansion is secured by the inflow of funds from the operating cash flow, as well as by bilateral bank loans and credit lines, a syndicated credit line of € 350 million with a term running until December 22, 2022,
COMBINED MANAGEMENT REPORT Risk Report 69
and the € 250 million bond issued by HORNBACH Baumarkt AG in February 2013, which has a term running until February 15, 2020. HORNBACH counters the risk of no longer being able to obtain longer-term financing for new locations from banks or via sale and leaseback transactions due to financing conditions on the capital markets by flexibly adjusting its investments, maintaining a substantial liquidity cushion in the form of liquid funds and free credit lines. No security in the form of assets was granted in connection with the bond or the syndicated credit line at HORNBACH Baumarkt AG. The contractual terms nevertheless require compliance with specified customary bank covenants. Failure to do so may possibly result in immediate repayment being required for the funds drawn down. This would necessitate follow-up financing, which would only be possible on stricter refinancing terms. Alongside general covenants, such as pari passu, negative pledge, and cross default covenants, specific financial covenants were also agreed for the syndicated credit line at HORNBACH Baumarkt AG. These require compliance with an equity ratio of at least 25 % and interest cover (adjusted EBITDA / gross interest expenses) of at least 2.25 on the level of the HORNBACH Baumarkt AG Group. Furthermore, maximum limits have been set for financial liabilities secured by land charges and for financial liabilities at subsidiaries. The bond is only governed by general covenants, such as pari passu, negative pledge, and cross default covenants, but not by financial covenants. As of February 28, 2018, the equity ratio amounted to 52.5 % (2016/17: 51.6 %) and interest cover came to 10.9 (2016/17: 9.8). Compliance with these covenants is monitored on an ongoing basis. All covenants were complied with at all times during the 2016/17 financial year. The information required for efficient liquidity management is provided by rolling group financial planning with a twelve-month budgeting horizon, which is updated monthly, as well as by a daily financial forecast. The Group currently faces no risks in connection with any follow-up financing necessary to cover maturing financial liabilities. At present, no liquidity risks are discernible.
5.3 Credit risks The company limits the risk of any financial loss in connection with financial investments and derivative financial instruments by working exclusively with contractual partners of strong creditworthiness and select-ing banks covered by collective deposit security arrangements. Moreover, bank deposits have been distributed among several financial institutions in order to counter the risk of bank deposit default. This approach was also maintained in the 2017/18 financial year. The company’s retail format (cash and carry) means that the risk of receivables defaults in its operating divisions is already considerably reduced. Further detailed information about financial risks and sensitivity analyses can be found in the notes to the consolidated financial statements.
6. External Risks
6.1 Macroeconomic and sector-specific risks The dependency of HORNBACH DIY stores with garden centers on general macroeconomic developments and levels of disposable household income may become apparent in the form of unwillingness on the part of cus-tomers to make purchases in periods of low economic growth. Not only that, the economic outlook in Europe
Notes to Consolidated Financial Statements Note (34)

70 COMBINED MANAGEMENT REPORT Risk Report
may also turn out weaker than expected due to the influence of negative developments in the global political and economic framework. Irrespective of this, a major dependency on economic developments in Germany has been identified. The further expansion into other European countries is intended to achieve an ongoing diversification of risk. Furthermore, the company generates a substantial share of its sales with seasonal articles whose turnover is significantly affected by external factors, such as weather conditions. Prolonged winter weather, for example, might shorten the spring season and result in lower sales in the gardening division in the important first quarter of the financial year. Changing consumer behavior, particularly with regard to increasing digitization, also harbors risks. To be pre-pared for the future, and thus counter this risk, we have gradually expanded our online activities by way of an integrated multichannel strategy.
6.2 Natural hazards The climate change observable around the world also directly affects HORNBACH locations in Germany and other European countries. In addition to potential natural catastrophes (e.g. gales, flooding), the Group is also exposed to risks resulting from fire and explosions. The principal insurable natural hazards and any potential interruption to operations thereby arising are covered by group-wide insurance policies.
7. Operating Risks
7.1 Location and turnover risks Investments in unsuitable locations could have a significant negative impact on the Group’s earnings power. To minimize such risks, investments in new locations are therefore prepared on the basis of detailed market research analysis, with investment decisions being taken on the basis of dynamic investment calculations and sensitivity analyses. The risk of unsatisfactory sales performance due to additional existing factors, such as customer behavior and the local competitive situation, can nevertheless not be excluded entirely. Ongoing investments therefore have to be made in locations, enhancing customer service levels, and in new concepts in order to maintain the company’s competitiveness, especially in countries with low market growth and in-tense competition.
7.2 Procurement risks As a retail company, HORNBACH is dependent on external suppliers and manufacturers. We exercise the utmost caution when selecting our suppliers. Particularly when selecting private label suppliers, we pay attention to their reliability in terms of high product quality and their consistent compliance with safety and social standards at the respective companies. To avoid the loss of major suppliers, the Group has developed an efficient early warning system that monitors suppliers continuously on the basis of various quantitative and qualitative criteria. The implications of any potential supplier loss are further reduced by probing the market for alternative substitutes at an early stage and maintaining a multi-supplier strategy. Should there be any deterioration in the macroeconomic situation, however, then the risk of the Group losing suppliers and being unable to procure such products elsewhere at short notice cannot be excluded entirely. The overall Group has several central warehouses in order to reduce the risk of any interruption to the logistics chain and optimize the supply of merchandise. In its procurement of merchandise, HORNBACH is subject, among other risks, to increasing purchasing prices for articles involving a high share of crude oil, copper or steel as a result of volatile prices on the international commodities markets. Furthermore, higher prices for

COMBINED MANAGEMENT REPORT Risk Report 71
products involving energy-intensive manufacturing processes could lead to an increase in overall procurement costs, one which it might not be possible to pass on to customers in full, or only following a certain delay.
8. Legal Risks
8.1 Legislative and regulatory risks As a result of its international business activities, the HORNBACH Baumarkt AG Group is subject to various national legislative frameworks and regulations. Legislative amendments may therefore lead to higher costs. Alongside risks such as those relating to damages claims due to infringements of patents or industrial property rights, or of damages resulting from environmental or product liability, the Group’s future earnings situation may also be negatively affected in particular by any tightening up of national construction laws or regulations governing the acquisition of land. To avoid contract breaches and disadvantageous arrangements, we continually monitor compliance with our contractual obligations and seek advice from internal and external legal experts for contract-related matters.
8.2 Risks relating to legal disputes In the course of their business operations, the companies of the HORNBACH Baumarkt AG Group are inevitably confronted with legal claims on the part of third parties, both in court and out of court. Precautionary account-ing measures are taken by recognizing a suitable level of provisions for existing risks in connection with legal disputes. At present, HORNBACH is not involved in any current or foreseeable court or arbitration proceedings which could significantly impact on the Group’s economic situation.
9. Management and Organizational Risks
9.1 IT risks The management of the Group is heavily dependent on high-performance information technology (IT). The ongoing maintenance and optimization of IT systems is performed by highly qualified internal and external experts. Unauthorized data access, and the misuse or loss of data are averted by using appropriate up-to-date virus software, firewalls, adequate access and authorization concepts, and existing backup systems. Appropriate emergency plans are in place for unexpected breakdowns in IT systems.
9.2 Personnel risks The deployment of highly motivated and qualified employees represents one of the foundations for HORNBACH’s success. This pillar of the corporate culture is therefore of great significance for the overall Group. The maintenance of employee satisfaction is therefore evaluated in regular employee surveys carried out by external service providers, while employee qualification levels are continually improved with appropriate training and development measures. Performance-based bonus models support the company in reaching this objective. Not only that, all management staff hold annual one-to-one meetings with their employees in which their past performance is appraised and future development measures are agreed. In its recruitment and retention of highly qualified specialist and management personnel, however, HORNBACH is dependent on a variety of external factors, such as overall developments on the labor market or in the sector, and is also subject to the country-specific impact of demographic changes.

72 COMBINED MANAGEMENT REPORT Opportunity Report
10. Overall Assessment of Risk Situation
The assessment of the overall risk situation found that there were no risks to the continued existence of the HORNBACH Baumarkt AG Group in the 2017/18 financial year. From a current perspective, there are also no discernible risks that could endanger the continued existence of the company in future or sustainably impair its earnings, financial or net asset position.

COMBINED MANAGEMENT REPORT Opportunity Report 73
Opportunity Report
The European DIY sector will continue to provide HORNBACH with growth opportunities in future as well. These are to be assessed in conjunction with the risks outlined in the Risk Report and the evaluation of the future macroeconomic framework provided in the Outlook. Against this backdrop, the company is consistently enhancing its retail format and corporate strategy, aiming to ensure continuity, reliability and sustainability so as to make optimal use of potential opportunities for future growth.
1. Sector-Specific Opportunities
The growing need for modernization work plays a major role for DIY store and garden center operators, as do trends among consumers. These harbor various degrees of potential in individual country markets in terms of rising demand for products and services relating to construction, renovation and gardens. Furthermore, market consolidation in regions with particularly intense competition, such as Germany and Austria, also presents opportunities in the short term.
1.1 Modernization market Construction work on existing buildings (the refurbishment, modernization and renovation market) is a prominent factor in the business performance of DIY and garden stores, with more than half of all housing construction investments relating to this market segment. Robust economic developments in Europe, low interest rates, international and domestic migration, and the need to make up for the shortfall in investment in many areas since the financial crisis – all these factors mean that new construction volumes in the Euro-pean housing construction market showed a marked temporary revival in the years from 2015 to 2017. Having said this, modernization work on existing buildings is set to remain the driving force for sales in the DIY sector. Euroconstruct, the European research and consulting network, expects construction work on exist-ing buildings to regain significance compared with new housing construction over the next three years. In Germany, sales in the modernization market have exceeded new construction volumes since 1998. Based on calculations compiled by the German Institute for Economic Research (DIW), two thirds of the housing construction volumes of around € 215 billion in 2017 involved construction work on existing buildings. Declining momentum in the new housing construction market will allow homeowners to perform increasing volumes of refurbishment and modernization work once again in future. Despite lively transaction volumes in the market for second-hand properties, however, the DIW reports that the modernization segment has so far not witnessed any more substantial growth in this respect. Usually, however, homeowners implement far-reaching modernization measures directly upon or shortly after the transfer of ownership. Work on existing buildings is often of a smaller-scale nature and less lucrative for the construction industry than new con-struction orders. A backlog of modernization work can thus be expected to have accumulated in recent years. As capacities in the new housing construction market are freed up once again, this backlog can be expected to be gradually worked through. The following growth drivers should impact positively on the business perfor-mance of the DIY sector: The age structure of real estate indicates an increasing need for maintenance and modernization. In
Germany, for example, more than 80 % of all houses and apartments are more than 30 years old. Almost one in three detached houses in Germany is in need of renovation. Half of the owner-occupied houses built between 1949 and 1960 have not yet been comprehensively renovated and no longer meet current techno-logical standards in terms of energy efficiency. Given that the property will decline in value and attrac-tiveness on the housing market unless renovation measures are undertaken, the need for construction
€ 215 bn construction work on existing buildings in 2017
> 80 % homes in Germany more than 30 years old

74 COMBINED MANAGEMENT REPORT Opportunity Report
services and materials can be expected to increase. Interest rates, still low by long-term standards, con-tinue to benefit private households' financing opportunities here.
Increasing momentum can be expected once again from the renovation of buildings to improve their energy
efficiency. Given the long-term increase in energy costs and climate protection, this is becoming an ever more important factor – one promoted not least by numerous laws, directives, ordinances and subsidies on European and national levels. Energy-efficient construction and renovation enable a residential property's energy costs to be cut by up to three quarters and the property's operating costs to be sustainably reduced over its lifecycle. Energy-efficiency renovation also makes a major contribution towards cutting CO2 emissions. Energy efficiency is therefore one of the top themes in the European DIY sector.
Given demographic developments in Europe, barrier-free construction involves the challenge of adapt-
ing existing living space and urban infrastructure to enable elderly people to retain their freedom and live independently in their familiar surroundings for as long as possible. Demand for senior citizen-friendly construction solutions, such as barrier-free access to buildings and apartments, the installation of eleva-tors, and doorway-widening and sanitary conversion measures, will therefore continue to rise.
1.2 Consumer trends Past experience shows that people are more likely to withdraw into their private sphere during periods of uncertainty than at other times ("homing"). Consumers spend more time at home and are prepared to in-vest in decorating and equipping their own four walls. This is not just a German phenomenon but also a key international motivation for home improvement as a popular leisure activity. This is all the more relevant at present, as consumers in numerous regions across Europe are benefiting from low mortgage interest rates and prefer to channel their resources into private house construction or renovation projects than into alter-native capital investments that are increasingly viewed as unsafe or unattractive. The realization of "living worlds" is playing an ever greater role in modernization projects in consumers' houses, apartments and gardens. Consumers are showing growing awareness of trends and influences from the realms of fashion, art, architecture and the media. Consumers' desire to map these living trends onto their own four walls is socially motivated by a desire for durable values, quality (of living), individuality, and emotional flair. Compared with specialist retailers, the DIY store sector still has great potential for devel-opment, and new opportunities, in terms of addressing its target groups in ways which arouse their emo-tions, presenting "living worlds", and advising consumers on complex interior design projects. Additional opportunities are presented by consumers' changing lifestyles and patterns of consumption due to the megatrends of digitization and sustainability. Retailers and industrial players are undergoing a pro-cess of far-reaching change. Business models are being further developed, or newly developed, to meet the future requirements of consumers and society. By offering suitable concepts, new technologies, and innova-tive products, the DIY store sector can benefit from new market opportunities here. One example is the sub-stantially expanded range of products and advisory services for "smart homes". According to a study com-piled by eco – Association of the Internet Industry and Arthur D. Little, the German smart home market is set to grow by an annual average of around 26 % over the next five years. Particularly when compared with net-based providers ("pure players"), stationary DIY store operators which also operate online retail channels have the advantage of being able to offer customers a broader and deeper DIY product range, "analog" advisory services, and a shopping experience on location.
26 % annual growth in market for smart home products

COMBINED MANAGEMENT REPORT Opportunity Report 75
1.3 Competition and consolidation Numerous different sales formats are competing for the favor of DIY enthusiasts, construction clients, and garden lovers in the European DIY market. By offering suitable customer focus and specialist retail concepts, DIY store operators have the opportunity to acquire additional market share at the cost of other sales for-mats. This growth potential is inversely proportionate to the share of the total DIY market accounted for by DIY stores in a given country. Germany is the largest DIY market in Europe. However, DIY and home improvement stores in Germany have so far only exhausted part of their customer potential. In Germany, this distribution channel only covers around half of the core DIY market, which has a market volume of around € 45 billion. The other half of the market is accounted for by specialist retailers (e.g. specialist tile, interior decoration, lighting or sanitary stores), builders' merchants, and timber merchants. In other European countries, DIY stores account for a higher share of the market, in some cases considerably so. Not only that, there is growing competition from pure players that are continually gaining market share in the DIY segment and stepping up the competitive pres-sure. Given these factors, further consolidation can be expected. Above all, this can be expected to benefit those companies that combine high-performing stationary retail with e-commerce in a multichannel retail business.
2. Strategic Opportunities
Our aim is to continually expand HORNBACH’s position in the European DIY market by means of organic growth. Our sales and profitability are to be sustainably increased by expanding our internationally success-ful retail format. On the one hand, this involves focusing on the strategic enhancement of our concept and expanding our store network at locations offering above-average growth potential in Germany and abroad. On the other hand, we intend to further promote our online retail activities in Germany and other European coun-tries in order to sustainably boost our competitive position as a multichannel retailer.
2.1 Unmistakable concept The company’s strategy focuses on the project concept. HORNBACH is increasingly able to differentiate itself from its competitors with this approach, which is reflected in its product range, service and pricing policies. Our solid financial resources, public corporate rating and the flexibility available to us in refinancing the business on the capital market will enable us to invest considerable sums in differentiating HORNBACH’s format in future as well. One unshakable component of our uniform strategy across the Group is our reliable permanent low price policy. We believe that we are better able to retain customers at HORNBACH in the long term by offering and guaranteeing the best market price across our entire product range on a permanent basis, with identical prices in our stationary and online stores. Our permanent low price strategy applies not only to prices at sta-tionary competitors, but also for online offerings. In particular, our main target group of project customers, who often undertake large-scale renovation work, needs to be able to budget in the long term. This is not possible with temporary discount campaigns.
2.2 Focus on sustainability We believe that HORNBACH is excellently positioned in the sector as a partner for renovation and modernization projects, also with regard to the increasingly strict legal requirements governing building energy efficiency. We will in future as well continue to present complex projects, such as the insulation of facades, the replacement of windows and doors, or smart home concepts, as "Project Shows" at the stores. Via our online stores, we also provide detailed guidelines which explain DIY projects on a step-by-step basis. Our product range offers
€ 45 bn core DIY market in 2017

76 COMBINED MANAGEMENT REPORT Opportunity Report
customers the opportunity to select low-emission products for their construction and renovation projects and thus to minimize the volume of noxious substances in their homes and living space. Not only that, we also offer energy and water-saving products. Moreover, further sales momentum may also be provided by public sector programs subsidizing the renovation of old properties in terms of energy efficiency or to make them senior citizen-friendly. Here, we offer an extensive database of subsidy opportunities on our homepage. Our customers increasingly value products that are sustainable in both ecological and economic terms. A suitable product selection, product certification, and transparent product information and advice are key competitive factors here. Above all the lifestyle-driven customer target group, who base their lifestyles on health and sustainability factors, is playing an increasingly important role in this respect. These so-called "LOHAS" (lifestyle of health and sustainability) mostly have above-average incomes, and are conscious, critical consumers. They accord great value to quality, brand and design. With our focus on the quality and sustainability of our product ranges, accompanied by professional advice, we are particularly well-placed to meet the high standards of these target groups. We are the DIY sector leaders, for example, in trading FSC-certified timber products.
2.3 Accessing new customer groups We are continually expanding our range of services, information and advice in order to attract new customer groups to HORNBACH. These include home improvement demonstrations at the stores intended to motivate customers to do it themselves, and special workshops for women ("Women at Work"). These measures are backed up by the promotion of specialist skills on the part of the store personnel with the aim of achieving a further increase in product expertise and advisory competence, and thus in customer satisfaction. Our DIY megastores with garden centers are also increasingly of interest to professional customers. Generous opening hours, the stocking of large quantities, the rapid handling of purchases at our drive-in stores and builders’ merchant centers, and the uncomplicated acceptance of residual volumes no longer required make HORNBACH an attractive alternative to traditional specialist retail or wholesale procurement sources. We see the buy-it-yourself (BIY) or do-it-for-me market segment as offering promising growth opportunities. This segment includes the target group of those customers who are on the lookout for solutions for their home improvement projects and who wish to purchase the product ranges themselves, but who then prefer to have the work undertaken by a specialist. We also view this market segment within the broader context of the ageing population in Germany and other parts of Europe. Our tradesman service aims to tap this potential.
2.4 Digitization of business model Online retail has reported by far the strongest growth rates within the overall retail sector, with DIY product ranges showing an above-average performance in this respect. Experts expect online sales with typical DIY store product groups in Germany to grow by almost 12 % to around € 3.6 billion in 2018, while the BHB sec-tor association has forecast sales growth of 1.3 % for the DIY store sector. Over the past nine years, the HORNBACH Baumarkt AG Group has channeled a substantial triple-digit million euro amount into digitizing its business model and developing its online retail business. These efforts have sustainably boosted our competitive position within the DIY sector and made the entire company fit for the future. Measured in terms of online sales generated by stationary DIY store chains, we believe that we are the German market leader in DIY online retail. Since its launch in Germany in December 2010, we have built up our online store (www.hornbach.de) into a high-performing virtual DIY store and garden center which we combine with our stationary retail business to provide an interconnected retail solution. We have now rolled out our e-commerce activities beyond Germany to Austria, Switzerland, the Netherlands, the Czech Republic, Luxembourg, and, since 2017, Slovakia and Sweden as well. The online store in Romania was launched in
12 % growth expected in online sales with DIY products in Germany in 2018

COMBINED MANAGEMENT REPORT Opportunity Report 77
January 2018. This means that customers in all countries in which HORNBACH operates now have the oppor-tunity to implement their projects on a cross-channel basis. One core aspect of our internet presence is the direct relationship our customers have to their preferred HORNBACH store. This way, our customers can inform themselves online about products, prices, and availa-bility, and also compare articles. Numerous text and image guidelines offer ideas and assistance in preparing and implementing projects. Customers can have articles delivered directly to their homes by mail order or opt for our "Reserve online and pick up at the store" service. From just two hours after the reservation, all of the articles in stock are ready to be collected from the desired HORNBACH store. This service is a real timesaver, especially for our professional customers. Not only that, our internet presence gives us the opportunity to acquire new customers outside our store network catchment areas and arouse their interest in the HORNBACH brand. Linking up social media channels offers a further means to intensify customer relationships, for ex-ample by enabling customers to share their experience with projects, products, and prices, as well as with service and quality standards. What's more, digitization enables companies to address customers on an in-creasing personalized basis, a development which may impact positively both on customer satisfaction and on demand levels. Moreover, we expect the digitization of store organization, sales, and the associated dove-tailing of these processes with procurement and logistics to have a sustainably positive impact on the Group's sales and earnings performance.
2.5 Internationalization Our expansion into foreign markets will provide us with additional growth prospects in future as well. These markets offer greater sales potential and higher profitability compared with the saturated German market and enable us to achieve a better distribution of regional market risks. The internationalization of group pro-curement provides us with broad-based access to global procurement markets, and enables us to forge stra-tegic, long-term partnerships with suppliers and industry. These partnerships benefit both sides. We offer each supplier the opportunity to supply all of our stores as efficiently as possible. Suppliers are able make large-scale logistical deliveries directly to each location, or to supply the merchandise indirectly via our cen-tral logistics hubs. We thus provide regional manufacturers as well with the opportunity of growing outside their existing sales regions and supplying goods to additional countries. The fact that our retail format is in-creasingly attracting professional customers to HORNBACH has enabled us to acquire production specialists who would otherwise only supply professional specialist retailers. The flexible dovetailing of our suppliers with the company’s logistics structures optimizes our value chain and secures a significant competitive advantage for us. The proximity of our suppliers to procurement struc-tures in the individual countries enables us to optimally adapt our product selection to regional requirements in those countries and to improve our margins due to benefits of scale. We are tapping further earnings po-tential by increasingly developing private labels in cooperation with partners. These provide our customers with attractive value for money, while at the same time differentiating us from competitors.
3. Explanatory Comments on Risk and Opportunity Report of HORNBACH Baumarkt AG
The risks and opportunities at HORNBACH Baumarkt AG are largely consistent with those presented for the HORNBACH Baumarkt AG Group.

78 COMBINED MANAGEMENT REPORT Outlook
Outlook
1. Macroeconomic and Sector-Specific Framework
One crucial factor for the business prospects of the HORNBACH Baumarkt AG Group is the future development in consumer demand and in construction and renovation activity in the countries in which we operate. Private consumer spending is decisively influenced by developments in employment totals, inflation, and disposable incomes. Forward-looking parameters, such as economic and income expectations, or consumers' propensity to spend, provide early indications of developments in consumer confidence ahead of the real macroeconomic data. Political changes in particular are a source of both opportunities and risks for the economy and con-sumers' propensity to spend. Not only that, exceptional weather conditions can severely impact on consumer behavior and on our seasonal business, even though this factor cannot be accounted for in our advanced planning.
1.1 Business framework in Europe According to an assessment issued by the European Commission in January 2018, the level of economic growth in the EU 28 and euro area countries in the 2018 calendar year, estimated at 2.3 % in each case, will virtually match the previous year's level. Growth will benefit from an improved situation on labor markets, as well as from a strong global economy and growing volumes of global trade. Sources of risk include more re-strictive interest policies, geopolitical conflicts, the potential introduction or extension of global trade barriers, and the uncertainty surrounding the economic outcome of the Brexit negotiations. The EU Commission's forecasts for the countries in which HORNBACH operates its DIY stores with garden centers are all at or ahead of the average growth in the EU 28 countries. In its forecast dated November 2017, the Euroconstruct research and consulting network expects European con-struction volumes to grow by 2.6 % in the 2018 calendar year. Growth rates in the housing and other construction segments can be expect to weaken slightly in the years ahead, and especially in the new construction segment. Euroconstruct has forecast stable growth rates for the modernization segment. Late winter weather conditions in March presented the DIY store sector with a notably chilly start to the 2018 spring season. The sector can be expected to catch up as the year progresses, with these effects then impacting positively on the annual performance of DIY players.
1.2 Business framework in Germany The Federal Government expects Germany to generate solid growth of 2.4 % in the 2018 calendar year. Early indicators, such as the ZEW Economic Expectations Index and the Ifo Business Climate Index, pointed to positive sentiment among companies and financial market experts at the beginning of the year. According to the Federal Government, the unemployment rate can be expected to fall further in 2018, while income from employment is expected to rise moderately. This will result in higher wage and salary growth, also in real terms. Private consumer spending is expected to increase by 3.6 % in nominal terms and by 1.9 % in real terms. According to economic experts, the positive macroeconomic framework and persistently high levels of con-sumer confidence in Germany will be reflected in further retail sales growth in 2018. For the current year, the Association of German Retailers (HDE) expects nominal net sales to grow by 2.0 % to a total of € 523.1 billion. Online retail, which according to the HDE forecast is set to grow by 9.7 % to € 53.4 billion, will remain the key growth driver. Online sales would then account for 10.2 % of total retail sales.
Above-average growth in HORNBACH countries

COMBINED MANAGEMENT REPORT Outlook 79
Based on the assessment by the German Institute for Economic Research (DIW), the growth in housing construction is set to continue in the years ahead, with nominal growth of 6.7 % forecast by the economic researchers for 2018. Having said this, the weighting of the respective segments can be expected to increas-ingly shift from new construction towards modernization. The modernization market is forecast to grow by 6.0 % in 2018 (2017: 4.7 %), while the growth of 8.0 % in new construction volumes will fall short of the high levels seen in recent years. For the following year, the DIY expects to see growth of only 4.0 % in the new con-struction segment, as against 7.4 % in the modernization market. This growth in the modernization market in particular can also be expected to benefit trade companies and DIY retailers. The BHB sector association has forecast nominal sales growth of 1.3 % for the German DIY sector in 2018. On a like-for-like basis, sales growth is expected to amount to 1.0 %. The BHB sees potential for sales growth above all in the private renovation and housing construction markets, as well as in strong private consumer spending due to the robust situation on the labor market with secure jobs and incomes. E-commerce sales with DIY product ranges (home improvement, construction materials, and garden products) are expected to show significantly higher growth momentum. Market researchers expect sales here to grow by 11.6 % to more than € 3.6 billion. Prolonged winter weather, however, meant that the DIY store sector began the year on a subdued note in terms of its sales in the first three months of 2018. Frosty weather in February was followed by similarly chilly weather in March. The first month of spring was even colder than January, with large volumes of snow in some areas. Given these weather conditions, outdoor projects on buildings and in gardens were in many cases postponed to a later date. According to the BHB/GfK, the DIY sector witnessed a 7.4 % downturn in like-for-like sales in the first quarter of the calendar year.
1.3 Overall assessment of the expected implications for the Group's business performance Based on our assessment, the macroeconomic and sector-specific framework forecast across Europe for 2018 will impact positively on the sales and earnings performance of the HORNBACH Baumarkt AG Group in the 2018/19 financial year. However, any significant macroeconomic disruptions during the forecast period, for example as a result of political or trading policy crises, terrorism, or price shocks on commodity or energy markets, and any resultant noticeable deterioration in consumer confidence would lead to downside risks for our sales and earnings performance.
2. Forecast Business Performance in 2018/19
The statements made concerning the expected business performance of the HORNBACH Baumarkt AG Group in the 2018/19 financial year are based on the medium-term planning, which has a budgeting horizon of five years and is extrapolated annually. The budget for the financial years 2018/19 to 2022/23, into which the annual budget for 2018/19 is integrated, was adopted by the Board of Management at the end of January 2018 and approved by the Supervisory Board at the end of February 2018.
2.1 Expansion In the one-year forecast period we will continue to focus on expanding and modernizing our store network in our existing country markets. Depending on the progress made in the building permit and construction plan-ning stages, store openings may be rescheduled between individual years. Given the challenges facing the sector in the field of e-commerce, in our stationary retail business we will be focusing even more closely than in the past on selective growth at premium locations. That is especially true
+1.3 % sales growth forecast for German DIY store sector in 2018

80 COMBINED MANAGEMENT REPORT Outlook
for new store openings in Germany. In the coming five years, the number of HORNBACH DIY stores here will only rise marginally, not least as a result of planned closures for new replacement locations. The key focus of our medium-term expansion and investment activities will be outside Germany. Three new store openings are planned for the 2018/19 financial year. Operations were launched in the first quarter of the forecast period at DIY megastores with garden centers in Zwolle (Netherlands) and Affoltern (Switzerland). The number of locations in the Netherlands has therefore risen to 14, and that in Switzerland to seven. Our sixth store in Sweden is due to be opened in Boras, most likely in the third quarter of 2018/19. One DIY store in Germany (Alzey) was closed at the end of April 2018 due to a lack of development perspectives. No further closures are scheduled for the 2018/19 financial year. Overall, the group-wide total number of HORNBACH DIY stores with garden centers will rise to up to 158 by February 28, 2019 (February 28, 2018: 156), of which 61 in other European countries.
Investments Gross investments of between € 150 million and € 170 million have been budgeted at the HORNBACH Bau-markt AG Group for the 2018/19 financial year. The overwhelming share of these funds will be channeled into building new stores, plant and office equipment at new and existing stores, converting and extending exist-ing stores, and IT infrastructure. Around one half of the planned investment budget relates to advance pay-ments for land and buildings, as well as plant and office equipment, for new HORNBACH DIY stores planned for periods beyond the 2018/19 financial year. HORNBACH enjoys great flexibility in its investment financing. Alongside the free cash flow from operating activities, the company's cash resources and free credit lines mean that a large volume of disposable liquidity is available. The inflow of cash from operating activities will exceed the total investment volume both in the one-year forecast period and in the period covered by the medium-term planning. No sale and leaseback transactions are planned in the 2018/19 financial year.
2.2 Sales forecast for the HORNBACH Baumarkt AG Group Thanks to our expansion, increased growth at existing stores, and growing online sales due not least to the completion in January 2018 of the online store rollout to all countries in which HORNBACH operates, we expect consolidated sales in the 2018/19 budget year to exceed the figure for the 2017/18 year under report (€ 3,891 million). Driven by disproportionate organic growth and new store openings, the share of sales in inter-national regions (2017/18: 46.8 %) is set to rise further. We expect net sales, including sales at stores newly opened, closed, or significantly extended, to show growth in a medium single-digit percentage range in the 2018/19 financial year. Given the macroeconomic and sector-specific framework outlined above, we expect the Group's like-for-like sales net of currency items to show growth in a low to medium single-digit percentage range. From a geo-graphical perspective, we expect the like-for-like sales growth in Germany to fall short of the Group aver-age once again in the 2018/19 financial year, while the growth rates in like-for-like sales net of currency items in Other European countries are expected to exceed the Group average.
+ 3 new store openings planned for 2018/19 financial year
€ 150 -170 m gross investments planned for 2018/19 financial year
Group growth in medium sin-gle-digit percentage range in 2018/19

COMBINED MANAGEMENT REPORT Outlook 81
2.3 Earnings performance at the HORNBACH Baumarkt AG Group
2.3.1 Retail segment The operating earnings performance of the Retail segment is principally determined by the rate of change in like-for-like sales, the gross margin, and the development in costs. Based on our expectations, the gross margin will decrease slightly in the 2018/19 financial year. The devel-opment in the gross margin is being influenced by tough competition in the stationary and online DIY retail businesses. E-commerce is gradually gaining in significance throughout our European network and provides consumers with maximum price transparency. HORNBACH has positioned itself here with a consistently im-plemented permanent low price policy and offers identical article prices to its customers both online and in its stationary business. Given the different product mix involved, we generate a lower gross margin in online retail compared with our stationary retail business. Not only that, the online retail margin is adversely affected by freight costs that are only partly covered by freight revenues. To stabilize the gross margin in the long term, we intend to continually increase the share of sales generated with private label products, among other measures. Moreover, we are working to further expand the volume of imports so as to benefit from the most best-priced procurement sources available worldwide. According to our 2018/19 annual budget, selling and store expenses are set to rise less rapidly than sales. Due to expected collectively agreed pay rises and shortages of specialists in regional labor markets in the countries in which HORNBACH operates, personnel expenses are expected to increase once again, albeit to a less marked extent than sales. We expect rental and utility expenses to rise less rapidly than sales. Due to marketing measures for new stores and the newly added online stores, advertising expenses are budgeted to grow more rapidly than sales in the 2018/19 budget year. We expect our general operating expenses to rise slightly faster than sales due to increased maintenance measures for land and buildings. Maintaining the substance of stores and while at the same time ensuring they are attractively designed requires an ongoing supply of funds to renovate older properties and modernize sales areas and merchandise presentation. Despite the planned opening of three new stores, pre-opening expenses in 2018/19 are expected to fall short of the previous year's period. This is because a prorated share of the costs for these store openings was al-ready incurred in the 2017/18 financial year. The 2018/19 budget foresees a significantly disproportionate rise in administration expenses compared with sales. This cost growth is once again closely linked to additional expenses incurred for the increasing digiti-zation of our business model and forward-looking strategic projects. A large portion of these outlays involves personnel expenses for the e-business and the extended customer service structures introduced in connection with the international expansion of our online store, as well as costs for technological developments to be viewed in connection with our interconnected retail approach. Due to the lower gross margin and higher administration expenses, the adjusted EBIT (EBIT adjusted for non-op-erating earnings items) in the Retail segment is expected to decrease slightly in the one-year forecast period (2017/18: € 48.0 million).

82 COMBINED MANAGEMENT REPORT Outlook
2.3.2 Real estate segment Due to the Group's expansion, we expect rental income in the Real estate segment to show further stable growth in a low to medium single-digit percentage range. The real estate expenses budgeted for 2018/19 are slightly lower than in the previous year, as a result of which the real estate expense ratio as a percentage of rental income should decrease. This development will be driven above all by lower rental expenses. The budget for the 2018/19 financial year provides for a year-on-year decrease in pre-opening expenses. Overall, we expect adjusted EBIT in the Real estate segment to show clearly disproportionate growth compared with rental income in the 2018/19 financial year (2017/18: € 74.3 million).
2.3.3 Headquarters and consolidation segment Mainly as a result of the increased budgets for developing information technology, central administration expenses are set to rise significantly in the 2018/19 financial year. Development projects such as for article data management, warehouse management, and IT security, as well as for updating office applications, the telephony system, and implementing the requirements of the General Data Protection Regulation, are pre-requisites for a sustainable overall IT infrastructure. Furthermore, the budget for the year ahead also includes expenses for fully refurbishing and modernizing the old office buildings at the Bornheim location. These measures are expected to be completed in 2020. This segment is expected to report a significant reduction in its adjusted EBIT (2017/18: minus € 12.2 million).
2.3.4 Earnings forecast for the HORNBACH Baumarkt AG Group We expect our adjusted EBIT (EBIT adjusted to exclude non-operating earnings items) in the one-year 2018/19 forecast period to roughly match the level reported for the 2017/18 financial year (€ 110.0 million).
2.4 Sales and earnings forecast for HORNBACH Baumarkt AG (separate financial statements – HGB) In the separate financial statements of HORNBACH Baumarkt AG, which will be shaped by developments at the HORNBACH DIY stores with garden centers in Germany, we expect sales growth in a low to medium single-digit percentage range in the 2018/19 financial year. Assuming a significantly higher profit transfer from HORNBACH International GmbH compared with the previous year, we expect the annual net surplus on the level of HORNBACH Baumarkt AG to rise significantly in the 2018/19 forecast period compared with the previous 2017/18 financial year.
Adjusted EBIT at around pre-vious year's level in 2018/19

COMBINED MANAGEMENT REPORT Other Disclosures 83
Other Disclosures
1. Disclosures under § 315a (4) and § 289a (4) HGB and Explanatory Report of Board of Management
As the parent company of the HORNBACH Baumarkt AG Group, HORNBACH Baumarkt AG participates in an organized market as defined in § 2 (7) of the German Securities Acquisition and Takeover Act (WpÜG) by means of the shares with voting rights thereby issued and therefore reports in accordance with § 315 (4) and § 289 (4) of the German Commercial Code (HGB).
1.1 Composition of share capital The share capital of HORNBACH Baumarkt AG, amounting to € 95,421,000, is divided into 31,807,000 ordinary bearer shares with a prorated amount in the share capital of € 3.00 per share. Each no-par ordinary share entitles its holder to one vote at the Annual General Meeting. Reference is made to the relevant requirements of stock corporation law in respect of the further rights and obligations for ordinary shares.
1.2 Direct or indirect capital shareholdings HORNBACH Holding AG & Co. KGaA, based in Le Quartier Hornbach 19, 67433 Neustadt an der Weinstrasse, Germany, holds more than 10 % of the voting rights. Its shareholding, and thus its share of voting rights, amounted to an unchanged total of 76.4 % as of February 28, 2018.
1.3 Statutory requirements and provisions in Articles of Association relating to appointment and dismissal of members of Board of Management and amendments to Articles of Association
The appointment and dismissal of members of the Board of Management (§ 84 and § 85 of the German Stock Corporation Act – AktG) and amendments to the Articles of Association (§ 133 and § 179 AktG) are based on the relevant requirements of stock corporation law.
1.4 Change of control Material agreements taking effect upon any change of control are in place between HORNBACH Baumarkt AG and third parties in respect of contracts relating to the long-term financing of the Group.
1.5 Powers of Board of Management to issue shares Pursuant to § 4 of the company’s Articles of Association (Share Capital), the Board of Management is author-ized until July 7, 2021, subject to approval by the Supervisory Board, to increase the company’s share capital by a total of up to € 15,000,000.00 by issuing new ordinary shares on one or several occasions in return for cash contributions (Authorized Capital I). The new shares may in each case be issued as ordinary shares with voting rights or as non-voting preference shares. The Board of Management is authorized, subject to approval by the Supervisory Board, to determine the further details concerning the execution of capital increases. Shareholders are generally to be granted subscription rights when the authorized capital is drawn on. However, the Board of Management is entitled, subject to approval by the Supervisory Board, to exclude shareholders’ subscription rights: in order to settle residual amounts
to the extent necessary to grant subscription rights to the holders of conversion or option rights issued or
still to be issued by the company or by direct or indirect wholly-owned subsidiaries to the extent that they would be entitled to such shares having exercised their respective conversion or option rights

84 COMBINED MANAGEMENT REPORT Other Disclosures
to offer new shares up to a total volume of € 1,500,000.00 to employees of the company and its subsidiaries for subscription as employee shares
to the extent that the proportion of share capital attributable to the new shares for which subscription rights are excluded does not exceed a total of ten percent of the existing share capital either at the time of this authorization being adopted or at the time at which such authorization takes effect or is exercised and that the issue price of the new shares does not fall significantly short of the stock market price. Shares issued, disposed of or to be issued by any other direct or analogous application of § 186 (3) Sentence 4 of the German Stock Corporation Act (AktG) are to be imputed to this restriction to ten percent of the share capital. This relates in particular to the disposal of treasury stock undertaken on the basis of an authorization to dispose of treasury stock pursuant to § 71 and § 186 (3) Sentence 4 of the German Stock Corporation Act (AktG), as well as to shares issued or to be issued in order to service bonds with conversion and/or option rights in cases where the respective bonds were issued on the basis of an authorization pursuant to § 221 (4) and § 186 (3) Sentence 4 of the German Stock Corporation Act (AktG).
The Board of Management is authorized until July 7, 2021, subject to approval by the Supervisory Board, to increase the company’s share capital by a total of up to € 30,000,000.00 by issuing new individual shares on one or several occasions in return for cash or non-cash contributions (Authorized Capital II). The new shares may in each case be issued as ordinary shares with voting rights or as non-voting preference shares. The Board of Management is authorized, subject to approval by the Supervisory Board, to determine the further details concerning the execution of capital increases. Shareholders are generally to be granted subscription rights when the authorized capital is drawn on. However, the Board of Management is authorized, subject to approval by the Supervisory Board, to exclude shareholders’ subscription rights to the extent that the capital increases in return for non-cash contributions are undertaken for the purpose of acquiring companies or shareholdings in companies. The Board of Management is further authorized, subject to approval by the Supervisory Board, to exclude shareholders’ subscription rights to the extent required to grant subscription rights to owners of conversion or option rights issued or still to be issued by the company or its direct or indirect wholly-owned subsidiaries to the extent that the holders of these rights would be entitled to such shares following the exercising of their conversion or option rights. Moreover, residual amounts may also be excluded from shareholders’ subscription rights. The Supervisory Board is authorized to adjust the wording of the Articles of Association in line with the respective volume and level of utilization of the authorized capital and of any conditional capital.
2. Corporate Governance Declaration pursuant to § 289f HGB
The Corporate Governance Declaration requiring submission pursuant to § 289f of the German Commercial Code (HGB) is available on our website. Pursuant to § 317 (2) Sentence 3 HGB, the disclosures made under § 289f HGB have not been included in the audit performed by the auditor.
3. Compensation Report
The compensation report presents the basic features and structure of the compensation paid to the Board of Management and Supervisory Board. It forms part of the Group Management Report and is presented in the Corporate Governance section.
www.hornbach-group.com Investor Relations > Corporate Governance
2017/18 Annual Report Corporate Governance Compensation Report

COMBINED MANAGEMENT REPORT Other Disclosures 85
4. Dependent Company Report
A report on relationships with associate companies has been compiled for the 2017/18 financial year pursuant to § 312 of the German Stock Corporation Act (AktG). With regard to those transactions requiring report, the report states: "Our company has received adequate counterperformance for all legal transactions executed with the controlling company or any associate of such or at the instigation or on behalf of any of these com-panies in accordance with the circumstances known to us at the time at which the legal transactions were performed. No measures were taken or omitted at the instigation of or on behalf of the controlling company or any associate of such." DISCLAIMER Our combined management report should be read in conjunction with the audited financial data of the HORNBACH Baumarkt AG Group and the disclosures made in the notes to the consolidated financial state-ments which can be found in other sections of this Annual Report. It contains statements referring to the fu-ture based on assumptions and estimates made by HORNBACH’s Board of Management. Forward-looking statements are always only valid at the time at which they are made. Although we assume that the expecta-tions reflected in these forecast statements are realistic, the company can provide no guarantee that these expectations will also turn out to be accurate. The assumptions may involve risks and uncertainties which could result in actual results differing significantly from the forecast statements. The factors which could produce such variances include changes in the economic and business environment, particularly in respect of consumer behavior and the competitive environment in those retail markets of relevance for HORNBACH. Furthermore, they include a lack of acceptance of new sales formats or new product ranges, as well as changes to the corporate strategy. HORNBACH has no plans to update the forecast statements, neither does it accept any obligation to do so.


CONSOLIDATED FINANCIAL STATEMENTS Income Statement of the HORNBACH Baumarkt AG Group 87
CONSOLIDATED FINANCIAL STATEMENTS Income Statement of the HORNBACH Baumarkt AG Group
for the Period from March 1, 2017 to February 28, 2018
Statement of Comprehensive Income of the HORNBACH Baumarkt AG Group
for the Period from March 1, 2017 to February 28, 2018
1) Represents the residual value of fair value changes and recognized changes in the value of corresponding hedge instruments in the period under report.
Notes 2017/18 2016/17 Change € 000s € 000s %
Sales 1 3,890,704 3,710,097 4.9 Cost of goods sold 2 2,440,777 2,328,851 4.8 Gross profit 1,449,927 1,381,246 5.0 Selling and store expenses 3/10 1,150,778 1,104,263 4.2 Pre-opening expenses 4/10 5,118 6,012 (14.9)General and administration expenses 5/10 206,654 186,336 10.9 Other income and expenses 6/10 15,111 12,888 17.2 Earnings before interest and taxes (EBIT) 102,489 97,522 5.1 Other interest and similar income 740 904 (18.1)Other interest and similar expenses 17,562 18,595 (5.6)Other financial result (4,784) (538) >(100)Net financial expenses 7 (21,605) (18,229) 18.5 Consolidated earnings before taxes 80,884 79,293 2.0 Taxes on income 8 22,217 26,429 (15.9)Consolidated net income 58,667 52,864 11.0 Basic/diluted earnings per share (€) 9 1.84 1.66 10.8
Notes 2017/18 2016/17 € 000s € 000s
Consolidated net income 58,667 52,864 Actuarial gains and losses on defined benefit plans 24/25 4,042 1,974 Deferred taxes on actuarial gains and losses on defined benefit plans (780) (367)Other comprehensive income that will not be recycled at a later date 3,262 1,607 Measurement of derivative financial instruments (cash flow hedge) Measurement of derivative hedging instruments directly in equity 1) (1) (8)Gains and losses from measurement of derivative financial instruments transferred to profit or loss 33 733
Measurement of available for sale financial assets 13/33 883 1,788 Exchange differences arising on the translation of foreign subsidiaries (2,988) 2,565 Deferred taxes on gains and losses recognized directly in equity 8 (21) (237)Other comprehensive income that will be recycled at a later date (2,094) 4,841 Total comprehensive income 59,835 59,312

88 CONSOLIDATED FINANCIAL STATEMENTS Balance Sheet of the HORNBACH Baumarkt AG Group
Balance Sheet of the HORNBACH Baumarkt AG Group
as of February 28, 2018
Assets Notes 2.28.2018 2.28.2017 € 000s € 000s
Non-current assets Intangible assets 11 18,892 15,235 Property, plant, and equipment 12 1,120,408 1,087,101 Investment property 12 18,692 16,226 Financial assets 13/33 6,543 5,659 Other non-current receivables and assets 14/24 4,151 3,632 Deferred tax assets 15 4,531 3,848 1,173,217 1,131,701 Current assets Inventories 16 657,821 626,086 Current financial assets 17 0 30,009 Trade receivables 18 8,913 8,221 Other current assets 18 53,417 43,129 Income tax receivables 27 2,235 7,706 Cash and cash equivalents 19 102,138 113,033 824,524 828,184 1,997,740 1,959,885
Equity and liabilities Notes 2.28.2018 2.28.2017 € 000s € 000s Shareholders' equity 21 Share capital 95,421 95,421 Capital reserve 143,623 143,623 Revenue reserves 809,759 771,601 1,048,802 1,010,645 Non-current liabilities Non-current financial debt 23 412,637 424,320 Provisions for pensions 24 10,820 15,216 Deferred tax liabilities 15 25,951 27,455 Other non-current liabilities 25/28 46,936 36,410 496,344 503,401 Current liabilities Current financial debt 23 11,435 28,575 Trade payables 26 253,711 244,468 Other current liabilities 26 88,000 82,626 Income tax liabilities 27 11,608 13,441 Other provisions and accrued liabilities 28 87,839 76,729 452,594 445,839 1,997,740 1,959,885

CONSOLIDATED FINANCIAL STATEMENTS Statement of Changes in Equity of the HORNBACH Baumarkt AG Group 89
Statement of Changes in Equity of the HORNBACH Baumarkt AG Group
2016/17 financial year € 000s
Notes Share capital Capital reserve
Hedging reserve
Cumulative currency
translation
Other revenue reserves
Total equity
Balance at March 1, 2016 95,421 143,623 (538) 36,767 697,605 972,878 Consolidated net income 52,864 52,864 Actuarial gains and losses on defined benefit plans, net after taxes 24/25 1,607 1,607 Measurement of derivative financial instruments (cash flow hedge), net after taxes 515 515 Measurement of available for sale financial assets, net after taxes 33 1,761 1,761 Foreign currency translation 2,565 2,565 Total comprehensive income 515 2,565 56,232 59,312 Dividend distribution 22 (21,629) (21,629)Treasury stock transactions 21 85 85 Balance at February 28, 2017 95,421 143,623 (24) 39,332 732,293 1,010,645
2017/18 financial year € 000s
Notes Share capital Capital reserve
Hedging reserve
Cumulative currency
translation
Other revenue reserves
Total equity
Balance at March 1, 2017 95,421 143,623 (24) 39,332 732,293 1,010,645 Consolidated net income 58,667 58,667 Actuarial gains and losses on defined benefit plans, net after taxes 24/25 3,262 3,262 Measurement of derivative financial instruments (cash flow hedge), net after taxes
24 24 Measurement of available for sale financial assets, net after taxes 33 870 870 Foreign currency translation (2,988) (2,988)Total comprehensive income 24 (2,988) 62,799 59,835 Dividend distribution 22 (21,629) (21,629)Treasury stock transactions 21 (50) (50)Balance at February 28, 2018 95,421 143,623 0 36,344 773,414 1,048,802

90 CONSOLIDATED FINANCIAL STATEMENTS Cash Flow Statement of the HORNBACH Baumarkt AG Group
Cash Flow Statement of the HORNBACH Baumarkt AG Group
Notes 2017/18 2016/17 € 000s € 000s
Consolidated net income 58,667 52,864 Depreciation and amortization of non-current assets 10 80,363 76,122 Change in provisions 9,040 7,760 Gains/losses on disposals of non-current assets and of non-current assets held for sale
(401) 679
Change in inventories, trade receivables and other assets (40,626) (17,951)Change in trade payables and other liabilities 29,394 (11,128)Other non-cash income/expenses (2,331) 6,870 Cash flow from operating activities 134,106 115,217 Proceeds from disposal of non-current assets and of non-current assets held for sale
2,438 1,555
Payments for investments in property, plant, and equipment (120,859) (150,424)Payments for investments in intangible assets (7,824) (6,578)Cash flow for investments in connection with short-term finance planning 30,000 (30,000)Cash flow from investing activities (96,245) (185,447)Dividends paid 22 (21,629) (21,629)Repayment of long-term debt 23 (3,111) (83,659)Proceeds from group financing activities 0 35 Change in current financial debt and finance lease liabilities (22,958) 5,128 Cash flow from financing activities (47,698) (100,125)Cash-effective change in cash and cash equivalents (9,837) (170,355)Change in cash and cash equivalents due to changes in exchange rates (1,059) 390 Cash and cash equivalents at March 1 113,033 282,998 Cash and cash equivalents at balance sheet date 102,138 113,033
Cash and cash equivalents include cash on hand, credit balances at banks, and other short-term deposits. The other non-cash income/expenses item mainly relates to deferred taxes and unrecognized exchange rate gains/losses. The cash flow from operating activities was reduced by income tax payments of € 21,310k (2016/17: € 11,102k) and interest payments of € 20,011k (2016/17: € 21,279k) and increased by interest received of € 740k (2016/17: € 1,133k).

NOTES TO THE CONSOLIDATED FINANCIAL STATEMENTS Explanatory Notes on Accounting Policies 91
NOTES TO THE CONSOLIDATED FINANCIAL STATEMENTS Explanatory Notes on Accounting Policies
Information about the company HORNBACH Baumarkt AG, whose legal domicile is in Bornheim bei Landau/Pfalz, Germany, and its subsidiaries develop and operate DIY megastores with garden centers on an international basis. The company is entered in the Commercial Register (No. HRB 2311) at Landau/Pfalz District Court. Shares in HORNBACH Baumarkt AG are listed in the Prime Standard and traded under ISIN DE0006084403 on the Xetra and Frankfurt am Main exchanges. HORNBACH Baumarkt AG and its subsidiaries are included in the consolidated financial statements of HORNBACH Holding AG & Co. KGaA. The consolidated financial statements and group management report of HORNBACH Holding AG & Co. KGaA are published in the electronic Federal Gazette (Bundesanzeiger).
Basis of preparation In line with § 315e (1) of the German Commercial Code (HGB), HORNBACH Baumarkt AG prepares consolidated financial statements in accordance with International Financial Reporting Standards (IFRS) as requiring mandatory application in the European Union. New IFRS are only applied following their endorsement by the European Union. Application has been made of all IFRS and pronouncements of the International Financial Reporting Interpretations Committee (IFRIC) with binding effect for the 2017/18 financial year. The financial year of HORNBACH Baumarkt AG and thus of the Group runs from March 1 of each year through to the final day of February of the following year. The income statement, statement of comprehensive income, balance sheet, cash flow statement, and statement of changes in equity are presented separately in the consolidated financial statements. To enhance clarity, individual income statement and balance sheet items have been grouped together. These items are reported separately in the notes. In line with IAS 1 "Presentation of Financial Statements", a distinction is made in balance sheet reporting between non-current and current debt capital. Debt items are treated as current if they are due within one year. The consolidated financial statements have been compiled in euros. This represents the functional currency at HORNBACH Baumarkt AG. The figures have been rounded to the nearest thousand or million euros. Such round-ing up or down may result in minor discrepancies between the figures depicted in the various sections of these notes. The Board of Management of HORNBACH Baumarkt AG prepared the consolidated financial statements and approved them for publication on May 14, 2018. The period in which adjusting events could be accounted for thus expired as of this date.
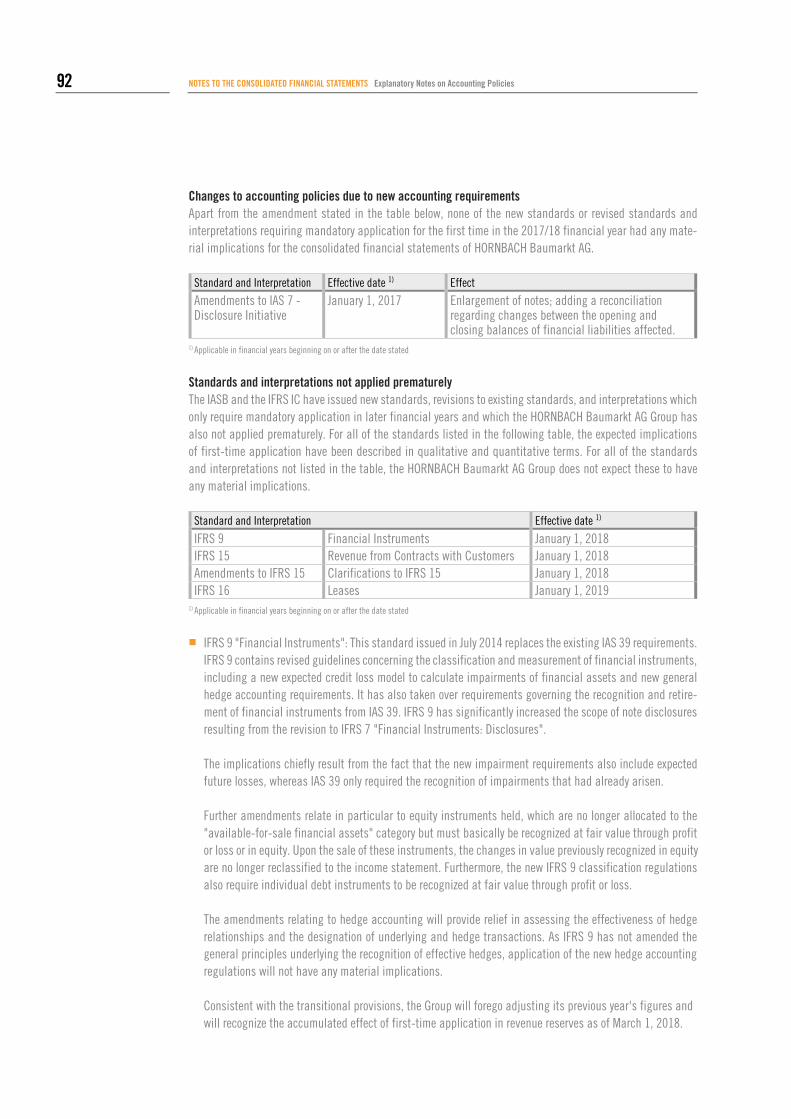
92 NOTES TO THE CONSOLIDATED FINANCIAL STATEMENTS Explanatory Notes on Accounting Policies
Changes to accounting policies due to new accounting requirements Apart from the amendment stated in the table below, none of the new standards or revised standards and interpretations requiring mandatory application for the first time in the 2017/18 financial year had any mate-rial implications for the consolidated financial statements of HORNBACH Baumarkt AG.
Standard and Interpretation Effective date 1) Effect
Amendments to IAS 7 - Disclosure Initiative
January 1, 2017 Enlargement of notes; adding a reconciliation regarding changes between the opening and closing balances of financial liabilities affected.
1) Applicable in financial years beginning on or after the date stated
Standards and interpretations not applied prematurely The IASB and the IFRS IC have issued new standards, revisions to existing standards, and interpretations which only require mandatory application in later financial years and which the HORNBACH Baumarkt AG Group has also not applied prematurely. For all of the standards listed in the following table, the expected implications of first-time application have been described in qualitative and quantitative terms. For all of the standards and interpretations not listed in the table, the HORNBACH Baumarkt AG Group does not expect these to have any material implications.
Standard and Interpretation Effective date 1)
IFRS 9 Financial Instruments January 1, 2018 IFRS 15 Revenue from Contracts with Customers January 1, 2018 Amendments to IFRS 15 Clarifications to IFRS 15 January 1, 2018 IFRS 16 Leases January 1, 2019
1) Applicable in financial years beginning on or after the date stated
IFRS 9 "Financial Instruments": This standard issued in July 2014 replaces the existing IAS 39 requirements.
IFRS 9 contains revised guidelines concerning the classification and measurement of financial instruments, including a new expected credit loss model to calculate impairments of financial assets and new general hedge accounting requirements. It has also taken over requirements governing the recognition and retire-ment of financial instruments from IAS 39. IFRS 9 has significantly increased the scope of note disclosures resulting from the revision to IFRS 7 "Financial Instruments: Disclosures".
The implications chiefly result from the fact that the new impairment requirements also include expected future losses, whereas IAS 39 only required the recognition of impairments that had already arisen. Further amendments relate in particular to equity instruments held, which are no longer allocated to the "available-for-sale financial assets" category but must basically be recognized at fair value through profit or loss or in equity. Upon the sale of these instruments, the changes in value previously recognized in equity are no longer reclassified to the income statement. Furthermore, the new IFRS 9 classification regulations also require individual debt instruments to be recognized at fair value through profit or loss. The amendments relating to hedge accounting will provide relief in assessing the effectiveness of hedge relationships and the designation of underlying and hedge transactions. As IFRS 9 has not amended the general principles underlying the recognition of effective hedges, application of the new hedge accounting regulations will not have any material implications. Consistent with the transitional provisions, the Group will forego adjusting its previous year's figures and will recognize the accumulated effect of first-time application in revenue reserves as of March 1, 2018.

NOTES TO THE CONSOLIDATED FINANCIAL STATEMENTS Explanatory Notes on Accounting Policies 93
The Group has compiled an inventory of its financial instruments, allocated these to its business models and determined the relevant IFRS 9 measurement categories. The new classification model will result in minor changes that will not have any material implications for the consolidated financial statements. The amendments relate in particular to all factoring receivables. These will no longer be allocated to the "loans and receivables" category but recognized at fair value through profit or loss. Furthermore, the Group will draw on the option of voluntarily designating instruments into the equity instruments measured at equity category and continue to measure all equity instruments at fair value in equity. IFRS 9 requires the Group to measure its expected credit losses from all its debt instruments, loans, and trade receivables either on the basis of their 12-month expected credit loss (ECL) or their lifetime ECL. The Group will opt for the simplified approach and recognize the lifetime ECL from all of its trade receivables. We expect IFRS 9 application to result in a change of less than € 0.5 million in the allowances recognized for trade receivables. This will result in an effect of the same amount in equity. The allowances recognized for cash and cash equivalents and for other receivables and assets will be based on their 12-month ECL. We do not expect this to have any notable implications. In applying IFRS 9 for the first time, the Group is exercising the accounting option of continuing to recognize hedges pursuant to IAS 39 rather than IFRS 9.
IFRS 15 "Revenue from Contracts with Customers": This new standard has reorganized the requirements
governing the recognition of revenues. As a result, IFRS 15 replaces all previous relevant standards gov-erning revenue recognition (IAS 18, IAS 11, and IFRIC 13), as well as the relevant interpretations. From now on, companies are required to determine the date or period in which revenues are recognized by reference to a 5-step model. The model is also used to determine the amount of revenues. In general, revenues have to be recognized as of the date/period in which control over the goods and services is transferred. The standard also includes guidelines for multiple element arrangements and new requirements governing the treatment of service contracts and contract modifications. The scope of note disclosures has also been extended. The Group has completed its project to determine the implications resulting from first-time application of IFRS 15. The vast share of revenues is generated by way of simple merchandise sale agreements which do not have any long-term characteristics and under which the power of control is transferred to the customer at a specific time. The Group has decided to introduce IFRS 15 using the modified retrospective method. The accumulated effect of first-time application will be recognized in equity as of March 1, 2018. Irrespec-tive of the implications listed below, the Group basically does not expect any material effects compared with previous recognition under IAS 18. Due to multiple element arrangements and bonus agreements with customers, in the opening bal-
ance sheet as of March 1, 2018 items will be reclassified between assets and contract assets and between liabilities and contract liabilities respectively.
As a result of IFRS 15, any return rights will in future be recognized on a gross basis. Unlike its previous practice of recognizing a provision in the balance sheet, in future the Group will recognize an asset for expected returns and a refund liability due to customers. In the opening balance sheet as of March 1, 2018, we expect this to lead to a reduction in provisions and an increase in assets and liabilities. Total assets will increase by around € 2.7 million.

94 NOTES TO THE CONSOLIDATED FINANCIAL STATEMENTS Explanatory Notes on Accounting Policies
HORNBACH is affected by the IFRS 15 regulations governing non-utilization of credits (breakage) with regard to the customer vouchers its sells. The new regulation will result in unutilized credits being recognized through profit or loss at an earlier point in time in future. In the opening balance sheet as of March 1, 2018, we expect a reduction of around € 2.4 million in liabilities and an increase of the same amount in equity.
The option of granting retrospective discounts (permanent low price guarantee) may prospectively lead to an increase in refund liabilities. As the relevant contracts are deemed to have been fulfilled as of the date of first-time application, however, this amendment will exclusively apply to contracts concluded after the date of first-time application. No restatement effects will arise as of March 1, 2018.
IFRS 16 "Leases": This standard replaces the existing lease accounting requirements and fundamentally
alters the treatment of leases at the lessee. The existing review performed to classify a lease as an operating lease or a finance lease is no longer required at the lessee. Apart from short-term and low-value contracts, from now on all lease contracts are to be presented using a methodology similar to that previously applied for finance leases, i.e. alongside a right-of-use asset a corresponding lease liability is also recognized upon initial recognition. Both items are updated as appropriate. When accounting for leases, lessors are still required to perform a review to classify leases as operating or finance leases.
Due to IFRS 16, all leases will basically require recognition in the balance sheet in future. At HORNBACH, this particularly affects those property rental agreements previously classified as operating leases. Their recognition in the balance sheet will materially increase the volume of non-current assets and financial debt recognized in future. Furthermore, there will also be changes within the income statement. Rental payments for operating lease agreements were previously mainly recognized as expenses within selling and store expenses. In future, the amortization of the right-of-use asset will be recognized, as will interest expenses for the financial debt item. Due to the recognition of amortization on the right-of-use asset rather than the current recognition of rental expenses, the application of IFRS 16 will significantly increase EBIT. Similarly, the future recognition of interest expenses will significantly lower net financial expenses. The Group intends to apply IFRS 16 using the modified retrospective method. Accumulated restatement effects will be recognized as an adjustment to revenue reserves in the opening balance sheet as of March 1, 2019. The comparative information does not require adjustment. Furthermore, the Group currently intends to draw on the simplification provisions for short-term and low-value leases. To determine the implications of first-time application, a group-wide inventory of the contracts thereby affected is currently being conducted within the implementation project. This process has been completed for material contracts in which the Group acts as lessee. These contracts mainly involve property rental agreements. Based on current information, the property agreements at the Group in which HORNBACH acts as lessee are expected to increase non-current assets and financial debt by around € 1.1 billion each. This estimate is based on application of a uniform incremental borrowing rate of interest. Furthermore, the exercising of extension options has been based on current economic and company-specific conditions which may change as of the date of first-time application. It is currently not possible to assess any more far-reaching implications for the consolidated financial statements, as the inventory of contracts for lease

NOTES TO THE CONSOLIDATED FINANCIAL STATEMENTS Explanatory Notes on Accounting Policies 95
arrangements involving plant and office equipment and intermediary lease arrangements is not yet com-plete. The same applies for potential write-downs resulting from application of IFRS 16.C8 (c) as of the date of first-time application as the future economic framework is not known.
Consolidation principles The annual financial statements of the companies included in the consolidated financial statements are based on uniform recognition and measurement principles. The separate financial statements of the companies included in the consolidated financial statements have been prepared as of the balance sheet date for the consolidated financial statements. Capital consolidation has been based on the purchase method. Any resultant debit differences have been recognized as goodwill. This is tested for impairment in the event of any indication of such and at least once a year. Any change in the level of shareholding held in a fully consolidated company not leading to a change of status is recognized as an equity transaction. Intercompany sales, income and expenses, and receivables and liabilities between the consolidated companies have been offset against each other. Where material, intercompany profits have been eliminated.
Scope of consolidation The assessment as to whether a subsidiary is fully consolidated in the consolidated financial statements of HORNBACH Baumarkt AG is based on an assessment of control-related factors. Control over a subsidiary exists when HORNBACH can directly or indirectly influence the relevant activities of the subsidiary and when it is exposed to variable returns from the subsidiary or is entitled to such. Furthermore, control enables the level of returns to be influenced. HORNBACH generally acquires this right when it holds a majority of the voting rights. Where this is not the case, other contractual arrangements may lead to HORNBACH gaining control. Subsidi-aries are fully consolidated in the consolidated financial statements of HORNBACH Baumarkt AG on the date on which control is gained. Should any circumstances or facts indicate a change in the control relationship, then a reassessment is performed. Interests in companies not included in the scope of consolidation have been recognized in accordance with IAS 39. In addition to HORNBACH Baumarkt AG, the consolidated financial statements include 6 domestic and 30 for-eign subsidiaries by way of full consolidation. As the sole shareholder in HORNBACH International GmbH, HORNBACH Baumarkt AG holds, either directly or indirectly, 100 % of the voting rights in the consolidated subsidiaries. As in the previous year, all direct and indirect subsidiaries of HORNBACH Baumarkt AG have been included in the consolidated financial statements for the 2017/18 financial year.

96 NOTES TO THE CONSOLIDATED FINANCIAL STATEMENTS Explanatory Notes on Accounting Policies
Changes in the scope of consolidation HORNBACH Real Estate Apeldoorn B.V. (Netherlands) and HORNBACH Real Estate Enschede B.V. (Netherlands) were included in the consolidated financial statements for the first time in the 2017/18 financial year. Both companies were founded in the 2017/18 financial year. The development in the scope of consolidation was as follows:
2017/18 2016/17
March 1 35 36 Companies consolidated for the first time 2 1 Mergers 0 2 February 28/29 37 35
The changes to the scope of consolidation in the 2017/18 financial year did not have any material implica-tions for the Group's asset, financial, or earnings position.

NOTES TO THE CONSOLIDATED FINANCIAL STATEMENTS Explanatory Notes on Accounting Policies 97
Consolidated shareholdings
Company name and domicile Shareholding Equity1) Local in % in thousands,
local currency currency
Germany 2) HORNBACH International GmbH, Bornheim 100 106,019 EUR AWV-Agentur für Werbung und Verkaufsförderung GmbH, Bornheim 100 329 EUR HB Reisedienst GmbH, Bornheim 100 7,285 EUR HB Services GmbH, Bornheim 100 18 EUR HORNBACH Versicherungs-Service GmbH, Bornheim 100 141 EUR HORNBACH Solar-, Licht- und Energiemanagement GmbH, Bornheim 100 (36) EUR Other countries HORNBACH Baumarkt CS spol s.r.o., Prague, Czech Republic 1004) 2,626,342 CZK HORNBACH Baumarkt GmbH, Wiener Neudorf, Austria 100 75,336 EUR HL Immobilien Lambda GmbH, Wiener Neudorf, Austria 100 11,238 EUR G.N.E. Global Grundstücksverwertung GmbH, Wiener Neudorf, Austria 100 768 EUR HORNBACH Baumarkt Luxemburg SARL, Bertrange, Luxembourg 100 9,603 EUR HORNBACH Baumarkt (Schweiz) AG, Oberkirch, Switzerland 100 125,283 CHF HORNBACH Byggmarknad AB, Gothenburg, Sweden 100 75,349 SEK HIAG Fastigheter i Sisjön AB, Gothenburg, Sweden 100 667 SEK HORNBACH Holding B.V., Amsterdam, Netherlands 100 119,675 EUR HORNBACH Bouwmarkt (Nederland) B.V., Driebergen-Rijsenburg, Netherlands 100 14,221 EUR HORNBACH Real Estate Apeldoorn B.V., Apeldoorn, Netherlands 100 20 EUR HORNBACH Real Estate Enschede B.V., Enschede, Netherlands 100 20 EUR HORNBACH Real Estate Breda B.V., Breda, Netherlands 100 1,905 EUR HORNBACH Real Estate Best B.V., Nieuwegein, Netherlands 100 1,411 EUR HORNBACH Real Estate Amsterdam-Sloterdijk, Amsterdam, Netherlands 100 1,235 EUR HORNBACH Real Estate Den Haag B.V., The Hague, Netherlands 100 1,888 EUR HORNBACH Real Estate Zwolle B.V., Zwolle, Netherlands 100 245 EUR HORNBACH Real Estate Almelo B.V., Almelo, Netherlands 100 12 EUR HORNBACH Real Estate Duiven B.V., Duiven, Netherlands 100 (1,124) EUR HORNBACH Real Estate Tilburg B.V., Tilburg, Netherlands 100 948 EUR HORNBACH Real Estate Groningen B.V., Groningen, Netherlands 100 914 EUR HORNBACH Real Estate Wateringen B.V., Wateringen, Netherlands 100 1,480 EUR HORNBACH Real Estate Alblasserdam B.V., Alblasserdam, Netherlands 100 825 EUR HORNBACH Real Estate Nieuwegein B.V., Nieuwegein, Netherlands 100 1,456 EUR HORNBACH Real Estate Nieuwerkerk B.V., Nieuwerkerk, Netherlands 100 1,456 EUR

98 NOTES TO THE CONSOLIDATED FINANCIAL STATEMENTS Explanatory Notes on Accounting Policies
HORNBACH Real Estate Geleen B.V., Geleen, Netherlands 100 733 EUR HORNBACH Reclame Activiteiten B.V., Nieuwegein, Netherlands 100 (12) EUR HORNBACH-Baumarkt SK spol. s.r.o., Bratislava, Slovakia 100 27,171 EUR HORNBACH Centrala SRL, Domnesti, Romania 1003) 101,258 RON HORNBACH Asia Ltd., Kowloon, Hong Kong 100 6,394 HKD
1) Shareholders' equity corresponds to the local equity; in the case of HORNBACH Centrala SRL, however, equity has been determined in accordance with IFRS. 2) Of which: 100 % direct shareholding. 3) Of which: 1.6854 % direct shareholding. 4) Of which: 0.0033 % direct shareholding.
A control and profit and loss transfer agreement is in place between HORNBACH Baumarkt AG and HORNBACH International GmbH.
Foreign currency translation In the separate financial statements of HORNBACH Baumarkt AG and its consolidated subsidiaries, transac-tions in currencies other than the respective company’s functional currency have been translated into the relevant functional currency at the transaction rate. All receivables and liabilities in currencies other than the respective company’s functional currency have been measured, irrespective of any currency hedges, at the reporting date rate. The resultant exchange gains and losses have generally been included in the income state-ment. Embedded forward exchange transactions have been recognized at fair value. In line with IAS 21, the annual financial statements of foreign group companies have been translated into euros on the basis of the functional currency concept. This is the local currency for all of the companies in view of the fact that the foreign companies conduct their business independently from a financial, economic and organizational point of view. Accordingly, non-current assets, other assets and liabilities have been translated at the median rate on the reporting date. Income and expense items have been translated using average rates. Exchange rate differences arising from the translation of the annual financial statements of foreign subsidiaries are recognized directly in equity in a separate item within revenue reserves. The most important foreign exchange rates applied are as follows:
Country Rate on reporting date Average rate 2.28.2018 2.28.2017 2017/18 2016/17
RON Romania 4.6630 4.5202 4.59266 4.49100 SEK Sweden 10.0923 9.5675 9.69801 9.49182 CHF Switzerland 1.1520 1.0648 1.12731 1.08530 CZK Czech Republic 25.4180 27.0210 26.05696 27.03226 USD USA 1.2214 1.0597 1.15673 1.10080 HKD Hong Kong 9.5595 8.2252 9.02700 8.54064
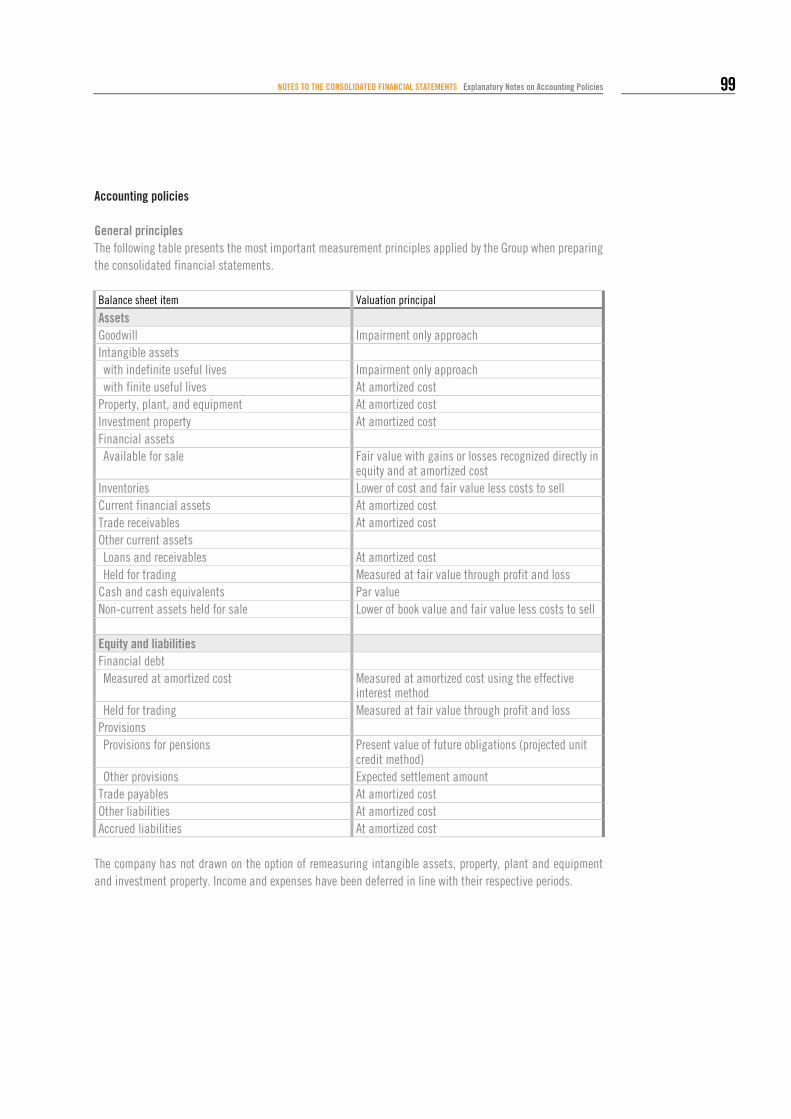
NOTES TO THE CONSOLIDATED FINANCIAL STATEMENTS Explanatory Notes on Accounting Policies 99
Accounting policies
General principles The following table presents the most important measurement principles applied by the Group when preparing the consolidated financial statements. Balance sheet item Valuation principal
Assets Goodwill Impairment only approach Intangible assets with indefinite useful lives Impairment only approach with finite useful lives At amortized cost
Property, plant, and equipment At amortized cost Investment property At amortized cost Financial assets Available for sale Fair value with gains or losses recognized directly in
equity and at amortized cost Inventories Lower of cost and fair value less costs to sell Current financial assets At amortized cost Trade receivables At amortized cost Other current assets Loans and receivables At amortized cost Held for trading Measured at fair value through profit and loss
Cash and cash equivalents Par value Non-current assets held for sale Lower of book value and fair value less costs to sell Equity and liabilities Financial debt Measured at amortized cost Measured at amortized cost using the effective
interest method Held for trading Measured at fair value through profit and loss
Provisions Provisions for pensions Present value of future obligations (projected unit
credit method) Other provisions Expected settlement amount
Trade payables At amortized cost Other liabilities At amortized cost Accrued liabilities At amortized cost
The company has not drawn on the option of remeasuring intangible assets, property, plant and equipment and investment property. Income and expenses have been deferred in line with their respective periods.

100 NOTES TO THE CONSOLIDATED FINANCIAL STATEMENTS Explanatory Notes on Accounting Policies
Goodwill Goodwill is tested for impairment once a year. Should any events or changes in circumstances indicate any impairment in value, then such impairment test must be performed more frequently. Pursuant to IAS 36, the carrying amounts of the cash generating units, including the share of goodwill allocated to such units, are compared with the higher of the fair value less costs to sell and the value in use (so-called recoverable amount) of such units. If a write-down is required, then the impairment loss for a cash generating unit is initially allocated to goodwill. Any remaining impairment loss is subsequently recognized for the other assets in the cash generating unit. However, assets may only be written down at maximum to the recoverable amount of the individual identifiable asset. Goodwill is not written up.
Intangible assets (except goodwill) Intangible assets with finite useful lives are recognized at amortized cost. Amortization is determined using the straight-line method based on the following economic useful lives: Years
Software and licenses 3 to 8 Other intangible assets 3 to 8
Impairment losses are recognized when there are indications of impairment and the recoverable amount falls short of the carrying amount. Corresponding write-ups to a maximum of amortized cost are recognized when the reasons for impairment losses recognized in previous years no longer apply. There are no intangible assets with indefinite useful lives.
Property, plant and equipment and investment property Property, plant and equipment and investment property are recognized at amortized cost. Depreciation is undertaken on a straight-line basis. If there are indications of any impairment in value and if the recoverable amount is less than the amortized cost, then impairment losses are recognized for the respective items of property, plant and equipment or investment property. Corresponding write-ups to a maximum of amortized cost are recognized when the reasons for impairment losses recognized in previous years no longer apply. Depreciation is uniformly based on the following economic useful lives across the Group: Years
Buildings and outdoor facilities (including rented property) 15 to 33 Other equipment, plant, and office equipment 3 to 15
Financing costs incurred in connection with real estate development ("building interest") which can be directly allocated to the acquisition, construction or establishment of land and buildings ("qualifying assets") are capitalized as a component of costs in accordance with IAS 23 "Borrowing Costs".

NOTES TO THE CONSOLIDATED FINANCIAL STATEMENTS Explanatory Notes on Accounting Policies 101
Impairment of non-current financial assets The amount of impairment is measured on the basis of the amount by which the recoverable amount of an asset falls short of its amortized cost. The recoverable amount is the higher of the fair value less costs to sell and the value in use. Where no recoverable amount can be determined for an individual asset, the recoverable amount is determined for the cash generating unit in which the asset is included. A cash generating unit is defined as the smallest identifiable group of assets independently generating cash flows. Within the Group, individual locations are basically viewed as cash generating units. The value in use of an individual asset or a cash generating unit is calculated by reference to the discounted future cash flows of a cash generating unit expected on the basis of the detailed financial budget compiled within the strategic five-year plan. Periods reaching further into the future (perpetuity) have been based on growth factors of 1.0 % to 1.5 % (2016/17: 1.0 % to 1.5 %). The strategic five-year plan is largely based on the developments expected in consumer spending as stated in economic forecasts published by economic research institutes and on current procurement terms and future expectations as to such terms. Discounting is based on average equity and debt capital costs after taxes (WACC= Weighted Average Cost of Capital). The calculation of the costs of equity is based on the yield expected on a long-term risk-free federal bond plus a company-specific risk premium. The costs of debt capital are based on the aforementioned base rate and include a risk premium. This risk premium is appropriate to the rating of HORNBACH Baumarkt AG or of a relevant peer group. The discount rates applied for the respective cash generating units take account of the specific equity capital structures of a peer group, and of country risk. To this extent, the value in use is basically determined by reference to Level 3 input data. The interest rates used for discounting are based on market data. Depending on the countries and activities involved, the discount rates thereby applied ranged from 4.9 % to 9.4 % after taxes (2016/17: 4.6 % to 10.0 %) and from 6.2 % to 11.1 % before taxes (2016/17: 5,8 % to 11.9 %). If the impairment loss is derived from the value in use, then the discount rate referred to for the specific item is reported in the respective section of the notes. The fair value less costs to sell (net realizable value) of an individual asset or cash generating unit is deter-mined by reference to external surveys and assessments based on past experience. The net realizable value of real estate at individual locations that is owned by the Group and of investment property is determined by external independent surveyors. These determine the fair value less costs to sell by reference to Level 3 input data using the valuation methods outlined below. Application is made on the one hand of the capitalized value method, generally the discounted cash flow method. Here, a present value is derived from future (rental) income by application of a discount rate. On the other hand, market price-based methods are applied in the form of analogy methods. Here, reference is made to standard land values deter-mined by comparing the price with suitable other pieces of land or by surveyor committees on the basis of corresponding land sales. Furthermore, application is made of the multiplier method, in which rental income surpluses are multiplied by land-specific factors. Alongside the input data already mentioned, the surveyors also account for additional premiums and discounts to do justice to the individual property-specific circum-stances (e.g. size, situation, conversion, or demolition costs still required). The net realizable values of other assets included in the cash generating unit are also determined on the basis of Level 3 input data. Based on past experience and on an assessment of current market conditions, the cash flows that could be generated by disposing of the assets currently in the cash generating unit are determined.

102 NOTES TO THE CONSOLIDATED FINANCIAL STATEMENTS Explanatory Notes on Accounting Policies
Leases Leased items of property, plant and equipment which are to be viewed in economic terms as asset purchases with long-term financing (finance leases) are recognized pursuant to IAS 17 “Leases” at fair value at the beginning of the leasing relationship, unless the present value of the leasing payments is lower. The relevant assets are depreciated over their economic useful lives or over the term of the lease contract if shorter. Appli-cation is made of the same method of depreciation applicable to comparable assets acquired or manufactured. Moreover, an equivalent financial liability is capitalized at the amount of the fair value of the asset or the present value of the minimum leasing payments, if lower. These payments are subsequently divided into fi-nancing costs and the principal repayment share of the remaining liability. Where material changes in the contractual terms result in a reclassification requirement, the lease is prospectively recognized as a finance lease. Where group companies act as lessees within an operating lease, i.e. when all significant risks and rewards remain with the lessor, then the leasing expenses are recognized on a straight-line basis in the income statement.
Inventories Inventories are carried at cost or at their net realizable value, if lower. The net realizable value is taken to be the expected realizable sales proceeds less the costs incurred up to disposal. The acquisition costs of inventory holdings are determined using weighted average prices. Costs of unfinished services relate to customer orders for merchandise deliveries, including services provided with tradesmen commissioned by HORNBACH. Unfin-ished products and unfinished services mainly involve directly allocable costs of material and invoiced trades-man services. Supplier compensation requiring measurement as a reduction in the respective costs of acqui-sition or manufacture is recognized accordingly within inventories.
Taxes Taxes levied by the respective countries on taxable income and changes in deferred tax items are recognized as taxes on income. These are calculated in accordance with the relevant national legislation on the basis of the tax rates applicable at the balance sheet date, or due to be applicable in the near future. Other taxes are allocated to the respective functional divisions and recognized under the corresponding ex-penses for the relevant function. In line with IAS 12, deferred taxes are recognized and measured using the balance sheet liability method based on the tax rate expected to be valid at the realization date. Deferred tax assets are recognized for the tax benefits expected to arise from future realizable losses carried forward. Deferred tax assets arising from de-ductible temporary differences and tax losses carried forward are only recognized to the extent that it can be assumed with reasonable certainty that the company in question will generate sufficient taxable income in future. This is assessed by reference to the strategic five-year planning. Recognized and unrecognized deferred tax assets are reviewed at each balance sheet date to ascertain whether any adjustment in their current values is required. Deferred tax assets and liabilities referring to items recognized directly in equity are also recognized in equity rather than in the income statement. Deferred tax assets and liabilities are netted for each company or fiscal unity provided that such are due to or from the same tax authority and there is an enforceable right for such items to be offset.
Non-current assets held for sale and disposal groups Land, buildings and other non-current assets and disposal groups which are very likely to be sold in the coming financial year are measured at fair value less costs to sell, if such is lower than the carrying amount.
NOTES TO THE CONSOLIDATED FINANCIAL STATEMENTS Explanatory Notes on Accounting Policies 103
Pensions and similar obligations Consistent with legal requirements in the respective countries and with individual commitments made to members of the Board of Management, group companies of HORNBACH Baumarkt AG have obligations relating to defined contribution and defined benefit pension plans. In the case of defined benefit plans, provisions have been calculated using the projected unit credit method in accordance with IAS 19 (revised 2011) “Employee Benefits”. When determining the pension obligation in ac-cordance with actuarial principles, this method accounts for the pensions known of and claims vested as of the balance sheet date, as well as for the increases in salaries and pensions to be expected in future. The plan assets are deducted at fair value from the obligations. Should this result in a net asset, then this is recognized, provided that it does not exceed the present value of future reductions in contributions or repayments or any retrospective service costs. Current service cost and any retrospective service cost are recognized under personnel expenses. The net in-terest result is recognized under net financial expenses. Actuarial gains and losses relating to the pension obligation or the plan assets are recognized directly in equity, taking account of any deferred taxes. The impli-cations are presented separately in the statement of comprehensive income. For defined contribution plans, the contributions are recognized under personnel expenses upon becoming due for payment. Multiemployer pension plans are recognized by analogy with defined contribution plans.
Provisions and accrued liabilities Provisions are recognized for uncertain obligations to third parties where these result from past events and are likely to lead to a future outflow of resources. Provisions are stated at the expected settlement amount, having accounted for all identifiable risks, and are not offset against recourse claims. This item also includes provi-sions for severance payments, for which actuarial surveys are obtained. If the overall effect is material, non-current provisions are measured at present value discounted to the end of the respective terms. Provisions for pending losses and onerous contracts are recognized if the contractual obligations are higher than the expected economic benefits. When determining the amount of provision, reference is made to the assumptions in the strategic five-year plan. Where contracts have longer terms, the plan assumptions are extended to the earliest possible contract termination date and referred to in measuring the provision. Risks in connection with legal disputes and court cases are recognized under provisions if the requirements of IAS 37 are met. The amount of provision is measured on the basis of an assessment of the circumstances relevant to the case and represents the likely scope of obligation, including estimated legal expenses. To de-termine the obligation, the management regularly analyzes the information available on the legal disputes and court cases. Both in-company and external attorneys are involved in this assessment. In deciding whether it is necessary to recognize a provision, the management accounts for the likelihood of an unfavorable outcome and the possibility of estimating the amount of obligation with sufficient reliability. Provisions are recognized for structural maintenance obligations when the company was contractually obliged to do so. To determine the amount of provision, the company refers to historic information about comparable properties and draws on the expertise of real estate specialists. Additions to the provision are generally recog-nized on a straight-line basis over the term of the contract in order to account for the pattern of consumption of the underlying rental property. In the case of accrued liabilities, the date and level of the respective liability are no longer uncertain.

104 NOTES TO THE CONSOLIDATED FINANCIAL STATEMENTS Explanatory Notes on Accounting Policies
Financial instruments Financial instruments are contracts which result in a financial asset at one company and a financial liability or equity instrument at another company. On the one hand, these include primary financial instruments such as trade receivables and payables, financial receivables and financial liabilities. On the other hand, they also include derivative financial instruments, such as options, forward exchange transactions, interest swaps and currency swaps. Derivative financial instruments are recognized at fair value as of the transaction date. Primary financial instruments are basically recognized at the time at which the company becomes a contractual party. Upon initial recognition, these are recognized at fair value. This generally corresponds to the transaction price. Where there are indications that the fair value deviates from the transaction price, the fair value is determined in accordance with the logic outlined in "Fair Value Measurement" and then used as the basis for initial recognition. Financial assets are basically derecognized once the contractual rights to payment have expired. Furthermore, financial assets are derecognized when the contractual rights to payment, and thus all significant risks and rewards or powers of disposal over these assets, have been assigned. Financial liabilities are derecognized once they have been settled, i.e. once the liability has been repaid, cancelled or has expired.
Primary financial instruments The HORNBACH Baumarkt AG Group has so far not made any use of the option of classifying financial assets or financial liabilities as measured at fair value through profit or loss. Financial assets are classified pursuant to IAS 39 as available for sale, as they cannot be allocated to any other of the IAS 39 categories. They are measured at fair value. Investments and prepayments for financial assets (equity instruments) are recognized at cost when there is no active market for these items and their fair values cannot be reliably determined at reasonable expense. Current financial assets mainly relate to fixed-term deposits which cannot be allocated to cash and cash equivalents. These are recognized at amortized cost or at present value, if lower. Value reductions are stated to account for all identifiable risks. Trade receivables and other assets (except derivatives) are carried at amortized cost or at present value, if lower. Value reductions are stated to account for all identifiable risks. These are determined on the basis of individual risk assessments and depending on the maturity structure of overdue receivables. Specific cases of default lead to the receivable in question being derecognized. Impairment accounts are maintained for current financial assets, trade receivables and the financial assets recognized under other assets. Amounts from impairment accounts are derecognized, with a corresponding charge to the carrying amount of the impaired assets, in cases such as when insolvency proceedings against the debtor have been completed, or when the receivable is deemed irretrievably lost. Cash and cash equivalents include cash on hand and short-term deposits with maturity dates of less than three months. These items are measured at amortized cost (nominal value). Financial debt (except derivatives) are recognized at the respective loan amount, less transaction costs, and subsequently measured at amortized cost. The difference to the repayment amount is recognized as an expense over the term of the bond and the respective financial liability using the effective interest method. All other debt items are also recognized at amortized cost. This mostly corresponds to the respective repayment amount.

NOTES TO THE CONSOLIDATED FINANCIAL STATEMENTS Explanatory Notes on Accounting Policies 105
Trade payables and other liabilities are recognized at amortized cost. Trade payables are mostly classified as current. The same applies for other liabilities. In this respect, their carrying amounts basically correspond to their fair values.
Derivative financial instruments Derivative financial instruments, such as forward exchange transactions and interest swaps, are used to hedge exchange rate and interest risks. In line with the Group’s risk principles, no derivative financial instruments are held for speculative purposes. Upon addition, derivative financial instruments are recognized in the balance sheet at fair value. Any transaction costs incurred are immediately recognized as expenses. Derivatives which are not integrated into an effective hedging relationship as defined in IAS 39 are subject to mandatory classification as held for trading (financial assets/liabilities held for trading) and are thus measured at fair value through profit or loss. The fair values of forward exchange transactions (including the embedded forward exchange transactions) are determined on the basis of market conditions at the balance sheet date. The fair value of interest and interest-currency swaps is determined by the financial institutions with which they were concluded. The financial institutions use customary market valuation models (e.g. discounted cash flow method) that refer to the interest and currency information available on the market. This corresponds to Level 2 input factors in the fair value hierarchy. Upon entering into a hedging transaction, the HORNBACH Baumarkt AG Group classifies certain derivatives as hedging future cash flows or planned transactions (cash flow hedges). Changes in the fair value of those cash flow hedges viewed as effective are recognized directly in equity under revenue reserves, taking due account of deferred taxes, until the result of the hedged item is recognized. Non-effective gains and losses are recognized through profit or loss.
Fair value measurement Fair value represents the price on a given valuation date which a company would receive to sell an asset or to transfer a liability (exit price). Fair value is determined in line with the three-level measurement hierarchy set out in IFRS 13. Based on the availability of information, fair value is determined by reference to the following hierarchy. Level 1 information – current market prices on an active market for identical financial instruments Level 2 information – current market prices on an active market for comparable financial instruments
or using valuation methods whose key input factors are based on observable market data
Level 3 information – input factors not based on observable market prices. The level of information and/or valuation methods used to determine the fair value of assets and liabilities is explained in the respective chapter.
Revenues Pursuant to IAS 18, sales and other operating income are recognized at the time at which the service is performed provided that the amount of income can be reliably determined and the inflow of benefits is deemed likely. For the sale of merchandise, the time at which ownership, i.e. the significant risks and rewards associated with ownership, is transferred is taken to be the time at which the service is performed. The amount of sales recognized is based on the fair value of the consideration received, taking due account of sales deductions and the expected level of goods returned.

106 NOTES TO THE CONSOLIDATED FINANCIAL STATEMENTS Explanatory Notes on Accounting Policies
Rental income from operating lease arrangements is recognized on a straight-line basis under sales over the term of the rental contract. Government grants awarded to cover expenses incurred and for assistance purposes are recognized as income in the income statement. Grants awarded for non-current assets reduce the cost of such assets accordingly.
Expenses As well as the direct acquisition costs of the merchandise in question, the cost of goods sold also includes ancillary acquisition costs, such as freight charges, customs duties and other services rendered, as well as write-downs on inventories. Rental expenses for operating lease arrangements are recognized on a straight-line basis as expenses over the term of the rental contract. Outlays on advertising campaigns and sales promotion measures are recognized as expenses once the relevant powers of disposal have been granted or the respective service received. The reversal of provisions and accrued liabilities has generally been recognized as a reduction in expenses within the functional expense group in which the costs of recognizing the corresponding provision or accrued liability were originally presented. Interest expenses and interest income are recognized in accordance with the period of the respective financial debt. Financing costs incurred in connection with real estate development ("building interest") which can be directly allocated to the acquisition, construction or establishment of land and buildings ("qualifying assets") are capitalized as a component of costs in accordance with IAS 23 “Borrowing Costs". Tax expenses include current and deferred taxes unless they relate to facts or circumstances accounted for directly in equity.
Discretionary decisions Discretionary decisions made when applying the accounting policies and which materially influence the amounts recognized in the consolidated financial statements chiefly relate to the classification of leases as finance or operating leases. Based on the contractual terms, an assessment is made upon concluding or mod-ifying the respective contracts as to whether the risks and rewards associated with ownership of the leased item are attributable to HORNBACH Baumarkt AG or to the counterparty. More detailed information can be found in Notes 23 and 30.
Assumptions and estimates Assumptions and estimates are made when preparing the consolidated financial statements which have an effect on the recognition and/or measurement of the assets, liabilities, income and expenses as presented. Assumptions and estimates are made on the basis of the information available at the reporting date. Should the development in the relevant conditions deviate from the assumptions and estimates, then the amounts actually arising in future may differ from the amounts recognized in the accounts. The assumptions and estimates mainly relate to uniform procedures applied across the Group for economic useful lives (Notes 10, 11 & 12), the recognition and measurement of provisions (Notes 24, 25 & 28), the calculation of the recoverable amount to determine the amount of any impairments of non-current non-finan-cial assets (Notes 10, 11 & 12), the determination of the net realizable price for inventories (Note 16), and the

NOTES TO THE CONSOLIDATED FINANCIAL STATEMENTS 107
ability to obtain future tax relief (Notes 8, 15 & 27). Further information about the accounting policies relating to the respective topic can be found in the aforementioned notes. The assumptions and estimates relevant to the preparation of the consolidated financial statements are con-tinually reviewed. Changes in estimates are accounted for in the period of such changes and in future periods when they relate both to the reporting period and future periods.
108 NOTES TO THE CONSOLIDATED FINANCIAL STATEMENTS Segment Reporting
Segment Reporting
Segment reporting is consistent with the accounting policies applied in the consolidated financial statements (IFRS). Sales to external third parties represent net sales. Transfer prices between the segments are equivalent to those applied to external third parties.
Segment delineation The allocation of business fields (segments) corresponds to the internal reporting system used by the Board of Management of the HORNBACH Baumarkt AG Group for managing the company. The "Retail" segment includes the 156 (2016/17: 155) DIY megastores and garden centers grouped together in the HORNBACH Baumarkt AG Group and the online shops in the nine European countries in which we operate. The "Real estate" segment includes the retail properties owned by the HORNBACH Baumarkt AG Group, which are let and charged to the respective DIY stores with garden centers within the Group at normal market conditions. The "Headquarters and consolidation" reconciliation column includes administration and consolidation items not attributable to the individual segments.
Segment earnings Earnings before interest and taxes (EBIT) have been taken to represent the segment earnings.
Segment assets and liabilities Apart from income tax receivables, income tax liabilities and deferred taxes, asset and liability items in the consolidated balance sheet have been directly allocated to the individual segments as far as possible. Re-maining assets and liabilities have been allocated as appropriate. Liabilities in the consolidated balance sheet have been increased by liabilities to group companies in the individual segments and allocated to the individual segments in line with their causation. The resultant adjustments have been eliminated in the "Headquarters and consolidation" reconciliation column. Investments relate to the non-current assets allocable to the respec-tive segment.

NOTES TO THE CONSOLIDATED FINANCIAL STATEMENTS Segment Reporting 109
2017/18 in € million 2016/17 in € million
Retail Real estate Headquarters and
consolidation
HORNBACH Baumarkt AG
Group
Segment sales 3,889.4 172.8 (171.5) 3,890.7 3,708.5 167.6 (166.0) 3,710.1 Sales to third parties 3,889.4 0.0 0.0 3,889.4 3,708.5 0.0 0.0 3,708.5 Rental income from third parties 0.0 1.3 0.0 1.3 0.0 1.6 0.0 1.6 Rental income from affiliated companies 0.0 171.5 (171.5) 0.0 0.0 166.0 (166.0) 0.0 Segment earnings (EBIT) 40.4 74.3 (12.2) 102.5 41.1 67.3 (10.9) 97.5 of which: depreciation and amortization/write-ups 39.5 31.7 9.0 80.2 39.5 29.8 6.8 76.1
Segment assets 929.0 972.3 89.7 1,991.0 893.7 937.2 117.4 1,948.3 of which: credit balances at banks 52.5 0.0 29.0 81.6 58.6 0.0 32.4 91.0
Investments 1) 43.8 71.1 13.7 128.7 37.6 113.1 25.4 176.1 Segment liabilities 409.9 208.5 292.9 911.4 405.6 215.1 287.6 908.3 of which: financial debt 0.0 175.1 249.0 424.1 13.5 189.7 249.6 452.9
1) Investments in the "Real estate" segment include additions resulting from the capitalization of finance leases amounting to € 0.0 million (2016/17: € 19.0 million).
Reconciliation in € million 2017/18 2016/17
Segment earnings (EBIT) before "Headquarters and consolidation" 114.7 108.4 Headquarters (12.2) (10.9) Net financial expenses (21.6) (18.2) Consolidated earnings before taxes 80.9 79.3 Segment assets 1,991.0 1,948.3 Deferred tax assets 4.5 3.8 Income tax receivables 2.2 7.7 Total assets 1,997.7 1,959.9 Segment liabilities 911.4 908.3 Deferred tax liabilities 26.0 27.5 Income tax liabilities 11.6 13.4 Total liabilities 949.0 949.2

110 NOTES TO THE CONSOLIDATED FINANCIAL STATEMENTS Segment Reporting
Geographical information To enhance comprehension of the financial statements, the mandatory geographical disclosures for sales to third parties and non-current assets have been supplemented with voluntary additional information. The geographical disclosures have been subdivided into the "Germany" and "Other European countries" re-gions. The "Other European countries" region includes the Czech Republic, Austria, the Netherlands, Luxem-bourg, Switzerland, Sweden, Slovakia, and Romania. Sales are allocated to the geographical regions in which they were generated. Apart from income tax receiva-bles, income tax liabilities and deferred taxes, all assets have been allocated to the region in which they are located. Investments relate to non-current assets allocated to the respective region. The reconciliation column includes consolidation items. 2017/18 in € million 2016/17 in € million
Germany Other European countries
Reconciliation HORNBACH Baumarkt AG
Group
Sales 2,418.1 1,819.7 (347.1) 3,890.7 2,361.0 1,669.9 (320.8) 3,710.1 Sales to third parties 2,071.3 1,818.1 0.0 3,889.4 2,040.5 1,668.0 0.0 3,708.5 Sales to affiliated companies 346.7 0.4 (347.1) 0.0 320.4 0.4 (320.8) 0.0 Rental income from third parties 0.1 1.2 0.0 1.3 0.0 1.6 0.0 1.6 EBIT 3.9 98.5 0.1 102.5 12.2 85.4 (0.1) 97.5 Depreciation and amortization/write-ups 47.6 32.6 0.0 80.2 45.1 31.0 0.0 76.1 EBITDA 51.5 131.1 0.1 182.7 57.3 116.5 (0.1) 173.6 Assets 1,412.6 1,008.6 (430.2) 1,991.0 1,408.9 917.1 (377.7) 1,948.3 of which: non-current assets*) 519.3 640.4 (0.1) 1,159.5 522.7 596.9 (0.1) 1,119.5 Investments 1) 54.8 73.9 0.0 128.7 58.4 117.7 0.0 176.1
*) These involve property, plant and equipment, investment property, intangible assets, and non-current deferrals and accruals. 1) Investments include additions resulting from the capitalization of finance leases amounting to € 0.0 million (2016/17: € 19.0 million).
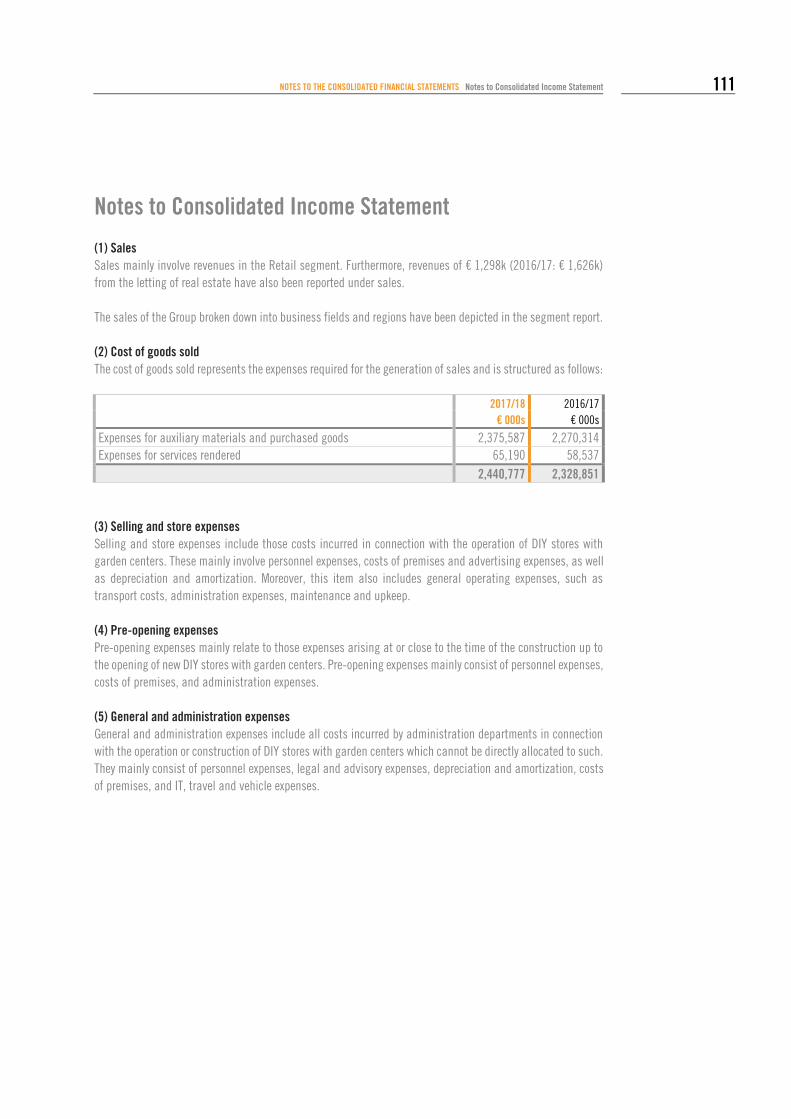
NOTES TO THE CONSOLIDATED FINANCIAL STATEMENTS Notes to Consolidated Income Statement 111
Notes to Consolidated Income Statement
(1) Sales Sales mainly involve revenues in the Retail segment. Furthermore, revenues of € 1,298k (2016/17: € 1,626k) from the letting of real estate have also been reported under sales. The sales of the Group broken down into business fields and regions have been depicted in the segment report.
(2) Cost of goods sold The cost of goods sold represents the expenses required for the generation of sales and is structured as follows: 2017/18 2016/17
€ 000s € 000s
Expenses for auxiliary materials and purchased goods 2,375,587 2,270,314 Expenses for services rendered 65,190 58,537 2,440,777 2,328,851
(3) Selling and store expenses Selling and store expenses include those costs incurred in connection with the operation of DIY stores with garden centers. These mainly involve personnel expenses, costs of premises and advertising expenses, as well as depreciation and amortization. Moreover, this item also includes general operating expenses, such as transport costs, administration expenses, maintenance and upkeep.
(4) Pre-opening expenses Pre-opening expenses mainly relate to those expenses arising at or close to the time of the construction up to the opening of new DIY stores with garden centers. Pre-opening expenses mainly consist of personnel expenses, costs of premises, and administration expenses.
(5) General and administration expenses General and administration expenses include all costs incurred by administration departments in connection with the operation or construction of DIY stores with garden centers which cannot be directly allocated to such. They mainly consist of personnel expenses, legal and advisory expenses, depreciation and amortization, costs of premises, and IT, travel and vehicle expenses.

112 NOTES TO THE CONSOLIDATED FINANCIAL STATEMENTS Notes to Consolidated Income Statement
(6) Other income and expenses Other income and expenses are structured as follows: 2017/18 2016/17 € 000s € 000s
Other income from operating activities Income from advertising allowances and other reimbursements of suppliers 1,565 2,193 Income from allocations within the HORNBACH HOLDING Group 1,770 1,692 Income from disposal of non-current assets 876 859 Income from damages 1,555 1,472 Income from payment differences 1,267 899 Miscellaneous other income 14,794 13,103 21,827 20,218 Other income from non-operating activities Income from write-ups to property, plant, and equipment and investment property 121 0 121 0 Other income 21,948 20,218
Miscellaneous other income principally relates to ancillary revenues at the DIY stores with garden centers, in-come from disposal activities, income from retirements of liabilities, income from personnel grants, and income from the reversal of impairments of receivables. 2017/18 2016/17 € 000s € 000s
Other expenses from operating activities Losses due to damages 2,273 2,041 Impairments and defaults on receivables 1,440 1,161 Losses on disposal of non-current assets 422 1,473 Expenses from payment differences 40 471 Miscellaneous other expenses 2,663 2,185 Other expenses 6,837 7,330 Net income from other income and expenses 15,111 12,888

NOTES TO THE CONSOLIDATED FINANCIAL STATEMENTS Notes to Consolidated Income Statement 113
(7) Net financial expenses 2017/18 2016/17 € 000s € 000s
Other interest and similar income Interest income on financial instruments measured at amortized cost 473 483 Other 267 421 of which: from affiliated companies 75 150
740 904 Other interest and similar expenses Interest expenses on financial instruments measured at amortized cost 16,365 16,720 Interest expenses on financial instruments used as hedging instruments 33 733 Interest expenses from compounding of provisions 180 196 Other 984 946 of which: to affiliated companies 45 50
17,562 18,595 Net interest expenses (16,822) (17,691) Other financial result Gains/losses on derivative financial instruments 1,195 (1,055)Gains and losses from foreign currency exchange (5,978) 517 (4,783) (538)Net financial expenses (21,605) (18,229)
Other interest income includes interest income of € 192k on tax refund claims (2016/17: € 271k). In line with IAS 17 “Leases”, finance leases are recognized under property, plant and equipment, with the interest component of the leasing installments, amounting to € 7,764k (2016/17: € 8,173k) being recognized under interest and similar expenses. Net interest expenses do not include interest incurred for financing the construction stage of real estate development measures. This interest amounted to € 2,637k in the year under report (2016/17: € 2,880k) and has been capitalized as a component of the costs of the property, plant and equipment concerned. The average financing cost rate used to determine the volume of borrowing costs eligible for capitalization amounted to 4.2 % (2016/17: 4.2 %). (Deferred) interest payments on interest swaps included as a hedging instrument within cash flow hedges pursuant to IAS 39 are netted for each swap contract and recognized on the basis of their net amount either as interest income or interest expenses. Gains/losses on derivative financial instruments include gains and losses of € 1,195k on derivative currency instruments (2016/17: € -1,055k). The gains and losses from foreign currency exchange for the 2017/18 financial year chiefly result from the measurement of foreign currency receivables and liabilities. This resulted in net expenses of € 1,827k (2016/17: € 1,840k). Furthermore, this item also includes realized exchange rate gains of € 5,670k (2016/17: € 8,692k) and realized exchange rate losses of € 9,821k (2016/17: € 6,335k).

114 NOTES TO THE CONSOLIDATED FINANCIAL STATEMENTS Notes to Consolidated Income Statement
(8) Taxes on income The taxes on income reported include the taxes on income paid or payable in the individual countries, as well as deferred tax accruals. The German companies included in the HORNBACH Baumarkt AG Group are subject to an average trade tax rate of approximately 14.7 % of their trading income (2016/17: 14.7 %). The corporate income tax rate con-tinues to amount to 15 %, plus 5.5 % solidarity surcharge. As in the previous year, all domestic deferred tax items have been valued at an average tax rate of 30 %. The calculation of foreign income taxes is based on the relevant laws and regulations in force in the individual countries. The income tax rates applied to foreign companies range from 16 % to 28 % (2016/17: 16 % to 29 %). The actual income tax charge of € 22,217k (2016/17: € 26,429k) is € 2,048k lower (2016/17: € 2,641k higher) than the expected tax charge of € 24,265k (2016/17: € 23,788k) which would have been payable by applying the average tax rate of 30 % at HORNBACH Baumarkt AG (2016/17: 30 %) to the Group’s pre-tax earnings of € 80,884k (2016/17: € 79,293k). Deferred tax assets have been stated for losses carried forward amounting to € 4,764k (2016/17: € 4,737k). HORNBACH Baumarkt AG expects it to be possible to offset the tax losses arising and carried forward in indi-vidual countries against future earnings in full. No deferred tax assets have been reported in the case of losses carried forward amounting to € 35,330k (2016/17: € 30,623k), as future realization of the resultant benefit is not expected. There are no time limits on the utilization of all other losses carried forward for which no deferred tax assets have been stated. Losses carried forward amounting to € 8k for which no deferred taxes had been recognized were utilized (2016/17: € 2,908k). In the previous year, deferred tax assets of € 6,237k were derecognized in connection with losses carried for-ward whose utilization was no longer deemed likely. Taxes on income due in future in connection with planned profit distributions at subsidiaries have been recog-nized as deferred tax liabilities. A budgeting horizon of one year has been assumed. The distributions for which deferred tax liabilities have been recognized at the HORNBACH Baumarkt AG Group are subject to German taxation at 5 %. No deferred tax liabilities have been recognized for retained profits of € 351,644k at subsidi-aries (2016/17: € 323,634k), as these are either not subject to taxation or currently intended for reinvestment over an indefinite period.
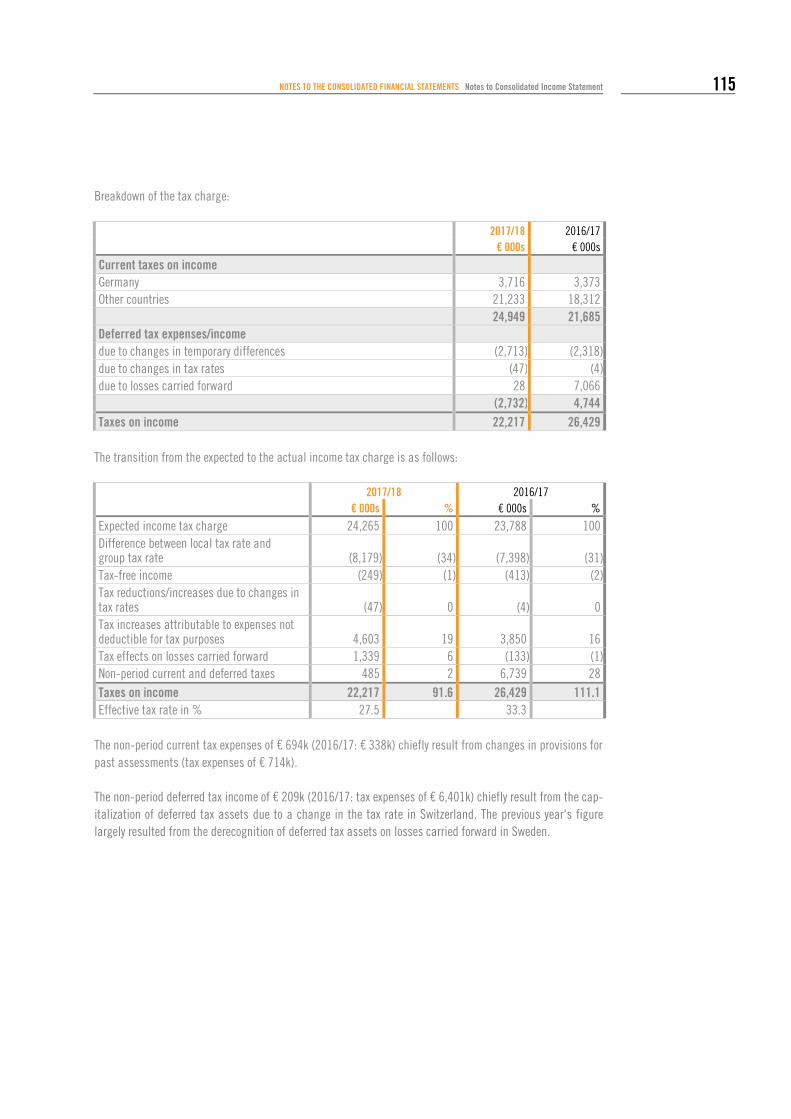
NOTES TO THE CONSOLIDATED FINANCIAL STATEMENTS Notes to Consolidated Income Statement 115
Breakdown of the tax charge: 2017/18 2016/17
€ 000s € 000s
Current taxes on income Germany 3,716 3,373 Other countries 21,233 18,312 24,949 21,685 Deferred tax expenses/income due to changes in temporary differences (2,713) (2,318) due to changes in tax rates (47) (4) due to losses carried forward 28 7,066 (2,732) 4,744 Taxes on income 22,217 26,429
The transition from the expected to the actual income tax charge is as follows:
2017/18 2016/17 € 000s % € 000s %
Expected income tax charge 24,265 100 23,788 100 Difference between local tax rate and group tax rate (8,179) (34) (7,398) (31) Tax-free income (249) (1) (413) (2) Tax reductions/increases due to changes in tax rates (47) 0 (4) 0 Tax increases attributable to expenses not deductible for tax purposes 4,603 19 3,850 16 Tax effects on losses carried forward 1,339 6 (133) (1) Non-period current and deferred taxes 485 2 6,739 28 Taxes on income 22,217 91.6 26,429 111.1 Effective tax rate in % 27.5 33.3
The non-period current tax expenses of € 694k (2016/17: € 338k) chiefly result from changes in provisions for past assessments (tax expenses of € 714k). The non-period deferred tax income of € 209k (2016/17: tax expenses of € 6,401k) chiefly result from the cap-italization of deferred tax assets due to a change in the tax rate in Switzerland. The previous year's figure largely resulted from the derecognition of deferred tax assets on losses carried forward in Sweden.

116 NOTES TO THE CONSOLIDATED FINANCIAL STATEMENTS Notes to Consolidated Income Statement
The taxes recognized directly in equity in the financial year under report relate to the following items: 2017/18 2016/17 € 000s € 000s
Actuarial gains and losses on defined benefit plans Actuarial gains and losses on defined benefit plans before taxes 4,042 1,974 Change in deferred taxes (780) (367) 3,262 1,607 Measurement of derivative financial instruments (cash flow hedge) Changes in fair value of derivative financial instruments before taxes 32 725 Change in deferred taxes (8) (210) 24 515 Measurement of available for sale financial assets Changes in fair value of available for sale financial assets before taxes 883 1,788 Change in deferred taxes (13) (27) 870 1,761 Exchange differences arising on the translation of foreign subsidiaries (2,988) 2,565 Other comprehensive income, net after taxes 1,168 6,448 of which: other comprehensive income before taxes 1,969 7,052 of which: change in deferred taxes (801) (604)
(9) Earnings per share Basic earnings per share are calculated in line with IAS 33 “Earnings per Share” by dividing the consolidated net income allocable to the shareholders of HORNBACH Baumarkt AG by the weighted average number of shares in circulation during the financial year. As in the previous year, there were no dilutive effects.
2017/18 2016/17
Weighted number of shares issued 31,807,000 31,807,000 Consolidated net income allocable to shareholders in HORNBACH Baumarkt AG (in €) 58,666,925 52,863,504 Earnings per share in € 1.84 1.66

NOTES TO THE CONSOLIDATED FINANCIAL STATEMENTS Notes to Consolidated Income Statement 117
(10) Other disclosures on the income statement
Non-operating items Individual expense items also include the following non-operating items:
2017/18 financial year € 000s
Impairment of assets (IAS 36)
Reversal of impairment
losses (IAS 36)
Additions to provisions
for onerous contracts
Income from reversal of
provisions for onerous
contracts
Result from cancellation
of projects
Total
Selling and store expenses (350) 0 (7,383) 118 0 (7,615)Pre-opening expenses 0 0 0 0 (54) (54)Other income and expenses 0 121 0 0 0 121 (350) 121 (7,383) 118 (54) (7,547)
2016/17 financial year € 000s
Impairment of assets (IAS 36)
Reversal of impairment
losses (IAS 36)
Additions to provisions
for onerous contracts
Income from reversal of
provisions for onerous
contracts
Result from cancellation
of projects
Total
Selling and store expenses (1,338) 0 (3,664) 0 0 (5,003)Pre-opening expenses 0 0 0 0 (312) (312) (1,338) 0 (3,664) 0 (312) (5,315)
Personnel expenses The individual expense items include the following personnel expenses: 2017/18 2016/17
€ 000s € 000s
Wages and salaries 573,671 541,558 Social security contributions and pension expenses 126,635 118,620 700,306 660,178
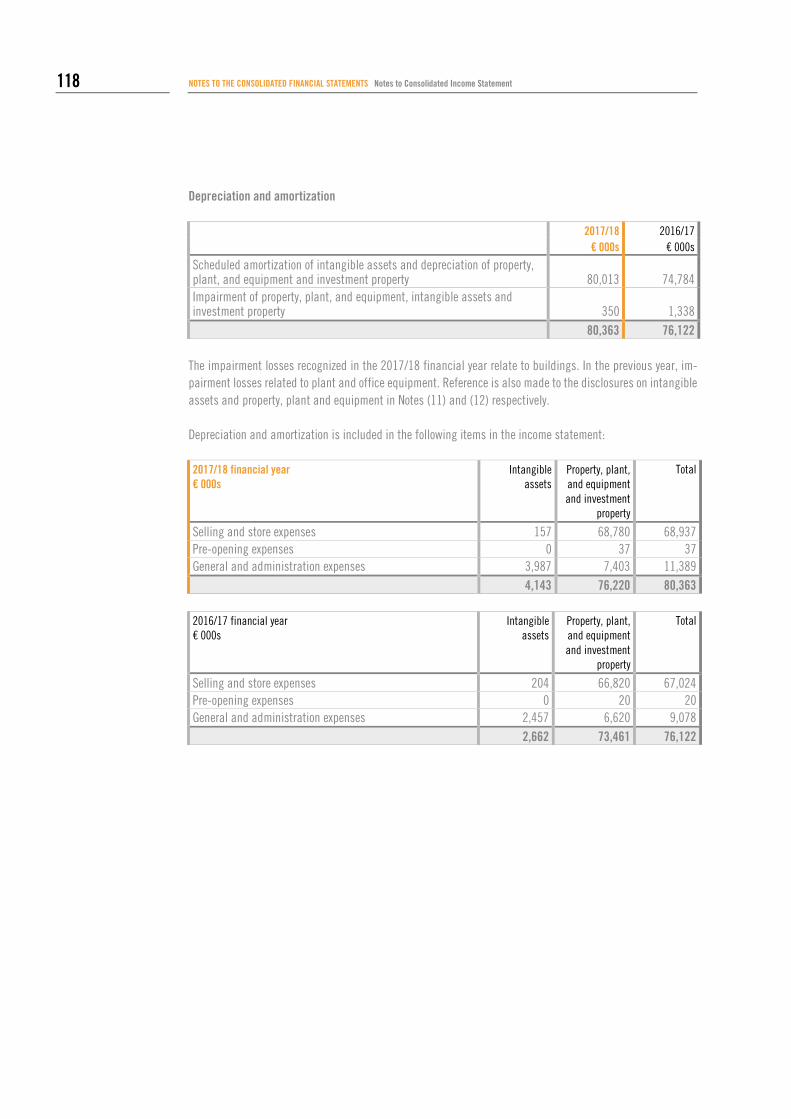
118 NOTES TO THE CONSOLIDATED FINANCIAL STATEMENTS Notes to Consolidated Income Statement
Depreciation and amortization 2017/18 2016/17
€ 000s € 000s
Scheduled amortization of intangible assets and depreciation of property, plant, and equipment and investment property 80,013 74,784 Impairment of property, plant, and equipment, intangible assets and investment property 350 1,338 80,363 76,122
The impairment losses recognized in the 2017/18 financial year relate to buildings. In the previous year, im-pairment losses related to plant and office equipment. Reference is also made to the disclosures on intangible assets and property, plant and equipment in Notes (11) and (12) respectively. Depreciation and amortization is included in the following items in the income statement: 2017/18 financial year € 000s
Intangible assets
Property, plant, and equipment and investment
property
Total
Selling and store expenses 157 68,780 68,937 Pre-opening expenses 0 37 37 General and administration expenses 3,987 7,403 11,389 4,143 76,220 80,363
2016/17 financial year € 000s
Intangible assets
Property, plant, and equipment and investment
property
Total
Selling and store expenses 204 66,820 67,024 Pre-opening expenses 0 20 20 General and administration expenses 2,457 6,620 9,078 2,662 73,461 76,122

NOTES TO THE CONSOLIDATED FINANCIAL STATEMENTS Notes to Consolidated Balance Sheet 119
Notes to Consolidated Balance Sheet
(11) Intangible assets
The development in intangible assets in the 2016/17 and 2017/18 financial years was as follows: Additions to franchises, industrial property rights and similar rights and values and licenses to such rights
and values and to assets under construction mainly relate to the acquisition of software licenses and ex-penses incurred to prepare the software for its intended use.
As in the previous year, there are no major restrictions on ownership and disposition rights. The goodwill relates to two garden centers in the Netherlands, with around 50 % of the respective figure
being allocable to each of these. As in the previous year, the mandatory annual impairment test performed on goodwill in the 2017/18 financial year did not identify any impairment requirement. The recoverable amounts of the two cash generating units are based in each case on their value in use. This is calculated using the discounted cash flow method by reference to Level 3 input data.
The pre-tax discount rates applied in the 2017/18 financial year amounted to 9.1 % and 6.6 % (2016/17: 9.3 % and 6.2 %).
As in the previous year, the changes deemed possible in key assumptions (increase in discount rate or reduction in gross profit) would not result in any impairments at the two locations.
€ 000s Franchises, industrial property rights, and similar rights and
values as well as licenses to such rights and values
Goodwill Assets under construction
Total
Cost Balance at March 1, 2016 85,350 3,271 2,818 91,439 Additions 2,678 0 3,901 6,579 Disposals 247 0 939 1,186 Reclassifications 233 0 (21) 212 Foreign currency translation 2 0 0 2 Balance at February 28/March 1, 2017 88,016 3,271 5,759 97,046 Additions 5,911 0 1,913 7,824 Disposals 495 0 0 495 Reclassifications 5,226 0 (5,245) (19)Foreign currency translation (2) 0 0 (2)Balance at February 28, 2018 98,656 3,271 2,427 104,354 Amortization Balance at March 1, 2016 79,394 0 0 79,394 Additions 2,662 0 0 2,662 Disposals 247 0 0 247 Foreign currency translation 2 0 0 2 Balance at February 28/March 1, 2017 81,811 0 0 81,811 Additions 4,143 0 0 4,143 Disposals 490 0 0 490 Foreign currency translation (2) 0 0 (2)Balance at February 28, 2018 85,462 0 0 85,462 Carrying amount at February 28, 2018 13,194 3,271 2,427 18,892 Carrying amount at February 28, 2017 6,205 3,271 5,759 15,235

120 NOTES TO THE CONSOLIDATED FINANCIAL STATEMENTS Notes to Consolidated Balance Sheet
(12) Property, plant and equipment and investment property The development in property, plant and equipment in the 2016/17 and 2017/18 financial years was as fol-lows:
The impairment losses included in depreciation relate to assets whose carrying amounts exceed their recover-able amounts. This depreciation is allocated to the relevant functional cost item (see Note 10). Where the carrying amount of the cash generating unit exceeded its value in use, the net realizable values of any real estate attributable to the CGUs were also determined by reference to external real estate surveys. Values were determined using the capitalized earnings method pursuant to the German Real Estate Valuation
€ 000s Land, leasehold rights, and buildings
on third-party land
Investment property (IAS 40)
Other equipment, plant, and
office equipment
Assets under construction
Total
Cost Balance at March 1, 2016 1,049,255 18,464 595,884 29,580 1,693,183 Changes in scope of consolidation 8,189 0 0 0 8,189 Additions 98,870 1,390 37,273 23,773 161,306 Disposals 24 0 27,554 101 27,679 Reclassifications 17,934 0 6,683 (24,829) (212)Foreign currency translation 2,537 0 165 31 2,733 Balance at February 28/March 1, 2017 1,176,761 19,854 612,451 28,454 1,837,520 Reclassifications to/from non-current assets held for sale 0 (754) 0 0 (754)Additions 28,036 2,770 43,516 46,537 120,859 Disposals 101 0 25,738 827 26,666 Reclassifications 16,509 0 5,736 (22,226) 19 Foreign currency translation (5,760) 0 (2,291) (227) (8,278)Balance at February 28, 2018 1,215,445 21,870 633,674 51,711 1,922,700 Depreciation Balance at March 1, 2016 228,032 3,569 454,993 0 686,594 Additions 31,033 59 42,369 0 73,461 Disposals 24 0 26,361 0 26,385 Reclassifications (29) 0 29 0 0 Foreign currency translation 300 0 223 0 523 Balance at February 28/March 1, 2017 259,312 3,628 471,253 0 734,193 Reclassifications to/from non-current assets held for sale 0 (432) 0 0 (432)Additions 33,600 (18) 42,638 0 76,220 Write-ups (121) 0 0 0 (121)Disposals 67 0 24,567 0 24,634 Reclassifications 14 0 (14) 0 0 Foreign currency translation 361 0 (1,987) 0 (1,626)Balance at February 28, 2018 293,099 3,178 487,323 0 783,600 Carrying amount at February 28, 2018 922,346 18,692 146,351 51,711 1,139,100 Carrying amount at February 28, 2017 917,449 16,226 141,198 28,454 1,103,327
NOTES TO THE CONSOLIDATED FINANCIAL STATEMENTS Notes to Consolidated Balance Sheet 121
Ordinance (ImmoWertV). No write-down requirements were identified on real estate in the 2017/18 financial year. As a result of the impairment test, an impairment requirement was identified in the 2017/18 financial year for one building at a store in the Germany region which constitutes a cash generating unit. This item was written down by € 350k to its value in use. This was determined using the discounted cash flow method and based on Level 3 input data. The discount rate used to calculate the value in use amounted to 9.8 % before tax. The recoverable amount for the location amounts to € 2,706k. In the previous year, impairment requirements were identified for marketing-oriented and sales promotional plant and office equipment and on real estate at three stores in the Germany region, which each constitute cash generating units, and at two stores in Austria. These items were written down by € 1,338k to their net realizable values. The recoverable amount for these locations amounted to € 28,773k. As in the previous year, no impairment losses to net realizable value were recognized for items of investment property in the 2017/18 financial year. Impairment losses are included under non-current asset items in the corresponding segments as follows: € 000s 2017/18 2016/17
Retail segment Other equipment, plant, and office equipment 0 1,338 0 1,338 Real estate segment Buildings 350 0 350 0 Total 350 1,338
Reference is made to Note (7) with regard to capitalized financing costs. The real estate assets are predominantly owned by HORNBACH Baumarkt AG and by real estate companies established for this purpose. Other equipment and plant and office equipment mainly relate to HORNBACH Baumarkt AG in the case of German consolidated companies and to HORNBACH Baumarkt GmbH, HORNBACH Baumarkt Luxemburg SARL, HORNBACH Baumarkt CS spol s.r.o., Hornbach Bouwmarkt (Nederland) B.V., Hornbach Baumarkt (Schweiz) AG, HORNBACH-Baumarkt SK spol s.r.o., Hornbach Byggmarknad AB, and HORNBACH Centrala SRL in the case of foreign consolidated companies. Investment property mainly relates to retail properties at various locations in Germany. The respective rental contracts have basic rental periods of 1 to 15 years and in some cases provide extension options for the lessees. The properties let to third parties are recognized at amortized cost. A useful life of 33 years has been assumed. The fair value of investment property amounts to approximately € 21.2 million (2016/17: € 18.5 million). The fair values have been determined by independent external surveyors, who generally calculate the capitalized earnings value pursuant to the German Real Estate Valuation Ordinance (ImmoWertV). The calculation is based on Level 3 input data. Key input factors include future rental income, the property rate, and operating costs. Irrespective of this, application is also made of the comparative method. This involves determining the fair value on the basis of transactions with comparable properties (Level 2 input data).

122 NOTES TO THE CONSOLIDATED FINANCIAL STATEMENTS Notes to Consolidated Balance Sheet
Rental income of € 759k was generated on properties let to third parties in the year under report (2016/17: € 1,545k). Expenses of € 406k were incurred for the maintenance of the properties let to third parties (2016/17: € 469k). Expenses of € 28k were incurred for all other items of investment property (2016/17: € 35k). The real estate acts as security for bank loans in the form of registered land charges amounting to € 12.5 million (2016/17: € 36.6 million). As in the previous year, contractual amendments and new rental contracts were negotiated for several existing locations in the 2017/18 financial year. The existing lease agreements were exclusively classified as operating leases. The net carrying amount of finance leases included in the "Land, leasehold rights and buildings, and buildings on third-party land" asset class at the balance sheet date totals € 161,756k (2016/17: € 176,385k). The leases mainly relate to land and buildings that are let and provide for basic rental periods of 15 years. Furthermore, the leases include up to three options to extend the contractual terms by five years in each case, as well as indexing provisions customary to the market and based on the development in consumer price indices. The following table provides disclosures on finance lease obligations. Further information about operating lease obligations can be found in Notes (30) and (31). 2017/18 financial year € 000s
Current < 1 year
Non-current 1 to 5 years
Non-current > 5 years
Nominal value of the minimum lease payments 17,565 70,260 138,693 Discounting (7,243) (24,215) (20,945) Present value 10,322 46,045 117,748
2016/17 financial year € 000s
Current < 1 year
Non-current 1 to 5 years
Non-current > 5 years
Nominal value of the minimum lease payments 18,004 70,806 157,475 Discounting (7,772) (26,362) (26,417) Present value 10,232 44,444 131,057

NOTES TO THE CONSOLIDATED FINANCIAL STATEMENTS Notes to Consolidated Balance Sheet 123
(13) Financial assets The development in financial assets in the 2016/17 and 2017/18 financial years was as follows: € 000s Investments Total
Cost Balance at March 1, 2016 3,871 3,871 Measurement of available for sale financial assets 1,788 1,788 Balance at February 28/March 1, 2017 5,659 5,659 Measurement of available for sale financial assets 884 884 Balance at February 28, 2018 6,543 6,543 Carrying amount at February 28, 2018 6,543 6,543 Carrying amount at February 28, 2017 5,659 5,659
Financial assets include a ten-percent shareholding in HORNBACH Immobilien H.K. s.r.o., Czech Republic, which is classified as an available-for-sale financial asset and measured at fair value. Information about the measurement assumptions can be found in the information about financial instruments in Note (33). The other financial assets of € 1k (2016/17: € 1k) involve investments in non-operating companies. These are measured at cost as there is no active market for such investments and their fair values cannot be reliably determined. The Group currently has no intention to sell financial assets.
(14) Other non-current receivables and assets Other non-current receivables and assets mainly consist of deposits of € 2,259k (2016/17: € 2,254k) paid as security for possible subsequent claims to purchase price reductions on the part of the buyer. The deposits have a maximum remaining term of 3 years.
(15) Deferred taxes Deferred taxes relate to the following items:
2.28.2018 2.28.2017 Assets Liabilities Assets Liabilities
€ 000s € 000s € 000s € 000s
Intangible assets and property, plant, and equipment 567 31,401 528 31,248 Finance leases 1,935 0 1,275 0 Inventories 684 3,783 639 4,341 Other provisions 10,606 26 9,027 35 Liabilities 34 379 411 458 Other assets and liabilities 507 936 660 899 Losses carried forward 772 0 834 0 15,105 36,525 13,374 36,981 Set-off (10,574) (10,574) (9,526) (9,526) Total 4,531 25,951 3,848 27,455

124 NOTES TO THE CONSOLIDATED FINANCIAL STATEMENTS Notes to Consolidated Balance Sheet
(16) Inventories
2.28.2018 2.28.2017 € 000s € 000s
Auxiliary materials and supplies 1,850 1,693 Unfinished products, unfinished services 1,460 1,439 Finished products and merchandise 664,130 631,966 Inventories (gross) 667,440 635,098 less valuation allowances 9,619 9,012 Inventories (net) 657,821 626,086 Carrying amount of inventories measured at net realizable value 33,644 28,748
Expenses of € 2,365,968k were recognized as merchandise input expenses for merchandise and auxiliary ma-terials and supplies in the 2017/18 financial year (2016/17: € 2,261,303k).
(17) Current financial assets In the previous year, this item included short-term deposits not allocated to cash and cash equivalents.
(18) Trade receivables and other current assets This item comprises the following items:
2.28.2018 2.28.2017 € 000s € 000s
Trade receivables 7,957 6,767 Receivables from affiliated companies 957 1,454 Positive fair values of derivative financial instruments 578 29 Other receivables and assets 52,838 43,100 62,330 51,350
Trade receivables include receivables of € 1,485k (2016/17: € 1,414k) assigned within factoring agreements that have not been derecognized as all of the credit risk remains at the HORNBACH Baumarkt AG Group. A corresponding liability has been recognized in the same amount. Given the short-term nature of the relevant receivables and the corresponding liability, their fair values are basically equivalent to their carrying amounts. Furthermore, the company has factoring agreements that result in the full derecognition of the respective trade receivables, but that nevertheless entail continuing involvement pursuant to IFRS 7. This continuing involve-ment arises due to fact that new obligations arise for HORNBACH upon the assignment of the respective re-ceivable. Should the receivables thereby assigned default, then HORNBACH is liable for a contractually defined quota. The receivables assigned and fully derecognized are countered by a provision of € 26k (2016/17: € 22k) that represents the likely liability risk. Any liability-related issues are generally addressed shortly after the assignment of the receivable. The maximum risk of loss amounted to € 1,669k as of February 28, 2018 (2016/17: € 1,499k) and was based on the total loss of all relevant receivables. This amount was derived by multiplying the balance of receivables thereby assigned with the respective liability quota. The company does not generate any gain or loss at the time at which the receivable is assigned. The expenses recognized in the 2017/18 financial year for receivables that were assigned and fully derecognized and that subsequently de-faulted amount to € 244k (2016/17: € 278k). Other receivables and assets mainly consist of receivables in connection with pledged funds, receivables from credit card companies, deferred charges and prepaid expenses, credit notes for goods, bonus agreements, and tax refund claims.
NOTES TO THE CONSOLIDATED FINANCIAL STATEMENTS Notes to Consolidated Balance Sheet 125
As in the previous year, there are no major restrictions on ownership or disposition rights in respect of the receivables and other assets reported. The following tables provide an analysis of the financial assets included under receivables and other assets. Only those receivables for which individual allowances have been recognized have been portrayed as impaired. The HORNBACH Baumarkt AG Group also accounts for credit risks by recognizing portfolio-based allowances.
2.28.2018 € 000s
Carrying amount
of which: neither
impaired nor
overdue
of which: not impaired, but overdue within the following time bands (days)
< 60 61 to 90 91 to 180 > 180
Trade receivables 7,957 4,674 2,278 253 321 107 Receivables from affiliated companies 957 957 Positive fair values of derivative financial instruments 578 578 Other receivables and assets 34,720 31,414 2,409 114 140 161 44,212 37,623 4,687 367 462 268
2.28.2017 € 000s
Carrying amount
of which: neither
impaired nor
overdue
of which: not impaired, but overdue within the following time bands (days)
< 60 61 to 90 91 to 180 > 180
Trade receivables 6,767 2,832 2,523 229 308 0 Receivables from affiliated companies 1,454 1,454 Positive fair values of derivative financial instruments 29 29 Other receivables and assets 31,316 28,738 1,112 99 130 85 39,566 33,054 3,635 328 438 85
There were no indications of impairment at the balance sheet date for financial assets that were neither im-paired not overdue.
126 NOTES TO THE CONSOLIDATED FINANCIAL STATEMENTS Notes to Consolidated Balance Sheet
Allowances for trade receivables and for other receivables and assets developed as follows: € 000s Trade receivables Other receivables and assets 2017/18 2016/17 2017/18 2016/17
Allowances at March 1 689 516 1,976 2,003 Utilization 89 46 58 81 Reversals 190 178 107 215 Additions 610 397 443 269 Foreign currency translation (5) 0 (3) 0 Allowances at February 28 1,015 689 2,251 1,976
The complete retirement of receivables resulted in expenses of € 474k (2016/17: € 572k). The receipt of receiv-ables already derecognized resulted in income of € 32k (2016/17: € 231k).
(19) Cash and cash equivalents 2.28.2018 2.28.2017
€ 000s € 000s
Cash balances at banks 81,551 90,977 Checks and cash on hand 20,586 22,057 102,138 113,033
(20) Non-current assets held for sale This item includes assets which are highly likely to be sold in the coming financial year. In the 2017/18 financial year, one piece of land was reclassified at € 321k out of the "investment property" balance sheet line item and sold at its carrying amount. The piece of land was previously allocated to the "Real estate" segment. In the previous year, no items were reclassified into the "non-current assets held for sale" category.

NOTES TO THE CONSOLIDATED FINANCIAL STATEMENTS Notes to Consolidated Balance Sheet 127
(21) Shareholders' equity The development in the shareholders’ equity of the HORNBACH Baumarkt AG Group is shown in the statement of changes in group equity for the 2016/17 and 2017/18 financial years.
Share capital The Annual General Meeting held on July 7, 2016 resolved the creation of Authorized Capital I and Authorized Capital II in line with the following provisions: The Board of Management is authorized until July 7, 2021, subject to approval by the company’s Supervisory
Board, to increase the company’s share capital by up to € 15,000,000 by means of a single or repeated issue of new shares – ordinary shares with voting rights or non-voting preference shares – in exchange for cash contributions (Authorized Capital I). Shareholders’ subscription rights may be excluded in specified circumstances.
The Board of Management is authorized until July 7, 2021, subject to approval by the company’s Supervisory
Board, to increase the company’s share capital by up to € 30,000,000 by means of a single or repeated issue of new shares – ordinary shares with voting rights or non-voting preference shares – in exchange for cash or non-cash contributions (Authorized Capital II). Shareholders’ subscription rights may be excluded in specified circumstances.
Total authorized capital therefore amounts to € 45,000,000. As in the previous year, this is equivalent to 47.16 % of the current share capital. On the basis of a resolution adopted by the Board of Management on September 4, 2017, the employees of HORNBACH Baumarkt AG and its foreign subsidiaries were offered employee shares at a preferential price of € 21.00 per share. A total of 46,800 shares were acquired via the stock exchange at an average price of € 35.42 and subsequently assigned to employees. An amount of € 57k was recognized in equity to account for the difference between the acquisition price and the stock market price upon the date on which the shares were assigned to employees. The difference per share between the preferential sale price and the stock market price (€ 10.20) was recognized through profit or loss.
WpHG voting right notifications § 21 (1) of the German Securities Trading Act (WpHG) requires shareholders to disclose the fact that their share of voting rights has reached, exceeded, or fallen short of specific disclosure thresholds within four trading days. These thresholds amount to 3 %, 5 %, 10 %, 15 %, 20 %, 25 %, 30 %, 50 %, and 75 %. Similar disclosure obliga-tions are set out in § 25 and § 25a WpHG for the bearers of financial instruments once they reach, exceed, or fall short of the aforementioned disclosure thresholds with the exception of the 3 % threshold. Pursuant to § 26 WpHG, HORNBACH Baumarkt AG is obliged to publish such notifications immediately, and no later than three trading days after receipt. We did not receive or publish any such notifications in the reporting period from March 1, 2017 to February 28, 2018. When applicable, these notifications can be found in the "NEWS" section of the company website at www.hornbach-group.com (filtered by catchword "voting right notification").
Capital reserve The capital reserve includes the equity components generated over and above the par value of the shares issued.

128 NOTES TO THE CONSOLIDATED FINANCIAL STATEMENTS Notes to Consolidated Balance Sheet
Revenue reserves Revenue reserves include the "statutory reserve", "other revenue reserves", and accumulated earnings and equity components recognized directly in equity.
Disclosures concerning capital management The capital management practiced by HORNBACH Baumarkt AG pursues the aim of maintaining a suitable equity base in the long term. The equity ratio is viewed as representing an important key figure for investors, analysts, banks and rating agencies. The company aims on the one hand to achieve the growth targets it has set itself while maintaining healthy financing structures and a stable dividend policy, and on the other hand to achieve long-term improvements in its key rating figures. The capital management instruments deployed include active debt capital management. The company has entered into covenants towards some providers of debt capital which, among other conditions, require it to maintain an equity ratio of at least 25 %. The equity ratio, interest cover, debt/equity ratio and company liquidity (cash and cash equivalents plus available committed credit lines) are monitored monthly as part of the company’s internal risk management. Further key figures are calculated on a quarterly basis. Should the values fall short of certain target levels, then suitable countermeasures are initiated at an early stage. The covenants were complied with at all times during the 2017/18 financial year. The equity ratio amounted to 52.5 % as of February 28, 2018 (2016/17: 51.6 %). No changes were made to the company’s capital management approach in the financial year under report.
(22) Distributable earnings and dividends The distributable amounts involve the unappropriated net profit reported in the balance sheet of HORNBACH Baumarkt AG prepared in accordance with German commercial law. HORNBACH Baumarkt AG concluded the 2017/18 financial year with an annual net surplus of € 14,028,890.30. Following the withdrawal of € 7,599,869.70 from other revenue reserves, the unappropriated net profit amounts to € 21,628,760.00. The Board of Management and the Supervisory Board of HORNBACH Baumarkt AG will propose to the Annual General Meeting that the unappropriated net profit of HORNBACH Baumarkt AG reported as of February 28, 2018 be appropriated as follows:
€
Dividend of € 0.68 on 31,807,000 shares 21,628,760.00 21,628,760.00
By resolution of the Annual General Meeting held on July 6, 2017, a dividend of € 0.68 (2016/17: € 0.68) per share was distributed on a total of 31,807,000 (2016/17: 31,807,000) individual shares in the 2017/18 financial year. The total amount distributed thus amounted to € 21,629k (2016/17: € 21,629k).

NOTES TO THE CONSOLIDATED FINANCIAL STATEMENTS Notes to Consolidated Balance Sheet 129
(23) Financial debt Total current and non-current financial debt is structured as follows: € 000s Maturities Carrying
amount Current
< 1 year Non-current1 to 5 years
Non-current > 5 years
2.28.2018 Total
Bonds 0 248,844 0 248,844 Liabilities to banks 1,001 0 0 1,001 Liabilities in connection with finance leases 10,322 46,045 117,748 174,115 Negative fair values of derivative financial instruments 113 0 0 113 Total 11,435 294,890 117,748 424,072
€ 000s Maturities Carrying
amount Current
< 1 year Non-current1 to 5 years
Non-current > 5 years
2.28.2017 Total
Bonds 0 248,231 0 248,231 Liabilities to banks 16,966 587 0 17,553 Liabilities in connection with finance leases 10,232 44,444 131,057 185,733 Negative fair values of derivative financial instruments 1,378 0 0 1,378 Total 28,575 293,262 131,057 452,895
The HORNBACH Baumarkt AG Group had current financial debt amounting to € 11.4 million at the balance sheet date on February 28, 2018 (2016/17: € 28.6 million). This consists of the portion of long-term financing facilities maturing in the short term, amounting to € 10.9 million (2016/17: € 13.3 million), in the previous year of current financing facilities of € 13.5 million, of liabilities of € 0.1 million relating to the measurement of derivative financial instruments (2016/17: € 1.4 million), and of interest deferrals of € 0.4 million (2016/17: € 0.4 million). HORNBACH Baumarkt AG took up a seven-year corporate bond of € 250 million on February 15, 2013. The bond has an interest coupon of 3.875%. In combination with the issue price of 99.25 %, this results in a yield of 4.00 % p.a. The total costs of € 2,355k arising in connection with the corporate bond and the disagio of € 1,875k have been spread over the term using the effective interest method. The interest of € 372k accrued since the previous bond interest payment date has been recognized in the carrying amount of liabilities to banks (2016/17: € 372k). Alongside the aforementioned bond, the Group has further non-current liabilities, generally secured by mort-gages, to banks.

130 NOTES TO THE CONSOLIDATED FINANCIAL STATEMENTS Notes to Consolidated Balance Sheet
Liabilities to banks, originally of a non-current nature, are structured as follows: 2017/18 financial year Currency Interest
agreement in %
(including swap)
Maturity Amount 2.28.2018
€ 000s
Mortgage loans CZK 5.08 2018 624 624
2016/17 financial year Currency Interest
agreement in %
(including swap)
Maturity Amount 2.28.2017
€ 000s
Mortgage loans EUR 5.57 2017 1,864 CZK 5.08 2018 1,760 3,624
The non-current liability to a bank remaining in the year under report has a fixed interest rate. As of February 28, 2018, the HORNBACH Baumarkt AG Group had total credit lines of € 422.6 million (2016/17: € 339.1 million) on customary market terms. Unutilized credit lines amounted to € 418.1 million (2016/17: € 321.0 million). Furthermore, HORNBACH Baumarkt AG has a credit line for import credits amounting to USD 40.0 million (2016/17: USD 40.0 million). Of this, an amount of USD 9.9 million had been drawn down as of the balance sheet date (2016/17: USD 8.0 million). The credit lines at the HORNBACH Baumarkt AG Group include a syndicated credit line of € 350 million at HORNBACH Baumarkt AG that was agreed on December 22, 2017 and has a five-year term. The credit line may also be drawn down in foreign currencies, particularly CHF, SEK and CZK, up to an amount of € 25 million. Furthermore, supplementary bilateral loan agreements of up to € 70 million may also be concluded within the credit framework (also in foreign currencies). Upon utilization of the credit line, the interest is based on the 3-month or 6-month Euribor, or the equivalent Ibor, plus an interest margin. The applicable interest margin is determined by reference to the company rating granted to HORNBACH Baumarkt AG by an internationally rec-ognized rating agency. Margin premiums apply should the level of utilization exceed specified threshold values. A provision fee dependent on the respective interest margin is charged for the unutilized portion of the credit line. Land charges amounting to € 12.5 million have been provided as security for liabilities to banks (2016/17: € 36.6 million). No assets have been provided as security for the credit lines or the bond. The relevant contractual arrange-ments nevertheless require compliance with customary bank covenants, non-compliance with which could lead to a premature repayment obligation. These regularly involve pari passu clauses and negative pledge declara-tions, as well as cross default arrangements for major financing facilities. In the case of the syndicated credit line, they also require compliance with specific financial ratios. These key financial ratios are based on consol-idated figures at the HORNBACH Baumarkt AG Group and require interest cover of at least 2.25 times and an equity ratio of at least 25 %. Maximum limits for financing facilities secured by land charges and financing facilities taken up by subsidiaries were also agreed. The interest cover, net debt/EBITDA ratio, equity ratio, agreed financing limits, and company liquidity (cash and cash equivalents, plus unutilized committed credit

NOTES TO THE CONSOLIDATED FINANCIAL STATEMENTS Notes to Consolidated Balance Sheet 131
lines) are regularly monitored within the internal risk management framework. Should the values fall short of certain target levels, then countermeasures are initiated at an early stage. All covenants were complied with at all times in the year under report. The transition of future leasing payments for finance leases has been presented in Note 12 "Property, plant and equipment and investment property". The following reconciliation presents the changes in financial liabilities and derivative financial instruments relating to the Group's financing activities.
(24) Pensions and similar obligations As a result of legal requirements in individual countries and individual commitments made to members of its Board of Management, the HORNBACH Baumarkt AG Group has obligations relating to defined benefit and defined contribution pension plans.
Defined contribution plans Apart from payment of contributions, the defined contribution plans do not involve any further obligations on the part of the HORNBACH Baumarkt AG Group. The total of all defined contribution pension expenses amounted to € 53,754k in the 2017/18 financial year (2016/17: € 50,312k). Of this total, an amount of € 29,845k involved the employer’s share of contributions to the state pension scheme in Germany (2016/17: € 29,025k).
Multiemployer defined benefit pension plans Joint pension plans are in place for staff employed in the Netherlands. As the pension providers for these plans do not provide the necessary information in the form required for recognition as defined benefit plans, these plans are recognized as defined contribution plans. Consistent with the requirements of this plan, HORNBACH Baumarkt AG has no obligation to assume liability for the contributions of other employers participating in the plan. No probable material risks have been identified in connection with the multiemployer defined benefit pension plan. The company expects to pay contributions of € 3,827k in the 2018/19 financial year.
Reconciliation pursuant to IAS 7 in € 000s
3.1.2017 Cash-effective changes
of which: interest included in cash
flow from operating activities
Non-cash changes 2.28.2018
Foreign currency
translation
Changes in fair values
Other changes
Bonds 248,231 (9,688) 9,688 0 0 613 248,844 Liabilities to banks 17,553 (16,771) 114 116 0 (11) 1,001 Liabilities in connection with finance leases 185,733 (17,176) 7,764 (2,206) 0 0 174,115 Negative fair values of derivative financial instruments from financing activities 48 (48) 48 0 0 0 0 Financial and similar liabilities 451,565 (43,683) 17,614 (2,090) 0 602 423,959

132 NOTES TO THE CONSOLIDATED FINANCIAL STATEMENTS Notes to Consolidated Balance Sheet
Defined benefit plans Switzerland
The HORNBACH Baumarkt AG Group has one fund-financed pension plan which is financed via an external pension provider. This pension plan exists due to legal requirements in Switzerland (Swiss Occupational Pensions Act - BVG) and grants old-age, invalidity and fatality pensions and payments for 840 beneficiaries. The pension plan offers benefits that exceed the statutory minimum requirements under the BVG legislation. The employee covers around 35 % of the premiums to be paid for the savings balances, as well as further clearly defined costs. The remaining expenses are covered by the employer. Retirement pension contribu-tions are age-dependent and rise with increasing age. Risk and cost premiums are calculated by the insur-ance company on an individual basis and reassessed each year. The actuarial risk in connection with this plan is borne by HORNBACH Baumarkt AG. The pension plan must be fully covered on the basis of a statis-tical evaluation performed in accordance with BVG provisions. In the event of a shortfall, the pension authority is required to take measures such as setting additional employer and employee contributions or payments. The pension provider constitutes a separate legal entity. This is responsible for managing the pension plan and has issued investment regulations defining the respective investment strategy. The highest decision-making body for the pension provider is the Board of Trustees. This consists of an equal number of employer and employee representatives from the companies participating in the plan.
Germany
Since the 2011/12 financial year, HORNBACH Baumarkt AG has undertaken to provide members of its Board of Management with a fund-financed pension plan. This model offers the opportunity of increasing pension claims, while the company simultaneously guarantees a minimum return of 2 % p.a. for members of its Board of Management. The assets contributed by the company or additionally paid in by members of the Board of Management are held in a fiduciary capacity and invested in diversified funds by Allianz Treuhand GmbH, Frankfurt am Main. The funds are invested in line with a capital investment concept jointly defined by HORNBACH Baumarkt AG and Allianz Treuhand GmbH. Provided that amendments to the capital invest-ment concept do not contravene the fiduciary objective, HORNBACH Baumarkt AG is itself entitled to have such amendments made. The risk that the trust assets do not generate the minimum return of 2 % p.a. is borne by HORNBACH Baumarkt AG. The scope of obligation towards plan beneficiaries has been set in each case at a maximum of the fund assets and the present value of contributions paid, including the guaranteed return. To this end, the contributions paid by the employer and by the Board of Management are compared with the fund assets. Furthermore, company employees also have the possibility of participating in a "working time account model". Salary claims can be converted into so-called value credits in line with individual employees' requirements. Directly before the termination of the employment relationship for age-related reasons, these credits can then be used to enable the employee to retire early. Non-disbursed salary claims can be invested in various investment funds in line with the individual employee's risk preference. HORNBACH Baumarkt AG guarantees the value retention of amounts contributed to value credits and thus bears the investment risk. Salary components contributed by the company or employees are managed within a so-called double fiduciary model by Allianz Treuhand GmbH, Frankfurt am Main. Provisions for obligations in connection with working time accounts have been offset as of the balance sheet date against the corresponding cover assets in the form of fund shares.

NOTES TO THE CONSOLIDATED FINANCIAL STATEMENTS Notes to Consolidated Balance Sheet 133
Pensions and similar obligations are structured as follows: 2017/18 2016/17
€ 000s € 000s Present value of pension obligation 65,768 69,593 less fair value of plan assets (54,948) (54,377)Pension commitments as reported in balance sheet 10,820 15,216 of which: pension provisions 10,820 15,216
The plan assets were structured as follows at the balance sheet date: 2.28,2018 2.28,2017 % %
Debt securities 76.8 79.8 Shares 5.1 4.2 Real estate 11.7 11.2 Other 6.5 4.9 100.0 100.0
Change in pension obligation 2017/18 2016/17 € 000s € 000s
Present value of pension obligation at the beginning of the period 69,593 62,643 Current service cost of employer 4,578 5,328 Employee contributions 2,831 2,709 Payments from the plan (2,152) (1,000)Interest cost 384 502 Remeasurement effects because of: Changes in demographic assumptions 0 (2,170)Changes in financial assumptions (5,005) 1,537 From experience adjustments 1,216 (246)
Insurance premiums (1,168) (1,138)Foreign currency translation (4,509) 1,428 Present value of pension obligation at the end of the period 65,768 69,593

134 NOTES TO THE CONSOLIDATED FINANCIAL STATEMENTS Notes to Consolidated Balance Sheet
Change in plan assets 2017/18 2016/17 € 000s € 000s
Plan assets at beginning of period 54,377 48,073 Employer contributions 3,551 3,752 Employee contributions 2,831 2,709 Payments from the plan (2,152) (1,000)Interest income 318 424 Return on plan assets (excluding interest income) 486 584 Insurance premiums (1,168) (1,138)Foreign currency translation (3,294) 974 Plan assets at the end of the period 54,948 54,377
Responsibility for the plan asset investment strategy has been assigned to Allianz Treuhand GmbH for the German plans and to the top management body (Board of Trustees) at the BVG-Sammelstiftung Swiss Life for the Swiss plans. These external asset managers perform portfolio risk management and synchronize the de-velopment in plan assets and pension obligations in line with the conceptual and legal structure of the defined benefit plans. HORNBACH Baumarkt AG analyses the portfolio structure and performance at regular intervals in order to identify any need for action. The expenses for defined benefit plans are presented below. As well as expenses and income recognized through profit or loss under personnel expenses and net financial expenses, these also include plan-related amounts recognized in other comprehensive income within equity. 2017/18 2016/17
€ 000s € 000s
Current service cost of employer 4,578 5,328 Interest cost 384 502 Interest income (318) (424)Effects recognized in P&L 4,645 5,407 Remeasurement effects because of: Changes in demographic assumptions 0 2,170 Changes in financial assumptions 5,005 (1,537)From experience adjustments (1,216) 246
Return on plan assets (excluding interest income) 486 584 Effects recognized in OCI 4,276 1,463 Costs for defined benefit plans 369 3,944

NOTES TO THE CONSOLIDATED FINANCIAL STATEMENTS Notes to Consolidated Balance Sheet 135
The amounts recognized through profit or loss are included in the income statement in the personnel ex-penses for the following functional areas and in net financial expenses: 2017/18 2016/17
€ 000s € 000s
Selling and store expenses 3,293 4,039 Pre-opening expenses 48 0 General and administration expenses 1,237 1,290 Net financial expenses (net interest expenses) 67 79 4,645 5,407
Actuarial assumptions The calculation has been based on the following actuarial assumptions. These vary depending on the country in which the plan is based. 2.28.2018 2.28.2017 Weighted
average Range Weighted
average Range
Discount interest rate 1.1 % 1.0 % to 1.6 % 0.7 % 0.5 % to 1.6 % Future salary increases 1.7 % 1.5 % to 3.0 % 1.7 % 1.5 % to 3.0 % Future pension increases 0.3 % 0.0 % to 2.0 % 0.3 % 0.0 % to 2.0 %
The discount rate used has been determined on the basis of the return on blue-chip fixed-income industrial bonds. The assumptions concerning future mortality rates are based on published statistics and mortality tables. For plans in Germany, reference has been made to the "Heubeck Richttafeln 2005 G". Swiss plans are governed by the "BVG 2015 Generationentafel".
Sensitivity analysis The influence of those actuarial assumptions which, if changed, would materially impact on the measurement of the present value of the pension obligation, has been presented in the following sensitivity analysis. This presents that change in the present value of the pension obligation that would have arisen if different actuarial assumptions had been used as of the balance sheet date. The other parameters influencing the respective values have remained constant. Change in present value of pension obligation: € 000s 2.28.2018 2.28.2017 Increase Decrease Increase Decrease
Discount rate (0.25 basis points change) (2,348) 2,546 (2,741) 2,982 Rate of pension increase (0.10 basis points change) 714 n/a 912 n/a Mortality (+ 1 year) 984 n/a 1,203 n/a
136 NOTES TO THE CONSOLIDATED FINANCIAL STATEMENTS Notes to Consolidated Balance Sheet
Future cash flows Payments of contributions amounting to € 3,471k are expected for the 2018/19 financial year. Expected payments 2.28.2018 € 000s
2018/19 408 2019/20 433 2020/21 496 2021/22 6,213 2022/23 4,027 2023 to 2027 5,192
Expected payments 2.28.2017 € 000s
2017/18 375 2018/19 508 2019/20 519 2020/21 594 2021/22 5,869 2022 to 2026 8,468
(25) Other non-current liabilities Other non-current liabilities mainly involve non-current provisions of € 38,029k (2016/17: € 28,087k). These include provisions of € 14,650k (2016/17: € 12,732k) for contractually assumed structural maintenance obli-gations and personnel provisions of € 11,573k (2016/17: € 10,043k). The rental agreements underlying the maintenance obligations have remaining terms of between 1 and 15 years. The personnel provisions mainly relate to provisions recognized due to statutory requirements in Austria for employees in the event of their leaving the company (severance payments) and to anniversary bonus claims and part-time early retirement obligations. Further information about the severance payment obligation can be found below. Furthermore, this line item also includes provisions for onerous lease arrangements and a provision for the storage of business documents. The lease arrangements for which provisions were recognized have non-terminable remaining terms of between 2 and 13 years. The provision for the storage of business documents chiefly relates to statutory storage periods of between 7 and 11 years. The development in provisions is presented in Note (28). Other non-current liabilities also include accruals of € 7,755k (2016/17: € 8,172k). These mainly relate to incentive payments received in connection with extensions or amendments to real estate rental agreements classified as operating leases. The accruals are being written back in instalments over the non-terminable rental period. Furthermore, this item also includes accruals relating to graduated rental agreements.
Severance payments Upon reaching retirement age (or if their employment is terminated), employees at Austrian subsidiaries are entitled to severance payments provided that they joined the company by December 31, 2002. The level of severance payment entitlement is based on the number of years of service and the most recent level of compensation from the employment relationship. The volume of obligation is reviewed annually and adjusted accordingly on the basis of an external survey. The actuarial risks associated with this plan are borne by HORNBACH Baumarkt AG.

NOTES TO THE CONSOLIDATED FINANCIAL STATEMENTS Notes to Consolidated Balance Sheet 137
Severance payments represent other defined benefit post-employment benefits and are therefore recognized under other non-current liabilities. The provision for severance payments is measured at the present value of the pension obligation.
Change in pension obligation and costs of plan 2017/18 2016/17 € 000s € 000s
Present value of pension obligation at the beginning of the period 5,649 6,061 Current service cost of employer 327 360 Payments from the plan (170) (358)Interest cost 97 98 Remeasurement effects because of: Changes in demographic assumptions 0 38 Changes in financial assumptions 548 (448)From experience adjustments (315) (102)
Present value of pension obligation at the end of the period 6,137 5,649 2017/18 2016/17 € 000s € 000s
Current service cost of employer 327 360 Interest cost 97 98 Effects recognized in P&L 425 458 Remeasurement effects because of: Changes in demographic assumptions 0 (38)Changes in financial assumptions (548) 448 From experience adjustments 315 102
Effects recognized in OCI (234) 512 Total costs for the plan 658 (54)
The average remaining term of the obligation amounts to 13.5 years (2016/17: 14.5 years).
Actuarial assumptions and sensitivity analysis 2.28.2018 2.28.2017
Discount interest rate 1.6 % 1.7 % Future salary increases 3.0 % 2.3 %
The discount rate used has been determined on the basis of the return on blue-chip fixed-income bonds. The biometric calculation has been based on "AVÖ 2008 P – Rechnungsgrundlage für die Pensionsversicherungen". The influence of those actuarial assumptions which, if changed, would materially impact on the measurement of the present value of the pension obligation, has been presented in the following sensitivity analysis. This presents that change in the present value of the pension obligation that would have arisen if different actuarial assumptions had been used as of the balance sheet date. The other parameters influencing the respective values have remained constant.

138 NOTES TO THE CONSOLIDATED FINANCIAL STATEMENTS Notes to Consolidated Balance Sheet
Change in the present value of the pension obligation € 000s 2.28.2018 2.28.2017
Increase Decrease Increase Decrease
Discount rate (0.5 basis points change) -390 429 -380 420 Rate of salary increase (0.25 basis points change) 203 -195 222 -213
(26) Trade payables and other current liabilities
2.28.2018 2.28.2017 € 000s € 000s
Trade payables and advance payments received for orders 269,806 260,262 Liabilities to affiliated companies 472 34 Other liabilities 71,433 66,798 of which: other taxation 23,433 23,008 of which: social security contributions 4,277 4,064
341,711 327,094 Trade payables and other current liabilities have remaining terms of less than one year. Trade payables are secured by reservations of title to the customary extent. Other taxation liabilities include amounts for which the individual group companies are liable. Liabilities for social security contributions particularly include contributions yet to be remitted to the social security funds. In addition to the aforementioned items, other liabilities mainly include deposits and pledged funds, merchan-dise credits not yet redeemed, and amounts due for outstanding invoices.
(27) Income tax receivables and liabilities The receivables and liabilities relating to taxes on income involve current tax liabilities / receivables and taxes for previous financial years. Current income tax provisions are offset against corresponding income tax refund claims, provided that they relate to the same tax jurisdiction and are identical as far as their type and their due date are concerned. Tax provisions for current income taxes mainly relate to corporate income tax (includ-ing the solidarity surcharge) and to trade tax. The income tax receivables mainly relate to prepayments of trade tax. The previous year's figure included a refund claim for corporate tax credits amounting to € 1.7 million which arose due to the "German act on fiscal measures accompanying the introduction of the European Company and amending further tax legislation (SES-tEG)" and the 2010 Annual Tax Act. This claim was settled in the current financial year. Reference is made to the information about deferred taxes included in Note 15 with regard to the deferred tax assets and liabilities recognized under non-current assets and non-current liabilities.

NOTES TO THE CONSOLIDATED FINANCIAL STATEMENTS Other Disclosures 139
(28) Other provisions and accrued liabilities Other provisions and accrued liabilities developed as follows in the 2017/18 financial year:
Miscellaneous other current provisions mainly relate to provisions for onerous contracts, at € 2,565k (2016/17: € 3,914k), for customers' expected utilization of their rights of return, recognized at € 1,500k (2016/17: € 1,554k), and for litigation risks, at € 621k (2016/17: € 730k). Reference is made to Note 25 with regard to details of non-current provisions. The accrued liabilities for personnel obligations primarily relate to outstanding vacation entitlements, em-ployee bonuses, vacation pay, Christmas bonuses, and contributions to employer's liability insurance associ-ations. Miscellaneous accrued liabilities relate in particular to the costs of gas, water, electricity, property duties and advertising, as well as to year-end expenses and legal advisory expenses.
€ 000s Opening balance at
3.1.2017
Utilization Reversals Additions Interest compoundi
ng
Foreign currency
translation
Closing balance at 2.28.2018
of which: non-
current
Other provisions Personnel 10,043 1,367 39 2,819 97 20 11,573 11,573 Miscellaneous 26,246 6,582 1,420 14,741 16 (135) 32,866 26,457 36,289 7,948 1,460 17,559 113 (115) 44,438 38,029 Accrued liabilities Other taxes 1,176 679 61 425 0 (28) 834 0 Personnel 46,133 44,343 793 57,679 0 (238) 58,438 0 Miscellaneous 21,218 16,793 2,802 20,690 0 (157) 22,157 0 68,527 61,815 3,656 78,794 0 (422) 81,430 0 104,816 69,763 5,115 96,354 113 (538) 125,868 38,029

140 NOTES TO THE CONSOLIDATED FINANCIAL STATEMENTS Other Disclosures
Other Disclosures
(29) Guarantees and other commitments As in the previous year, there were no guarantees or other commitments as of February 28, 2018.
(30) Other financial obligations
€ million Maturities 2.28.2018 Current
< 1 year Non-current 1 to 5 years
Non-current > 5 years
Total
Purchase obligations for investments 106.1 11.8 0.0 117.9 Obligations under rental, leasehold and leasing contracts 156.6 463.3 365.1 985.0 Other financial obligations 8.1 0.5 0.0 8.6 270.8 475.6 365.1 1,111.5
€ million Maturities 2.28.2017 Current
< 1 year Non-current 1 to 5 years
Non-current > 5 years
Total
Purchase obligations for investments 90.3 25.3 0.0 115.6 Obligations under rental, leasehold and leasing contracts 152.2 457.4 403.5 1,013.1 Other financial obligations 13.2 0.0 0.0 13.2 255.7 482.7 403.5 1,141.9
HORNBACH Baumarkt AG had agreed a credit line of up to € 50 million with HORNBACH Immobilien AG within the framework of its expansion strategy. The agreement dated June 24, 2013 with a 5-year term was prema-turely rescinded as of August 31, 2017. No funds were drawn down under this agreement. The obligations resulting from rental, hiring, leasehold and leasing contracts relate exclusively to those rental contracts in which the companies of the HORNBACH Baumarkt AG Group do not constitute the economic owners of the rented assets pursuant to IFRS regulations (operating leases). Rental agreements mainly relate to DIY stores in Germany and abroad. The terms of the rental agreements mostly amount to 15 years, with subsequent rental extension options and purchase options at market value. The agreements include rent adjustment clauses. An amount of € 151,918k, excluding ancillary expenses, was recognized in the 2017/18 financial year as rental expenses in connection with operating lease agreements (2016/17: € 151,685k).
(31) Future income from rental and leasing contracts
Future income from rental and leasing contracts is structured as follows:
Rental income from third parties Maturities Total € 000s Current
< 1 year Non-current1 to 5 years
Non-current > 5 years
February 28, 2018 3,689 3,662 351 7,702 February 28, 2017 3,134 4,688 194 8,016

NOTES TO THE CONSOLIDATED FINANCIAL STATEMENTS Other Disclosures 141
Rental income results from the letting of retail real estate. The rental contracts mostly have terms of between 5 and 15 years. Rental income has only been reported for up to one year in the case of rental contracts with indefinite contrac-tual terms.
(32) Legal disputes HORNBACH Baumarkt AG does not anticipate that it or any of its group companies will be involved in current or foreseeable court or arbitration proceedings which could have any material effect on the economic situation of the Group. Moreover, appropriate provisions have been stated at the relevant group companies for any financial charges in connection with other legal or arbitration proceedings. Such charges are therefore not expected to have any material impact on the financial position of the Group.
(33) Supplementary disclosures on financial instruments The following tables show the carrying amounts of the financial instruments in each IAS 39 measurement category, and their fair values broken down by balance sheet category: € 000s Category Carrying
amount Fair value Carrying
amount Fair value
2.28.2018 2.28.2018 2.28.2017 2.28.2017 Assets Financial assets AfS 6,543 6,543 5,659 5,659 Current financial assets LaR 0 0 30,009 30,009 Trade receivables LaR 8,913 8,913 8,221 8,221 Other current and non-current assets Derivatives without hedge relationship FAHfT 578 578 29 29 Other assets LaR 37,367 37,367 33,994 33,994 Cash and cash equivalents LaR 102,138 102,138 113,033 113,033 Equity and liabilities Financial debt Bonds FLAC 248,844 266,080 248,231 272,310 Liabilities to banks FLAC 1,001 1,013 17,553 17,641 Liabilities in connection with finance leases n.a. 174,115 200,354 185,733 215,260 Derivatives with hedge relationship n.a. 0 0 48 48 Derivatives without hedge relationship FLHfT 113 113 1,329 1,329 Trade payables FLAC 253,711 253,711 244,468 244,468 Other current and non-current liabilities FLAC 29,584 29,584 25,538 25,538 Accrued liabilities FLAC 22,156 22,156 21,218 21,218 The interest of € 372k accrued since the previous bond interest payment date has been recognized in the carrying amount of liabilities to banks (2016/17: € 372k). The following items are outside the scope of IFRS 7: other current and non-current assets of € 19,623k (2016/17: € 12,738k), other current and non-current liabilities of € 105,352k (2016/17: € 93,498k), and accrued liabilities of € 59,272k (2016/17: € 47,310k).

142 NOTES TO THE CONSOLIDATED FINANCIAL STATEMENTS Other Disclosures
Aggregate totals by measurement category Category Carrying amount
Carrying amount
€ 000s 2.28.2018 2.28.2017
Loans and receivables LaR 148,418 185,257 Available-for-sale financial assets AfS 6,543 5,659 Financial assets held for trading FAHfT 578 29 Financial liabilities measured at amortized cost FLAC 555,297 557,008 Financial liabilities held for trading FLHfT 113 1,329
Cash and cash equivalents, trade receivables, other assets, accrued liabilities, trade payables, and other liabilities mature in the short term in the majority of cases. Their carrying amounts therefore basically corre-spond to their fair values as of the balance sheet date. Available for sale financial assets include shareholdings recognized at cost due to the lack of an available fair value. One exception relates to a ten-percent company shareholding in HORNBACH Immobilien H.K. s.r.o., Czech Republic. This company lets out several DIY store properties and is not publicly listed. Its fair value has largely been determined by reference to Level 3 input data. To calculate the fair value, application was made of the discounted cash flow method. To this end, the cash flows resulting from company-specific planning were dis-counted by a risk-adjusted interest rate (WACC). In the 2017/18 financial year, the discount rate amounted to 5.7 % after taxes (2016/17: 5.6 %). Furthermore, account was taken of a growth factor of 1.0 %. The cash flows derived from company-specific planning mainly result from rental income within long-term letting arrangements and cash flows relating to the company’s operations. The development in the available for sale financial assets measured at fair value on the basis of Level 3 input data is presented below. Changes in financial assets level 3 input data 2017/18 2016/17
As of March 1 5,658 3,870 Change in valuation (OCI) 883 1,788 Balance at February 28 6,541 5,658
The increase in the amount recognized for the investment is chiefly due to the reduction in financial debt and the change in the CZK/EUR exchange rate. The changes in fair value resulting from changes in the most important input factors at the respective reporting date are presented in the following sensitivity analysis. € 000s 2.28.2018 2.28.2017 Increase Decrease Increase Decrease
Rent (5 % change) 903 (903) 853 (853) Discount rate (50 basis point change) (1,038) 1,288 (990) 1,232
Derivative financial instruments include foreign currency items for outstanding orders and measurement items for outstanding forward exchange transactions. Their fair value measurement has been based on customary valuation models (e.g. discounted cash flow method) by reference to interest and foreign exchange curves available on the market and with congruent terms, and thus corresponding to Level 2 input factors in the fair value hierarchy. The fair values of fixed-interest liabilities to banks and of finance leases have been measured by analogy. The credit risk for the aforementioned financial instruments has been accounted for by reference to risk premiums available on the market.

NOTES TO THE CONSOLIDATED FINANCIAL STATEMENTS Other Disclosures 143
The fair value of the publicly listed bond corresponds to the nominal value multiplied by the market value at the balance sheet date. The fair value has thus been determined by reference to Level 1 data in the fair value hierarchy. The following financial instruments whose measurement has been based on fair value hierarchy input data have been recognized at fair value in the balance sheet or the notes: € 000s 2.28.2018 2.28.2017 Assets Valuation based on level 2 input data Derivatives without hedge relationship FAHfT 578 29
Valuation based on level 3 input data Financial assets AfS 6,541 5,658
Liabilities Valuation based on level 1 input data Bonds FLAC 266,080 272,310
Valuation based on level 2 input data Liabilities to banks FLAC 1,013 17,641 Liabilities in connection with finance leases n.a. 200,354 215,260 Derivatives with hedge relationship n.a. 0 48 Derivatives without hedge relationship FLHfT 113 1,329
The following net results have been recognized in the income statement: Net result by measurement category 2017/18 2016/17 € 000s € 000s
Loans and receivables (LaR) (6,177) 878 Financial instruments held for trading (FAHfT and FLHfT) 85 (1,055) Financial liabilities measured at amortized cost (FLAC) 812 34
The net results of the measurement category "financial instruments held for trading" are attributable to derivative financial instruments. The net results of the measurement categories "loans and receivables", and "financial liabilities measured at amortized cost" involve foreign currency translation items, the results of disposals and write-downs. Furthermore, in the 2017/18 financial year measurement changes of € 883k relating to "available-for-sale financial assets" were recognized directly in equity (2016/17: € 1,788k). No financial instruments are reported on a net basis in the balance sheet. Supplementary arrangements permitting the economic netting of recognized financial instruments exist for forward exchange transactions concluded by the Group. These are governed by the German Master Agreement for Financial Derivative Trans-actions. The Group currently does not have any forward exchange transactions that are eligible for netting. In the previous year, the Group had forward exchange transactions of € 29k that were eligible for netting.

144 NOTES TO THE CONSOLIDATED FINANCIAL STATEMENTS Other Disclosures
(34) Risk management and financial derivatives
Risk management principles The assets, liabilities and planned financial transactions of the HORNBACH Baumarkt AG Group are subject in particular to risks resulting from changes in exchange rates and interest rates. The aim of the company’s risk management is therefore to minimize these market risks by means of suitable financial market-based hedging activities. To achieve this aim, derivative financial instruments are deployed to limit interest rate and foreign currency risks. In general, however, the company only hedges those risks which could impact materially on its financial result. The necessary decisions may only be taken on the basis of the strategic requirements determined by the Chief Financial Officer. These requirements focus on hedging interest rate and foreign currency risks. Moreover, these requirements do not permit financial transactions to be undertaken for speculative purposes. Furthermore, certain transactions also require prior approval by the Supervisory Board. The Treasury department regularly reviews and monitors the current and future interest charge and the foreign exchange requirements of the overall Group. The Board of Management is informed of its findings on a regular basis.
Market risks For the presentation of market risks, IFRS 7.40 “Financial Instruments: Disclosures” requires the hypothetical impact on profit and loss and equity which would have resulted if those changes in the relevant risk variables (e.g. market interest rates or exchange rates) which could reasonably be assumed to be possible at the balance sheet date had actually materialized to be presented on the basis of sensitivity analyses. The market risks faced by the HORNBACH Baumarkt AG Group consist of foreign currency risks and interest rate risks. The com-pany does not face any other price risks.
Foreign currency risks Foreign currency risks, i.e. potential reductions in the value of a financial instrument or future cash flow due to changes in foreign exchange rates, particularly apply wherever monetary financial instruments, such as receivables or liabilities, exist in a currency other than the local currency of the company, or will exist in the scheduled course of business. The foreign currency risks of the HORNBACH Baumarkt AG Group mainly result from financing measures and from the company’s business operations. Exchange rate differences arising from the translation of financial statements into the group currency do not constitute a foreign currency risk as defined by IFRS 7. In cases where long-term financing requirements are involved, the group companies are largely financed by means of external financing measures denominated in the functional currency of the corresponding group company (natural hedging). Moreover, there are also intra-group loans denominated in euros, thus resulting in foreign currency risks at those group companies which have a functional currency other than the euro. These risks are basically not hedged. The foreign currency risks faced by the HORNBACH Baumarkt AG Group in its business operations mainly relate to the purchase of goods in the Far East using US dollars and from intragroup supplies and services, which are basically handled in euros. The US dollar currency risk is hedged with fixed deposits denominated in US dollars and forward exchange transactions. Including hedging measures, the Group had the following main foreign currency items open as of the balance sheet date:

NOTES TO THE CONSOLIDATED FINANCIAL STATEMENTS Other Disclosures 145
€ 000s 2.28.2018 2.28.2017
EUR (69,489) (47,083)USD 3,214 17,324 CZK (518) (627)
The above EUR currency position results from the following currency pairs: CHF/EUR € -29,332k (2016/17: € 5,991k), RON/EUR € -16,764k (2016/17: € -18,758k), SEK/EUR € -15,622k (2016/17: € -23,201k), CZK/EUR € -7,769k (2016/17: € -10,116k), and USD/EUR € 0k (2016/17: € -999k). The most important exchange rates have been presented under "Foreign currency translation". In the sensitivity analysis provided below for foreign currency risks, it has been assumed that the foreign currency holdings as of the balance sheet date are representative of the financial year as a whole. If the euro had appreciated by 10 % compared with the Group’s other main currencies at the balance sheet date, and all other variables had remained unchanged, consolidated earnings before taxes would have been € 7,340k lower (2016/17: € 6,206k). Conversely, if the euro had depreciated by 10 % compared with the Group’s other main currencies at the balance sheet date, and all other variables had remained unchanged, then consolidated earnings before taxes would have been € 7,340k higher (2016/17: € 6,206k). The hypothet-ical impact on earnings of € +7,340k (2016/17: € +6,206k) is the result of the following sensitivities: EUR/CHF € 2,998k (2016/17: € -589k), EUR/RON € 1,702k (2016/17: € 1,888k), EUR/SEK € 1,614k (2016/17: € 2,327k), EUR/CZK € 706k (2016/17: € 948k), and EUR/USD € 320k (2016/17: € 1,632k).
Interest rate risks At the end of the year, the Group was principally financed by a euro bond with a nominal total of € 250,000k. Furthermore, the Group also had CZK loans amounting to € 624k (2016/17: € 1,760k). At the end of the 2017/18 financial year, the Group did not have any short-term or long-term euro loans (2016/17: € 1,864k) or current liabilities to banks (2016/17: € 13,541k). In the sensitivity analysis for interest rate risks, it has been assumed that the volumes as of the balance sheet date are representative of the financial year as a whole. A parallel shift in the interest rate curve has been assumed. If the market interest rate had been 100 base points higher at the balance sheet date, and all other variables had remained unchanged, then consolidated earnings before taxes would have been € 814k higher (2016/17: € 774k) and equity before deferred taxes would have been € 0k higher (2016/17: € 5k). Due to the low level of interest rates currently, a parallel shift in the interest rate curve by 100 base points downwards in some cases produces negative interest rates. This severely limits the meaningfulness of any such simulation. For the cur-rent financial year, the company has therefore rather simulated the hypothetical impact on earnings of a shift in the interest rate curve by 10 base points downwards. If the market interest rate had been 10 base points lower at the balance sheet date, and all other variables had remained unchanged, then consolidated earnings before taxes would have been € 82k lower (2016/17: € 78k) and equity before deferred taxes would have been € 0k lower (2016/17: € 0k).

146 NOTES TO THE CONSOLIDATED FINANCIAL STATEMENTS Other Disclosures
Credit risk Credit risk involves the risk that a contractual party is unable to comply in part or in full with the obligations entered into upon the conclusion of a financial instrument. The credit risk of the Group is strictly limited to the extent that financial assets and derivative financial instruments are as far as possible only concluded with contractual parties of good credit standing. Moreover, transactions with individual contractual partners are subject to a maximum limit. The risk of receivables default in the operating business is already considerably reduced on account of the retail format (cash & carry). The maximum credit risk is basically equivalent to the carrying amounts of the financial assets, which do not include any material risk clusters.
Liquidity risk The following tables show the contractually agreed (undiscounted) outflows of cash for primary and derivative financial liabilities: € 000s Carrying
amount Cash outflows
2.28.2018 < 1 year 1 to 5 years > 5 years
Primary financial liabilities Bonds 248,844 9,688 259,714 0 Liabilities to banks 1,001 636 0 0 Liabilities in connection with finance leases 174,115 17,565 70,260 138,693 Trade payables 253,711 253,711 0 0 Other current and non-current liabilities 29,584 28,433 1,152 0 Accrued liabilities 22,156 22,156 0 0 729,412 332,188 331,126 138,693 Derivative financial liabilities Foreign currency derivatives without hedge relationship 113 113 0 0 113 113 0 0 Derivative financial assets Foreign currency derivatives without hedge relationship 578 3,202 0 0 578 3,202 0 0 335,503 331,126 138,693

NOTES TO THE CONSOLIDATED FINANCIAL STATEMENTS Other Disclosures 147
€ 000s Carrying amount
Cash outflows
2.28.2017 < 1 year 1 to 5 years > 5 years
Primary financial liabilities Bonds 248,231 9,688 269,401 0 Liabilities to banks 17,553 16,651 598 0 Liabilities in connection with finance leases 185,733 18,004 70,806 157,475 Trade payables 244,468 244,468 0 0 Other current and non-current liabilities 25,538 25,386 152 0 Accrued liabilities 21,218 21,218 0 0 742,741 335,414 340,957 157,475 Derivative financial liabilities Foreign currency derivatives without hedge relationship 1,329 10,749 0 0 Interest derivatives in connection with cash flow hedges 48 48 0 0 1,378 10,796 0 0 Derivative financial assets Foreign currency derivatives without hedge relationship 29 5,627 0 0 29 5,627 0 0 351,837 340,957 157,475
All financial liabilities held at the balance sheet date have been included. No account has been taken of budget figures for future new liabilities. Furthermore, the presentation includes financial assets that will lead to an outflow of cash. Floating-rate interest payments were calculated on the basis of interest rates valid at the balance sheet date. Liabilities denominated in foreign currencies were translated at the relevant reporting date rate. The interest of € 372k accrued since the previous bond interest payment date has been recognized in the carrying amount of liabilities to banks (2016/17: € 372k). The corresponding outflows of cash have been recognized in the bond line item. With regard to the management of liquidity risk, reference is made to Note (23) and to the disclosures on the financial situation in the management report.
Hedging measures Hedging transactions serve to hedge the interest rate and foreign currency risks associated with an underlying transaction (hedged item).
Cash flow hedge – interest rate risk The interest swaps reported as of the end of the 2016/17 financial year expired on schedule as of September 30, 2017.
Other hedging measures – foreign currency risks The HORNBACH Baumarkt AG Group also deploys hedging measures which do not meet the hedge accounting requirements set out in IAS 39, but which nevertheless make an effective contribution towards hedging the Group’s financial risks in line with its risk management principles. For example, the HORNBACH Baumarkt AG Group hedges the foreign currency risks involved in select (planned) transactions, including the embedded

148 NOTES TO THE CONSOLIDATED FINANCIAL STATEMENTS Other Disclosures
foreign currency derivatives potentially resulting from the transactions, such as those involved in the purchase of merchandise in the Far East using US dollars, by concluding forward exchange transactions or making fixed deposit investments denominated in foreign currencies in the form of macro hedges. The fair value of forward exchange transactions, including embedded forward exchange transactions, amounts to € 465k (2016/17: € -1,300k). Of this total, € 578k has been recognized under other assets (2016/17: € 29k) and € -113k under financial debt (2016/17: € -1,329k). No fair value hedges or net investment in a foreign operation hedges have been undertaken to date.
Derivatives The following table provides an overview of the nominal and fair values of derivative financial instruments as of the balance sheet date. The values of opposing transactions, such as foreign exchange purchases or sales, have been shown on a net basis. Nominal value totals are shown in the nominal value line without offsetting any opposing transactions.
2.28.2017 Forward
exchange transactions
Embedded forward exchange
transactions
Interest swaps Total
Nominal value in € 000s 17,000 37,182 1,864 56,046 Fair value in € 000s (before deferred taxes)
(64) (1,236) (48) (1,348)
2.28.2018 Forward exchange
transactions
Embedded forward exchange
transactions
Interest swaps Total
Nominal value in € 000s 4,000 29,469 0 33,469 Fair value in € 000s (before deferred taxes)
65 400 0 465

NOTES TO THE CONSOLIDATED FINANCIAL STATEMENTS Other Disclosures 149
(35) Sundry disclosures
Employees The average number of employees was as follows: 2017/18 2016/17
Salaried employees 17,608 16,997 Trainees 858 836 18,466 17,833 of which: part-time employees 5,313 4,981
In terms of geographical regions, 10,440 of the average workforce were employed in Germany during the 2017/18 financial year (2016/17: 10,280) and 8,026 in other European countries (2016/17: 7,553).
Auditor's fee The fees charged by the auditor of the annual and consolidated financial statements of HORNBACH Baumarkt AG, KPMG AG Wirtschaftsprüfungsgesellschaft, Frankfurt am Main, for the year under report were as follows: 2017/18 2016/17 € 000s € 000s
Auditing of financial statements 589 508 Other certification services 7 7 Tax advisory services 27 44 Other services 0 6 624 565
The annual and consolidated financial statements of HORNBACH Baumarkt AG have been audited by KPMG AG Wirtschaftsprüfungsgesellschaft, Frankfurt am Main, since the 1997/98 financial year. Lars Betram (partner) has been the responsible auditor since the 2017/18 financial year.
Information on the German Corporate Governance Code The annual Declaration of Conformity with the German Corporate Governance Code required by § 161 of the German Stock Corporation Act (AktG) was submitted by the Board of Management and Supervisory Board of HORNBACH Baumarkt AG in December 2017 and made available to shareholders on the company’s homepage.

150 NOTES TO THE CONSOLIDATED FINANCIAL STATEMENTS Other Disclosures
(36) Related party disclosures In addition to the subsidiaries included in the consolidated financial statements, HORNBACH Baumarkt AG has direct or indirect relationships with associated companies in the course of its customary business activities. These include the parent company HORNBACH Holding AG & Co. KGaA and its direct and indirect subsidiaries.
The associated companies are: Hornbach Familien-Treuhandgesellschaft mbH HORNBACH Management AG
Parent company HORNBACH Holding AG & Co. KGaA
Associates HORNBACH Immobilien AG HORNBACH Baustoff Union GmbH
Subsidiaries and second-tier subsidiaries of associates Union Bauzentrum Hornbach GmbH Ruhland-Kallenborn & Co. GmbH Ruhland-Kallenborn Grundstücksverwaltungsgesellschaft mbH Robert Röhlinger GmbH Etablissements Camille Holtz et Cie S.a. Saar-Lor Immobilière S.C.I. HORNBACH Baustoff Union Grundstücksentwicklungs GmbH HIAG Immobilien Jota GmbH HIAG Fastigheter i Göteborg AB HIAG Fastigheter i Helsingborg AB HIAG Fastigheter i Stockholm AB HIAG Fastigheter i Göteborg Syd AB HIAG Fastigheter i Botkyrka AB HO Immobilien Omega GmbH HR Immobilien Rho GmbH HC Immobilien Chi GmbH HM Immobilien My GmbH HORNBACH Real Estate Nederland B.V. HORNBACH Immobilien HK s.r.o. HORNBACH Immobilien SK-BW s.r.o. HORNBACH Imobiliare SRL HB Immobilien Bad Fischau GmbH

NOTES TO THE CONSOLIDATED FINANCIAL STATEMENTS Other Disclosures 151
The following principal transactions were performed with associates: 2017/18 2016/17 € 000s € 000s
Rent and ancillary costs for rented DIY stores with garden centers and other real estate 76,903 76,290 Interest charge for group financing 45 50 Interest income for group financing 75 150 Allocations paid for administration expenses 925 897 Allocations received for administration expenses 2,552 2,292 Supplies and deliveries to HORNBACH Holding AG & Co. KGaA and its subsidiaries 176 195 Supplies and deliveries by HORNBACH Holding AG & Co. KGaA and its subsidiaries 317 680
At February 28, 2018, there were receivables of € 957k (2016/17: € 1,454k) and liabilities of € 472k (2016/17: € 34k) due to HORNBACH Holding AG & Co. KGaA and its subsidiaries. All transactions are undertaken at normal market prices and with customary delivery conditions. HORNBACH Holding AG & Co. KGaA has provided guarantee declarations for liabilities at the HORNBACH Bau-markt AG Group amounting to € 9,012k (2016/17: € 10,022k). Guarantee fees of € 45k (2016/17: € 50k) were recognized as expenses at the HORNBACH Baumarkt AG Group in this respect during the year under report. Some of the companies included in the consolidated financial statements of HORNBACH Baumarkt AG make use of Kurhaus Trifels Seminarhotel GmbH, Annweiler am Trifels, for seminars and conferences. This company is represented by its managing director, Bettina Hornbach, wife of Albrecht Hornbach. Services of € 6k were performed by the seminar hotel in the 2017/18 financial year (2016/17: € 13k). These services were invoiced at customary rates. As in the previous year, liabilities of € 0k were outstanding at the balance sheet date on February 28, 2018.
(37) Events after the balance sheet date The consolidated financial statements of HORNBACH Baumarkt AG for the 2017/18 financial year were ap-proved for publication by the Board of Management on May 14, 2018.

152 NOTES TO THE CONSOLIDATED FINANCIAL STATEMENTS Other Disclosures
(38) Supervisory Board and Board of Management Members of the Board of Management: Steffen Hornbach Chairman (CEO) Strategic Development, Operative Store Management, First appointed: February 1, 1992 Sales and Services Chairman since November 1, 2001 Appointed until: August 26, 2022 Roland Pelka Deputy Chairman Finance, Accounting, Tax, Controlling, Risk Management, First appointed: October 1, 1996 Loss Prevention, Group Communications Dep. Chairman since December 16, 2008 Appointed until: September 30, 2021 Susanne Jäger First appointed: December 1, 2006 Procurement, Imports, Store Planning, Store Development, Appointed until: November 30, 2021 Quality Assurance, Environmental Issues Wolfger Ketzler First appointed: March 1, 2012 Labor Director Appointed until: February 28, 2022 Personnel, Real Estate, Construction, Technical Procurement, Internal Audit, Legal, Compliance Karsten Kühn First appointed: October 1, 2014 Marketing, Market Research, Internal Communications Appointed until: September 30, 2019 Ingo Leiner First appointed: March 1, 2012 Logistics Appointed until: February 28, 2022 Dr. Andreas Schobert First appointed: January 1, 2015 Technology Appointed until: December 31, 2022 Compensation of the Board of Management for the 2017/18 financial year totals € 5,535k (2016/17: € 5,687k). Of this, € 2,828k (2016/17: € 2,805k) relates to fixed compensation and € 2,707k (2016/17: € 2,882k) to performance-related components. Post-employment benefits (pension provision endowment) of € 663k were incurred for active Board members in the 2017/18 financial year (2016/17: € 663k). Pension provisions for former members of the Board of Management amounted to € 1,246k in the 2017/18 financial year (2016/17: € 1,268k). All pension provisions are offset by corresponding value credits (Note 11). Based on a shareholder resolution for a limited period up to and including the 2020/21 financial year, individ-ualized disclosure of the compensation of members of the Board of Management has been waived.

NOTES TO THE CONSOLIDATED FINANCIAL STATEMENTS Other Disclosures 153
Members of the Supervisory Board: As representatives of the shareholders Albrecht Hornbach Chairman CEO Member since: April 25, 2002 HORNBACH Management AG Chairman since: March 1, 2009 Appointed until: end of 2018 AGM Dr. Wolfgang Rupf Further Deputy Chairman Managing Partner, Rupf Industries GmbH, Member since: August 27, 1998 Rupf Engineering GmbH, and Rupf ATG Casting GmbH Appointed until: end of 2018 AGM Dr. John Feldmann Member since: July 4, 2013 Supervisory Board Chairman of KION Group AG Appointed until: end of 2018 AGM Former Executive Board member at BASF SE Erich Harsch Member since: July 4, 2013 CEO Appointed until: end of 2018 AGM dm-drogerie markt GmbH & Co. KG Georg Hornbach Member since: July 9, 2015 Head of Controlling Department and Head of Finance and Procurement Department
Appointed until: end of 2018 AGM
Universtitätsklinikum Köln Martin Hornbach Member since: July 13, 2006 Managing Partner Appointed until: end of 2018 AGM Corivus Gruppe GmbH Joerg Walter Sost Member since: March 1, 2012 Managing Partner Appointed until: end of 2018 AGM J.S. Consulting GmbH Prof. Dr.-Ing. Jens P. Wulfsberg Member since: September 1, 2005 Professor of Production Technology Appointed until: end of 2018 AGM Helmut-Schmidt-Universität/Universität der Bundeswehr Hamburg

154 NOTES TO THE CONSOLIDATED FINANCIAL STATEMENTS Other Disclosures
As representatives of the employees Kay Strelow Deputy Chairman Section Manager, for trade unions Berlin-Marzahn Store Member since: July 10, 2008 Appointed until: end of 2018 AGM Monika Di Silvestre (since April 5, 2017) for trade unions State Retail Section Head at ver.di Member since: April 5, 2017 Rheinland-Pfalz-Saarland Appointed until: end of 2018 AGM Mohamed Elaouch for salaried employees Section Manager, Mainz Store Member since: July 4, 2013 Appointed until: end of 2018 AGM Martin Fischer for salaried employees Professional Customer Advisor, Kempten Store Member since: July 4, 2013 Appointed until: end of 2018 AGM Christian Garrecht for salaried employees Operative Head of Workplace Safety Member since: July 4, 2013 and Fire Prevention Appointed until: end of 2018 AGM Kerstin Holfert for salaried employees Section Manager, Dresden Store Member since: July 4, 2013 Appointed until: end of 2018 AGM Hans Kroha († April 5, 2017) for trade unions State Retail Section Head at ver.di Rheinland-Pfalz-Saarland
Member from July 4, 2013 until April 5, 2017
Brigitte Mauer for salaried employees Section Manager, Tübingen Store Member since: July 4, 2013 Appointed until: end of 2018 AGM Michael Reiland for senior employees Sales Director at HORNBACH Compact Member since: July 4, 2013 Appointed until: end of 2018 AGM The total compensation of the Supervisory Board for the 2017/18 financial year amounted to € 515k (2016/17: € 515k). Of this sum, € 390k (2016/17: € 390k) related to basic compensation and € 125k (2016/17: € 125k) to committee activities.

NOTES TO THE CONSOLIDATED FINANCIAL STATEMENTS Other Disclosures 155
Mandates in supervisory boards and other control bodies (Disclosures pursuant to § 285 Number 10 HGB)
Members of the Supervisory Board a) Membership of statutory supervisory boards b) Membership of comparable control bodies Albrecht Hornbach a) HORNBACH Immobilien AG (Chairman) b) Rheinland-Pfalz Bank (Member of Advisory Board until December 2017) Dr. Wolfgang Rupf a) HORNBACH Holding AG & Co. KGaA (Chairman) HORNBACH Management AG (Chairman) IVA Valuation & Advisory AG (Deputy Chairman) b) Inception Exploration Ltd. (Member of Board)
Monika Di Silvestre (since April 5, 2017) a) WASGAU Produktions & Handels AG
Dr. John Feldmann a) HORNBACH Holding AG & Co. KGaA HORNBACH Management AG KION Group AG (Chairman) Erich Harsch a) HORNBACH Holding AG & Co. KGaA HORNBACH Management AG b) dm drogerie markt GmbH, Wals/Austria (since February 2018)
Georg Hornbach a) HORNBACH Management AG b) Evangelisches Klinikum Köln Weyertal GmbH (Supervisory Board member since February 2018) Martin Hornbach a) Corivus AG (Chairman) HORNBACH Holding AG & Co. KGaA (Deputy Chairman) b) Corivus Swiss AG (Chairman of Administrative Board) Hans Kroha († April 5, 2017) a) WASGAU Produktions & Handels AG
156 NOTES TO THE CONSOLIDATED FINANCIAL STATEMENTS Other Disclosures
Joerg Walter Sost a) DUOPLAST AG (Chairman since May 2017) HORNBACH Holding AG & Co. KGaA HORNBACH Management AG b) Atreus GmbH (Member of Advisory Board) Bürger GmbH (Chairman of Advisory Board) DUOPLAST Holding GmbH (Chairman of Advisory Board) ECF GmbH (Chairman of Advisory Board) Leuna Tenside Holding GmbH (Chairman of Advisory Board since March 2017) Norafin Industries GmbH (Chairman of Advisory Board) VR Equitypartner GmbH (Chairman of Advisory Board) Weisshaar GmbH (Member of Advisory Board until March 2017) ZT Management Holding GmbH (Member of Advisory Board until January 2018) Prof. Dr.-Ing. Jens P. Wulfsberg a) HORNBACH Management AG
Members of the Board of Management a) Membership of statutory supervisory boards b) Membership of comparable control bodies Steffen Hornbach a) HORNBACH Immobilien AG (until August 2017) Roland Pelka a) HORNBACH Immobilien AG (Deputy Chairman) WASGAU Produktions & Handels AG b) Commerzbank AG (Member of Regional Advisory Board, Central Region) Susanne Jäger a) VR Bank Südliche Weinstraße-Wasgau eG Wolfger Ketzler a) HORNBACH Immobilien AG (since August 2017) Med 360° AG (Chairman)

NOTES TO THE CONSOLIDATED FINANCIAL STATEMENTS 157
Bornheim bei Landau/Pfalz, May 14, 2018 HORNBACH Baumarkt AG The Board of Management Steffen Hornbach Roland Pelka Susanne Jäger Wolfger Ketzler Karsten Kühn Ingo Leiner Dr. Andreas Schobert

158 RESPONSIBILITY STATEMENT (BALANCE SHEET OATH)
RESPONSIBILITY STATEMENT (BALANCE SHEET OATH) We hereby affirm that, to the best of our knowledge, the consolidated financial statements give a true and fair picture of the assets, liabilities, financial position and results of operations of the Group in accordance with the applicable reporting principles, and the group management report includes a fair review of the develop-ment and performance of the business and the position of the Group, together with a description of the prin-cipal opportunities and risks associated with the expected development of the Group. Bornheim bei Landau/Pfalz, May 14, 2018 HORNBACH Baumarkt Aktiengesellschaft The Board of Management Steffen Hornbach Roland Pelka Susanne Jäger Wolfger Ketzler Karsten Kühn Ingo Leiner Dr. Andreas Schobert

AUDITOR'S REPORT Report on the Audit of the Consolidated Financial Statements and the Combined Management Report 159
AUDITOR'S REPORT To HORNBACH Baumarkt AG, Bornheim bei Landau/Pfalz
Report on the Audit of the Consolidated Financial State-ments and the Combined Management Report
Audit Opinions
We have audited the consolidated financial statements of HORNBACH Baumarkt AG, Bornheim bei Lan-dau/Pfalz, and its subsidiaries (the Group), comprising the balance sheet as of February 28, 2018, income statement, statement of comprehensive income, statement of changes in equity, and cash flow statement for the financial year from March 1, 2017 to February 28, 2018, and the notes to the consolidated financial state-ments, including the summary of significant accounting policies. Furthermore we audited the combined man-agement report for the financial year from March 1, 2017 to February 28, 2018. In our opinion, on the basis of the knowledge obtained in the audit: the accompanying consolidated financial statements comply in all material respects with IFRS as
adopted by the EU and the additional requirements of German commercial law pursuant to § 315e (1) HGB (Handelsgesetzbuch - German Commercial Code) and, in compliance with these requirements, give a true and fair view of the assets and financial position of the Group as of February 28, 2018, and of its fi-nancial performance for the financial year from March 1, 2017 to February 28, 2018, and
the accompanying combined management report as a whole provides an appropriate view of the Group's
position. In all material respects, this combined management report is consistent with the consolidated financial statements, complies with German legal requirements and appropriately presents the opportuni-ties and risks of future development.
Pursuant to § 322 (3) Sentence 1 HGB, we declare that our audit has not led to any reservations relating to the legal compliance of the consolidated financial statements and the combined management report.
Basis for the Audit Opinions
We conducted our audit of the consolidated financial statements and of the combined management report in accordance with § 317 HGB and the EU Audit Regulation (No. 537/2014; hereinafter "EU-APrVO") and in compliance with German Generally Accepted Standards for Financial Statement Audits promulgated by the Institut der Wirtschaftsprüfer (Institute of Public Auditors in Germany - IDW). Our responsibilities under those requirements and principles are further described in the "Auditor's Responsibilities for the Audit of the Con-solidated Financial Statements and of the Combined Management Report" section of our auditor's report. We are independent of the group entities in accordance with the requirements of European law and German commercial and professional law, and we have fulfilled our other German professional responsibilities in ac-

160 AUDITOR'S REPORT Report on the Audit of the Consolidated Financial Statements and the Combined Management Report
cordance with these requirements. In addition, in accordance with Article 10 (2) Point f) EU-APrVO, we de-clare that we have not provided any non-audit services prohibited under Article 5 (1) EU-APrVO. We believe that the audit evidence we have obtained is sufficient and appropriate to provide a basis for our audit opin-ions on the consolidated financial statements and on the combined management report.
Key Audit Matters in the Audit of the Consolidated Financial Statements
Key audit matters are those matters that, in our professional judgement, were of most significance in our au-dit of the consolidated financial statements for the financial year from March 1, 2017 to February 28, 2018. These matters were addressed in the context of our audit of the consolidated financial statements as a whole, and in forming our audit opinion thereon we do not provide a separate audit opinion on these matters.
Measurement of inventories Information about the accounting policies applied can be found in the "Accounting policies/General princi-ples" and "Accounting policies/Inventories" chapters of the notes to the consolidated financial statements.
THE RISK FOR FINANCIAL REPORTING Inventories of € 657.8 million have been recognized in the balance sheet as of February 28, 2018. This figure includes impairments of € 9.6 million. Inventories, which require initial measurement at cost (including incidental acquisition costs and purchase price reductions) must be written down when they are damaged, fully or partly obsolete, or when their ex-pected net realizable value no longer covers their cost of acquisition. The calculation of net realizable value as the maximum value permitted is subject to discretionary decisions and in some cases requires forward-looking estimates concerning the amounts which can most likely be gen-erated upon the sale of the inventories. There is the risk that, due to the failure to recognize an impairment requirement, the inventories are overvalued.
OUR AUDIT APPROACH Based on the understanding we gained of the relevant processes, we initially assessed the structure, estab-lishment, and functionality of those internal controls identified with regard to the correct calculation of net realizable values. We then performed a critical assessment of the methodology applied by the company to calculate age-related write-downs of inventories. We assessed the days-on-inventory analyses of the company and referred to his-torical empirical values at the company to appraise whether the write-downs recognized were adequate. Fur-thermore, we convinced ourselves of the arithmetical correctness of the calculation. We then assessed the sale prices used when calculating the net realizable values by selecting specific ele-ments on a risk-oriented basis and referring to sale prices valid as of the balance sheet date. In a further step, we convinced ourselves that the impairments recognized by the company due to reductions in sale prices had been correctly stated.
OUR CONCLUSIONS The assumptions underlying the calculation of net realizable values are appropriate, as were the discretion-ary decisions taken by the company's legal representatives in this respect.

AUDITOR'S REPORT Report on the Audit of the Consolidated Financial Statements and the Combined Management Report 161
The recoverability in the value of location properties Information about the accounting policies applied can be found in the "Accounting policies/General princi-ples" and "Accounting policies/Property, plant and equipment" chapters of the notes to the consolidated fi-nancial statements. Information about the impairment test performed can be found in the "Impairment of non-current, non-financial assets" chapter.
THE RISK FOR FINANCIAL REPORTING The HORNBACH Baumarkt AG Group assesses the recoverability in the value of property, plant and equipment on the level of individual stores, each of which constitutes a cash generating unit (CGU). Within property, plant and equipment, the carrying amount of "Land, leasehold rights, and buildings on third-party land" (so-called "location properties") amounts to € 922.3 million. This line item thus accounts for 82.3 % of property, plant and equipment and 46.2 % of total assets and is therefore of considerable significant for the Group's net asset position. In the 2017/18 financial year, the Group recognized impairments totaling € 0.4 million on these assets. Where there are indications of impairment, the company calculates the value in use for each CGU in the con-text of its impairment testing. Where the value in use falls short of the carrying amount, the fair value less costs to sell (net realizable value) is determined for the property attributable to the CGU. Impairment testing pursuant to IAS 36 is complex and requires the use of numerous assumptions based on discretionary decisions. These particularly include the forecast cash flows used to determine the value in use, the assumed long-term growth rates, and the discount rates used. Furthermore, the recoverability in the value of location properties also depends on their respective location and the resultant potential alternative uses. The company commissioned an external surveyor to determine the net realizable values of its location properties. The net realizable value of the location properties depends on their respective location and the resultant potential alternative uses. There is the risk that the properties at the stores are overvalued.
OUR AUDIT APPROACH We received explanations from employees in the accounting department and assessed the group accounting policy and thus gained an understanding of the processes used by the Group to identify any indications of impairment and to determine the value in use and the net realizable value. We analyzed the indications of impairment identified by the Group and, based on the information gained from our audit, assessed whether there were any further indications of impairment not identified by the Group. In addition to the arithmetical correctness and IFRS-conformity of the valuation model used by the company, we then assessed the appropriateness of the key assumptions used in the model. To this end, we first ana-lyzed the planning process and convinced ourselves of the forecasting quality of group planning by compar-ing the planning referred to in the past financial year with the results actually achieved in the subsequent period. Furthermore, we compared the planning thereby used with the five-year planning compiled by the Board of Management and approved by the Supervisory Board. Furthermore, we assessed the extent to which the assumptions used were consistent with external market estimates. We compared the assumptions and parameters underlying the discount rate, and in particular the risk-free interest rate, market risk premium, and beta factor, with publicly available data and took advice from valua-tion specialists. Furthermore, we assessed the competence, skills, and objectivity of the independent surveyor commissioned by the Group to determine the net realizable values and appraised the results of his work, also seeking advice in this respect from our own valuation specialists.

162 AUDITOR'S REPORT Report on the Audit of the Consolidated Financial Statements and the Combined Management Report
OUR CONCLUSIONS The approach taken to measuring the recoverability of the value of location properties and the valuation model are consistent with the accounting policies. The assumptions and parameters referred to by the com-pany are appropriate.
Other Information
The company's legal representatives are responsible for the other information. The other information com-prises the Annual Report of the HORNBACH Baumarkt AG Group with the exception of the audited consoli-dated financial statements, the combined management report, and our audit report. Our audit opinions on the consolidated financial statements and on the combined management report do not cover the other information and consequently we do not express an audit opinion or any other form of assur-ance conclusion thereon. In connection with our audit, our responsibility is to read the other information and, in so doing, to consider whether the other information is materially inconsistent with the consolidated financial statements, the combined management report
or our knowledge obtained in the audit, or otherwise appears to be materially misstated.
Responsibility of the Board of Management and the Supervisory Board for the Consolidated Financial Statements and the Combined Management Report
The company's legal representatives are responsible for the preparation of the consolidated financial state-ments that comply, in all material respects, with IFRS as adopted by the EU and the additional requirements of German commercial law pursuant to § 315e (1) HGB and that the consolidated financial statements, in compliance with these requirements, give a true and fair view of the assets, financial position, and financial performance of the Group. In addition, the Board of Management is responsible for such internal controls as they have deemed necessary to enable the preparation of consolidated financial statements that are free from material misstatement, whether due to fraud or error. In preparing the consolidated financial statements, the legal representatives are responsible for assessing the Group's ability to continue as a going concern. They also have the responsibility for disclosing, as appli-cable, matters related to going concern. In addition, they are responsible for financial reporting based on the going concern basis of accounting unless there is an intention to liquidate the Group or to cease operations, or there is no realistic alternative but to do so. Furthermore, the legal representatives are responsible for the preparation of the combined management re-port that, as a whole, provides an appropriate view of the Group's position and is, in all material respects, consistent with the consolidated financial statements, complies with German legal requirements, and appro-priately presents the opportunities and risks of future development. In addition, the legal representatives are responsible for such precautions and measures (systems) as they have considered necessary to enable the
AUDITOR'S REPORT Report on the Audit of the Consolidated Financial Statements and the Combined Management Report 163
preparation of a combined management report that is in accordance with applicable German legal require-ments, and to be able to provide sufficient appropriate evidence for the assertions in the combined manage-ment report. The Supervisory Board is responsible for overseeing the Group's financial reporting process for the prepara-tion of the consolidated financial statements and of the combined management report.
Auditor's Responsibility for the Audit of the Consolidated Financial Statements and of the Combined Management Report
Our objectives are to obtain reasonable assurance about whether the consolidated financial statements as a whole are free from material misstatement, whether due to fraud or error, and whether the combined man-agement report as a whole provides an appropriate view of the Group's position and, in all material respects, is consistent with the consolidated financial statements and the knowledge obtained in the audit, complies with German legal requirements, and appropriately presents the opportunities and risks of future develop-ment, as well as to issue an auditor's report that includes our audit opinions on the consolidated financial statements and on the combined management report. Reasonable assurance is a high level of assurance, but is not a guarantee that an audit conducted in ac-cordance with § 317 HGB and EU-APrVO and in compliance with German Generally Accepted Standards for Financial Statement Audits promulgated by the Institut der Wirtschaftsprüfer (IDW) will always detect a ma-terial misstatement. Misstatements can arise from fraud or error and are considered material if, individually or aggregately, they could reasonably be expected to influence the economic decisions taken by users on the basis of these consolidated financial statements and this combined management report. We exercise professional judgement and maintain professional skepticism throughout the audit. We also: identify and assess the risks of material misstatement in the consolidated financial statements and in
the combined management report, whether due to fraud or error, design and perform audit procedures responsive to those risks, and obtain audit evidence that is sufficient and appropriate to provide a basis for our audit opinions. The risk of not detecting a material misstatement resulting from fraud is higher than for one resulting from error, as fraud may involve collusion, forgery, intentional omissions, misrepre-sentations, or the override of internal control.
obtain an understanding of the internal control system relevant to the audit of the consolidated financial statements and of precautions and measures relevant to the audit of the combined management report in order to design audit procedures that are appropriate in the circumstances, but not for the purpose of ex-pressing an audit opinion on the effectiveness of these systems.
evaluate the appropriateness of accounting policies used by the legal representatives and the reasona-
bleness of estimates made by the legal representatives and related disclosures.
conclude on the appropriateness of the legal representatives' use of the going concern basis of account-ing and, based on the audit evidence obtained, whether a material uncertainty exists related to events or conditions that may cast significant doubt on the Group's ability to continue as a going concern. If we conclude that a material uncertainty exists, we are required to draw attention in the auditor's report to the related disclosures in the consolidated financial statements and in the combined management report or, if such disclosures are inadequate, to modify our respective audit opinion. Our conclusions are based on
164 AUDITOR'S REPORT Other Legal and Regulatory Requirements
the audit evidence obtained up to the date of our auditor's report. However, future events or conditions may cause the Group to cease to be able to continue as a going concern.
evaluate the overall presentation, structure, and content of the consolidated financial statements, includ-
ing the disclosures, and whether the consolidated financial statements present the underlying transac-tions and events in a manner that they give a true and fair view of the assets, financial position, and fi-nancial performance of the Group in compliance with IFRS as adopted by the EU and the additional requirements of German commercial law pursuant to § 315e (1) HGB.
obtain sufficient appropriate audit evidence regarding the financial information of the entities or busi-
ness activities within the Group to express audit opinions on the consolidated financial statements and on the combined management report. We are responsible for the direction, supervision, and performance of the group audit. We remain solely responsible for our audit opinions.
evaluate the consistency of the combined management report with the consolidated financial statements,
its conformity with (German) law, and the view of the Group's position it provides. perform audit procedures on the prospective information presented by the legal representatives in the
combined management report. On the basis of sufficient appropriate audit evidence we evaluate, in par-ticular, the significant assumptions used by the company's legal representatives as a basis for the pro-spective information and evaluate the proper derivation of the prospective information from these as-sumptions. We do not express a separate audit opinion on the prospective information and on the assumptions used as a basis. There is a substantial unavoidable risk that future events will differ mate-rially from the prospective information.
We communicate with those charged with governance regarding, among other matters, the planned scope and timing of the audit and significant audit findings, including any deficiencies in the internal control sys-tem that we identify during our audit. We also provide those charged with governance with a statement that we have complied with the relevant independent requirements, and communicate with them all relationships and other matters that may reason-ably be thought to bear on our independence and, where applicable, the related safeguards. From the matters communicated with those charged with governance, we determine those matters that were of most significance in the audit of the consolidated financial statements of the current period and are therefore the key audit matters. We describe these matters in our auditor's report unless laws or other regu-lations preclude public disclosure of the matter.
Other Legal and Regulatory Requirements
Further Information pursuant to Article 10 EU-APrVO
We were elected as auditor of the consolidated financial statements by the Annual General Meeting on July 6, 2017. We were engaged by the Supervisory Board on December 12, 2017. We have been the auditor of the consolidated financial statements of HORNBACH Baumarkt AG without interruption since the 1997/98 financial year.

AUDITOR'S REPORT Auditor Responsible 165
We declare that the audit opinions expressed in this auditor's report are consistent with the additional report to the Audit Committee pursuant to Article 11 EU-APrVO (long-form audit report). In addition to the consolidated financial statements, we also audited the annual financial statements of HORNBACH Baumarkt AG and audited the annual financial statements of a subsidiary of HORNBACH Bau-markt AG. Furthermore, we performed an audit review on the half-year financial report of HORNBACH Bau-markt AG. Additional certification services were performed in particular with the issuing of sales certificates. Furthermore, we provided support in connection with the first-time application of new financial reporting principles. The tax advisory services mainly involved providing support in tax court proceedings.
Auditor Responsible
The German public auditor responsible for the engagement is Lars Erik Bertram. Frankfurt am Main, May 14, 2018 KPMG AG Wirtschaftsprüfungsgesellschaft Bertram Palm Wirtschaftsprüfer Wirtschaftsprüfer (German public auditor) (German public auditor)

LOCATIONS
Sweden
Germany
Netherlands
Switzerland
Luxembourg
Austria
Slovakia
Romania

Germany
International
Baden-Württemberg Berlin Hannover-Linden Koblenz Binzen Berlin-Bohnsdorf Isernhagen-Altwarmbüchen Ludwigshafen Esslingen Berlin-Mariendorf Lüneburg Mainz-Bretzenheim Göppingen Berlin-Marzahn Oldenburg Pirmasens Heidelberg Berlin-Neukölln Osnabrück Trier Karlsruhe-Grünwinkel Berlin-Weißensee Wilhelmshaven Worms Karlsruhe-Hagsfeld Wolfsburg Ludwigsburg Brandenburg Saarland Mosbach Fredersdorf-Vogelsdorf North Rhine-Westphalia Neunkirchen Pforzheim Ludwigsfelde Bielefeld Saarbrücken Remseck Marquardt Datteln Rottweil Velten Dortmund Saxony Schwetzingen Duisburg Chemnitz Sindelfingen Bremen Essen Dresden-Kaditz Sinsheim Bremen, Duckwitzstraße Gelsenkirchen Dresden-Prohlis Tübingen Bremen, Weserpark Gütersloh Görlitz Ulm Bremerhaven Herne Leipzig Kamen Bavaria Hamburg Krefeld Saxony-Anhalt Altötting Hamburg-Eidelstedt Moers Magdeburg
Bamberg Mönchengladbach, Künkelstr. Halle1
Erlangen Hesse M’gladbach-Reststrauch Fürth Darmstadt Münster Schleswig-Holstein Ingolstadt Frankfurt, Hanauer Landstr. Niederzier Kiel Kempten Frankfurt-Niedereschbach Oberhausen Lübeck Munich-Freiham Hanau2 Paderborn Munich-Fröttmaning Lohfelden Wuppertal Thuringia Neu-Ulm Wiesbaden-Biebrich Jena Nuremberg Wiesbaden-Mainz-Kastel Rhineland-Palatinate Passau Alzey Schwabach
Lower Saxony Bad Bergzabern Straubing Braunschweig Bornheim Würzburg Garbsen Kaiserslautern
Austria Netherlands Domneşti Slovakia Ansfelden Amsterdam-Sloterdijk Sibiu Bratislava-Devínska Nová Ves Bad Fischau Alblasserdam Timişoara Bratislava-Ružinov Brunn a.G. Best Kosice Gerasdorf Breda Sweden Hohenems Den Haag1 Arlöv Czech Republic Klagenfurt Geleen Botkyrka Brno Krems Groningen Helsingborg Hradec Kralové Leoben Kerkrade Gothenburg Olomouc Regau Nieuwegein Sundbyberg Ostrava-Svinov Rum Nieuwerkerk Ostrava-Vítkovice Seiersberg Tilburg Switzerland Plzeň St. Pölten Wateringen Biel/Bienne Prague-Černý Most Wels Zaandam Etoy Prague-Čestlice Vienna-Stadlau Galgenen Prague-Řepy Romania Luzern-Littau Prague-Velká Chuchle Luxembourg Baloteşti Riddes Bertrange Braşov Villeneuve 1 Newly opened in 2017/18 financial year Bucureşti-Berceni 2 Closed in 2017/18 financial year
Romania


IMPRINT
Published byHORNBACH Baumarkt AGHornbachstraße76878 Bornheim bei Landau / PfalzTelephone +49 (0) 6348 / 60-00Fax +49 (0) 6348 / [email protected]
Investor RelationsTelephone +49 (0) 6348 / [email protected]
Design Concept and PhotographySchröder & Schröder GmbH & Co. KGBöttcherstraße 2749124 Georgsmarienhü[email protected]
ProductionRasch Druckerei & Verlag GmbH & Co. KGLindenstraße 4749565 Bramschewww.raschdruck.de

www.hornbach.com