2017 wage/salary survey - general pay c.ymcdn.com/sites/ · pdf filethe survey information has...
TRANSCRIPT

2017 WAGE/SALARY SURVEY -
GENERAL PAY PRACTICES
DATA EFFECTIVE JANUARY 1, 2017
Compiled by
Actuarial Consulting Services, Inc.5830 South 142nd Street, Suite B
Omaha, NE 68137(402) 614-1844
www.ACShrbenefits.com
Copyright © 2017 Society for Human Resource Management of Greater Kansas City, Inc.No portion of this publication may be reproduced in any form without express
written permission from SHRM-KC

© 2017 Lockton, Inc. All rights reserved.
WE LIVE SERVICE!® !!!"#$%!&'(')*+*(,!!-!.+/012**!3*(*4!,$!-!"*,#5*+*(,!6*57#8*$
444 W. 47th Street, Suite 900 Kansas City, MO 64112 • 816.960.9000
FOCUSED ON CLIENTS. DEDICATED TO RESULTS.
WE BELIEVE IN KANSAS CITY
Helping You Make Your Business Better
Serving Employers Across the Region and Around the World
Health Risk Solutions
Voluntary Benefits
Health & Welfare Benefits
Retirement Services
HR Technology
HR Consulting
Compensation
Lockton helps companies protect their people, property, and reputations. For five decades,
our clients have depended on our risk management, employee benefits, and retirement
services expertise to help them take risks and grow.
VOTED AS A “BEST PLACE TO WORK IN INSURANCE” FOR EIGHT YEARS RUNNING.
To learn how Lockton can help you create a successful employee benefits strategy for your
business, visit lockton.com.
Total Rewards
2017 SHRM-KC Wage/Salary Survey
Compiled by Actuarial Consulting Services, Inc.
Data Collected as of January 1, 2017Data Published July 2017
Confidentiality
This survey has been compiled from information furnished by each respondent with the understanding that all or any portion of the information would:
· Remain strictly confidential;· Not be used in any collective bargaining sessions or grievance proceedings;· Completely protect respondent identity.
The survey information has been compiled solely to assist in guiding the effective management of wage, salary and benefit administration programs.
All content is for informational purposes only and is not to be construed as a guaranteed outcome. SHRM-KC or ACS cannot accept responsibility for any errors, omissions or liability resulting from the use or misuse of any such information.
Copyright © 2017 Society for Human Resource Management of Greater Kansas City, Inc.All rights reserved. Quotation from or reproduction of any part of this report, in any form, by photocopy or any other means, without prior permission in writing from SHRM-KC is prohibited.
For information on or questions regarding this survey, please contact Scott Stoltenberg or John Rankin at Actuarial Consulting Services at (402) 614-1844 or [email protected] or Lori Maher McCombs at (913) 948-8623 or [email protected].
Page i

Table of Contents 2017 SHRM-KC Wage/Salary Survey
Section 1: Introduction 1
Section 2: Survey Modifications 2
Section 3: Respondent Listing 3
Section 4: Respondent Organization Characteristics 4
Section 5: General Pay Practices Survey Results 7
New Employee Increases 7
Performance Increases 8
Promotional Increases 10
Salary Ranges 11
General Increase 13
Shift Differential/On-Call/Call Back 15
Incentives - Short-Term (One year or less) 17
Special Pay Practices - Sign-On and Retention Issues 20
Special Pay Practices - Skill Issues 22
Special Pay Practices - Other Issues 23
About SHRM-KC 27
About Actuarial Consulting Services, Inc. 27
Page ii

Section 1: Introduction 2017 SHRM-KC Wage/Salary Survey
We are pleased to present the results of the SHRM-KC 2017 Wage/Salary Survey. The format of this report is designed to provide individual users ready access to the data most relevant to their organizations.
This report contains aggregate data for summary purposes. Custom analyses of the data are available to survey participants provided that the demographic database is of sufficient size to protect the integrity of the survey. For more information on these custom analyses, please contact Scott Stoltenberg or John Rankin at Actuarial Consulting Services, Inc.
(402) 614-1844 [email protected]
On behalf of SHRM-KC, and the survey administrator, Actuarial Consulting Services, we would like to extend our sincerest appreciation to the individuals in the participating organizations for their cooperation in providing prompt and accurate salary information.
SHRM-KC would also like to extend a special thanks to Lockton for sponsoring this year’s survey. Lockton’s sponsorship and production assistance went a long way towards making this year’s survey a success for everyone.
Note: The total number of respondents in each section may vary. Although there were 84 total respondents, not all respondents answered every survey question. Therefore, there is some variability in the respondents who reported data by section.
Page 1

Section 2: Survey Modifications 2017 SHRM-KC Wage/Salary Survey
As always, we continue to learn and improve from the previous year's surveys. This year there were no major modifications to the survey process. We hope that the survey participants continue to find the survey easy to use and we welcome any comments to enhance the overall survey process.
This year the format of the survey results has not changed. Providing a consistent look and feel throughout the survey from year to year is intended to enhance the survey's ease of use.
As new and emerging topics come into our field every year, it is important that we continue to stay current as to what information human resources professionals seek. If you have any suggestions for new and emerging topics please provide your feedback in the comment sections.
Please note the Responses are labeled to match the Question labels from the survey. Therefore, a response may appear to be "missing" when there was just no corresponding question in the survey with that label. For example, Section 4 starts with A2 since question A1 is not summarized.
Page 2

Section 3: Respondent Listing 2017 SHRM-KC Wage/Salary Survey
Adecco Group – Ajilon Kansas City Public LibraryAmerican Century Investments Kansas City Southern RailwaysAmerican Dish Service Kansas City University of Medicine & BiosciencesAmerico Labconco CorporationAnesthesia Associates of Kansas City Lansing Trade Group, LLCARC Physical Therapy Legacy Touch, Inc.Armed Forces Insurance Lockton CompaniesAsh Grove Cement Company Marriott Kansas City Overland ParkBlack & Veatch Marshall Municipal UtilitiesBluebird Network McCownGordon ConstructionBlueScope Mid-Continent Public LibraryCartesian, Inc MOCSACartwright International Van Lines MRIGlobalChildren International Murphy Hoffman CompanyChildren's Center for the Visually Impaired National Association of Insurance CommissionersChildren's Mercy Hospital Nebraska Furniture MartCity of Blue Springs North Kansas City HospitalCity of Lenexa Northwest Missouri State UniversityCity of Overland Park, KS O’Reilly Auto PartsClay County, MO Govt. Olathe Health SystemClinical Reference Laboratory, Inc. OMNI Employment Management Services, LLCDickson Diveley Orthopaedic Clinic OOIDADigital Ally, Inc. PAS TechnologiesDuvel Moortgat USA Pembroke Hill SchoolEssense of Australia ReDiscoverEurofins Viracor, Inc. Rockhurst UniversityEwing Marion Kauffman Foundation Saint Luke's Health SystemFairbanks Scales Inc. Shafer, Kline & Warren, Inc.GCSAA Shook, Hardy, & Bacon LLCGEAR for Sports Stinson Leonard StreetGEHA Stouse, LLCGrantham University The Elms Hotel and SpaHallmark Cards, Inc. The Lewer Agency, Inc.HNTB Corporation The University of Kansas Health SystemHopkins Manufacturing Corporation The Whole Personintellicents inc Tnemec CompanyIsle of Capri Casino TradeNet Publishing, Inc.Johnson County Government TriCounty Mental Health ServicesKansas City Area Development Council Truman Medical CentersKansas City Life Insurance Company Visiting Nurse AssociationKansas City Orthopaedic Institute WalsworthKansas City Power & Light WaterOne
Page 3

Section 4: Respondent Organization Characteristics 2017 SHRM-KC Wage/Salary Survey
Section A: Organization Information
A2. Number of Respondents by industry
Education 7 Professional Services 5Finance/Banking 2 Retail/Wholesale 4Government 8 Services 3Health Care 14 Technology 1Hospitality/Restaurant 3 Telecommunications 1Insurance 7 Transportation 2Legal 1 Utilities 2Manufacturing 11 Other 9
Total Respondents 80
A3. Number of Respondents by profit status
For-Profit 52Not-For-Profit 32Total 84
A4. Starting fiscal month
Jan Feb Mar Apr May JunAll Employers 62 0 0 0 2 0
Jul Aug Sep Oct Nov Dec Total14 0 0 6 0 0 84
A5. Average revenue (in millions)
Employer Size Total 001 - 249 $35.7 26 250 - 999 $427.1 18 1,000 or more $1,712.7 22 All $701.4 66
A6. Single-site or multi-site employer
Single-site 28Multi-site 56Total 84
A7. Organization headquarters
Kansas City Area 71Other Location 13Total 84
A8. Majority of employees are located
Kansas City Area 64Other Location 7Multiple locations including Kansas City Area 13Total 84
Page 4

Section 4: Respondent Organization Characteristics 2017 SHRM-KC Wage/Salary Survey
A9. Average employer size
Employer Size US Total KC Area US Total KC Area 001 - 249 114 98 29 28 250 - 999 456 356 30 30 1,000 or more 13,230 2,599 24 23 All 3,965 904 83 81
A10. Average number of employees in HR functionTotal
Employer Size Exempt Non-Exe Exempt Non-Exe 001 - 249 3.3 7.0 27 25 250 - 999 3.8 1.7 30 27 1,000 or more 26.0 18.8 24 23 All 10.4 8.7 81 75
A11. Average voluntary and involuntary turnover rates for office and production employeesAverage Turnover Percentage
Office Office Office Product Product ProductEmployer Size Voluntary Involun Overall Voluntary Involun Overall 001 - 249 9.9% 3.8% 14.4% 4.4% 4.8% 9.1% 250 - 999 12.2% 5.1% 13.0% 13.4% 5.5% 18.4%1,000 or more 14.1% 5.4% 13.9% 7.5% 4.1% 13.0% All 11.8% 4.7% 13.7% 8.3% 4.9% 13.3%
Total RespondentsOffice Office Office Product Product Product
Employer Size Voluntary Involun Overall Voluntary Involun Overall 001 - 249 26 25 26 16 16 17 250 - 999 23 23 24 13 13 14 1,000 or more 17 16 14 5 5 5 All 66 64 64 34 34 36
A12. Percent of Respondents who include the following business functions under the auspices of human resources
CorporateEmployer Size Benefits Comp- Training Develop- Emp Rel HRIS Payroll Recruit- Total 001 - 249 100% 97% 76% 83% 93% 72% 62% 100% 29 250 - 999 97% 97% 81% 84% 100% 84% 39% 100% 31 1,000 or more 96% 100% 75% 79% 96% 92% 29% 96% 24 All 98% 98% 77% 82% 96% 82% 44% 99% 84
A13. Percent of Respondents who have the following types of employeesNon-Exe
Employer Size Exempt Office Production Total 001 - 249 100% 100% 34% 29 250 - 999 100% 100% 61% 31 1,000 or more 100% 96% 46% 24 All 100% 99% 48% 84
Page 5
Section 4: Respondent Organization Characteristics 2017 SHRM-KC Wage/Salary Survey
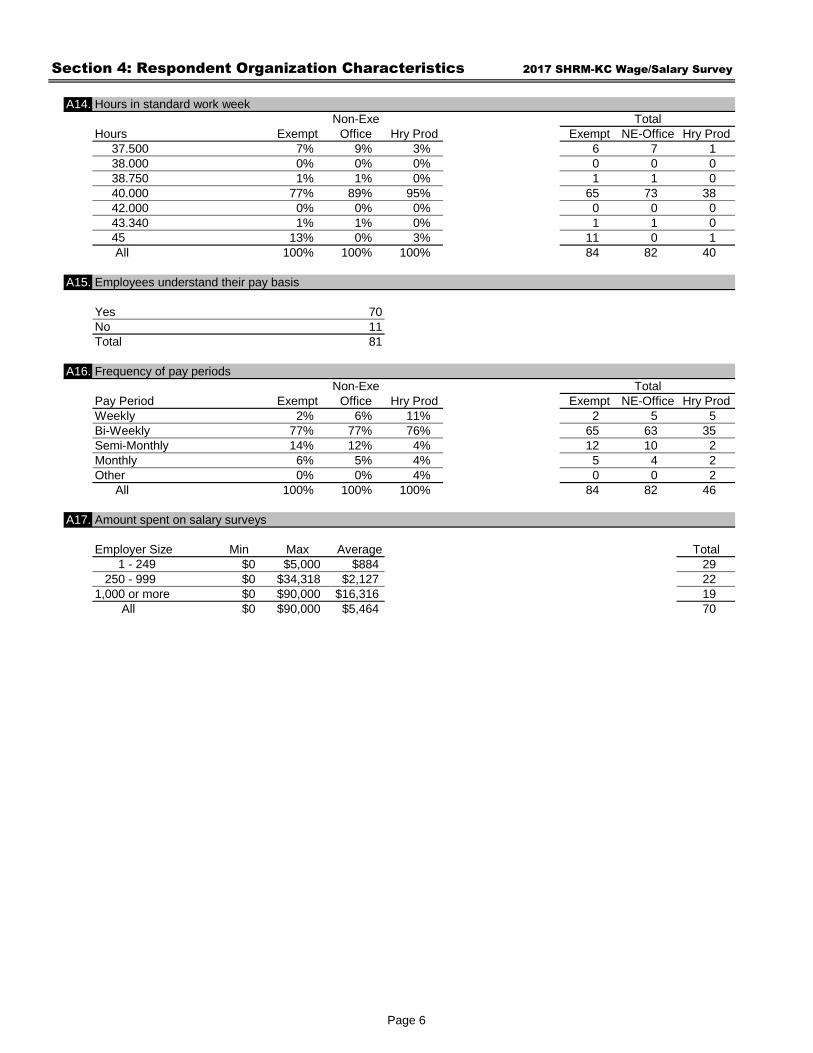
A14. Hours in standard work weekNon-Exe Total
Hours Exempt Office Hry Prod Exempt NE-Office Hry Prod37.500 7% 9% 3% 6 7 1 38.000 0% 0% 0% 0 0 0 38.750 1% 1% 0% 1 1 0 40.000 77% 89% 95% 65 73 38 42.000 0% 0% 0% 0 0 0 43.340 1% 1% 0% 1 1 0 45.000 13% 0% 3% 11 0 1 All 100% 100% 100% 84 82 40
A15. Employees understand their pay basis
Yes 70No 11Total 81
A16. Frequency of pay periodsNon-Exe Total
Pay Period Exempt Office Hry Prod Exempt NE-Office Hry ProdWeekly 2% 6% 11% 2 5 5 Bi-Weekly 77% 77% 76% 65 63 35 Semi-Monthly 14% 12% 4% 12 10 2 Monthly 6% 5% 4% 5 4 2 Other 0% 0% 4% 0 0 2
All 100% 100% 100% 84 82 46
A17. Amount spent on salary surveys
Employer Size Min Max Average Total 001 - 249 $0 $5,000 $884 29 250 - 999 $0 $34,318 $2,127 22 1,000 or more $0 $90,000 $16,316 19 All $0 $90,000 $5,464 70
Page 6

Section 5: General Pay Practices Survey Results 2017 SHRM-KC Wage/Salary Survey
Section B: New Employee Increases
B1. Number of months before new employees are eligible for first pay increase
Exempt Non-Exempt OfficeEmployer Size 3 mo 6 mo 12 mo Other 3 mo 6 mo 12 mo Other 001 - 249 10% 3% 52% 34% 14% 14% 41% 31% 250 - 999 0% 13% 32% 55% 0% 13% 35% 52% 1,000 or more 4% 8% 38% 50% 13% 9% 30% 48% All 5% 8% 40% 46% 8% 12% 36% 43%
TotalHourly Production Non-Exe
Employer Size 3 mo 6 mo 12 mo Other Exempt Office Hry Prod 001 - 249 25% 8% 42% 25% 29 29 12 250 - 999 5% 14% 14% 67% 31 31 21 1,000 or more 14% 7% 7% 71% 24 23 14 All 13% 11% 19% 57% 84 83 47
B2. Percentage of employee population hired within the last yearTotal
Non-Exe Non-ExeEmployer Size Exempt Office Hry Prod Exempt Office Hry Prod 001 - 249 11% 10% 9% 27 26 10 250 - 999 8% 13% 14% 24 23 17 1,000 or more 6% 8% 13% 18 16 9 All 9% 11% 12% 69 65 36
Page 7

Section 5: General Pay Practices Survey Results 2017 SHRM-KC Wage/Salary Survey
Section C: Performance Increases
C1. Percent of Respondents with formal performance review program
Employer Size Total 001 - 249 93% 29 250 - 999 90% 31 1,000 or more 96% 24 All 93% 84
C2. Employee types included in formal performance review programTotal
Non-Exe Non-ExeEmployer Size Exempt Office Hry Prod Exempt Office Hry Prod 001 - 249 93% 90% 80% 29 29 10 250 - 999 90% 90% 79% 31 31 19 1,000 or more 96% 96% 82% 24 23 11 All 93% 92% 80% 84 83 40
C3. Average percent of employees who received a performance increase last fiscal yearTotal
Non-Exe Non-ExeEmployer Size Exempt Office Hry Prod Exempt Office Hry Prod 001 - 249 79% 85% 86% 26 26 9 250 - 999 92% 92% 97% 23 23 12 1,000 or more 88% 82% 74% 22 21 9 All 86% 86% 87% 71 70 30
C4. Average overall performance increases granted last fiscal yearTotal
Non-Exe Non-ExeEmployer Size Exempt Office Hry Prod Exempt Office Hry Prod 001 - 249 3.2% 3.4% 3.7% 19 20 7 250 - 999 2.6% 2.6% 2.6% 15 15 8 1,000 or more 2.7% 2.8% 2.6% 18 17 8 All 2.8% 3.0% 3.0% 52 52 23
C5. Average performance increase granted last fiscal year to "below-expectations" performersTotal
Non-Exe Non-ExeEmployer Size Exempt Office Hry Prod Exempt Office Hry Prod 001 - 249 0.8% 0.8% 0.2% 17 16 5 250 - 999 0.3% 0.4% 0.7% 16 16 10 1,000 or more 0.4% 0.5% 0.1% 17 17 9 All 0.5% 0.6% 0.4% 50 49 24
C6. Average performance increase granted last fiscal year to "meets-expectations" performersTotal
Non-Exe Non-ExeEmployer Size Exempt Office Hry Prod Exempt Office Hry Prod 001 - 249 2.5% 2.5% 1.8% 18 17 5 250 - 999 2.1% 2.2% 2.2% 14 14 9 1,000 or more 2.5% 2.6% 2.2% 15 15 8 All 2.4% 2.4% 2.1% 47 46 22
Page 8

Section 5: General Pay Practices Survey Results 2017 SHRM-KC Wage/Salary Survey
C7. Average performance increase granted last fiscal year to "exceeds-expectations" performersTotal
Non-Exe Non-ExeEmployer Size Exempt Office Hry Prod Exempt Office Hry Prod 001 - 249 3.3% 3.2% 3.1% 17 17 4 250 - 999 2.9% 2.9% 3.0% 14 14 9 1,000 or more 3.8% 3.7% 3.0% 15 15 8 All 3.3% 3.3% 3.0% 46 46 21
C8. Average current fiscal year's performance increase budgetTotal
Non-Exe Non-ExeEmployer Size Exempt Office Hry Prod Exempt Office Hry Prod 001 - 249 3.1% 3.1% 2.7% 24 24 7 250 - 999 2.3% 2.3% 2.3% 20 20 12 1,000 or more 2.9% 2.8% 2.7% 21 20 8 All 2.8% 2.8% 2.5% 65 64 27
C9. Average range movement across all employee groups
Employer Size Total 001 - 249 2.9% 16 250 - 999 1.8% 13 1,000 or more 1.4% 16 All 2.1% 45
C10. Average budget for performance increases next fiscal yearTotal
Non-Exe Non-ExeEmployer Size Exempt Office Hry Prod Exempt Office Hry Prod 001 - 249 3.1% 3.1% 3.0% 22 22 6 250 - 999 2.5% 2.4% 2.7% 19 19 11 1,000 or more 2.7% 2.6% 2.1% 18 17 7 All 2.8% 2.7% 2.6% 59 58 24
C11. Date performance increases are given to employees
Exempt Non-Exempt OfficeEmployer Size Common Annivrsy Other Common Annivrsy Other 001 - 249 67% 26% 7% 67% 26% 7% 250 - 999 69% 23% 8% 65% 27% 8% 1,000 or more 77% 14% 9% 71% 29% 0% All 71% 21% 8% 68% 27% 5%
TotalHourly Production Non-Exe
Employer Size Common Annivrsy Other Exempt Office Hry Prod 001 - 249 82% 9% 9% 27 27 11 250 - 999 69% 13% 19% 26 26 16 1,000 or more 50% 25% 25% 22 21 12 All 67% 15% 18% 75 74 39
Page 9
Section 5: General Pay Practices Survey Results 2017 SHRM-KC Wage/Salary Survey
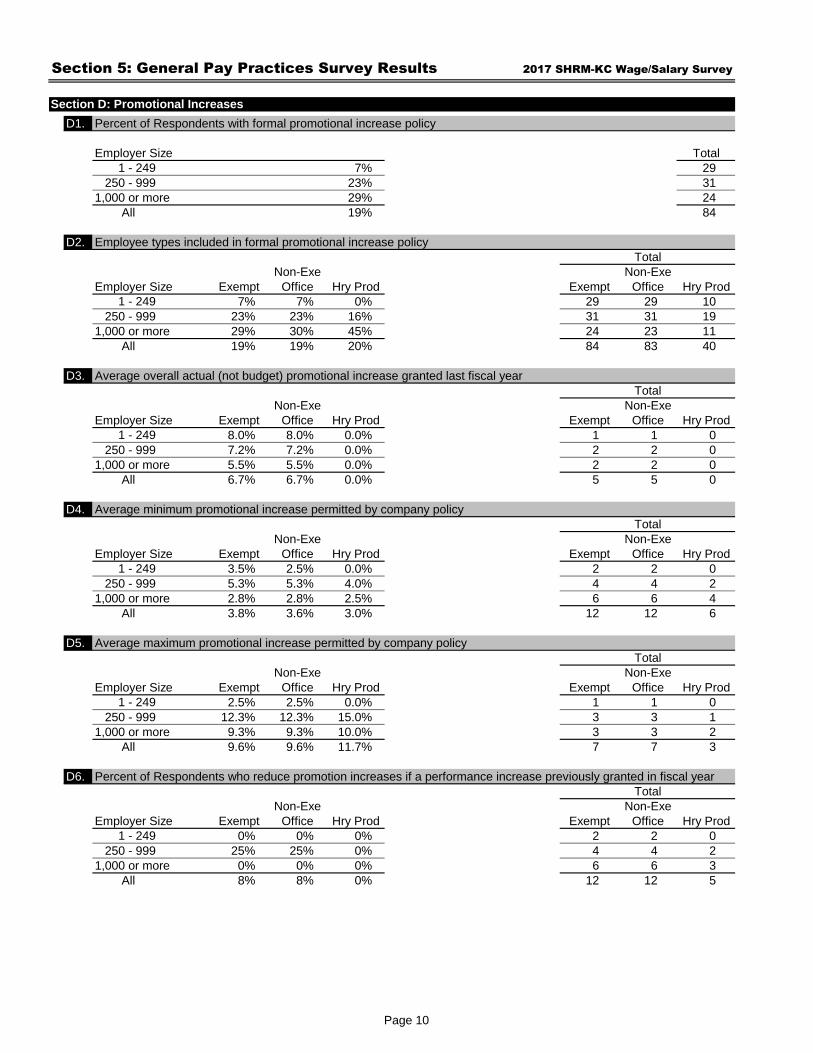
Section D: Promotional Increases
D1. Percent of Respondents with formal promotional increase policy
Employer Size Total 001 - 249 7% 29 250 - 999 23% 31 1,000 or more 29% 24 All 19% 84
D2. Employee types included in formal promotional increase policyTotal
Non-Exe Non-ExeEmployer Size Exempt Office Hry Prod Exempt Office Hry Prod 001 - 249 7% 7% 0% 29 29 10 250 - 999 23% 23% 16% 31 31 19 1,000 or more 29% 30% 45% 24 23 11 All 19% 19% 20% 84 83 40
D3. Average overall actual (not budget) promotional increase granted last fiscal yearTotal
Non-Exe Non-ExeEmployer Size Exempt Office Hry Prod Exempt Office Hry Prod 001 - 249 8.0% 8.0% 0.0% 1 1 0 250 - 999 7.2% 7.2% 0.0% 2 2 0 1,000 or more 5.5% 5.5% 0.0% 2 2 0 All 6.7% 6.7% 0.0% 5 5 0
D4. Average minimum promotional increase permitted by company policyTotal
Non-Exe Non-ExeEmployer Size Exempt Office Hry Prod Exempt Office Hry Prod 001 - 249 3.5% 2.5% 0.0% 2 2 0 250 - 999 5.3% 5.3% 4.0% 4 4 2 1,000 or more 2.8% 2.8% 2.5% 6 6 4 All 3.8% 3.6% 3.0% 12 12 6
D5. Average maximum promotional increase permitted by company policyTotal
Non-Exe Non-ExeEmployer Size Exempt Office Hry Prod Exempt Office Hry Prod 001 - 249 2.5% 2.5% 0.0% 1 1 0 250 - 999 12.3% 12.3% 15.0% 3 3 1 1,000 or more 9.3% 9.3% 10.0% 3 3 2 All 9.6% 9.6% 11.7% 7 7 3
D6. Percent of Respondents who reduce promotion increases if a performance increase previously granted in fiscal yearTotal
Non-Exe Non-ExeEmployer Size Exempt Office Hry Prod Exempt Office Hry Prod 001 - 249 0% 0% 0% 2 2 0 250 - 999 25% 25% 0% 4 4 2 1,000 or more 0% 0% 0% 6 6 3 All 8% 8% 0% 12 12 5
Page 10

Section 5: General Pay Practices Survey Results 2017 SHRM-KC Wage/Salary Survey
Section E: Salary Ranges
E1. Percent of Respondents with formal wage/salary structure
Employer Size Total 001 - 249 45% 29 250 - 999 68% 31 1,000 or more 83% 24 All 64% 84
E2. Employee types included in formal wage/salary structureTotal
Non-Exe Non-ExeEmployer Size Exempt Office Hry Prod Exempt Office Hry Prod 001 - 249 38% 45% 50% 29 29 10 250 - 999 68% 68% 79% 31 31 19 1,000 or more 75% 83% 45% 24 23 11 All 60% 64% 63% 84 83 40
E3. Percent of Respondents that made adjustments to the salary range for the current fiscal yearTotal
Non-Exe Non-ExeEmployer Size Exempt Office Hry Prod Exempt Office Hry Prod 001 - 249 82% 69% 100% 11 13 5 250 - 999 55% 55% 57% 20 20 14 1,000 or more 79% 74% 44% 19 19 9 All 70% 65% 61% 50 52 28
E4. Average percent increase to the range minimumTotal
Non-Exe Non-ExeEmployer Size Exempt Office Hry Prod Exempt Office Hry Prod 001 - 249 2.8% 2.2% 2.0% 9 11 6 250 - 999 1.4% 1.4% 1.5% 14 14 10 1,000 or more 2.0% 1.7% 2.0% 15 16 7 All 2.0% 1.7% 1.8% 38 41 23
E5. Average percent increase to the range midpointTotal
Non-Exe Non-ExeEmployer Size Exempt Office Hry Prod Exempt Office Hry Prod 001 - 249 2.4% 2.5% 2.4% 7 9 5 250 - 999 1.8% 1.8% 1.5% 14 14 10 1,000 or more 2.5% 2.2% 2.5% 15 16 6 All 2.2% 2.1% 2.0% 36 39 21
E6. Average percent increase to the range maximumTotal
Non-Exe Non-ExeEmployer Size Exempt Office Hry Prod Exempt Office Hry Prod 001 - 249 2.1% 2.4% 2.4% 8 10 6 250 - 999 1.5% 1.5% 1.5% 13 13 10 1,000 or more 2.2% 1.8% 2.5% 13 14 6 All 1.9% 1.9% 2.0% 34 37 22
Page 11
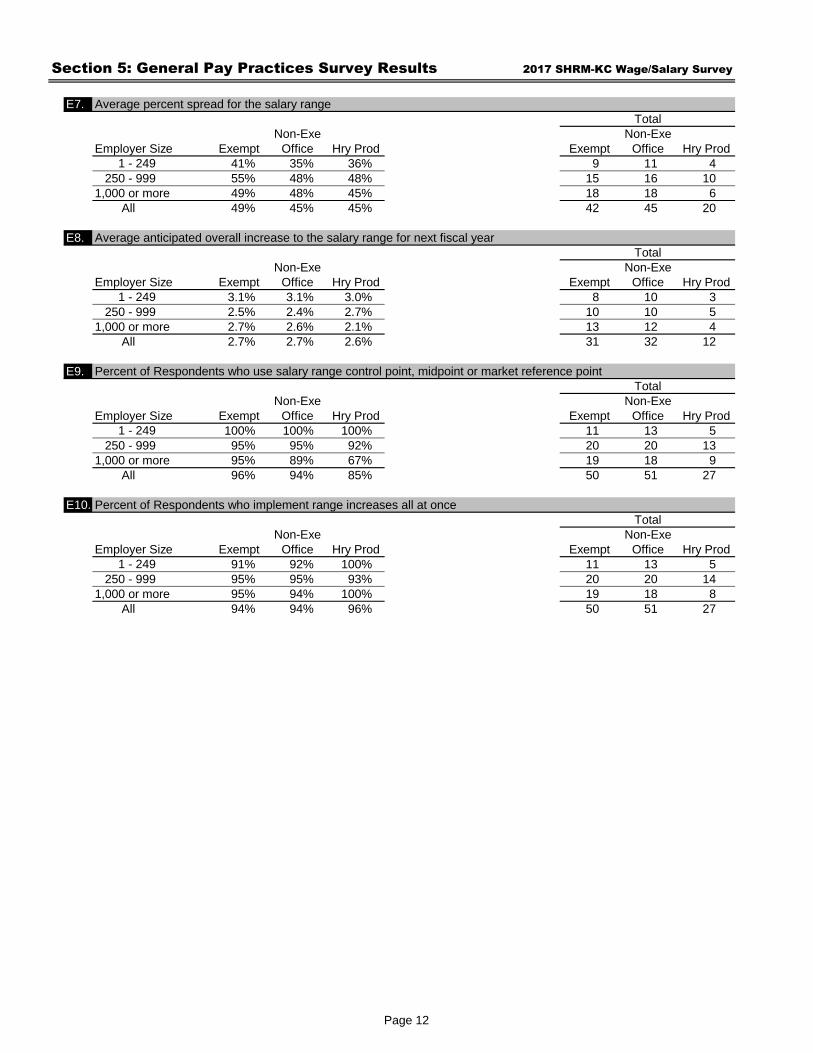
Section 5: General Pay Practices Survey Results 2017 SHRM-KC Wage/Salary Survey
E7. Average percent spread for the salary rangeTotal
Non-Exe Non-ExeEmployer Size Exempt Office Hry Prod Exempt Office Hry Prod 001 - 249 41% 35% 36% 9 11 4 250 - 999 55% 48% 48% 15 16 10 1,000 or more 49% 48% 45% 18 18 6 All 49% 45% 45% 42 45 20
E8. Average anticipated overall increase to the salary range for next fiscal yearTotal
Non-Exe Non-ExeEmployer Size Exempt Office Hry Prod Exempt Office Hry Prod 001 - 249 3.1% 3.1% 3.0% 8 10 3 250 - 999 2.5% 2.4% 2.7% 10 10 5 1,000 or more 2.7% 2.6% 2.1% 13 12 4 All 2.7% 2.7% 2.6% 31 32 12
E9. Percent of Respondents who use salary range control point, midpoint or market reference pointTotal
Non-Exe Non-ExeEmployer Size Exempt Office Hry Prod Exempt Office Hry Prod 001 - 249 100% 100% 100% 11 13 5 250 - 999 95% 95% 92% 20 20 13 1,000 or more 95% 89% 67% 19 18 9 All 96% 94% 85% 50 51 27
E10. Percent of Respondents who implement range increases all at onceTotal
Non-Exe Non-ExeEmployer Size Exempt Office Hry Prod Exempt Office Hry Prod 001 - 249 91% 92% 100% 11 13 5 250 - 999 95% 95% 93% 20 20 14 1,000 or more 95% 94% 100% 19 18 8 All 94% 94% 96% 50 51 27
Page 12

Section 5: General Pay Practices Survey Results 2017 SHRM-KC Wage/Salary Survey
Section F: General Increase
F1. Percent of Respondents who granted a general (cost-of-living) increase last fiscal year
Employer Size Total 001 - 249 7% 29 250 - 999 13% 31 1,000 or more 0% 24 All 7% 84
F2. Employee types who were granted a general (cost-of-living) increase last fiscal yearTotal
Non-Exe Non-ExeEmployer Size Exempt Office Hry Prod Exempt Office Hry Prod 001 - 249 7% 7% 10% 29 29 10 250 - 999 13% 13% 16% 31 31 19 1,000 or more 0% 0% 0% 24 23 11 All 7% 7% 10% 84 83 40
F3. Average overall actual (not budget) general increase granted last fiscal yearTotal
Non-Exe Non-ExeEmployer Size Exempt Office Hry Prod Exempt Office Hry Prod 001 - 249 3.3% 3.3% 3.5% 2 2 1 250 - 999 2.0% 2.0% 2.0% 3 3 3 1,000 or more 0.0% 0.0% 0.0% 0 0 0 All 2.5% 2.5% 2.4% 5 5 4
F4. Percent of Respondents who budgeted a general (cost-of-living) increase for this fiscal yearTotal
Non-Exe Non-ExeEmployer Size Exempt Office Hry Prod Exempt Office Hry Prod 001 - 249 17% 17% 17% 29 29 12 250 - 999 10% 10% 14% 29 29 21 1,000 or more 0% 0% 0% 23 22 12 All 10% 10% 11% 81 80 45
F5. Average general increase budgeted for this fiscal yearTotal
Non-Exe Non-ExeEmployer Size Exempt Office Hry Prod Exempt Office Hry Prod 001 - 249 2.0% 2.0% 1.4% 8 8 3 250 - 999 2.0% 2.0% 2.0% 4 4 4 1,000 or more 3.0% 3.0% 0.0% 1 1 0 All 2.1% 2.1% 1.8% 13 13 7
Page 13

Section 5: General Pay Practices Survey Results 2017 SHRM-KC Wage/Salary Survey
F6. Average general (cost-of-living) increase budgeted for next fiscal yearTotal
Non-Exe Non-ExeEmployer Size Exempt Office Hry Prod Exempt Office Hry Prod 001 - 249 0.9% 0.9% 0.3% 14 14 5 250 - 999 0.2% 0.2% 0.3% 11 11 7 1,000 or more 0.0% 0.0% 0.0% 7 7 1 All 0.5% 0.5% 0.3% 32 32 13
F7. Percent of Respondents who allow employees receiving a general increase to be eligible for a performance increaseTotal
Non-Exe Non-ExeEmployer Size Exempt Office Hry Prod Exempt Office Hry Prod 001 - 249 52.9% 52.9% 50.0% 17 17 6 250 - 999 31.3% 31.3% 18.2% 16 16 11 1,000 or more 58.3% 58.3% 66.7% 12 12 6 All 46.7% 46.7% 39.1% 45 45 23
Page 14

Section 5: General Pay Practices Survey Results 2017 SHRM-KC Wage/Salary Survey
Section G: Shift Differential/On-Call/Call-Back
G1. Percent of Respondents who have 2nd/3rd shift or offer on-call and/or call-back pay
Employer Size Total 001 - 249 24% 29 250 - 999 74% 31 1,000 or more 67% 24 All 55% 84
G2. Employee types who work 2nd/3rd shiftTotal
Non-Exe Non-ExeEmployer Size Exempt Office Hry Prod Exempt Office Hry Prod 001 - 249 3.4% 10.3% 40.0% 29 29 10 250 - 999 32.3% 29.0% 78.9% 31 31 19 1,000 or more 37.5% 56.5% 81.8% 24 23 11 All 23.8% 30.1% 70.0% 84 83 40
G3. Percent of Respondents that pay a shift differentialTotal
Non-Exe Non-ExeEmployer Size Exempt Office Hry Prod Exempt Office Hry Prod 001 - 249 0% 50% 100% 3 4 4 250 - 999 20% 44% 76% 15 16 17 1,000 or more 38% 86% 91% 13 14 11 All 26% 62% 84% 31 34 32
G4. Percent of Respondents minimum number of hours required to work during a shift to earn the differentialNo minimu1 to 7 hours8 hours More than 8 hours
Employer Size Total 001 - 249 71% 29% 0% 0% 7 250 - 999 61% 22% 17% 0% 18 1,000 or more 67% 33% 0% 0% 15 All 65% 28% 8% 0% 40
G5. Average amount paid to employees who receive a shift differential
% of Base Salary TotalEmployer Size 2nd Shift 3rd Shift 2nd Shift 3rd Shift 001 - 249 5.2% 5.0% 4 1 250 - 999 9.3% 13.1% 5 4 1,000 or more 11.3% 12.3% 4 3 All 8.6% 11.8% 13 8
Flat $ per Hour TotalEmployer Size 2nd Shift 3rd Shift 2nd Shift 3rd Shift 001 - 249 $0.60 $3.00 1 1 250 - 999 $0.79 $0.97 12 10 1,000 or more $0.83 $1.05 7 8 All $0.80 $1.11 20 19
No Min1 to 7Hours
8Hours
Over 8Hours
Page 15

Section 5: General Pay Practices Survey Results 2017 SHRM-KC Wage/Salary Survey
G6. Percent of Respondents who offer on-call pay
Employer Size Total 001 - 249 71% 7 250 - 999 23% 22 1,000 or more 44% 16 All 38% 45
G7. Percent of Respondents (who answered Yes to G6) offering on-call pay by job family
Call CenterEmployer Size Cust Svc Healthcare IT Maint Production Sales Total 001 - 249 50% 0% 13% 25% 13% 0% 8 250 - 999 39% 6% 0% 17% 28% 11% 18 1,000 or more 35% 6% 24% 18% 12% 6% 17 All 40% 5% 12% 19% 19% 7% 43
G8. Percent of Respondents who offer call-back pay
Employer Size Total 001 - 249 57% 7 250 - 999 27% 22 1,000 or more 63% 16 All 44% 45
G9. Minimum number of hours paid for call-back pay
Min hrsEmployer Size Paid Total 001 - 249 2.5 4 250 - 999 3.2 6 1,000 or more 2.3 10 All 2.6 20
Page 16

Section 5: General Pay Practices Survey Results 2017 SHRM-KC Wage/Salary Survey
Section H: Incentives - Short-Term (One Year or Less)
H1. Percent of Respondents with a short-term bonus or incentive plan
Employer Size Total 001 - 249 45% 29 250 - 999 35% 31 1,000 or more 54% 24 All 44% 84
H2. Employee types with a short-term bonus or incentive planTotal
Non-Exe Non-ExeEmployer Size Exempt Office Hry Prod Exempt Office Hry Prod 001 - 249 45% 34% 10% 29 29 10 250 - 999 35% 29% 37% 31 31 19 1,000 or more 54% 39% 18% 24 23 11 All 44% 34% 25% 84 83 40
H3. Types of criteria short-term bonuses or incentives are based upon
ExemptIndiv. Group Company Dpt. Profit
Employer Size Perform. Perform. Perform. Perform. Sharing Other Total 001 - 249 85% 23% 69% 23% 8% 8% 13 250 - 999 73% 9% 91% 18% 27% 0% 11 1,000 or more 85% 31% 92% 38% 8% 15% 13 All 81% 22% 84% 27% 14% 8% 37
Non-Exempt OfficeIndiv. Group Company Dpt. Profit
Employer Size Perform. Perform. Perform. Perform. Sharing Other Total 001 - 249 73% 27% 73% 18% 9% 0% 11 250 - 999 44% 22% 100% 11% 33% 0% 9 1,000 or more 75% 25% 88% 13% 13% 25% 8 All 64% 25% 86% 14% 18% 7% 28
Hourly ProductionIndiv. Group Company Dpt. Profit
Employer Size Perform. Perform. Perform. Perform. Sharing Other Total 001 - 249 100% 0% 100% 0% 0% 0% 1 250 - 999 29% 29% 100% 14% 29% 0% 7 1,000 or more 100% 50% 50% 50% 50% 0% 2 All 50% 30% 90% 20% 30% 0% 10
Page 17

Section 5: General Pay Practices Survey Results 2017 SHRM-KC Wage/Salary Survey
H4. Average short-term/incentive bonus as percent of base pay
ExemptIndiv. Group Company Dpt. Profit
Employer Size Perform. Perform. Perform. Perform. Sharing Other 001 - 249 1.8% 0.0% 1.6% 5.0% 5.0% 1.5% 250 - 999 2.3% 10.0% 1.8% 0.0% 0.0% 0.0% 1,000 or more 2.2% 20.0% 4.4% 0.0% 0.0% 7.5% All 2.1% 15.0% 2.1% 5.0% 5.0% 3.5%
Total 13 2 12 1 1 3
Non-Exempt OfficeIndiv. Group Company Dpt. Profit
Employer Size Perform. Perform. Perform. Perform. Sharing Other 001 - 249 2.2% 0.0% 1.5% 5.0% 3.0% 1.5% 250 - 999 2.0% 10.0% 1.2% 0.0% 0.0% 0.0% 1,000 or more 0.0% 0.0% 5.0% 0.0% 0.0% 1.0% All 2.2% 10.0% 1.8% 5.0% 3.0% 1.3%
Total 4 1 9 1 1 3
Hourly ProductionIndiv. Group Company Dpt. Profit
Employer Size Perform. Perform. Perform. Perform. Sharing Other 001 - 249 0.0% 0.0% 0.0% 0.0% 0.0% 0.0% 250 - 999 0.0% 10.0% 2.3% 0.0% 0.0% 0.0% 1,000 or more 0.0% 0.0% 0.0% 0.0% 0.0% 0.0% All 0.0% 10.0% 2.3% 0.0% 0.0% 0.0%
Total 0 1 2 0 0 0
H5. Percent of Respondents who offer any formal non-monetary recognition award
Employer Size Total 001 - 249 58% 12 250 - 999 73% 11 1,000 or more 69% 13 All 67% 36
H6. Types of non-monetary recognition awards provided by Respondents
Time Gift Parking Co. Recog- FavorableEmployer Size Off Cert. Space Merch. nition Hours Other Total 001 - 249 29% 100% 14% 29% 71% 0% 71% 7 250 - 999 0% 88% 50% 75% 100% 0% 38% 8 1,000 or more 30% 70% 40% 30% 90% 0% 10% 10 All 20% 85% 34% 43% 87% 0% 39% 25
H7. Percent of Respondents who offer any formal monetary recognition award
Employer Size Total 001 - 249 33% 12 250 - 999 55% 11 1,000 or more 31% 13 All 39% 36
Page 18

Section 5: General Pay Practices Survey Results 2017 SHRM-KC Wage/Salary Survey
H8a. Average amount of monetary formal recognition reward
Employer Size Min Max Average Total 001 - 249 $25 $100 $81 4 250 - 999 $100 $500 $267 6 1,000 or more $250 $1500 $833 3 All $25 $1500 $340 13
H8b. Months of employment before employees are eligible to receive a monetary recognition reward
Employer Size Min Max Average Total 001 - 249 2 3 3 2 250 - 999 1 24 11 4 1,000 or more 0 12 6 2 All 0 24 8 8
Page 19

Section 5: General Pay Practices Survey Results 2017 SHRM-KC Wage/Salary Survey
Section I: Special Pay Practices - Sign-On and Retention Issues
I1. Percent of Respondents who offer sign-on or retention bonuses
Employer Size Total 001 - 249 24% 29 250 - 999 19% 31 1,000 or more 33% 24 All 25% 84
I2a. Employee types who are offered sign-on bonusesTotal
Non-Exe Non-ExeEmployer Size Exempt Office Hry Prod Exempt Office Hry Prod 001 - 249 17% 14% 10% 29 29 10 250 - 999 16% 3% 5% 31 31 19 1,000 or more 33% 4% 0% 24 23 11 All 21% 7% 5% 84 83 40
I2b. Employee types who are offered retention bonusesTotal
Non-Exe Non-ExeEmployer Size Exempt Office Hry Prod Exempt Office Hry Prod 001 - 249 14% 10% 10% 29 29 10 250 - 999 6% 0% 5% 31 31 19 1,000 or more 21% 4% 0% 24 23 11 All 13% 5% 5% 84 83 40
I3. Types of positions that receive sign-on and/or retention bonuses
Exempt Non-Exempt Office Hourly Production
Inform. Call/Cust. Inform. Call/Cust. Inform. Call/Cust.Employer Size Tech. Rep Other Tech. Rep Other Tech. Rep Other 001 - 249 10% 10% 3% 0% 7% 0% 10% 14% 7% 250 - 999 3% 0% 0% 0% 0% 0% 16% 3% 3% 1,000 or more 21% 0% 0% 0% 0% 0% 21% 0% 0% All 11% 4% 1% 0% 2% 0% 15% 6% 4%
Total 84 84 84 83 83 83 40 40 40
I5. Types of situations that sign-on and/or retention bonuses are offered
Exempt Non-Exempt Office Hourly Production
Seasonal Chronic Seasonal Chronic Seasonal ChronicEmployer Size Demand Openings Other Demand Openings Other Demand Openings Other 001 - 249 0% 7% 3% 7% 10% 3% 3% 0% 0% 250 - 999 0% 0% 0% 3% 0% 3% 6% 3% 0% 1,000 or more 0% 0% 0% 17% 0% 0% 13% 0% 0% All 0% 2% 1% 9% 4% 2% 7% 1% 0%
Total 84 84 84 83 83 83 40 40 40
Page 20

Section 5: General Pay Practices Survey Results 2017 SHRM-KC Wage/Salary Survey
I7. Percent of Respondents who require a new hire to remain with the company to collect a sign-on bonus
Employer Size Total 001 - 249 86% 7 250 - 999 0% 6 1,000 or more 63% 8 All 52% 21
I8. The number of months a new hire must remain with the companyTotal
Non-Exe Non-ExeEmployer Size Exempt Office Hry Prod Exempt Office Hry Prod 001 - 249 8.3 4.0 3.0 4 3 1 250 - 999 6.5 0.0 12.0 2 0 1 1,000 or more 12.0 0.0 0.0 5 0 0 All 9.6 4.0 7.5 11 3 2
Page 21
Section 5: General Pay Practices Survey Results 2017 SHRM-KC Wage/Salary Survey
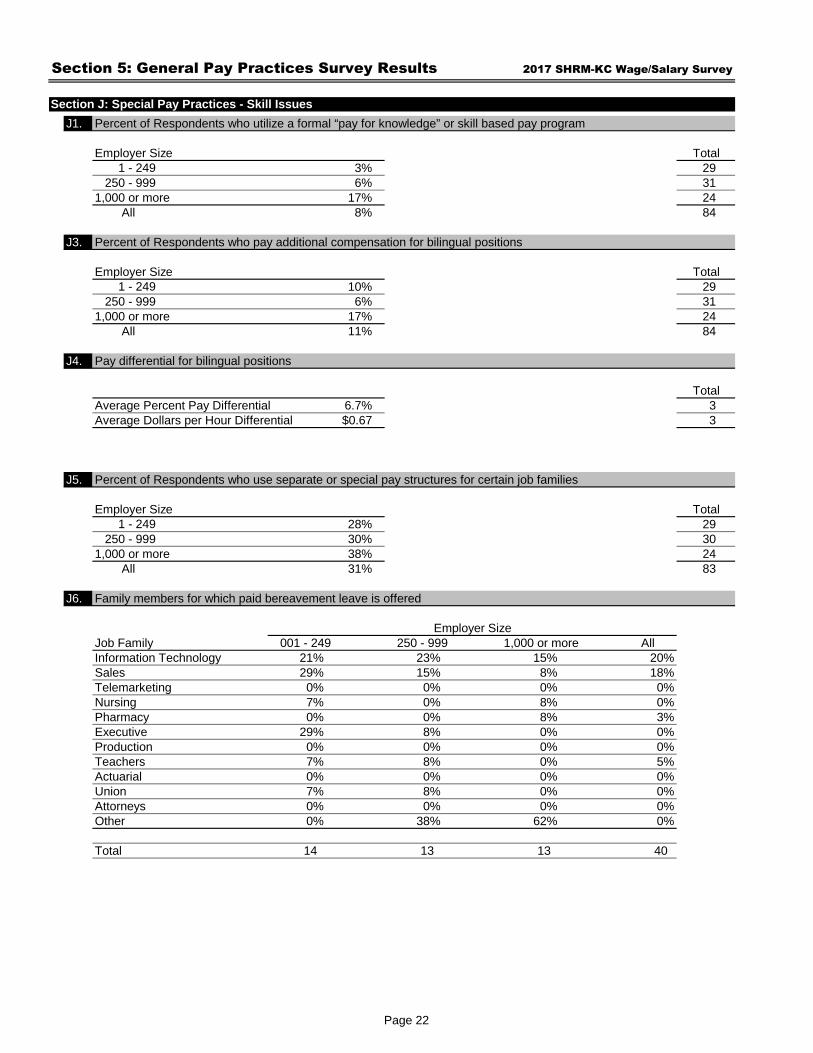
Section J: Special Pay Practices - Skill Issues
J1. Percent of Respondents who utilize a formal “pay for knowledge” or skill based pay program
Employer Size Total 001 - 249 3% 29 250 - 999 6% 31 1,000 or more 17% 24 All 8% 84
J3. Percent of Respondents who pay additional compensation for bilingual positions
Employer Size Total 001 - 249 10% 29 250 - 999 6% 31 1,000 or more 17% 24 All 11% 84
J4. Pay differential for bilingual positions
TotalAverage Percent Pay Differential 6.7% 3 Average Dollars per Hour Differential $0.67 3
J5. Percent of Respondents who use separate or special pay structures for certain job families
Employer Size Total 001 - 249 28% 29 250 - 999 30% 30 1,000 or more 38% 24 All 31% 83
J6. Family members for which paid bereavement leave is offered
Employer SizeJob Family 001 - 249 250 - 999 1,000 or more AllInformation Technology 21% 23% 15% 20%Sales 29% 15% 8% 18%Telemarketing 0% 0% 0% 0%Nursing 7% 0% 8% 0%Pharmacy 0% 0% 8% 3%Executive 29% 8% 0% 0%Production 0% 0% 0% 0%Teachers 7% 8% 0% 5%Actuarial 0% 0% 0% 0%Union 7% 8% 0% 0%Attorneys 0% 0% 0% 0%Other 0% 38% 62% 0%
Total 14 13 13 40
Page 22

Section 5: General Pay Practices Survey Results 2017 SHRM-KC Wage/Salary Survey
Section K: Special Pay Practices - Other Issues
K1. Types of compensation structures utilized by Respondents
ExemptMarket Broad Step
Employer Size Based Banding Structure Total 001 - 249 43% 54% 0% 0% 4% 28 250 - 999 43% 40% 7% 3% 7% 30 1,000 or more 30% 61% 0% 0% 9% 23 All 40% 51% 2% 1% 6% 81
Non-Exempt OfficeMarket Broad Step
Employer Size Based Banding Structure Total 001 - 249 38% 58% 4% 0% 0% 26 250 - 999 48% 34% 7% 3% 7% 29 1,000 or more 27% 59% 0% 5% 9% 22 All 39% 49% 4% 3% 5% 77
Hourly ProductionMarket Broad Step
Employer Size Based Banding Structure Total 001 - 249 50% 40% 0% 0% 10% 10 250 - 999 50% 22% 6% 11% 11% 18 1,000 or more 17% 33% 0% 17% 33% 12 All 40% 30% 3% 10% 18% 40
K2. Percent of Respondents who utilize a job evaluation systemTotal
Non-Exe Non-ExeEmployer Size Exempt Office Hry Prod Exempt Office Hry Prod 001 - 249 54% 54% 56% 28 28 9 250 - 999 55% 48% 35% 29 29 20 1,000 or more 71% 70% 50% 24 23 12 All 59% 56% 44% 81 80 41
Other
Trad. Other
Trad. Other
Trad.
Page 23

Section 5: General Pay Practices Survey Results 2017 SHRM-KC Wage/Salary Survey
K3. Types of job evaluation systems being used by Respondents
Exempt
Employer Size Total 001 - 249 33% 7% 13% 20% 27% 0% 15 250 - 999 24% 12% 29% 18% 12% 6% 17 1,000 or more 65% 0% 6% 0% 18% 12% 17 All 41% 6% 16% 12% 18% 6% 49
Non-Exempt Office
Employer Size Total 001 - 249 33% 7% 13% 20% 27% 0% 15 250 - 999 20% 0% 27% 20% 20% 13% 15 1,000 or more 63% 0% 6% 0% 19% 13% 16 All 39% 2% 15% 13% 22% 9% 46
Hourly Production
Employer Size Total 001 - 249 33% 17% 17% 17% 17% 0% 6 250 - 999 13% 0% 38% 13% 13% 25% 8 1,000 or more 57% 0% 0% 14% 14% 14% 7 All 33% 5% 19% 14% 14% 14% 21
K4. Percent of Respondents with multiple facilities or divisions and a centralized compensation system
Employer Size Total 001 - 249 80% 20 250 - 999 84% 25 1,000 or more 86% 22 All 84% 67
Other
RankingClassifi-cation
Job Compnt. Other
Other
Market Slotting
Point Factor
Market Slotting
Point FactorRanking
Classifi-cation
Job Compnt.
Market Slotting
Point FactorRanking
Classifi-cation
Job Compnt.
Page 24

Section 5: General Pay Practices Survey Results 2017 SHRM-KC Wage/Salary Survey
K5. Base pay target percentile
Exempt
Employer Size Total 001 - 249 0% 12% 46% 27% 4% 12% 26 250 - 999 0% 5% 73% 14% 5% 5% 22 1,000 or more 0% 0% 57% 26% 13% 4% 23 All 0% 6% 58% 23% 7% 7% 71
Non-Exempt Office
Employer Size Total 001 - 249 4% 8% 50% 23% 8% 8% 26 250 - 999 5% 9% 68% 14% 0% 5% 22 1,000 or more 0% 0% 64% 18% 14% 5% 22 All 3% 6% 60% 19% 7% 6% 70
Hourly Production
Employer Size Total 001 - 249 0% 22% 44% 11% 22% 0% 9 250 - 999 0% 14% 79% 7% 0% 0% 14 1,000 or more 0% 0% 50% 10% 30% 10% 10 All 0% 12% 61% 9% 15% 3% 33
K5. Short-term incentive pay target percentile
Exempt
Employer Size Total 001 - 249 0% 9% 45% 9% 27% 9% 11 250 - 999 0% 0% 75% 25% 0% 0% 4 1,000 or more 0% 10% 70% 0% 20% 0% 10 All 0% 8% 60% 8% 20% 4% 25
Non-Exempt Office
Employer Size Total 001 - 249 0% 0% 56% 22% 11% 11% 9 250 - 999 0% 33% 33% 33% 0% 0% 3 1,000 or more 0% 0% 83% 0% 17% 0% 6 All 0% 6% 61% 17% 11% 6% 18
Hourly Production
Employer Size Total 001 - 249 0% 0% 50% 50% 0% 0% 2 250 - 999 0% 50% 50% 0% 0% 0% 2 1,000 or more 0% 0% 50% 0% 0% 50% 2 All 0% 17% 50% 17% 0% 17% 6
60-75th%tile
>75th%tile
<45th%tile
45-49th%tile
50th%tile
<45th%tile
45-49th%tile
50th%tile
51-59th%tile
51-59th%tile
<45th%tile
45-49th%tile
50th%tile
51-59th%tile
60-75th%tile
>75th%tile
60-75th%tile
>75th%tile
<45th%tile
45-49th%tile
50th%tile
51-59th%tile
60-75th%tile
60-75th%tile
>75th%tile
<45th%tile
45-49th%tile
50th%tile
51-59th%tile
>75th%tile
60-75th%tile
>75th%tile
<45th%tile
45-49th%tile
50th%tile
51-59th%tile
Page 25

Section 5: General Pay Practices Survey Results 2017 SHRM-KC Wage/Salary Survey
K5. Long-term incentive pay target percentile
Exempt
Employer Size Total 001 - 249 0% 14% 43% 0% 29% 14% 7 250 - 999 0% 0% 33% 33% 33% 0% 3 1,000 or more 0% 0% 60% 0% 40% 0% 5 All 0% 7% 47% 7% 33% 7% 15
Non-Exempt Office
Employer Size Total 001 - 249 0% 0% 57% 0% 29% 14% 7 250 - 999 0% 50% 0% 50% 0% 0% 2 1,000 or more 0% 0% 50% 0% 50% 0% 2 All 0% 9% 45% 9% 27% 9% 11
Hourly Production
Employer Size Total 001 - 249 0% 0% 33% 33% 33% 0% 3 250 - 999 0% 100% 0% 0% 0% 0% 1 1,000 or more 0% 0% 0% 0% 100% 0% 1 All 0% 20% 20% 20% 40% 0% 5
K5. Total compensation target percentile
Exempt
Employer Size Total 001 - 249 0% 14% 38% 19% 10% 19% 21 250 - 999 0% 6% 53% 29% 12% 0% 17 1,000 or more 0% 0% 67% 13% 13% 7% 15 All 0% 8% 51% 21% 11% 9% 53
Non-Exempt Office
Employer Size Total 001 - 249 0% 19% 43% 10% 14% 14% 21 250 - 999 6% 6% 59% 24% 6% 0% 17 1,000 or more 0% 0% 62% 15% 15% 8% 13 All 2% 10% 53% 16% 12% 8% 51
Hourly Production
Employer Size Total 001 - 249 0% 33% 17% 17% 17% 17% 6 250 - 999 0% 17% 67% 17% 0% 0% 12 1,000 or more 0% 0% 50% 0% 50% 0% 4 All 0% 18% 50% 14% 14% 5% 22
60-75th%tile
>75th%tile
<45th%tile
45-49th%tile
50th%tile
51-59th%tile
<45th%tile
45-49th%tile
50th%tile
51-59th%tile
<45th%tile
45-49th%tile
50th%tile
51-59th%tile
<45th%tile
45-49th%tile
60-75th%tile
>75th%tile
60-75th%tile
>75th%tile
60-75th%tile
>75th%tile
60-75th%tile
>75th%tile
<45th%tile
45-49th%tile
50th%tile
51-59th%tile
50th%tile
51-59th%tile
60-75th%tile
>75th%tile
<45th%tile
45-49th%tile
50th%tile
51-59th%tile
Page 26

About SHRM-KC
The Society for Human Resource Management of Greater Kansas City, Inc. (SHRM-KC) is a professional association dedicated to the advancement and support of the human resource profession. An affiliate of the Society for Human Resource Management (SHRM), SHRM-KC has long been recognized as one of the largest and oldest chapters of the Society for Human Resource Management. SHRM-KC began in 1953 as the Personnel Management Association (PMA). In 1954, PMA was chartered with ASPA (American Society of Personnel Administration) now known as SHRM. PMA was the fifth chapter chartered in the United States.
SHRM-KCP.O. Box 860272Shawnee, KS 66286-0272Phone - (913) 948-8623www.SHRM-KC.org
Special Thanks
We would like to extend a special thank you to Lockton Companies and Lori Maher McCombs of SHRM-KC for all their efforts in making this year's survey a success.
About Actuarial Consulting Services, Inc.
Actuarial Consulting Services, Inc. (ACS) is a premier employee benefits consulting firm. ACS provides professional products and services designed to maximize the value of client's employee benefit plans.
The consultants at ACS have extensive experience in consulting, insurance, and corporate HR environments. ACS's experience allows it to see the big picture in the group benefit marketplace and to access the impact this will have on its clients. As your strategic partner, ACS focuses on listening to you and learning about your group benefits. Their strong relationship allows them to provide the kind of products and services that add value to your group benefit plans.
ACS provides its clients with a full array or services, including
· Health claims data warehousing, plan utilization reporting and plan financial reporting· Strategic planning, vendor management and plan renewal services· IBU reserves, funding/COBRA rates and stop-loss analysis
Please contact Scott Stoltenberg or John Rankin at (402) 614-1844 or by email at [email protected] or [email protected].
Actuarial Consulting Services, Inc.5830 South 142nd Street, Suite BOmaha, NE 68137(402) 614-1844www.ACShrbenefits.com
Page 27