2017 vol. 50. no. 4 - educationalrev.us.edu.pl · e-mail: kendzor@novadoba org ua kim yongdeog phd,...
TRANSCRIPT

2017 Vol. 50. No. 4
CONTENTS
Stanisław JuszczykEditor’s Preface � � � � � � � � � � � � � � � � � � � � � � � � � � � � � � � � � � � � � � � � � � � � � � � � � � 11
� SOCIAL PEDAGOGYIngrid Emmerová, Jana Kohútová
Manifestations of Pupil Aggression towards Teachers in Elementary and Secondary Schools � � � � � � � � � � � � � � � � � � � � � � � � � � � � � � � � � � � � � � � � � � � 17
Rajka Bračun SovaUnderstanding Erasmus Students‘ Motivation: What Directs Erasmus Students‘ Choice of Destination and Particular Course � � � � � � � � � � � � � � � � 26
Petro Kendzor, Larysa KolesnykEducational and Socio-Psychological Needs of Internally Displaced Children in Ukraine � � � � � � � � � � � � � � � � � � � � � � � � � � � � � � � � � � � � � � � � � � � � � 36
Somaye Bikar, Afsaneh Marziyeh, Abdulwahab PourghazAffective Structures among Students and Their Relationship with Academic Burnout � � � � � � � � � � � � � � � � � � � � � � � � � � � � � � � � � � � � � � � � � � � � � � � 47
Krystyna Nowak-Fabrykowski, Monika Wiśniewska-Kin, Anastasia Bristley
Children’s Metaphoric Expressions ; The Meaning of Friendship� A Comparative Analysis Between the USA and Poland � � � � � � � � � � � � � � � 56
Mahtab Pouratashi, Asghar ZamaniHow Faculty Members’ Personality traits Influence their Education-Research Performance � � � � � � � � � � � � � � � � � � � � � � � � � � � � � � � � � � � � � � � � � � � � 70
Maria Świątkiewicz-Mośny, Katarzyna Kowalczewska-GrabowskaYouth and Cancer Prevention (with the Example of Cervical Cancer) � � � 83
© Copyright by Wydawnictwo Adam MarszałekToruń 2017
ISSN 1732-6729
Prenumeratę instytucjonalną można zamawiać w oddziałach firmy Kolporter S�A� na terenie całego kraju� Informacje pod numerem infolinii 801 205 555 lub na stronie internetowej
http://www�kolporter-spolka-akcyjna�com�pl/prenumerata�asp
WYDAWNICTWO ADAM MARSZAŁEK, ul� Lubicka 44, 87-100 Toruńtel�/fax 56 648 50 70; tel� 56 660 81 60, 56 664 22 35
e-mail: info@marszalek�com�pl www�marszalek�com�pl
Drukarnia nr 1, ul� Lubicka 46, 87-100 Toruń, tel� 56 659 98 96

54 ContentsContents
� PEDEUTOLOGYM.D. Díaz-Noguera, P. Toledo-Morales, C. Hervás-Gómez
Augmented Reality Applications Attitude Scale (ARAAS): Diagnosing the Attitudes of Future Teachers � � � � � � � � � � � � � � � � � � � � � � � � � � � � � � � � � � 215
Monika FraniaSelf-assessment of Attitudes Towards Media and the Knowledge of Safety in Cyberspace of Future Pedagogues and Teachers in Croatia and Poland � � � � � � � � � � � � � � � � � � � � � � � � � � � � � � � � � � � 227
� CHRONICLEInformation on the 5th International Asian Congress in Toruń (Poland), May 10–11, 2018 � � � � � � � � � � � � � � � � � � � � � � � � � � � � � � � � � � � � � � 241
Reviewers of the Manuscripts Sent from the Czech Republic, Poland, the Slovak Republic, and from the Whole World to “The New Educational Review” in 2017 � � � � � � � � � � � � � � � � � � � � � � � � � � � � � � � � � � � � � 243
Stanislaw Juszczyk, Mária Karasová, Alojz Kostelanský, Zuzana Chanasová, Miriam Uhrinová, Mária Vargová
Family as One of the Key Determinants of Media Education of Young School-age Children � � � � � � � � � � � � � � � � � � � � � � � � � � � � � � � � � � � � � � � � � � � � � 94
Anna BroschThe Need for Popularity and Facebook Usage Among Czech and Polish Young Adults � � � � � � � � � � � � � � � � � � � � � � � � � � � � � � � � � � � � � � � � � � � � � � � � � � 109
� GENERAL DIDACTICSBaskoro Adi Prayitno, Suciati
Narrowing the Gap of Science Students’ Learning Outcomes Through INSTAD Strategy � � � � � � � � � � � � � � � � � � � � � � � � � � � � � � � � � � � � � � � � � � � � � � � 123
Bens Pardamean, Harjanto Prabowo, Hery Muljo, Teddy Suparyanto, Eryadi Masli, Jerome Donovan
Team Based Learning as an Instructional Strategy: A Comparative Study � � � � � � � � � � � � � � � � � � � � � � � � � � � � � � � � � � � � � � � � � � � � � � � � � � � � � � � � � 134
Hyoung-Jin Moon, Jong-ho Nam, Yongdeog KimNew Measures to Improve Korean Culture Education for Chinese Students in South Korea: Focusing on racial differences � � � � � � � � � � � � � � 146
Katarzyna KrasońThe Educational Significance of Art – a Report from Experimental Research � � � � � � � � � � � � � � � � � � � � � � � � � � � � � � � � � � � � � � � � � � � � � � � � � � � � � � 159
Ewa Ogrodzka-Mazur, Anna Szafrańska, Josef Malach, Milan Chmura The Use of E-learning Resources by Academic Teachers – a Polish-Czech Comparative Study � � � � � � � � � � � � � � � � � � � � � � � � � � � � � � � � � � � � � � � 169
Sanja BaukMoving Education to Cloud : A pilot Study in Montenegrin Higher Education � � � � � � � � � � � � � � � � � � � � � � � � � � � � � � � � � � � � � � � � � � � � � � � � � � � � � 186
Dita CulkováThe Sensation Seeking Tendency and Learning Style of Grammar School Students with Extended Physical Education and Sports Training � � � � � � � � � � � � � � � � � � � � � � � � � � � � � � � � � � � � � � � � � � � � � � � � � � � � � � � 199

CONTRIBUTORS
Bauk Sanja Prof� PhD, Durban University of Technology, Faculty of Accounting & Informatics, Durban, South Africa
E-mail: bsanjaster@gmail�com Website: http://www�sanjabauk�ac�me
Bikar Somaye Master student of Educational Psychol-ogy, University of Sistan and Baluchestan, Zahedan, Iran
Bračun Sova Rajka PhD, Assistant professor, Faculty of Education, University of Ljubljana, Ljubljana, Slovenia
E-mail: rajka�bracun-sova@pef�uni-lj�si, Website: https://www�pef�uni-lj�si/
Bristley Anastasia Lead teacher, CDLL, Central Michigan University, USA
E-mail: brist1a@cmich�edu
Brosch Anna PhD, University of Silesia, Faculty of Pedagogy and Psychology, Department of Early Education and Media Pedagogy, Poland
e-mail: anna�brosch@us�eu�pl, Website: annabrosch�pl
Chanasová Zuzana Doc�, PaedDr� PhD, Associate Professor, Catholic University in Ružomberok, Ružomberok
E-mail: zuzana�chanasova@ku�sk Website: https://kpep�wordpress�com/2017/03/06/chanasova/
Chmura Milan PhD, Mgr�, University of Ostrava, Department of Pedagogy and Andragogy, Ostrava, Czech Republic
E-mail: milan�chmura@osu�cz
Culková Dita Mgr�, Ph�D�, Assistant Professor, Department of Physical Education and Sports, Faculty of Education, University of Hradec Králové, Hradec Králové, Czech Republic
E-mail: dita�culkova@uhk�cz, Website: culkova�webnode�cz
Díaz-Noguera M�D� Prof� PhD, University of Seville, Seville, Spain
E-mail: noguera@us�es
Donovan Jerome Doctor, Senior Lecturer, Swinburne University of Technology, John Street, Hawthorn, Victoria, Australia 3122
Email: jdonovan@swin�edu�au, Website: http://www�swinburne�edu�au/
Emmerová Ingrid Prof�, PhDr�, PhD, Matej Bel University, Faculty of Education, Department of Pedagogy, Banská Bystrica, Slovakia
E-mail: ingrid�emmerova@umb�sk
Frania Monika PhD, University of Silesia, Faculty of Pedagogy and Psychology, Katowice, Poland
E-mail: monika�frania@us�edu�pl

98 ContributorsContributors
Hervás-Gómez C�, PhD, University of Seville, Seville, Spain
Associate Professor, Faculty of Educa-tional Sciences and Psychology, Univer-sity of Sistan and Baluchestan, Zahedan, Iran
Email: hjenaabadi@ped�usb�ac�ir
Juszczyk Stanisław Prof�, PhD, DrSc� University of Silesia, Faculty of Pedagogy and Psychology, Katowice, Poland
E-mail: stanislaw�juszczyk@us�edu�pl, Website: http://www�us�edu�pl/us-address-book/emp/10102
Karasová Mária PaedDr�, PhD�, Faculty of Pedagogy, Catholic university in Ružomberok, Ružomberok, Slovakia
E-mail: maria�karasova@ku�sk, Website: http://ludia�ku�sk/person�xhtml?id=maria�karasova%40ku�sk
Kendzor Petro Doctor of Pedagogy, Associate Professor, Lviv Regional Institute of Postgraduate Pedagogical Education, Ukraine
E-mail: kendzor@novadoba�org�ua
Kim Yongdeog PhD, Associate Professor, Hankuk University of Foreign Studies, Yongin, South Korea
E-mail: kimyd@hufs�ac�kr
Kohútová Jana PhDr�, internal PhD student, Matej Bel University Faculty of Education, Department of Pedagogy, Banská Bystrica, Slovakia
E-mail: jana�kohutova@umb�sk
Kolesnyk Larysa PhD (Candidate of Pedagogical Sciences), Associate professor, Department of Pedagogy and Methodology of Primary Education National Dragomanov Pedagogical University, Ukraine
E-mail: l�v�kolesnyk@npu�edu�ua
Kostelanský Alojz Doc�, PaedDr�, ThLic�, PhD, Associate Professor, Faculty of Pedagogy, Catholic University in Ružomberok, Ružomberok, Slovakia
E-mail: alojz�kostelansky@ku�sk, Website: http://ludia�ku�sk/person�xhtml?id=alojz�kostelansky%40ku�sk
Kowalczewska-Grabowska, Katarzyna
PhD, University of Silesia, Faculty of Pedagogy and Psychology, Katowice, Poland
E-mail: katarzyna�kowalcze-wska-grabowska@us�edu�pl
Krasoń Katarzyna PhD, Professor, University of Silesia, Faculty of Pedagogy and Psychology, Katowice, Poland
E-mail: katarzyna�krason@us�edu�pl
Malach Josef Doc� PhDr� CSc�, University of Ostrava, Department of Pedagogy and Andragogy, Ostrava, Czech Republic
E-mail: josef�malach@osu�cz
Marziyeh Afsaneh Assistant Professor, Faculty of Educa-tional Science and Psychology, Universiy of Sistan and Baluchestan, Zahedan, Iran
Email: marziyeh@ped�usb�ac�ir
Masli Eryadi Doctor, Lecturer, Swinburne University of Technology, John Street, Hawthorn, Victoria, Australia 3122
E-mail: emasli@swin�edu�au, Website: http://www�swinburne�edu�au/
Moon Hyoung-Jin PhD, Professor, DongDuk Women’s University, Seoul, South Korea
E-mail: subugwi@hanmail�net
Muljo Hery Master‘s, Researcher, Bina Nusantara University, Jakarta, Indonesia
E-mail: heryhm@binus�edu, Website: http://research�binus�ac�id/bdsrc/
Nam Jong-ho PhD, Assistant Professor, Hankuk Univer-sity of Foreign Studies, Yongin, South Korea
E-mail: leopard3@hanmail�net
Nowak-Fabrykowski Krystyna
Central Michigan University, USA E-mail: nowak1k@cmich�edu
Ogrodzka-Mazur Ewa
Prof�, PhD, habilitated doctor, University of Silesia in Katowice, Faculty of Ethnology and Educational Science in Cieszyn, Cieszyn, Poland
E-mail: ewa�ogrodzka-mazur@us�edu�pl; eom1@wp�eu
Pardamean Bens Doctor, Director, Bioinformatics & Data Science Research Center, Bina Nusantara University, Jakarta, Indonesia
E-mail: bpardamean@binus�edu, Website: http://research�binus�ac�id/bdsrc/
Pouratashi Mahtab Institute for research and planning in higher education, Tehran, Iran
Pourghaz Abdulwa-hab
Associate Professor, Faculty of Educa-tional Science and Psychology, Universiy of Sistan and Baluchestan, Zahedan, Iran
E-mail: w�pourghaz@ped�usb�ac�ir
Prabowo Harjanto Doctor, Rector, Bina Nusantara Univer-sity, Jakarta, Indonesia
E-mail: harprabowo@binus�edu, Website: http://binus�ac�id/
Prayitno Baskoro Adi
Dr, Lecturer, Department of Biology Education, Faculty of Teacher Training and Education, Sebelas Maret University, Surakarta, Indonesia
E-mail: baskoro_ap@fkip�uns�ac�id, Website: baskoro�staff�uns�ac�id
Suciati Dr, Associate Professor, Department of Biology Education, Faculty of Teacher Training and Education, Sebelas Maret University, Surakarta, Indonesia
E-mail: suciati�sudarisman@yahoo�com, Website: http://dosen�fkip�uns�ac�id/data/index�php?prodi=p18&id =19580723
Suparyanto Teddy Master‘s, Research Assistant, Bioinfor-matics & Data Science Research Center, Bina Nusantara University, Jakarta, Indonesia
E-mail: teddysuparyanto@yahoo�com, Website: http://research�binus�ac�id/bdsrc/
Świątkiewicz-Mośny Maria
PhD, Jagiellonian University in Kraków, Faculty of Philosophy, the Institute of Sociology, Kraków, Poland
E-mail: maria�swiatkiewicz-mosny@uj�edu�pl

10 Contributors
Szafrańska Anna PhD, habilitated doctor, University of Silesia in Katowice, Faculty of Ethnology and Educational Science in Cieszyn, Cieszyn, Poland
E-mail: anna�gajdzica@us�edu�pl; annagajdzica@interia�eu
Toledo-Morales P� PhD, University of Seville, Seville, Spain hsharifi@yahoo�com Uhrinová Miriam PaedDr�, PhD, Faculty of Pedagogy,
Catholic University in Ružomberok, Ružomberok, Slovakia
E-mail: miriam�uhrinova@ku�sk, Website: http://ludia�ku�sk/person�xhtml?id=miriam�uhrinova%40ku�sk
Vargová Mária PaedDr�, PhD, Faculty of Pedagogy, Catholic university in Ružomberok, Ružomberok, Slovakia
E-mail: maria�vargova@ku�sk, Website: http://ludia�ku�sk/person�xhtml?id=maria�vargova%40ku�sk
Wiśniewska-Kin Monika
PhD, habilitated doctor, University of Lodz, Fakulty of Education Science
E-mail: monikawk@uni�lodz�pl
Zamani Asghar Institute for research and planning in higher education, Tehran, Iran

Editor’s Preface
The fourth number of The New Educational Review in 2017 is the fiftieth issue of our journal since the start of its foundation in 2003� In this issue there are mainly papers from: Australia, the Czech Republic, Indonesia, Iran, Jordan, Kuwait, Lithuania, Malaysia, Poland, Russia, the Slovak Republic, Slovenia, South Africa, South Korea, Spain, Ukraine, and the USA, because our journal is open for presentation of scientific papers from all over the world�
In the present issue, the International Editors’ Board have proposed the follow-ing subject sessions: Social Pedagogy, General Didactics, Pedeutology, Chronicle, and Review�
In the subject session “Social Pedagogy” we publish nine articles� The goal of the study by Ingrid Emmerová and Jana Kohútkova is to determine a statistically significant relationship between the forms of aggressive behaviour and the age of teachers and the length of their teaching experience� The paper by Rajka Bračun Sova is a Central European contribution to the current knowledge of Erasmus students’ motivation� The aim of the paper by Petro Kendzor and Larysa Kolesnyk is to present the results of sociological research into socio-psychological needs of school-age children, displaced from the Anti-Terrorist Operation Zone in Ukraine� Somaye Bikar, Afsaneh Marziyeh and Abdulwahab Pourghaz discuss the relationship between affective structures and academic burnout among male and female third grade high school students in Zahedan (Iran)� The goal of the research by Krystyna Nowak-Fabrykowski, Monika Wiśniewska-Kin, and Anasta-sia Bristley is to analyse children’s understanding of the concept of friendship by investigating symbolic representations in drawing and metaphoric expression in language� In their article, Mahtab Pouratashi and Asghar Zamani investigate the relationship between personality traits and education-research performance of faculty members� The research material described by Maria Świątkiewicz-Mośny and Katarzyna Kowalczewska-Grabowska allows for formulating guidelines for the educational and preventive treatment programs against cancer addressed to young
Stanisław Juszczyk

1312 Editor’s PrefaceStanisław Juszczyk
We hope that this edition, like previous ones, will encourage new readers not only from the Central European countries to participate in an open international discussion� On behalf of the International Editors’ Board I would like to invite representatives of different pedagogical sub-disciplines and related sciences to publish their texts in The New Educational Review, according to the formal as well as essential requirements placed on our website: www�educationalrev�us�edu�pl – For Authors�
people and their parents� The Polish-Slovak scientific team: Stanisław Juszczyk, Mária Karasová, Alojz Kostelanský, Zuzana Chanasová, Miriam Uhrinová, and Mária Vargová examines media education performed in formal and non-formal ways among young school-aged children in Slovakia, as part of VEGA project No� 1/0913/15� The goal of the study by Anna Brosch is to determine preferences con-cerning Facebook usage by university students in Poland and the Czech Republic regarding their gender, age and nationality�
In the subject session “General Didactics” we publish seven articles� The research by Baskoro Adi Prayinto and Suciati aims to examine the strategy effec-tiveness of the Integrating Inquiry-based learning and Student Teams Achieve-ment Division compared to other strategies: Inquiry, Student Teams Achievement Division, and conventional learning, in order to narrow Upper Academic Ability and Lower Academic Ability science students’ learning outcome gap� The use of Team Based Learning as an instructional strategy in undergraduate health sci-ence curricula has been identified by Bens Pardamean et al� as a way to improve student learning outcomes� To derive a more effective educational method, racial differences among Chinese students in learning Korean culture were investigated by Hyoung-Jin Moon, Jong-ho Nam and Yongdeog Kim� The aim of the article by Katarzyna Krasoń is to present a strategy of the educational use of art in primary school grades 1-3� The article by Ewa Ogrodzka-Mazur, Anna Szafrańska, Josef Malach, and Milan Chmura is a result of the collaboration between Polish and Czech scientists, who explore the issues of applying resources from the e-learning environment by academic teachers� In her article, Sanja Bauk considers challenges of moving education into Cloud under the conditions of digital divide� In her paper, Dita Culková examines the sensation seeking tendency and learning style of grammar school students with extended physical education and sports training�
In the subject session “Pedeutology” we publish two articles� The aim of the study presented by M�D� Díaz-Noguera, P� Toledo-Morales, and C� Herváas-Gómez is to identify the attitudes of future teachers (in pre-service teacher education) toward Augmented Reality applications� In her paper, Monika Frania explores, compares, and describes the level of knowledge on selected issues concerning safety in cyberspace among people preparing for the profession of a pedagogue and a teacher, and presents opinions of the examined persons on their attitudes towards the broadly understood media�
In the subject session “Chronicle ” we publish information on the 5th Interna-tional Asian Congress, which will be held in Toruń (Poland), on May 10–11, 2018�


Social Pedagogy


Manifestations of Pupil Aggression towards Teachers in Elementary and Secondary Schools
DOI: 10.15804/tner.2017.50.4.01
AbstractThe study focuses on pupils’ aggression towards teachers� The goal of the study was to determine a statistically significant relationship between the forms of aggressive behaviour and the age of teachers and the length of their teaching experience� The research sample consisted of 268 teachers of elementary schools, secondary vocational schools and grammar schools in the region of Banská Bystrica� Results revealed a statistically significant negative relationship between teachers’ age and the years of teaching experience in three forms of aggressive behaviour: refusal to obey instructions, intentional disruption and ironic remarks� A statistically significant relationship was observed between the length of teachers’ teaching experience and destruction of school property�
Keywords: aggression, pupil, teacher, pupils’ aggressive behaviour towards teachers
Introduction
The increase in socio-pathological phenomena in society has manifested itself in the increase in pupils’ problem behaviour in elementary and secondary schools� Aggressive behaviour is clearly a socio-pathological phenomenon which is complex and multicausal� Currently, the increase in pupil aggressive behaviour, shifting to ever lower age brackets (Emmerová, I�, 2014, Kirves, L�, Sajaniemi, N�, 2012; Saracho, O�N�, 2017) and manifested in various forms, has become a serious
Ingrid Emmerová, Jana Kohútová Slovakia

1918 Manifestations of Pupil Aggression Ingrid Emmerová, Jana Kohútová
etc�; the teacher’s failure to handle well new electronic media - the Internet and computer applications, teachers’ burn out syndrome resulting from their long-term work overload�
Society-wide changes have caused an increase in various socio-pathological phenomena (e�g�, crime, substance and non-substance addictions, etc�) and thus also an increase in problem behaviour in children and youth� Another significant aspect is also the general negative attitude of the public to education and the status of the teaching profession� It is necessary to increase the prestige and attractiveness of the teaching profession� An extremely important role is played by the family, parents’ moral values, their attitude to education and school, or lack of attention to the child, too liberal parenting, etc�
Methodological background and methods of research
The occurrence of aggressive behaviour is described by several authors as con-siderably increasing problems in the school setting� Teachers are directly involved in situations where aggression is targeted at their person by pupils who are at vertical level towards them in terms of social relations�
Our research objectives were specified as follows: • Examine the statistically significant relationship between the forms of
pupils’ aggressive behaviour towards teachers and teachers’ age; • Examine the statistically significant relationship between the forms of
pupils’ aggressive behaviour towards teachers and the length of teachers’ teaching experience;
• Examine the occurrence of pupils’ aggressive behaviour towards teachers�The research focused on the following variables in teachers: age, length of
teaching experience in relation to forms of aggression manifested by pupils towards teachers� The research was conducted with the use of a questionnaire of our own design, with scaled questions (5-point scale - ranging from “I completely disagree” to “I completely agree”) and open questions: perception of aggression, occurrence of aggression forms, reasons for pupils’ aggressive behaviour, disci-pline, and teacher authority� The research comprised 268 teachers selected by convenience sampling� The research tool pilot was carried out in 2015, when the author conducted research on the issue, and in 2016 she amended the question-naire accordingly� The research sample consisted of 148 teachers of elementary schools, 75 teachers of secondary vocational schools and 45 teachers of four-year grammar school� The respondents came from various municipalities and towns
problem� Aggression is a continual process, which can progress from disobedience of rules through verbal and non-verbal threats, damage to property, even to phys-ical harm to others (Daly, D�L�, Sterba, M�N�, 2011)�
In the current school practice, aggressive behaviour of pupils towards teachers is not rare, which has been pointed out by several authors (Espelage, D�, Anderman, E�M�, Brown, V�E�, Jones, A�, Lane, K�L�, McMahon, S�D�, Reddy, L�A�, Reynolds, C�R�, 2013; Garrett, L�, 2014; Kauppi, T�, Pörhölä, M�, 2012a; Kopecký, K�, Szot-kowski, R�, 2017, etc�)�
Causes leading pupils to undisciplined, insolent, aggressive behaviour, even bullying of teachers, are various; it may be fun, a feeling of power, but also an effort to be at the centre of attention, to amuse those around and be appreciated for one’s conduct, have a dominant position and control over the situation, also retaliation for injustice and wrong done by the teacher, fun and an effort to get rid of boredom in class�
C� de Wet (2010), J�K� Chen, R�A� Astor (2009), E� Lahelma, T� Palmu, T� Gor-don (2000) and A�A� Terry (1998) conducted studies on primary or secondary school teachers� Of concrete forms, gross verbal insults or swearing by pupils in class prevailed, followed by negative verbal expressions (unpleasant statements, ridicule and swearing), respondents were forced to do something against their will, teachers reported social manipulation, taking of things and direct physical attacks or threats�
The term bullying of teachers is correct because it has much in common with the definition of bullying (T� Kauppi, M� Pörhölä, 2012b)� In their opinion, the point “aggressor´s superiority” is controversial because, theoretically, the teacher is always superior to pupils� However, the superiority of pupil bullies is real and sometimes the teacher actually has minor power�
Currently, cyber-bullying of teachers has become an up-to-date problem� Pupils try to record the teacher in an embarrassing situation and publish it on the Inter-net� What happens is that pupils purposefully provoke the teacher and post his/her reactions on the web� Cyber-bullying of teachers has a profound impact on their psychological and physical well-being, may lead to depression, frustration, resig-nation, even suicide� In 2016 research, 21�73% of teacher-respondents reported having experienced a cyber-attack on their person (Kopecký, K�, Szotkowski, R�, 2017)�
K� Hollá (2012) indicates the following causes leading pupils to attacks on teachers (in relation to cyber-attacks): the teacher’s lack of authority, the teacher’s low social status, insufficient engagement of pupils in class resulting in boredom they get rid of by experimenting with mobile phones, revenge for marks, reproach,

2120 Manifestations of Pupil Aggression Ingrid Emmerová, Jana Kohútová
in the region of Banská Bystrica� The majority of the teachers participating in the research were from Zvolen and Banská Bystrica, with Banská Bystrica having the highest number of schools in the region� Distribution of the research sample is presented in Table 1�
Table 1. Distribution of respondents by age and length of teaching experience (N=268)
Teacher’s age Teaching experienceYears N % Number of years N %
25 – 30 y. 29 10�82 1 – 5 y. 40 14�9231 – 40 y. 65 24�25 6 – 10 y. 27 10�0741 – 50 y. 80 29�85 11 – 15 y. 34 12�6851 – 60 y. 86 32�08 16 – 20 y. 38 14�1761 – 70 y. 8 2�98 21 – 25 y. 37 13�80
31 – 40 y.41
26 – 30 y. 51 19�0215�29
Research results
On the basis of the research results, 85�4% of the teachers encountered aggres-sive behaviours� The most frequent were intentional disrupting, ignoring and provoking� Statistical analysis was carried out of the correlation between the age, the length of teaching experience and the forms of aggression presented in Tables 2 and 3� Data were analysed using a non-parametric test because a non-standard questionnaire was used and the data did not meet the normal distribution condi-tion� The variable of the teacher’s age correlated statistically significantly with the following variables of forms of aggression: refusal to obey instructions, intentional disruptions, and ironic remarks� Spearman’s coefficient was negative, which means that the younger the teacher, the higher the rate of aggression�
The research results show that there is a statistically significant linear relation-ship between the forms of aggressive behaviour and the length of teaching expe-rience, where it was found out that the shorter the teacher’s teaching experience, the higher the rate of pupils’ aggression towards him/her� It was manifested, in particular, in the following forms: destruction of school property, refusal to obey instructions, intentional disrupting, and ironic remarks� Based on our research, it can be stated that the statistically significant linear relationship between three identical forms of pupils’ aggressive behaviour towards teachers is significant�
Table 2. Correlation between the forms of aggressive behaviour and the teacher’s age
AgeRefusal to obey instructions and fulfil assignments
Spearman’s rho PN AM SD Md
25 – 30 y. 29 3�97 1�08 4�14 -0�174 0�004
31 – 40 y. 65 3�71 1�28 3�9641 – 50 y. 80 3�60 1�28 3�8151 – 60 y. 86 3�36 1�32 3�4661 – 70 y. 8 2�38 1�68 1�80
AgeIntentional disruption
Spearman’s rho PN AM SD Md
25 – 30 y. 29 3�93 1�06 4�10 -0�161 0�00831 – 40 y. 65 3�78 1�24 4�05
41 – 50 y. 80 3�53 1�28 3�69
51 – 60 y. 86 3�38 1�33 3�47
61 – 70 y. 8 2�88 1�55 2�75
AgeIronic remarks
Spearman’s rho PN AM SD Md
25 – 30 y. 29 3�07 1�51 3�36 -0�185 0�00231 – 40 y. 65 3�08 1�48 3�2041 – 50 y. 80 2�60 1�46 2�4351 – 60 y. 86 2�25 1�46 2�1561 – 70 y. 8 2�13 1�64 2�00
Table 3. Correlation between the forms of aggressive behaviour and the length of teaching experience
Length of teaching experienceDestruction of school property Spearman’s
rho PN AM SD Md
1 – 5 y. 40 3�18 1�61 3�37 -0�130 0�0346 – 10 y. 27 3�07 1�63 3�45
11 – 15 y. 34 2�24 1�49 1�7716 – 20 y. 38 2�76 1�46 2�6921 – 25 y. 37 2�69 1�65 2�1026 – 30 y. 51 2�65 1�54 2�4631 – 40 y. 41 2�29 1�52 1�86

2322 Manifestations of Pupil Aggression Ingrid Emmerová, Jana Kohútová
Discussion
The occurrence of pupils’ aggressive behaviour towards teachers in school, found out in our research (85�4%), corresponds to the findings of K� Pervin and A� Turner (1998, p� 5), who report in their study that more than 91% of teachers encountered in their teaching career pupils’ aggressive behaviour towards their person� This fact was pointed out also by I� Emmerová (2014, pp� 150 – 151), who conducted research on the issue in the region of Banská Bystrica and her results showed that only 32�4% of elementary and secondary school teachers had not encountered even one form of aggressive behaviour� M� Niklová and M� Šajgal-ová (2016, p� 107) found out that only 20�26% of teachers had not encountered aggression towards their person� In another study (Džuka, J�, Dalbert, C�, 2007, p� 10), 108 teachers of secondary vocational schools were examined, out of whom 60 (55%) reported experiencing pupil violence within the last 15 days�
Our research showed that teachers encounter the following manifestations of aggression most frequently: intentional disrupting, ignoring and provoking� Teachers either ignore such manifestations as if overlooking them or take disci-plinary actions� It wastes teaching time and raises conflicts between the teacher and pupils, often also pupils’ parents� Since the coefficients are relatively low, the statistical correlation should be confirmed in larger research samples outside the region of Banská Bystrica�
The research confirmed the statistically significant correlation between the forms of aggression (in refusal to obey instructions, intentional disrupting, and ironic remarks) and the teacher’s age and length of teaching experience� This cor-responds to the results of M� Niklová and M� Šajgalová (2016, p� 107), who found out that teachers with longer teaching experience reported the lowest occurrence of pupil aggressive behaviour towards their person� 1�29% of teachers with the teaching experience of 21 – 25 years, and even 25% of teachers with the teaching experience of 6 – 10 years reported encountering pupil aggression�
Conclusion
The Act No� 317/2009 on teaching staff and professional staff, Section 3, specifies that a member of teaching staff has the status of a protected person in relation to performance of teaching activities� This can be evaluated positively; the positive aspects include greater authority, safety, acceptance of teachers by pupils and better protection of teachers�
Length of teaching experienceDestruction of school property Spearman’s
rho PN AM SD Md
Length of teaching experience Refusal to obey instructions and fulfil
assignments Spearman’s rho P
N AM SD Md1 – 5 y. 40 3�78 1�05 3�38 -0�161 0�008
6 – 10 y. 27 4�07 1�29 4�4011 – 15 y. 34 3�59 1�28 3�7616 – 20 y. 38 3�50 1�39 3�7321 – 25 y. 37 3�76 1�23 4�0026 – 30 y. 51 3�22 1�33 3�2631 – 40 y. 41 3�24 1�44 3�33
Length of teaching experience Intentional disruption Spearman’s
rho PN AM SD Md
1 – 5 y. 40 3�73 1�17 3�90 -0�162 0�0086 – 10 y. 27 4�26 0�93 4�39
11 – 15 y. 34 3�62 1�32 3�8216 – 20 y. 38 3�45 1�24 3�5521 – 25 y. 37 3�76 1�34 4�0826 – 30 y. 51 3�18 1�32 3�2231 – 40 y. 41 3�34 1�37 3�38
Length of teaching experience Ironic remarks Spearman’s
rho PN AM SD Md
1 – 5 y. 40 2�80 1�43 3�00 -0�174 0�0046 – 10 y. 27 3�52 1�39 3�85
11 – 15 y. 34 2�94 1�51 3�0016 – 20 y. 38 2�74 1�53 2�7021 – 25 y. 37 2�62 1�55 2�3026 – 30 y. 51 2�29 1�39 1�9731 – 40 y. 41 2�44 1�46 2�09
On the basis of our research, it can be stated that there is a statistically sig-nificant linear negative relationship between three identical forms of pupils’ aggressive behaviour towards teachers and both variables (the teacher’s age and length of teaching experience)� In addition, a correlation was confirmed between the teacher’s age and destruction of school property in his/her presence�

2524 Manifestations of Pupil Aggression Ingrid Emmerová, Jana Kohútová
against teachers: Recommendations for a national research, practice and policy agenda� American Psychologist. No 2, pp� 75 – 87�
Garrett, L� (2014)� The student bullying of teachers: An exploration of the nature of the phenomenon and ways in witch it is experienced by teachers� Aigne. No 5, pp� 19 – 40�
Hollá, K� (2012)� Cyberbullying of teachers (Kyberšikanovanie učiteľov)� Pedagogika.sk. No 3, pp� 166 – 180�
Kauppi, T� & Pörhölä, M� (2012a)� School teachers bullied by their students� Teachers´ attributions and how they share their experiences� Teaching and Teacher Education. No 7, pp� 1059 – 1068�
Kauppi, T� & Pörhölä, M� (2012b)� Teachers bullied by students: Forms of bullying and perpetrator characteristics� Violence and Victims. No 3, pp� 396 – 413�
Kirves, L� & Sajaniemi, N� (2012)� Bullying in early educational settings� Early Child Development and Care. No 3 – 4, pp� 383 – 400�
Kopecký, K� & Szotkowski, R� (2017)� Specifics of cyberbullying of teachers in Czech schools – A national research� Informatics in Education� No 1, pp� 103 – 119�
Lahelma, E� – Palmu, T� – Gordon, T� (2000)� Intersecting Power Relations in Teachers´ Experiences of Being Sexualized or Harassed by Students� Sexualities. No 4, pp� 463 – 481�
Niklová, M� & Šajgalová, M� (2016)� Pupils´Aggressive Behaviour towards Teachers in Elementary Schools in Slovakia� The New Educational Review. No� 4, pp� 104 – 118�
Pervin, K� & Turner, A� (1998)� A Study of Bullying of Teachers by Pupils in an Inner London School� Pastoral Care. No 4, pp� 4 – 10�
Practical Guide to Protecting Teaching Staff and Professional Staff (Praktická príručka k ochrane práv pedagogického zamestnanca a odborného zamestnanca). (2015)� Brati-slava: Ministry of Education, Science, Research and Sport of the Slovak Republic�
Saracho, O�N� (2017)� Bullying prevention strategies in early childhood education� Early Childhood Education Journal. No 4, pp� 453 – 460�
Terry, A�A� (1998)� Teachers as targets of Bullying by their Pupils: A Study to Investigate Incidence� British Journal of Educational Psychology. No 2, pp� 255 – 269�
The Act No. 317/2009 on teaching staff and professional staff.
In November 2015, the Ministry of Education, Science, Research and Sport of the Slovak Republic issued the Practical Guide to Protecting Teaching Staff and Professional Staff (Praktická príručka k ochrane práv pedagogického zamestnanca a odborného zamestnanca) (2015)� The main purpose of the document is the effort to increase the legal consciousness of the teaching staff and professional staff at schools� It also includes model examples as well as concrete examples from practice�
Within protection from attacks on teaching staff and professional staff, it is necessary to specify principles for communication with the external environment and include esteem, regard, and respect for human rights in internal regulations and documents� Attackers can be school pupils, but also their parents, legal rep-resentatives or other relatives� The body of laws provides teaching staff and pro-fessional staff with general and special protection from attacks that are offences, crimes or infringements on their right for protection of personality and personal expressions, and occur during performance of teaching or professional activities or related thereto�
Schools must pay attention to prevention, implement prevention programmes aimed at harmonization of relations and improvement of the school climate� More attention should be paid to this area also in the higher education of future teach-ers� In-service teachers should be offered such educational activities and should be motivated to attend them�
In the area of the prevention of the cyber-bullying of teachers, it is required to increase teachers’ awareness of active protection in the Internet environment� The number of professional staff in schools trained in social-educational prevention at a professional level should be increased�
ReferencesChen, J�K� & Astor, R�A� (2009)� Students’ Reports of Violence against Teachers in Taiwan-
ese Schools� Journal of School Violence. No 1, pp� 2 – 17� Daly, D�L� & Sterba, M�N� (2011)� Working with Aggressive youth. Nebraska, 224 p�De Wet, C� (2010)� Victims of educator-targeted bullying: a qualitative study� South African
Journal of Eductaion. Vol 30, pp� 189 – 201� Džuka, J� & Dalbert, C�(2007)� Student violence against teachers: Teachers’ well-being and
the belief in a just world� European Psychologist. No 12, pp� 253 – 260�Emmerová, I� (2014)� Aggressive Behaviour of Pupils against Teachers – Theoretical Reflec-
tion and School Practice� The New Educational Review, Vol� 35� No� 2, pp� 147 – 156�Espelage, D� – Anderman, E�M� – Brown, V�E� – Jones, A� – Lane, K�L� – McMahon, S�D� –
Reddy, L�A� – Reynolds, C�R� (2013)� Understanding and preventing violence directed

27Understanding Erasmus Students‘ Motivation
Understanding Erasmus Students‘ Motivation : What Directs Erasmus Students‘ Choice of Destination
and Particular Course
DOI: 10.15804/tner.2017.50.4.02
AbstractThis paper is a Central European contribution to the current knowledge of Erasmus students‘ motivations� It takes as its starting point the fact that one of the reasons for studying in a foreign country is learning about different cultures� 30 Erasmus students from 8 European countries, enrolled in Museum Education course in two academic years at the Faculty of Education, University of Ljubljana, participated in the research� The analysis of qualitative data, col-lected by individual interviews, a focus group and written personal reflections, revealed that, when making specific country and study decisions, students are driven by three motivational factors: discovery, change and curiosity� The research, done from the perspective of cultural heritage, additionally indicated how geography shapes the cultural experience of Erasmus students and what role museum and heritage site visiting play in it�
Keywords: higher education, internationalisation, intra-European student mobility, motivation
Introduction
Internationalisation of higher education is an important issue in the EU� The focus of this paper is intra-European student mobility, precisely incoming mobility of students within the European Community Action Scheme for the Mobility of
Rajka Bračun SovaSlovenia
University Students (Erasmus)� It has been estimated that in Europe on average more than 10 percent of recent graduates spent a period of study of at least three months in another country during the course of their study (about a third with Erasmus support), and the target for the year 2020 is 20 percent (Teichler, 2013, pp� 70 – 71)�
Despite the dramatic growth of incoming foreign students since 1999, when Slovenia joined Erasmus, no empirical data has been collected to understand the motivation of international students – why they choose Slovenia and what they expect to learn from a particular course� As van Ginkel (2011, p� 10) stressed, ‚‘the success of internationalisation is not simply the numbers involved in mobility programmes�‘‘ This paper is a contribution to the field�
The research was conducted at the oldest public university in Slovenia, the Uni-versity of Ljubljana� It involved 30 Erasmus students of Museum Education at the Faculty of Education� I wanted to understand certain students‘ decision-making processes: what makes Slovenia attractive to foreign students and to what extent cultural heritage – learning about history, identity – is part of Erasmus experience� In order to better understand students‘ motivation, qualitative methodology was used� Before I present it in more detail, let us look at the conceptual underpinnings of the research�
Theoretical Background
The definition to internationalisation used in this paper is that formulated by Knight (2004, p� 11), who sees it as “the process of integrating an international, intercultural or global dimension into the purpose, functions or delivery of post-secondary education�” While in the past, internationalisation was more or less equal to the study of foreign languages, today international higher education is regarded to be more complex and ambitious – student learning outcomes have to include intercultural knowledge, skills, and values�
Teichler (2013, p� 56) sees intra-European student mobility as one of the EU’s political strategies of intercultural understanding: “Efforts to facilitate and actually increase student mobility have already played a role in Europe for many decades� Already since World War II, the hope that more detailed knowledge of other countries would dilute prejudices and increase sympathy for other ways of life and thinking gained momentum�” The EU has particularly put strong emphasis on short-term, temporary mobility� According to one of the leading researchers of intra-European student mobility, Ewa Krzaklewska from Poland, the objective
2928 Understanding Erasmus Students‘ Motivation Rajka Bračun Sova
behind Erasmus and similar programmes is not to create a generation of highly educated young Europeans but rather to build their inter-cultural skills and foster identification with the EU (Feyen & Krzaklewska, 2013)�
Research on Erasmus students’ motivation shows that students have various reasons, desires, objectives and expectations for studying in a foreign country� In a mixed method study, Krzaklewska (2008) identified four areas of motivation: academic, linguistic, cultural, and personal� She found out that students decide to do Erasmus exchange for academic purposes, to practice a foreign language, to live in a foreign country and at the same time learn about new culture and to gain new personal experience� A Spanish quantitative study, conducted among Erasmus students at a single university, similarly showed that academic and cultural factors, the wish to get to know a new environment and to have a European experience are the most important reasons for living and studying abroad (Fombona, Rodríguez & Pascual Sevillano, 2013)� Gričar and Neary (2016) interviewed eight students who had studied or worked abroad� Their opinion was that the promotion of local cultures was one of the issues in which mobility requires support� Lesjak et al� (2015) conducted a quantitative survey among Erasmus students from 26 Euro-pean countries� Their study revealed that students’ choice of destination is not only driven by typical professional and personal reasons, already identified by previous researchers, but depends also on tourism attractiveness, location and features of a chosen destination, such as popularity, richness in culture, arts and history, event offer, safety and security, night life, etc� According to Rodríguez Gonzáles, Bustillo Mesanza and Mariel (2011), country size, cost of living, distance, educational background, university quality, the host country language and climate as well as a country’s characteristics and time effects are all found to be significant factors influencing Erasmus students’ mobility flows�
To sum up, all studies, although various in scope and complexity, have generally identified the cultural dimension of student mobility� Integrated into concepts such as “intercultural learning” (Lauritzen, 1998), “living foreignness” (Murphy-Lejeune, as cited in: Krzaklewska, 2008) and “learning from contrast” (Teichler, 2013), living in a foreign country and learning about different culture is one of the most important Erasmus students’ motivations� However, previous research is predominantly quantitative, so what it does is identify or pre-formulate this category, but it does not give any meaning to it� Moreover, the majority of studies on the motivation of Erasmus students are conducted after or at the end of their stay, which means that it might be more students’ outcomes and less initial desires and expectations that are examined�
Research Purpose and Methodology
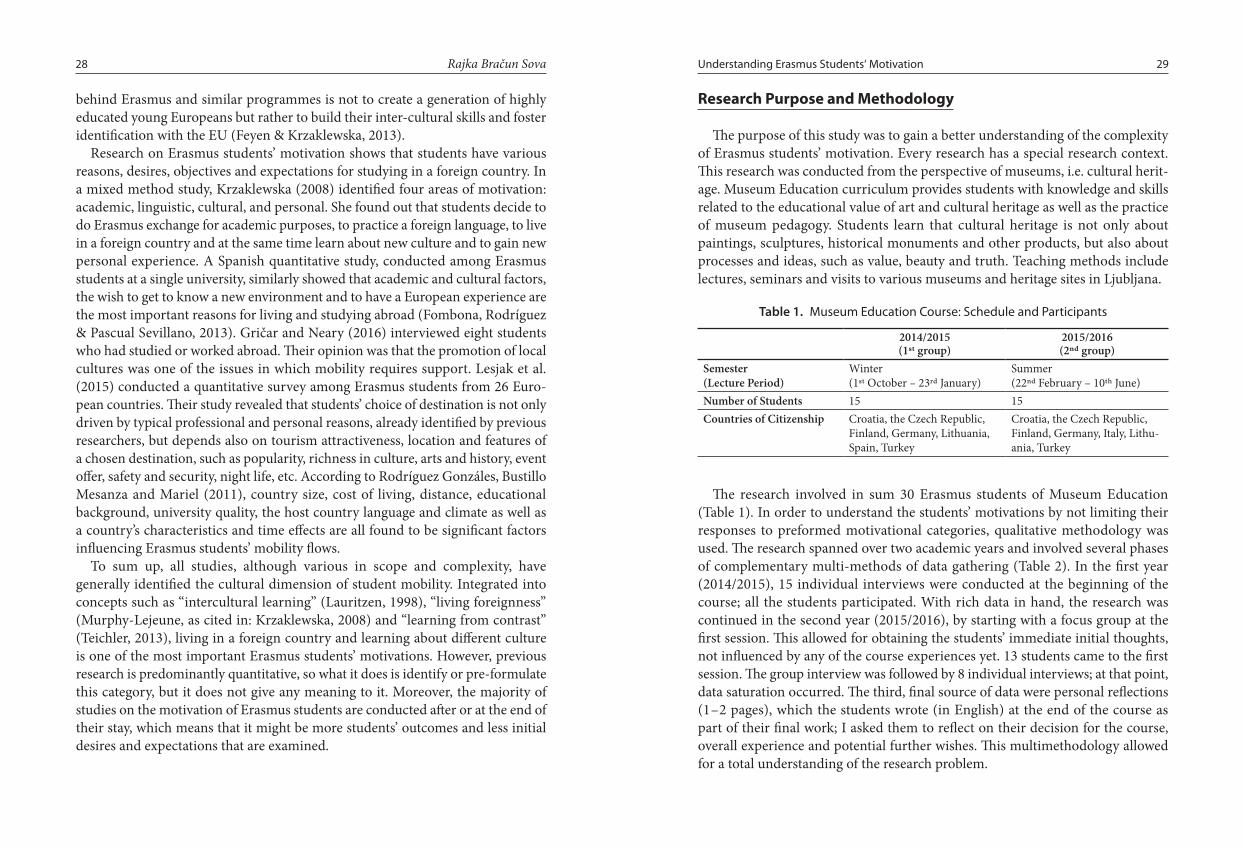
The purpose of this study was to gain a better understanding of the complexity of Erasmus students’ motivation� Every research has a special research context� This research was conducted from the perspective of museums, i�e� cultural herit-age� Museum Education curriculum provides students with knowledge and skills related to the educational value of art and cultural heritage as well as the practice of museum pedagogy� Students learn that cultural heritage is not only about paintings, sculptures, historical monuments and other products, but also about processes and ideas, such as value, beauty and truth� Teaching methods include lectures, seminars and visits to various museums and heritage sites in Ljubljana�
Table 1. Museum Education Course: Schedule and Participants
2014/2015 (1st group)
2015/2016(2nd group)
Semester(Lecture Period)
Winter(1st October – 23rd January)
Summer (22nd February – 10th June)
Number of Students 15 15Countries of Citizenship Croatia, the Czech Republic,
Finland, Germany, Lithuania, Spain, Turkey
Croatia, the Czech Republic, Finland, Germany, Italy, Lithu-ania, Turkey
The research involved in sum 30 Erasmus students of Museum Education (Table 1)� In order to understand the students’ motivations by not limiting their responses to preformed motivational categories, qualitative methodology was used� The research spanned over two academic years and involved several phases of complementary multi-methods of data gathering (Table 2)� In the first year (2014/2015), 15 individual interviews were conducted at the beginning of the course; all the students participated� With rich data in hand, the research was continued in the second year (2015/2016), by starting with a focus group at the first session� This allowed for obtaining the students’ immediate initial thoughts, not influenced by any of the course experiences yet� 13 students came to the first session� The group interview was followed by 8 individual interviews; at that point, data saturation occurred� The third, final source of data were personal reflections (1 – 2 pages), which the students wrote (in English) at the end of the course as part of their final work; I asked them to reflect on their decision for the course, overall experience and potential further wishes� This multimethodology allowed for a total understanding of the research problem�

3130 Understanding Erasmus Students‘ Motivation Rajka Bračun Sova
Table 2. Research Design
2014/2015 (1st group: 15 students)
2015/2016 (2nd group: 15 students)
Research phase 1 15 interviews (in the first weeks of the course)
Focus group with 13 participants(at the first course session)
Research phase 2 / 8 interviews (in the first weeks of the course)
Research phase 3 / 15 written personal reflections(at the last course session at the end of semester)
In order to analyse and interpret the data, I used a mixture of ideas from the grounded theory methodology and experience research methodology (interpre-tative analysis)�
Results and Discussion
Three main motivational drivers were identified: discovery, change, and curi-osity� Being driven by discovery means that students wish to learn about a new country and/or culture; they want to discover something new� Being driven by change means that students want to change the environment and learn about a different country and/or its culture� Being driven by curiosity means that stu-dents know nothing or very little about the host country and/or its culture and want to acquire knowledge; they are open to the unfamiliar� In the following paragraphs these three categories will be presented and illustrated with verbatim quotations�
DiscoveryAlthough Erasmus students’ list of countries for living and studying is limited,
they still have to make a choice about where to go and what to study� They are driven by many factors, but it seems that the cultural motive is a pivotal one: I had some countries where I could go and I looked: there were two in Switzerland, but I didn’t want to go there because it’s the same language – that was not that what I wanted. There was another offer in Spain, one in Finland and one here in Ljubljana (Int� 4, Germany)� When asked, why they chose Slovenia, the students answered that because this was a new country for them� They wanted to discover a new country: It was the first time when the students of history from my home university
would go to study in Slovenia. So it seemed something new, something unexplored to me (Int� 3, Lithuania)� Even the students from geographically neighbouring or, from the historical point of view, culturally seemingly closer countries, for example Croatia, considered Slovenia as a new discovery�
Discovery is connected to difference� Students want to experience a country which is “totally opposite” of theirs: Slovenia is a country that I do not know, it is different, with different weather, different language, totally opposite of Spain (Int� 11, Spain)� Being driven by discovery actually means that a student wishes to learn about the country and/or culture that he or she does not have any experience of: This was the most different country from mine. I could also go to Norway and to Germany, to England … This is all north and I know it already. So I thought the south of Europe is more different (Foc� Grp�, Finland)� Slovenia is an unknown country for these students� They are unfamiliar with Slovenia (and see Erasmus experience as a way of learning about it): In Germany we do not learn a lot about Slovenia. It doesn’t appear in our history lessons. We stop with the Second World War, so there’s nothing about the war down here. […] I now start to learn how the borders were set in this part of Europe (Int� 23, Germany)� Discovery, therefore, is about exploring something unknown, not experienced yet� The same pertains to the choice of Museum Education course: this course was something new, some-thing “unusual” for them: It was a new thing to me, so I liked it. In Lithuania we do not have subjects like this (Int� 3, Lithuania)�
To summarise, from the motivational point of view, students (when choosing a country or study course) are driven by discovery – they are attracted by something new, different, unknown or not experienced� This corresponds to Krzaklewska’s findings (2008) about the notion of novelty, but gives them a little more meaning�
ChangeErasmus students are also driven by a wish to change country and/or culture�
They want to change the environment and learn about another, different culture: I am here and I want to learn about the country I am staying in (Int� 19, Austria)� Words such as “to be here”, “to live” and “to stay” indicate that we are talking about a physical change – Erasmus experience is very much about travelling and geography�
It seems that part of this change is learning about culture� When Erasmus students themselves become travellers, they visit museums or heritage sites: In Zagreb we visited a cathedral. And we saw the statue in the middle of the square. And we visited Broken Relations Museum. It was an interesting museum. And we went to the national park (Int� 2, Turkey)� Visiting museums is not part of their

3332 Understanding Erasmus Students‘ Motivation Rajka Bračun Sova
everyday life, but part of the change; they more often consider visiting museums when they travel than at home: Usually I visit museums when I travel. For example, in spring I was in London and I visited the National Gallery, Tate Modern gallery and Victoria and Albert Museum (Int� 22, Czech Republic)� Visiting museums is part of Erasmus experience� Students are inexperienced (or, better to say, not yet experienced) museum visitors; they rarely visit museums in their home countries, but are motivated to see art and heritage when they study or travel abroad� They are driven by the popularity of the museum and just want to see major culture works�
Which culture do they want to learn about? On the one hand, students want to learn about Slovenia – its arts, history: I want to see museums here. I want the history of Slovenia (Foc� Grp�)� They do this by comparison: I just want to see how you understand arts in Slovenia […] I think a lot of it is the same, just you have more colourful things and we like more black, white, grey colours. It is a bit different from you (Int� 9, Lithuania)� They learn this not only in the city of Ljubljana, but also by traveling around Slovenia: I went to the coast, Piran, Izola, Koper, and I also went to lake Bled and Bohinj. When I went to Škocjanske jame, I visited there museums, small museums about the history of the caves and also biology, animals and this area (Int� 6, Spain)� On the other hand, students come to Slovenia to learn about Central Europe: I have been to Italy, Austria, and Croatia. Pula was the most impressive city to me. Because this city is next to the sea, it is really old, also there are some old buildings like the amphitheater. Also I liked that warm weather and the influence of the Romans (Int� 3, Lithuania)� The students reported that a geographic location was a very strong point when deciding on Slovenia (Ljubljana)� And they used words and ideas such as “art” “history and culture”, “Zagreb cathedral”, “old city”, “statue”, “see objects in real life”, “to be in front of the painting” when describing their learning activities related to heritage�
To summarise, from the motivational point of view, a wish to (physically) change the environment relates to learning about something different, contrasting� Change differs from discovery� Discovery is about ‚‘being far away‘‘ from home culture, whereas change is about ‚‘knowing where I am now‘‘� When learning about a new culture, students compare,look for dissimilarities but also similarities with their own culture� Learning about culture is geographically conditioned and mul-tidimensional; in Slovenia (Ljubljana), a country in the middle of Europe, students learn not only about Slovenian culture but also about Central European culture (and the Balkans)� They do this by exploring Ljubljana and travelling around Slovenia, as well as travelling to Austria, Croatia, Italy and Hungary and visiting capital and touristic cities� These research findings correspond to Krzaklewska’s
(2008) empirical data concerning the cultural dimension of Erasmus experience and Teichler’s (2013) notion of learning by contrast� The size and strategic position of Slovenia, a “small country with a favourable geographical position in the middle of Europe,” was already recognised by Altbach (2013, p� 98)�
CuriosityThis last category, which I call curiosity, means that students are open to the
unfamiliar� Let us look at an example� Students know nothing or very little about the host country (as the “discovery” category showed) and get actively involved in the experience of the country (“change”)� Now they want to acquire knowledge� One student described this process as a kind of excitement: […]And then I chose Slovenia. And when I arrived home I looked in google maps where Slovenia exactly is. Yeah, I knew more or less, but then I started reading some things about this country and the culture and everything and I really liked it and I was really excited about coming here (Int� 10, Spain)� Curiosity is about interest, a wish to learn� For example, the students did not know about museum education and were curious about it: Museum education was an unfamiliar topic to me. I chose it because I was curious about it, because I thought it would be interesting (Int� 2, Turkey)� Curiosity is about challenge: I think it was not in my original learning agreement. Then I take a lot of changes in my learning agreement. And I thought about museum education, it is something like: “What is that?“I t was intriguing, something I did not know and I wanted to know more about (Int� 12, Finland)�
Curiosity relates to uncertainty� For example, this student is curious about museum education and wants to go to museums because she wants to understand art (she clearly admits that she does not know art): I am visiting museums and I am just looking at pictures or something, and I could not understand anything and I wanted to learn about it. I thought this lecture would be beneficent for me, what they mean (Int� 2, Turkey)� The students also talked about not having any clear idea what they wanted to learn: I do not know, I just want to see. We went to the Contemporary Art Museum and I did not have any expectations about it, it made me really astonished. I found it very different (Int� 2, Turkey)� As already indicated by a student from Turkey, curiosity is about not having expectations: When I chose Museum Education course, I was not sure what to expect from the course. I had never come across with the concept of museum education during my studies so I was rather curious about the subject (Pers� Refl� 5, Finland)� After three weeks of study, one student said: I have already gained more than I expected (Int� 23, Germany)�
To summarise, from the motivational point of view, students are also driven by curiosity – a wish to know the unknown, the different� Students are curious

3534 Understanding Erasmus Students‘ Motivation Rajka Bračun Sova
to learn about Slovenia, museums, culture that they do not have any knowledge of� To put it differently: it is because they have little or no knowledge about the country and/or culture and find it so different to theirs, they are curious about it� Openness to the unfamiliar or unknown, identified in this study, is a new research finding�
Conclusions
One of the greatest benefits of studying abroad is a greater understanding of other cultures� “Discovery”, “change” and “curiosity” are not cultural concepts per se, but are involved in the cultural dimension of Erasmus experience�
Erasmus students are motivated to learn about new, different, unknown or not experienced cultures (discovery); they want to change the environment or culture in order to live in a different one (change); they know nothing or very little about the host country and are open to the unfamiliar (curiosity)� The research, done from the perspective of cultural heritage, additionally indicated how geography shapes the cultural experience of Erasmus students and what role museums and heritage site visiting play in it�
Some critical consideration of the findings needs to be made� Firstly, as already pointed by Krzaklewska (2008), students‘ statements of motivation sometimes fit into more that one of the main categories� Secondly, also pointed by the same researcher, the respondents scan manipulate their answers and redefine the value of the experience every time depending on the research context, personal situation or even interviewer�
There are further limitations to the claims this study can make� The qualitative research does not allow for indentifying how many or what proportion of stu-dents would fit into each of the categories in this study� Repetition of this study in a different context, like Erasmus students of other programmes, may provide other perspectives of their motivation� Further comparative studies in different countries may create a more comprehensive platform concerning what directs Erasmus students‘ choice of destinations and particular courses�
The value of this research is that it involved students from 8 European countries (Croatia, the Czech Republic, Finland, Germany, Italy, Lithuania, Spain, Turkey), that the categories are based on the respondents‘ experience, and that the data was gathered also at the beginning of their stay and with the use of different tech-niques� The findings of this research can be used in two ways� They are informative for the realisation of culture-related policy objectives, introduced at the beggining
of the paper� The findings can also be used strategically for the “capacity-building” of Central European countries�
References:Altbach, P�G� (2013)� The International Imperative in Higher Education� Rotterdam, Boston,
Taipei: Sense Publishers�Feyen, B� & Krzaklewska, E� (eds�) (2013)� The Erasmus Phenomenon. Symbol of a New
European Generation? Frankfurt Am Main: Peter Lang�Fombona, J�, Rodriguez, C�, & Pascual Sevillano, M� (2013)� The Motivational Factor of
Erasmus Students at University� International Education Studies, 6 (4), 1 – 9� Gričar, S�, & Neary, G� (2016)� Consequences of Mobility: the New EU Paradigm� Journal
of Economic and Business Sciences, 3 (1), 18 – 32�Knight, J� (2004)� Internationalization Remodelled: Definitions, Approaches, and Ration-
ales� Journal of Studies in International Education, 8 (1), 5 – 31�Krzaklewska, E� (2008)� Why Study Abroad? An Analysis of Erasmus Students‘ Motiva-
tions� In F� Dervin & M� Byram (eds�), Students, Staff and Academic Mobility in Higher Education (pp� 82 – 98)� Newcastle: Cambridge Scholars Publishing�
Lauritzen, P� (1998)� Intercultural Learning – One Big Bluff or a Learning Strategy for the Future? Concepts, Objectives and Practices of Intercultural Learning in Informal Education� European Journal of Intercultural Studies, 9 (Supplement), 35 – 48�
Lesjak, M�, Juvan, E�, Ineson, E�, Yap, M�, & Podovšovnik� E� (2015)� Erasmus Student Motivation: Why and Where to Go? Higher Education, 70 (5), 845 – 865�
Rodríguez Gonzáles, C�, Bustillo Mesanza, R�, & Mariel, P� (2011)� The Determinants of International Student Mobility Flows: An Empirical Study of the Erasmus Programme� Higher Education, 62 (4), 413 – 430�
Teichler, U� (2013)� The Event of International Mobility in the Course of Study – The European Policy Objective� In P� Zgaga, U� Teichler, & J� Brennan (eds�), The Globalisa-tion Challenge for European Higher Education: Convergence and Diversity, Centres and Peripheries (pp� 55 – 78)� Frankfurt am Main: Peter Lang Edition�
Van Ginkel, H� (2011)� More than a Tradition and Ambition: Internationalisation and Higher Education� In K� Miklavič (ed�), Paths to Internationalisation: Higher Education Policies Trends and Strategies in Europe and Slovenia (pp� 8 – 27)� Ljubljana: Centre of the Republic of Slovenia for Mobility and European Educational and Training Programmes – CMEPIUS�
Van Hoof, H�B�, & Verbeeten, M�J� (2005)� Wine Is for Drinking, Water Is for Washing: Student Opinions About International Exchange Programs� Journal of Studies in Inter-national Education, 9 (1), 42 – 61�

37Educational and Socio-Psychological Needs of Internally Displaced Children in Ukraine
Educational and Socio-Psychological Needs of Internally Displaced Children in Ukraine
DOI: 10.15804/tner.2017.50.4.03
AbstractIn 2014 the ongoing armed conflict in Ukraine forced thousands of people to leave their homes and seek refuge elsewhere� The number of officially registered internally displaced persons (IDPs) has exceeded 1�76 million� More than 300 thousand of them are children� The aim of the paper is to present the results of sociological research “Study of socio-psychological needs of school-age children, displaced from the Anti-Terrorist Operation Zone (ATO)”� Quan-titative and qualitative research methods, the survey of parents and teachers who work with IDP children have been applied� Results show IDP children do not have specific needs the satisfaction of which would require a separate intervention� On the contrary, there is a need for maximum integration in the social environment of the host community� The research was conducted within the framework of the project “Integration Through Dialogue”, 2015 – 2017, with the support of the European Commission.
Keywords: internally displaced person (IDP), IDP children, educational needs, socio-psychological needs of IDP children, communication and rejecting problems, adaptation and integration in host community
Introduction
An alarming number of people worldwide have had to abandon their homes and livelihoods in the face of civil conflict, natural or economic disasters, or other threats� As they do not cross an international border, they are considered internally
Petro Kendzor, Larysa KolesnykUkraine
displaced persons (IDPs) and not refugees (Hines & Balletto, 2002, p� 9)� In 2014, Ukraine was included in the list of ongoing armed conflicts� For the first time in modern history, Ukraine faced the war problems, such as death, destruction, violence, and internal migration� More than three years into the conflict, with more than 1�7 million people being officially registered as internally displaced persons (IDPs) from Donbas and Crimea, those directly affected and host com-munities are facing a multitude of complex and interrelated challenges� According to the Guiding Principles on Internal Displacement, IDPs are persons or groups of persons who have been forced or obliged to flee or to leave their homes or places of habitual residence, in particular as a result of or in order to avoid the effects of armed conflict, situations of generalized violence, violations of human rights or natural or human-made disasters, and who have not crossed an internationally recognized state border (UN Guiding Principles on Internal Displacement, p�6)� People who have been forced into another socio-cultural space feel confused and frightened� The experience of limiting their social, psychological, communicative, and other capabilities will be able to become an insurmountable psychological barrier to successful integration into the new social environment� The influx of IDPs into communities across Ukraine has been a strain on local budgets as well as on the local social infrastructure� This causes numerous problems, which IDPs and host communities now have to overcome jointly� Different perceptions gener-ated by the government’s response to the specific needs of IDPs represent another source of possible tension among conflict-affected populations in terms of unequal access to civil and political rights as well as socio-economic opportunities and create barriers hampering future integration (Conflict-related Displacement in Ukraine: Increased Vulnerabilities of Affected Populations and Triggers of Tension within Communities, 2016, p� 6)�
The most vulnerable IDP group of this integration process is the group of teenagers, due to its specific age-characteristics� Until now, there has been no comprehensive study of the peculiarities of their socio-psychological adapta-tion, actual educational needs and socio-cultural expectations of their families� A major dilemma in situations of displacement is that a lot of the institutions (governmental, non-governmental, and international) pay great attention to humanitarian assistance – food aid, housing, medical care, employment – but not to the socio-cultural indicators for teenagers, which might help them in the integration process�
The aim of the paper is to present the results of sociological research “Study of socio-psychological needs of school-age children, displaced from the Anti-Terror-ist Operation Zone (ATO)” and to provide recommendations to professionals who

3938 Educational and Socio-Psychological Needs of Internally Displaced Children in Ukraine Petro Kendzor, Larysa Kolesnyk
work with IDP children, how to optimize the processes of creating an adaptive environment for IDP children in the host community�
Research Methodology
This research is based on the findings of focus group discussions with adults, parents and professionals who work with IDP children (qualitative methods) and executing a survey of school-age children (quantitative methods)� In designing a survey of children, it was decided to organize it at schools� The sample was based on clusters covering different regions of the country� Focus group discussions and a survey of school-age children were conducted between March and June 2016 in six regions across Ukraine: Kyiv, Brovary, Lviv, Odessa, Severodonetsk, and Nova Kahovka� The choice of the territory was due to the need to obtain the data on the IDPs’ social adaptation in different types of socio-cultural environment and regions of Ukraine�
The methodology for the focus groups and the questionnaire for school-age children were developed by Zoya Garkavenko, Olena Karagodina and Anna Shaposhnikova�
The questionnaire consists of three parts: instructive, basic and passport� The first part contains brief information on the research group, the purpose and objec-tives of the study and instructions for respondents� The basic part includes three blocks of questions� These blocks are aimed at identifying the features and level of educational satisfaction (Block A), at socio-psychological (Block B) and socio-cultural (Block C) needs� It also detects indirect maladaptation manifestations of the target group�
The passport section is placed at the end of the questionnaire and contains 6 questions about the respondent and his/her family� The passport part includes the question-filters of collective belonging to a group of IDPs (Garkavenko, Z�, Karagodina O�, Kendzor, P�, Kolesnyk, L� & Shaposnikova, A�,2016, pp�38 – 50)�
In total, 708 people (605 children and 103 adults) participated in the study� In the end, a total of 491 questionnaires were answered by children at school,
among them 287 (58�5%) were internally displaced persons, and 192 (39�1%) were the control group, were sent to the research team� 12 respondents (2�4%) did not answer this questionnaire�
The group of respondents included 11 – to 18-year-old children, from 6th–11th grades� The average age of the respondents was 14�7 years�
58 professionals 45 parents took part in the focus group discussions�
The majority of the parent-respondents (42, or 93�3%) moved from the ATO zone (Donetsk, Donetsk and Luhansk regions), three of them (6�7%) from Crimea�
The group of professionals included 47 teachers (81�1%), 1 (1�7%) methodolo-gist of the Department of Education, 5 (8�6%) school psychologists and 5 (8�6%) social pedagogues� Among the respondents, there were 2 school principals� In all focus groups, the participants represented a wide range of subject specializations (Ukrainian and Foreign Languages, Mathematics, Computer Science, History, Physical Education, Labor Studies, Music and Art)� A significant proportion of the respondents (23 persons – 42�6%) performed the duties of class manager� With regards to pedagogical experience, the teachers were distributed as follows: up to 5 years – 8 persons (13�8%), 5 – 10 years – 10 persons (17�2%), over 10 years – 40 persons (69�0%)�
Research Results and Discussion
The purpose of the study was to identify the features of socio-psychological adaptation and development of the target group� In particular, the aim was to identify real educational, socio-psychological and socio-cultural needs of benefi-ciaries and give recommendations to professionals and parents of how to improve the situation of integration in the host communities�
This study is based on the following assumptions:1� The needs of school-age children are not fully satisfied with the available
types of educational activity�2� The satisfaction level of these needs depends on various factors (lack of access
to resources, some problems with adults and peers, lack of psychological support, lack of control over their behavior and emotions, etc�)
3� Children of IDP families have a different structure of educational, socio-psy-chological and socio-cultural needs from their peers who permanently live outside the military conflict�
4� Children of IDP families more often face communication and rejection problems in their environments than their peers in host communities�
5� IDP children rely on other sources of support in a state of psychological dis-comfort than their peers who permanently live outside the military conflict�
Comparing the results of the quantitative and qualitative surveys, we partially confirmed the main hypotheses of the research� Thus, the first assumption regard-ing the satisfaction level of the educational, socio-psychological, socio-cultural needs of IDP children is only partially confirmed� This is due to the influence

4140 Educational and Socio-Psychological Needs of Internally Displaced Children in Ukraine Petro Kendzor, Larysa Kolesnyk
of several factors� In fact, all educational institutions (in the opinion of teachers and parents) provide the best possible conditions for the satisfaction of students’ basic educational needs� It was evidenced by the discussion in the focus group interview with representatives from all the regions of the survey� In this case, we are talking about the general possibilities of educational institutions to provide high-quality educational services� There are several indicators in the educational needs structure, determined by the survey of the students, which turned out to be the least satisfied� They are: “help in defining interests, life plans, and the choice of profession”, “help in the identification and development of abilities”, “skills to use the acquired knowledge to solve life problems”, and “the development of life skills and creative abilities”� Interestingly, this result is the same for both the host community children and the IDP children�
In relation to the foregoing observations, we can assume that the problem of the partial satisfaction of the students’ educational needs refers to the general organ-ization of the educational process in the education system� It is not an exception and it is not due to regional peculiarities or certain events that happen� In support of this assumption, most respondents said they had abilities that could not be dis-closed or implemented in the educational institutions’ conditions� Current curric-ulum and programs do not meet the modern requirement of preparing a child for a successful life under uncertainty conditions and quickly changeable situations� Therefore, we cannot resolve this problem at the local level� A partial solution is possible by introducing additional training programs into the educational process and after-school work� The aims of these programs should be devoted to the life and communication skills development, interaction, professional orientation, etc�
With reference to the second assumption, various factors determine the level of IDP children’s needs and their satisfaction� It was almost completely confirmed� First of all, it is revealed through the influence of external factors: the possibility of providing educational services at the high level, social environment and social support availability, the psychological climate in educational groups, the presence of “significant adult”, etc� The influence of the first (the availability of opportuni-ties) has already been considered above�
The analysis of the results and comparison of the children’s and adults’ vision has revealed several regularities�
In the process of the research, we found out that the length of a child’s adapta-tion to the new sociocultural conditions depends both on personal factors (gender, age, temperament), and external factors (new lifestyle, the attitude of the local population, the social status of parents)� For example, according to the research of the Kiev International Institute of Sociology, almost all respondents have positive
or neutral attitudes towards IDPs from Donbas and Crimea� In the general popu-lation sample, 43% reported a positive attitude and approximately 47% a neutral attitude (comprising 90%)� Only 6% expressed a negative attitude, and 4% were undecided� In the cities with the largest population of IDPs (CLP), the attitudes were even positive: 58% of the people perceived IDPs positively, 34% neutrally, 2% negatively, and 6% were undecided�
The highest percentage of those who expressed a positive attitude to IDPs is found in the East, Center and South of CLP (63%, 63% and 57% respectively)� The regions in Western Ukraine have the lowest percentage of people who expressed positive attitudes to IDPs (35%) (Ukrainians’ Attitudes Towards Internally Dis-placed Persons from Donbas and Crimea, 2016, p� 9)�
Figure 1. Attitudes of local population to IDPs (% in Ukraine and CLP)
In particular, if we speak about personal factors, we note that junior students adapt to new conditions faster than senior students do, and adolescent girls inte-grate into new environments more quickly than adolescent boys do�
It is important to know IDP children’s needs and values, which are the basis of their lifestyles� They play the key role in the adaptation process and help to better understand the individual and psychological characteristics of students in the process of integration� Children from IDP families are less dependent on the school environment, more on their parents’ position and the atmosphere in the family (choice of support sources, place of comfortable stay, communication needs, etc�)� The most likely reason for such a situation is the fact that in families where immediate prospects are not identified (staying at the temporary place or return home), children are more likely to face future problems (profession choice, education at universities, etc�)� This fact was confirmed during the focus group
43
58
47
34
6
2
4
6
Ukraine
CLPPositive
Neutral
Negative
Di�cult to answer
What is your attitude in general to IDPs from Donbas or Krimea? (%)

4342 Educational and Socio-Psychological Needs of Internally Displaced Children in Ukraine Petro Kendzor, Larysa Kolesnyk
interview� In an extreme situation and stress, which causes the uncertainty of the future, families’ separation, low-income for families, parents and children usually solidarize, get closer� Sometimes such families artificially isolate themselves from the environment and have fewer contacts� Quite often these families need com-prehensive social and psychological assistance aimed at restoring, increasing the ability to solve current problems�
IDP children feel the influence of the general political events in the country more acutely� This is not only about the changes of the place of residence and the possibilities of the family, but also the change of their own interests and life plans, their requirements and their attitudes to the country in which they live� In fact, it can be argued that IDP children “grow up faster” than their peers from peaceful regions� Educational institutions should take these changes into account when they build their relationships with them� But, as the World Food Programme report (2000a) shows, on the one hand, IDPs do have special needs, on the other, there is a growing consensus that IDPs should not be singled out for special treatment� Our research confirms this statement� People and especially children do not wish to be classified as IDPs� They prefer to give up help, just not to stand out from the new environment� Therefore, organizing formal and non-formal education, we should ensure the forms of IDP children’s participation “not for them, but with them”� Access to partnerships adds confi-dence and energy to the development of the child’s identity� Another important feature that can be considered regular is the lack of favorable school environ-ments� The survey results indicate uneven expectations and intentions of the respondents regarding the level of trust and assistance in school teams� 91% of the respondents are ready to help� But the assessment of classmates’ readiness to help (70%) is an indicator of a not-so-favorable socio-psychological situation� At the same time, we have not found a differences in the assessments of the IDP children and the general group of respondents� It only confirms the existence of the problem�
The assumption of the study that children of IDP families have a different structure of educational, socio-psychological and socio-cultural needs from their peers who permanently live outside the military conflict is almost refuted�
According to the comparative results, the structures of needs development of the IDP children group and control group (all the respondents) are almost identical� This is evidenced by the results of the FG interviews� Table 1 presents the comparison of the respondents’ answers to the question “What of the above does the school give you?”
Table 1. Comparison of the structure of respondents’ educational needs which are satisfied at school
Answer Options All respondents
IDP children CG
Reliable knowledge of the subjects 2 2 3Imagination about the world and human relationships 6 6 6Assistance in abilities identifying and developing 8 7 7Communication experience with people 4 4 5Ability to acquire knowledge to solve life problems 9 9 8Ability to study independently 3 3 2Help in defining interests, life plans, career choices 7 8 9Ability to behave correctly (rules of conduct) 1 1 1Command of foreign languages 5 5 4Other 10 10 10
There is similarity in the assessment of the respondents’ expectations of school study�
Table 2. Comparison of the structure of respondents’ educational needs which are expected from school
Answer Options All respondents
IDP children CG
Development of mental abilities 4 4 3Physical development 3 3 4Development of creative abilities 2 2 2Life skills development 1 1 1
Thus, it can be assumed that the main hypotheses of the study were only par-tially confirmed� The IDP children do not have specific (different from the general group) needs� According to both the parents and teachers, this group, on the contrary, needs to minimize the emphasis on the IDP status� The nature of their adaptation depends on the social status of their parents, the level of Ukrainian (as a rule, most children speak Russian), and the quality of school education� In this context, we recommend providing indirect assistance to IDP children, combine them with other students� All the educational institutions which work with IDP children should use active learning tools in the study process� Particular attention

4544 Educational and Socio-Psychological Needs of Internally Displaced Children in Ukraine Petro Kendzor, Larysa Kolesnyk
should be paid to professional career choice, projects aimed at family psycho-education (parents and other family members), training of team building in the new educational environment, sports, business and research games involving all students in activities�
It is important that all events take place with families, children’s groups and col-lectives are aimed at the solidarity, integration and implemented on the principle “Together, not for them”�
Conclusions
In the study, 708 participants (605 children and 103 adults) were interviewed in six regions of Ukraine� In general, we can report an average-high level of sat-isfaction with the educational, socio-psychological, socio-cultural needs of IDP children�
We have identified a number of factors that hinder the adaptation and integra-tion processes of IDP children:
• limiting of families’ opportunities (first of all, financial) for additional education and children development;
• imperfections in the curriculum and school programs, which do not ensure full life skills development and students’ creative abilities development;
• insufficient level of psychological and pedagogical competence of individual educators, psychologists, parents�
On the other hand, there are problems of individual psychological, socio-psy-chological nature:
• individual peculiarities of some children’s adaptation; • a complexity of the transitional age (problems with self-regulation, moti-
vation, etc�); • low level of social, communicative competence of children (teenagers) from
small towns and villages; • lack of social support of the school environment; • in some cases, “stigmatization” of this category of children through the
allocation of individual measures that cause forced isolation�We did not find any fundamental difference between the IDP children and the
general group in the needs structure and the level of their satisfaction� In our opinion, the lack of fundamental differences in the IDP children needs structure is caused by the general situation in the country�
A lot of Ukrainian families are living under the pressure of the circumstances of the “uncertainty of life and the future”, “difficulties of ensuring the current existence”, “difficulties in raising adolescents”, etc� We live in a VUCA world – the volatility, uncertainty, complexity and ambiguity of general conditions and situations (Stiehm, Judith Hicks and Nicholas W� Townsend, 2002, p�6)� These families can be classified as ones facing “difficult living conditions”� Therefore, it is important to combine the efforts of all participants in the educational process in order to stabilize and harmonize the children’s development and optimize the processes of their socialization�
Resources of the adaptation and integration process optimization of IDP chil-dren are:
• a fairly high level of «adulthood» (maturity) of children from IDP families, which can serve as the basis for the life values development and capability of self-fulfillment;
• readiness of the majority of educational workers who work with IDP chil-dren to increase their professional, psychological and pedagogical skills;
• readiness of the educational authorities for cooperation in the direction of optimization and harmonization of educational processes�
Taking into account the results of the study, we believe that further research should be conducted on the impact of IDP children on the educational environ-ment of host communities�
ReferencesConflict-related Displacement in Ukraine: Increased Vulnerabilities of Affected Popula-
tions and Triggers of Tension within Communities (2016)� [Thematic report]� Published by the OSCE Special Monitoring Mission to Ukraine� Osce.org. Retrieved from http://www�osce�org/ukraine-smm/261176?download=true
Garkavenko, Z�, Karagodina O�, Kendzor, P�, Kolesnyk, L� & Shaposnikova, A� (2016)� Vyvchennia socialno-psyhologichnyh potreb ditey shkilnogo viku, peremischenyh iz zony
ATO [Study of Socio-psychological needs of School-age Children Displaced from the ATO Zone]� Retrieved from http://dialogos�org�ua/pro-proekt/opytuvannya�
Hines, D� & Balletto, R�, (2002), Assessment of Needs of Internally Displaced Persons inColombia [Working and discussion papers]� Retrieved from https://www�odi�org/publica-
tions/1988-assessment-needs-internally-displaced-persons – colombiaStiehm, Judith Hicks and Nicholas W� Townsend (2002)� The U.S. Army War College:Military Education in a Democracy. Temple University Press� Ukrainians’ Attitudes Towards Internally Displaced Persons from Donbas and Crimea�

46 Petro Kendzor, Larysa Kolesnyk
Summary of Opinion Polls� (2016)� KIIS research by UNHCR request. Retrieved from http://unhcr�org�ua/attachments/article/1605/Public%20Survey_36_ENG_www�pdf
UN Guiding Principles on Internal Displacement [G�A� Res� 60/L�1, 132, U�N� Doc� A/60/L�1]� Retrieved from http://www�un�org/documents/ga/docs/56/a56168�pdf
WFP (World Food Programme) (2000a) Reaching People in Situations of Displacement� (2000)� [Discussion Paper]� Executive Board Consultation – Situations of Displacement: Issues and Experiences, Rome, Italy: WFP� Retrieved from https://www�wfp�org/content/wfp-reaching-people-situations-displacement-framework-action�

Affective Structures among Students and Their Relationship with Academic Burnout
DOI: 10.15804/tner.2017.50.4.04
AbstractThe presented study aimed to determine the relationship between affective structures and academic burnout among male and female third grade high school students in Zahedan in the 2016/2017 school year� The descriptive-cor-relational study had a sample including 362 students selected with the use of a multistage cluster sampling method� To collect data, the Academic Burnout Questionnaire (Berso et al�, 1997) and Positive and Negative Affect Schedule (Watson et al�, 1988) were used� Results of the present study indicated that pos-itive affect was significantly and diversely related to the subscales of academic burnout (academic fatigue, academic apathy, and academic inefficiency)� More-over, negative affect was significantly and directly related to all the subscales of academic burnout� Results of an independent t-test demonstrated that there were no significant differences between the male and female students with regard to positive and negative affects� However, academic burnout was higher among the male students compared to their female counterparts� Furthermore, results of a stepwise regression analysis showed that in the first step, positive affect alone predicted 22% of the variance in academic burnout and in the sec-ond step, negative affect increased the power of predicting academic burnout to 28%� Given the predictive power of affect, it can be effectively applied to prevent academic burnout�
Keywords: affective structures, positive affect, negative affect, academic burnout, students
Somaye Bikar, Afsaneh Marziyeh, Abdulwahab PourghazIran

4948 Affective Structures among Students and Their Relationship with Academic Burnout Somaye Bikar, Afsaneh Marziyeh, Abdulwahab Pourghaz
Zahed Bablaan, Pourbahram, and Rahmani Javanmard (2014), in their study, concluded that academic burnout was higher among male students compared to that in their female counterparts� On the other hand, Azimi and Piri (2013) revealed that there were no significant differences between male and female stu-dents with regard to academic burnout�
Michaeli, Rajabi, Abbasi, and Zamanlou (2014) reached a conclusion that female students had higher emotion regulation and positive affect and experi-enced lower academic burnout compared to male students� However, considering negative affect and academic performance, no significant differences were found between these two groups� Marzoughi, Heidari, and Heidari (2013) showed that there were no significant differences between male and female students in terms of academic burnout�
Therefore, given the discussed theoretical and practical background and taking the significance of academic burnout and factors affecting it into account, this study aimed to investigate the relationship of affective structures with academic burnout among students�
Methods
This descriptive-correlational study had a statistical population including all male and female third grade high school students in Zahedan in the 2016/2017 school year� Among these students, 362 individuals were selected as the sample using the multistage cluster sampling method� In this regard, 5 schools were chosen from each district of Zahedan (districts 1 and 2) and 2 classes were selected from each school� Afterwards, the sample was randomly selected from each class�
To collect the required data, the following measurement tools were applied�The Academic Burnout Questionnaire (Berso et al�, 1997): this questionnaire
assessed 3 subscales including academic fatigue, academic apathy, and academic inefficiency and was designed by Breso, Salanova, and Schoufeli in 1997� This questionnaire, which has 15 items, is scored based on a 5-point Likert-type scale (ranging from totally disagree to totally agree)� Breso, Salanova, and Schoufeli (1997) reported that the reliability of academic fatigue, academic apathy, and academic inefficiency was 0�70, 0�82, and 0�75 respectively� In the presented study, Cronbach’s alpha coefficients of the whole questionnaire, academic fatigue, academic apathy, and academic inefficiency were 0�86, 0�75, 0�74, and 0�68 respec-tively�
Introduction
The term burnout was scientifically used, for the first time, by a psychiatrist Freudenberger (1974)� Following him, Neuman (1990) proposed the term aca-demic burnout� Academic burnout is characterized by several features including a sense of exhaustion caused by academic demands and requirements (academic fatigue), a growing sense of pessimism and lack of interest in academic tasks (academic apathy), and poor personal development in academic and educational affairs (academic inefficiency)� In recent years, burnout has expanded to edu-cational contexts and situations and is mostly referred to as academic burnout (Salmela-Aro, Kiuru, Pietikainen, & Jokela, 2008)� Nowadays, academic burnout is a major concern of families and education authorities� In addition to its adverse effects on the national economy, academic burnout has negative impacts on stu-dents’ mental health (Eslami, 2011)�
Among other significant factors affecting learning and academic burnout among students, positive and negative affects, known as affective structures, can be included� Indeed, affect refers to the student’s interest in doing his/her assign-ments (Dinner & Emmons, 1984)� Watson and Tellegen (1985) divided affect into two basic affective dimensions� One of these dimensions is negative affect, which is defined as the extent to which a person is dissatisfied and has an unpleasant feeling� In contrast, positive affect refers to the extent to which a person expe-riences joy, alertness, and involvement in enjoyable tasks� Various studies have indicated that positive and negative emotions can play key roles in predicting and modifying health consequences and can act in accordance with different mood states since most of the feelings students experience in a learning environment are recognized through their relationships with a number of important outcomes such as academic achievement and academic adjustment as well as physical and psychological health and well-being (Salkowski, Joyce, & Stroch, 2012)�
Negative affect makes students less active (Reynolds & Weigand, 2010) and is closely associated with emotional exhaustion and academic stressors (Márquez, Martin, & Brackett, 2006)� In their study, Saklofske, Austin, Rohr, and Andrews (2007) showed that negative affect and its dependence on stress among students were related to academic failure� In another study, Lin and Huang (2014) reported that the status of academic burnout among university students was lower than the moderate level� Vahedi, Hashemi, and Shafiee Surak (2014) found that academic experience and neuroticism were significantly correlated with academic burnout� Additionally, they revealed that self-efficacy, internal valuation, and self-regulation were negatively associated with academic burnout�

5150 Affective Structures among Students and Their Relationship with Academic Burnout Somaye Bikar, Afsaneh Marziyeh, Abdulwahab Pourghaz
and positive and negative affects together predict 28% of variance in academic burnout�
Table 2. Results of the stepwise regression analysis conducted to predict academic burnout via the students’ affective structures
Cri
teri
on v
aria
ble
Patte
rn
Vari
able
s ent
ered
in
to th
e eq
uatio
n re
spec
tivel
y
R R2 ADj--R2 SE B β F T Sig
Aca-demic burn-out
step-wise
Positive affect
0�471 0�222 0�220 9�38 -0�642 -0�471 102�62 -10�13 0�00
Negative affect
0�535 0�286 0�282 8�99 0�325 0�267 72�05 5�701 0�00
To investigate the difference in affective structures among the male and female students, an independent t-test was used, the results of which are presented in Table 3�
Table 3. The results of the independent t-test carried out to examine the difference in affective structures
and academic burnout based on gender
VariableIndependent
VariableGender N M SD t-statistic Sig
Positive affect Female 181 34�92 7�76 -0�944 0�346
Male 181 35�70 7�82Negative affect Female 181 29�09 8�51 0�625 0�532
Male 181 28�52 8�96Academic burnout
Female 181 39�56 10�40 -3�162 0�002Male 181 43�05 10�56
The results presented in this table demonstrate that the male students’ mean scores on positive affect and negative affect are greater than those of the female students� However, this difference is not statistically significant� Furthermore, considering academic burnout, the male students’ mean score is greater than that of the female students and this difference is statistically significant�
The Positive and Negative Affect Schedule (Watson et al�, 1988): this scale includes 20 items and was developed and standardized by Watson, Clark, and Tellegen (1988)� It evaluates 2 subscales including positive affect and negative affect� Each item is answered based on a 5-point Likert-type scale ranging from not at all to very high� Cronbach’s alpha coefficient of positive affect was reported to range from 0�86 to 0�90 and Cronbach’s alpha coefficient of negative affect was reported to range from 0�84 to 0�87� In this study, Cronbach’s alpha coefficients of positive affect and negative affect were 0�76 and 0�84 respectively�
The obtained data were analyzed by the Pearson correlation coefficient, stepwise regression analysis, independent t-test and one-sample t-test�
Results
To examine the relationship of positive and negative affects with the subscales of academic burnout, the Pearson correlation coefficient was applied, the results of which are presented in Table 1�
Table 1. Correlation matrix among positive and negative affects and the subscales of academic burnout
1 2 3 4 5 6Academic apathy 1Academic fatigue 0�721** 1Academic inefficiency 0�554** 0�457** 1Positive affect -0�384** -0�332** -0�485** 1Negative affect 0�395** 0�346** 0�248** -0�309** 1Academic burnout 0�884** 0�868** -0�789** -0�471** 0�387** 1
** P<0�01
The results presented in the above table show that positive affect is significantly and diversely related to the subscales of academic burnout� Moreover, negative affect is significantly and directly related to the subscales of academic burnout�
To find which subscale of the students’ affective structures can predict academic burnout among them, a stepwise regression analysis was used�
The results of the stepwise regression analysis presented in Table 2 indicate that in the first step, positive affect predicts 22% of variance in academic burn-out� In the second step, negative affect increases the predictive power by 0�06%

5352 Affective Structures among Students and Their Relationship with Academic Burnout Somaye Bikar, Afsaneh Marziyeh, Abdulwahab Pourghaz
of academic burnout� This finding is in line with the results of Saklofske et al� (2007), Salkowski, Joyce, and Stroch (2012), Vahedi et al� (2014), and Michaeili et al� (2014), which indicated that there was a correlation between positive affect (or its realizations) and academic burnout� To explain this finding, it can be noted that several previously carried out studies indicated that gentle and positive emotional states can particularly affect daily thinking processes� Having positive emotions is a sign of having positive information in memory and vise versa� When stressful conditions, like attending school, are accompanied with positive affect, people usually show a lot of effort and employ lots of energy to achieve their goals�
Additionally, the results indicated that negative affect was significantly and directly related to the subscales of academic burnout� This finding is consistent with the results of Saklofske et al� (2007), Salkowski et al� (2012), Vahedi et al� (2014), and Michaeili et al� (2014), which revealed the relationship between negative affect and academic burnout� Negative affect leads to loss of energy and personal resources� People who experience high levels of negative affect are usually anxious and worried and they usually have low levels of energy� Experiencing negative affect leads to achieving low levels of performance�
According to the results of the presented study, academic burnout was higher among the male students compared to their female counterparts� This finding is in agreement with the findings of Zahed Bablaan et al� (2014) and Michaeili et al� (2014)� However, it is not consistent with the results of Azimi and Piri (2013) and Marzoughi et al� (2013)� To explain this finding, it can be mentioned that male and female students have different academic motivation and concerns about unemployment have a significant impact on male students� Hence, there is a pos-sibility that male students, compared to female students, experience higher levels of academic pressure and have additional concerns� In this regard, these factors can exacerbate academic burnout among male students�
Considering positive and negative affects, no significant differences were found between the male and female students under study� This finding is not in line with the results of Michaeili et al� (2014), which demonstrated that female students experienced higher levels of positive affect compared to their male counterparts� It is likely that the possibility of continuing education provides more positive feed-back for female students compared to male students� This may create more positive emotions among female students� It should also be noted that the results of this study are consistent with a part of the results obtained from the study conducted by Michaeili et al� (2014), which revealed that there were no significant differences between male and female students with regard to negative affect� However, unlike the results of this study, many social psychologists believe that the concept of self
To evaluate the statuses of affective structures and academic burnout among the students, a one-sample t-test was applied, the results of which are presented in Table 4�
Table 4. The results of the one-sample t-test carried out to evaluate the statuses of affective structures and academic burnout among the students
Variable N M SD Expected mean Error df Sig
Positive affect 362 35�31 7�79 30 0�409 361 0�00Negative affect 362 28�81 8�74 30 0�459 361 0�00Academic burnout 362 41�31 10�61 45 0�558 361 0�00Academic fatigue 362 16�005 4�58 15 0�241 361 0�00Academic apathy 362 11�12 3�75 12 0�197 361 0�00Academic inefficiency 362 14�17 4�20 18 0�220 361 0�00
The results presented in this table show that the students’ mean score on positive affect (35�31) is significantly greater than the mean (30)� Therefore, the status of positive affect among the students under study is higher than the moderate level� Considering negative affect, the students’ mean score (28�81) is significantly lower than the mean (30)� Hence, the status of negative affect among the students under study is lower than the moderate level�
With regard to academic burnout, the students’ mean score (41�31) is lower than the mean (45)� This means that the status of academic burnout among the students under study is lower than the moderate level� Considering academic fatigue, the students’ mean score (16�005) is greater than the mean (15)� Moreover, with regard to academic apathy, the students’ mean score (11�12) is lower than the mean (12) and the students’ mean score on academic inefficiency (14�17) is lower than the mean (18)� Hence, the status of academic fatigue among the students is higher than the moderate level� However, the statuses of their academic apathy and academic inefficiency are lower than the moderate levels�
Discussion and Conclusion
The present study aimed to examine the relationship between affective structures and academic burnout among the students� The results of this study showed that positive affect was significantly and diversely related to the subscales

5554 Affective Structures among Students and Their Relationship with Academic Burnout Somaye Bikar, Afsaneh Marziyeh, Abdulwahab Pourghaz
tion regulation and positive and negative emotions with academic performance and academic burnout among university students� Educational Psychology, 2(32), 31 – 54�
Neuman, Y� (1990)� Determinant and consequences of student Burnout in universities� The Journal of Higher Education, 61(1), 20 – 31�
Reynolds, A�L�, & Weigand, M�J� (2010)� The relationships among academic attitudes, psy-chological attitudes, and the first-semester academic achievement of first year college students� Journal of Student Affairs Research and Practice, 47(2), 175 – 195�
Saklofske, D�H�, Austin, E�J�, Rohr, B�A�, & Andrews, J�W� (2007)� Personality, emotional intelligence and exercise� Journal of Health Psychology, 12, 937 – 948�
Salkowski, M�L�, Joyce, D�K�, & Stroch, E�A� (2012)�Treating childhood anxiety in schools: service delivery in a response to intervention paradigm� Journal of Child and Family Studies, 21 (6), 938 – 947�
Salmela-Aro, K�, Kiuru, N�, Pietikainen, M�, & Jokela, J� (2008)� Does School matter? The role of school context for school burnout� European Psychologist, 13, 1 – 13�
Vahedi, Sh�, Hashemi, T�, & Shafiee Surak, S� (2014)� The impact of educational experience, neuroticism, and learning self-regulation strategies on academic burnout: Test a con-ceptual model� Knowledge and Research in Applied Psychology, of 15(3), 71 – 80�
Watson, D, Clark, L�A�, & Tellegen, A� (1988)� Development and validation of a brief measure of positive and negative affect: The PANAS scales� Journal of Personality and Social Psychology, 54 (6), 1063 – 1070�
Watson, D�, & Tellegen, A� (1985)� Toward a consensual structure of mood� Psychological Bulletin, 98 (2), 219 – 235�
Watson, D�, Clark, L�A�, & Carey, G� (1988)� Positive and negative affectivity and their rela-tion to anxiety and depression disorders� Journal of Abnormal Psychology, 97, 346 – 353�
Zahed Bablaan, A�, Pourbahram, R�, & Rahmani Javanmard, S� (2014)� The relationship of perfectionism, goal orientation, and academic performance with academic burnout� Journal of New Approaches in Educational Management, 5(18), 109 – 124�
is different in male and female students� When defining self, male students mainly focus on uniqueness� Conversely, female students’ schemas mostly put emphasis on emotions, relations, and being related to others�
Furthermore, another result of this study revealed that the status of academic burnout among the students was lower than the moderate level� This finding is in line with the results of Lin and Huang (2014), which indicated that the status of academic burnout among students was lower than the moderate level�
Finally, the results of the present study indicated that positive and negative affects predicted variance in academic burnout among the students� Therefore, given the obtained results, it can be concluded that an increase in positive affect and an improvement in the method of controlling negative affect can play key roles in the prevention of academic burnout� In this regard, to improve positive affect, reduce negative affect, and prevent the incident of academic burnout among students, course planners are highly recommended to revise school curricula and pay attention to students’ interests and community needs when planning a course content�
References:Azimi, M�, & Piri, M� (2013)� The relationship of academic burnout and learning self-reg-
ulation with academic performance among high school students� Journal of Research in Curriculum Development, 10(11), 116 – 128�
Breso, E�, Salanova, M�, & Schoufeli, B� (1997)� In search of the third dimension of Burn-out� Applied psychology, 56(3), 460 – 472�
Dinner, E�, & Emmons, R�A� (1984)� The independence of positive and negative affect� Journal of Personality and Social Psychology, 47, 1105 – 1117�
Eslami, M�A� (2010)� The relationship of spiritual intelligence and mental-physical health with academic burnout among students of Allameh Tabatabai University� MA Thesis, Allameh Tabatabai University, Tehran�
Freudenberger, H�J� (1974)� Staff burn-out� Journal of Social Issues, 30, 159 – 161�Lin, S�H�, & Huang, Y�C� (2014)� Life stress and academic burnout� Journal of Active Learn-
ing in Higher Education, 15(1), 77 – 90�Márquez, P�G�, Martin, R�P�, & Brackett, M�A� (2006)� Relating emotional intelligence to
social competence and academic achievement in high school students� Psicothema, 18,118 – 123
Marzoughi, R�, Heidari, M�, & Heidari, E� (2013)� Examine the relationship between edu-cational equity and academic burnout among students of Welfare and Rehabilitation Sciences University� Journal of Strides in Development of Medical Education, Department of Research in and Development of Medical Education, 10(3), 328 – 334�
Michaeili, L�, Rajabi, S�, Abbasi, M�, & Zamanlou, Kh� (2014)� The relationship of emo-

57Children’s Metaphoric Expressions
Children’s Metaphoric Expressions ; The Meaning of Friendship.
A Comparative Analysis Between the USA and Poland
DOI: 10.15804/tner.2017.50.4.05
AbstractThe goal of this research project is to analyze children’s understanding of the concept of friendship by investigating symbolic representation in drawing and metaphoric expression in language� This research project is grounded in the conceptual metaphor theory (Lakoff & Johnson, 1980), in which metaphor is defined as a conceptual-linguistic mapping between a source and a target domain� It uses qualitative, ethnographic research based on Spradley’s (1979) theory stating that meanings are derived from symbolically coded concepts where X is a symbol and Y is a referent� The researchers in this study, one from the USA and one from Poland, asked a group of preschool children to draw pictures of their friends� When the children finished their drawings, the researchers asked them 4 questions: “What did you draw?” “Why are they friends?” and “A friend is like…”, “A friendship is like…”� The results demonstrate that preschool children have the cognitive ability to understand the concept of friend and even differentiate between friends and playmates� In the study, the children could determine the number of their real friends, and for most children in both countries, it was 1 or 2 friends� In the group of American children, friendship (X) had two basic meanings (Y): helping (YH) and playing (YP)� In Poland, friendship meant playing (YP) and being together after school (YBT)� The children in both countries associated friends (target domain) with (source domain) certain people (FP), character quality (FCH), activity (FA) and (FO) object/places� A comparison of the results demonstrates a difference in the number of friends the children claimed to
Krystyna Nowak-FabrykowskiUSAMonika Wiśniewska-KinPolandAnastasia BristleyUSA
have in Poland versus the USA� Additionally, the research showed that the American children drew only their friends without including themselves, while the Polish children included themselves in their pictures�
Keywords: friendship, metaphoric expressions
Introduction – theoretical background for selecting the subject, terminological findings
This research project uses the conceptual metaphor theory (Lakoff & Johnson, 1980), in which a metaphor was defined as a conceptual-linguistic mapping between a source and a target domain� Previous studies had shown that “children encounter metaphors in all aspects of their daily lives, including the spoken and written discourse of school, and metaphor can be one of the routes through which socio-cultural norms are appropriated� The use of metaphor seems to be a basic human skill, which develops in interaction with developing world knowledge and linguistic skills� Both the use of metaphor and the development of metaphor capacity take place in situations in which language is used for personal and interpersonal goals” (Cameron 1996, p� 49)� L� Cameron stated that: “Where once children were thought to develop skills with metaphor only at a late stage (e�g�, Piaget, 1974) more recent changes in theoretical frameworks and research methodologies have provided evidence that preschool children can produce and understand metaphorical language that is congruent with their level of conceptual development” (L� Cameron 1996, p� 50)� Other researchers go further and suggest that the thought processes underlying metaphor are basic to human development from infancy on� For example, Marschark and Nall (1985, p� 54) stressed that metaphor provides one of the basic ways of learning about the world� Its mapping of different, previously unrelated domains onto each other is seen to extend children’s knowledge to that which is unfamiliar, thus making it a tool as well as a skill� For example, Stites and Özçalişkan (2013, p� 116) empha-sized that metaphor plays a unique role in cognitive development by structuring abstract concepts and leading to conceptual change� Existing work suggests the early emergence of metaphorical abilities, with five-year-olds understanding and explaining metaphors that involve cross-domain comparisons (e�g�, space to time)�
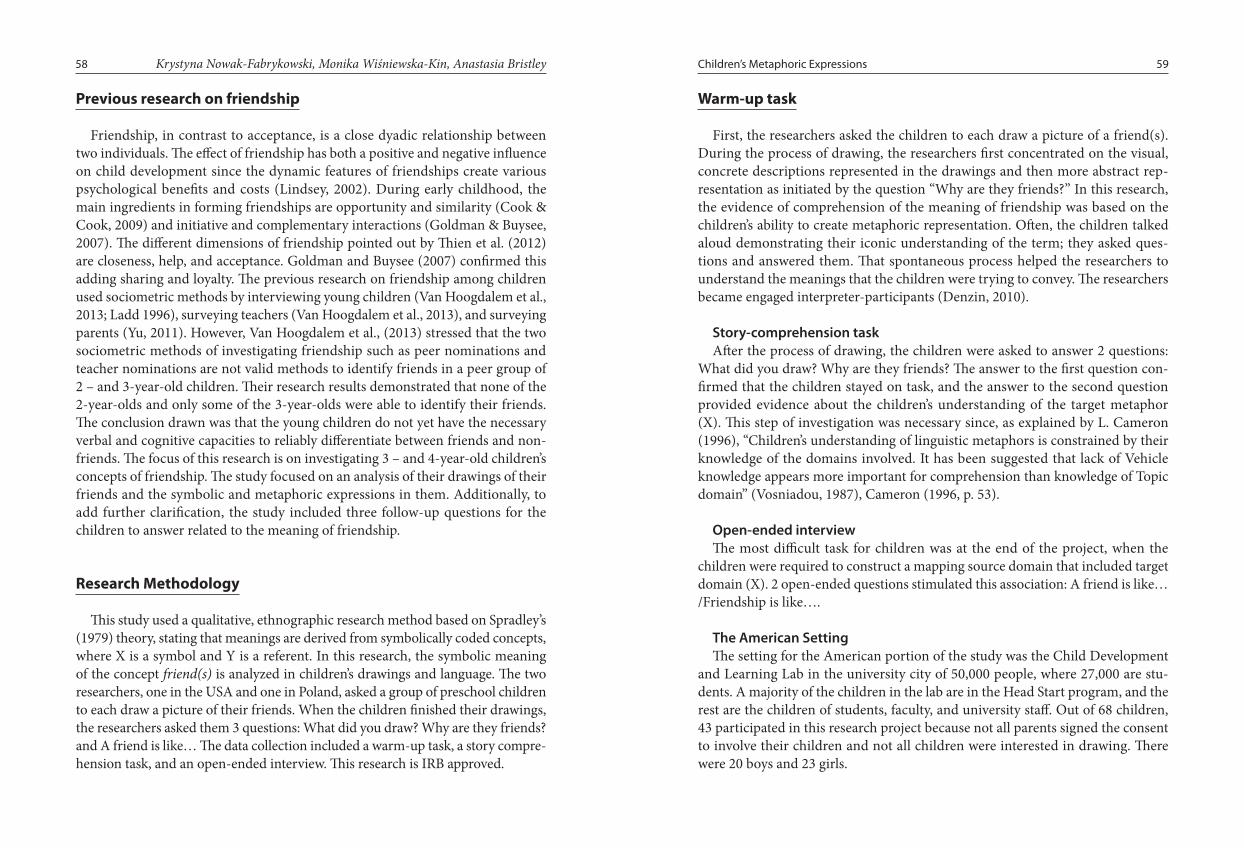
5958 Children’s Metaphoric ExpressionsKrystyna Nowak-Fabrykowski, Monika Wiśniewska-Kin, Anastasia Bristley
Previous research on friendship
Friendship, in contrast to acceptance, is a close dyadic relationship between two individuals� The effect of friendship has both a positive and negative influence on child development since the dynamic features of friendships create various psychological benefits and costs (Lindsey, 2002)� During early childhood, the main ingredients in forming friendships are opportunity and similarity (Cook & Cook, 2009) and initiative and complementary interactions (Goldman & Buysee, 2007)� The different dimensions of friendship pointed out by Thien et al� (2012) are closeness, help, and acceptance� Goldman and Buysee (2007) confirmed this adding sharing and loyalty� The previous research on friendship among children used sociometric methods by interviewing young children (Van Hoogdalem et al�, 2013; Ladd 1996), surveying teachers (Van Hoogdalem et al�, 2013), and surveying parents (Yu, 2011)� However, Van Hoogdalem et al�, (2013) stressed that the two sociometric methods of investigating friendship such as peer nominations and teacher nominations are not valid methods to identify friends in a peer group of 2 – and 3-year-old children� Their research results demonstrated that none of the 2-year-olds and only some of the 3-year-olds were able to identify their friends� The conclusion drawn was that the young children do not yet have the necessary verbal and cognitive capacities to reliably differentiate between friends and non-friends� The focus of this research is on investigating 3 – and 4-year-old children’s concepts of friendship� The study focused on an analysis of their drawings of their friends and the symbolic and metaphoric expressions in them� Additionally, to add further clarification, the study included three follow-up questions for the children to answer related to the meaning of friendship�
Research Methodology
This study used a qualitative, ethnographic research method based on Spradley’s (1979) theory, stating that meanings are derived from symbolically coded concepts, where X is a symbol and Y is a referent� In this research, the symbolic meaning of the concept friend(s) is analyzed in children’s drawings and language� The two researchers, one in the USA and one in Poland, asked a group of preschool children to each draw a picture of their friends� When the children finished their drawings, the researchers asked them 3 questions: What did you draw? Why are they friends? and A friend is like… The data collection included a warm-up task, a story compre-hension task, and an open-ended interview� This research is IRB approved�
Warm-up task
First, the researchers asked the children to each draw a picture of a friend(s)� During the process of drawing, the researchers first concentrated on the visual, concrete descriptions represented in the drawings and then more abstract rep-resentation as initiated by the question “Why are they friends?” In this research, the evidence of comprehension of the meaning of friendship was based on the children’s ability to create metaphoric representation� Often, the children talked aloud demonstrating their iconic understanding of the term; they asked ques-tions and answered them� That spontaneous process helped the researchers to understand the meanings that the children were trying to convey� The researchers became engaged interpreter-participants (Denzin, 2010)�
Story-comprehension taskAfter the process of drawing, the children were asked to answer 2 questions:
What did you draw? Why are they friends? The answer to the first question con-firmed that the children stayed on task, and the answer to the second question provided evidence about the children’s understanding of the target metaphor (X)� This step of investigation was necessary since, as explained by L� Cameron (1996), “Children’s understanding of linguistic metaphors is constrained by their knowledge of the domains involved� It has been suggested that lack of Vehicle knowledge appears more important for comprehension than knowledge of Topic domain” (Vosniadou, 1987), Cameron (1996, p� 53)�
Open-ended interviewThe most difficult task for children was at the end of the project, when the
children were required to construct a mapping source domain that included target domain (X)� 2 open-ended questions stimulated this association: A friend is like… /Friendship is like…�
The American SettingThe setting for the American portion of the study was the Child Development
and Learning Lab in the university city of 50,000 people, where 27,000 are stu-dents� A majority of the children in the lab are in the Head Start program, and the rest are the children of students, faculty, and university staff� Out of 68 children, 43 participated in this research project because not all parents signed the consent to involve their children and not all children were interested in drawing� There were 20 boys and 23 girls�
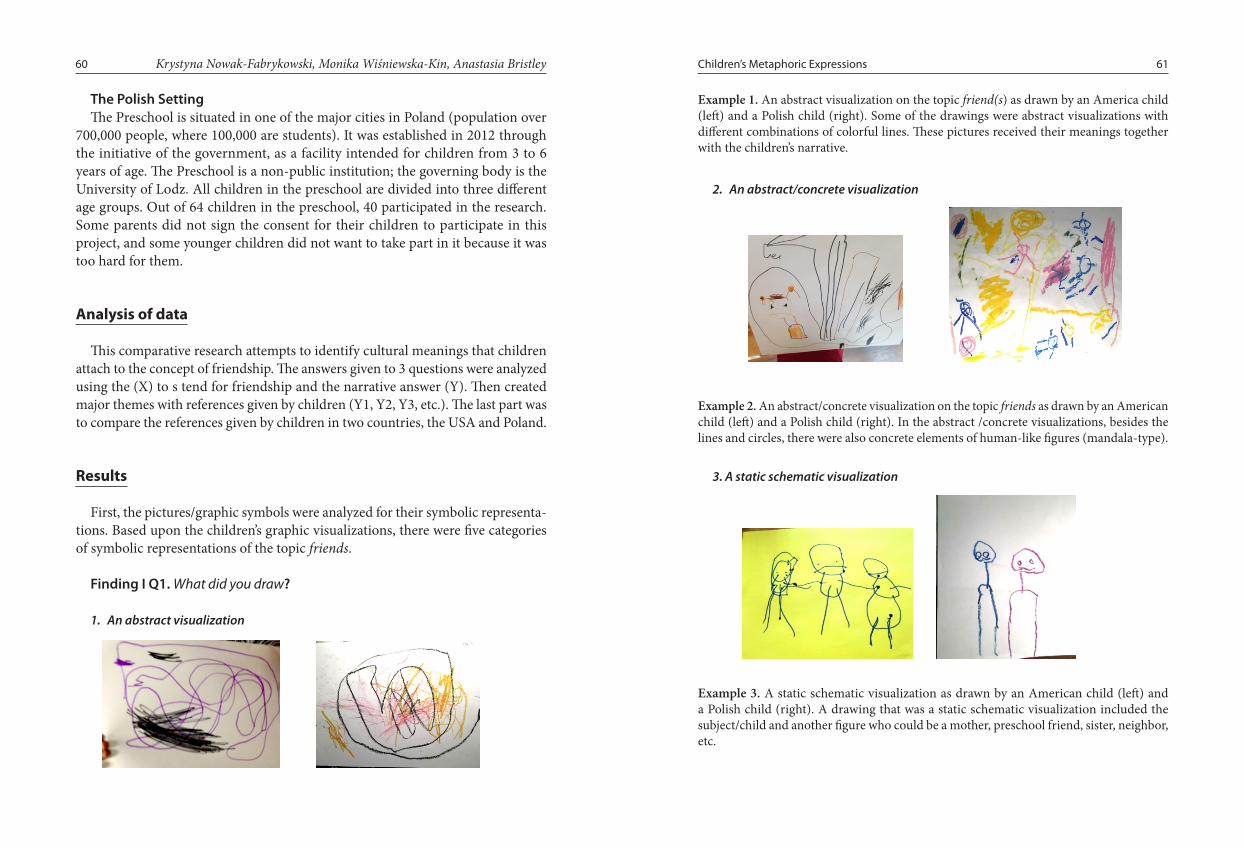
6160 Children’s Metaphoric ExpressionsKrystyna Nowak-Fabrykowski, Monika Wiśniewska-Kin, Anastasia Bristley
The Polish SettingThe Preschool is situated in one of the major cities in Poland (population over
700,000 people, where 100,000 are students)� It was established in 2012 through the initiative of the government, as a facility intended for children from 3 to 6 years of age� The Preschool is a non-public institution; the governing body is the University of Lodz� All children in the preschool are divided into three different age groups� Out of 64 children in the preschool, 40 participated in the research� Some parents did not sign the consent for their children to participate in this project, and some younger children did not want to take part in it because it was too hard for them�
Analysis of data
This comparative research attempts to identify cultural meanings that children attach to the concept of friendship� The answers given to 3 questions were analyzed using the (X) to s tend for friendship and the narrative answer (Y)� Then created major themes with references given by children (Y1, Y2, Y3, etc�)� The last part was to compare the references given by children in two countries, the USA and Poland�
Results
First, the pictures/graphic symbols were analyzed for their symbolic representa-tions� Based upon the children’s graphic visualizations, there were five categories of symbolic representations of the topic friends�
Finding I Q1. What did you draw?
1. An abstract visualization
Example 1. An abstract visualization on the topic friend(s) as drawn by an America child (left) and a Polish child (right)� Some of the drawings were abstract visualizations with different combinations of colorful lines� These pictures received their meanings together with the children’s narrative�
2. An abstract/concrete visualization
Example 2. An abstract/concrete visualization on the topic friends as drawn by an American child (left) and a Polish child (right)� In the abstract /concrete visualizations, besides the lines and circles, there were also concrete elements of human-like figures (mandala-type)�
3. A static schematic visualization
Example 3. A static schematic visualization as drawn by an American child (left) and a Polish child (right)� A drawing that was a static schematic visualization included the subject/child and another figure who could be a mother, preschool friend, sister, neighbor, etc�

6362 Children’s Metaphoric ExpressionsKrystyna Nowak-Fabrykowski, Monika Wiśniewska-Kin, Anastasia Bristley
4. A static schematic visualization of a friend with elements from nature, or representing their environment
Example 4� A static schematic visualization on the topic friend(s) with some elements from nature or the surroundings included as drawn by an American child (left) and a Polish child (right)� This type of representation was uncommon in the American group of children� This is the only picture that one American child created and added the letter “f ” for friends�
5. Dynamic visualization with objects
Example 5. Dynamic visualization with objects (often 2) and people who demonstrate a community of people and things� This is a picture drawn by a Polish child (5 years and 5 months old)� The Polish researcher reported that the children episodically drew some visualizations of people and things from nature that created the meaning of friendship� An idea of friendship evokes in children pictures of community and unity between nature and people� This type of symbolic visualization was not present in the American children, maybe because the children in the American setting were younger, except one child who was five years old�
Finding II Q2. Why are they friends?The second finding is related to the question about why the children in the
picture are friends�Surprisingly, the children could differentiate between their friends and play-
mates� Following Piaget’s liberated conviction idea, each child was able to very quickly determine the number of friends using previous experience and knowl-edge� From the first minute of drawing the pictures of friends, they could tell how many friends they had� The American teacher asked what about (name of the child) or you play with (the name of the child), and the children replied yes, I play with them, but they are not my friends� Out of 43 American children, 6 reported having only 1 friend; 14 reported having 2 friends; 4 reported having 3 friends; 5 reported having 4 friends; one child reported having 6 friends, and 2 reported having many friends� In the American sample, 32 children verbally and visually identified the number of friends and others just drew them or did not respond verbally (some of the children were still non-verbal)� In the Polish sample, out of 40 children, 35 could identify the number of friends� At most, 20 children were identified as having 1 friend, 10 children as having 2 friends, and 2 children as having 3 friends� There were no children who stated having 4, 5 or 6 friends� The most interesting finding is that the Polish children often drew themselves with friends, but the American children just drew friends without including themselves�
1. One friendIn the American sample, 6 children were identified as having one friend� One
child, when asked what he had drawn, replied, “…one friend and my Mom and brother”� Some children struggled with not including their brother or sister as friends (left)� In the Polish sample, 20 children claimed to have 1 friend (right)� Most Polish children gave the names of their friend(s), and in most cases it was a child from preschool� Some children just said “friend”, “my best friend”, or a “boy”� For one child, his best friend was his Mom�

6564 Children’s Metaphoric ExpressionsKrystyna Nowak-Fabrykowski, Monika Wiśniewska-Kin, Anastasia Bristley
2. Two friendsIn the American sample, most children were in this category, with 14 children
claiming to have 2 friends� In the Polish sample, 10 children decided that they had 2 friends, and their friends were children from preschool�
3. Three friendsIn the American sample, 4 children claimed to have 3 friends� In the Polish
sample, 2 children had 3 friends� In the Polish sample, the children named friends from the previous preschool, the current preschool, and their families�
4. Four, five and six friendsIn the American sample, 5 children claimed to have 4 friends� Five American
children said that they had 5 friends� There was 1 child in the American sample with 6 friends� There was no child in the Polish sample with 4, 5 or 6 friends�
5. Many friendsIn the American sample, only 2 children claimed to have many friends� In the
Polish sample, 2 children also declared they had many friends�
Regarding the number of friends, most children in both countries have a notion that friends are very special and that most people have 1 or 2 friends� The study demonstrated that young children have an ability to analyze concepts using complex and diverse meanings (Wierzbicka, 2006) by determining the number of friends and differentiating between playmates and friends. Some Polish children explained that “When there are too many friends, it is too noisy and difficult to play, and it will be sad�” Some children in Poland as well as in America named their mom, dad, brother, sister, or cousin as friends�
The third finding is related to the children’s ability to determine the character-istics of friendship�
The young children could convey their meanings to other people (Wierzbicka, 2006) and explained the characteristics that determined why some children are their friends�
Considering Spradley’s (1979) theory of meanings, which stresses that meanings are derived from the symbolically coded concepts, in our analysis we are looking at children’s meanings of the concept of a friend and comparing references given by American and Polish children�
Finding III Q3. “A friend is like…”The next question the researchers asked the children to define a friend� This
question was difficult for the children to answer� For the American children, the concept of Friend (F) means people F(P), character quality F(Ch), activity F(A),
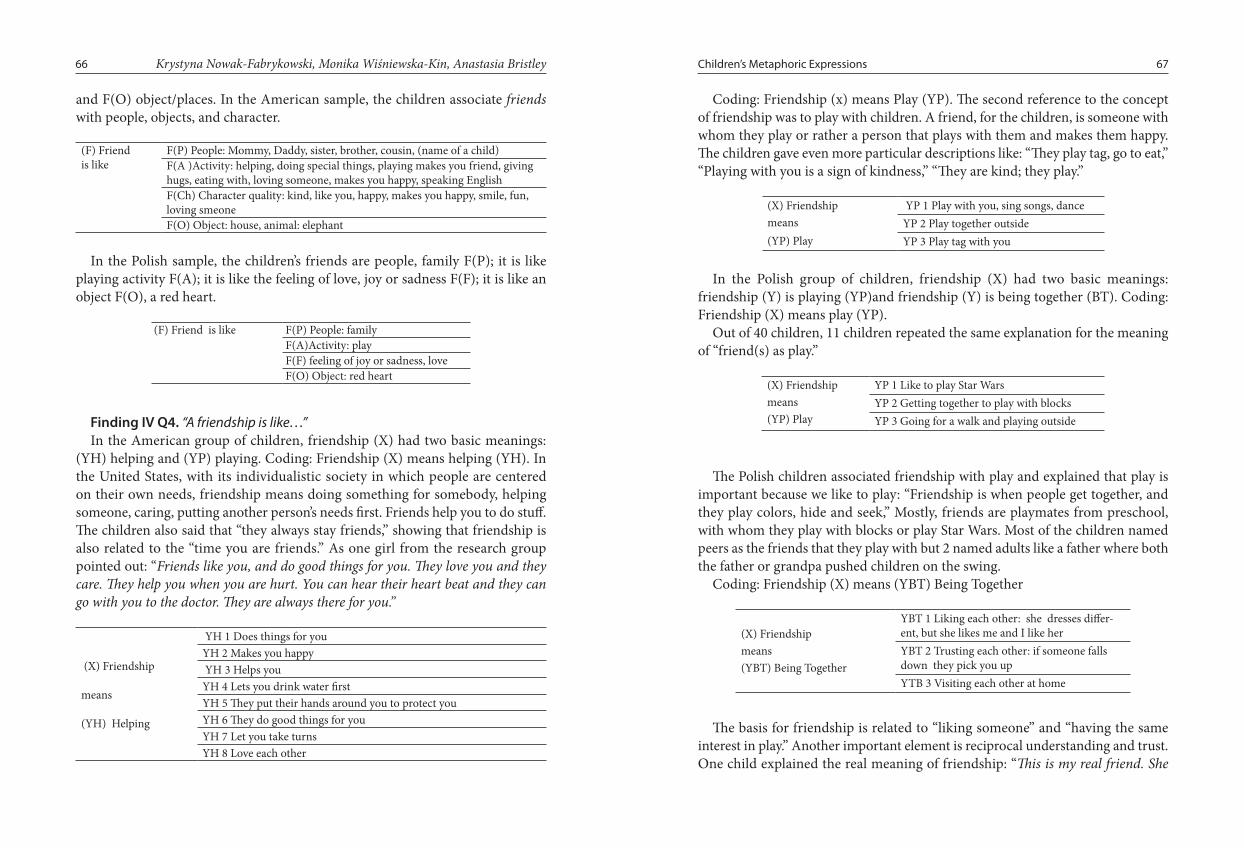
6766 Children’s Metaphoric ExpressionsKrystyna Nowak-Fabrykowski, Monika Wiśniewska-Kin, Anastasia Bristley
and F(O) object/places� In the American sample, the children associate friends with people, objects, and character�
(F) Friend is like
F(P) People: Mommy, Daddy, sister, brother, cousin, (name of a child)F(A )Activity: helping, doing special things, playing makes you friend, giving hugs, eating with, loving someone, makes you happy, speaking EnglishF(Ch) Character quality: kind, like you, happy, makes you happy, smile, fun, loving smeoneF(O) Object: house, animal: elephant
In the Polish sample, the children’s friends are people, family F(P); it is like playing activity F(A); it is like the feeling of love, joy or sadness F(F); it is like an object F(O), a red heart�
(F) Friend is like F(P) People: familyF(A)Activity: playF(F) feeling of joy or sadness, loveF(O) Object: red heart
Finding IV Q4. “A friendship is like…”In the American group of children, friendship (X) had two basic meanings:
(YH) helping and (YP) playing� Coding: Friendship (X) means helping (YH)� In the United States, with its individualistic society in which people are centered on their own needs, friendship means doing something for somebody, helping someone, caring, putting another person’s needs first� Friends help you to do stuff� The children also said that “they always stay friends,” showing that friendship is also related to the “time you are friends�” As one girl from the research group pointed out: “Friends like you, and do good things for you. They love you and they care. They help you when you are hurt. You can hear their heart beat and they can go with you to the doctor. They are always there for you.”
(X) Friendship
means
(YH) Helping
YH 1 Does things for youYH 2 Makes you happy YH 3 Helps youYH 4 Lets you drink water firstYH 5 They put their hands around you to protect youYH 6 They do good things for youYH 7 Let you take turnsYH 8 Love each other
Coding: Friendship (x) means Play (YP)� The second reference to the concept of friendship was to play with children� A friend, for the children, is someone with whom they play or rather a person that plays with them and makes them happy� The children gave even more particular descriptions like: “They play tag, go to eat,” “Playing with you is a sign of kindness,” “They are kind; they play�”
(X) Friendship means (YP) Play
YP 1 Play with you, sing songs, danceYP 2 Play together outsideYP 3 Play tag with you
In the Polish group of children, friendship (X) had two basic meanings: friendship (Y) is playing (YP)and friendship (Y) is being together (BT)� Coding: Friendship (X) means play (YP)�
Out of 40 children, 11 children repeated the same explanation for the meaning of “friend(s) as play�”
(X) Friendship means (YP) Play
YP 1 Like to play Star WarsYP 2 Getting together to play with blocksYP 3 Going for a walk and playing outside
The Polish children associated friendship with play and explained that play is important because we like to play: “Friendship is when people get together, and they play colors, hide and seek,” Mostly, friends are playmates from preschool, with whom they play with blocks or play Star Wars� Most of the children named peers as the friends that they play with but 2 named adults like a father where both the father or grandpa pushed children on the swing�
Coding: Friendship (X) means (YBT) Being Together
(X) Friendship means (YBT) Being Together
YBT 1 Liking each other: she dresses differ-ent, but she likes me and I like herYBT 2 Trusting each other: if someone falls down they pick you upYTB 3 Visiting each other at home
The basis for friendship is related to “liking someone” and “having the same interest in play�” Another important element is reciprocal understanding and trust� One child explained the real meaning of friendship: “This is my real friend. She

6968 Children’s Metaphoric ExpressionsKrystyna Nowak-Fabrykowski, Monika Wiśniewska-Kin, Anastasia Bristley
does not attend my preschool, but we visit each other at home. She dresses different than me, but she likes me, and I like her.”
Another characteristic of friendship for the Polish children is an ability to trust someone: “If someone falls down, the friend will help you to get up, or if something breaks, they will fix it.”
One Polish child even mentioned sacrifices: “My Mom is my friend because she gave birth to me.”
Summary
In both countries, the children could respond to the given task and draw a friend(s), which means that they are able to think in an abstract way and find connection to the target domain (friend/ friendship)� They used symbolic thinking to express their thoughts and feelings and conveyed the meanings to other people (researchers)� There were some surprising results at the very beginning of the study, when the children drew just a few friends and when asked, “How many friends did you draw?” they gave very low numbers� When asked a follow-up question, “How many friends do you have?,” the majority said 1 (Polish sample) or 2 (American sample)� They could differentiate between friends and occasional playmates, contrary to the conclusion of Van Hoogdalem et al� (2013), that only some 3-year olds can differentiate between friends and non-friends� All the pre-school children precisely identified the number of friends, and for some children, the number of friends was higher than 1 or 2� Another finding demonstrated that the American children drew just friends, but the Polish children drew themselves among the friends� The American children associated friendship with help, con-firming the findings of Thien et al�(2012) and Goldman and Buysee (2007) and play at school or at home� For the Polish children, the symbolic connotation was play and being together� Another small difference was in the explanation “A friend is like�” For both groups of children, a friend is like a family member or somebody to play with or do activities with� It also could be an object like a toy, but for the American children it is also the character that counts in a friend, like kindness, being nice, or happiness, and in the Polish sample, the important qualities were related to feelings like joy or sadness�
References:Cameron L�, (1996)� Discourse context and the development of metaphor in children, Cur-
rent Issues in Language & Society, 3(1),49 – 64� Cook J�L�, & Cook G�, (2009)� Child Development Principles and Perspectives� Boston: Allyn
& Bacon�Denzin N�K�, (2000)� Handbook of qualitative research� CA: Palo Alto, Sage� Goldman, B� & Buysee, V�, (2007)� Friendship in the very young age� In Saracho, O� &
Spodek, B� (2007)� Contemporary Perspectives on Socialization and Social Development in Early Childhood Education, University of Maryland: Information Age Publishing�
Ladd, G�, Kochenderfer, B�, & Coleman, C�, (1996)� Friendship Quality as a Predictor of Young Children’s Early School Adjustment, Child Development, 67 (3), 1103 – 1118�
Lakoff, G & Johnsen, M�, (1980)� Metaphors we live by� Chicago: University of Chicago Press�
Lindsey E�W�, (2002)� Preschool Children’s Friendships and Peer Acceptance: Links to Social Competence� Child Study Journal, 32(3), 145 – 156�
Marschark, M�, & Nall, L� (1985)� Metaphoric competence in cognitive and language devel-opment� In H� Reese (ed�) Advances in Child Development and Behaviour� Orlando: FL: Academic Press Inc�
Piaget J�, (1951)� The Child’s Conception of the World� London: Littlefield� Spradley J�, (1979)� The Ethnographic Interview� Belmont, CA: Wadsworth� Stites L�J�, & Özçalişkan Ş�, (2013)� Teasing Apart the Role of Cognitive and Verbal Factors
in Children’s Early Metaphorical Abilities� Metaphor & Symbol, 28 (2), 116 – 129� Thien, L�M�, Razak, N�A�, & Kamil, H� (2012)� Friendship Quality Scale: Conceptualization,
Development and Validation, School of Educational Studies, Universiti Sains Malaysia, Penang�
Van Hoogdalem A�G�, Singer E�, Eek A�, & Heesbeen D�, (2013)� Friendship in Young Chil-dren: Construction of a Behavioural Stoichiometric Method� Journal of Early Childhood Research, 11 (3), p�236 – 24�
Vosniadou S�, (1987)� Children and metaphors� Child Development, 58, 870 – 85� Wierzbicka, A� (2006)� English. Meaning and Culture� NY: New York, Oxford University
Press� Yu S�, Ostrosky M�M�, Fowler S�A� (2011)� Children’s friendship development: A compar-
ative study� Early Childhood Research & Practice, 13� Retrieved from http://ecrp�uiuc�edu/v13n1/yu�html Google Scholar

71How Faculty Members’ Personality
How Faculty Members’ Personality traits Influence their Education-Research Performance
DOI: 10.15804/tner.2017.50.4.06
AbstractThe purpose of this study was to investigate the relationship between person-ality traits and education-research performance of faculty members� A survey was conducted among 321 faculty members in Tehran University, Iran� The research instrument included: personal and professional features, items related to personality traits, and items related to self-evaluation of education and research performance� Reliability and validity of the instrument were determined through opinions of faculty members and application of Cron-bach’s Alpha, respectively� Data were analyzed descriptively and inferentially using SPSS/Windows� Findings showed that neuroticism had a negative and significant effect on education and research performance� Openness to experience, agreeableness, and conscientiousness had positive and significant effects on research performance� Extraversion and agreeableness had positive and significant effects on education performance� Finally, results showed that agreeableness had the most effect on educational performance and neuroticism had the most effect on research performance�
Keywords: personality traits, education performance, research performance, faculty member
Introduction
Educated manpower is vital in today’s world and that is why universities and higher education institutions have an important responsibility to educate skillful,
Mahtab Pouratashi, Asghar ZamaniIran
creative, and motivated manpower for different economic activities of their coun-tries� Faculty members are the major pillars in universities and in the teaching and learning process� They are expected to make substantial contributions to educating their students, as well as to make contributions to their field and university (Samp-son et al�, 2010)� In other words, faculty members are expert human resources responsible for teaching and dissemination of knowledge, thus, the quality and development of knowledge significantly depends on faculty members’ perfor-mance (YaminiDozi Sorkhabi & Bahrami, 2009 as cited in: Rakhshani & Shams, 2014)� Education and research are two important functions of faculty members in universities (Rakhshani & Shams, 2014) and it is obvious that studying the edu-cation and research performance of faculty members and their determinants can serve as a contributing factor in enhancing the performance of faculty members� Different factors influence job performance, such as transformational leadership (Nemanich & Keller, 2007; Jalali & Rooholahi, 2015), organizational commit-ment (Derakhshide & Kazemi, 2014; MasoodiAsl et al�, 2012), personality traits (Rothmann & Coetzer, 2003; Ahmad et al�, 2014), conscientiousness (Alirezaee et al�, 2013), etc� Rahimi (2007) stated that scientific cooperation among faculty members would result to an increase in their scientific-research output� It can be said that among the factors influencing job performance, personality traits are more important than other factors, due to their considerable stability (Cooper & Robertson, 1995, as cited in: Rahmani Dotalabadi et al�, 2016) and they can be used to predict individuals’ behaviors and job performance (Witt, 2002)�
Since assessing faculty members’ performance is an important tool to improve the quality of higher education and considering that faculty members’ evaluation of their performance can lead to greater quality, and also due to the importance of personality traits, in this study the relationship between faculty members’ personality traits and evaluation of their educational and research performance was studied� The specific objectives of the research were to study: (1) faculty members’ personality traits (2) faculty members’ self-evaluation of educational and research performance (3) relationship between faculty members’ personality traits and educational and research performance�
Brief literature review
Personality refers to a pattern of relatively permanent traits that give consistency and individuality to an individual’s behavior (Feist & Feist, 2009)� In other words, among various characteristics, what helps people to better explain themselves and

7372 How Faculty Members’ Personality Mahtab Pouratashi, Asghar Zamani
others is personality (Narimani et al�, 2007), which is a total of an individual’s men-tal, emotional, physical, and social characteristics (Peabody & Goldberg, 1989)� Personality is affected by internal factors (e�g�, thoughts, values, and inherited attributes) and external factors (e�g�, visible behaviors) (McShane & Von-Glinow, 2003, as cited in: Khonifar et al�, 2009)� In the history of psychology, the study of personality has been done using different approaches� Some psychologists, such as Cattell, developed new factor analytic techniques to study personality� One of the results of Cattell’s application of factor analysis was his discovery of the empir-ically-derived theory of personality factors� The multidimensional self-report instrument used to measure them is known as the 16 personality factor model (Eliasi, 2009)� Eysenck (1985, as cited in: Eliasi, 2009) presented a three-factor model to study personality, which were identified on a spectrum: extraversion-in-troversion (E), neuroticism-emotional stability (N), and psychoticism (E)� The most important traits of the three dimensions of personality are: (1) Extraverts: sociable and crave excitement and change, tend to be carefree, optimistic and impulsive� Introverts: reserved, plan their actions and control their emotions, tend to be serious, reliable and pessimistic� (2) Neurotics: tend to be anxious, worrying and moody, find it difficult to calm down once upset� Stables: emotionally calm, unreactive and unworried� (3) Psychotics: lacking in empathy, cruel, aggressive and troublesome�
Contemporary scholars in the field of personality believe that Eysenck’s theory is very simple and has few dimensions, and at the same time, Cattell’s theory is very complex and has many factors� In recent decades, the taxonomy of personal-ity that has received the most attention is a five-factor model� McCrae and Costa (1987) presented a model of personality that is known as the five-factor model of personality� Accordingly, the five dominant personality traits are: neuroticism (the tendency to experience negative moods, such as anxiety and depression), extraversion (inclination to be sociable), openness to experience (creativity and appreciation of esthetic experiences), agreeableness (the quality of one’s inter-personal interactions), and conscientiousness (the amount of persistence and motivation in goal-directed behaviors) (Besser & Shackelford, 2007; Weisberg et al�, 2011)� McCrae and Costa, in their research, concluded that the basic factors of personality had good stability, so that those in their childhood had a high or low score in these factors, retained the same characteristic in the next six years� Today, the five-factor model is a widely accepted construct describing personality variation (Rahmani et al�, 2016)�
Morris et al� (2004, as cited in: Eliasi, 2009) examined a broad range of manag-ers’ personality traits and their relationship with job performance� They found that
the factors predicting managers’ performance were: responsibility, self-esteem, progression, and extraversion� In a study of the relationship between personality traits and job success, Samans (2006) found that two factors of conscientiousness and extraversion were good predictors of job success� Kark et al� (2003) found that there was a strong relationship between conscientiousness and job performance� The conceptual framework of research is shown in Figure 1�
Method
Population and sampleThe statistical population of the study consisted of the faculty members of the
University of Tehran (N= 1951)� A sample of 321 faculty members was randomly selected using a random sampling method (Krejcie and Morgan Table)�
InstrumentsData were collected from the target group by means of a questionnaire� The
first section of the questionnaire contained the respondents’ demographic char-acteristics and the remaining sections consisted of questions related to personality traits and self-evaluation of education and research performance� Several rating instruments were developed to measure the Big Five dimensions of personality traits� The most comprehensive instrument was Costa and McCrae’s (1992) 240-
Figure 1. Conceptual framework of research

7574 How Faculty Members’ Personality Mahtab Pouratashi, Asghar Zamani
item NEO Personality Inventory, which measured the Big-Five domains� The inventory was too lengthy for many research purposes, and to answer the need for a short instrument measuring the prototypical components of the Big Five personality traits, John et al� (1991) constructed the Big Five Inventory (BFI, as cited in: John & Srivastava, 1999), which is composed of 44 items� The items of BFI were rated on a 5-point Likert scale ranging from 1 (strongly disagree) to 5 (strongly agree)� To assess the faculty members’ self-evaluation, an inventory was developed, divided into two section: (a) assessment of educational performance and (b) assessment of research performance, each category containing 8 items, on a 5-point scale ranging from 1 to 5�
The face validity of the questionnaire was confirmed by a panel of experts consisting of the faculty members of Tarbiat Modares University� Cronbach’s alpha was used to estimate the reliability of the questionnaire and showed good reliability for the instrument (Table 1)�
Table 1. Results of Cronbach’s alpha
Scale Dimension Cronbach’s alphaPersonality traits Neuroticism �84
Extraversion �87Openness to experience �85Agreeableness �85Conscientiousness �82
Educational-Research Performance Educational performance �81Research performance �86
Data analysisAnalysis of data was made in two sections, descriptive and inferential statistics�
Statistics such as frequency distribution, percentage, mean and standard deviation were used in the descriptive section� Correlation coefficient, t-test, and regression analysis were used in the inferential analysis section� In applying these statistical techniques, Statistical Package for Social Science (SPSS) was used�
Results
More than half of the respondents were males (69�5% versus 30�5% females)� The average age of the faculty members was about 44, with the most frequency of 41 to 50 years old� The respondents’ mean work experience was 16 years� About half of the respondents were assistant professors (48�5%), followed by associate professors (28%)� The findings showed that over the past five years, the majority of the respondents (85�8%) had written between 1 and 5 Persian articles� Also, 9�9% of the respondents wrote more than 10 Persian articles� Regarding articles in English, the findings indicated that 73�5% of the respondents had written between 1 and 3 English articles� Almost all the respondents participated in at least one national conference� Regarding research projects at the university, the findings showed that the highest frequency was from 1 to 2 projects (63�5%), and the find-ings regarding research projects outside the university indicated that the highest frequency was also related to 1 to 2 projects (47�6%)� The findings concerning writing or translating a book showed that 34�1% of the respondents had written or translated at least one book�
As previously stated, personality traits include five dimensions: neuroticism, extraversion, openness to experience, agreeableness, and conscientiousness� The mean score of neuroticism was 27�23� Also, the mean score of extraversion, openness to experience, agreeableness, and conscientiousness dimensions were 31�99, 36�64, 34�43, and 31�38, respectively� The findings on the respondents’ self-evaluation of educational and research performance showed that the mean score on educational performance was 22�82 and on research performance 21�02� The results regarding probable differences in personality traits by gender (Table 2) showed significant differences on neuroticism, extraversion, and conscientious-ness between the male and female faculty members� The findings revealed that on extraversion, the male faculty members had a significantly higher score than the female ones, whereas the female members scored higher on the dimensions of neuroticism and conscientiousness compared to the male ones� On openness to experience and agreeableness, the female faculty members got higher scores than the male group� However, these scores were not statistically significant� The results regarding probable differences of educational and research performance by gender showed that in both dimensions of performance, the male faculty members had higher scores than their female counterparts, and this difference in research performance was significant (Table 2)
Pearson correlation analysis was conducted to examine the probable rela-tionships between educational and research performance and personality traits
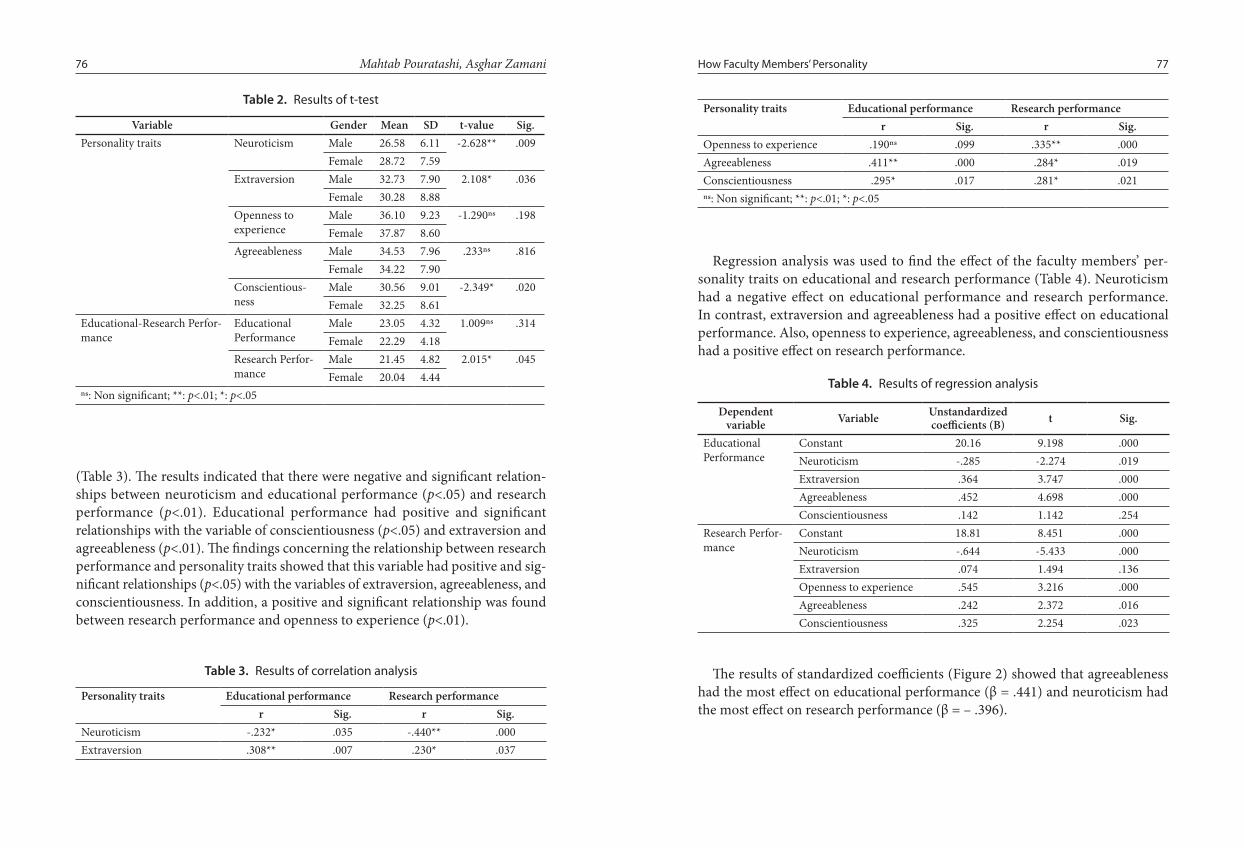
7776 How Faculty Members’ Personality Mahtab Pouratashi, Asghar Zamani
(Table 3)� The results indicated that there were negative and significant relation-ships between neuroticism and educational performance (p<�05) and research performance (p<�01)� Educational performance had positive and significant relationships with the variable of conscientiousness (p<�05) and extraversion and agreeableness (p<�01)� The findings concerning the relationship between research performance and personality traits showed that this variable had positive and sig-nificant relationships (p<�05) with the variables of extraversion, agreeableness, and conscientiousness� In addition, a positive and significant relationship was found between research performance and openness to experience (p<�01)�
Table 3. Results of correlation analysis
Personality traits Educational performance Research performancer Sig. r Sig.
Neuroticism -�232* �035 -�440** �000Extraversion �308** �007 �230* �037
Personality traits Educational performance Research performancer Sig. r Sig.
Openness to experience �190ns �099 �335** �000Agreeableness �411** �000 �284* �019Conscientiousness �295* �017 �281* �021ns: Non significant; **: p<�01; *: p<�05
Regression analysis was used to find the effect of the faculty members’ per-sonality traits on educational and research performance (Table 4)� Neuroticism had a negative effect on educational performance and research performance� In contrast, extraversion and agreeableness had a positive effect on educational performance� Also, openness to experience, agreeableness, and conscientiousness had a positive effect on research performance�
Table 4. Results of regression analysis
Dependent variable Variable Unstandardized
coefficients (B) t Sig.
Educational Performance
Constant 20�16 9�198 �000Neuroticism -�285 -2�274 �019Extraversion �364 3�747 �000Agreeableness �452 4�698 �000Conscientiousness �142 1�142 �254
Research Perfor-mance
Constant 18�81 8�451 �000Neuroticism -�644 -5�433 �000Extraversion �074 1�494 �136Openness to experience �545 3�216 �000Agreeableness �242 2�372 �016Conscientiousness �325 2�254 �023
The results of standardized coefficients (Figure 2) showed that agreeableness had the most effect on educational performance (β = �441) and neuroticism had the most effect on research performance (β = – �396)�
Table 2. Results of t-test
Variable Gender Mean SD t-value Sig.Personality traits Neuroticism Male 26�58 6�11 -2�628** �009
Female 28�72 7�59Extraversion Male 32�73 7�90 2�108* �036
Female 30�28 8�88Openness to experience
Male 36�10 9�23 -1�290ns �198Female 37�87 8�60
Agreeableness Male 34�53 7�96 �233ns �816Female 34�22 7�90
Conscientious-ness
Male 30�56 9�01 -2�349* �020Female 32�25 8�61
Educational-Research Perfor-mance
Educational Performance
Male 23�05 4�32 1�009ns �314Female 22�29 4�18
Research Perfor-mance
Male 21�45 4�82 2�015* �045Female 20�04 4�44
ns: Non significant; **: p<�01; *: p<�05
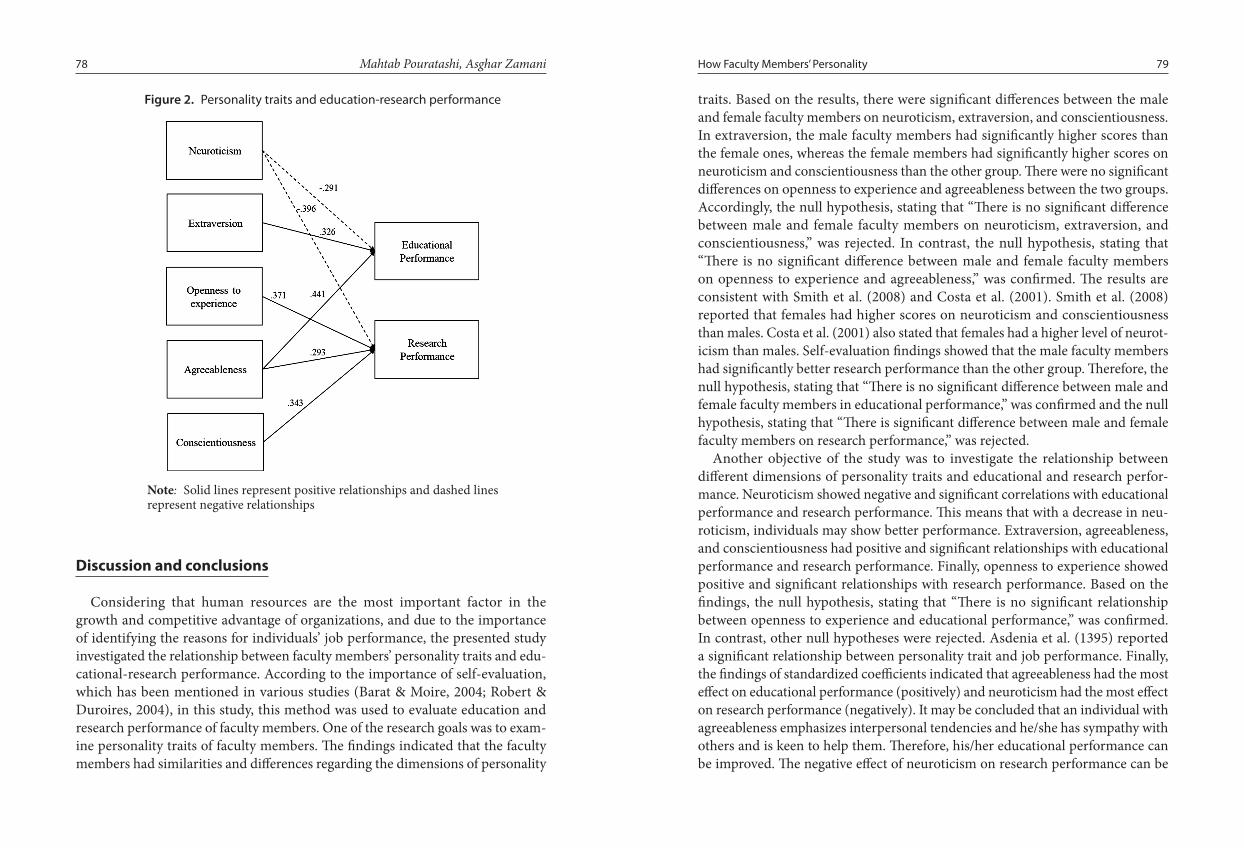
7978 How Faculty Members’ Personality Mahtab Pouratashi, Asghar Zamani
Discussion and conclusions
Considering that human resources are the most important factor in the growth and competitive advantage of organizations, and due to the importance of identifying the reasons for individuals’ job performance, the presented study investigated the relationship between faculty members’ personality traits and edu-cational-research performance� According to the importance of self-evaluation, which has been mentioned in various studies (Barat & Moire, 2004; Robert & Duroires, 2004), in this study, this method was used to evaluate education and research performance of faculty members� One of the research goals was to exam-ine personality traits of faculty members� The findings indicated that the faculty members had similarities and differences regarding the dimensions of personality
Note: Solid lines represent positive relationships and dashed lines represent negative relationships
Figure 2. Personality traits and education-research performance traits� Based on the results, there were significant differences between the male and female faculty members on neuroticism, extraversion, and conscientiousness� In extraversion, the male faculty members had significantly higher scores than the female ones, whereas the female members had significantly higher scores on neuroticism and conscientiousness than the other group� There were no significant differences on openness to experience and agreeableness between the two groups� Accordingly, the null hypothesis, stating that “There is no significant difference between male and female faculty members on neuroticism, extraversion, and conscientiousness,” was rejected� In contrast, the null hypothesis, stating that “There is no significant difference between male and female faculty members on openness to experience and agreeableness,” was confirmed� The results are consistent with Smith et al� (2008) and Costa et al� (2001)� Smith et al� (2008) reported that females had higher scores on neuroticism and conscientiousness than males� Costa et al� (2001) also stated that females had a higher level of neurot-icism than males� Self-evaluation findings showed that the male faculty members had significantly better research performance than the other group� Therefore, the null hypothesis, stating that “There is no significant difference between male and female faculty members in educational performance,” was confirmed and the null hypothesis, stating that “There is significant difference between male and female faculty members on research performance,” was rejected�
Another objective of the study was to investigate the relationship between different dimensions of personality traits and educational and research perfor-mance� Neuroticism showed negative and significant correlations with educational performance and research performance� This means that with a decrease in neu-roticism, individuals may show better performance� Extraversion, agreeableness, and conscientiousness had positive and significant relationships with educational performance and research performance� Finally, openness to experience showed positive and significant relationships with research performance� Based on the findings, the null hypothesis, stating that “There is no significant relationship between openness to experience and educational performance,” was confirmed� In contrast, other null hypotheses were rejected� Asdenia et al� (1395) reported a significant relationship between personality trait and job performance� Finally, the findings of standardized coefficients indicated that agreeableness had the most effect on educational performance (positively) and neuroticism had the most effect on research performance (negatively)� It may be concluded that an individual with agreeableness emphasizes interpersonal tendencies and he/she has sympathy with others and is keen to help them� Therefore, his/her educational performance can be improved� The negative effect of neuroticism on research performance can be

8180 How Faculty Members’ Personality Mahtab Pouratashi, Asghar Zamani
described according to the features of this dimension, in which a neurotic person has low self-esteem, usually has a negative attitude toward his/her work, and he/she experiences some stress� Thus, individuals with this feature will have a negative evaluation of their performance� Summing up the findings, it can be said that it is important and necessary to pay attention to personality traits in general and the dimensions of agreeableness and neuroticism in particular, because faculty members’ educational and research performance has a significant effect on the quality of universities�
As with any study, it is important to highlight the limitations of this study and the directions for future research� This study was limited by its relevance on self-reported data� In addition, only quantitative methods were used in this study� In further studies, qualitative data can be gathered using interviews and observation to gain an in-depth understanding of faculty members’ perfor-mance�
References:Ahmad, J�, Ather, M�R�, & Hussain, M� (2014)� Impact of big five personality traits on job
performance (organizational commitment as a mediator)� International Conference on management, knowledge and learning� 25 – 27 June 2014 Slovenia�
Alirezaee, N�, Mesah, H� & Akrami, N� (2013)� Relationship between job conscience and job performance� Ethics in Science and Technology, 8(2), 1 – 11�
Asadnia, A�, Jalilpour, P�, Ahmadi, V� & Beryaji, M� (2016)� Relationship between per-sonality traits and job performance of Libraria, Shahid Chamran and Jondishapoor Universiites� Science and Technique of Information Management, 1(2), 141 – 157�
Barratt, M�S� & Moyer, V�A� (2004)� Effect of teaching skill program on faculty skills and Confidence� Ambulatory Pediatrics, 4 (1 suppl�), 117 – 120�
Besser, A� & Shackelford, T�K� (2007)� Mediation of the effects of the big five personality dimensions on negative mood and confirmed affective expectations by perceived situ-ational stress: A quasi-field study of vacationers� Personality and Individual Differences, 42(7), 1333 – 1346�
Costa, P�T�Jr�, Terracciano, A�, & McCrae, R�R� (2001)� Gender differences in personality traits across cultures: robust and surprising findings� Journal of Personality and Social Psychology, 81(2), 322 – 331�
Derakhshide, H� & Kazemi, A� (2014)� Effect of job contribution and job engagement on job satisfaction and performance of staffs, using structural equation modeling� Journal of Applied Sociology, 25(55), 89 – 101�
Eliasi, M� (2009)� Assessing personality traits of managers and its relationship with job performance, happiness and motivation� Supervision and Inspection, 3(10), 68 – 88�
Jalali, A� & Rooholahi, A�A� (2015)� Effect of transformative leadership on job performance of faculty members, with intervention of job engagement� Journal of Public Administra-tion Mission, 6(17&18), 1 – 16�
John, O�P�, & Srivastava, S� (1999)� The Big-Five trait taxonomy: History, measurement, and theoretical perspectives� In L�A� Pervin & O�P� John (Eds�), Handbook of personality: Theory and research (Vol� 2, pp� 102 – 138)� New York: Guilford Press�
Kark, R� Shamir, B� & Chen, G� (2003)� The two faces of trans formational leadership: empowerment and dependency� Journal of Applied psychology, 88(2), 255 – 296�
Khonifar, H�, Moghimi, S�M�, Jandaghi, Gh�, Taheri, F� & Sayar, A� (2009)� Knowing characteristics of managers, require for organizational behavior management (study of personality traits at Qom Medical University)� Journal of Health Administration, 37(12), 49 – 56�
MasoodiAsl, I�, Hajinabi, K�, Nosrati nejad, F�, & Soodaii Zanoozegh, H�A� (2012)� Relation between job commitment and performance of staffs at hygiene center� Payesh, 11(5), 595 – 601�
McCrae, R�R� & Costa, P�T� (1987)� Validation of the five-factor model of personality across instruments and observers� Journal of Personality and Social Psychology, 52(1), 81 – 90�
McShane, S�L� & Von-Glinow, M�A� (2003)� Organizational behavior: emerging realities for the workplace revolution� 2nd ed� New York: McGraw-Hill�
Narimani, M�, Khanbabazadeh, M�, & Farzaneh, S� (2007)� Personality traits and job satis-faction of Staffs at Ardebil University� Journal of Ardabil University of Medical Sciences, 7(1), 77 – 83�
Nemanich, L�A�, & Keller, R�T� (2007)� Transformational leadership in an acquisition: A field study of employees� The Leadership Quarterly, 18, 49 – 68�
Peabody, D�, & Goldberg, L�R� (1989)� Some determinants of factor structures from personality trait descriptors� Journal of Personality and Social Psychology, 57, 552 – 567�
Rahimi, M� (2007)� Study the status of contribution in scientific productions and effective factors, among faculty members of Ferdowsi University� MSc thesis, Department of Educational Studies, Ferdowsi University, Mashhad�
Rahmani dotalabadi, J�, Golshani, F�, Emamipoor, S� & Hasani, F� (2016)� Relationship between personality traits and self-efficacy of Jihad faculty members� Journal of Human Sciences Research, 2(2), 95 – 105�
Rakhshani, M� & Shams, A� (2014)� Relationship between faculty members’ education-al-research performance and academic achievement of agricultural students, Zanjan University� Agricultural Education Administration Research, 31, 3 – 17�
Roberts, K�B� & Devries, J�M� (2004)� APA/HRSA National Faculty Development scholars program: community-based teaching track� Ambulatory Pediatrics, 4 (1 suppl�), 92 – 97�
Rothmann, S� & Coetzer, E�P� (2003)� The big five personality dimensions and job perfor-mance� Journal of Industrial Psychology, 29 (1), 68 – 74�
Schmitt, D�P�, Realo, A�, Voracek, M� & Allik, J� (2008)� Why can’t a man be more like a woman? Sex differences in Big Five personality traits across 55 cultures� Journal of Personality and Social Psychology, 94(1), 168 – 182�

82 Mahtab Pouratashi, Asghar Zamani
Weisberg, Y�, DeYoung, C�G�, & Hirsh, J�B� (2011)� Gender differences in personality across the ten aspects of the Big Five� Frontiers in Psychology, 2, 1 – 11� DOI: 10�3389/fpsyg�2011�00178
Witt, L�A� (2002)� The interactive effects of extraversion and Conscientiousness on Perfor-mance� Journal of Management, 23(6), 364 – 372�

Youth and Cancer Prevention (with the Example of Cervical Cancer)
DOI: 10.15804/tner.2017.50.4.07
AbstractThe research results presented in this article originate from the research and educational project conducted from January to June 2017, titled Prevention of cervical carcinoma, or how it is done in Tychy. Analysis of knowledge sources and the views on HPV vaccines, which was funded with a grant by the Polish Cancer League Foundation� The research material allowed for formulating the guidelines for the educational and preventive treatment programs addressed to young people and their parents� Despite free vaccinations against the HPV virus from some local governments, the percentage of people covered by vaccinations is decreasing� What is needed in order to reverse the negative tendencies is a set of new, innovative solutions, addressed at the needs and expectations of the beneficiaries� Therefore, people should be educated on the risk of falling ill, while HPV vaccinations constitute an important element of primary prevention�
Keywords: youth, cancer prevention, cervical cancer
Introduction
Neoplasms are the second most common cause of deaths in Poland, right after cardiovascular diseases (GUS, 2016� Retrieved 15/08/2017, from: http://stat�gov�pl/)� The increase in incidence results, among others, from environmental reasons, but also from lifestyles� In certain neoplasms, preventive treatment proves effec-
Maria Świątkiewicz-Mośny, Katarzyna Kowalczewska-GrabowskaPoland

8584 Youth and Cancer Prevention Maria Świątkiewicz-Mośny, Katarzyna Kowalczewska-Grabowska
and rubella and associated them with autism� Although the article was withdrawn, and its author punished for unethical conducting of research and fraud, many people are still convinced that vaccines are harmful�
What is more, the issues associated with cervical cancer are also considered sen-sitive, because they are associated with intimate and sexual life� Research (Kamzol, at al�, 2012) demonstrates that the knowledge of the incidence of cervical cancer is insufficient among women in Poland�
The article presented discusses the results of an extensive research program financed by the Polish Cancer League Foundation, associated with prevention of cervical cancer� The objective of the research was to present the way of thinking of prevention of cervical cancer, and to analyze the areas of knowledge and igno-rance� The research conducted was of empirical and pedagogical character, which means that, apart from obtaining significant social data on a given community, the project participants had the opportunity to learn by acting and to become familiar with the latest, reliable knowledge of preventive treatment�
Research Methodology
The project methodology was based on the humanist paradigm� The questions asked were associated with the way of thinking of preventive treatments, as well as with the areas of knowledge and ignorance regarding cervical cancer:
• What is the motivation of girls and their parents to undertake preventive activities?
• What are the causes of refusal to take a vaccination? • How are health and disease defined? • What is the knowledge and ignorance regarding prevention of cervical
cancer? • What activities are undertaken by the inhabitants of Tychy in the scope of
HPV vaccinations? • Where do teenage inhabitants of Tychy and their parents get the knowledge
on cervical cancer prevention?The answers to the research questions were obtained on the basis of qualitative
research: focus group interviews and moderated workshops�The research was conducted from February to May 2017 in Tychy, among
female pupils born in 2005 (12-year-olds who qualified for the program of free vaccinations) and their parents, during workshops� The research covered 69 female pupils from 4 Tychy schools and 10 parents (mothers)�
tive� However, preventive treatment requires specific, systematic activities aimed at future results� One of the strategies of prevention of cervical cancer is HPV vaccination� Its effectiveness depends on administration of the vaccine before sexual initiation� This means that very young girls undertake (together with their parents) activities which, in the unspecified future, will protect them from the disease�
In Poland, cervical cancer incidence amounts to ca� 11 people per 100,000 inhabitants (Didkowska, Wojciechowska, Zatoński, 2009), while on Malta, on Cyprus or in Finland – below 5 (WHO, 2013� Retrieved 22/10/2017, from: http://apps�who�int/iris/bitstream/10665/78128/3/9789241505147_eng�pdf?ua=1)� The WHO data shows that: “every year more than 270 000 women die of cervical cancer, more than 85% of these deaths are in low and middle income countries” (WHO, 2013)� The most exposed group is women over 30, mainly aged 45 – 59� The WHO data demonstrates that cervical cancer incidence and mortality are decreas-ing and are going to decrease, as a result of the conducted preventive activities, i�e�, vaccinations and cytological screening� The data from the Polish Cancer Register (KRN) demonstrates that cervical cancer incidence has decreased in Poland by ca� 30% since 1980, and the mortality rate – by ca� 45% (Cervical cancer� Retrieved 15/08/2017, from: http://onkologia�org�pl/nowotwory-szyjki-macicy-kobiet/)�
The most frequent cause of the development of cervical cancer is infection with genital types of the human papillomavirus (HPV) (Kampikaho Turiho at al�, 2014)� There are 2 types of available vaccines against the most oncogenic types of the HPV: bivalent and four-valent (Kessler, 2017, p�176; Farouk, 2017, p�64)� Their cost in Poland is not low (over PLN 1,000 for three full doses), so some self-governments make the decision to finance a vaccination program� One of such cities is Tychy1, where a program of free HPV vaccinations was introduced in 2010� The direct inspiration for the research was the low percentage rate of the girls benefiting from the program – it does not exceed 60% (apart from 2011, where the vaccinations covered 61�08%), while in 2016 – it was a little over 30%2 of those entitled to vaccination�
HPV vaccinations, just like any other vaccinations, generate controversy� The anti-vaccination movements are not as active as in the case of MMR vaccines, but still certain activities aimed at discouragement are noticeable� The anti-vaccination discourse is still based on the famous article by A�J� Wakefield published in “The Lancet” in 1998, which challenged the effectiveness of vaccines against measles
1 Tychy is a city in the south of Poland�2 Data from the Department of Social Issues and Health of the Tychy City Hall, Poland�

8786 Youth and Cancer Prevention Maria Świątkiewicz-Mośny, Katarzyna Kowalczewska-Grabowska
other prevention campaigns� The impact of the media in the modern world is visible in the saying that “if it is not on the Internet, it does not exist”�
The source of knowledge of vaccinations may also be the website of the Out-patient Clinic that executes the program� In this case, it is a pop-up window with a poster with invitation to take a vaccine� However, it does not include any infor-mation to help make the decision, but only formal, organizational information� It is not particularly legible – the font does not seem big enough�
The catchphrase that is supposed to promote vaccinations: “adult decisions pro-tect young lives” and the photograph presenting an adult woman and a teenage girl are not unequivocally addressed to the youth� Both women are dressed in white (which may symbolize health) and are smiling� The older (probably mother) is holding her hand on the younger one (probably daughter)� The image of an adult and a young person is often used in preventive and pharmaceutical campaigns – it is to support the value of experience-based knowledge (symbolized by an adult) or to reinforce emotions by presenting strong relationships between a parent and a child (in this case: mother and daughter)� It may also refer to the future (and probably that was the intention in this case) – today a girl – tomorrow an adult woman� The discrepancies between the left and right sides of the poster may make it less legible� The left side refers to the world of adults – mature people� The invitation on the right side of the poster is addressed to the girls born in 2005�
Another issue which should be highlighted is the fact that the outpatient clinic conducting the program does not provide any information on the vaccinations� The message: free vaccinations against HPV may not be understandable for the persons who do not know that abbreviation and do not associate it with anything� The Outpatient Clinic website could be the place where reliable information on vaccinations is available�
The media, which constitute sources of information on the issues associated with health and diseases, do not become such sources in this case� The local media do not comment on the program of free vaccinations, do not become a platform of knowledge or exchange of experiences associated with cervical cancer prevention�
Health and diseaseHealth is one of the most important values in Poland (CBOS, 2013� Retrieved
29/08/2017, from: http://www�cbos�pl/SPISKOM�POL/2013/K_111_13�PDF)� The way it is defined affects the way it is looked after; e�g�, what activities are undertaken to preserve it� The workshop participants were asked to state their associations with health and disease� The female pupils presented their answers in graphical form, and their parents – in written form�
In order to obtain more information on the way of thinking about cervical cancer prevention in Tychy, there was also conducted a critical analysis of the local media� The text corpus included 9 press articles published in the local media during the program� The keywords used for searching for the articles were: “cervi-cal cancer prevention”, “HPV vaccinations”, “vaccinations against cervical cancer”� The search engines showed that the subject was not particularly interesting for the local media (from the beginning of the program, the Tychy media published only 9 texts about the free vaccinations)� That is why the research was supplemented with an analysis of the promotional materials prepared by Outpatient Clinic No� 4, which executes the vaccination program in Tychy�
Research Results
Sources of knowledge (press analysis)The informative function of the media in the scope of prevention may be
applied in a functional manner� The media may provide space for the provision of information, development of knowledge, and management of ignorance� New media play a special role in the area of health and disease, as exemplified by Dr� Google (Robertson, Polonsky, McQuilken, 2014), who is becoming a general practitioner, always ready to “provide” information, “suggest” treatment, “console” with a story of recovery or “find” a support group�
The analyzed press materials from the local (Tychy) websites was very scarce – 9 articles were published over 7 years of the program� Every article presented a positive attitude towards vaccinations and encouraged the readers to use them� The journal-ists supported their arguments with statements by a professor, specialist in obstetrics, gynecology, gynecologic oncology, a consultant of the Faculty of Gynecology and Obstetrics in the Province Specialist Hospital in Tychy� Both the academic title and the affiliation legitimized the statements and gave the right to define the reality� The professor clearly encouraged people to get vaccinated, but also referred to systematic cytology� In his opinion, that was the main reason why the cervical cancer incidence and mortality are lower in such countries as the USA or Malta�
The analyzed articles demonstrate statistics from which it follows that in Tychy, the issue of cervical cancer incidence and mortality is not as serious as, e�g�, in the nearby city of Chorzów� That statement is to reinforce the message of encourage-ment regarding vaccinations�
However, the key issue is the number of articles� The Tychy media do not enter the prevention campaign – and neither do they enter (or only enter sporadically)
8988 Youth and Cancer Prevention Maria Świątkiewicz-Mośny, Katarzyna Kowalczewska-Grabowska
evidence-based medical knowledge, as well as experience-based knowledge� Per-sonal experience provides strong motivation, including undertaking pro-health activities�
The mothers answered that the only demotivating factors were laziness and a lack of willpower� Both properties are assessed in a negative manner and the respondents were ashamed to indicate they made looking after health more dif-ficult� What is surprising is that the disincentives listed were closely associated with personal traits, more internal than external factors, which are not subject to direct control, such as a lack of time, hard work, or financial trouble� This also demonstrates assumption of responsibility for one’s health� Even if the preventive activities are not fully undertaken, there is the conviction that they should be undertaken and that one is responsible for one’s health�
Knowledge – ignoranceKnowledge allows for managing risk and uncertainty and undertaking activities
aimed at minimizing uncertainty and risk (Gross, McGoey, 2015)� The pupils were asked to identify the most important risk factors of cervical cancer� They mainly indicated early sexual initiation and high sexual activity together with changing partners� This indicates the existing strong association between the uterus and sex life� Uterus is perceived as a sexual organ which, in turn, causes a certain degree of embarrassment and lack of openness in talking about that topic� The problem is becoming sensitive and a lot of gentleness and proper, intimate atmosphere need to be provided in order to address it� This generates areas of ignorance and establishes common knowledge which is not always consistent with the current medical knowledge�
The respondents disregarded such factors as the fifth and sixth decade of life and numerous pregnancies, but these factors are indicated in the literature as important risk factors for cervical cancer (Kulesza-Brończyk, Gąsiewska 2010, p�73)� The participation in the workshops allowed the teenagers to gain knowledge in that area�
Then, an attempt was made to test the current knowledge of the female pupils regarding prevention of cervical cancer� They were asked to mark the most impor-tant preventive activities�
The female pupils knew of primary preventive treatment and indicated one of the forms of secondary preventive treatment, i�e�, a test for the presence of the oncogenic HPV� Cytological tests were not included as elements of preventive treatment against cervical treatment in the answers of the female pupils� It is an important piece of information which demonstrates that cytological tests are
The female pupils perceive health in holistic categories, taking into account the fundamental types of health, i�e�, physical, mental and social health� The pupils questioned found it easiest to refer to physical health, and hardest – to the social aspects of health� Health was presented by such positive symbols as an apple (fruit, healthy food) or bicycle (healthy lifestyle) and such negative symbols as crossed-out cigarettes and bottles of alcohol� Disease was defined by the female pupils as a sad condition associated with difficult emotions, as well as with its attributes, i�e�, a syringe, a physician, an ambulance, etc�
The studied parents (mothers) also approach health from a holistic point of view� In their statements, they mentioned its value: “health is the most important and fundamental thing in life, and we realize that when we start being ill, seriously ill, when it turns out that health is of utmost importance… while work, money, everything else recedes into the background”. Such an understanding is associated with treatment of health as an autotelic value (value in itself), not as an instrumen-tal value (health as the tool for achieving other objectives)�
Disease, understood as a pathological condition, appeared in the answers less frequently� It was understood as lack of health, but also as a situation that forces certain activities� It is a disease, a potential disease, or a disease of a family member, which provides motivation for undertaking preventive activities� Similarly, a case of disease results in the willingness to obtain knowledge in that scope� Health is to a smaller degree conducive to undertaking preventive activities and searching for information on a healthy lifestyle�
Motivation – demotivationThe research conducted by CBOS (2013) shows that the Polish demonstrate
they are responsible for their own health� 74% of the respondents believed that everyone was responsible for their own health, and 20% – that the authorities were responsible� The responsibility for one’s own health is particularly visible in demonstrating healthy behaviours associated with nutrition and lifestyle�
When describing their motivation for looking after their own health, the parents questioned highlighted two aspects: individual and social� The indi-vidual aspect was associated with the need to look after one’s health in order to execute one’s own plans, to achieve good psycho-physical fitness, to meet requirements, etc� The social aspect was mainly associated with family members and the respondents stated that care for them was conducive to undertaking pro-health activities� Attention was paid to motivation, resulting from diseases of family members, to undertake preventive treatment� Apart from many difficult emotions, a case of disease in family also results in more knowledge, including

9190 Youth and Cancer Prevention Maria Świątkiewicz-Mośny, Katarzyna Kowalczewska-Grabowska
The mothers participating in the workshops found it much easier to verbalize the reasons for making the decision on vaccination of their children� In particular, they mentioned the health aspects, but also the financial side (free vaccinations)� The concerns associated with vaccination included, in particular, adverse effects� They listed the following reasons for not having their children vaccinated: laziness, “I wasn’t vaccinated, so neither will my child”, “people don’t like being instructed”, “because an HPV vaccine is not obligatory – if it was, then more people would get vaccinated”.
However, the key issue seems to be a lack of knowledge of vaccinations (that such a vaccine exists at all) or of the program (that Tychy has a program of free HPV vaccinations)� On multiple occasions, concerns were raised whether working people were able to manage the vaccination program (“people live in a hurry and don’t have the power to handle and remember about vaccinations, especially when you have several doses”). Some mothers didn’t know that Tychy had a program of free vaccinations, others knew but did not have the information on when or where one should go�
When the mothers were asked what could convince other mothers to make the decision on having their children vaccinated, they listed: “obtaining knowledge, talking to your child, the need to look after your child’s health, future and health are more important than temporary discomfort, the message: if you want to protect your child from cancer – the message would be disturbing, but also very important”. Information campaigns were suggested, which would both provide reliable med-ical knowledge of the vaccinations and precise and legible information on the program (how, when and where to have your daughter vaccinated)�
One of the identified difficulties of the program is the problem associated with the school system� At the beginning of the program, it was addressed to the girls attending the 6th grade of primary education� School could be an effective commu-nication channel and space for dissemination of information� The school system reform caused 6-year-old children to attend school, and so now 12-year-old girls may be in different grades (6th of primary school or 1st of junior secondary school)�
The qualitative analysis of the statements given by the female pupils allowed for getting to know their knowledge and opinions on health/disease as well as cervical cancer prevention� It also allowed for an understanding of individual motivations for demonstrating pro-health behaviors�
not only not commonly taken by women in Poland3, but also do not constitute a subject that is widely recognizable� The participation in the workshops allowed the teenagers to gain knowledge in that area�
Social campaign – persuasionOne of the tasks during the workshops was to prepare a social campaign in
the scope of cervical cancer prevention� The objective was to get to know the arguments which might induce the girls and their parents to take vaccinations� The task for the female pupils was to prepare advertising posters connected with the above-mentioned subjects, addressed both to parents and their teenage peers�
All the educational posters prepared by the pupils concerned the future� Their contents do not include intimidation with a disease, but only a worry, a caution� At the same time, there was provided the very specific answer to what should be done to avoid the disease in the future (clear suggestion), e�g�: run to the outpatient clinic, get vaccinated�
The prepared posters demonstrated what should be done to prevent the disease, in a very direct manner (Fight for your daughter’s health; Parents, get your children vaccinated). Some of the messages were very emotional and personal, e�g�: Save me! The messages to peers included the issue of health that gives satisfaction, constitutes a positive value, but which should be looked after� In this case, it is not particularly difficult to look after your health, because it “doesn’t hurt”, “it’s quick and cancer’s done”.
As for the above-mentioned message from Outpatient Clinic No� 4 regarding the prevention program – none of the messages included the elements which appeared in the actual Clinic poster� The pupils did not refer to experience-based knowledge (or any other knowledge), or to the authority of a mother (as a mature woman)� The arguments in the posters are very straightforward, simple, pointing at specific activities and personalized (directed to particular persons)�
Vaccinations – pros and consThe issue of making the decision on having your child vaccinated was also
discussed during the workshops with parents, who were asked about incentives or disincentives for issuing consent for having their child vaccinated against HPV�
3 The data published on 2 July 2017 by the Polish Health Fund demonstrates that only 19% of the entitled women have used the free cytology program� Retrieved 02/07/2017, from: http://nfz�gov�pl/dla-pacjenta/programy-profilaktyczne/dane-o-realizacji-programow/ �
9392 Youth and Cancer Prevention Maria Świątkiewicz-Mośny, Katarzyna Kowalczewska-Grabowska
Discussion/conclusions
It follows from the interviews with the parents of the female pupils born in 2005 that the motivation to undertake preventive treatment, including making the decision on vaccination, mainly results from personal convictions and experi-ences� The parents mainly mentioned the care for their family and the possibility to execute their life plans� All the mothers participating in the project supported the activity of free HPV vaccinations� The disincentives listed were laziness and a lack of willpower� Within the context of free vaccinations, it may be assumed that it is laziness that plays the key role in making the decision on having one’s child vaccinated� The need to appear at an outpatient clinic with the child three times to get the respective doses, may prove a backbreaking task for many parents, not because of time limitations (the dates and times are adjusted to the parents and children), but mainly because of a lack of the willpower or consistence in following through with a decision made� The female students who prepared the advertising posters at the workshops associated with cervical cancer prevention, took into account the need to take vaccinations� The contents of the posters were very emotional (included such statements as: “Save me”) with a simple instruction of what should be done (e�g�, ”run to the outpatient clinic”)� At the same time, they emphasized the value of health�
AcknowledgementsThe authors of the article would like to thank the Polish Cancer League Foundation for financing the research and educational project within the grant�
ReferencesCBOS (2013)� Wartości i Normy� Komunikat z badań (Values and standards� Survey
report)� BS/111/2013� Retrieved 29/08/2017, from: http://www�cbos�pl/SPISKOM�POL/2013/K_111_13�PDF�
Cervical cancer� Retrieved 15/08/2017, from: http://onkologia�org�pl/nowotwory-szy-jki-macicy-kobiet/)
Data on the implementation of programs� Retrieved 02/07/2017, from: http://nfz�gov�pl/dla-pacjenta/programy-profilaktyczne/dane-o-realizacji-programow/�
Didkowska, J�, Wojciechowska, U�, Zatoński, W�, (2009)� Prognozy zachorowalności i umieralności na nowotwory złośliwe w Polsce do 2025 roku (Predictions of cancer incidence and mortality in Poland up to 2025), Centrum Onkologii – Instytut im� Marii
Skłodowskiej – Curie� Retrieved 16/08/2017, from: http://onkologia�org�pl/wp-content/uploads/Prognozy_2025�pdf�
Farouk, M� (2017)� Vaccines for Prevention of Cervical Cancer. Pakistan Journal of Medical Research, 56(2), p�64�
Gross, M�, McGoey, L� (2015)� Routledge international handbook of ignorance studies, Routledge, NewYOurk-London�
GUS (Central Statistical Office 2016)� Retrieved 15/08/2017, from: http://stat�gov�pl/� Kampikaho Turiho, A�, Okello, E�S�, Muhwezi W�M�, Harvey, S�, Byakika-Kibwika, P�, Meya,
D�, Katahoire A�R� (2014)� Effect of School-based Human Papillomavirus (HPV) Vacci-nation on Adolescent Girls’ Knowledge and Acceptability of the HPV Vaccine in Ibanda District in Uganda� African Journal of Reproductive Health, 18(4), 45 – 53�
Kamzol, W�, Jaglarz K�, Tomaszewski, K� Puskulluoglu, M�, Krzemieniecki, K� (2012)� Assessment of knowledge about cervical cancer and its prevention among female stu-dents aged 17 – 26 years� European Journal of Obstetrics & Gynaecology and Reproductive Biology, 166 (2), 196 – 203�
Kessler, T�A� (2017)� Cervical cancer: prevention and early detection� Seminars in Oncology Nursing, 33(2), 172 – 183�
Kulesza-Brończyk, B�, Gąsiewska, H�, (2010)� Profilaktyka chorób nowotworowych narządu rodnego (Preventive treatment in neoplastic diseases of reproductive organs) In: Promocja zdrowia (Health Promotion)� Tom II Promocja zdrowia w praktyce pielęg-niarki i położnej� Ed� A� Andruszkiewicz, M� Banaszkiewicz� PZWL Warszawa, p� 73�
Macdonald, L�, Deeks, S�, Doyle, C� (2010)� A Public Health Perspective on HPV Vaccina-tion: Response to The HPV Vaccination Campaign: A Project of Moral Regulation in an Era of Biopolitics� The Canadian Journal of Sociology, 35(4), 627 – 631�
Robertson, N�, Polonsky M�, McQuilken, L� (2014)� Are my symptoms serious Dr Google? A resource-based typology of value co-destruction in online self-diagnosis� Australasian Marketing Journal (AMJ), 22(3): 246�
WHO guidance note: comprehensive cervical cancer prevention and control: a healthier future for girls and women (2013)� Retrieved 22/10/2017, from: http://apps�who�int/iris/bitstream/10665/78128/3/9789241505147_eng�pdf?ua=1�

95Family as One of the Key Determinants of Media Education
Family as One of the Key Determinants of Media Education of Young School-age Children
DOI: 10.15804/tner.2017.50.4.08
Abstract The attitude of parents influences formation of children’s attitude to life� It is even more noticeable when speaking about media� The proposed contribution shows partial results of research carried out as a part of VEGA project No� 1/0913/15: Media literacy of young school-age children in the context of family and school cooperation� The character of the empirical research was diagnostic and quantitative-qualitative� The aim of the research was to examine media education performed in formal and non-formal ways among young school-aged children in Slovakia� 28 schools from all over Slovakia were examined in the presented research� The contribution focuses mainly on findings from questionnaires given to parents and other focus groups, i�e� pupils�
Keywords: media education, family, young school-age children, parents, pupil, Slovakia
Introduction
Today there is an easy access of pupils to complex media� Pupils can quickly and easily connect to the Internet from any kind of device� They know what is currently on TV or which computer games are most up-to-date� Habits of young school-aged children and their use of these devices are generally considered a problem� In this respect, parents play an important role and can significantly contribute in order to guide their children to use media and their content in a responsible way�
Stanislaw JuszczykPolandMária Karasová, Alojz Kostelanský, Zuzana Chanasová, Miriam Uhrinová, Mária VargováSlovakia
Research FocusFamily is one of the most important factors that influences children’s habits
and their use of media as well as their search for content� For this reason, in this contribution we want to focus on media education� The attitude children acquire to media is greatly affected by the attitude of their parents�
For us, to be able to learn to live meaningfully in the cyberculture it is as impor-tant as civilization itself, which is inevitable for every person as an individual� Multiple expansion of the human mind by means of chips and networks in the first decade of the 21st century gave the power to billions� However, the early years of multimedia production and global information networks made technological enthusiasts unable to cope with such media consumption because, in the mean-time, they did not learn how to control the use of media� Obviously, this all affects our communication� Also, it is connected with the fact that meaningful use of the Internet and social media is not automatic� (Rheingold, 2012)� Particularly in the case of children, it is important to teach them a wise and responsible approach to media use and its content from the very first experience� “Theory and practice of media education, its paradigmatic background and approaches to its research face an inevitable challenge in order to make critical media theories accessible to masses of people in a sufficiently attractive form, which would clearly indicate benefits and strengths resulting from critical thinking in relation to media and its meaningful use” (Vrabec, 2013, p� 20)� In Slovakia, there is not a sufficient amount of research focused on preschool-age children and young school-age children� For this reason, we decided to aim our research at young school-age children� We see the importance of media education of not only the children; we see a great need for the improvement of media education in schools, and, in the first place, in families�
Research Methodology
General Background of ResearchOur empirical research was of diagnostic and quantitative-qualitative character�
The subject of the research was formal and non-formal media education in Slo-vakia at primary schools and the level of media literacy of primary school pupils and school (teachers) – family cooperation in media education and formation of healthy habits of young school-age children� In this contribution, we want to focus on presenting results of research on family-media education in the context of children’s habits� Among the cognitive goals of the research, we tried to find out

9796 Family as One of the Key Determinants of Media EducationStanisław Juszczyk, Mária Krasová et al.
the extent and possibilities of parents in setting limits on media use for children� We posed the following research questions:
• What do parents do in order to control their children’s use of media and what rules do they apply?
• Are parents interested in educational portals for media education, which would help them to educate their children in this area?
Research Sample 28 elementary schools were selected to participate in this research� They were
divided into the following categories according to the towns and villages they were situated in: 9 schools in villages with the population up to 1,999 inhabitants; 4 schools in small towns from 2,000 to 19,999 inhabitants; 7 schools in middle-sized towns from 20,000 to 199,999 inhabitants and 8 schools in cities with the popu-lation over 100,000 inhabitants� Among the selected schools there were: 9 church schools, 2 private schools and 17 public schools�
The research population included 151 teachers of primary education (5 male and 146 female respondents) and 27 head teachers or their representatives� We conducted 48 focus interviews with 10 third grade pupils in a target group (480 pupils)� There were 498 parents (92 male and 406 female respondents) who par-ticipated in our research�
Instrument and ProceduresThe method of diagnostic research was used as a fundamental method in the
empirical research� We used a questionnaire for the teachers and parents and classified discussions (i�e�, in which questionnaires contained the same questions in a specific, unchanged order to be given to the same respondents from the same professional or social group) with the head eachers or their representatives� The focus discussion was used to interview the pupils, where the members of the VEGA research team were the presenters (they are pedagogues, and therefore they are highly qualified for working with children), which influenced the qualitative aspect of our research�
Data AnalysisMathematical and statistical operations of absolute and relative frequency were
used to process and analyze results� For the sake of data transparency and clarity, we present data processing in tables� We used the Pearson Chi-square test of good agreement to determine the statistical significance of selected variables and to express correlations�
Research Results
Young school-age children have an easy access to media (TV, tablet, mobile phone and the Internet)� One of the goals of our research was to find out the way parents control their children when using media and what rules they apply� Table 1 shows the results of the research on parents observing the rules�
Table 1. Parents’ control of observing the rules by children
No. of respondents who expressed their opinion Sex
TotalMale Female
yes 59 213 272Total 92 406 498
CHI-SQUARE TESTS
Value df Asymp. Sig. (2-sided)
Exact Sig. (2-sided)
Exact Sig. (1-sided)
Pearson’s Chi-Square 4�119a 1 �042Continuity Correctionb 3�662 1 �056Likelihood Ratio 4�179 1 �041Fisher’s Exact Test �049 �027Linear-by-Linear Association 4�111 1 �043N of Valid Cases 498a� 0 cells (0�0%) have expected count less than 5� The minimum expected count is 41�75�b� Computed only for a 2x2 table
When speaking about observing the rules by children and their use of TV, Internet, and tablet, we found out a significant difference of the control due to the parent’s sex� We found that the female respondents (mothers) tend to control their children more than the fathers and also control whether the children observe rules when watching TV or using the computer (Table 1)�
Based on the results obtained from the statistical χ2-test, we can confirm the alternative hypothesis on the independence of the investigated characters at the level of significance α = 0�05 (the calculated p-value of 0�042 is less than the selected level of significance)� Due to the fact that the parents control their children’s television watching, statistically there is a significant difference between the male and female respondents� The value of the Pearson Chi-square test is the same and the obtained significance is p =�042
χ2 = 4�119; p<0�05 (p=0�042)

9998 Family as One of the Key Determinants of Media EducationStanisław Juszczyk, Mária Krasová et al.
Table 2 presents the parents’ responses in regard to the established rules for watching TV�
Table 2. Established rules from the parents’ point of view
Parents’ responses to statements Sex Total (N=498)
Male (N=92)
Female (N=406)
Absolute frequency
Relative frequency
We watch family and children TV programs together
62 256 318 63.9
We watch TV series/films for adults together, with particular explanation if necessary
15 112 127 25�5
We watch TV series/films for adults together, I do not consider it necessary to explain anything
1 6 7 1�4
The child is not allowed to watch TV until the homework is finished
30 152 182 36�5
The child is not allowed to watch TV after 10 p�m�, I have a parental control lock
33 166 199 40�0
I often control what the child is viewing 31 178 209 42�0I do not control my child since he/she is educat-ed and knows which programs he/she can watch and how long
17 28 45 9�0
The child is allowed to watch anything and at any time
2 4 6 1�2
As shown in Table, the statement that parents watch family and children TV programs together with their children achieved the highest percentage (63�9%)� 42% of the parents often control what their child is viewing� 40% of the parents responded that their child is not allowed to watch TV after 10 p�m�, which is secured by a parental control lock� Nearly a quarter of the parents stated that they watch TV series/films for adults together, and, if necessary, they provide an explanation (25�5%)� Of all the parents, 9% does not control their child because he/she is educated and knows which TV programs he/she can watch and how long� The smallest number of the parents responded that their child has an unlimited parental permission to watch anything and at any time, which we consider very positive� What is also positive is the statement stating that the parents and children watch TV series/films for adults together, however, the parents do not consider it necessary to explain anything to their child�
We observed a correlation in relation to the parents’ sex in the statement: ‘we watch TV series/films for adults together, with particular explanation if necessary’�
The correlation was confirmed� There is a significant difference in watching and explaining TV series for adults to children� Based on the results obtained from the statistical χ2-test, we can confirm the alternative hypothesis on the independence of the investigated characters at the level of significance α = 0�05 (the calculated p-value of 0�025 is less than the selected level of significance)�
In regard to explaining TV programs for adults to children, statistically there is a significant difference between the male and female respondents� The value of the Pearson Chi-square test is the same and the obtained significance is p =0�025
χ2 = 5�025; p<0�05 (p=0�025)
Table 3 presents a correlation in relation to the parents’ sex� The research shows that there are more females, mothers, who watch films together with their children and, at the same time, they provide them with a particular explanation, if neces-sary, more often than the fathers�
Table 3. Parents watching TV with children and their willingness to provide explana-tions to the child, if necessary
SexTotal
Male FemaleYes 15 112 127Total 92 406 498
CHI-SQUARE TESTS
Value df Asymp. Sig. (2-sided)
Exact Sig. (2-sided)
Exact Sig. (1-sided)
Pearson’s Chi-Square 5�025a 1 �025Continuity Correctionb 4�449 1 �035Likelihood Ratio 5�421 1 �020Fisher’s Exact Test �025 �015Linear-by-Linear Association 5�015 1 �025N of Valid Cases 498a� 0 cells (0�0%) have expected count less than 5� The minimum expected count is 23�46�b� Computed only for a 2x2 table
We also investigated the parents’ reasons for their lack of control over their children’s viewing� From their point of view, it is because their children are well informed and educated as to which programs they are or are not allowed to watch� The correlation in relation to the parents’ sex was confirmed again� There is a significant difference in the mothers’ and fathers’ responses and their reasons
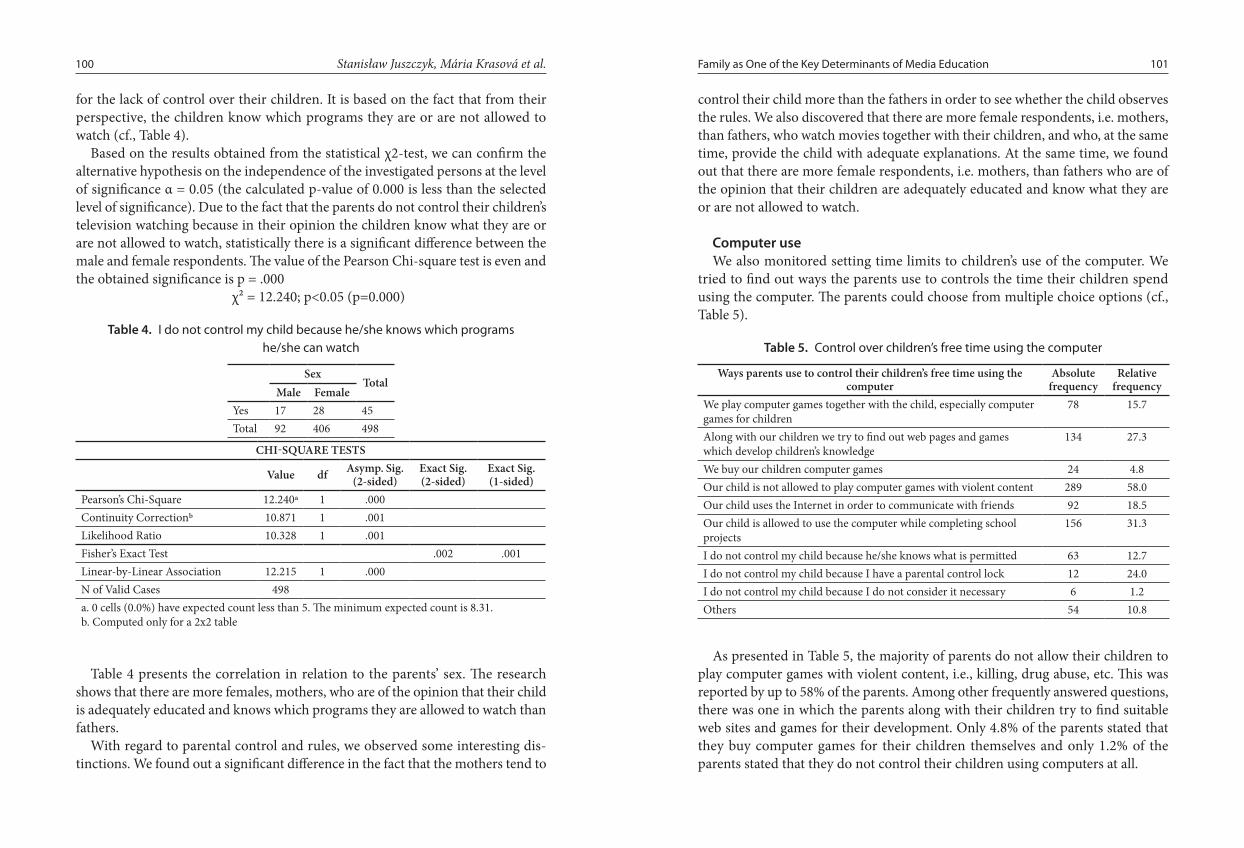
101100 Family as One of the Key Determinants of Media EducationStanisław Juszczyk, Mária Krasová et al.
for the lack of control over their children� It is based on the fact that from their perspective, the children know which programs they are or are not allowed to watch (cf�, Table 4)�
Based on the results obtained from the statistical χ2-test, we can confirm the alternative hypothesis on the independence of the investigated persons at the level of significance α = 0�05 (the calculated p-value of 0�000 is less than the selected level of significance)� Due to the fact that the parents do not control their children’s television watching because in their opinion the children know what they are or are not allowed to watch, statistically there is a significant difference between the male and female respondents� The value of the Pearson Chi-square test is even and the obtained significance is p = �000
χ2 = 12�240; p<0�05 (p=0�000)
Table 4. I do not control my child because he/she knows which programs he/she can watch
SexTotal
Male FemaleYes 17 28 45Total 92 406 498
CHI-SQUARE TESTS
Value df Asymp. Sig. (2-sided)
Exact Sig. (2-sided)
Exact Sig. (1-sided)
Pearson’s Chi-Square 12�240a 1 �000Continuity Correctionb 10�871 1 �001Likelihood Ratio 10�328 1 �001Fisher’s Exact Test �002 �001Linear-by-Linear Association 12�215 1 �000N of Valid Cases 498a� 0 cells (0�0%) have expected count less than 5� The minimum expected count is 8�31�b� Computed only for a 2x2 table
Table 4 presents the correlation in relation to the parents’ sex� The research shows that there are more females, mothers, who are of the opinion that their child is adequately educated and knows which programs they are allowed to watch than fathers�
With regard to parental control and rules, we observed some interesting dis-tinctions� We found out a significant difference in the fact that the mothers tend to
control their child more than the fathers in order to see whether the child observes the rules� We also discovered that there are more female respondents, i�e� mothers, than fathers, who watch movies together with their children, and who, at the same time, provide the child with adequate explanations� At the same time, we found out that there are more female respondents, i�e� mothers, than fathers who are of the opinion that their children are adequately educated and know what they are or are not allowed to watch�
Computer useWe also monitored setting time limits to children’s use of the computer� We
tried to find out ways the parents use to controls the time their children spend using the computer� The parents could choose from multiple choice options (cf�, Table 5)�
Table 5. Control over children’s free time using the computer
Ways parents use to control their children’s free time using the computer
Absolute frequency
Relative frequency
We play computer games together with the child, especially computer games for children
78 15�7
Along with our children we try to find out web pages and games which develop children’s knowledge
134 27�3
We buy our children computer games 24 4�8Our child is not allowed to play computer games with violent content 289 58�0Our child uses the Internet in order to communicate with friends 92 18�5Our child is allowed to use the computer while completing school projects
156 31�3
I do not control my child because he/she knows what is permitted 63 12�7I do not control my child because I have a parental control lock 12 24�0I do not control my child because I do not consider it necessary 6 1�2Others 54 10�8
As presented in Table 5, the majority of parents do not allow their children to play computer games with violent content, i�e�, killing, drug abuse, etc� This was reported by up to 58% of the parents� Among other frequently answered questions, there was one in which the parents along with their children try to find suitable web sites and games for their development� Only 4�8% of the parents stated that they buy computer games for their children themselves and only 1�2% of the parents stated that they do not control their children using computers at all�

103102 Family as One of the Key Determinants of Media EducationStanisław Juszczyk, Mária Krasová et al.
Based on focus groups analysis from the pupils’ point of view, in connection with the stated limits to media we obtained the following results:
• Among the fundamental rules concerning watching TV, the children first had to tidy up the mess, do their homework and after that they were allowed to watch TV� Likewise, they were not allowed to watch TV if they got a bad mark at school or did not listen to the parents�
• The time limit to the children’s use of computers and screens was one of the most common rules applied by the parents� The children were allowed to use computers and screen from 0�5 to 1 hour a day maximum, or when they finished their homework�
• The parents whose children attend church schools were more likely to establish rules� Some children have rules established in relation with con-tent, not time� Some rules were related only to weekdays�
• Some parents applied so-called “occasional rule”� This means that parents state time limits with regard to the situation, or, when they find it conven-ient� When they assume their child used the computer for too long, the child is told to turn it off�
• There are only a few pupils whose parents set up parental control� • The parents stated, predominantly in public schools, that they do not
control their children or establish any rules� Some pupils even said their parents lie� This means that the parents ban their children from playing some game, however, the children still continue (e�g�, tanks game online, unsuitable games, etc�)
• With regard to setting time limits for computers and screen, there was an interesting group of pupils� Almost 5% of them stated they did not need to use the internet� Formerly, they were from private schools, church schools, or pupils from villages who spend their time outdoors, or, do not have access to the Internet�
Moreover, we tried to find out whether the parents were interested in media content related to computer games� Their attitudes to particular types of computer games, suitability or unsuitability for the children are presented in Table 6� The reason for our interest in the parents’ attitudes was that if parents consider some unsuitable games as acceptable, it can cause contradiction in their children’s edu-cation concerning their attitudes towards the teacher� Also, it can be difficult for the children to distinguish between what is suitable and unsuitable� According to our opinion and based on our experiences, parents’ habits and attitudes are related to their children’s adopted habits and attitudes� Therefore, we see great importance in and need for media education for parents�
Table 6. Parents’ attitudes to suitability or unsuitability of computer games for children
Absolute frequency
Relative fre-quency
Absolute frequency
Relative frequency
Absolute frequency
Relative frequency
Not consid-ered suitable
Not consid-ered suitable
Considered suitable
Considered suitable
I don’t know
I don’t know
Action games 433 86.9 20 4.0 43 8.6Adventures 205 41.2 149 29�9 142 28�5Strategic games
123 24�7 236 47.3 138 27�7
Role playing games (RPG)
275 55.2 54 10�9 166 33�3
Simulations 164 32�9 180 36.1 150 30�1Educational games
25 5�0 437 87.8 36 7�2
Games for girls 145 29�1 254 51.0 92 18�5Others 18 3�6 25 5�0 36 7�2
As shown in Table 6, the parents have different attitudes to each type of com-puter games� They consider action games, adventure games and role playing games as unsuitable� On the contrary, the parents consider strategic games, simulations, educational games and games for girls as suitable� In the case of action games, there is a significant number of responses stating that action games are not consid-ered as suitable for children� A striking number of parents stated that educational games are most suitable� For some types of computer games, it is evident that despite the given examples the parents do not comprehend the type of game as described in terms of categorization and characteristics�
There is an interesting finding concerning a relatively small difference between suitability and unsuitability of simulations from the parents’ point of view� It is evident that the parents are of a different opinion on a particular type of com-puter game, and, thus, on a given game as such� This was expressed in the parents’ understanding of some types of games and in regard of the parent’s sex (e�g�, the right understanding of games such as arcades, games for girls, etc�)� Unfortunately, we are unable to deal with this issue in detail in our contribution�
In line with these findings, we were interested in whether the parents feel the need for available educational portals that would provide them with valuable advice and information in the field of media education, which would help them to educate their children in this area� The results are presented in Table 7�

105104 Family as One of the Key Determinants of Media EducationStanisław Juszczyk, Mária Krasová et al.
Table 7. Parents’ need for available educational portals for media education
Not expressed No Yes I don’t
know Total
SexMale 0 14 47 30 91Female 5 28 227 147 407
Total 5 42 274 177 498
CHI-SQUARE TESTSValue df Asymp. Sig. (2-sided)
Pearson’s Chi-Square 6�752a 2 �034Likelihood Ratio 5�860 2 �053Linear-by-Linear Association �436 1 �509N of Valid Cases 493a� 0 cells (0�0%) have expected count less than 5� The minimum expected count is 7�75�
As shown in Table 7, up to 55% of the parents expressed their need for creating an Internet website providing some advice and tips on how to use media effec-tively� When comparing the parents’ answers to this question based on sex, we found a significant difference in the parents’ opinions on the need for educational portals for media education� Based on the results obtained from the statistical χ2-test, we can confirm the alternative hypothesis on the independence of the investigated characters at the level of significance α = 0�05 (the calculated p-value of 0�034 is less than the selected level of significance)� With regard to the parents’ need for education portals, statistically there is a significant difference between the males and females�
The value of the Pearson Chi-square test is χ2 = 6�752 and the obtained signif-icance is p =�034
χ2 = 6�752 ; p<0�05 (p=0�034)
As shown in Table 7, we observed a correlation in relation to the parents’ sex� The research suggests that there is a significant difference in responses� There were more female than male respondents expressing their need for educational portals for media education�
Discussion
We found a significant difference in approach based on the parents’ sex con-cerning whether to control the child due to the fact that the parents consider their children capable of discerning what programs they are or are not allowed to watch� The research shows that there are more females (mothers) than males who think that their child is adequately educated and knows what programs are or are not permitted�
We found out that the female respondents (mothers) tend to control their chil-dren more than the male respondents (fathers) whether they observe rules� Based on our research, there are more females than males who control observing rules�
Much research refers to a strong relation between children’s and parents’ attitudes to watching TV (Jago, Stamatakis, Gama, Marques, Noqueira, Mourao, Padez, 2012; Jago, SebireJ, Edwards, Thompson, 2013)� Our research presents the same observation, as parents’ attitudes and habits significantly influence their children’s attitudes and habits�
Parents’ evaluation of the suitability and game selection of their children var-ies� They have a different attitude to each type of computer games� Statistically, there are also significant differences between the fathers’ and mothers’ approach in determining which game is suitable for their children� The parents consider action games, adventures and role playing games as unsuitable� On the contrary, strategic games, simulations, educational games and games for girls are considered as suitable�
The parents are inevitable media socializers� There is great importance of parental intervention in the case of little children who have just been introduced to media� In some families, media hold the primary position� Direct and emo-tional contact is very rare, which is being replaced by virtual relationships, such as phone calls, text messages, e-mails, and watching TV� It is necessary to talk to children about what they saw and heard in order to help them to evaluate and comprehend the importance of moral teaching and the character of the content presented in different types of media (Petani, Brcic, 2014)� Also, it is important to realize that forms of media, including symbols that we converse with, do not convey specific and definite statement about the world� These forms of media are “rather metaphors, which inconspicuously and modestly, but effectively impose their definitions of reality� Whether we perceive the world through speech, print, or television camera, our media-metaphors pre-classify it, categorize, delimit, expand, reduce, and probe” (Postman, 2010)� In a special way young school-age

107106 Family as One of the Key Determinants of Media EducationStanisław Juszczyk, Mária Krasová et al.
children may consider virtual reality more realistic than the real world� Therefore, parents should be aware of such risks�
For parents to be helpful to their children, it is necessary to constantly develop their competences in the field of media education� In this context, the parents showed their interest in developing self-learning competences from educational portal� More than a half of the parents expressed their need for creating an Inter-net website providing some advice and tips on how to use media effectively� The research results show that the female respondents more often than the male ones expressed the need for creating an educational portal�
Like adults, also children are more and more exposed to short, impulse infor-mation in the form of advertising, commands, theories, and segment messages which relatively easily fit into our mental files� It helps the recipients to receive a countless number of information in a short time� However, it is more difficult to put information into a comprehensive form� This causes an increase in the amount of information (Toffler, 1981), which causes problems particularly when speaking about children� Also for this reason, it is necessary to respond to changes introduced to us by the informational society and to teach children a responsible approach to media in order to be enriched, grow, and learn to critically evaluate all the content they encounter on a daily basis�
Access to media enables children to create opportunities for education in early childhood, expand the world of children; it allows them to explore and stimu-late their thinking (Juszczyk, 2004)� Parents are role models for their children with regard to all areas of their development� Sometimes parents themselves are distracted by media and they do no pay enough attention to their children, as a result of which children lack opportunities for their emotional development (Jago, Thompson, Sebire, 2014)�
Conclusions
Our research shows a need for education in the field of media education for not only pupils, i�e� young school-aged children, but also their parents, who expressed the interest� Nearly a half of the parents prefer gaining competences in a given area through self-study, i�e�, a website� During research implementation, we found that the parents were not interested in training or professional lectures due to a lack of time� However, we see the need for school and family co-operation, which can bring a significant change by mutual interaction in order to improve the quality of media education� Parents cannot rely on teachers – school, as well as school
cannot substitute the irreplacable position of parents� Our research shows that the mothers are more interested in the responsible use of media than the fathers, therefore, it is necessary to focus impulses as well as content of websites for parents in an attractive and adequate manner, especially for males – fathers, which would encourage them to consider changing their attitudes�
It is necessary to provide media education for young school-aged children with regard to the media education of their parents� Parents should be aware of the negative aspects of media and see the need for the regulation of their children’s use of media, as well as reasonable time limitations to virtual activities� Young school-aged children need balanced activities, such as physical and sports activities, but also activities which develop their competences through skills, experiences, or by shaping a positive attitude to reading books, which is not preferred among children in comparison with audiovisual information they receive on television and the Internet� So much of such information deprives children of creativity, as well as imagination development and fantasy�
The proposed contribution shows the partial results of the research carried out as part of VEGA project No� 1/0913/15: Media literacy of young school-age children in the context of family and school cooperation�
References:Jago R, Sebire SJ, Edwards MJ, Thompson J�L� (2013)� Parental TV viewing, parental
self-efficacy, media equipment and TV viewing among preschool children� European Journal of Pediatrics� 2013, p� 172�
Jago R, Stamatakis E, Gama A, Marques V, Noqueira H, Mourao I, Padez C� (2012)� Paren-tal and child screen-viewing time and home media environment� American Journal of Preventive Medicine� 2012, 43 (2) pp� 150 – 158�
Jago R, Thompson J�L�, Sebire S�J� (2014) Cross-sectional associations between the screen-time of parents and young children: differences by parent and child gender and day of the week: International Journal of Behavioral Nutrition and Physical Activity, 2014, 11, pp� 54 – 62�
Juszczyk, S� (2004)� Media influence on children and adolescents� In The New Educational Review, 2004, Vol� 2, No 3, pp� 93 – 112�
Petani, R� – Brcic, K�M� (2014) Family environment, communication and media education� In Perspectives of Innovation in Economics and Business (PIEB), 2014, vol� 14, issue 3, pp� 132 – 142�

108 Stanisław Juszczyk, Mária Krasová et al.
Postman, N� (2005)� Amusing Ourselves to Death: Public Discourse in the Age of Show Business. USA: Penguin books, 2005�
Rheingold, H� (2012)� Net Smart� How to Thrive Online� Cambridge, Massachusetts: The MIT Press�
Toffler, A� (1981)� The third wave. USA New York: Bantam edition�Vrabec, N� (2013)� Paradigmatické prístupy a súčasné trendy vo výskume mediálnej gramot-
nosti. (Paradigmatic Approaches and Current Trends in Media Literacy Research) Trnava: FMK�

The Need for Popularity and Facebook Usage Among Czech and Polish Young Adults
DOI: 10.15804/tner.2017.50.4.09
AbstractThe goal of this study was to determine the preferences concerning Facebook usage by university students in Poland and the Czech Republic regarding their gender and nationality� This study aimed also to discover the relation between the need to be popular on Facebook and three key factors: the number of Facebook friends, activity on Facebook and perceived enjoyment during this activity� To get necessary data, multiple research tools were developed – a ques-tionnaire consisting of four sections and a 12-item questionnaire measuring the level of the need for popularity� Results show that there is no significant differences in the background of Facebook usage between Polish and Czech students� However, there is a statistically significant correlation between the need for popularity and two factors: the number of friends (r = �501) and the level of perceived enjoyment in using Facebook (r = �401)� The results suggest that participants feel pleasure while undertaking different actions on Facebook and treat Facebook as a way to increase their perceived popularity�
Keywords: activity on Facebook, Czech students, Facebook, Polish students, popularity
Introduction
The exponential growth of the Internet observed in the last decade has brought significant changes to information distribution, the cultural norms and maintain-ing social relationships� One of the most widely used Internet applications are
Anna BroschPoland
111110 The Need for Popularity and Facebook Anna Brosch
openness is beneficial for their relationships� Julie E� Cohen suggests that “norms of transparency and exposure are developed to legitimate and reward practices of self-exposure and peer exposure� These practices are the morality plays of con-temporary networked life, they operate as both spectacle and discipline” (Cohen, 2012, p� 135)�
Jessica Vitak and Jinyoung Kim (2011), based on the survey conducted in 2011 among 2000 American graduate students, found six self-disclosure goals of using Facebook: social approval, social control, intimacy, identity clarification, relief of distress, and personal record� The first one is connected with the need for social acceptance, so users share information, specifically because they think their friends will be interested in it� The second one results from the fact that users are highly cognizant of their self-presentation online and nearly all make references to engag-ing in some degree of social control in their self-disclosures� The third one allows the participants to increase or maintain relational closeness with others, especially if specific friends are geographically dispersed� The fourth one functions to clarify users’ opinions or beliefs on various issues� The fifth one underlines the cathartic role of self-disclosure during online communication� The last one is associated with intrinsic rewards and is related to the desire to keep an online diary of events in one’s life� Thus, the popularity of Facebook is based on a large offer of communicative features and information-sharing applications that foster social capital by allowing users to exchange resources within an online environment� According to Santor, Messervey and Kusumakar (2000), the need to be popular is related to conformity to peer group norms� Moreover the authors suggests that “being popular involves being recognized or liked by a group of individuals” (p� 165)�
Therefore, Facebook has had currently an enormous impact on the lives of millions of users worldwide and constitutes an important part of popular culture�
Methods
The purpose of the study was to determine the preferences concerning Face-book usage by youth in Poland and the Czech Republic regarding their gender, age and nationality and how the need for popularity relates to Facebook activity and perceived enjoyment during this activity�
Instrument and measuresThe presented study uses multiple measures of frequency of Facebook use
and frequency of engaging in various types of Facebook activities� To get basic
Social Networking Sites (SNSs), which offer a new participatory online culture� These platforms give members access to digital creation and allow them to portray their private lives in new ways by sharing photos and videos, sending messages and keeping in touch with others (cf�, Huk, 2016)� In fact, communication via Social Networking Sites is characterized by a high awareness both of watching and being seen� According to Christena Nippert-Eng, “Humans are constantly scanning, constantly receptive to and looking for whatever they can perceive about each other, for whatever is put out there” (2010, p� 8)� Despite the fact that sharing of intimate details on SNSs is pervasive and growing rapidly, relatively little research has investigated the underlying motivations behind this behavior� As suggested by Helen Nissenbaum, “In a flourishing online ecology, where individuals, commu-nities, institutions, and corporations generate content, experiences, interactions, and services, the supreme currency is information, including information about people” (2011, p� 33)� Oscar H� Gandy, using the metaphor of Panopticon1, argues instead, that a surveillance system can exert the same type of control in contempo-rary culture and it is important to hold “the rationalization and control of human existence” (1993, p� 227)� In this context, a surveillance system is a general method of regulating individuals’ behavior in society and is part and parcel of socializa-tion� Therefore, sociality has always required some abandonment of privacy� As pointed out by Zizi Papacharissi and Paige L� Gibson, “learning how to share is a central process of being socialized into society, as it enables relationships and presentations of the self ” (2011, p� 80)� Among the numerous players on the field of SNSs, Facebook is recognized as one of the most popular and influential SNS, with 1�01 billion daily active users and 894 million mobile daily active users as of September 2015 (Facebook� Statistics, 2015)�
David Kirkpatrick reported in his book The Facebook Effect: The Inside Story of the Company That Is Connecting the World that the mission of Facebook founders has been to “make society more open” (Kirkpatrick, 2010, p� 207), which they described as “radical transparency” (Kirkpatrick, 2010, p� 200)� Perhaps, this idea is based on a dream of an interpersonally intimate society without hierar-chical structure, where openness and transparency are positive for society and interpersonal relations� This point of view could explain why more and more people are exposing their intimacy to invisible audience as they may consider that
1 The Panopticon is a type of architectural design created by the English philosopher and social theorist Jeremy Bentham in the late 18th Century for prisons� Its structure is ideal for indoor discreet and covert surveillance of the inmates� In 1975 Michel Foucault developed Panopticon as a metaphor for modern “disciplinary” societies and their pervasive inclination to observe and normalise�

113112 The Need for Popularity and Facebook Anna Brosch
ParticipantsThe survey was conducted in 2015 among 104 university students from Poland
(N=53) and the Czech Republic (N=51)� The participants’ age ranged from 20 to 30, although over 79% were between 21 and 24 years of age� The mean age of the sample was 23�5 with a standard deviation of 1�73 (among Polish students – 23, SD 1�14 and Czech – 24, SD 2�05)� With regards to the respondents’ gender, 57% were female, including 46% from Poland and 54% from the Czech Republic and 43% were male – 60% from Poland and 40% from the Czech Republic�
Results
The background of Facebook useThe first research objective was to examine the background of Facebook use
among Polish and Czech students, which was measured on several dimensions: the length of Facebook membership, frequency of Facebook use, the kind of devices used to access Facebook, the number of Facebook friends and the purpose of using Facebook� Chi-square tests of independence were conducted to determine if the distribution among categories was not equal�
The research shows that the large majority of the participants have been active Facebook users for several years� Over 90% of them have had a Facebook account for 4 years and longer� However, over 30% admitted that they are active Facebook users even longer than for 6 years, including 20% Polish and 43% Czech students� As presented in Table 1, there are significant differences between the Polish and Czech Facebook users in the length of Facebook use� Although both groups have belonged to Facebook community for a long time, the Czech students indicate longer Facebook membership period�
To measure the rates of frequency, the participants were asked to indicate the average amount of time they spent with a logged-in profile by selecting one of the following categories: Less than 1 hour a day; 1 – 3 hours a day; more than 3 hours a day� The majority of the respondents spend on Facebook 1 – 3 hours a day (57�7%), while only 11�5% reported more than three hours of Facebook use in a typical day� Regarding to nationality, the time spent on Facebook was similar� About 71�7% of the Polish and 66�7% of the Czech students spend more than one hour on Facebook, whereas slight differences are visible with regard to the respondents’ gender� More women spend over one hour on Facebook (45�1%) than their counterparts (31�6%)� However, this difference is not statistically significant (c2 = 1�263)�
information from participants, a questionnaire was developed, which consisted of four sections� The first section of the questionnaire included basic questions regarding preferences for Facebook use, such as the length of Facebook usage, sources used to access Facebook, number of Facebook friends, frequency and purposes of Facebook use� The second section of the questionnaire focused on preferred activities of Facebook use, including posting one’s own photos, posting comments on other people’s profiles or photos, status update, “liking” other people’s pages� The rate of the activity was based on a four-point ordinal scale: 1 – Never; 2 – Seldom (1 – 5 times a week); 3 – Sometimes (6 – 10 times a week); 4 – Often (11 – 15 times a week), 5 – Very Often (more than 15 times a week)� The third section of the questionnaire concerned perceived enjoyment in using Facebook during different activities, which was measured with the use if a four-point Likert scale (1 – strongly disagree, 2 – disagree, 3 – agree, 4 – strongly agree)� The last section included demographic questions to describe the population in terms of age, gender and nationality� The collected data was analyzed using the Statistical Package for Social Sciences (SPSS) software for Windows version 24�0�
As Santor at al� (2000) claim, the need to be popular is related to being accepted by the peer group, hence it is probable that activity on Facebook and perceived enjoyment in using Facebook would be correlated with the need for popularity� The need for popularity was measured by a 12-item questionnaire (Santor at al�, 2000), using a bipolar Likert scale, measuring either a positive or negative response to a statement, ranging from 1 (Definitely Not) to 5 (Definitely Yes)�
Thus, the aim of this study was to examine the level of the need to be popular in the context of Facebook usage by Polish and Czech Students based on the following research questions:
Question 1: What is the background connected to the use of Facebook by Polish and Czech university students in view of their nationality?
Question 2: What is the background connected to the use of Facebook by Polish and Czech university students in view of their gender?
Question 3: Is there a relationship between the number of Facebook friends and the need to be popular among Polish and Czech university students?
Question 4: Is there a relationship between the level of Facebook activities and the need to be popular among Polish and Czech university students?
Question 5: Is there a relationship between the level of perceived enjoyment in using Facebook and the need to be popular among Polish and Czech university students?

115114 The Need for Popularity and Facebook Anna Brosch
The largest group of respondents indicated that they used Facebook to interact with friends (93�3%)� The next large group uses Facebook to fallow recent events (60�6%) and activities of other users (51%)� Taking into account the respondents’ nationality, there are no significant differences, although the Polish students more often than the Czech ones use Facebook to satisfy their need for belonging� Regarding gender, the research shows that the female students more often use Facebook to invite others (30�5%) than the male students (11�1%)� However, the latter are more likely to meet new people (28�9) than the former (15�3%)�
The need for popularity and activities on FacebookThis study was done to determine which factor (number of Facebook friends,
preferred activities or perceived enjoyment) was more strongly related to the need for popularity� While the effect of gender and nationality could be important vari-ables in Facebook use, they will not be taken into account in this analysis, because, as shown in the above analysis, there are no significant differences in Facebook usage between the Polish and Czech students� To test the relationship between the need for popularity and three mentioned factors, the Pearson correlation coefficient was used� The findings are presented in Table 3�
The level of the need to be popular was measured with the use of a bipolar Likert scale ranging from 1 (Definitely Not) to 5 (Definitely Yes)� The maximum score obtained by the participants is 41 and the minimum is 12, with the average of 17�8 and SD = 6�64� Wherein almost 31% of the respondents obtained a score above the average�
The first variable taken into account was the number of Facebook friends� According to Zywica and Danowski (2008), the number of friends and posts a person has on his/her wall on Facebook is a significant indication to other users that the person is popular� Tom Tong et al� (2008) stated that a person with at least 302 friends was perceived to be the most socially attractive by others� It suggests that people who want to increase their popularity notice how many friends they have� Thus, the following hypothesis was put forward:
H1: There is a relationship between the number of Facebook friends and the need to be popular
To obtain adequate data, the participants were asked to reveal how many people they have on their Facebook friend lists� The number of friends ranged from 120 to 970 friends per account, an average of 413�6 and SD = 249�2� It shows that for young people it is very important to have many friends on Facebook� The result of
Regarding the sources used to access Facebook, the largest group of respondents uses smartphones (85�6%)� This indicates that both the Polish and Czech students prefer mobile devices to participate in Facebook life anywhere and anytime� The personal computer is still popular as a device used to access Facebook, wherein the Czech students use it more often (88�2%) than the Polish students (66%)� It is also interesting that both the Polish and Czech women are more likely to use smartphones (90�4%) than the men (79�8%) to access Facebook� However, these differences are not statistically significant (c2 = 3�88; c2 = 1�999, respectively)�
Table 1. The usage of Facebook among Polish and Czech students (Chi-Square Analysis)
df Nationality GenderLength of Facebook Membership 2 6�014* �899Frequency of Facebook Usage 2 �600 1�263The Source used to Access FacebookSmartphone 1 1�73 1�999Personal computer 1 3�88 �576Tablet 1 �503 �036
p < 0.5
Facebook primarily allows people to contact others and this interaction can take many forms� Therefore, the participants were asked to indicate the purposes for which they use Facebook by selecting more than one answer (Table 2)�
Table 2. The purpose of using Facebook
Poland Czech Republic TotalN % N % N %
Interacting with family 21 39�6 15 29�4 36 34�6Interacting with friends 52 98�1 48 88�2 97 93�3Fallowing recent events 29 54�7 34 66�7 63 60�6Fallowing activity of other users 24 45�3 29 56�9 53 51�0Meeting new people 14 26�4 8 15�7 22 21�2Playing games 2 3�8 1 2�0 3 2�9Belonging to the group 26 49�1 15 29�04 41 39�4Inviting others 10 18�9 13 25�5 23 22�1
* Table 2 does not add up to 100% as respondents were able to select more than one response�

117116 The Need for Popularity and Facebook Anna Brosch
ment in using Facebook during different activities was measured with the use of a four-point Likert scale (from 1 – strongly disagree to 4 – strongly agree)� The scores obtained by the participants ranged from 9 to 32, with the average of 22�6 and SD = 5�24� Almost 60% of the respondents obtained a score above the average� The results of a correlation test also showed that there is a statistically significant relationship between the level of perceived enjoyment in using Facebook and the need for popularity (r =�401, p < �001)�
Table 3. Pearson’s Correlation Coefficients for the need for popularity and three variables
Variable Pearson Correlation Sig. (2-tailed) The number of Facebook friends �501 �000The level of activity on Facebook �101 �308The level of perceived enjoyment in using Facebook �401 �000
Discussion and conclusion
In the age of the open society, the need for popularity has become a value, thus many ordinary people try to become popular through different activities online� Undoubtedly, Facebook with its full panoply of communication tools seems to be an ideal environment, allowing its users to meet their need for popularity� As a result, most of Facebook users make a lot of efforts to be seen and recognizable on Facebook�
The research shows that Facebook plays a significant role in the lives of Polish and Czech university students� This platform is an excellent way to be more connected to each other, even crossing time and geographic barriers� As stated by Bovitz (2007), “ it’s a way to meet people, share things about themselves, and communicate with friends”� With a full panoply of different tools, Facebook offers a great opportunity to become popular by posting photos, videos and other contents and to follow other users’ activities� Hence, both the Polish and Czech students consistently pursue every opportunity to interact with friends, as almost 70% of them spend on Facebook over one hour a day� The respondents prefer to connect with Facebook using smartphones followed by computers� What is interesting is that there are not significant differences in using Facebook between them� It can be explained by the similar political and historical background of both countries� Regarding the participants’ gender, there are also no significant
a correlation test also showed that there was a statistically significant relationship between the number of friends and the need for popularity (r =�501, p < �001)�
Popularity can also be connected with different activities on Facebook, which requires user engagement� In other words, people who seek to be popular on Facebook are those who take significant notice to be seen and recognizable on Facebook� Thus, the following hypothesis was put forward:
H2: There is a relationship between the level of activity on Facebook and the need to be popular
To obtain necessary data, the participants were asked to estimate the frequency with which they conducted various activities on Facebook� As the possible types of Facebook activities change over time because of addition or deletion of features, the list of Facebook activities was developed just before the presented study� Eventually, the activities connected with Facebook use were categorized as follows: self-promo-tion (e�g�, posting photos and films), maintaining relationships (e�g�, commenting on contents posted by others), communication (e�g�, chatting) and entertainment (e�g�, playing games)� The rate of an activity was based on a four-point scale from 1 – Never to 5 – Very Often (more than 15 times a week)� The scores obtained by the respondents ranged from 4 to 16 points� The activity undertaken on Facebook was essentially connected with maintaining relationships with others� Almost 65% of the respondents post contents on their Facebook wall several times a week and 46% of them comment on the profiles of others� However, there is no statistically significant relationship between the level of activity and the need for popularity�
According to Deci et al� (1991), people engage in activities for their own pleas-ure and satisfaction, they are affected by intrinsic motivation, which is defined as “the extent to which the activity of using a specific system is perceived to be enjoyable in its own rights, aside from any performance consequences resulting from system use” (Davis at al�, 1992)� Therefore, Facebook users may get involved in different Facebook activities to meet their personal need for popularity, which as result makes them pleased� Taking the above mentioned into account, the following hypothesis was proposed:
H3: There is a relationship between the level of perceived enjoyment in using Facebook and the need to be popular
To verify this hypothesis, the students were asked to indicate the level of per-ceived enjoyment they feel while using Facebook� The level of perceived enjoy-

119118 The Need for Popularity and Facebook Anna Brosch
differences between them – both the females and males use Facebook above all to contact with friends, follow recent events and activities of others�
The technological capabilities of Facebook have made it easy to search for people and become friends with them at a click of a button� It is also visible among the researched students, who reported a high number of Facebook friends ranging from 120 to 970, an average of 413�6 per account� Moreover, the number of friends is positively correlated with the need for popularity� Therefore, Santor at al� (2000) are right when saying that popularity involves being recognized or liked by a group of individuals (p� 165)� A positive correlation was also found in the level of perceived enjoyment in using Facebook and the need for popularity, which confirms the hedonic nature of Facebook� On the other hand, there was no statistically significant correlation between the need for popularity and the level of activity on Facebook� It indicates the widespread nature of this phenomenon regardless of the need to be popular�
In summary, the need for fame and accessibility to a wide audience proved to be extrinsic motivators for a variety of activities on Facebook� Therefore, Facebook profile owners’ popularity was manipulated via the number of friends, photos tagged, and the proportion of self – vs� friend-authored wall posts�
References:Bovitz, L� (2007)� In Their Own Words—Understanding the Communication Styles of
Teens� Journal of Extension, 45(2)� Retrieved from http://www�joe�org/joe/2007april/tt1�php [11�12�2016]�
Cohen, J�E� (2012)� Configuring the Networked Self: Law, Code, and the Play of Everyday Practice. Yale: University Press�
Davis, F�D�, Bagozzi, R�P� & Warshaw, P�R� (1992)� Extrinsic and intrinsic motivation to use computers in the workplace� Journal of Applied Social Psychology, 22(14), pp� 1111 – 1132�
Deci, E�L�, Vallerand, R�J�, Pelletier, L�G� & Ryan, R�M� (1991)� Motivation and education: The self-determination perspective� Educational psychologist, 26(3 – 4), pp� 325 – 346�
Facebook� Statistics� (2015)� Received from: http://newsroom�fb�com/company-info/ [22�11�2016]�
Facebook Trends Polska� Użytkownicy Facebooka [Facebook users] http://www�sotrender�pl/trends/facebook/reports/201511/categories [20�12�2016]�
Gandy, O�H� (1993)� The panoptic sort: A political economy of personal information� Boul-der, Colo: Westview Press�
Huk, T (2016)� Use of Facebook by children aged 10 – 12� Presence in social media despite the prohibition, The New Educational Review, 46(4), pp� 17 – 28, DOI: 10�15804/tner�2016�46�4�01�
Kirkpatrick, D� (2010)� The Facebook Effect: The Inside Story of the Company That Is Con-necting the World. New York: Simon & Schuster�
Nippert-Eng, Ch� E� (2010)� Islands of Privacy. Chicago: University of Chicago Press�Nissenbaum, H� (2011)� A Contextual Approach to Privacy Online� Dӕdalus Journal of the
American Academy of Arts & Sciences, 140 (4)� Received from: https://www�amacad�org/multimedia/pdfs/publications/daedalus/11_fall_nissenbaum�pdf [30�11�2015]�
Papacharissi, Z� & Gibson, P� (2011)� 15 Minutes of Privacy: Privacy, Sociality an Publicity on Social Network Sites� In L� Reinecke & S� Tepte, (Eds�), Privacy Online: Theoretical Approaches and Research Perspectives on the Role of Privacy in the Social Web, pp� 75 – 89� New York: Springer�
Santor, D�A�, Messervey, D & Kusumakar V� (2000), Measuring Peer Pressure, Popularity, and Conformity in Adolescent Boys and Girls: Predicting School Performance, Sexual Attitudes, and Substance Abuse, Journal of Youth and Adolescence, 29(2), pp� 163 – 182�
Tom Tong, S�, Van Der Heide, B�, Langwell, L� & Walther, J�B� (2008)� Too much of a good thing? The relationship between number of friends and interpersonal impressions on Facebook� Journal of Computer-Mediated Communication, 13� DOI:10�1111/j�1083 – 6101�2008�00409�x
Vitak, J� & Kim, J� “You Can’t Block People Offline”: Examining How Facebook’s Affor-dances Shape the Disclosure Process� In: Proc. CSCW, ACM (2014), pp� 461 – 474� Received from: https://vitak�files�wordpress�com/2009/02/vitak-kim-cscw2014�pdf [11�12�2015]�
Zywica, J� & Danowski, J� (2008)� The Faces of Facebookers: Investigating Social Enhance-ment and Social Compensation Hypotheses; Predicting Facebook™ and Offline Popularity from Sociability and Self-Esteem, and Mapping the Meanings of Popularity with Semantic Networks� Journal of Computer-Mediated Communication, 14, pp� 1 – 34� Received from: http://onlinelibrary�wiley�com/doi/10�1111/j�1083 – 6101�2008�01429�x/epdf [5�10�2017]�

General Didactics


Narrowing the Gap of Science Students’ Learning Outcomes Through INSTAD Strategy
DOI: 10.15804/tner.2017.50.4.10
Abstract This research aimed to examine the strategy effectiveness of the Integrating Inquiry-based learning and Student Teams Achievement Division (INSTAD) compared to other strategies: Inquiry; Student Teams Achievement Division (STAD); and conventional learning, in order to narrow Upper Academic Abil-ity (AA) and Lower Academic Ability (AB) science students’ learning outcome gap� As many as 136 research subject, consisting of AA and AB 7th grade stu-dents in equal numbers were selected using stratified random sampling from 27 State Junior High Schools in Surakarta, Indonesia� This research employed 4x2 factorial design as a method. Students’ learning results were measured with an essay test, then analyzed using Anakova� Findings demonstrate that INSTAD is the optimum strategy to constrict AA and AB students’ science grade point average, compared to Inquiry, STAD, and conventional learning�
Keywords: inquiry, STAD, INSTAD, learning outcomes
Introduction
A considerable amount of research has established that Indonesian students’ grade point average in science is substandard� PISA surveys in different periods indicated that this unsatisfactory learning outcome has been consistently in the lowest 10� In 2015, Indonesian students ranked 62th out of 69 countries, while in 2009, they ranked 60th out of 65 countries� In 2006, Indonesia ranked 50th out
Baskoro Adi Prayitno, SuciatiIndonesia

125124 Narrowing the Gap of Science Students’ Learning Outcomes Through INSTAD Strategy Baskoro Adi Prayitno, Suciati
Research Methodology
General Background of ResearchThis research was conducted with the use of 4x2 factorial design� During the
data collection phase, the students were divided into four groups, then each was treated with INSTAD, Inquiry, STAD, and Conventional� Pretest and posttest were conducted before and after science learning treatment for 4 months� Pretest score was used as a covariate controlling the students’ pre-determined learning outcome varying factors� Table 1 shows the research design�
Table 1. Research design
Students’ Academic AbilityLearning Strategy
INSTAD (X1) Inquiry (X2) STAD (X3) Conven-tional (X4)
Upper Academic Ability (Y1) X1Y1 X2Y1 X3Y1 X4Y1Upper Academic Ability (Y2) X2Y2 X2Y2 X3Y2 X4Y2
Research Sample The population of this research consisted of the 7th grade students from 27 jun-
ior high schools in Surakarta Regency, Indonesia� The research sample included 4 upper (AA) and 4 lower (AB) academic ability junior high schools, chosen using stratified random sampling� This academic ability classification was derived from the average national exam score� The AA students sample was selected from the upper academic ability schools, whereas the AB students were selected from the lower academic ability schools� As many as 17 students from each classification per school were chosen, deriving 68 AA and 68 AB students per school, resulting in 136 research subjects in total� The AA and AB students classification was obtained from their elementary school national exam scores�
Instrument and ProceduresScience learning outcomes refer to students’ proficiency in concept, principal,
law, and science theory enlisted in the learning objectives� The learning outcomes were measured using an essay test� Three experts examined test items used as research instruments, assessing the accuracy of learning objectives and cognitive process dimension to test validity� Expert evaluation results indicated that the test was valid� The reliability was measured by the Cronbach alpha formula specifying a high category of reliability index with the score of 0�81�
of 57 countries, in the period before, in 2003, Indonesia ranked 38th out of 40 countries (OECD, 2015)�
The Indonesian government advocate the use of Inquiry strategy in science classes to improve students’ academic achievement (Retnawati, Munadi, Arlin-wibowo, Wulandari F, & Sulistyaningsih, 2017)� Multiple studies confirmed that the Inquiry strategy makes it possible to improve students’ outcomes in science (Gillies, Nichols, Burgh, & Haynes, 2012; Ogan-Bekiroğlu & Arslan, 2014; Simsek & Kabapinar, 2010)� However, big gaps were persistent when Upper Academic Level (AA) and Lower Academic Level (AB) students’ learning outcome is meas-ured� The gap is caused by the homogeneous in-class learning time allocation regardless of their academic ability� As a consequence, students’ learning outcomes were varied and categorized into high, moderate, and low� Indeed, varying time allocation for studying science to match their academic ability would lead to a smaller learning outcome gap (Damavandi & Shekari, 2010)� It is suggested, then, to conduct scaffolding� Science learning that facilitates scaffolding from AA to AB students has the potential to provide more time without varying in-class time allocation� The scaffolding conducted by AA students delivers AB students to their potential zone, so that the learning outcome gap between them could be diminished (Prayitno, Corebima, Susilo, Zubaidah, & Ramli, 2017)�
Integrating Inquiry strategy and STAD (INSTAD) have the potential to decrease the gap between AA and AB science students’ grade point averages� The Inquiry strategy implementation without STAD could not demonstrate better outcomes� The STAD is more effective than Inquiry in facilitating scaffolding from AA to AB students� As a cooperative strategy, STAD has been proven effectively able to facilitate scaffolding compared to a non-cooperative strategy� STAD is incom-patible for science learning; therefore STAD implementation without Inquiry integration seems less powerful in improving learning outcomes in science classes� The INSTAD strategy comprising both Inquiry – which guarantees optimal empowerment for students’ learning outcomes, and STAD – which provides ideal scaffolding from AA to AB students� The INSTAD strategy has the potential to narrow the gap between AA and AB students compared to the Inquiry, STAD, and conventional science learning strategies�
Research Problem The research problems are the following: (1) Is INSTAD more effective in
improving students’ learning outcomes in science compared to the Inquiry, STAD, and conventional strategy? (2) To what extent is INSTAD able to narrow students’ science learning gap compared to the Inquiry, STAD, and Conventional strategy?

127126 Narrowing the Gap of Science Students’ Learning Outcomes Through INSTAD Strategy Baskoro Adi Prayitno, Suciati
Table 2 shows that the learning strategy has a significant influence on science learning outcomes (P<0�000)� The LSD test results of the learning strategy of science learning outcomes are presented in Table 3�
Table 3. The difference in students’ learning outcomes based on the learning strategy
Learning strategy Pretest Posttest Gain Corrected mean Notation Conventional 17�03 43�93 25�97 44�47 aSTAD 28�47 61�21 32�77 60�00 bInquiry 18�56 72�90 54�35 73�24 cINSTAD 18�55 75�77 57�23 76�11 c
Table 3 shows that the learning outcomes of the science students that had been given the INSTAD and Inquiry treatment are similar, but higher than those of the students treated with the STAD and Conventional strategy� The learning outcomes of the students treated with STAD are higher than those of the Conventional treatment groups� Score differences or gain in science learning outcomes from pretest and posttest were highest with INSTAD, followed by the Inquiry STAD, and Conventional learning strategy� This indicated that INSTAD is optimal in improving students’ learning outcomes�
Table 2 shows that the learning strategy is significantly interrelated with aca-demic ability in science learning outcomes (P<0�007)� The LSD test of learning strategy interaction and academic ability are presented in Table 4�
Table 4. The interrelation of learning strategy and academic ability in science learning outcomes
Learning strategy Ability Pretest Post test Gain Corrected mean Notation Conventional Lower 16�177 39�044 22�867 39�758 aConventional Upper 18�456 48�824 30�368 49�180 bSTAD Lower 14�485 59�118 44�633 60�097 cSTAD Upper 42�444 63�309 20�865 59�902 cInquiry Lower 16�029 69�044 53�015 69�781 dINSTAD Lower 17�279 74�706 57�427 75�247 deInquiry Upper 21�103 76�765 55�662 76�706 eINSTAD Upper 19�853 76�838 56�985 76�976 e
The INSTAD class treatment was conducted as follows: (1) the students were divided into AA and AB student groups of 5, (2) the teacher presented problems to the students, (3) the students formulated the problem, constructed hypotheses, designed an experiment, conducted the experiment, and made a conclusion, (4) the students presented their results in class discussion, (5) the students took individual tests, and (6) the teacher calculated the score difference before and after the learning process as the basis for group recognition� The treatment for Inquiry class referred to Pedaste, et� al� (2015), while STAD class treatment referred to Slavin (1980), and the conventional class treatment used variations of seminar� Three experts evaluated the learning steps and learning outcomes prior to the implementation to assess the learning design in treatment classes� The evaluation confirmed the design feasibility� Before the treatment, partner teach-ers were trained to ensure the consistency of learning strategy implementation during the experiment�
Data AnalysisData were analyzed with the use of Anakova, with science learning outcomes
in form of pretest scores reviewed as a covariate� Kolmogorov Smirnov para-metric statistical prerequisite analysis was used for testing data normality, the pretest score was 0�075 and posttest score 0�123, i�e�, within the normal category, whereas the Levene homogeneity test concluded that homogeneous variants were at 0�740� The LSD test was further used for the average difference between variables�
Research Results
The results of Anakova test of the students’ science learning outcomes after the treatment and academic ability are presented in Table 2�
Table 2. Anakova test results regarding the effect of treatment on science learning outcomes
Source Sum of Squares df Mean
Square F p
Learning strategy 21352�401 3 7117�467 211�424 �000Learning strategy*academic 421�525 3 140�508 4�174 �007a� R Squared = �843 (Adjusted R Squared = �833)

129128 Narrowing the Gap of Science Students’ Learning Outcomes Through INSTAD Strategy Baskoro Adi Prayitno, Suciati
to have higher scores than students memorizing knowledge (Gurses, Gunes, Dalga, & Dogar, 2015; Kwan & Wong, 2015)� The students treated with INSTAD were divided into smaller heterogeneous groups to ensure effective scaffolding (Prayitno et al�, 2017)� Scaffolding on INSTAD was effective because of the combination of teacher and peer tutorials� The characteristics of STAD ensured the sustainability of positive dependency amongst group members� The complementary Inquiry and STAD characteristics in INSTAD resulted in the students’ higher academic achievements compared to the STAD and Conventional learning strategies�
Inquiry originates from steps of a scientific method (Pedaste et� al�, 2015)� The inquiry phase begins with problem presentation� In the next step, students are required to conduct a theoretical investigation to temporarily solve the problem in the form of hypotheses� Then, students design a strategy to test the hypotheses� The phases make students independently find a problem and the solution� In solving problems, students are required to conduct deductive-inductive thinking� Their activity in constructing knowledge and performing deductive-inductive thinking has been proven to improve students’ learning outcomes (Arslan, Ilkörücü, & Seden, 2009)�
STAD develops group member’s positive dependency in the learning process (Slavin, 1980)� Peer tutorial on STAD proved more effective than non-coopera-tive learning (Kyndt et al�, 2013)� STAD is not specifically designed for science learning� Science learning outcome empowerment on STAD is practiced through the teacher’s explanation and group discussion� The teacher explains knowledge through lecture and cooperative group discussion� Each member of the group is responsible for mastering the learning objectives� STAD has less capacity in facilitating students’ knowledge construction, hence students’ learning outcomes are lower than those of the students employing the INSTAD and Inquiry learning strategies�
Students taught with the use of the Conventional strategy learn by listening to the teacher’s explanation, therefore they lack involvement in constructing knowledge during the learning process� On the other hand, students’ learning outcomes are better if students independently construct their knowledge rather than listening to the teacher’s explanation (Gurses et al�, 2015; Kwan & Wong, 2015), as a consequence, the science students employing the Conventional strategy gain the lowest scores�
Table 2 presents how learning strategy interacts with academic ability towards science learning outcomes� The LSD test indicates that: (1) the learning outcomes of the AA and AB science students treated with the Conventional strategy were the lowest compared to those of other groups� The strategy was least effective
Table 4 shows that there are no differences in learning outcomes between the AA and AB science students in the INSTAD group and the AA science students in the Inquiry group� The AA and AB students employing INSTAD and the AA students employing the Inquiry strategy have higher scores than the AB students employing Inquiry, AA and AB STAD group, and AA and AB Conventional group� In addition, the AB science students Inquiry group have higher scores than the AA and AB students treated with the STAD and Conventional strategy� Further-more, the AA and AB science students treated with STAD have similar learning outcomes� The AA and AB science students treated with STAD have higher scores than the students treated with the Conventional strategy� The AA students treated with the Conventional strategy demonstrate higher scores compared to the AB science students� It could be conclude that INSTAD is the optimum strategy in narrowing the learning outcome gap between the AA and AB science students, compared to the Inquiry, STAD, and Conventional strategies� With regards to the difference or gain of pretest and posttest score in Table 4, the AB students treated with INSTAD and STAD had a bigger gap than the AA students, while the AA students treated with the Inquiry or Conventional strategy had higher pretest posttest differentiation than the AB students� The finding indicated that the AB students’ learning outcomes were more improved than those of the AA students’ treated with INSTAD and STAD�
Discussion
Tables 2 and 3 show that learning strategy has a significant effect on science learning outcomes� The learning outcomes of the science students treated with INSTAD and Inquiry are similar, but higher compared to the students treated with the STAD and Conventional learning strategy� The students employing STAD have higher scores than those employing the Conventional strategy, whose learning outcomes are the lowest�
INSTAD has characteristics of both the Inquiry and STAD strategies� The Inquiry strategy requires students to use scientific methods in building their knowledge� The problem presentation phase in Inquiry has the potential to cause students’ cognitive conflict (Pedaste et� al�, 2015)� The cognitive imbalance caused by cognitive conflict is marked by a multitude of questions on their minds� In the next phase, students are required to formulate hypotheses and to design a strategy for testing the hypotheses� Inquiry character requires students to construct their knowledge� Students learning by constructing their knowledge have been proven

131130 Narrowing the Gap of Science Students’ Learning Outcomes Through INSTAD Strategy Baskoro Adi Prayitno, Suciati
narrowing the AA and AB science students’ learning outcomes compared to the treated with the Inquiry and Conventional strategies�
The INSTAD and Inquiry strategies require students to use scientific methods in constructing their knowledge, resulting in higher learning scores compared to students employing STAD and Conventional strategy� The students in the Inquiry class were randomly grouped, so the scaffolding process was less effective, as a result, the AA and AB students had different learning outcomes� As STAD is not originally designed for science learning, although it has the potential to narrow the gap between AA and AB science students, the learning outcomes do not surpass those of students treated with the INSTAD and Inquiry learning strategies� INSTAD has characteristics related to Inquiry and STAD� Students employing INSTAD practice group cooperative inquiry activity, which proves to be able to facilitate effective scaffolding� This explains why INSTAD becomes the optimum strategy in improving science students’ learning outcomes, equal to the Inquiry strategy, at the same time narrowing the gap between AA and AB learning outcomes, lacking in the Inquiry and Conventional strategies�
Students employ the Conventional strategy in learning science, by listening to their teacher’s explanations� Once in a while, the teacher gives examples and asks questions to students� The Conventional strategy is less effective in facilitating scaffolding, as the teacher tends to give scaffolding to actively involve students during the learning period� The Conventional strategy also has little contribution to facilitating students’ knowledge construction; therefore the students’ learning outcomes appear to be the lowest among the other learning strategies� This also generates a gap between the AA and AB students’ learning outcomes�
Conclusions
The results suggest that compared to the STAD and Conventional strategies the INSTAD and Inquiry learning strategies are the most advantageous strategies in improving students’ science learning outcomes� STAD is more productive than the Conventional strategy� In addition, INSTAD and STAD enhance both AA and AB science students’ learning outcomes, which the Inquiry and Conventional strategies do not do� It is concluded that INSTAD is the optimum strategy both for improving science learning outcomes and narrowing the learning outcome gap between AA and AB students�
The findings confirm that the gap in students’ learning outcomes in science is caused by the use of competitive-based and unscientific-based learning methods�
in narrowing the proficiency gap between the AA and AB students; (2) the learning outcomes of the AA and AB science students treated with STAD were higher compared to those of the students treated with the Conventional strategy, but lower compared to those treated with Inquiry and INSTAD� STAD proved effective in narrowing the learning outcome gap between the AA and AB science students; (3) the learning outcomes of the AA and AB science students treated with Inquiry were higher compared to those of the AA and AB science students treated with the STAD and Conventional strategies, equal to those of the AB science students treated with INSTAD, but lower than those of the AA students treated with INSTAD� The Inquiry strategy was less effective in decreasing the learning outcome gaps between the AA and AB science students; (4) the learning outcomes of the AA and AB science students treated with INSTAD were higher compared to those of the students treated with Conventional and STAD� The learning outcomes of the AB students treated with INSTAD were equal to those of the AA and AB students treated with Inquiry� The learning outcomes of the AA students treated with INSTAD were higher than those of the AB students treated with Inquiry� INSTAD is effective in narrowing the gap between the AA and AB students� These findings prove that Inquiry is optimal in enhancing the AA and AB science students’ learning outcomes� The optimum cooperative characteristic has proven to reduce the learning outcome gap between the AA and AB students�
According to mastery learning, if students have varied academic ability and they receive equal learning quality, materials, and time allocation, their scores will vary� This gap could be narrowed if time allocation meets students’ needs (Damavandi & Shekari, 2010; Ozden, 2008)� Unfortunately, the uniformity of stu-dents’ in-class learning allocation is inevitable, so students’ learning outcome gap is unavoidable� Regarding social constructivism theory, students could enter their zone proximal development (ZPD) if provided with scaffolding by individuals with higher knowledge or mastery, including their friends (Kim & Hannafin, 2011; Royanto, 2012)� Peer scaffolding equips students with an arguably apt study time without changing the uniform in-class time allocation�
The students treated with INSTAD and STAD were divided into smaller hetero-geneous groups regarding their academic ability� The scaffolding performed by the students treated with STAD and INSTAD was effective as each of the group mem-bers was required to master the learning objective� Effective scaffolding pushed the AB science students entering their zone proximal development� In addition, effective scaffolding is effective in providing varied students’ learning period without changing in-class uniformed learning time allocation� Furthermore, the scaffolding for the students treated with INSTAD and STAD proved effective in

133132 Narrowing the Gap of Science Students’ Learning Outcomes Through INSTAD Strategy Baskoro Adi Prayitno, Suciati
The unscientific-based teaching method leads to unsatisfactory learning outcomes, while the competitive-based teaching is unable to facilitate scaffolding resulting in a gap of learning outcomes between students� Although the competitive-based learning method has the capability of facilitating scientific-based learning activity, it arguably needs to be integrated into other strategies facilitating effective scaf-folding, such as the cooperative learning strategy�
References:Arslan, C�, Ilkörücü, S�, & Seden, M� (2009)� Learning and reasoning styles of pre-service
teachers’: inductive or deductive reasoning on science and mathematics related to their learning style� In Procedia Social and Behavioral Sciences, 1, 2460 – 2465� https://doi�org/10�1016/j�sbspro�2009�01�432
Damavandi, M�E�, & Shekari, Z� (2010)� Effect of mastery learning method on perfor-mance and attitude of the weak students in chemistry� In Procedia Social and Behavioral Sciences, 5, 1574 – 1579� https://doi�org/10�1016/j�sbspro�2010�07�327
Gillies, R�M�, Nichols, K�, Burgh, G�, & Haynes, M� (2012)� The effects of two strategic and metacognitive questioning approaches on children’s explanatory behavior, prob-lem-solving, and learning during cooperative, inquiry-based science� International Jour-nal of Educational Research, 53(1), 93 – 106� https://doi�org/10�1016/j�ijer�2012�02�003
Gurses, A�, Gunes, K�, Dalga, T�, & Dogar, C� (2015)� A design practice for interactive direct teaching based on constructivist learning (IDTBCL): Boiling and evaporation� In Procedia Social and Behavioral Sciences, 197, 2377 – 2383� https://doi�org/10�1016/j�sbspro�2015�07�293
Kim, M�C�, & Hannafin, M�J� (2011)� Scaffolding problem solving in technology-enhanced learning environments (TELEs): Bridging research and theory with practice� Computers and Education, 56(2), 403 – 417� https://doi�org/10�1016/j�compedu�2010�08�024
Kwan, Y�W�, & Wong, A�F�L� (2015)� Effects of the constructivist learning environment on students’ critical thinking ability: Cognitive and motivational variables as mediators� International Journal of Educational Research, 70(1), 68 – 79� https://doi�org/10�1016/j�ijer�2015�02�006
Kyndt, E�, Raes, E�, Lismont, B�, Timmers, F�, Cascallar, E�, & Dochy, F� (2013)� A metaanal-ysis of the effects of face-to-face cooperative learning� Do recent studies falsify or verify earlier findings? Educational Research Review, 10, 133 – 149� https://doi�org/10�1016/j�edurev�2013�02�002
OECD� (2016)� Result from PISA 2015: Country note� Retrieved from https://www�oecd�org/pisa/PISA-2015-Indonesia�pdf
Ogan-Bekiroğlu, F�, & Arslan, A� (2014)� Examination of the Effects of Model-based Inquiry on Students’ Outcomes: Scientific Process Skills and Conceptual Knowledge� In Procedia Social and Behavioral Sciences, 141, 1187 – 1191� https://doi�org/10�1016/j�sbspro�2014�05�202
Ozden, M� (2008)� Improving science and technology education achievement using mas-tery learning model� World Applied Sciences Journal, 5(1), 62 – 67� Retrieved from http://idosi�org/wasj/wasj5(1)/10�pdf
Pedaste, M�, Mäeots, M�, Siiman, L�A�, Jong, T� De, Zacharia, Z�C�, & Tsourlidaki, E� (2015)� Phases of inquiry-based learning: Definitions and the inquiry cycle� Educational Research Review, 14, 47 – 61� https://doi�org/10�1016/j�edurev�2015�02�003
Prayitno, B�A�, Corebima, D�, Susilo, H�, Zubaidah, S�, & Ramli, M� (2017)� Closing the science process skills gap between students with high and low level academic achieve-ment� Journal of Baltic Science Education, 16(2), 266 – 277� Retrieved from http://www�scientiasocialis�lt/jbse/files/pdf/vol16/266 – 277�Prayitno_JBSE_Vol�16_No�2�pdf
Retnawati, H�, Munadi, S�, Arlinwibowo, J�, Wulandari F, N�, & Sulistyaningsih, E� (2017)� Teachers’ difficulties in implementing thematic teaching and learning in elementary schools� The New Educational Review, 48(2), 202 – 212� https://doi�org/10�15804/tner�2017�48�2�16
Royanto, L�R� (2012)� The effect of an intervention program based on scaffolding to improve metacognitive strategies in reading: a study of year 3 elementary school stu-dents in Jakarta� In Procedia Social and Behavioral Sciences, 69, 1601 – 1609� https://doi�org/10�1016/j�sbspro�2012�12�105
Simsek, P�, & Kabapinar, F� (2010)� The effects of inquiry-based learning on elementary stu-dents’ conceptual understanding of matter, scientific process skills and science attitudes� In Procedia Social and Behavioral Sciences 2, 1190 – 1194� https://doi�org/10�1016/j�sbspro�2010�03�170
Slavin, R�E� (1980)� Cooperative learning� Review of Educational Research, 50(2), 315 – 342� https://doi�org/10�3102/00346543050002315

135Team Based Learning as an Instructional Strategy: A Comparative Study
Team Based Learning as an Instructional Strategy: A Comparative Study
DOI: 10.15804/tner.2017.50.4.11
AbstractThe use of Team Based Learning (TBL) as an instructional strategy in under-graduate health science curricula has been identified as a way to improve student learning outcomes� However, comparative studies of the use of TBL in business subjects in different countries are rare� This research is a first step to provide comparative quantitative empirical evidence for the usefulness of TBL, leading to continuous improvement in the learning process� It compares the results of Indonesian and Australian students in two different business classes� The finding reveals that TBL has some usefulness in enhancing student learning outcomes in business subjects�
Keywords: team based learning, instructional strategy, learning outcome, read-iness assurance
Introduction
Indonesian higher education faces issues in its teaching and learning process in order to improve its education standards and student proficiency outcomes� Thus, most universities in Indonesia are trying to improve the quality of their graduates� Specifically, simply passing a course is no longer sufficient; students need to play more active roles during the learning process� This problem also takes place in Australia� From the literature reviewed on the learning issues in the higher education in Australia (Tobias, 1990; Gibbs, 1992; Biggs, 1999; Graham,
Bens Pardamean, Harjanto Prabowo, Hery Muljo, Teddy SuparyantoIndonesiaEryadi Masli, Jerome DonovanAustralia
2006; Blackwell, 2011; Sharma, 2011), it can be said that currently one of three emerging trends is the need to engage students in the learning process�
Currently, most of the teaching and learning activities are based on the tradi-tional didactic method, which is a combination of lecture, case study seminar and/or tutorial� The lecturer imparts his/her knowledge to students by standing up at the front of the classroom, and teaches, explains concepts, facts and other learning contents� As lecture time is limited, students will listen, absorb and memorize what the lecturer has said� Some activities, such as homework, review of questions and concepts and other activities, will complement the teaching activities during a tutorial� Students are more or less passive participants in the learning process, except for a presentation session during a case study seminar� Like other physical sciences, business-related courses require students to master technical as well as non-technical competences� Tobias (1990) showed that many capable students in introductory physical science courses are dissatisfied with the passive role that the lecture method imposes on them� When teaching business-related courses, it is a tradition to rely on the text as a primary information source� Students are urged to read the text, but many do not do so� As a result, the lecturer spends more time in organizing and clarifying the text information to students� In this approach, students are less engaged in the learning process� The learning and teaching activities are more inclined to the teacher-controlled category (Biggs, 1999)� This traditional didactic method of teaching business-related courses does not maximize the potential of students in learning and understanding the teaching materials� The focus of this type of didactic instruction is learning about concepts and ideas� However, we are of the opinion that an effective teaching method should make students active participants in the learning process� The focus of instruction here is learning how to use concepts and ideas in meaningful ways� Gibbs (1992) has defined a deep approach to learning: “the student attempts to make sense of what is to be learnt, which consists of ideas and concept [and] involves [the student in] thinking, seeking integration between components and between tasks, and ‘playing’ with ideas”� This is not only to motivate capable students to be higher performers, but also to bring out ‘the potential’ of the ‘not-so-capable’ students to master the basic technical as well non-technical competency in business-related courses�
For the presented research, we employed Team Based Learning (TBL) as an instructional strategy� TBL provides opportunities for both developing teamwork capabilities and enhancing active learning (Fink, 2004)� The form of TBL adopted is based on Michaelsen (2004) as summarized by Fink (2004), where students are given preparatory work on which they are tested and the majority of the tutorial

137136 Team Based Learning as an Instructional Strategy: A Comparative StudyBens Pardamean, Harjanto Prabowo et. al
time is spent working in teams on an application of their knowledge to a problem relevant to their learning�
The research presented in this paper is a first step to provide comparative quantitative empirical evidence for the usefulness of TBL, leading to continuous improvement in the learning process. The research is based on the analysis of RAP (Readiness Assurance Process) test results, which is part of the TBL process, and final exam� This research used data from the undergraduate-level of International Business Strategy (INB30020) unit at Faculty of Business and Law, Swinburne Uni-versity, Hawthorn campus (SUT), Australia, and Basic Accounting (ACCT6087) at Bina Nusantara University (BINUS), Jakarta, Indonesia�
Structure of Team-Based Learning (TBL)
The primary learning objective in TBL is to achieve beyond simply covering content, and shift the focus towards ensuring that students have the opportunity to practice course concepts via problem solving� Thus, TBL is designed to provide students with both conceptual and procedural knowledge (Michaelsen & Sweet, 2008)� Although a portion of the classroom time is still spent ensuring that students master the course content, the vast majority of class time is devoted to team assignments that focus on problem-based learning by simulating complex questions that student will face as the course develops�
In a TBL course, students are strategically divided into permanent groups for the term, and the course content is typically divided into five to seven major units� Before any in-class content work, students must study assigned materials since each unit begins with the readiness assurance process (RAP), which consists of a short test on key ideas from the readings that students complete individually� Subsequently, students work on the test as a team, coming to consensus on team answers� Immediate feedback is given on the team test, allowing for the opportu-nity to write evidence-based appeals and valid arguments for incorrect responses� The final step in the RAP is short and lecture-specific to clarify any common misunderstandings found within the team test and appeals� Upon completion of the RAP, the remainder of a learning unit is mainly devoted to in-class activities and assignments that require students to practice using the course content�
Shifting from simply familiarizing students with course concepts to requiring that students use those concepts to solve problems is no small task (Michaelsen & Sweet, 2008)� The realization of this shift requires changes in the roles of both the instructor and the students� The instructor’s primary role shifts from dispensing
information to designing and managing the overall instructional process� On the other hand, the students’ role shifts from being passive recipients of information to active responding to initial exposure to the course content during the process of preparing for in-class teamwork� Changes of this magnitude do not happen automatically and may even seem improbable� They are, however, achievable when the four essential elements of TBL are implemented successfully (Michaelsen & Sweet, 2008):
• Teams: groups of students must be properly formed and managed • Accountability: students must be accountable for the quality of their indi-
vidual and group work • Feedback: instructors must provide frequent and timely feedback to stu-
dents • Assignment design: group questions must promote learning and team
developmentsWhen these four elements are implemented in a course, the stage is set for
student groups to evolve into cohesive learning teams (Michaelsen & Sweet, 2008)�
Methodology
The research only considered two variables to measure learning effects: Individ-ual Reading Assurance Test (IRAT) and EXAM, final exam performance (Figure 1)� This research used data from International Business Strategy (INB30020) unit at Swinburne University of Technology (SUT), Faculty of Business and Enterprise at Hawthorn campus, Australia; and Basic Accounting (ACCT6087) at Bina Nusantara University (BINUS), Jakarta, Indonesia�
The unit of International Business Strategy (INB30020) at SUT is one of the core units for undergraduate students majoring in International Business� Students have to complete 200 credit points including Global Business Cultures, Global Logistics and Supply Chain Management, and Managing the Global Marketplace, prior to enrolling into this class� So, this class is for third year students� The aim of this class is to equip students with a comprehensive framework to formulate business strategies in the global marketplace� On the other hand, Basic Account-ing (ACCT6087) class at BINUS provides students with knowledge for them to understand the concepts and principles of accounting, and how to use financial statement information as the basis for decision making� The course includes basic accounting concepts and principles and financial statement analysis� The class is offered in the first semester for first year business students and uses an Interna-
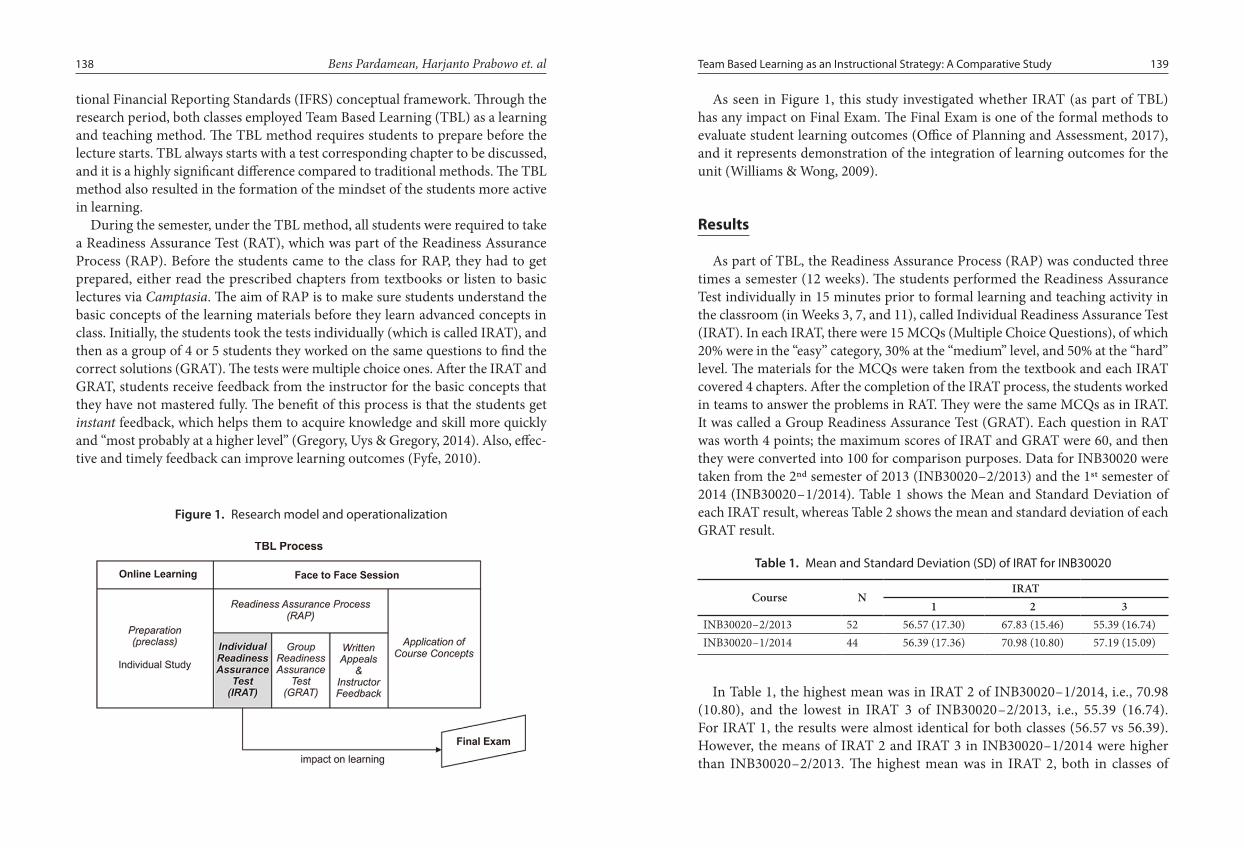
139138 Team Based Learning as an Instructional Strategy: A Comparative StudyBens Pardamean, Harjanto Prabowo et. al
tional Financial Reporting Standards (IFRS) conceptual framework� Through the research period, both classes employed Team Based Learning (TBL) as a learning and teaching method� The TBL method requires students to prepare before the lecture starts� TBL always starts with a test corresponding chapter to be discussed, and it is a highly significant difference compared to traditional methods� The TBL method also resulted in the formation of the mindset of the students more active in learning�
During the semester, under the TBL method, all students were required to take a Readiness Assurance Test (RAT), which was part of the Readiness Assurance Process (RAP)� Before the students came to the class for RAP, they had to get prepared, either read the prescribed chapters from textbooks or listen to basic lectures via Camptasia� The aim of RAP is to make sure students understand the basic concepts of the learning materials before they learn advanced concepts in class� Initially, the students took the tests individually (which is called IRAT), and then as a group of 4 or 5 students they worked on the same questions to find the correct solutions (GRAT)� The tests were multiple choice ones� After the IRAT and GRAT, students receive feedback from the instructor for the basic concepts that they have not mastered fully� The benefit of this process is that the students get instant feedback, which helps them to acquire knowledge and skill more quickly and “most probably at a higher level” (Gregory, Uys & Gregory, 2014)� Also, effec-tive and timely feedback can improve learning outcomes (Fyfe, 2010)�
As seen in Figure 1, this study investigated whether IRAT (as part of TBL) has any impact on Final Exam� The Final Exam is one of the formal methods to evaluate student learning outcomes (Office of Planning and Assessment, 2017), and it represents demonstration of the integration of learning outcomes for the unit (Williams & Wong, 2009)�
Results
As part of TBL, the Readiness Assurance Process (RAP) was conducted three times a semester (12 weeks)� The students performed the Readiness Assurance Test individually in 15 minutes prior to formal learning and teaching activity in the classroom (in Weeks 3, 7, and 11), called Individual Readiness Assurance Test (IRAT)� In each IRAT, there were 15 MCQs (Multiple Choice Questions), of which 20% were in the “easy” category, 30% at the “medium” level, and 50% at the “hard” level� The materials for the MCQs were taken from the textbook and each IRAT covered 4 chapters� After the completion of the IRAT process, the students worked in teams to answer the problems in RAT� They were the same MCQs as in IRAT� It was called a Group Readiness Assurance Test (GRAT)� Each question in RAT was worth 4 points; the maximum scores of IRAT and GRAT were 60, and then they were converted into 100 for comparison purposes� Data for INB30020 were taken from the 2nd semester of 2013 (INB30020 – 2/2013) and the 1st semester of 2014 (INB30020 – 1/2014)� Table 1 shows the Mean and Standard Deviation of each IRAT result, whereas Table 2 shows the mean and standard deviation of each GRAT result�
Table 1. Mean and Standard Deviation (SD) of IRAT for INB30020
Course NIRAT
1 2 3INB30020 – 2/2013 52 56�57 (17�30) 67�83 (15�46) 55�39 (16�74)INB30020 – 1/2014 44 56�39 (17�36) 70�98 (10�80) 57�19 (15�09)
In Table 1, the highest mean was in IRAT 2 of INB30020 – 1/2014, i�e�, 70�98 (10�80), and the lowest in IRAT 3 of INB30020 – 2/2013, i�e�, 55�39 (16�74)� For IRAT 1, the results were almost identical for both classes (56�57 vs 56�39)� However, the means of IRAT 2 and IRAT 3 in INB30020 – 1/2014 were higher than INB30020 – 2/2013� The highest mean was in IRAT 2, both in classes of
Figure 1. Research model and operationalization

141140 Team Based Learning as an Instructional Strategy: A Comparative StudyBens Pardamean, Harjanto Prabowo et. al
INB30020 – 2/2013 and INB30020 – 1/2014 (67�83 and 70�98, respectively)� Mean-while, the mean of IRAT 1 and 3 in both classes were in the range of 55�39 – 57�19�
Table 2. Mean and Standard Deviation (SD) of GRAT for INB30020
Course NGRAT
1 2 3INB30020 – 2/2013 52 83�38 (8�78) 92�36 (6�89) 90�44 (6�37)INB30020 – 1/2014 44 78�88 (12�80) 90�20 (5�11) 78�47 (10�99)
According to Table 2, the highest mean was in INB30020 – 2/2013, i�e�, 92�36 (6�89), and the lowest mean was in GRAT 3 in INB30020 – 1/2014, i�e�, 78�47 (10�99)� According to Tables 1 and 2, the mean of each GRAT from both classes was always higher than IRAT�
The data for ACCT6087 was taken from LD21 and LF21 classes in Semester 2, 2015� The LD21 class consisted of 23 students and LF21 of 43 students� The Readiness Assurance Test (RAT) was conducted five times a 15-week semester� The RATs were conducted in the first 6 weeks (i�e�, weeks 2, 3, 4, 5, and 6), before the mid-term exam� In each IRAT, there were 10 MCQs (Multiple Choice Ques-tions), of which 20% were in the “easy” category, 30% at the “medium” level, and 50% at the “hard” level� Each question was worth 4 points; the maximum scores of IRAT and GRAT were 40, and then they were converted into 100 for comparison purposes� The materials for MCQs were taken from the textbook, which was in English, and each IRAT covered 1 chapter� Table 3 shows the mean and standard deviation of the overall IRAT, whereas Table 4 shows the mean and standard deviation of the overall GRAT�
Table 3. Mean and Standard Deviation (SD) of IRAT for ACCT6087
Course NIRAT
1 2 3 4 5ACCT6087-LF21 43 61�41
(25�32)15�94(9�37)
38�91(24�82)
26�63(10�01)
70�38(16�77)
ACCT6087-LD21 23 96�27(6�91)
29�17(14�14)
86�19(20�98)
65�55(30�29)
65�34(21�13)
As presented in Table 3, the highest mean was in IRAT 1 of LD21, i�e�, 96�27 (6�91), while the lowest in IRAT 2 of LF21, i�e�, 15�94 (9�37)� The mean of IRAT 1 to 4 of LD21 was always higher than LF21� However, the mean in IRAT 5 of
LF21, i�e�, 70�38 (16�77), was higher than LD21 (65�34)� The highest mean of LF21 occurred in IRAT 5, i�e�, 70�38 (16�77), while in LD21 it was in IRAT 1 (96�27)� The lowest mean in the IRAT for both classes was in IRAT 2 (15�94 and 29�17)� Interestingly, for LF21, the mean IRAT 5 increased significantly from 26�63 in IRAT 4 to 70�38� Yet, in LD21, the mean of IRAT 4 and 5 did not change very much (65�55 and 65�34)�
Table 4. Mean and Standard Deviation (SD) of GRAT for ACCT6087
Course NGRAT
1 2 3 4 5ACCT6087-LF21 23 90�58
(11�32)67�75
(23�21)75�65
(19�03)61�20
(24�31)91�85
(11�68)ACCT6087-LD21 43 84�42
(25�29)59�79
(22�80)100�00 (0�00)
93�17 (10�90)
89�77 (14�51)
In Table 4, the highest mean in LD21 was 100, meaning that all the groups received the maximum score� On the other hand, the lowest mean was in GRAT 2 of LD21, i�e�, 59�79� Generally, except for GRAT 2 of LD21, the mean of GRAT for both classes was over 60�
Discussion
The principal aim of this analysis was to investigate whether the application of Team-Based Learning (TBL) could serve as a significant predictor for overall course performance� One significant part of TBL is individual tests of RAP (IRAT) during a semester� At the end of the semester, students take the final exam to measure their performance� Comparative analysis is made on both designated classes, i�e�, International Business Strategy INB30020 and Basic Accounting (ACCT6087)� In this case, the data analysis was carried out on combinations of each class� Data from the SUT was taken from a combination of INB30020 in the 2nd semester of 2013 and 1st semester of 2014� While data from BINUS was taken from a combination of ACCT6087 from LD21 and LF21 classes in the 2nd semester of 2015� Table 5 shows the mean and standard deviation (SD) of IRAT and GRAT the for class combination of INB300200 at SUT� Table 6 shows the mean and SD of IRAT and GRAT for the class combination of ACCT6087 at BINUS�

143142 Team Based Learning as an Instructional Strategy: A Comparative StudyBens Pardamean, Harjanto Prabowo et. al
Table 5. Mean and Standard Deviation (SD) of IRAT and GRAT for the class combination of INB300200 at SUT
Class Combination of INB30020 – SUT Mean (%) SD (%) N = 96 IRAT 1 56�33 17�53
IRAT 2 69�43 13�49IRAT 3 56�11 16�00
GRAT 1 81�13 11�23
GRAT 2 91�50 5�68
GRAT 3 84�60 10�53Mean of Final Exam 66�12 13�21
Mean-IRAT 60�62
In INB30020, each IRAT was worth 5% (totaling 15%), and the final exam was 40% of total mark� On the other hand, for ACCT6097, each IRAT was worth 3% (totaling 15%), and the final exam was 50% of total mark� As stated above, in INB30020, RAT was conducted three times in a 12-week semester� There was no mid-term exam� The final exam was conducted 2 weeks after the end of the semester� However, for ACCT6067, in a 15-week semester, RAT was conducted five times in the first 6 weeks, prior to the mid-term exam, which was conducted in week 8� As this study was to investigate the impact of IRAT on the final exam, the paper will not report on the relationship between IRAT and the mid-term exam�
Table 6. Mean and Standard Deviation (SD) of IRAT and GRAT for the class combination of ACCT6087 at BINUS
Class Combination of ACCT6087 – BINUS Mean (%) SD (%) IRAT 1 84�13 22�98N = 66 IRAT 2 24�56 14�12
IRAT 3 69�72 31�75
IRAT 4 51�97 31�24
IRAT 5 67�10 19�74
GRAT 1 87�02 20�65
GRAT 2 61�80 24�03
GRAT 3 91�52 16�10
Class Combination of ACCT6087 – BINUS Mean (%) SD (%) GRAT 4 82�12 22�70
GRAT 5 90�49 13�54
Mean – Final Exam 60�70 17�42
Mean – IRATMean – last 3 IRAT
59�5062�93
Tables 5 and 6 present interesting findings:1� In both units (INB30020 and ACCT6087), GRATs were always higher than
IRAT� This result confirms that working in a team students perform better than individually�
2� The means of IRAT for both classes are almost similar: 60�62 for BUS30020, and 59�50 for ACCT6087� For BUS 30020, IRAT 2 was significantly higher than IRAT 1, and then dropped again to the level similar to IRAT 1 (56�33 and 56�11)� Is it possible that IRAT 3 is not sustained at a higher level (at least at the level similar to IRAT 2) due to students’ workload? IRAT 3 was conducted in week 11, which was one week before the final week in a 12-week semester� Usually, during the last three weeks of a semester, more tasks and assignments are due� Students have to submit their reports; and some have to make presentations� Thus, students possibly lack the time to read and understand the prescribed chapters for RAT� This needs further investigation�
3� On the other hand, for ACCT6087, the movement was quite erratic� It started with a very high mean (84�13) and dropped drastically to 24�56, and then went up, down and up, but not up to IRAT 1 level� However, if the first two RAT results were taken out, the last three IRAT results proved less volatile; they ranged from 51� 97 to 69�72� The mean of the last three IRATs was 62�93, which was higher than the average of the final exam� This is quite interesting as the IRATs were conducted in the first half-semester, and the final exam covered the material from the second half-semester� It will be intriguing to see whether IRAT will have any impact on the mid-term exam� Furthermore, if IRATs were conducted throughout a semester, not just in the first half-semester, will the mean of the final exam result improve? Further design of assessments may be required�
4� The average of the final exam result of BUS30020 is significantly higher than the average of all the IRATs (slightly above 9%); on the hand, this is not the case for ACCT6087 as the mean of IRAT is not much different from

145144 Team Based Learning as an Instructional Strategy: A Comparative StudyBens Pardamean, Harjanto Prabowo et. al
the final exam, albeit increasing� One of the possible explanations is that for the ACCT6087, the basic accounting unit is the first of the accounting courses that the students took since they had finished high school� Thus, the average final exam was quite low, slightly above 60� On the other hand, for BUS30020, the unit was the third year class� The class consisted of the first and second years of the international business course� Thus, the students were more familiar with the contents and basic concepts�
Conclusion
The purpose of this study was to investigate the impact of IRAT, which is part of the Team-Based Learning method, on learning outcomes� In this comparative study between Australian and Indonesian students, the conclusion is encouraging� The data showed that the students, especially those from Australia, had made worthwhile improvement in their academic performance� For the Australian students, who studied INB30020, the mean of the IRAT results was 60�62, and the final exam result was 66�12, i�e�, an increase of 9%� However, for the Indonesian students who enrolled in ACCT6087, the result was not different, around 60� One of the reasons could be the way TBL was conducted� Unlike in the INB30020 class, the ACCT6087 employed TBL (including IRAT) only in the first half of the semester� However, further research is recommended �
AcknowledgmentThis work was supported by a research grant in International Cooperation and Interna-tional Publication provided by the Directorate of Research and Community Services of the Republic of Indonesia’s Ministry of Research, Technology, and Higher Education, in collaboration with Swinburne University of Technology, Australia�
ReferencesBiggs, J� (1999)� What the Student Does: teaching for enhanced learning, Higher Education
Research & Development,18(1), 57 – 75�Blackwell, A� (2011)� Online is not always fine for Gen Y student, Campus Review, 21 (2),
8 February�Fyfe, G� (2010)� The final examination: a squandered opportunity for feedback to students
or a poor use of time?, ATN Assessment Conference 2010: Assessment: Sustainability, Diversity and Innovation, Sydney, 18 – 19 November 2010�
Fink, L D� (2004)� Creating significant learning experiences: An integrated approach to designing college courses, San Francisco: Jossey-Bass�
Gibbs, G� (1992)� Improving the Quality of Student Learning, Bristol: TES�Graham, C�R� (2006)� Blended learning Systems: Definition, Current Trends, and Future
Directions� In C�J� Bonk and C�R� Graham (Eds�), The Handbook of Blended Learning: Global Perspectives, Local Designs� San Francisco: Pfeiffer, 3 – 21�
Gregory, B�, Uys, P�, & Gregory, S� (2014)� The role of instant feedback in improving student understanding of basic accounting concepts, Rhetoric and Reality: Critical Perspectives on Educational Technology�
Michaelsen, L K� (2004)� Getting started with team-based learning� In L�K� Michaelsen, A B Knight and L D Fink (Eds), Team-based learning: A transformative use of small groups on college teaching, Sterling, Virginia Stylus: 209 – 228�
Michaelsen, L�K�, & Sweet, M� (2008)� The Essential Elements of Team-Based Learning� New Directions for Teaching and Learning, 116, 7 – 21�
Office of Planning and Assessment, Writing and Assessing Course-Level Student Learning Outcomes� Retrieved from https://www�depts�ttu�edu/opa/resources/ docs/writing_learning_outcomes_handbook3�pdf, Accessed 21 January 2017�
Sharma, A� (2011)� Close the lecture theatres, The Age, 25 May�Tobias, S� (1990)� They’re not dumb� They’re different: A new ‘tier of talent’ for science�
Change 22(4): 11 – 30�Williams, J�, & Wong, A� (2009)� The efficacy of final examinations: A comparative study
of closed-book, invigilated exams and open-book, open-web exam� British Journal of Educational Technology, 40, 227�
147New Measures to Improve Korean Culture Education
New Measures to Improve Korean Culture Education for Chinese Students
in South Korea: Focusing on racial differences1
DOI: 10.15804/tner.2017.50.4.12
AbstractTo derive a more effective educational method, racial differences among Chinese students in learning Korean culture was invesigated using a survey method� The Han and Joseon racial groups in China were examined� Before the survey, the Han race students (Chinese students except Joseon race students, in this case) preferred a language and culture teaching method (LCTM), whereas the Joseon race students favored an audiovisual teaching method (AVTM)� However, after experiencing four different teaching meth-ods – comparative-cultural teaching method (CCTM), AVTM, LCTM, and rote memorization teaching method—for two weeks, the Han race students preferred the AVTM more, whereas the Joseon race students preferred the CCTM� Thus, students from the same country require different education methods�
Keywords: Chinese students, culture knowledge, culture teaching methods, Korean culture
1 This work was supported by the Hankuk University of Foreign Studies Research Fund of 2017�
Hyoung-Jin Moon, Jong-ho Nam, Yongdeog KimSouth Korea
Introduction
The number of foreign students studying at universities in Korea increases every year2 (123,462 in April 2017) and the students are mostly Chinese� Since the establishment of Korea-China diplomatic relations, the number of Chinese students, which was initially low, has increased gradually; 56% as of April 2017 (The Ministry of Justice, 2017)� China, being a multi-racial country, comprises 56 races, and therefore the students belong to various racial groups� This study, however, focuses on Han and Joseon race students�
People of the Joseon race moved to China from the Korean peninsula between the late eighteenth and early nineteenth centuries (Han & Gwon, 1994)� They have formed autonomous districts in three provinces (Liaoning, Jilin, and Heilung-kiang) in northeast China (Lee, 1994)� Therefore, the customs and language of the Joseon race is the same as those of Koreans� They even use textbooks written in the Korean language� They are Chinese, but they share great similarity with Koreans� However, regardless of the similarities, the Joseon race students are treated like Chinese students in Korea when organizing educational curricula (Moon, 2013)� Moreover, people of the Han race have superficial knowledge about Korean lan-guage and culture� The Joseon race students learn Korean language and culture at home and from school; therefore, they differ greatly from the Han race students� Nevertheless, how should the students from these two races be taught? Should the same teaching methods be used with them because they are Chinese? Or, should they be taught differently by identifying differences in their awareness of Korean culture?
This study adopts the latter perspective� Despite being Chinese, students from the two races have apparent differences in their prior knowledge and beliefs regarding Korean culture� The Han race students tend to show high interest in Korean culture, influenced by Korean dramas and K-pop, whereas the Joseon race students tend to exhibit a strong desire to find their identity as the Han race and their roots in Korean culture� In addition, they have different motivations for studying in Korea� The Han race students tend to have a high desire to learn Korea’s advanced education, for which they receive economic support from their parents; the Joseon race students, however, do not face difficulties in expressing themselves in the Korean language and seek job opportunities (Moon, 2011)�
2 In 2012, the number of Chinese students was 84,711, which gradually increased to 86,410, 96,357, and 115,927 in 2014, 2015, and 2016, respectively (Monthly statistics published in April 2017 by the Korea Immigration Service)�

149148 New Measures to Improve Korean Culture Education Hyoung-Jin Moon, Jong-ho Nam, Yongdeog Kim
Despite such differences, the same cultural education is offered to both the Han and Joseon race university students in Korea� Consequently, students experience conflicts with their prior knowledge and lose interest in learning, which hampers their learning of Korean culture�
Korean culture refers to all collective phenomena that a single race has gen-erated and developed from the past to the present time� Thus, Korean culture encompasses various fields and serves as a foundation for several academic fields (Moon, 2013)� It can be considered as the most basic element in understanding and communicating with Koreans� If several elements of Korean culture are considered essential Liberal Arts knowledge, Korean culture education is extremely essential for Chinese students in Korea and can be considered a suitable educational field�
However, Korean culture education has been focusing on the Korean language education because it is considered a prerequisite for foreign learners to learn Korean culture� However, when cultural education is provided along with lan-guage education, the effect of language education can be doubled� If we consider language education as a foundation for acquiring a foreign culture, Korean culture education becomes extremely important (Moon, Nam & Kim, 2014)�
Therefore, in this study, Chinese students were classified into two groups (Han and Joseon race) to investigate their level of awareness of Korean culture and derive the most effective educational measures based on the results� Both qualita-tive and quantitative investigations were conducted; four education methods were used to produce data for analyses�
Research Methodology
This study, which lasted for a month (March 10 – 31, 2017), used both quanti-tative and qualitative methods� First, a survey using the qualitative method was administered to 200 Chinese university students studying in Korea (100 students each from the Han and Joseon race)� To investigate students’ preference by their school years, 100 students were selected from freshman and sophomore years and junior and senior years� Moreover, to identify an effective educational method, pre – and post-lecture changes were investigated�
For adequacy, the students’ race was checked beforehand; the students’ parents’ race was also investigated because racial differences between students and parents can influence the result of this study� The students’ educational background before university education was also investigated� Students who graduated from Han and Joseon race schools were selected for this study�
196 students were analyzed, of whom four, with dishonest or erroneous responses, were excluded from the analysis� The quantitative investigation had nine items to investigate the students’ understanding of Korea-China diplomatic relations and overall Korean culture, and the qualitative investigation had eight items to investigate the students’ levels of awareness of Korean culture� Four educational methods—a comparative-cultural teaching method (CCTM), an audiovisual teaching method (AVTM), a language and culture teaching method (LCTM), and a rote memorization teaching method (RMTM)—were derived from the investigations, and they were used to teach the students for 2 weeks� Thereafter, a survey was conducted based on the students’ preferred educational method� After giving lectures using the four education methods, an in-depth observation of the students’ responses was conducted to identify changes�
The survey investigated whether a different educational method should be used depending on the students’ prior knowledge and awareness of Korean culture, even if they are from the same country� This study is based on the assumption that differences in the Han and Joseon race result in differences in the acceptance of Korean culture, eventually determining students’ preference for an educational method� The study emphasizes that foreign students from the same country may have differences in the degree of their exposure to foreign culture, their prior knowledge, and cultural familiarity; therefore, different educational methods should be used accordingly�
Analysis: Level of students’ awareness of Korean culture
Due to the geographical proximity between Korea and China, the two countries exhibit cultural similarities because they share similar religion, philosophy, and customs (Nam, Kim & Kim, 2016)� Does it imply that Chinese students do not need to learn Korean culture? Moreover, despite being Chinese students, if they show different racial tendencies, should they be taught differently? Before taking a different educational measure for different racial students from the same coun-try, this study investigated the students’ basic awareness of Korean culture�
According to Table 1, there is a major discrepancy between the Han and Joseon race students in their prior knowledge about Korean language and culture� The Korean language proficiency was low (62%) for the Han race students and high (92%) for the Joseon race students� The difference is attributable to the influence of their parents and language used at schools (elementary, middle, and high schools)�

151150 New Measures to Improve Korean Culture Education Hyoung-Jin Moon, Jong-ho Nam, Yongdeog Kim
Consequently, the Chinese students had different levels of awareness of Korean culture depending on their race� The Han race students seemed to perceive Korean culture from a China-centered perspective (Kim & Jeong, 2004; Yu, 2005), whereas the Joseon race students emphasized racial similarity between them and Koreans� The students from both races believed that Chinese culture was superior and had a China-centered cultural view, but they had a different attitude toward Korean culture depending on their prior learning level� Regarding the influence of China on Korean culture, the students from both races responded that China affected Korean culture (Han-90%, Joseon-92%) and believed in the similarity between Korean and Chinese culture (Han-86%, Joseon-66%)� However, according to their level of awareness of Korean culture, 81% of the Han race students responded that they did not know Korean culture very well, whereas 89% of the Joseon race
students responded that they knew Korean culture very well, indicating a great discrepancy between the two races�
Nevertheless, where does this discrepancy stem from? To check the origin, the cultural education situation was investigated, revealing that the Han race students identified a difference between the learning content of Korean culture in China and Korea (67%) and between Korean and Chinese education (61%)� However, the Joseon race students identified no difference in both textbooks (57%) and edu-cation (59%)� Thus, the discrepancy between the two races is attributable to dif-ferences in the content of textbooks and in educational methods; namely, Korean students and Joseon race students study from cultural textbooks that emphasize the superiority of their own race (Kim, 2005)� Such discrepancies affects students’ learning attitude toward Korean culture, and therefore the Han race students had low curiosity about Korean culture compared to the Joseon race students�
To investigate the students’ level of awareness of Korean culture in depth, 80 Chinese students (40 each from Han and Joseon races) were selected and a quali-tative investigation was conducted; the students’ responses to the following eight questions were analyzed�
Table 2. Interview on overall Korean culture (n = 80)
QuestionHan Race Joseon Race
Correct Answer
Incorrect Answer
Correct Answer
Incorrect Answer
1� The traditional wedding ceremony of Koreans� 15% 85% 86% 14%2� The meaning of Korean traditional wedding
ceremony�10% 90% 55% 45%
3� The most preferred funeral ceremony of Kore-ans�
64% 36% 73% 17%
4� Why do Koreans cry aloud when a person dies? 13% 77% 33% 67%5� How many times do Koreans bow at an ances-
tral ritual?9% 81% 35% 65%
6� How many times do Koreans bow to their par-ents on New Year’s day?
48% 32% 75% 25%
7� What is the traditional religion of Koreans? 17% 83% 30% 70%8� What is the meaning of the Korean national
flag?19% 81% 43% 57%
According to Table 2, the students’ awareness of Korean culture differed accord-ing to race� According to the rate of correct responses, the level of awareness of the Han race students was 25%, whereas that of the Joseon race students was 50%�
Table 1. Level of general knowledge about Korean culture among Chinese students (Han/Joseon race) (n = 196)
Question Race 1
Very Much
2 Some-what
3Not
Much
4 Little
1� China influenced Korean culture greatly� Han 54% 36% 10% -Joseon 48% 44% 8% -
2� There are differences between Korean and Chinese cultures�
Han 7% 17% 48% 28%Joseon 8% 26% 44% 22%
3� I have a high awareness of Korean culture� Han 8% 11% 62% 19%Joseon 62% 27% 11% -
4� I have good Korean language proficiency� Han 8% 30% 45% 17%Joseon 75% 17% 8% -
5� There is a difference between Korean and Chinese culture education�
Han 18% 43% 19% 20%Joseon 21% 20% 36% 23%
6� There is a difference between what you learned about Korean culture in China and what you learned in Korea�
Han 22% 45% 20% 13%Joseon 20% 23% 36% 21%
7� I am interested in learning about Korean culture�
Han 5% 15% 53% 27%Joseon 17% 48% 23% 12%
8� I like Korean culture� Han 14% 28% 46% 12%Joseon 44% 24% 22% 10%
9� I want to learn about Korean culture� Han 18% 24% 46% 12%Joseon 24% 32% 34% 10%

153152 New Measures to Improve Korean Culture Education Hyoung-Jin Moon, Jong-ho Nam, Yongdeog Kim
For questions 1 – 5 on the rites of passage, the Joseon race students had a higher rate of correct responses (60%), compared to that of the Han race students (20%), highlighting a great discrepancy between the two groups�
Such a tendency, apparently, reflects the Joseon race students’ prior learning of Korean culture (Hwang, 2002)� For the questions on the meaning of Korean wed-ding customs and attire, the Han race students provided all incorrect responses, whereas the Joseon race students provided all correct responses; responses to the questions on the attitude of Koreans toward death and ancestral worship had the same results� This also reflects the students’ learning at home and school (Choi, 2005)� Such incorrect responses might have been given because the Han race students viewed Korean wedding according to their own wedding customs� In China, after marriage, the bride goes to the bridegrooms’ house, and therefore the Han race students could not understand an ancient Korean custom where the groom goes to the bride’s house (Moon, 2005)� Thus, the Joseon race students were aware of this Korean custom because of their prior learning, whereas the Han race students understood Korean culture from their China-centered viewpoint�
Nevertheless, not all the Han and Joseon race students had different results� To questions regarding Korean traditional religion and the number of bows offered at ancestral rituals, all the respondents responded incorrectly� Despite belonging to the same cultural area, both the Han and Joseon race students responded incor-rectly to questions regarding customs that are no longer practiced or those of which they did not have prior knowledge� However, regarding the custom of New Year’s greeting that is currently practiced, both race students responded correctly� For the question about the meaning of the Korean national flag, both Han (81%) and Joseon (57%) race students responded incorrectly�
According to the qualitative investigation, the Han race students tended to view Korean culture from the perspective of Chinese culture, and the Joseon Race students also did not know the specifics of Korean culture very well� In other words, the Han race students’ China-centered cultural viewpoint and the Joseon race students’ preconception that they know Korean culture very well hampered their understanding of Korean culture (Moon, 2012)�
Based on the level of the two races’ awareness of Korean culture, this study attempted to explore a more effective educational method� Table 3 presents the results of an education method that is considered most effective in the process that Chinese students accept Korean culture�
In the case of the Han race students, because of their low level of Korean lan-guage proficiency, they believed that the LCTM was the most effective (35%), whereas the Joseon race students (42%) preferred the AVTM, which provided
a visual effect� In other words, the Han race students believed that learning both Korean culture and language was more effective� However, the Joseon race students with high Korean language proficiency believed that a more animated educational method was effective� Table 4 presents the results of a survey on preferred educational methods by university year�
Table 4. Which educational method do you prefer the most? (n = 196)
CategoryHan Race Joseon Race
1st-2nd year 3rd-4th year 1st-2nd year 3rd-4th yearCCTM 30% 31% 41% 48%AVTM 28% 33% 43% 33%LCTM 34% 26% 12% 14%RMTM 8% 10% 4% 5%
Among the Han race students, the initial year students (1st-2nd year) preferred the LCTM (34%) the most, whereas the higher year students (3rd-4th year) pre-ferred the AVTM (33%) the most� In the case of the Joseon race students, the initial year students (1st-2nd year) preferred the AVTM, whereas the higher year students (3rd-4th year) preferred the CCTM, which helped them identify the differences between the two cultures� In other words, the students who did not have good Korean language proficiency tended to learn Korean culture to master the Korean language, whereas those who had good Korean language proficiency preferred an educational method that showed interesting videos while teaching differences in cultures�
According to the results of such surveys, cultural education cannot be sep-arated from language education for foreigners� In the case of higher level of language education, video materials are more effective in terms of a comparative approach�
Table 3. Which educational method do you believe is the most effective for you? (n = 196)
Category Han Race Joseon RaceComparative-cultural teaching method (CCTM) 29% 40%Audiovisual teaching method (AVTM) 31% 42%Language and culture teaching method (LCTM) 35% 10%Rote memorization teaching method (RMTM) 5% 8%

155154 New Measures to Improve Korean Culture Education Hyoung-Jin Moon, Jong-ho Nam, Yongdeog Kim
Results: The most effective educational measure
To identify the most effective educational method and the process of change induced by the most preferred educational method, four kinds of educational methods were implemented for 2 weeks between April 17 and 28, 2017� The par-ticipating students were divided into Han and Joseon races and further into initial year students and higher year students; 44 students were assigned to each of the four groups� The four teaching methods were implemented and four topics were used for each educational method; moreover, 2-hour lectures were given�
For example, for the CCTM, 2-hour lectures were given on the topics of the wedding system, funeral customs (burial and cremation), ancestral rites (presided by son or daughter), and ancestral worship, highlighting the similarities and dif-ferences between the two countries� For the AVTM, four topics – the meanings of wedding attire and numbers, differences in preferred colors, Byeong-in yangyo (French campaign against Korea), and the Opium War (Invasion by the British Army) were selected and videos on each topic were presented; the effects of the educational method were evaluated�
For the LCTM, the topics of folk tales, adage, songs, and dramas were used� Folk tales used the two countries’ foundation mythology, adage used the content of man and woman discrimination, songs used the content of K-pop and Chinese songs and dramas used words used in lyrics to explain the difference and similarity between the two cultures�
Finally, for the RMTM, the change of dynasties, diversity of religion and philosophy, and changes of political systems were introduced� For 2 weeks, four teaching methods were used for 32 hours to introduce Korean culture� After the implementation, the students selected the most effective education methods�
Table 5. Which educational method do you believe is the most effective for you? (n = 196)
CategoryHan Race Joseon Race
B A B ACCTM 29% 33% 40% 49%AVTM 31% 36% 42% 39%LCTM 35% 27% 10% 9%RMTM 5% 4% 8% 3%
Note: Before survey = B; After survey = A
The results reveal that the educational methods previously preferred by the Han and Joseon race students changed after the implementation; before, the Han race students preferred the LCTM (35%), but after the implementation, they believed the AVTM was more effective (36%)� The Joseon race students’ preference also changed from the AVTM (42%) to the CCTM (49%)� Such changes were also identified by school year� The initial year students changed their preference after implementation, whereas the higher year students did not�
Table 6. Which educational method do you prefer the most? (n = 196)
CategoryHan Race Joseon Race
1st-2nd year 3rd-4th year 1st-2nd year 3rd-4th yearB A B A B A B A
CCTM 19% 30% 32% 30% 33% 42% 35% 46%AVTM 34% 42% 43% 45% 38% 34% 33% 32%LCTM 37% 23% 17% 22% 25% 20% 27% 19%RMTM 10% 5% 8% 3% 4% 4% 4% 3%
Note: Before survey = B; After survey = A
The initial year (1st-2nd year) Han race students preferred the LCTM before implementation, but favored the AVTM (42%) after implementation� However, their higher year (3rd-4th year) counterparts preferred the AVTM both before and after implementation� In addition, the initial year (1st-2nd year) Joseon race stu-dents preferred the AVTM (38%) before implementation, but favored the CCTM after implementation� However, their higher year (3rd-4th year) counterparts preferred the CCTM both before and after implementation�
Thus, the results revealed that the Han race students focused on learning the Korean language in their initial years of university and preferred an education method that induces interest as they progressed to higher years� By contrast, the Joseon race students preferred the AVTM during their early years, but preferred the CCTM, which facilitates in-depth study of Korean culture in later years�
Among the Chinese students, the Han race students admitted that they expe-rienced difficulties in accepting Korean culture due to conflicts with their prior knowledge that they had acquired (the result of qualitative investigation)� In other words, China-centered cultural education and Sinocentrism hampered their understanding of the culture of the surrounding countries (Oh, 2001; Park, 2003)� Therefore, the Han race students wanted to learn the Korean language initially, but later they became interested in Korean culture after the implementation of their
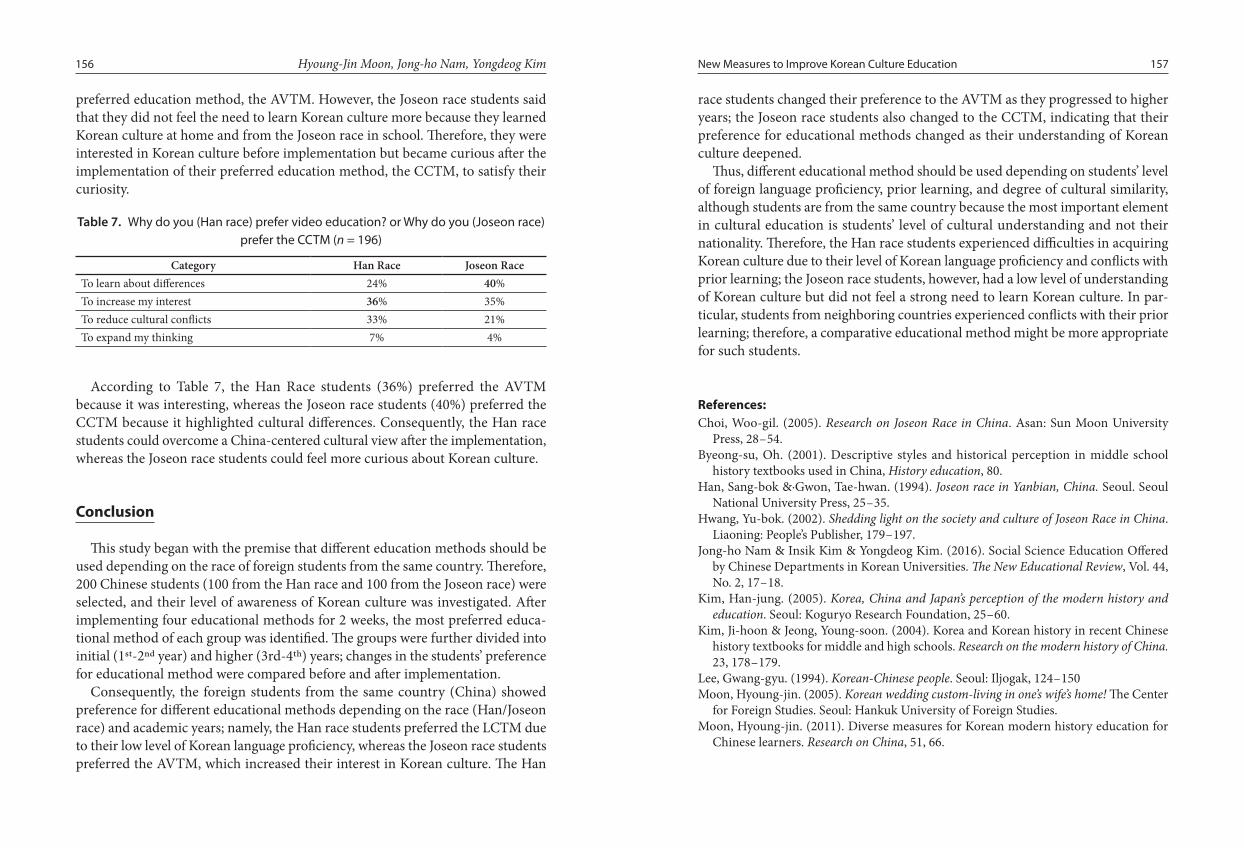
157156 New Measures to Improve Korean Culture Education Hyoung-Jin Moon, Jong-ho Nam, Yongdeog Kim
preferred education method, the AVTM� However, the Joseon race students said that they did not feel the need to learn Korean culture more because they learned Korean culture at home and from the Joseon race in school� Therefore, they were interested in Korean culture before implementation but became curious after the implementation of their preferred education method, the CCTM, to satisfy their curiosity�
Table 7. Why do you (Han race) prefer video education? or Why do you (Joseon race) prefer the CCTM (n = 196)
Category Han Race Joseon RaceTo learn about differences 24% 40%To increase my interest 36% 35%To reduce cultural conflicts 33% 21%To expand my thinking 7% 4%
According to Table 7, the Han Race students (36%) preferred the AVTM because it was interesting, whereas the Joseon race students (40%) preferred the CCTM because it highlighted cultural differences� Consequently, the Han race students could overcome a China-centered cultural view after the implementation, whereas the Joseon race students could feel more curious about Korean culture�
Conclusion
This study began with the premise that different education methods should be used depending on the race of foreign students from the same country� Therefore, 200 Chinese students (100 from the Han race and 100 from the Joseon race) were selected, and their level of awareness of Korean culture was investigated� After implementing four educational methods for 2 weeks, the most preferred educa-tional method of each group was identified� The groups were further divided into initial (1st-2nd year) and higher (3rd-4th) years; changes in the students’ preference for educational method were compared before and after implementation�
Consequently, the foreign students from the same country (China) showed preference for different educational methods depending on the race (Han/Joseon race) and academic years; namely, the Han race students preferred the LCTM due to their low level of Korean language proficiency, whereas the Joseon race students preferred the AVTM, which increased their interest in Korean culture� The Han
race students changed their preference to the AVTM as they progressed to higher years; the Joseon race students also changed to the CCTM, indicating that their preference for educational methods changed as their understanding of Korean culture deepened�
Thus, different educational method should be used depending on students’ level of foreign language proficiency, prior learning, and degree of cultural similarity, although students are from the same country because the most important element in cultural education is students’ level of cultural understanding and not their nationality� Therefore, the Han race students experienced difficulties in acquiring Korean culture due to their level of Korean language proficiency and conflicts with prior learning; the Joseon race students, however, had a low level of understanding of Korean culture but did not feel a strong need to learn Korean culture� In par-ticular, students from neighboring countries experienced conflicts with their prior learning; therefore, a comparative educational method might be more appropriate for such students�
References:Choi, Woo-gil� (2005)� Research on Joseon Race in China� Asan: Sun Moon University
Press, 28 – 54�Byeong-su, Oh� (2001)� Descriptive styles and historical perception in middle school
history textbooks used in China, History education, 80� Han, Sang-bok &·Gwon, Tae-hwan� (1994)� Joseon race in Yanbian, China. Seoul� Seoul
National University Press, 25 – 35�Hwang, Yu-bok� (2002)� Shedding light on the society and culture of Joseon Race in China�
Liaoning: People’s Publisher, 179 – 197�Jong-ho Nam & Insik Kim & Yongdeog Kim� (2016)� Social Science Education Offered
by Chinese Departments in Korean Universities� The New Educational Review, Vol� 44, No� 2, 17 – 18�
Kim, Han-jung� (2005)� Korea, China and Japan’s perception of the modern history and education� Seoul: Koguryo Research Foundation, 25 – 60�
Kim, Ji-hoon & Jeong, Young-soon� (2004)� Korea and Korean history in recent Chinese history textbooks for middle and high schools� Research on the modern history of China. 23, 178 – 179�
Lee, Gwang-gyu� (1994)� Korean-Chinese people� Seoul: Iljogak, 124 – 150Moon, Hyoung-jin� (2005)� Korean wedding custom-living in one’s wife’s home! The Center
for Foreign Studies� Seoul: Hankuk University of Foreign Studies�Moon, Hyoung-jin� (2011)� Diverse measures for Korean modern history education for
Chinese learners� Research on China, 51, 66�
158 Hyoung-Jin Moon, Jong-ho Nam, Yongdeog Kim
Moon, Hyoung-jin� (2012)� The necessity and effectiveness of Joseon history education for Chinese students in Korea� Research on China, 54, 66�
Moon, Hyoung-jin� (2013)� Improvement of the diversity of Korean history education measures for Chinese students in Korea� Research on history & culture, 45, 300 – 301�
Moon Hyoung-jin & Nam Jong-ho & Kim Yongdeog� (2014)� New Measures for the Improvement of History Education for Chinese Students in South Korea. The New Educational Review, Vol� 37, No� 3, 54 – 55�
Park, Jang-bae� (2003)� Education of Chinese modern history and the identity of the Republic of China 2: Focusing on the integration of people during the era of People’s Republic of China� Research on the modern history of China, 20�
The Ministry of Justice, Republic of Korea� (2017)� The Immigration Office Policy for foreigners Monthly Statistics� Seoul: Ministry of Justice�
Yu, Young-tae� (2005)� Perception of Korean history and Sino-centrism in Chinese university history textbooks� China’s Northeast Project and the Chinese Nationalism� Seoul: Kogu-ryo Research Foundation�

The Educational Significance of Art – a Report from Experimental Research
DOI: 10.15804/tner.2017.50.4.13
AbstractThe aim of the article is to present a strategy of the educational use of art in primary school grades 1 – 3� The strategy is being implemented in the form of a pedagogical innovation in a school in the Silesian province� It is based on joint perception of a work of visual art and musical material as well as artistic and kinaesthetic creative activity evoked by this perception� The text includes a presentation of individualising pilot experimental studies of a selected case�
Keywords: art, strategy of education, primary school
Introduction
Establishing contact with art is an ever-open-ended activity, for we are incapa-ble of ever attaining complete knowledge about it� ”There are always new things to discover� Great works of art seem to look different every time one stands before them” (Gombrich, E�H�, 1978, p� 33)� These are cases of the influence of art1, the first field used in education and considered in terms of reception� It is then that the perceiving subject creates a relation between art and its own needs� These are
1 The meaning of art in the life of a human being is a subject I discuss extensively in: Katarzyna Krasoń, Ludwika Konieczna-Nowak (2016)�
Katarzyna KrasońPoland

161160 The Educational Significance of Art Katarzyna Krasoń
the student becomes a creator� The second field – educating through art, which appears in the context of general education, corresponds well to the anthropo-logical understanding of art, which places its origin in a human being’s intrinsic, psychobiological ability to “artify” (Dissanayake E�, 2001)� This ability results from a naturalistic, specifically Darwinian view of art called adaptation, which considers art as a psychobiological ability innate in the human species� I believe that adaptation, seen in anthropological terms, does not embrace all aspects in which the creator might benefit from creating� The reason for my belief is that such adaptation fails to include all aspects of transgression, i�e� reaching beyond one’s abilities�
J�S� Bruner lists stimulating conditions for creative activity, which can be treated as guidelines in designing occasions for this type of activity for early-school-aged pupils� These are: entering deep into one’s individuality, readiness to depart from the obvious, detaching oneself from existing forms, freedom to subordinate one-self to the object of creation, and finally an emotional attitude to and spontaneity of acting (Bruner J�, 1973, pp� 208 – 217)�
This study is an attempt at establishing a possible strategy for organising the process of actualisation of pupils’ creative potentiality� The stimulating situation is going to be based on working with a work of visual art and a quasi-theatrical activity drawing from this work of art� The strategy relies on the inclusion of an education that creates an integral mixture of different art fields� In my opinion, such an education ought to be applied to the youngest, we must begin as early as possible, i�e� as early as the pre-school and primary school grades 1 – 3�
A model of classes based on educating with art and educating through art
As mental representations are rooted in perceptive, motor, and affective expe-riences, the scope of the classes is going to include all these types of experience� The form of the classes is flexible and their respective elements are modifiable and interchangeable� The whole procedure is the basis for a pedagogical innovation consisting of an experiment carried out by the Department of Child Creativity and Expression Pedagogy, University of Silesia in Katowice� The experiment is carried out within the framework of the “Actualisation of modal and creative potentialities as key competences through integral cultural expression placed in visual arts in 1 – 3-grade pupils” project in cooperation with Primary School No� 1 in Mysłowice (Ministry of Education decision No� DKOW�WEPW�5019�15�20140)�
mainly, but not exclusively, aesthetic needs, for the subject’s analysis of art is based on a hermeneutic reading of the message coded in signs�
If we do want to point to the importance of art as it is perceived and utilised in personality-building by pupils, it might be beneficial to reach for the thought of Hans-Georg Gadamer, who writes that an encounter with a work of art is “being struck with the truth” present in the work� Within this experience, a revelation of its own kind takes place� This revelation carries a principal message of actu-alisation� Gadamer claims that a work of art tells us “you need to change your life” (as cited in: Pawliszyn A�, 2008 – 2009, p� 127)� Thus, the reflection that takes place in the face of a work of art is beneficial for self-understanding and conscious decision-making, including change-related decisions�
As a work of art is an event constantly taking place in the perceiver’s eyes (cf�, Bal M�, 1999), it is a virtually unlimited base for its experiences� While these expe-riences are read subjectively, they are intersubjectively marked by means of their multiplication� A work of art does not “tell its story” itself (Gombrich as cited in: D’Alleva A�, 2005, p� 108)� To reveal its meaning it needs to lend itself to reception, which means it requires an audience to invest it with meaning� For this reason, a work of art is always a space for intersubjective interpretation, an interpretation that negotiates with the artist, with convention, and with the recipient’s horizon (it is a subject I discussed in greater detail in: Krasoń K�, 2016)�
Reception of art is transferred along channels other than perception and it requires more than mere knowledge, for in a situation of reception experiencing emotions and being moved are states appearing simultaneously� Irena Wojnar stresses that “organising individual, synthetic and dynamic, aesthetic experiences might become a basis for enriching a human being’s integral personality� Such enrichment leads to an enhancement of their creative abilities, which are in turn expressed in the attitude towards making their life better and fuller, as well as towards outer reality� A human being might themselves remain as they are and become a creator of outer reality, or become a creator of themselves” (1966, p� 257)� Perception of art is, therefore, a process allowing for an aesthetic experience (Ingarden R�, 1960, pp� 289 – 313)� Through symbolic messages and stories told, it reaches what is located in a human being’s horizon, in their multidimensional experience (Dewey J�, 1980) they gain throughout their life� We might say that “art teaches one to see the surrounding reality” (Kukuła E�, 2006, p� 196) and allows one to orient oneself in this reality�
Another dimension of art in education is making art� In such cases we talk about the second field of using art in education – acting through art, which introduces the creative element� In this field, by undertaking expressive activity,

163162 The Educational Significance of Art Katarzyna Krasoń
emotion, has to be experienced through the body in order to be experienced at all (Shusterman R�, 2006)� “Somaesthetics can be provisionally defined as the critical, meliorative study of the experience and use of one’s body as a locus of sensoryaes-thetic appreciation (aisthesis) and creative self-fashioning” (Shusterman R�, 1999, p� 302)� A� Wańtuch (Wańtuch A�, 2011, pp� 58 – 60) goes further and claims that thinking without the aid of the body is impossible�
The experimental sessions finish with children performing the short scenes they have prepared� It is during this phase that the pupils perform the rediscovery of meaning, enabling associations and comparing their reading of the inductive material (paintings and music) with that of their classmates� Every concept is accepted, we need to appreciate especially the originality of ideas and openness to other persons’ different views�
As stated before, the classes might be fragmentarily modified� Sometimes they are divided into two or three meetings, but either way, they always begin with reminding children about the inspiration�
The strategy of creative play enables real contact with works of art� Children become familiar with contemporary artists’ paintings and listen to the music which facilitates such a perception� The result of experiencing and interpreting the perceived works is the children’s creation of their own artistic utterance, original and independent of any external support� The pupils learn the language of art and fully employ their artistic potential�
Empirical implication – case study – individualising study
The aim of the study was to establish the effectiveness of the strategy of edu-cating with art and through art� The findings are the result of an individualising experiment2, an approach informed with a conviction that “every living creature is (…) a unique individuality” (Kępiński A�, 2015, p� 314)� Thus, if we aim at learning something about the human being, or, as is the case in the present study, at recog-nising the range of the actualisation of the pupil’s potential when they are exposed to an educational method, it can be easily observed that we ought to consider their uniqueness viewed from the position of complete focus on the person� Therefore, the study will consist in a case study viewed as an exemplification of the change in the person’s functioning from a qualitative perspective�
2 The method of the study described in Krasoń K�, Konieczna-Nowak L� (2016)�
The classes are divided into two major phases� The first one utilises an encoun-ter with art in the form of visual (painting) and auditory (music) perception� The paintings presented in class are of the surrealist genre, by e�g� René Magritte, Salvador Dali, and Vladimir Kush, while the musical material is taken mostly from film soundtracks by contemporary composers, including Abel Korzeniowski, Hans Zimmer, and Alexandre Desplat� The choice of film scores was not accidental, as they are a medium for rather plain emotions, which allows for a non-ambiguous composition of tales based on pupils’ readings and interpretation of the visual material�
Joining picture and sound simultaneously allows for a redundancy of coding to occur� Allan Paivio (1986) maintains that pictorial and auditory content in memory is stored in two systems exhibiting specific modality� Mental representa-tions are in turn rooted in perceptive, motor, and affective experiences, which is significant for the present model� Therefore, there seems to be a purpose to a doubling of induction by means of joining picture and music, for “the factor which considerably modifies the effects of memory is the number of codes a stim-ulus evokes” (Dylak S�, 1995, p� 50)� It is also a good idea to create an opportunity for stimulation of the greatest possible number of sensory channels by means of the multisensory activation of pupils’ activity – VAKT (Krasoń K�, Jaszczyszyn E�, 2006, p� 626)� In such situations the whole brain is used and neural networks are more easily covered with myelin, which leads to greater transmission speed�
Another phase of the lesson is the co-operative creation of a scenario for a story based on children’s associations and imaginations evoked during the 1st, receptive, phase� The core element of this phase is the negotiation of meanings within the group of cooperating pupils� We are aiming at a situation where all children’s ideas are included in the story� What we find important is communication, adopting different points of view, but also the skill of self-presentation� Initially, this phase requires the teacher to participate mainly as an agent maintaining order in children’s proceedings� Later on, however, the need for such a presence proves to decrease� Such a decrease is the main educational gain, as it tells us that children learn how to interpret pictures intersubjectively by means of the story scenario they draw together�
The last phase of the classes is yet another instance of decoding/encoding� This time the process is intersemiotic, visual signs are translated into bodily ones, accompanied by the music from the inspirational phase� The meaning of bodi-ly-motor expression, which is an element of expressing oneself in the language of art, combined with perception is perfectly grasped by Richard Shusterman in his idea of somaesthetics. He writes that the emotional value of art, as any other
165164 The Educational Significance of Art Katarzyna Krasoń
them, due to quick loss of concentration� One can observe significant motor activity resulting from high levels of arousal and a lack of ability to focus attention on the story being created for a longer time� When the teacher3 makes him an important character in a theatrical scene (he is to be a captain), his motivation for performing the task carefully can be observed� However, he begins to exhibit behaviour directed against his classmates (trying to move them – sometimes by pushing), which is the first time he shows initiative� Unfortunately, he quickly loses motivation and begins to concentrate exclusively on attacking classmates, this time with no connection to the plot of the scene; he falls and rolls across the floor�
• VerbalisationThe utterance is cursory; it contains only isolated words or a few simple sen-
tences� Only one element of the pictures is being referred to in detail� During the discussion of his group’s story, he begins to speak before his teammates, but after a short while he asks somebody else to take over�
• Pre-test remarksThe boy shows no particular involvement in creative activities – either artistic,
or kinaesthetic ones� He needs much attention and wants to be made special� If he fails to achieve that, he loses interest in an activity and does not try to act divergently�
2) Post-test session (after a year-long implementation of the strategy) modified musical inspiration Gerry Goldsmith’s “Chinatown” film soundtrack (Love Theme)
• Perception of the work of artWhile listening to and watching the presentation, the boy sits next to the
teacher� He tries to concentrate, although some motor activity can be observed, nonetheless limited to fine motor skills� He also asks the teacher questions (about what is going to happen next)�
• Team drawingWhen the teacher asks pupils to create groups, the boy becomes excited, he runs
around the room searching for his friends, he starts jumping once his group has been assembled� He is visibly cooperation-oriented� Furthermore, once the teacher encourages him to do it, he assists in distributing sheets of paper and coloured pencils�
When the group begins to draw, he focuses on others’ activity� He asks his classmates what they are going to do; he wants to know it immediately� He speaks
3 The classes were taught by the author of the presented study�
The experimental factor (independent variable) in the present study are classes based on a model using modern art and the child’s activity based on art, which is meant to activate the studied pupil’s creative potentiality� This potentiality will be analysed as an dependent variable�
The focal point of learning about a child’s actions in class and of the individual-ising verification of the strategy’s efficiency was the technique of collecting data in the form of observation (Angrosino M�, 2007, pp� 53 – 63)� Such an act of perceiv-ing the pupil’s reactivity, their ideas and ways of interacting with other members of their own group and members of other groups will enable an establishment of change in the pupil’s actualised potentiality�
Case study: a seven-year-old boyA boy with motor hyperactivity, having difficulty focusing on tasks� He has
a need to draw attention, sometimes directly by asking questions to the person conducting the class� He demands acceptance, pays less attention to other pupils�
1) The pre-test session was inspired by a set of surrealist paintings, opened to the meanings assigned to them by children, together with John Williams’s “Jurassic Park” film soundtrack�
• Perception of the work of artDuring the inspiration phase the boy looks at the pictures only for a short
while� He performs a number of strange and unnecessary movements� He pats his cheeks, bites his fingernails, crawls, and changes the place he sits in� He makes comments, but they are rather loosely related to the content of the pictures� While children verbalise their observations and associations evoked by the pictures being presented, the case in question imitates playing and the sounds of a trombone� He focuses exclusively on this imaged element, as if he has not taken note of other visualisations�
• Team drawingThe boy quickly finds a group of classmates to cooperate with while drawing
a picture serving as the scenario for their own story� He would like to be the leader of the group, but he seems to lack ideas of what to draw, so other members of the group take initiative� Once everybody has finished drawing and their works are being collected, he tries, no more cooperating with his classmates, to draw something of his own�
• MovementDuring the kinaesthetic activities, the boy does not contribute his own ideas� He
willingly participates in tasks created by others, although he is unable to complete

167166 The Educational Significance of Art Katarzyna Krasoń
of educating with art and through art proved especially important for the social potentiality of the case being studied�
Closing remarks
To conclude the attempt at establishing the role of art in education, I must stress the need for thinking about enculturation as a real procedure, routinely and consciously implemented at school� It should consist of providing the pupils with knowledge and tools necessary for orientation in artistic heritage, broadly understood� Thus, we ought to talk about well-organised education through or with art that includes creating proper conditions for the students to satisfy their needs by means of the form or expression they discover or create, which has been evoked with works and phenomena perceived� Aiming at that, we should focus especially on the process of actualising the pupil’s individual, aesthetic and creative potentiality� The pedagogical significance of the strategy of working with a small child is seen particularly in the dimension of interpersonal flow, i�e� stimulation of the development of socialisation�
Art, being synonymous with integral action, perfectly combines with class actions� The classes are filled with varied activities� One can observe communi-cation exercises, pupils’ speech and conceptual range are being developed, and aesthetic sensitivity is being stimulated� Thus, education with art and through art achieves the integral actualisation of the pupil’s potentiality�
The first observations made in class bring about reflections related especially to stimulating the participating pupils’ social competences, but also their levels of divergence and, especially, their greater courage in situations of self-presentation, expressing their own opinions and improving the way they are verbalised� Educa-tion through art enables holistic development of children’s potentiality, which is probably the strongest argument in favour of using it in Polish schools�
ReferencesAngrosino M�, (2007), Doing Ethnographic and Observational Research, SAGE Publica-
tions, London Bal M�, (1999), Quoting Caravaggio: Contemporary Art, Preposterous History, Cambridge
University Press, CambridgeBruner J�S�, (1973), The Conditions of Creativity, [in:] Bruner J�S�, Beyond the Information
Given. Studies in the Psychology of Knowing, W�W� Norton & Co Inc, New York
more than he draws, although the verbalisation is convergent with the themes in the paintings of the inspiration phase� After a short while he begins to draw himself and creates something his classmates like (falling squares)� Nonetheless, having drawn one square, he passes his pencil to a classmate, asking “show me the squares”� Concentrating on the activity, he carefully watches his classmate drawing� He tries to join the drawing once he has made sure that his square is a proper one� He cooperates and does not interrupt other team members� After the collective work is done, he grabs the picture wanting to discuss it�
• MovementThe boy recreates elements of the drawing, keeps connecting with his group� He
does not want to modify respective scenes, he wants to recreate “as it was before”� He becomes attached to solutions, lacks flexibility of ideas� Once praised for something, he becomes fixated on repeating that element� When the kinaesthetic presentation has begun, he shows other children what they should do� When his classmates stop listening to him, he begins to jump, dance, spin around, and finally lies on the floor� His hyperactivity increases when other children want to play important characters as well� When the scene is to be finalised, he argues with the teacher, calling “it wasn’t meant to be like that”� One can easily observe his satisfaction derived from playing a leading part in a kinaesthetic scene� Such a situation is mobilising and it enables initiative, although the initiative is still tightly linked to the drawing�
When the boy loses a privileged position, his hyperactivity begins to show again� However, he does not lose interest in the composition of the kinaesthetic story�
• VerbalisationThe utterance has certain new and original components� However, once the
originality has been recognised, the pupil ceases to look for new solutions and keeps talking about what has already been approved�
3) Observation conclusionsAnalysis of pre-test and post-test sessions shows a change in the boy’s behav-
iour� His involvement in classes increased� Although it was still difficult for him to control his kinaesthetic hyperactivity, it was less expansive and caused less disruption in group activities� It was important for the boy to play a significant part� Distinction stimulated his activity, including creative activity, although this particular type was manifested mainly in verbalisation� His physicality consti-tuted a mimesis of the content of previous narration� The greatest progress could be observed in his social functioning� The boy’s self-assurance translated into courage in interactions with the teacher� One can therefore infer that the strategy

168 Katarzyna Krasoń
D’Alleva A�, (2005), Methods and Theories of Art History, Laurence King Publishing, London
Dewey J�, (1980), Art as Experience, A Perigee Book, New YorkDissanayake E�, (2001), Kunst als menschliche universalie: Eine adaptionistische betrach-
tung, [in:] Peter M� Hejl (ed�), Universalien und konstruktivismus, Suhrkamp Verlag Frankfurt Am Main
Dylak S�, (1995), Wizualizacja w kształceniu nauczycieli [Visualisation in teacher educa-tion], Wydawnictwo Uniwersytetu A� Mickiewicza, Poznań
Gombrich E�H�, (1978), The Story of Art, Phaidon, London Ingarden R�, (1960), Aesthetic experience and aesthetic object, “Philosophy and Phenome-
nological Research”, No� 21 (3) Kępiński A�, (2015), Rytm życia [Rhythm of life], Wydawnictwo Literackie, Kraków Krasoń K�, (2016), O zachwycie sztuką doświadczaną. Pomiędzy „sztucznym fiołkiem”,
zdumieniem a przeżyciem nie tylko w edukacji, [About delight in experimental art� Between an “artificial violet”, amazement and experience not only in education] [in:] A� Rzymełka-Frąckiewicz, T� Wilk (ed�), Edukacja, kultura i sztuka – spoistość a integracja, [Education, culture and art – cohesion and integration], Wydawnictwo Uniwersytetu Śląskiego, Katowice
Krasoń K�, Konieczna-Nowak L�, (2016), Sztuka – terapia – poznanie. W stronę podejścia indywidualizującego w badaniach muzykoterapeutycznych [Art – therapy – cognition� Towards the individualizing approach in music therapy research], Wydawnictwo Nau-kowe PWN, Warszawa
Krasoń K�, Jaszczyszyn E�, (2006), Early education and inclusion in Poland, “Early Child Development and Care”, No� 6, Vol� 176
Kukuła E�, (2006), Miejsce wychowania przez sztukę w kształceniu ogólnym [Place of educa-tion through art in general education], [in:] Irena Wojnar (ed�), Edukacja i kultura. Idea i realia interakcji [Education and culture� The idea and reality of interaction], Polska Akademia Nauk, Kancelaria Komitetu Prognoz “Polska 2000 Plus”, Warszawa
Paivio A�, (1986), Mental representations: a dual coding approach, Oxford University Press, Oxford
Pawliszyn A�, (2/2008 – 1/2009), Transgresywne aspekty dzieła sztuki [Transgressive aspects of a work of art�], “Estetyka i Krytyka”, No� 15/16
Shusterman R�, (2006), Thinking Through the Body. Education for the Humanities: A Plea for Somaesthetics, a paper read during 1st Polish Aesthetic Congress “Visions and re-vi-sions”, Kraków 21 – 24 September (author’s own materials)
Shusterman R�, (1999), Somaesthetics: A Disciplinary Proposal, “The Journal of Aesthetics and Art Criticism”, Vol� 57, No� 3
Wańtuch A�, (2011), Taniec jako sztuka somaestetyczna par excellence� Rekonstrukcja filozofii Richarda Shustermana w kontekście tańca [Dance as somaesthetic art par excel-lence� Reconstruction of Richard Shusterman’s philosophy in the context of dance], “Kultura Współczesna”, No� 3
Wojnar I�, (1966), Perspektywy wychowawcze sztuki [Educational prospects of art], Nasza Księgarnia, Warszawa

The Use of E-learning Resources by Academic Teachers – a Polish-Czech Comparative Study
DOI: 10.15804/tner.2017.50.4.14
AbstractThe article is a result of the collaboration between Polish and Czech scientists who explore the issues of applying resources from the e-learning environment by academic teachers� The presented study was conducted in 2015 – 2016, within the project IRNet – International research network for study and development of new tools and methods for advanced pedagogical science in the field of ICT instruments, e-learning and intercultural competences. The research was aimed at learning academic teachers’ opinions on their own skills and possibilities of using various resources from the e-learning environment, as well as the ways in which they apply information and communication technologies in the educational process�
Keywords: tertiary education, academic teachers, distance learning, e-learning resources, comparative study
Introduction
As educational institutions and universities react to the development of mod-ern educational technologies and of educational and learning theories, a higher level of ICT literacy of students – secondary school graduates or people who already work – who start university education is demonstrated by their higher expectations concerning teaching methods and the organization of studies (mainly the use of current ICT technologies)� When dealing with the above-men-
Ewa Ogrodzka-Mazur, Anna SzafrańskaPolandJosef Malach, Milan Chmura Czech Republic

171170 The Use of E-learning Resources by Academic TeachersEwa Ogrodzka-Mazur, Anna Szafrańska, Josef Malach, Milan Chmura
communication is the basic principle in this form of study� The quality technolog-ical background, communication means and study materials (both printed and electronic) are essential for the successful implementation of distance learning� The distance study support materials are problem-oriented – full of questions, text gaps, exercise subjects, short tests, summaries, case study assignments, etc� (Eger, Dvořáková, 2003; So, Kim, 2009)� Lojda (1999) mentions the importance of a friendly study environment, support for studying, encouragement, counseling, explaining the evaluation process to the student, etc�
Midgley (2015) expresses an interesting view on distance learning in Great Brit-ain, arguing that “Distance learning is a way of learning remotely without being in regular face-to-face contact with a teacher in the classroom� In the UK such learning has its roots in students learning through correspondence courses� More than 270 000 undergraduate students are taking their first degrees via distance learning, together with about 108 000 postgraduate students� In recent years, the advent of the Internet and widespread use of computers has led to a huge growth in distantly delivered tuition and study�
In Poland, distance learning occurs in three dimensions: enhancing tradition-ally applied methods, making use of the specific potentialities of computer tech-nology and creating entirely new contexts for the learning process, and applying the role of a “living” teacher in direct contact� However, it is worth attention that many specialists recommend caution in the use of information technologies due to the risk of, e�g�, computer addiction or the phenomenon of the “flattening” of knowledge (Smyrnova-Trybulska, 2016a, 2016b)�
In the Czech Republic, distance learning is most commonly associated with e-learning, i�e�, the educational process uses information and communication technologies for the creation and distribution of study contents, communication between students and teachers, evaluation of educational results and the organ-ization and management of studying� It is realized mainly through computer networks such as the Internet or Intranet (Průcha, Veteška, 2012)�
Clark, Mayer (2007) and Eger (2012) characterize e-learning as education which is provided in an electronic form, needs a computer with software and a browser in the Internet or Intranet network and contains a multimedia platform based on the use of CD or DVD� Primarily, however, it uses a computer and a network as an interactive environment with the possibility of visual contact�
The recent rise of ICT and the expansion of electronic networks have resulted in the change of people’s behavior in the Internet and the change of their working and educational styles� While in the past people were only passive consumers of the information on the Internet, today there is a large number of tools for active
tioned phenomena, university teachers intend to adapt their classes to students’ expectations and possibilities and thus ensure the quality of the educational outcomes� Online education, which can be understood as the interconnection of distance education and e-learning, has the potential to take the above-mentioned facts into account�
The possible use of this potential can be influenced by a number of organiza-tional, management, pedagogical and technical factors, the analyses of which are the subject of the annually issued reports (Johnson et al�, 2016; Marcelino, Mendes, Gomes, 2016)� These analyses are inspiring and draw attention to the critical parts of online learning and its developmental trends� Within the 7th EU framework program called IRNet, some questionnaire research was conducted in each of the nine countries of the research consortium, which was aimed at finding how important university teachers consider the use of electronic resources in educa-tion, for which goals they use them, which resources they use most often, how they help them influence students’ activities and what they do to ensure their usefulness to all students�
Online distance learning
Online technologies are used in distance education today� A large number of universities use them to demonstrate that they offer study programs or individual courses conducted mostly or entirely without direct contact with the teacher� The essential elements and advantages of distance learning and its specific features concerning universities should not only be mentioned but also viewed from the perspective of its connections to both e-learning and online learning� Distance learning (Chen, Castillo, Ligon, 2015; Juszczyk, Kim, 2016) is a form of study based on managed self-study with the use of information and communication technologies� It is a form of education with multimedia elements which is mostly used for the realization of university study courses and for further education�
Bernard, Borokhovski, Tamim (2014) and Zlámalová (2008) argue that the main goal of distance learning is to provide education to those students who – for some reasons – cannot participate in daily attendance study courses (dis-tance from the university, workload, family responsibilities, medical or social disabilities)�
The tutor, the student’s advisor, who methodically arranges their education and evaluates their assignments, is a typical representative of distance learning� The student’s self-study guided by the tutor and based on their (mostly electronic)

173172 The Use of E-learning Resources by Academic TeachersEwa Ogrodzka-Mazur, Anna Szafrańska, Josef Malach, Milan Chmura
Currently, the Faculty of Education of the University of Ostrava has almost 3300 students� Most of the subjects are pedagogy-oriented and dominated by disciplines aimed at training future teachers; subjects are taught in bachelor’s, master’s and doctoral courses by 107 academic scholars� The Faculty has the MOODLE system, electronic informational databases and modern, well-equipped lecture theatres, with smart boards�
The research involved 40 university teachers working at the Pedagogical Faculty of the University of Ostrava, 26 of whom were men (65%) and 14 women (35%)� 38% of the entire number of 106 academic scholars working at the Faculty partic-ipated in the research� The majority of the respondents were assistant professors (72�5%), the remaining ones either held a doctoral degree with habilitation or were full professors� The majority of them were aged 41 – 50 (35%) and 31 – 40 (25%), while 62�5% of the respondents were under 50 years of age� As far as the level of ICT use is concerned, 7�5% of the respondents considered themselves beginners, 62�5% considered themselves intermediate and 30% advanced users� The question-naire was sent via email to all 106 the teachers of the Pedagogical Faculty of the University of Ostrava� They were asked to fill it in in the Google environment� It was up to the teachers whether or not they wanted to participate in the research� Therefore, it can be said that the selection of respondents was random�
Using e-learning resources by academic teachers is associated with self-assess-ment concerning their own skills and potentialities�
The first level assessed by the academic teachers is represented by the following answer: partial use of information instruments in teaching (presentations in class, computer tests, exchange of information via e-mail, etc�)�
The second level is represented by the following answer: creation of e-learning courses, the use of information technologies in the system�
The third level is represented by the following answer: creation and support of open educational resources (MOOC – massive open online course, personal open online resources – e-portfolio)�
Using the five-point scale, the respondents were asked to evaluate the three levels according to the frequency of use (1 means a low degree of use and 5 means a high degree of use)�
The “first level” of the application of ICT was evaluated above the average (3�8)� The degree of the “second level” of the use of ICT was significantly lower� The application of massive open online courses or open education resources was rare (cf�, Table 1 and Figure 1, respectively)�
Subsequently, the hypothesis that “the user level” of teachers concerning ICT influences the level of their application was tested (cf�, Figure 1)� The comparison
use of the Internet, which enable communication, publishing, sharing, discussion on the best practice and learning� E-learning, however, plays a key role not only in informal education but also in informal learning associated with mastering computer work (Chmielewski, 2013; Zounek, 2009)�
Developing online education within the classification of the methodological realization of taught courses or entire educational programs shows the need for specific preparation of teachers for the realization of blended learning� As a result, appropriate qualification frameworks are being created (Powell et al�, 2015)� The framework has four main domains: Mindsets, Qualities, Adaptive Skills and Tech-nical Skills� Each domain has defined competences, which are being specified by a particular standard�
The use of e-learning resources by academic teachers – research results
At the end of the 2015/16 academic year, the collecting of data from the survey research among academic scholars was carried out� The aim of the survey research was to present the real picture of the current situation concerning university teachers’ opinions on online education and the current situation concerning the use of the basic components of the university electronic environment for educa-tional purposes�
The main research problem was not being familiarized with academic schol-ars’ opinions on the instruments ensuring online education and the absence of relevant data concerning their actual usage in the educational process and for managed self-education of students�
The studies were conducted in 2015 – 2016 within the IRNet project in Poland, the University of Silesia, Faculty of Ethnology and Education in Cieszyn, and in the Czech Republic, the University of Ostrava, Pedagogical Faculty�
The Faculty of Ethnology and Educational Science conducts research tasks in the field of pedagogy and ethnology� The Faculty educates 3 000 students of pedagogy� The process of academic education comprises such academic subjects as, e�g�, multi – and intercultural education, computer science and information technology� Students make use of the faculty distance learning platform, based on the MOODLE system, which enhances future teachers’ preparation for applying e-learning in their work and for undertaking the function of a tutor�
The studies comprised 46 academic teachers, including 30�4% of full professors, 39�2% of assistant professors and 30�4% of assistants�

175174 The Use of E-learning Resources by Academic TeachersEwa Ogrodzka-Mazur, Anna Szafrańska, Josef Malach, Milan Chmura
Moreover, the conducted Mann-Whitney U tests for the staff groups of both universities (in Poland and the Czech Republic) confirmed statistically significant differences in the declarations concerning the creation of e-learning courses by the result Z = 2�7; p = 0�007 and the creation and support of open educational resources by the result Z = 4�48; p = 0�000007� In the first case, the staff of the Polish university statistically more often use the evaluating declaration: the highest level of application� In the second case, there is a statistically significant difference which consists in more frequent use by the Czech academic scholars than by the Polish ones of the evaluating declaration: the lowest level of application� The Polish academics statistically more often indicated a higher (the fourth and fifth) level of creating and supporting open educational resources� These statistics are shown in Tables 1 and 2 and graphically presented in Figure 1�
Table 2. Influence of teachers’ user level in the ICT field at the level of ICT use in education
ICT competence
Partial use of infor-mation instru-
ments in teaching
Creation of e-learn-ing courses, use of information tech-
nologies in the system
Creation and support of the
open educational resources
Czech R. Poland Czech R. Poland Czech R. Poland
Advanced users
Mean 3�92 4�29 2�92 4�29 1�58 3�14
Std� Deviation 1�443 1�113 1�782 1�496 1�084 1�676
Beginners or interme-diate users
Mean 3�75 4�25 2�07 3�06 1�25 3�00
Std� Deviation 1�430 0�931 1�215 1�611 0�844 1�633
Total Mean 3�80 4�26 2�33 3�43 1,35 3�04
Std� Deviation 1�418 0�964 1�439 1�647 0�921 1�609
Sig� (M�-W� test) 0�637 0�22 0�135 1.99 (p = 0.04)
0�244 0�138
Source: own elaboration
The respondents were asked to select those of the fifteen proposed resources which they use in education� They were allowed to choose as many resources as they wished�
was made through the Mann-Whitney U test� However, no statistically significant difference was found� Therefore, with regard to the respondents’ user level, their answers concerning this group of answers are uniform�
Conducting the Mann-Whitney U test confirmed one statistically significant difference� The Polish academic teachers assessing their ICT skills as “advanced” significantly more often than their counterparts from the less advanced group evaluate the creation of e-learning courses the highest (the result of the Mann-Whitney U test: Z = 1�99; p=0�04 – cf�, Table 2)�
Table 1. Frequency of the application of ICT in education according to three quality levels
ItemMean Std. Deviation
Czech R. Poland Czech R. PolandPartial use of information instruments in teaching 3�8 4�3 1�42 0�96Creation of e-learning courses, use of information technologies in the systemSig� (M�-W� test)
2.3* 3.4 1�44 1�65
2.71 p = 0.007
Creation and support of the open educational resourcesSig� (M�-W� test)
1.4 3.0 0�92 1�61
4.48 p = 0.000007
* In all tables, statistically significant differences are marked in boldSource: own elaboration
Figure 1. Frequency of the application of ICT in education according to three quality levels
Source: own elaboration

177176 The Use of E-learning Resources by Academic TeachersEwa Ogrodzka-Mazur, Anna Szafrańska, Josef Malach, Milan Chmura
ItemsFrequency Percentage of
teachers Percentage of cases
Czech R. Poland Czech R. Poland Czech R. Poland
List of current educational information resources in education
1 10 2.5 21.7 0.7 3.5
Institutional repository 0 12 0.0 26.1 0.0 4.2Total 140 284 350�0 617�4 100�0 100�0
Source: own elaboration
Figure 2. The most frequently used resources for the preparation and realization of education
Source: own elaboration
The teachers preparing electronic content for their courses (probably in the form of PowerPoint presentation) represented one-fourth of the 106 selected answers� The majority of teachers (87�5%) do this� It is followed by the preparation of film fragments and television or radio shows (12�9% of all answers and 45% of all teachers) and the preparation of digital materials for self-study (12�1% of all answers and 42�5% of all teachers)� Another frequent answer was that the teachers prepare thematic websites (11�4% of all answers and 40% of all teachers)� Other applications are presented in Table 3 and Figure 2, respectively�
Table 3. The most frequently used resources for the preparation and realization of education
ItemsFrequency Percentage of
teachers Percentage of cases
Czech R. Poland Czech R. Poland Czech R. Poland
I prepare electronic content for my courses
35 40 87�5 87�0 25�0 14�1
Fragments of films, television or radio programs, etc�
18 24 45�0 52�2 12�9 8�5
I prepare digital materials to help students with self-study
17 30 42.5 65.2 12.1 10.6
Thematic websites 16 26 40�0 56�5 11�4 9�2Electronic resources devel-oped by students as part of their projects
11 28 27.5 60.9 7.9 9.9
Sources from scientific data-bases of various universities
10 12 25�0 26�1 7�1 4�2
E-books as additional recom-mended reading
8 22 20.0 47.8 5.7 7.8
Educational programs 7 20 17.5 43.5 5.0 7.0Independently created e-courses
7 24 17.5 52.2 5.0 8.5
E-books as the major recom-mended reading
5 14 12.5 30.4 3.6 4.9
Digital multimedia learning objects from the accessible collections
4 18 10.0 39.1 2.9 6.3
Virtual laboratories 1 4 2�5 8�7 0�7 1�4

179178 The Use of E-learning Resources by Academic TeachersEwa Ogrodzka-Mazur, Anna Szafrańska, Josef Malach, Milan Chmura
The statistical significance was verified of the differences in the answers concerning the ways of using e-learning resources in the didactic activity of the examined groups from both universities – in Cieszyn and Ostrava� The results of statistical analysis were presented in Table 3 and Figure 2 (the pairs of data which statistically differ are marked in bold)� The conducted Chi-square tests confirm significant differences between the examined groups in the answers concerning the ways of using e-learning resources in didactic activity:
1� I prepare digital materials to help students with self-study – statistics: χ2 = 4�5; p < 0�05 and Φ = 0�232� Electronic resources developed by students as part of their projects – statistics: χ2 = 9�6; p < 0�05 and Φ = 0�333� E-books as additional recommended reading – statistics: χ2 = 7�3; p < 0�05 and Φ = 0�294� Educational programs – statistics: χ2 = 6�7; p < 0�05 and Φ = 0�285� Independently created e-courses – statistics: χ2 = 11�2; p < 0�05 and Φ = 0�366� E-books as the major recommended reading –statistics: χ2 = 4�0; p < 0�05 and Φ = 0�227� Digital multimedia learning objects from the accessible collections –statistics: χ2 = 9�5; p < 0�05 and Φ = 0�338� List of current educational information resources in education – statistics: χ2 = 7�1; p < 0�05 and Φ = 0�299� Institutional repository – statistics: χ2 = 12�1; p < 0�05 and Φ = 0�38In all the cases where differences were statistically significant, the answers were
chosen by the staff from the Polish university in Cieszyn�The hypothesis was also tested that the use of individual resources is influenced
by the subjectively felt ICT skills level of university teachers about which they were asked� They could evaluate themselves as advanced users, intermediate users or as beginners� Due to the low number of respondents, the beginner and intermediate user categories were merged�
The advanced users’ evaluation of the use of three entries is different from that of the beginners or intermediate users (cf�, Figure 4): “I prepare digital materials to help students with self-study” (chi-squared significance = 0�43), “Thematic websites” (Fisher’s test significance = 0�037, chi-square test could not be used due to a high number of low expected frequencies), “Independently created e-courses”
(Fisher’s test significance = 0�001)� All the three entries are used more frequently by the advanced users�
Table 4. Influence of ICT skills level on the use of individual resources [CZ]
Item [in the Czech Republic]Ad-
vanced users
Beginners or inter-mediate
users
Total Sig. Test
I prepare digital materials to help students with self-study
Count 8 9 17 �043 Pearson’s Chi-Square% 66�7% 32�1% 42�5%
Thematic websites Count 8 8 16 �037 Fisher’s Exact Test% 66�7% 28�6% 40�0%
Independently created e-courses
Count 6 1 7 �001 Fisher’s Exact Test% 50�0% 3�6% 17�5%
Source: own elaboration
Table 5. Influence of ICT skills level on the use of individual resources [PL]
Item [in Poland]Ad-
vanced users
Beginners or interme-diate users
Total Sig. Test
E-books as the major recom-mended reading
Count 8 6 14 0�015 Fisher’s Exact Test
% 57�1% 18�8% 30�4%
List of current educational information resources in education
Count 6 4 10 0�047 Fisher’s Exact Test
% 42�9% 12�5% 21�7%
Electronic resources devel-oped by students as part of their projects
Count 12 16 28 0�027 Fisher’s Exact Test
% 85�7% 50�0% 60�9%
Source: own elaboration
The advanced users’ evaluation of the use of three entries is different from that of the beginners or intermediate users (cf�, Figure 4): “E-books as the major recommended reading” (Fisher’s test significance = 0�015), “List of current edu-cational information resources in education” (Fisher’s test significance = 0�047), “Electronic resources developed by students as part of their projects” (Fisher’s test significance = 0�027)� All the three entries are used more frequently by the advanced users�

181180 The Use of E-learning Resources by Academic TeachersEwa Ogrodzka-Mazur, Anna Szafrańska, Josef Malach, Milan Chmura
Using the five-point scale, the respondents were asked to evaluate the signif-icance of the use of six given electronic resources in education (1 means low significance and 5 means high significance)� The values in Table 6 and Figure 3 respectively show that the teachers consider the possibility to provide students with study materials and organize their group or individual work as the most significant�
Table 6. Examination of the significance of the use of electronic resources in the selected parts of university education
ItemMean Std. Deviation Sig. (M.-W.
test)Czech R. Poland Czech R. PolandTo provide necessary study materials 3�65 4�00 1�292 1�243 Z=1�4; p=0�19To organize classes of self-study for students
3.33 4.00 1.328 1.044 Z=2.5; p=0.02
To provide distance learning 3�28 3�48 1�485 1�648 Z=1�0; p=0�35To increase students’ interest in the studied subject
3.13 4.13 1.265 0.920 Z=3.7; p=0.00
To organize students’ work 3.08 3.96 1.163 1.107 Z=3.5; p=0.00For inspection, introspection, and reflection
2.85 3.96 1.210 1.147 Z=4.0; p=0.00
Source: own elaboration
Figure 3. Examination of the significance of the use of electronic resources in the selected parts of university education
Source: own elaboration
The comparison of the answers evaluating the significance of the purpose for which electronic educational resources are used independently in the Polish and Czech scholars’ own didactic activity confirms significant differences (cf�, Table 6 and Figure 3, in which significant statistics – Mann-Whitney’s U Test – are marked in bold)�
The comparison of answers within the group of researchers from Ostrava confirmed the existence of significant differences in the assessment of particular scopes of didactic activities� Friedman’s Chi-square test ANOVA (N=40, df=5) = 25�51 for p = 0�0001 < 0�05�
It was not possible to compare the averages (the data are not normally dis-tributed)� As Mann-Whitney’s result, the medians had to be compared through Friedman’s test� The result of Friedman’s test (significance = 0�0001) proved that the academic scholars’ opinions on the significance of the use of the mentioned resources differ� They consider some resources to be more significant than other ones (cf�, Figure 4)�
Figure 4. Comparison of the answers concerning the significance of particular aims of using electronic educational resources in the didactic activities of the group
of academic scholars from Ostrava
averageaverage + ?? erroraverage + ?? deviation4a 4b 4c 4d 4e 4f
5.5
5.0
4.5
4.0
3.5
3.0
2.5
2.0
1.5

183182 The Use of E-learning Resources by Academic TeachersEwa Ogrodzka-Mazur, Anna Szafrańska, Josef Malach, Milan Chmura
Figure 5. Comparison of the answers concerning the significance of particular aims of using electronic educational resources in the didactic activities
of the group of academics from Cieszyn
Source: own elaboration
Key to Figures 4 and 5: 4a: To provide necessary study materials; 4b: To organize classes of self-study for students; 4c: To provide distance learning; 4d: To increase students’ interest in the studied subject; 4e: To organize students’ work; 4f: For inspection, introspection, and reflection
This issue is viewed in a different way by the academic staff from the University of Silesia� In this case, the analyses do not confirm the existence of significant differences� The evaluations of particular aims of using electronic educational resources in didactic activities are higher but at a similar level (cf�, Figure 5)� Friedman’s Chi-square test ANOVA (N=46, df=5) = 10�0 for p = 0�08 > 0�05�
Conclusion
The research results showed that, within the scope of blended learning, uni-versity teachers use a number of electronic instruments for the implementation of education, the management of students’ self-study and study communication to enhance the elements of online distance learning� Its actual choice or potential
preferences are not much influenced by teachers’ age but rather by their user level of ICT competence and in some cases also by their involvement in social networks� So far, teachers have used few specific educational applications and they prefer generally user-defined instruments� University teachers use or think over the application of electronic instruments for the preparation and realization of education or for consultations with students rather than for the organization of students’ study activities and online learning� Even though they prefer the incor-poration of individual communication instruments for all students, the higher the ICT competence user level is, the more diverse their preference is, concerning instruments which would reflect students’ learning styles when they are provided with electronic resources�
At the next stage of the realization of the IRNet project, the results of the survey research obtained in the Czech Republic will be included in a comparative study containing the data collected in the other participating countries� Based on the results, some generally applicable conclusions can be made concerning the appli-cation of electronic information resources in university education with varying degrees of using online education�
AcknowledgementThe research leading to these results has received, within the framework of the IRNet project, funding from the People Programme (Marie Curie Actions) of the European Union’s Seventh Framework Programme FP7/2007 – 2013/ under REA grant agreement No: PIRSES-GA-2013 – 612536 and statutory research�
References:Bernard, R�M�, Borokhovski, E�, & Tamim, R�M� (2014)� Detecting bias in meta-analyses
of distance education research: big pictures we can rely on� Distance Education, 35, 271 – 293�
Chen, A�N�, Castillo, J�G�D�, & Ligon, K� (2015)� Information and communication tech-nologies (ICT): components, dimensions and its correlates� Journal of International Technology and Information Management, 24, (4), 24 – 45�
Chmielewski, K� (2013)� Diagnoza stanu kształcenia na odległość w Polsce i wybranych krajach Unii Europejskiej. Raport końcowy� (The diagnosis of the state of play of distance education in Poland and selected European Union countries. Final report)� Warszawa: Krajowy Ośrodek Wspierania Edukacji Zawodowej i Ustawicznej� Available at: http://www�kno�koweziu�edu�pl /artykuly/201-raport-diagnoza-stanu-ksztalcenia-na-odleg-losc-w-polsce-i-wybranych-krajach-unii-europejskiej�html�
Clark, R�C�, & Mayer, R�E� (2007)� E-Learning and the science of instruction. Proven guide-
4a 4b 4c 4d 4e 4f
averageaverage + ?? erroraverage + ?? deviation
5.5
5.0
4.5
4.0
3.5
3.0
2.5
2.0
1.5

185184 The Use of E-learning Resources by Academic TeachersEwa Ogrodzka-Mazur, Anna Szafrańska, Josef Malach, Milan Chmura
lines for consumers and designers of multimedia learning� San Francisco, CA: Pfeiffer & Company�
Eger, L�, & Dvořáková, E� (2003)� Centrum celoživotního vzdělávání. (Lifelong learning center). Ostrava: VŠB –Technická univerzita Ostrava�
Eger, L� (2012)� Vzdělávání dospělých a ICT. Aktuální stav a predikce vývoje� (Adult educa-tion and ICT. Current status and development prediction). Plzeň: NAVA�
Johnson, L�, Adams Becker, S�, Cummins, M�, Estrada, V�, Freeman, A�, & Hall, C� (2016)� NMC Horizon Report: 2016 Higher Education Edition� Austin, Texas: The New Media Consortium�
Juszczyk, S�, & Kim, Y� (2016)� Are open education and flexible forms of learning a civ-ilisation requirement or a technological obligation? The New Educational Review, 46, (4), 163 – 173�
Lojda, J� (1999)� Význam kvality v distančním vzdělávání� (The importance of quality in distance education)� In: Distanční vzdělávání v České republice – současnost a budouc-nost. (Distance education in the Czech Republic – present and future). Praha: Národní centrum distančního vzdělávání�
Malach, J�, Kostolánová, K�, Chmura, M�, Ogrodzka-Mazur, E�, & Szafrańska-Gajdzica, A� (2015)� ICT – supported education at Czech and Polish universities: a comparative study� International Journal of Information and Communication Technologies in Educa-tion, 4, (4), 48 – 68�
Malach, J�, Kostolánová, K�, Chmura, M�, Ogrodzka-Mazur, E�, & Szafrańska-Gajdzica, A� (2016)� Social media at Czech and Polish universities: a comparative study� International Journal of Information and Communication Technologies in Education, 5, (1), 41 – 58�
Marcelino, M�J�, Mendes, A�J�, & Gomes, M�C� (eds) (2016)� ICT in education. Multiple and inclusive perspectives� Cham: Springer International Publishing Switzerland�
Midgley, S� (2015)� What is Distance Learning? Available at:_http://www�thecompleteuni-versityguide�co�uk/distance-learning/what-is-distance-learning/�
Moore, M�G�, & Anderson, W�G� (eds�) (2003)� Handbook of distance education. Mahwah, London: Lawrence Erlbaum Associates�
Ogrodzka-Mazur, E�, Gajdzica, A�, Chmura, M�, & Malach, J� (2015)� Research into stu-dents’ ICT competencies and their use in ICT at selected universities� A Polish – Czech comparative study. Studia Edukacyjne, 36, 365 – 379�
Ogrodzka-Mazur, E�, & Szafrańska-Gajdzica, A� (2016)� The diagnosis of ICT and inter-cultural competences of pedagogy students� A Polish – Czech comparative study. In: Pokroky v hodnocení klíčových kompetencí (Advances in the assessment of key competen-cies) Malach, J�, Červenková, I�, & Chmura, M� (eds�)� Ostrava: Ostravská univerzita, 8 – 21�
Powell, A� et al� (2015)� Blending learning: the evolution of online and face-to-face education from 2008 – 2015� iNACOL� Available at: http://www�inacol�org/resource/blending-learning-the-evolution-of-online-and-face-to-face-education-from-2008 – 2015/�
Powell, A� et al� (2015)� iNACOL blended learning teacher competency framework. iNACOL
Available at: http://www�inacol�org/resource/inacol-blended-learning-teacher-compe-tency-frame-work/�
Průcha, J�, & Veteška, J� (2012)� Andragogický slovník� (Andragogical dictionary). Praha: GRADA�
Smyrnova-Trybulska, E� (2016a)� Some aspects of increasing the effectiveness and com-fort of the scientific and educational process in university electronic environment – a research report� The New Educational Review, 45, (3), 259 – 272�
Smyrnova-Trybulska, E� (2016b)� Some aspects of activities in the e-learning environment for academic teachers – a research report� Edukacja Ustawiczna Dorosłych. Polish Jour-nal of Continuing Education, 4, 15 – 26�
So, H�J�, & Kim, B� (2009)� Learning about problem based learning: student teachers integrating technology, pedagogy and content knowledge� Australasian Journal of Educational Technology, 25, (1), 101 – 116�
Zlámalová, H� (2008)� Distanční vzdělávání a e-learning. (Distance education and e-learn-ing). Praha: Univerzita Jana Amose Komenského�
Zounek, J� (2009)� E-learning ve školním vzdělávání� (E-learning in school education)� In: Průcha, J� (ed�) Pedagogická encyklopedie� (Pedagogical encyclopaedia)� Praha: Portál�

187Moving Education to Cloud
Moving Education to Cloud : A pilot Study in Montenegrin Higher Education
DOI: 10.15804/tner.2017.50.4.15
Abstract The paper considers challenges of moving education into Cloud under the conditions of digital divide� The content of the paper is divided into two parts� In the first one, the focus is on digital divide, since it greatly affects the issue� In the second part, a model for adapting Cloud in higher educational environment is proposed, with the emphasise on the needs of so-called developing countries, which suffer consequences of digital inequality� The statistical analyses of the survey conducted on the basis of the proposed model have been made at two universities in Montenegro (South-East Europe)� Moreover, brief conclusions along with some guidelines for the future research work in the field are given�
Keywords: education, digital divide, developing countries, model for adopting Cloud
Introduction
Differences in the level of education of individuals are among the major causes of digital divide� This cause-and-effect relationship is multiple and can be explained by several theories� According to diffusion of innovation theory (Rogers, 2003), complexity is the main obstacle to the adoption of new technologies� Therefore, the simpler a technology is, the sooner it gets accepted� Education plays a key role here� More educated people are more willing to cope with more complex problems and effectively overcome the requirements set by new technology� In other words,
Sanja BaukSouth Africa
a higher level of education makes it easier to overcome the barrier to the use of new ICTs (Information and Communication Technologies)� Higher education enables a better acceptance and understanding of information, which again leads to informational divide between those with higher and those with lower levels of education� This is basically the main argument on which theory of educational differences relies (Tichenor, 1970)� The theory is developed in the context of mass media spread (TV, radio, etc�)� Namely, Tichenor et al� (1970) claim that the infu-sion of mass media information into the social system is on the rise in a way that a portion of the population with a higher socio-economic status adopts information faster than the part of the population with a lower status of this type, which shows that the disparity has a growing trend rather than declining one� If this is the case with mass media, which are far less complex and demanding than the Internet, in the case of the Internet, the previously identified problem of divide will be even more emphasized�
The mass media technologies are not as demanding as ICTs, as they do not require much engagement on the part of their users� Instead of being only the recipients of what is offered to them, as is the case with unilateral mass-media content, users are required to navigate through a large amount of information by ICTs� In addition, in the case of the Internet, although availability is a prerequisite, it is not sufficient per se to achieve all of the advantages that this technology can bring, so the important differences can remain in the domain of the nature of its use� Vicente & Lopez (2006) note: not only does a user need access to infrastruc-ture, but one also needs the ability to access information, i�e�, the ability to find and use it properly�
The hypothesis that educated people will work in information-intensive indus-tries, i�e�, that they will use ICTs more intensively both at work and at home, makes sense� In accordance with this, Howard et al� (2001) came to a conclusion that more educated people use the Internet more productively and with a higher economic impact compared to those with a lower level of education� Peng et al� (2011) have shown that people using PCs at work and at school are more likely to adopt new ICT solutions� Tengtrakul & Peha (2013) have shown that the higher educational level of a student, the greater the possibility of accepting ICT in households (which these students belong to), etc�
It becomes clear that there is a positive correlation between the level of educa-tion, the socio-economic opportunities of individuals and the adaptation of new ICT systems� Implicitly, this hypothesis could be also extended to the use of Cloud in the generation and dissemination of knowledge�

189188 Moving Education to Cloud Sanja Bauk
Moving education into Cloud in developing environments
Today, when it comes to using computer infrastructure, various platforms and soft-ware solutions, Cloud computing is an ubiquitous paradigm which has introduced significant changes in the way services are provided� Simply, Cloud computing is Internet-based computing� Cloud can also be described as a set of clusters of dis-tributed computers (with farms of servers, as enormous centres for data collection and processing), which provide resources and services via network medium, i�e�, the Internet� Customers used to deploy applications installed on their own (physical) computers or company (local) servers, while today these applications are moved to Cloud� For example, when users check their g-mail account, bank account status online, or update their facebook status – they are, in fact, in Cloud�
The question is why such a large number of activities, including education, is moved into Cloud? Numerous literary sources say that this is in order to increase the flexibility and scalability of user needs, to free the users of capital investments in infrastructure and software, “pay as you go’’ services, as well as automatic software updates, increasing the possibilities of collaboration, the ability to access resources from any place, more efficient group work on the same projects, increasing com-petitiveness (SUK&IB, 2015), etc�
Apart from this, we are undoubtedly faced with an expansive and less controlla-ble growth of technical forms of material culture, which we are often, in a certain way, forced to adopt� It is, in fact, a kind of imperative of the new digital era� On the other hand, education is more and more treated as an expense, rather than an investment (and not only in developing countries, but also in developed ones)� So, this is also one of the reasons for moving education into Cloud� All the challenges of moving education into Cloud in developed parts of the world are even more emphasised in developing environments, and that is, above all, willingness to manage knowledge and (confidential) human resources data in Cloud� Therefore, by taking into account contextual factors, socio-economic and political constraints, above all, an attempt has been made to propose a model for the implementation of Cloud in the developing environments�
If we start off with the assumption that the increase in the adoption of Cloud services will be present in the field of education (especially higher and lifelong) in developed countries, indisputably, new opportunities in this domain will arise for developing countries, as well� For these countries, small capital investments and flexibility in the use of resources are of particular importance� By opening Cloud capabilities, developing countries should be able to use the same infrastructure and resources as technologically highly developed countries (Kshetri, 2010)�
Methodology
In developing countries, there is very little preliminary research on the adap-tation of Cloud resources in education� The model proposed here (cf�, Figure 1) is inspired by a study which was carried out in sub-Saharan Africa (Humphrey, 2016), and it was slightly modified in accordance to the conducted pilot study requirements� The model represents the basis for designing a questionnaire, by means of which the readiness of the higher education institutions in the developing country (Montenegro) to implement this type of education, could be analyzed� The model is based on triangulation (reconciliation) of two theories of adoption and expansion of ICTs: theory of diffusion of innovations (Rogers, 2003) and theory of a technologically acceptable model (Davis, 1989)�
The model, which is proposed here includes one dependent variable: intention to adopt Cloud into education� The independent variables in the model are organized in several subgroups: innovative, economic, technical, contextual and organiza-tional factors (attributes)� The last, but not least, is the independent variable: actual use of Cloud in higher education� In Figure 1, direct and indirect links between dependent and independent variables are presented�
The main hypoteses on which is based the model, are as follows: H1: Innovation factors are positively correlated with the tendency of introducing
Cloud computing into higher education;H2: Economic factors (costs and unpredictable return of investments) are nega-
tively correlated with the introduction of Cloud; H3: Technological factors (data security, system flexibility and scalability) are
positively correlated with the adaptation of Cloud computing in this domain;
H4: The technological factor related to obsolescence risks, on the other hand, is negatively correlated with the introduction of Cloud;
H5: Simplicity of use, easiness to create new content, and self-evaluation of possibilities are positively correlated with the adoption of Cloud;
H6: The availability of ICT infrastructure, developed socio-cultural and educa-tional factors are positively correlated with the introduction of this new concept into education;
H7: The age of the user is negatively correlated with the Cloud adaptation� In other words, young people are usually for innovation, unlike the elderly generation;
H8: The size of organization is positively correlated with the adoption, i�e�, a larger higher education organization will easily adopt Cloud;
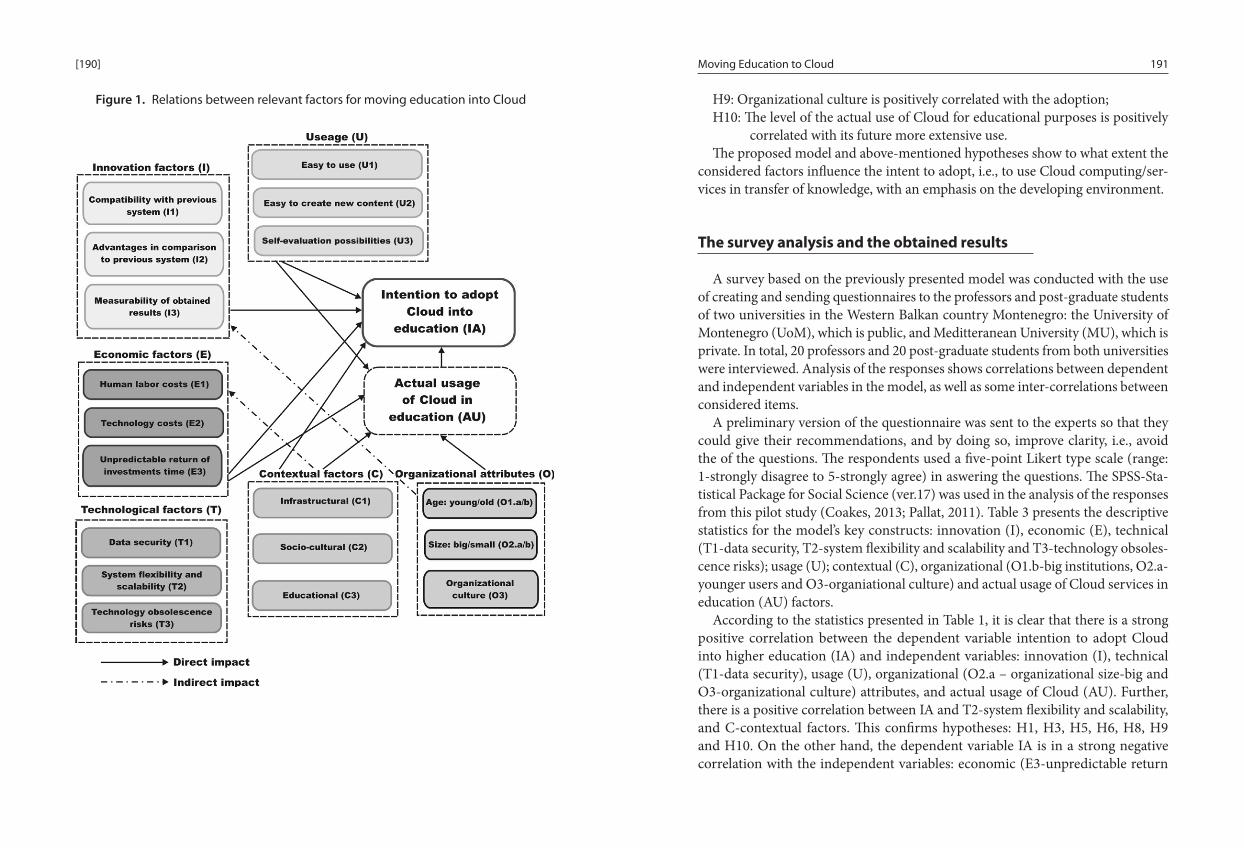
191Moving Education to Cloud[190]
H9: Organizational culture is positively correlated with the adoption; H10: The level of the actual use of Cloud for educational purposes is positively
correlated with its future more extensive use�The proposed model and above-mentioned hypotheses show to what extent the
considered factors influence the intent to adopt, i�e�, to use Cloud computing/ser-vices in transfer of knowledge, with an emphasis on the developing environment�
The survey analysis and the obtained results
A survey based on the previously presented model was conducted with the use of creating and sending questionnaires to the professors and post-graduate students of two universities in the Western Balkan country Montenegro: the University of Montenegro (UoM), which is public, and Meditteranean University (MU), which is private� In total, 20 professors and 20 post-graduate students from both universities were interviewed� Analysis of the responses shows correlations between dependent and independent variables in the model, as well as some inter-correlations between considered items�
A preliminary version of the questionnaire was sent to the experts so that they could give their recommendations, and by doing so, improve clarity, i�e�, avoid the of the questions� The respondents used a five-point Likert type scale (range: 1-strongly disagree to 5-strongly agree) in aswering the questions� The SPSS-Sta-tistical Package for Social Science (ver�17) was used in the analysis of the responses from this pilot study (Coakes, 2013; Pallat, 2011)� Table 3 presents the descriptive statistics for the model’s key constructs: innovation (I), economic (E), technical (T1-data security, T2-system flexibility and scalability and T3-technology obsoles-cence risks); usage (U); contextual (C), organizational (O1�b-big institutions, O2�a-younger users and O3-organiational culture) and actual usage of Cloud services in education (AU) factors�
According to the statistics presented in Table 1, it is clear that there is a strong positive correlation between the dependent variable intention to adopt Cloud into higher education (IA) and independent variables: innovation (I), technical (T1-data security), usage (U), organizational (O2�a – organizational size-big and O3-organizational culture) attributes, and actual usage of Cloud (AU)� Further, there is a positive correlation between IA and T2-system flexibility and scalability, and C-contextual factors� This confirms hypotheses: H1, H3, H5, H6, H8, H9 and H10� On the other hand, the dependent variable IA is in a strong negative correlation with the independent variables: economic (E3-unpredictable return
Figure 1. Relations between relevant factors for moving education into Cloud

193Moving Education to Cloud[192]
of investments), technical (T3-technology obsolescence risks), and organizational (O1�b-older users) attributes� This is in accordance with hypotheses: H2, H4 and H7� Therefore, it can be concluded that the initial hypotheses are verified by the polls� Figure 2 presents diagrams in which there are shown: (a) innovation; (b) economic; (d) technical factor (data security), and (d) usage mean values, which are estimated by the respondents, i�e�, professors and post-graduate students at the University of Montenegro (UoM) and Mediterranean University (MU)� These factors are evaluated as those of quite high importance for adopting and routinizing Cloud in two analyzed higher education institutions in Montenegro�
Figure 2. UoM and UM respondents’ assessments of some of the key construct in the model
Tab
le 1
. M
eans
, sta
ndar
d de
viat
ion
(SD
) and
cor
rela
tions
Con
st.
(N=4
0)C
orre
latio
ns in
the
over
all s
ampl
e (N
=40)
Mea
nSD
IE
T1T2
T3U
CO
1.b
O2.
aO
3AU
IAI
4�05
37�6
1797
1E
3�37
43�5
6273
-�173
1T1
4�47
50�5
5412
�288
-�212
1T2
3�82
50�6
3599
�255
-�030
�242
1T3
2�80
00�7
2324
-�343
*�4
53**
-�333
*�1
451
U4�
0867
�578
34-�3
38*
-�209
�427
**�4
26**
-�140
1C
4�07
93�3
5410
�259
-�246
�280
-�126
-�286
�096
1O
1.b
2�00
00�7
8446
-�179
*�4
22**
-�413
**-�2
57�5
42**
-�329
*-�1
981
O2.
a4�
2500
�588
35�3
06-�3
73*
�570
**�3
94*
-�181
�612
**-�0
58-�2
221
O3
4�02
50�6
9752
�389
*-�2
18�3
00�1
26-�4
77**
�523
**�1
98-�2
81�4
84**
1AU
2�50
00�9
0582
�448
**-�5
70**
�485
**�2
45�-4
70**
�452
**�1
65-�5
41**
�577
**�5
07**
1IA
4�55
00�5
9700
.476
**-.4
83**
.633
**.3
28*
-.570
**.6
48**
.313
*-.6
02**
.694
**.5
82**
.759
**1
Pear
son:
*Cor
rela
tion
is sig
nific
ant a
t the
0�0
5 le
vel
**C
orre
latio
n is
signi
fican
t at t
he 0
�01
leve
l
a� Innovation factors b� Economic factors
c� Technical factor: Data security d� Usage

195194 Moving Education to Cloud Sanja Bauk
Statistics reliabilityDue to the results of this pilot study, it is obvious that the respondents highly
assessed the innovation and economics factors� Also, they highly appreciated the usage easiness and extremely appreciated data security�
In order to ensure that the questions in the survey for each construct correspond well to the attributes of the constructs, the Cronbach alpha reliability test was used� Cronbach’s alpha is a statistical measurement used for determining the internal reliability of a survey instrument to ensure outputs from the measurements are consistent in producing similar results at different times (Coolican, 2014)� The results of the test are shown in Table 2� They are obtained after removing the follow-ing items: E3-unpredictable return of investments, T3-technology obsolesce risks and O1�b-organizational attribute-older users, which corresponds to hypotheses H2, H4, H7, and which are in this case negatively correlated to the dependent variable in model IA�
Table 2. Reliability statistics
Constructs Cronbach’s alphaInnovations factors (I) 0�840Data security (T1) 0�832System flexibility and scalability (T2) 0�856Usage (U) 0�825Contextual factors (C) 0�861Size of organization – big (O2�a) 0�821Organizational culture (O3) 0�833Actual usage of Cloud in education (AU) 0�823Intention to adopt Cloud into education (IA) 0�803
The Cronbach alpha value of 0�7, or higher, indicates good internal consist-ency of the items in the scale (Gliem & Gliem, 2003)� It means that the selected instruments in the proposed model have good consistency� Additionally, factor analysis was made in SPSS, and the following constructs are identified as those of key importance: T2-system flexibility and scalability, U-usage, O2�a-organization size-big, and IA-intention to adopt Cloud� The selected factor loads (l) and error variances (e) are presented in Table 3�
Table 3. Selected factors loads (l) and error variances (e)
Constructs Factor load (l) Error var. (e)System flexibility and scalability (T2) 0�752 0�434Usage (U) 0�774 0�401Size of organization – big (O2�a) 0�798 0�363Intention to adopt Cloud in education (IA) 0�603 0�636
The average variance extracted (AVE) and composite reliability (CR) are calcu-lated by Eq� (1) and Eq� (2):
nAVE ��2� … (1)
� �� � ���
��
��
�2
2
CR … (2)
Where, l is load factor, e is error variance, and n is number of load factors� The values obtained for AVE and CR are respectively: 0�541 and 0�823� Since the threshold for convergent validity is AVE>0�5 and for reliability CR>0�7 (Hair et al�, 2010), it can be concluded that both conditions are satisfied for the selected items� The results obtained by the pilot study provided initial support for the model constructs, while some constructs are removed� Also, some additional checks of clarity should be done before the study survey is executed in the next turn� This might be the subject of further, more rigorous and extensive investigations in the future work�
Conclusions
In the literature, there are different answers to the question if higher education should be moved into the sphere of Cloud� Some sources advocate the transition to Cloud as the only acceptable solution today, as the imperative of the new dig-ital age, which ensures higher efficiency in education (SUK&IB, 2015; Ellucian, 2016)� Others look at this transition primarily as an attempt to reduce the cost of education, especially higher one, but not as an entirely successful attempt� Moving from well-established, traditional, routine face-to-face education to new forms of

197196 Moving Education to Cloud Sanja Bauk
technologically supported education creates greater initial costs, alongside with uncertain outcomes (Bown, 2013)�
Despite the divided opinions, it can be concluded that the decision to move education to the domain of Cloud computing/services still depends on individual preferences and numerous contextual factors, especially in the developing regions (countries), where a noticeable digital divide is still present�
Due to the conducted statistical analysis through the pilot study realized at the University of Montenegro (UoM) and Meditteranean University (MU), it can be concluded:
(a) There is a strong positive correlation between the dependent variable inten-tion to adopt Cloud services in higher education, and the following independent variables:
• Actual use of Cloud services (0�759); • Organizational attribute: younger users (0�694); • Usage factors: easy to use, easy to create new content and self-evaluation
possibilities (0�648); • Technical factor: data security (0�633); • Organizational attribute: organizational culture (0�582); • Innovation factors: compatibility with previous systems, advantages in
comparison to previous systems and measurability of obtained results (0�476)�
(b) On the other hand, there is a strong negative correlation between the dependent variable intention to adopt Cloud services in higher education, and the following independent variables:
• Organizational attribute: small organization (-0�602); • Technological factor: technology obsolescence risk (-0�570); • Economic factor: unpredictable return of investments (-0�483)�
Further research work should be done to develop efficient approaches for the assessment of real needs, when it comes to providing access, adopting and deploy-ing new ICT solutions for generating and distributing (new) knowledge� In other words, solutions that suit the individual needs and abilities of diverse educational entities should be sought in the regions (countries) with different geo-locations� The multidimensional nature of accepting ICT innovations brings with it different levels of acceptance, which cannot be explained exclusively by economic and technological factors, but must inevitably involve socio-cultural factors, as well� In developing countries these factors are significantly different from those in (highly) developed countries�
ReferencesBorgia, E� (2014)� The Internet of Things vision: Key features, applications and open issues�
Computer Communications, 54, 1 – 31�Bowen, W�G� (2013)� Higher Education in the Digital Age� Princeton University Press:
Princeton�Coakes, S�J� (2013), SPSS 20�0 for Windows – Analysis without Anguish, Willey Publish-
ing, Inc�Coolican, H� (2014)� Research methods and statistics in psychology� Psychology press�Cruz-Jesus, F�, et al� (2016)� The education-related digital divide: An analysis for the EU-28�
Computers in Human Behavior, 56, 72 – 82�Davis, F�D� (1989)� Perceived usefulness, perceived easy of use, and user acceptance of
computer technology� MIS Quarterly, 13 (3), 319 – 339�Ellucian (2016)� The Cloud: a smart move for higher education� Retrived 20/7/2016, from
http://www�ellucian�com/Insights/The-Cloud--A-Smart-Move-for-Higher-Education/ Epstein, D� et al� (2014)� Not by technology alone: the “analog“ aspects of online public
engagement in policymaking� Government Information Quarterly, 31 (2), 337 – 344�Fleisch, E�, Weinberger, M, and Wortmann, F� (2014), Geschäftsmodelle im Internet der
Dinge, HMD Praxis der Wirtschaftinformatik, 51(6), pp� 812 – 826�Fleisch E� (2010), What is the Internet of Things? An Economic Perspective� Auto-ID Labs
White Paper, University of St� Gallen�Galliers, R�D�, & Currie, W�L� (2011)� The Oxford Handbook of Management Information
Systems – Critical Perspectives and New Directions� Oxford University Press Inc�: NY (USA)�
Gliem, J�A�, & Gliem, R�R� (2003)�Calculating, interpreting, and reporting Cronbach’s alpha reliability coefficient for Likert-type scale� Midwest research-to-practice confer-ence in adult, continuing, and community education�
Gunkel, D�J� (2003)� Second thoughts: toward a critique of the digital divide� New Media & Society, 5 (4), 641 – 654�
Hair, J�, Black, W�, Babin, B�, Anderson, R� (2010)� Multivariate data analysis (7th ed�)� Upper Saddle River, NJ, USA: Prentice-Hall, Inc�
Howard, P�E�N� et al� (2001)� Days and nights on internet: the impact of diffusing technol-ogy� American Behavioral Science, 45 (3), 383 – 404�
Humphrey, M�S� et al� (2016)� Conceptualizing a model for adoption of cloud computing in education� International Journal of Information Management, 36, 183 – 191�
Kshetri, N� (2010)� Cloud computing in developing economies: drivers, effects, and policy measures� Proceedings of PTC�
Lyell, J� (2016)� 3 Ways to Bridge Digital Divide – Access to the Internet is still Uneven� IEEE Spectrum, June, 7 – 8�
Novo-Corti, I�, & Barreiro-Gen, M� (2015)� Public policies based on social networks for introduction of technology at home: demographic and socioeconomic profiles of households� Computers in Human Behavior, 51(part B), 1216 – 1228�
OECD (2011)� Guide to measuring the information society 2011� Paris: OECD publishing�

198 Sanja Bauk
Pallant, J�F� (2011), SPSS Survival Manual: A Step by Step Guide to Data Analysis Using SPSS� Australia: Allen & Unwin�
Peng, G� et al� (2011)� Impact of network effects and diffusion channels on home computer adaption� Decision Support Systems, 52 (3), 384 – 393�
Pepper, R� (2015)� As two digital divides close, a new one threats, Huff Post� Retrived 19/7/2016, from http://blogs�cisco�com/gov/as-two-digital-divides-close-a-new-one-threatens
Rogers, E�M� (2003)� Diffusion of Innovations (5th Ed�)� New York, NY: The Free Press�SUK&IB – Sailforce UK & Ireland Blog (2015)� Why Move to the Cloud? 10 Benefits of
Cloud Computing� Retrived 20/7/2016, from www�salesforce�com/uk/blog/2015/11/why-move-to-the-cloud-10-benefits-of-cloud-computing�html
Tengtrakul, P�, & Peha, J�M� (2013)� Does ICT in schools affect residential adoption and adult utilization outside schools? Telecommunications Policy, 37 (6 – 7), 540 – 562�
THP – The Huffington Post (2016)� The Connected School: How IoT Could Impact Education� Retrived 18/7/2016, from http://www�huffingtonpost�com/jeanette-cajide/the-connected-school-how-_b_8521612�html
Tichenor, P�J� et al� (1970)� Mass media flow and differential growth in knowledge� Public Opinion Quarterly, 34 (2), 159 – 170�
USDC – US Department of Commerce (2002)� A nation online: How Americans are expanding their use of internet� Washington, D�C�: US Department of Commerce – Economics and Statistics Administration�
Vicente, M�R�, & Lopez, A�J� (2006)� Patterns of ICT diffusion across the European Union� Economic Letters, 93 (1), 45 – 51�
Weinberger M�, Bilgeri D�, and Fleisch E�, IoT business models in an industrial context (IoT Geschäftsmodelle im Industrie Kontext), Automatisierungstechnik 2016; 64(9), pp� 699 – 706�
WSIS (2003)� World summit on the information society: declaration of principles� Paper presented at the World Summit on the Information Society (WSIS), Geneva� Retrived 11/7/2016, from http://www�itu�int/net/wsis/documents/doc_multi�asp?lang=en&id=2266
Wu, T�-F� et al� (2014)� Is digital divide an issue for students with learning disabilities? Computers in Human Behavior, 39, 112 – 117�

The Sensation Seeking Tendency and Learning Style of Grammar School Students with Extended Physical
Education and Sports Training
DOI: 10.15804/tner.2017.50.4.16
AbstractThe study examines the sensation seeking tendency – Zuckerman’s concept (1978) and student’s learning style – Dunn’s concept (2000)� The study is of descriptive character and uses quantitative methods� To collect data, two stand-ardized questionnaires are combined into one – Learning styles, Interests and Hobbies Inventory� Students of Czech grammar schools with extended physical education and sports training were observed� Analysis of Variance has found that boys seek sensation extensively more than girls regardless of their class type; furthermore, students from classes with P�E� and sports specialization do not seek sensation more extensively in comparison with students from general classes� Statistically significant differences in preferred learning styles have been identified between both types of classes�
Keywords: learning, learning style, sensation, sensation seeking tendency, gram-mar school students, descriptive study
Introduction
The presented paper aims to contribute to the debate on improving the edu-cational process from the perspective of the sensation seeking tendency and preferred learning styles�
Dita CulkováCzech Republic

201200 The Sensation Seeking Tendency and Learning Style of Grammar School Dita Culková
Research questions1� Are there any differences in the sensation seeking tendency between students
of general grammar school classes and classes with extended physical educa-tion and sports training? If so, what differences are there?
2� Are there differences in preferred learning styles between students of general grammar school classes and classes with extended physical education and sports training? If so, what differences are there?
HypothesesH1: The sensation seeking tendency of the students from classes with extended
P�E� and sports training is statistically significantly higher than that of the students from general classes�
H2: There are statistically significant differences in preferred learning styles between the students of general grammar school classes and those from classes with extended P�E� and sports training�
Research Methodology
General Background of ResearchThe study is of descriptive character and uses quantitative methods� Analysis of
Variance (ANOVA) was used and two standardized questionnaires were applied to collect data�
Research Sample The research group was selected by the random stratified selection of Czech
grammar schools (Gymnasiums) which offer study programs with extended physical education and sports training� The basic set of schools was taken from the Institute for Information on Education and it consisted of 16 institutions� Through random selection, ten schools were selected and seven of them became involved in this study while other three schools refused to participate� In these seven schools, third grade students (in four-year schools), and seventh grade students (in eight-year schools) were investigated� The total number of filled-in questionnaires was 300� Responses came from 17 different classes, containing 142 students from gen-eral classes and 158 students of extended sports training and physical education, with a total of 148 girls and 147 boys� Five samples were excluded due to poor completion (not all the questions were answered)�
Research ProblemsThe objective of this study was to determine the level of the sensation seeking
tendency among students of general classes and classes with extended physical education and sports training in Czech grammar schools (gymnasiums), and to find out if there are differences in the learning styles between these two groups�
The basic concepts in this study are the learning style, defined by Rita Dunn (Dunn, 2000) and the sensation seeking tendency according to the concept of Marvin Zuckerman (Zuckerman, 1978)� Sensation is understood as a new, strong and exceptional or extraordinary experience, and it is used in the context of the sensation seeking tendency� This tendency is determined by both genetic and environmental factors (Zuckerman, 1994)� It is related to risk-taking (Zuckerman, 2001) and is an essential part of the pupil’s personality�
The used concept of learning styles by Dunn (2000) is highly pragmatic and refers to the learning style of twenty-one factors, which are divided into four groups: environmental influences, emotions, social needs and physical needs�
Research FocusThe studies explicitly related to sensation seeking and to education (Farley, 1981;
Wentzel, 1993; Stewin & Carter, 1999; Blum, Beuhring & Rinehart, 2000; Ang & Woo, 2003) demonstrate that students with a high sensation seeking tendency have a negative approach to school attendance and are more inclined to hyper-activity and crime than students with a low tendency� It indicates a link between the sensation seeking tendency, poor study skills and general dissatisfaction with teachers, the school and the learning process�
The general aim of the presented study was to relate the student’s sensation seeking tendency and learning styles, and analyse the possible relationship between these two variables to bring a new overview on teaching and learning process� Rybenský (2008), Krásová and Rost (2008) and Kuban (2001) in their studies came to the conclusion that the followers of a specific lifestyle, particularly young people engaged in some kind of sports, show a highly significant (above average) sensation seeking tendency� Also for this reason, this study was carried out among students of secondary schools with extended physical education and sports training� The specific aim of the study was to find out if students who are engaged in sports, respectively students of grammar schools with P�E� and sport specialization have a higher tendency of sensation seeking, if there are any specif-icities about their learning styles, and if there are any relationships between their level of sensation seeking and the way they prefer to learn�

203202 The Sensation Seeking Tendency and Learning Style of Grammar School Dita Culková
studies, under what conditions they focus best, what they prefer when learning new or difficult subject matter, or when they learn new skills� Furthermore, it characterizes their learning styles� The questionnaire divides the questions into twenty-one variables, while in the Questionnaire of learning styles, interests and hobbies only eight are used: internal motivation, persistence, responsibility, struc-turing tasks, experiential learning, morning/evening learning, morning learning and extrinsic motivation – the teacher.
Data AnalysisTo calculate results, the statistical program STATISTICA version 9�0� was used�
To compare the differences based on gender and class type, a two-way Analysis of Variance (surveyed factors is the gender and class type) was applied� As a post hoc test, the Fisher LSD test was used� This test points to significant differences between the two groups� For the complexity of the results, factual significance was calculated, while the importance of the influence of other factors was assessed relatively�
Research Results
Using the Analysis of Variance, statistically significant differences were found� This applies only to some cases such as the sensation seeking tendency (SST), persistence (P), morning/evening learning (ME_L) and extrinsic motivation by the teacher (EM_T)�
Because there is a statistically significant difference only between the genders in the sensation seeking tendency (Tables 1 and 2, and Figures 1 and 2), but not between the classes, hypothesis H1 can be rejected� Based on the significance level of α = 0�05, the observation that the sensation seeking tendency of the students from sports classes is statistically significantly higher than that of the students from the general classes can be rejected�
Although a statistically significant difference between the genders was identi-fied, the results of the factual significance show a small effect of the gender factor on the SST variable, which is in accordance with the fact that the differences are not dramatic�
Instrument and Procedures
Methods of data collectionTo collect data, the following research tool was used – a Questionnaire of learn-
ing styles, interests and hobbies composed of two standardized questionnaires� The first part consists of a Questionnaire of learning styles (Slavík & Mareš, 2004) and the second part of a Test of interests and hobbies (Kuban, 2006)� The Test of interests and hobbies was included in a complete form and from the Questionnaire of learn-ing styles only some variables were used� The main reason for selecting only certain variables was a higher time-efficiency and prevention of follow-up degradation of the quality of answers in the second half of the questionnaire� Another reason for not having used certain variables was their poor relation to the main purpose of the research, which increases the validity of the results� Reliability is not reduced by this procedure, since it is counted from the sets of questions (variables) that are maintained, rather than from the whole questionnaire�
Learning styles, interests and hobbies questionnaire The standardization of the Czech version of the Test of interests and hobbies was
conducted in 2003 by Kuban (2006) and its original version was devised in 1978 by Zuckerman (1978) under the Sensation Seeking Scale form V (SSS-V)� The SSS-V consists of forty items divided into four subscales with ten items in each subscale� The first subscale is Thrill and Adventure Seeking (TAS), which is an area of sports and physical activity� The second subscale is Experience seeking (ES), the area of sensory perception� The third subscale is Disinhibition (Dis), the level of respect for the legal, moral and social standards, and the fourth is Boredom Susceptibility (BS), the area of resistance to repeated stimuli� Each of the forty items contains two options that negate their importance to each other and maintains a form of forced choice� The total score expresses the sensation seeking tendency of the tested persons, and their level of adaptation to new things and new situations in life or lifestyle change (Kuban, 2006)�
In 1967, Dunn and Dunn (1978) created an instrument called the Learning style questionnaire (LSQ)� By 1975, this questionnaire had been tested and newly titled as the Learning style inventory (LSI)� The Czech version was created from three independent translations by Pýchová, Kantorová and Mareš in 1992 (Mareš & Skalská, 1994)� The questionnaire is designed for students of primary and secondary schools and it identifies what individual students prefer during their

205204 The Sensation Seeking Tendency and Learning Style of Grammar School Dita Culková
Figure 2. Difference in the sensation seeking tendency between boys and girls of sports and general classes (SST)
In terms of the learning style, lower persistence in learning was detected among the boys than among the girls (Tables 1 and 3; Figure 3)� Lower persistence was also found among the students from the sports classes than from the general classes (Tables 1 and 3; Figure 4)�
Table 3. Values of probability of LSD test in variable Learning persistence based on gender and type of class
gender class n {1} {2} {3} {4}1 boys general 61 0.010882 0�121310 0�8442342 boys sports 86 0.010882 0.000014 0.0140263 girls general 76 0�121310 0.000014 0�0679324 girls sports 72 0�844234 0.014026 0�067932
Figure 3. Difference in learning persistence (P) between boys and girls
Table 1. Results of two-factor Analysis of Variance, factual significance (Partial eta – squared – ηp2) and test efficiency for variables SST, Learning persis-
tence, Morning/evening learning, Extrinsic motivation – the teacher
n F p ηp2 Power of the test
SST – gender nb= 147, ng = 148 10.495 0.00134 0�034809 0�897761Persistence – gender nb= 147, ng = 148 7.956 0.00512 0�026613 0�802723Persistence – class type nsp = 158, nsgc = 142 9.687 0.00204 0�032215 0�87329Morning/evening learn-ing: gender vs� class type
nbsp = 86, ngsp�= 72nbgc = 61, nggc = 76
3.990 0.04670 0�013526 0�512384
Extrinsic motivation – the teacher: class type
nst =sp 158, nggc= 142 6.094 0.01414 0�020512 0�69163
Extrinsic motivation – the teacher:gender vs� class type
nbsp = 86, ngsp�= 72nbgc = 61, nggc = 76
1�499 0�22182 0�005125 0�230481
Notes: b – boys, g – girls, sp – students of sports classes, sgc – students of general classes, bsp – boys of sports classes, gsc – girls of sports classes, bgc – boys of general classes, ggc – girls of general classes; statistically significant values in bold
Table 2. Values of probability of LSD test in variable SST based on gender and type of class
gender class n {1} {2} {3} {4}1 boys general 61 0�871023 0.015907 0�1078432 boys sports 86 0�871023 0.005118 0�0549033 girls general 76 0.015907 0.005118 0�4081524 girls sports 72 0�107843 0�054903 0�408152
Figure 1. Difference between boys and girls in sensation seeking tendency (SST)
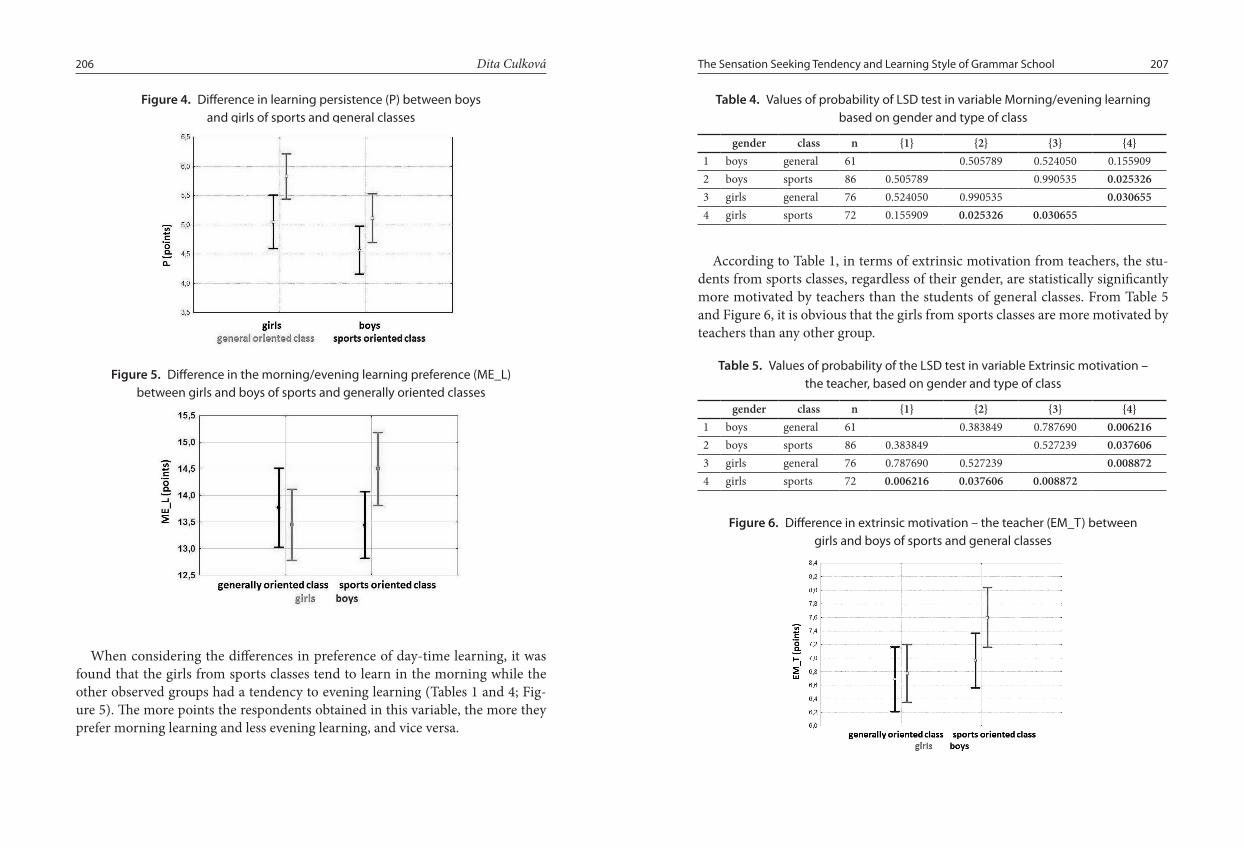
207206 The Sensation Seeking Tendency and Learning Style of Grammar School Dita Culková
Table 4. Values of probability of LSD test in variable Morning/evening learning based on gender and type of class
gender class n {1} {2} {3} {4}1 boys general 61 0�505789 0�524050 0�1559092 boys sports 86 0�505789 0�990535 0.0253263 girls general 76 0�524050 0�990535 0.0306554 girls sports 72 0�155909 0.025326 0.030655
According to Table 1, in terms of extrinsic motivation from teachers, the stu-dents from sports classes, regardless of their gender, are statistically significantly more motivated by teachers than the students of general classes� From Table 5 and Figure 6, it is obvious that the girls from sports classes are more motivated by teachers than any other group�
Table 5. Values of probability of the LSD test in variable Extrinsic motivation – the teacher, based on gender and type of class
gender class n {1} {2} {3} {4}1 boys general 61 0�383849 0�787690 0.0062162 boys sports 86 0�383849 0�527239 0.0376063 girls general 76 0�787690 0�527239 0.0088724 girls sports 72 0.006216 0.037606 0.008872
Figure 6. Difference in extrinsic motivation – the teacher (EM_T) between girls and boys of sports and general classes
Figure 4. Difference in learning persistence (P) between boys and girls of sports and general classes
Figure 5. Difference in the morning/evening learning preference (ME_L) between girls and boys of sports and generally oriented classes
When considering the differences in preference of day-time learning, it was found that the girls from sports classes tend to learn in the morning while the other observed groups had a tendency to evening learning (Tables 1 and 4; Fig-ure 5)� The more points the respondents obtained in this variable, the more they prefer morning learning and less evening learning, and vice versa�

209208 The Sensation Seeking Tendency and Learning Style of Grammar School Dita Culková
The power of the test of factual significance for preferred learning styles is sufficient in addition to the factors of gender and class type� Based on the above-mentioned results, hypothesis H2 is confirmed (significance level α = 0�05)� There are statistically significant differences in preferred learning styles between the students of general grammar school classes and the classes with extended P�E� and sports training�
Discussion
The present study rejects the hypothesis that “ the sensation seeking tendency of the students from the classes with extended P�E� and sports training is sta-tistically significantly higher than that of the students from general classes�” However, the research findings show that the sensation seeking tendency among boys may often be higher� Therefore, we can agree with Kuban’s (2006) statement that boys have a statistically higher tendency to sensation seeking than girls� The aforementioned studies (Farley, 1981; Wentzel, 1993; Stewin & Carter, 1999; Ang & Woo, 2003) demonstrate that students with a high sensation seeking tendency have a negative approach to school attendance and are more inclined to hyper-activity and crime than students with a low tendency� Furthermore, students with a high sensation seeking tendency are more often prone to having poor study skills and generally tend to be dissatisfied with teachers, the school and the learning process� Knowing that boys more frequently tend to seek sensation, their undesirable or disturbing behaviour can be identified as a normal fact based on their unsatisfied needs�
The hypothesis “there are statistically significant differences in preferred learning styles between the students of general grammar school classes and the classes with extended P�E� and sports training” was confirmed� Differences were found in the preference of the studying period of the day, learning persistence and inner motivation by the teacher� The boys from the classes with P�E� and sports specialization and the girls from the general classes tend to study in the evening� On the contrary, the girls from the classes with P�E� and sports specialization prefer to study in earlier parts of the day� These findings correspond to those of Slavík and Mareš (2004), whose theses deal with studying time preferences among sports talented girls attending 7th grades at elementary schools�
The students from the classes with P�E� and sports specialization are found less constant in their studying persistence� Less endurance in studying among the stu-dents from the P�E� and sports classes may seem to be surprising, as they practise
various sports, in which they are used to discipline, regular practise, self-denial and will�
The findings of Culková (2013) can be also mentioned: Culková detects that the more common characteristics of girls is a lower level of thrill and adventure seeking, not seeking new experiences, resistance to boredom and respect for social and moral norms� Culková also states that the common characteristic of boys from classes with P�E� and sports specialization is their lower learning responsibility, their need to have their homework structured, and their preference of experiential learning� Pettigrew and Zakrajsek (1984), Johnston and Bower (1997), D� Peters, Jones and J� Peters (2008) came to a similar conclusion that students of Physical Education subjects prefer hands-on experience, active experiments, and show a low interest in self-study and autonomous work� This statement can be partly confirmed by the finding that the boys and girls from the classes with P�E� and sports specialization prefer experiential learning (Culková, 2013)�
Blum, Beuhring and Rinehart (2000) demonstrate that teaching routines may lead to strong feelings of boredom, attention problems, interruptions and other negative phenomena, especially among students with a higher sensation seeking tendency� Positive intellectual results depend significantly on choosing the right teaching methods (Wentzel, 1993), and these findings need to be borne in mind, especially when teaching such students�
Conclusions
In conclusion, it can be stated that the objectives of the study were met� There were two alternative hypotheses tested, where the first one was rejected and the second one was confirmed�
At the significance level α = 0�05, the rejected hypothesis was the alternative hypothesis H1: the sensation seeking tendency of the students from the classes with extended P�E� and sports training is statistically significantly higher than that of the students from the general classes�
At the significance level α = 0�05, the second alternative hypothesis H2 was confirmed: there are statistically significant differences in preferred learning styles between the students of the general grammar school classes and the classes with extended P�E� and sports training�
Furthermore, answers to the research questions were found� Research question 1: are there any differences in the sensation seeking tendency between students of general grammar school classes and classes with extended physical education

211210 The Sensation Seeking Tendency and Learning Style of Grammar School Dita Culková
and sports training? If so, what differences are there? At the significance level α = 0�05, a higher sensation seeking tendency was detected in the boys group than in the girls group�
Research question 2: are there any differences in preferred learning styles between students of general grammar school classes and classes with extended physical education and sports training? If so, what differences are there? At the significance level α = 0�05, differences in persistence in learning, preference for the time of studying and extrinsic motivation from the teacher were found� The students from the sports classes are less persistent in learning than the students from the general classes and they are more motivated by teachers� The girls from the sports classes are motivated by teachers more than all the other groups, while the boys are less persistent than the girls regardless of their class type� The boys from the sports classes and the girls from the general classes more often prefer studying in the evenings, whereas the girls from the sports classes more often prefer to study in the mornings�
It is important to add that all the findings apply only to the 3rd-graders of the four-year study program and to the 7th-graders of the eight-year study program at Czech grammar schools� It also needs to be said that all the mentioned results are statistically significant, but the differences between the observed groups are not dramatic� That is confirmed by factual significance which shows a small effect in all the measured variables� Nevertheless, this study of the relationship between the sensation seeking tendency and preferred learning style contributes to the ongoing discussion concerning the educational process�
ReferencesAng, R�P�, & Woo, A� (2003)� Influence of sensation seeking on boys’ psychological adjust-
ment� North American Journal of Psychology, 5(1), 121 – 136�Blum, R�W�, Beuhring, T�, & Rinehart, P�M� (2000)� Protecting teens: Beyond race, income,
and family structure. Minneapolis, MN: University of Minnesota Printing Services�Carter, S�P�, & Stewin, L�L� (1999)� School violence in the Canadian context: An overview
and model for intervention� International Journal for the Advanement of Counseling, 21(4), 267 – 277�
Culková, D� (2013)� Vyhledávání mimořádných prožitků a preference učebního stylu studenta (Sensation Seeking and Learning Style Preferences)� Pedagogická orientace, 23(3), 364 – 405�
Dunn, R� (2000). Learning styles: Theory, research, and practice� National Forum of Applied Educational Research Journal, 13(1), 3 – 22�
Farley, F�H� (1981)� Basic process individual differences: A biological based theory of
individualization for cognitive, affective, and creative outcomes� In F�H� Farley, & N�J� Gordon (Eds�), Psychology and education: The State of the Union (pp� 9 – 31)� Berkeley, CA: McCutchon Publishing Corporation�
Jones, G�, Peters, D�, & Peters, J� (2008)� Preferred learning styles in students studying sports-related programmes in higher education in the United Kingdom� Studies in Higher Education, 33(2), 155 – 166�
Krásová, P�, & Rost, M� (2008): Tendence vyhledávat mimořádné prožitky u vysokoškoláků ve vztahu k osobnostním charakteristikám (Sensation Seeking Tendency of University Students in Relation to Personality Traits), Studia Kinanthropologica, 2(9), 238 – 245�
Kuban, J� (2001)� Komparace Sensation Seeking Tendency u hráčů sportovních her (Sensa-tion Seeking Tendency Comparison among Sport Game Players)� In� L� Čepička (Ed�), Hry v programech tělovýchovných procesů (pp� 41 – 46)� Plzeň: Západočeská univerzita�
Kuban, J� (2006)� Tendence k vyhledávání prožitku a její diagnostika (Sensation Seeking Tendency and its Diagnostics)� Hradec Králové: Gaudeamus�
Mareš, J�, & Skalská, H� (1994)� LSI – dotaznik stylů učeni pro žaky zakladnich a střednich škol (LSI – Learning Style Inventory for Primary and Secondary School Pupils)� Psy-chológia a patopsychológia dieťaťa, 29(3), 248 – 264�
O’ Connor, P�C�, & Jackson, C�J� (2008)� Learning to be saints or sinners: The indirect pathway from sensation seeking to behavior through mastery orientation� Journal of Personality, 76(4), 733 – 752�
Pettigrew, F�, & Zakrajsek, D� (1984)� A profile of learning style preferences among physical education majors� Physical Educator, 41(2), 85 – 89�
Rybenský, D� (2008)� Konstrukce standardů pro test prožitkovosti – Sensation Seeking Tendency (česká verze) (Standards Construction of Sensation Seeking Scale) (Czech version). Diplomová práce, Univerzita Hradec Králové, Pedagogická fakulta, Hradec Králové�
Slavík, V�, &� Mareš, J� (2004)� Dotazník stylu učení (Learning Style Inventory)� Praha: IPPP ČR�
Virostková, (1983)� An Analysis of the Relationships Among Student Achievement in Mathematics and Reading: Assigned Instructional Schedules and the Learning Style Preferences of a New York Suburban School’s 3rd, 4th, 5th, and 6th Grade Students� Disertační práce, St� John’s University, Queens, N�Y�
Wentzel, K�R� (1993)� Social and academic goals at school: Motivaion and achievement in early adolescence� Journal of early adolescence, 13(1), 4 – 20�
Zuckerman, M� (1978)� Sensation seeking� In H� London, & J� Exner (Eds�), Dimensions of personality. New York: Wiley�
Zuckerman, M� (1994)� Behavioral expressions and biosocial bases of sensation seeking� Cambridge: Cambridge University Press�
Zuckerman, M� (July 2001)� Personality and risk taking� Tenth Biennial Meeting of the International Society for the Study of Individual Differences� Edinburgh: The University of Edinburgh�


Pedeutology


Augmented Reality Applications Attitude Scale (ARAAS): Diagnosing the Attitudes of Future Teachers
DOI: 10.15804/tner.2017.50.4.17
Abstract The aim of the presented study is to identify the attitudes of future teachers (in pre-service teacher education) toward Augmented Reality (AR) applications� The innovation experience was carried out in the academic year 2016/17� For the collection of data, the Augmented Reality Applications Attitude Scale (ARAAS), by Küçük, Yilmaz, Baydaş & Göktaş (2014), was adapted to the Spanish context� It is a Likert scale grouped into three dimensions that determine the attitudes of future teachers toward the use of AR applications in education, which are Relevance, Satisfaction and Reliability� In order to analyse data, the statistical software SPSS 23�0 was used� The Bartlett test of sphericity and the Kaiser-Meyer-Olkin (KMO) test for sampling adequacy were also conducted� Results of the study led to the following conclusions: the students developed a favourable attitude in their role as future teachers toward the use of AR applications as learning tools, which have also provided deep learning�
Keywords: augmented reality, teaching attitudes, educational innovation, good educational practices, higher education
Introduction
The present study aims to show the impact of Augmented Reality (AR) in the development of educational activities with future teachers, experimenting with AR applications and implementing these in real teaching situations� In order to achieve
M.D. Díaz-Noguera, P. Toledo-Morales, C. Hervás-GómezSpain

217216 Augmented Reality Applications Attitude Scale M.D. Díaz-Noguera, P. Toledo-Morales, C. Hervás-Gómez
Hyun & So, 2015)� Increased learning, according to Azuma (1997), can be defined as a technique or display that meets three main characteristics: a combination of the real and virtual worlds, real-time interaction, and identical 3D registration of virtual and real objects� AR can be considered as one of the formats within the idea of Virtual Reality (VR) that ranges from a completely real environment to a completely virtual environment (Kesim & Ozarslan, 2012)�
Research Problem
The aim of this study was to identify the attitudes of future teachers (in pre-ser-vice teacher education) toward AR applications� More specifically, the study was focused on the following objectives:
1� To describe the attitudes of teachers in pre-service teacher education toward AR applications in the aspects related to: Relevance, Satisfaction, and Relia-bility�
2� To determine the inner consistency and reliability of the Augmented Reality Applications Attitude Scale (ARAAS)�
Research FocusOne of the most significant foci of the studies of AR is the importance of
motivation, since it is the force that initiates and drives behaviour� Therefore, it can be asserted that motivation provides the source of energy that accounts for students deciding to make an effort and get involved in the activity regardless of how difficult it is to be carried out, and the cognitive development it generates in them (Munnerley, Bacon, Wilson, Steele, Hedberg & Fitzgerald, 2012)�
These two factors are key for the self-regulation of learning (Pintrich, 1999), and it is clearly the academic aspiration of achieving goals which was analysed throughout the twentieth century� Some authors (Cuendet, Bonnard, Do-Lenh & Dilenbourg, 2013) developed three learning environments where prototypes and tests were designed and created, in which cooperative learning was achieved� AR poses great challenges to future teachers (Wu, Lee, Chang & Liang, 2013), identifying all the possibilities in the educational scope (Yuen, Yaoyuneyong & Johnson, 2011), detecting the difficulties and giving examples of their good practices (Waugh & Su-Searle, 2014)�
In this research line, what we consider essential is the level of satisfaction of students when they learn with AR devices� The most natural way of learning something new is doing it, as stated by the theory of experiential learning (Dünser,
this goal, educational modules with AR were designed� AR allows for enriching the information given by the objects or materials used� The difference between Augmented Reality and Virtual Reality (VR) is known in the scientific community� VR immerses us in a digital world� In our case, since we chose AR, we work in real environments where we can significantly enhance information� The history of AR is well documented in the technological literature, even though AR is a relevant topic worldwide in the field of education (Johnson, Levine, Smith & Stone, 2010)� In our case, it poses a great advancement in the educational processes�
Nowadays, the international scientific community analyses the consequences of Augmented Reality (AR) in terms of its adoption and incorporation into edu-cational practices� Revising the educational practices and recent research, or the current phenomena, such as the emergence of “Pokemon Go”, inspire us about the educational possibilities that this phenomenon can have, even the famous vide-ogames “Angry Birds” and “Candy Crush” (the successful mobile phone games)� In the future of educational ecosystems, AR and Virtual Reality (VR) are not only games and gadgets, but they are becoming communication tools themselves�
For some of the reviewed authors, they are trendsetter ways of communication and show us what they call “new communication tools” or “new media” (Waugh & Su-Searle, 2012)� If online learning has brought us the democratisation of knowledge, then AR offers the democratisation of virtual teaching in a real world and VR provides the democratisation of experience (Clark, 2016)� The educational scientific community is eager to do research into the possibilities that AR may integrate in educational centres, and the roles that the training and education of future teachers will play in the development of this process�
The AR scenarios help students contextualise information and, at the same time, reinforce it with additional information in different formats and symbolic systems, which allows for individualisation of training and adaptation to students’ different types of intelligence and preferences (Jeřábek, Rambousek & Wildová, 2014)� These scenarios or contexts may be real, fictional or designed ex post facto with the aim of achieving a certain intentional goal to acquire knowledge� Sub-merging in digital environments or activities causes attitude change in students toward that particular learning and increases their motivation� From the research reviewed, it was confirmed that they also increase critical thinking in students, as well as their academic performance (Billinghurst, Clark & Lee, 2015)�
Recent studies (Cabero & Barroso, 2016) consider AR as an emerging technol-ogy in the field of education, to which the university level can be added (Liu & Tsai, 2013), without ignoring the innovative approaches associated with this appli-cation (Wu, Lee, Chang & Liang, 2013)� We refer to training ecosystems (Han, Jo,

219218 Augmented Reality Applications Attitude Scale M.D. Díaz-Noguera, P. Toledo-Morales, C. Hervás-Gómez
In the present study, the instrument developed by Küçük, Yilmaz, Baydaş & Göktaş (2014) was adapted to the Spanish context� Item 18 “I want AR applications to take place in course books in the future” was removed, and the following items were added: develop positive emotional tones, difficulties, and good practices, collaborative and learning environment, motivation, mixed learning, cognitive skills, change of attitude, learning satisfaction, etc�
This instrument consists of 23 items, measured in a Likert scale of five points 5 (1= Strongly Disagree, 2= Disagree, 3= Neutral, 4= Agree, 5= Strongly Agree), and organised in three dimensions that determine the attitudes of future teachers toward the use of AR applications in pre-service teacher education, which are Relevance, Satisfaction, and Reliability�
To analyse the data, the statistical software SPSS 23�0 was used� Exploratory factor analysis was conducted to obtain the factor structure� The Bartlett test of sphericity and the Kaiser-Meyer-Olkin (KMO) test for sampling adequacy were also conducted� Factor extraction was performed through principal component analysis; the eigenvalues and the percentage of applied variance were determined� An oblique rotation was conducted, since the possible factors should be strongly correlated� KMO of 0�908 was obtained, which indicates adequacy to the model and significant Bartlett test of sphericity (p=�000)� Three factors were obtained, which account for 58�4% of the variance (Table 1)�
Reliability was determined with Cronbach´s Alpha by factor and global to the instrument� This indicator gave good results in all cases: Satisfaction (α =�854), Relevance (α =�795), and Reliability (α =�794)�
Results
Validity and ReliabilityPrior to factor analysis, the Kaiser-Meyer-Olkin Measure of Sampling Adequacy
(KMO) was checked and the Bartlett Test of sphericity was analysed� The calcu-lated KMO was 0�908, above the recommended valued of 0�6 (Field, 2009), which indicates that the factor analysis is appropriate for the data set� The results of the Bartlett Test of sphericity were (χ2 =1621�667, df =253, P = �000), suggesting the factor ability of the correlation matrix (Field, 2009)�
Cronbach’s alpha for the 23-item scale (α = �923) demonstrates high internal consistency� Analysing the internal consistency of the subscales, we found the following highly reliable: Satisfaction (F2) (α = �854), Relevance (F1) (α = �795), and Reliability (F3) (α = �794) (Tables 1 and 2)�
Walker, Horner, & Bentall, 2012)� In this regard, we add all the studies that assess the mixed-learning environments in which AR plays a relevant role (Yusoff, Ibra-him, Zaman, & Ahmad, 2011), taking into account students’ personal differences�
Research Methodology
General Background of ResearchIn order to carry out the present research, a non-experimental methodology was
followed; more specifically, a descriptive study based on surveys was conducted�The sample of the study consisted of all the students registered in the Faculties
of Educational Sciences of five Spanish universities during the 2016/2017 aca-demic year� The Faculties of Educational Sciences are organised by degrees (Early Childhood Education, Elementary Education, Pedagogy, and Physical Activity and Sport Sciences) and by groups (a maximum of nine, although not all the degrees offer the same number of groups)�
In this study, non-random or intentional sampling was conducted, and the criterion was to provide the students with the easy access that researchers have� Regarding the stratum, we intended to include a wide representation of students from every group, every shift (morning and afternoon), and both genders, i�e�, men and women from all the Educational Faculties from the different Spanish universities involved, the latter being a slightly more complex aspect since in this kind of degrees the majority of students are women�
SampleIn our case, the present study consisted of 1,533 students registered in the
2016/2017 academic year, in the Degree in Elementary Education, from five Spanish universities, of whom 450 (29%) were male and 1,103 (71%) were female� Throughout the course of the study, they took Information and Communication Technologies as a core subject, which had its practical lectures focused on the use of AR in pre-service teacher education�
Instrument and ProceduresFor data collection, the Augmented Reality Applications Attitude Scale
(ARAAS), created by Küçük, Yilmaz, Baydaş & Göktaş (2014), was used� The data were collected from 167 students (84 male, 83 female) in the 5th grade from 7 different secondary schools� The final scale had 15 items grouped into 3 factors�

221Augmented Reality Applications Attitude Scale[220]
Table 2. Cronbach´s Alpha and KMO for the subscales of the Augmented Reality Applications Attitude Scale (ARAAS)
Subscales Number of items Cronbach-α KMO Relevance 9 �795 �833 Satisfaction 9 �854 �879 Reliability 5 �794 �801 Total 23 �923 �908
Student attitudes
The mean values of the attitudes of future teachers in pre-service teacher edu-cation toward AR applications according to the items and factors of the ARAAS are shown in Table 3� The highest score was obtained in AR usage reliability (ẋ = 3�63), followed by satisfaction (ẋ = 3�48) and relevance (ẋ = 2�66), which is below the average score of attitudes�
With regard to the results obtained in the items of the scale, it is seen in Table 3 and Figure 1 that no item reaches the maximum value of 5, which indicates that the students have a middle attitude toward the use of AR for teaching� The items of reliability obtained mean values over 3, with the highest items being those of “I think that the generalisation of this type of AR initiatives would significantly improve the quality of university teaching” (ẋ = 3�78), and “This activity with AR makes me develop other cognitive skills” (ẋ = 3�74)� The results indicate that the future teachers show reliability with respect to the fact that the use of AR allows for improving the quality of university teaching, as well as developing cognitive and instrumental skills throughout their training, and sharing ideas and new educational perspectives�
Satisfaction shows high levels, above the average value of 3, except in the item “AR applications do not catch my attention” (ẋ = 1�99), which obtained the lowest scores in the satisfaction of future teachers� The items with the highest scores are “Demonstration of 3D objects, videos and animations with AR applications increases my curiosity” (ẋ = 4�07), “In general, I think that the use of AR indicates that the teacher is interested in teaching” (ẋ = 3�80), “Using AR motivates me to work more on this module” (ẋ = 3�76), and “I enjoy the lectures in which AR applications are used” (ẋ = 3�73)� These results indicate that the future teachers, after experiencing the use of AR as a teaching tool, show user satisfaction levels above the average�
Table 1. Cronbach´s alpha for the factors and items of the Augmented Reality Applications Attitude Scale (ARAAS)
Items Factor 1 Factor 2 Factor 3 Relevance (α = .795) Loadings I get bored while I use AR applications -�809 It is difficult to use AR applications �882 The AR applications of 3D objects provide a feeling of reality �773 Studying the topics is more difficult due to AR applications �757 I would like to use AR applications in other topics and modules
�800
The use of AR applications in the classroom is a waste of time �731 AR applications make my learning difficult because they confuse my mind
�736
There is no need to use AR applications in the classroom �732 AR improves my opinion about the content of the subject (practical view)
�651
Satisfaction (α = .854) Loadings
I gain better focus on the topic when AR applications are used
�664
Demonstration of 3D objects, videos and animations with AR applications increases my curiosity
�781
I attend a lecture with enthusiasm when AR applications are used
�704
I enjoy the lectures in which AR applications are used �879 AR applications do not catch my attention �760 I enjoy studying subject topics with AR applications �776 Using AR motivates me to work more on this module �826 I feel more involved in this module (AR) than if I worked in a more theoretical manner (useful view)
�589
In general, I think that the use of AR indicates that the teach-er is interested in teaching
�756
Reliability (α = .794) Loadings
I think that the generalisation of this type of AR initiatives would significantly improve the quality of university teaching
�795
Working with AR allows me to share my ideas, answers and views with my teacher and classmates
�733
This activity with AR makes me develop other cognitive skills (analysis, synthesis, critical thinking)
�689
AR has changed my attitude as a student, not only in this module, but generally in all subjects
�645
The use of AR makes me develop other instrumental skills (handling of tools, information search) in my way of studying
�890

223222 Augmented Reality Applications Attitude Scale M.D. Díaz-Noguera, P. Toledo-Morales, C. Hervás-Gómez
teaching/learning process; they do not get bored, and they think that it is easy to use, prevents a waste of time, provides a feeling of reality, and increases their motivation to study topics in AR, which makes it easier for them to acquire new knowledge�
Figure 1. Mean value of the scores of each of the items of the Augmented Reality Applications Attitude Scale (ARAAS)
Discussion
Considering the perceptions of the students, and meeting the objectives pro-posed in the presented study, it can be concluded that AR applications are efficient since they improve students’ personal projects� AR helped the students to immerse in complex topics and increased their motivation, encouraging them to design and create multimedia materials proposed in the learning modules� There was a change of attitude towards AR, in particular, and about the use of Information and Communication Technologies, in general� The results of this study were not compared in relation to sex, course or shift� Also, no data was provided about another hypothesis, which considers student evaluation, learning orientation, the effort to achieve the goals proposed, etc�
The main contribution of this study is that AR improved the learning processes and enhanced the acquisition of professional skills� Moreover, AR provided the description of very positive attitudes in the students who had experienced it, as shown by the statistical data�
Table 3. Dimensions and items of the Augmented Reality Applications Attitude Scale (ARAAS)
Items MeanẊ
Deviationδ Dimensions
Item 1 2�12 1�112 RelevanceẊ = 2�66δ = �365
Item 2 2�26 �937 Item 6 3�94 �926 Item 8 2�46 1�192 Item 9 3�73 1�065 Item 10 1�93 1�046 Item 12 1�75 �855 Item 13 2�07 1�043 Item 16 3�76 �901 Item 3 3�30 �987 Satisfaction
Ẋ = 3�48δ = �525
Item 4 4�07 �915 Item 5 3�54 �918 Item 7 3�73 �988 Item 11 1�99 1�130 Item 14 3�50 �911 Item 15 3�76 �932 Item 17 3�69 1�115 Item 18 3�80 �918 Item 19 3�78 �959 Reliability
Ẋ = 3�63δ = �666
Item 20 3�67 �909 Item 21 3�74 �809 Item 22 3�29 �910 Item 23 3�67 �912
With respect to relevance, the items with the lowest scores are: “The use of AR applications in the classroom is a waste of time” (ẋ = 1�93), “AR applications make my learning difficult because they confuse my mind” (ẋ = 1�75), “There is no need to use AR applications in the classroom” (ẋ = 2�07), and “I get bored while I use AR applications” (ẋ = 2�12)� On the other hand, the items with the highest scores are: “The AR applications of 3D objects provide a feeling of reality” (ẋ = 3�94) and “AR improves my opinion about the content of the subject (practical view)” (ẋ = 3�76)�
The results of the relevance dimension indicate that the future teachers in pre-ser-vice teacher education show very positive attitudes toward the use of AR in the

225224 Augmented Reality Applications Attitude Scale M.D. Díaz-Noguera, P. Toledo-Morales, C. Hervás-Gómez
Conclusions
The results of the presented study allow for drawing the following conclusions: the students developed a favourable attitude in their role as future teachers toward the use of AR applications as a learning tool, which provided them with great immersion or increased their resources to understand and learn disciplines with a high degree of abstraction� They felt happy with the new knowledge acquired, and their motivation increased with the use of the applications� However, it is important to highlight that, due to the exploratory nature of this study, a care-ful interpretation of the results is advisable, especially when generalising them in other contexts� Nevertheless, the initial character of this work opens new perspectives of special interest in research in this field (expand the study to the whole teaching staff, design and create new instruments that allow for a more detailed analysis of the different attitudes and professional teaching skills, include new contexts, create more mixed interactive environments, etc� (Dünser, Walker, Horner & Bentall, 2012)�
Augmented reality has allowed us to identify and analyze the effects of its use on the curricula of future teachers� Regarding the impact that these practices have on educational centers, we must refer to the results obtained in the following study, which are consistent with the objectives we set in the present research, such as: to analyze the effects of its use on educational environments, whether it modifies and facilitates the acquirement of knowledge, attention and motivation, as well as students’ academic performance, and the perceptions they had after the use of this novel technology (Toledo-Morales & Sánchez-García, 2017)� AR has gained prominence as a key digital resource for the transformation of education systems around the world� Especially in the last four years, our contribution has been in the work line proposed in the Horizon Report 2017, and of course in Horizon 2020 and 2030 as well�
We have stated that the ways to learn have changed, and one of the most significant implications is that future teachers must integrate new strategies and resources in their educational projects and performance� Since we are a Faculty of Education, we had the opportunity to experiment with future professionals about an educational reality of the future� The students had the chance to approach this cultural change, where the curriculum was enriched and the available resources, at that time, were given the best educational use�
Finally, we would like to highlight the idea that AR applications can be used as communication tools themselves, which opens other research lines on aspects that could be developed in current training ecosystems�
AcknowledgementsThis study is part of the R&D project funded by the State Plan of Scientific and Technical Excellence Development 2013 – 2016 (RAFODIUM EDU2014 – 57446-P) (Spain)� We would like to thank the director of this research project, Professor Julio Cabero-Almenara�
References Azuma, R�T� (1997)� A survey of augmented reality� Presence: Teleoperators and Virtual
Environments, 6(4), 355 – 385�Billinghurst, M�, Clark, A� & Lee, G� (2015)� A Survey of Augmented Reality� Founda-
tions and Trends Human-Computer Interaction, 8(2 – 3), 73 – 272� doi:http://dx�doi�org/10�1561/1100000049
Cabero, J� & Barroso, J� (2016)� The educational possibilities of Augmented Reality (Posi-bilidades educativas de la realidad aumentada)� NAER, New Approaches in Educational Research, 5(1), 46 – 52�
Clark, D� (2016)� 10 ways Pokemon Go portends AR in learning. Retrieved May 10, 2017, from http://donaldclarkplanb�blogspot�com�es/2016/07/10-ways-pokemon-go-por-tends-ar-in�html
Cuendet, S�, Bonnard, Q�, Do-Lenh, S� & Dilenbourg, P� (2013)� Designing augmented real-ity for the classroom� Computer Education, 68, 557 – 569� doi:http://dx�doi�org/10�1016/j�compedu�2013�02�015
Dünser, A�, Walker, L�, Horner, H� & Bentall, D� (2012)� Creating interactive physics educa-tion books with augmented reality� Proceedings of the 24th Australian Computer Human Interaction Conference, 107 – 114� doi:10�1145/2414536�2414554�
Field, A�P� (2009)� Discovering statistics using SPSS, Sage, London�Han, J�, Jo, M�, Hyun, E� & So, H� (2015)� Examining young children’s perception toward
augmented reality-infused dramatic play� Education Technology Research Development, 63(3), 455 – 474� doi:10�1007/s11423 – 015 – 9374 – 9�
Jeřábek, T�, Rambousek, V� & Wildová, R� (2014)� Specifics of visual perception of the augmented reality in the context of education� Procedia-Social and Behavioral Sciences, 159, 598 – 604� doi:10�1016/j�sbspro�2014�12�432
Kesim, M� & Ozarslan, Y� (2012)� Augmented Reality in Education: Current Technolo-gies and the Potential for Education� Social and Behavioral Sciences, 47, 297 – 302� doi:10�1016/j�sbspro�2012�06�654
Küçük, S�, Yılmaz, R�M�, Baydaş, O� & Göktaş, Y� (2014)� Augmented Reality Applications Attitude Scale in Secondary Schools: Validity and Reliability Study� Education and Science, 39(176), 383 – 392� doi:http://dx�doi�org/10�15390/EB�2014�3590
Liu, P�H�E� & Tsai, M�K� (2013)� Using augmented-reality-based mobile learning material in EFL english composition: an exploratory case study� British Journal of Educational Technology, 44(1), 1 – 4� doi:10�1111/j�1467 – 8535�2012�01302
Munnerley, D�, Bacon, M�, Wilson, A�, Steele, J�, Hedberg, J� & Fitzgerald, R� (2012)� Con-

226 M.D. Díaz-Noguera, P. Toledo-Morales, C. Hervás-Gómez
fronting an augmented reality� Research In Learning Technology, 20, 1 – 10� doi:http://dx�doi�org/10�3402/rlt�v20i0�19189
Pintrich, P�R� (1999)� The role of motivation in promoting and sustaining self-regulated learning� International Journal of Educational Research, 31(6), 459 – 470� doi:http://dx�doi�org/10�1016/S0883 – 0355(99)00015 – 4
Rost, M� (2010)� Generating student motivation. Retrieved May 10, 2017, from http://www�pearsonlongman�com/ae/worldview/
Toledo-Morales, P� & Sánchez-García, J�M� (2017)� Augmented Reality in Primary Education: effects on learning� (Realidad Aumentada en Educación Primaria: efectos sobre el aprendizaje)� Revista Latinoamerincana de Tecnología Educativa. 16 (1), http://dx�medra�org/10�17398/1695 – 288X�16�1�79
Waugh, M� & Su-Searle, J� (2014)� Student Persistence and Attrition in an Online M�S� Pro-gram: Implications for Program Design� International Journal on E-Learning, 13(1), 101 – 121� Chesapeake, VA: Association for the Advancement of Computing in Educa-tion (AACE)� [online] Available at: https://www�learntechlib�org/p/38649�
Wu, H�K�, Lee, S�W�Y�, Chang, H�Y� & Liang, J�C� (2013)� Current status, opportunities and challenges of augmented reality in education� Computer & Education, 62, 41 – 49� doi:http://dx�doi�org/10�1016/j�compedu�2012�10�024
Yuen, S�, Yaoyuneyong, G� & Johnson, E� (2011)� Augmented reality: An overview and five directions for AR in education� Journal of Educational Technology Development and Exchange, 4(1), 119 – 140�
Yusoff, R�C�M�, Ibrahim, R, Zaman, H�B� & Ahmad, A� (2011)� Evaluation of user accept-ance of mixed reality technology� Australasian Journal of Educational Technology, 27(8), 1369 – 1387�
Zimmerman, B�J� & Martinez-Pons, M� (1988)� Construct validation of a strategy model of student self-regulated learning� Journal of Educational Psychology, 80(3), 284 – 290� doi:10�1037/0022 – 0663�80�3�284

Self-assessment of Attitudes Towards Media and the Knowledge of Safety in Cyberspace of Future
Pedagogues and Teachers in Croatia and Poland
DOI: 10.15804/tner.2017.50.4.18
AbstractThe purpose of the presented research was to explore, compare and describe the level of knowledge on selected issues concerning safety in cyberspace among people preparing for the profession of a pedagogue and a teacher, and to present opinions of the examined people on their attitudes towards the broadly understood media� The research was comparative and comprised a group of 519 students of pedagogical and educational majors of the University of Split (Croatia) and the University of Silesia in Katowice (Poland)�
Keywords: digital literacy, higher education, Internet safety, media literacy, pedagogical media competencies
Introduction
Media, information and communication technologies (ICT), Internet-enabled devices are present in many areas of life of both the family itself (Petani & Kara-matić Brčić, 2014), and of the globalized society� In higher education they allow an increasing number of people to use sources of knowledge (Khalid & Pedersen, 2016)� On the one hand, they are a part of culture and social processes, creating both positive and negative phenomena, and, on the other hand, they constitute tools which have the potential to enrich and improve many activities�
Monika FraniaPoland

229228 Self-assessment of Attitudes Towards Media Monika Frania
stood as means of communication, tools and as the message itself� On the other hand, safety in cyberspace concerned technical aspects of using the Internet, but also in this case a great emphasis was put on the cultural and social phenomena occurring in this area, which were particularized further in the article�
The dependent variables in the presented study section referred to the respond-ents’ attitudes to the media determined in the self-assessment and the level of knowledge about selected cyber safety phenomena�
Answers given in the questionnaire and the score in the knowledge test will be the indicators of these variables� The independent variables referred to the country of origin (Croatia/Poland), the study major and the level of advancement�
Methods
In the research presented below, the researcher used: a document analysis method, a test which was supposed to determine the respondents’ level of knowledge about the selected issues related to the widely understood safety in cyberspace and a diagnostic survey with the use of a questionnaire�
The research group consisted of 519 people (n = 519)� It included 233 respond-ents studying pedagogy or teacher training at the University of Split (Croatia) and 286 respondents studying pedagogy (including early childhood and pre-primary education) and special pedagogy at the University of Silesia in Katowice, Poland� Among the 519 examined students, as many as 94% are women� The respondent population consists of people who started a study major which enables them to do educational work with children and teenagers� Therefore, it may be assumed that this is the group which should possess high competencies with regard to media literacy and digital literacy, which would be an answer to the challenges of the con-temporary mediatised world� Also, this group may face tasks concerning pupils’ media education� At the same time, the respondents are people currently being on the border of two communities – on the one hand, they prepare for pedagogical work, while on the other hand, they themselves are still students� Owing to time frames and their age, they are often classified as the so-called generation Y, for whom technical novelties, media devices and cyberspace should not be a problem�
It is impossible to directly observe educational media competencies (Tiede, Grafe & Hobbes, 2015) and there is hardly any dedicated complex quantifiable measurement� An element of special interest in the author’s research was there-fore the level of knowledge about safety in cyberspace� By analyzing the future teachers’ knowledge, the author refers here to the concept of didactic learning
Knowledge and competencies in the described scope are often defined as ML (media literacy), MIL (media information literacy) or DL (digital literacy)� These are highly desired attributes for all teaching process participants in higher edu-cation� In the subject literature, particularly in the Anglo-Saxon countries, it is possible to find reviews of the previous research on digital literacy in the context of different target groups in university education (Littlejohn, Beetham & McGill, 2012)� There is a need to extend the presence of specialists in various domains in the process of implementation of the whole spectrum of media education and critical thinking training (Fedorov & Levitskaya, 2015)�
At the same time, there is an emphasis on the need to use media-information and communication technologies in the process of teaching and learning� In 2012 – 2014, Fredrik Mørk Røkenes and Rune Johan Krumsvik (2016) carried out observation-based research into the didactic use of media and digital competen-cies in the context of teaching English as a second language (ESL)� In 2012, the research was conducted on a group of 158 primary school teachers in Croatia within urban and rural areas� In the summary, the authors emphasize that the students preparing for the profession of educators and teachers should be taught multimedia didactics to know how to teach their pupils to use technological tools, e�g� tablet, computer, smartphone, social media, etc� (Topolovčan, Toplak & Matijević, 2013)�
The purpose of the narrow area of research presented in this article was to explore, compare and describe the level of knowledge on the selected issues concerning safety in cyberspace among people preparing for the profession of a pedagogue and a teacher, and to present opinions of the examined people on their attitudes towards the broadly understood media� No comparisons in that field had been made so far in these two countries� Particularizing the purpose defined in such a manner, the empirical search was focused on analyses which were supposed to provide answers to the research problems, formulated in the form of the following questions:
What is the self-assessment of the attitudes towards media among people preparing for the profession of a pedagogue and a teacher in Croatia and Poland?
What is the level of knowledge about selected phenomena concerning safety in cyberspace among the respondents?
Do the country of origin, major and the level of advancement of studies differ-entiate the level of knowledge in the examined scope and if they do, how?
Comparative analyses were designed and conducted in two countries� To addi-tionally present diversity or its absence in the obtained results, they were placed in a broader context of valid teaching programmes� The media were widely under-

231230 Self-assessment of Attitudes Towards Media Monika Frania
Analysis of documents was related to the curriculum in education at both universities� Specifically, the researcher focused on media and technology related subjects�
Results
During participation in the diagnostic survey, the respondents were asked to define their attitudes towards the broadly understood media� However, it did not involve classifying themselves as critical or undiscriminating recipients� This selec-tion, for obvious reasons, would have been evocative and – as can be supposed – it could be partly linked to wishful thinking� The respondents could specify their attitudes as: positive, negative, or neutral� The analysis was conducted with the chi-square test of independence in order to verify whether people from Croatia differ from people from Poland in terms of assessment of their attitudes towards media� Table 1 presents the results obtained in the test without considering the questionnaires, in which the respondents did not provide answers�
Table 1. Nationality/country of origin and assessment of the respondents’ attitudes towards media in the opinion of the examined people (N = 519)
The attitude towards media can be identified as:
CountryCroatia Poland
n % of the group n % of the groupPositive 149 65�07 140 50�18Neutral 70 30�57 123 44�09Negative 10 4�37 16 5�73Total 229 100�00 279 100�00
The analysis with the chi-square test of independence demonstrated statistically significant differences: chi2(2) = 11�41; p = 0�003� This means that the people from Poland more often than the people from Croatia assessed their attitudes as neutral, while the people from Croatia more often than the people from Poland had a positive attitude towards media� However, the largest number of people in both groups identified their attitudes as positive� Among the people from Croatia it amounted to 65% of the group, and from Poland – 50% of the respondents� The least numerous part in both groups consisted of the respondents evaluating their attitudes towards media as negative�
outcome measurement� The basis is Boleslaw Niemierko’s “Taksonomia ABC” [“ABC Taxonomy”]� In the author’s research, the test was intended to measure the memorizing and understanding of the message (level I: categories A and B) (Niemierko, 2009)� In Bloom’s taxonomy, those issues can be defined in the cognitive (knowledge-based) domain as two first levels of objectives from a group of six: remembering and comprehending (e�g�, Bloom et al�, 1956; Adams, 2015) The research also refers to the first two levels of the data–information–knowledge–wisdom (DIKW) hierarchy (Rowley, 2007)�
Safety was widely understood as it applied not only to technical protection of using the Internet, which is widely described in the literature (e�g�, Spalević, 2014), but also to the social phenomena occurring there, such as: cyberstalking, child grooming, phishing, cyberbullying, cyberbaiting or trolling� After the initial stage and pilot research, several issues were selected and a knowledge test questionnaire was created�
The test was voluntary and anonymous� Each questionnaire had a code, which made it possible to match it with a survey questionnaire filled in by the same respondent without disclosing their personal data� The respondents could obtain a maximum of 20 points in the test� It was assumed that the level of knowledge measured with the test can be identified on a five-degree scale as very high (17 – 20), high (13 – 16), average (9 – 12), low (5 – 8), and very low (0 – 4)� The possible score was divided into four points in five categories� If a respondent did not get any point, they were qualified to the last category – very low�
The respondents were also asked to fill in an anonymous survey questionnaire, which contained close-ended questions and scale questions, where the respond-ents selected from among 5 degrees of the intensity of a given feature� The scale used was Likert’s Scale� This method involved a broader area of issues� For the purpose of these analyses, the emphasis will be put only on self-assessment of attitudes towards media, which the respondents could identify as: positive, neutral or negative�
The percentage distribution and descriptive statistics of the data were prepared after the analysis of answers� A statistical analysis with the use of the Kruskal-Wal-lis and Mann-Whitney U test, using the Statistica program was performed to verify whether people from different countries, studying different majors or being more or less advanced in the course of the studies differed statistically in the selected aspects� Additionally, the chi-square test of independence was used� The tests and analyses were conducted between March and May 2016�

233232 Self-assessment of Attitudes Towards Media Monika Frania
Table 3. Nationality/country of origin and the level of the knowledge test obtained by the examined people (N = 519)
Knowledge test Country
Croatia Polandn % of the group N % of the group
Very high (17 – 20 points) 11 4�72 42 14�69High (13 – 16 points) 101 43�35 159 55�59Average (9 – 12 points) 106 45�49 69 24�13Low (5 – 8 points) 7 3�00 7 2�45Very low (0 – 4 points) 8 3�43 9 3�15Total 233 100�00 286 100�00
Analysis with the use of the Mann-Whitney U test demonstrated statistically significant differences: Z = 5�35; p <0�001� This means that the people from Poland obtained a higher level in the knowledge test than the people from Croatia� A very high level of knowledge – measured with the test – was obtained by 14�69% of the Polish students and 4�72% of the Croatian students� A high level of knowledge was demonstrated by 55�59% of the examined group from the University in Katowice (which is the most numerous group) and 43�35% of the group from the University of Split� The most numerous group among the future Croatian pedagogues and teachers are people whose level of knowledge should be identified as average – 45�49%; among Poles it is – 24�13%� The least numerous group in both countries included people with a very low knowledge� Here, the result were similar and oscillated around 3%�
Since the respondents were representatives of different levels of studies and years, the research aimed at verification whether this factor is significant for the possessed knowledge� In this case, the nationality of the students was not taken into account� The tested years of study were chosen randomly�
Analyses with the use of the Mann-Whitney U test and analysis with the Kruskal-Wallis test were carried out in order to verify whether people studying in different years differed from each other in terms of the obtained results of the knowledge test� Table 4 presents the results obtained in the tests�
When making an attempt to diagnose the level of knowledge about the so-called digital literacy, the subject matter was narrowed only to the Internet, as an example of the so-called new converging, interactive, digital, and virtual media� Each respondent could obtain a maximum of 20 points in the test� The most numerous group of the Croatian students (17�16%) consisted of those who obtained 11 points in the knowledge test� In this group, none of the examined obtained the overall sum of 19 or 20 points� Two people obtained zero points� Among the Polish students, the majority obtained 15 points (15�73% of the group); two people obtained a maximum result of 20 points, and seven people obtained 19 points� In the Polish group, as many as four people obtained zero points�
The obtained raw results were subjected to further analyses� A point-based aver-age was determined in two subgroups and it compared them against each other� In order to verify whether the people from Croatia differed in the statistically significant manner from the people from Poland in terms of the obtained results of the knowledge test, an analysis was conducted with the use of the Mann-Whitney U test, which allows for comparison of the two groups (Table 2�)
Table 2. Nationality/country of origin and the result of the knowledge test obtained by the examined people (N = 519)
Variable Country Average Standard deviation
Result of the Z test
Importance level
Knowledge test Croatia 12�28 3�03 5.93 <0.001Poland 13�60 3�44
The analysis with the use of the Mann-Whitney U test demonstrated statistically significant differences� This means that the people from Poland obtained higher knowledge test results than the people from Croatia� The average for the students from Poland amounted to 13�60 points and for the students from Croatia – 12�28 points�
At the next stage, four-point intervals on a 5-grade scale of knowledge level were determined, as a result of which each respondent was qualified into the appropriate interval� In order to verify whether the people from Croatia differed in a statistically significant manner from the people from Poland in terms of the level obtained in the knowledge test, analysis was conducted with the use of the Mann-Whitney U test� Table 3 presents the results obtained in the test�

235234 Self-assessment of Attitudes Towards Media Monika Frania
Discussion
Although studies of this type have been conducted in other countries, compar-ative analyses have not been conducted in Poland and Croatia before� To educate future citizens to become knowledge society members, both in Poland and in Croatia, curricula changes have been made in the education of future teachers, pedagogues and educators� It is very important to analyze the knowledge of future teachers in the field of new phenomena in cyberspace� The dynamics of these issues is very high�
It is worth considering the obtained results in the context of the findings of Jennifer Tiede, Silke Grafe and Renee Hobbs (2015), who researched Pedagogical Media Competencies in relation to the education of future teachers in the US and Germany� The research was based on analysis of legal documents, scientific litera-ture and teaching programmes in higher education institutions in both countries (Tiede et al�, 2015)� Both in the case of universities in Germany and in the USA, there are three dominant ways of implementing media pedagogical knowledge into the teaching programmes: elective courses, being a part of the main program of teacher training; additional certificates and separate studies for people prepar-ing for the teaching profession and for in-service pedagogues; graduate studies concerning one or several areas under media pedagogy (Tiede et al� 2015)� The author’s studies were to demonstrate diversity or its absence in the knowledge level in the two countries with regard to the differences in implementation of the content related to media and new technologies in education programmes for pedagogues and teachers�
Remarkable conclusions were also drawn by the researchers in Australia� In 2012, 100 undergraduate pre-service teacher education students enrolled in a Bachelor of Education programme in an Australian university were examined� What is interesting is that the researchers noticed a lack of translation of high competencies and knowledge concerning media in everyday life into educational actions and future professional life� This gap should be eliminated as soon as possible, thus, it is impossible not to introduce new technologies into educational programmes during studies (Duncan-Howell, 2012)�
In the author’s research, the knowledge concerning cyberspace may be deter-mined as average bordering on high or as high despite the fact that the education programmes lack a widely developed area related to the media in the context of the development of media competencies� In the case of the University of Split, the respondents reported that the issues related to the media education and media in education – except for typical IT classes – are non-obligatory and facultative
Table 4. Year of studies and the result of the knowledge test obtained by the examined people (N = 519)
Variable The level of studies Year of studies Average Standard
deviationTest
resultImpor-
tance levelKnowledge test
1st degree studies (Bachelor’s degree studies)
1 13�22 3�61 Z=0�72 0�4703 13�58 3�09
Knowledge test
2nd degree studies (Master’s degree studies)
1 12�50 3�40 Z=1�78 0�0752 14�19 2�18
Knowledge test
Integrated major 1 12�06 3�75 H=0�94 0�9182 12�23 1�953 11�52 3�674 12�24 2�835 12�00 2�92
The highest average (14�19) was obtained by the students of the second year of the Master’s degree studies� However, analyses with the use of the Mann-Whitney U test and analysis with the use of the Kruskal-Wallis test did not show any statisti-cally significant differences� This means that the people studying in different years did not differ from each other in terms of the obtained results of the knowledge test in a statistically significant manner�
The separation of the respondents from different stages of studies in the analyses was intentional� The author wanted to indicate: an increase or lack of increase in memorized and understood messages, which can be referred to the level of studies� In the case of the first and second degree studies, an increase in the average score obtained in the test was found� This is not a big increase and as the analysis showed, it cannot be treated as statistically significant, but the upward trend does occur� The students, along with attaining successive stages, participated in an increasing number of classes, and so they gained competences� The highest grade point average was obtained by the second year students the during the second degree studies (the country of origin was not taken into account here)� In this study, this trend was not confirmed in the case of unified (integrated) studies� No upward trend can be observed here�

237236 Self-assessment of Attitudes Towards Media Monika Frania
in nature� A slightly different result was demonstrated by the respondents from the University of Silesia in Katowice� The pedagogy students may choose from several optional subjects related to the area, but also they obligatorily attend the following courses: media pedagogy in the form of lectures and information and communication technology in the form of computer workshops� Additionally, the program for people who choose specializations related to early childhood education includes lectures and classes/workshops concerning: New technologies in education, Pedagogy of Media as well as: Computer classes methodology for grades 1 – 3� Comparison of the two institutions may show a relation concerning the teaching programmes and it should be noted that such explorations in a simi-lar subject area have already been carried out (Swensson & Baelo, 2015), however, so far a complete study in this respect is not available
The postulate to include the issues related to the world of media and technology in teacher training and pedagogue training is being constantly repeated� Usually, establishment of a separate subject or a course is suggested� Another solution is integration and implementation of media education into existing subjects and courses the examples of which were described in the subject literature (e�g�, Mee-han, Ray, Walker, Wells & Schwarz, 2015)�
One of the reasons why future educators should have a high knowledge of safety in cyberspace is the fact that it significantly reduces exposure to the risk of cyberbaiting and cyberbullying� Turkish research demonstrated that teachers’ self-assessed knowledge concerning this issue remains at an average level (Sezer, Yilmaz & Karaoglan Yilmaz, 2015)�
As demonstrated by Greek researchers surveying 179 respondents, educators and pedagogues who show safe behaviours in cyberspace in everyday life dur-ing their own adventure with the Internet have a greater knowledge and more willingly promote safety in cyberspace among their students (Anastasiades & Vitalaki, 2011)� The statement may be the reason for some dose of optimism with regard to the surveyed in Poland and in Croatia, who demonstrated a high level of knowledge, because the test also referred to their behaviours in the network�
Conclusion
Media competencies and digital literacy are the elements the development and training of which is required for proper and practical functioning in a world in which the development of media and technology is closely related to social life and contemporary culture� Referring to the formulated detailed research problems:
1� The attitude of people preparing for the profession of a pedagogue and a teacher in Croatia and in Poland concerning the media was defined in self-assessment as positive� It was shown by the most respondents in both countries� In both countries, this accounted for more than half of the research population�
2� The level of knowledge about selected cyber safety phenomena measured by the ABC test relating to memorising (A) and understanding (B) messages can be defined as high and medium at the upper limit�
3� The country of origin and the study major differentiate the statistically sig-nificant results� The respondents from Poland got a slightly higher score in the test than the respondents from Croatia� The pedagogy students received higher scores in the test than the students of other courses, both in Croatia and Poland�
The upward trend in the test result concurring with the level of advancement of studies can be observed only in the two-cycle majors – older students get a better score� However, this is not a statistically significant difference� Therefore, it cannot be confirmed that the level of advancement of studies is a differentiating factor�
The author’s studies are subject to some restrictions� The results are not to be generalized to the whole population of future teachers and educators in a particu-lar country� In the future research it will be worth extending the exploration to three components of competencies, i�e�, knowledge, skills, and attitudes�
ReferencesAdams, N�E� (2015)� Bloom’s taxonomy of cognitive learning objectives� Journal of the
Medical Library Association : JMLA, 103(3), 152 – 153� Retrieved from: http://doi�org/10�3163/1536 – 5050�103�3�010 (18�10�2017)
Anastasiades, P�S�, & Vitalaki, E� (2011)� Promoting Internet Safety in Greek Primary Schools: the Teacher’s Role� Educational Technology & Society, 14(2), 71 – 80�
Bloom, B�S�, Engelhart, M�D�, Furst, E�J�, Hill, W�H�, & Krathwohl, D�R� (1956)� Taxonomy of educational objectives, handbook I: The cognitive domain� New York: David McKay Co Inc� Retrieved from: http://www�univpgri-palembang�ac�id/perpus-fkip/Perpustakaan/Pendidikan%20&%20Pengajaran/Taxonomy_of_Educational_Objectives__Hand-book_1__Cognitive_Domain�pdf (1�10�2017)
Duncan-Howell, J� (2012)� Digital mismatch: Expectations and realities of digital com-petency amongst pre-service education students� Australasian Journal of Educational Technology, 28(5), 827 – 840�
Fedorov, A�, & Levitskaya, A� (2015)� The Framework of Media Education and Media Crit-

238 Monika Frania
icism in the Contemporary World: The opinion of International Experts. Comunicar. Media Education Research Journal, 45, 107 – 115�
Khalid, Md� S�, & Pedersen, M� (2016)� Digital Exclusion in Higher Education Contexts: A Systematic Literature Review� Procedia – Social and Behavioral Sciences, 228, 614 – 621�
Littlejohn, A�, Beetham H�, & McGill, L� (2012)� Learning at the digital frontier: a review of digital literacies in theory and practice� Journal of Computer Assisted Learning, 28, 547 – 556�
Meehan, J�, Ray, B�, Wells, S�, Walker, A�, & Schwarz, G� (2015)� Media Literacy in Teacher Education: A Good Fit across the Curriculum� Journal of Media Literacy Education, 7(2), 81 – 86�
Niemierko, B� (2009)� Diagnostyka edukacyjna. Podręcznik akademicki [Educational Diag-nostics� Academic Textbook], Wydawnictwo Naukowe PWN, Warszawa�
Petani, R�, & Karamatić Brčić, M� (2014)� Family Environment, Communication And Media Education. Perspectives of Innovations, Economics & Business, 14 (3), 132 – 142�
Røkenes, F�M�, & Krumsvik, R�J� (2016)� Prepared to teach ESL with ICT? A study of digital competence in Norwegian teacher education� Computers & Education, 97, 1 – 20�
Rowley, J� (2007)� The wisdom hierarchy: representation of the DIKW hierarchy� Journal of Information Science 33 (2), 163 – 180�
Sezer, B�, Yilmaz, R�, & Karaoglan Yilmaz, F�G� (2015)� Cyber bullying and teachers’ aware-ness� Internet Research, 25(4), 674 – 687�
Spalević, Ž� (2014)� Cyber Security as a Global Challenge of The Modern Era� Paper presented at Sinteza 2014 – Impact of the Internet on Business Activities in Serbia and Worldwide� Retrieved from doi:10�15308/sinteza-2014 – 687 – 692 (9�10�2016)�
Swensson, M�, & Baelo, R� (2015)� Teacher students’ perceptions of their digital compe-tence� Procedia – Social and Behavioral Sciences, 180, 1527 – 1534�
Tiede, J�, Grafe, S�, & Hobbs, R� (2015)� Pedagogical Media Competencies of Preservice Teachers in Germany and the United States: A Comparative Analysis of Theory and Practice� Peabody Journal of Education, 90(4), 533 – 545�
Topolovčan, T�, Toplak T�, & Matijević, M� (2013)� Ownership and Use of New Media by Teachers in Rural and Urban Areas of Croatia� Paper presented at The 1st International Conference on Research and Education – Challenges Toward the Future (ICRAE2013), 24 – 25 May 2013� Retrieved from http://eric�ed�gov/?id=ED545362 (10�10�2016)�

Chronicle


Reviewers of the Manuscripts Sent from the Czech Republic, Poland, the Slovak Republic, and from the
Whole World to “The New Educational Review” in 2017
Prof� PhD� Estera CzojProf� dr hab� Marek FurmanekProf� zw� dr hab� Waldemar FurmanekProf� dr hab� Małgorzata Górnik-DuroseProf� PhD� Yaomin He Prof� PhDr� Tomaš Jablonsky, PhDProf� zw� dr hab� Stanisław Juszczyk Prof� zw� dr hab� Bożydar KaczmarekProf� PhD� Yongdeog KimProf� PhDr� Alojz Kostelansky, PhDProf� dr hab� Katarzyna KrasońProf� PhDr� Viera Kurincová, PhD�Prof� zw� dr hab� Barbara KożusznikProf� zw� dr hab� Stefan M� Kwiatkowski Prof� zw� dr hab� Eugenia Mandal Prof� dr hab� Katarzyna MarkiewiczProf� PhD� Katsuhiko MatsukawaProf� dr hab� Irena PilchProf� PhD� Erich Petlák, CSc�Prof� zw� dr hab� Krzysztof RubachaProf� zw� dr hab� Bronisław Siemieniecki Prof� zw� dr hab� Jerzy Stochmiałek Prof� dr hab� Maciej Tanaś
Prof� zw� dr hab� Andrzej Radziewicz-Winnicki
Prof� PhDr� Peter Seidler, PhD� Prof� zw� dr hab� Adam Stankowski Prof� PhD� Carl� C� WolhuterProf� dr hab� Ewa WysockaDr hab� Maciej BernasiewiczDr hab� Katarzyna Borzucka-SitkiewiczDr hab� Ewa BielskaDr hab� Alina BudniakDr hab� Alicja Gałązka Dr hab� Mirosław KisielDr hab� Beata Mazepa-DomagałaDr hab� Irena PolewczykDr hab� Hanna Przybyła-BasistaDr hab� Danuta Rode Dr hab� Elżbieta TurskaDr Anna BroschDr Monika FraniaDr Hewilia HetmańczykDr Tomasz Huk Dr Katarzyna Juszczyk-FrelkiewiczDr Monika Noszczyk-Bernasiewicz

244 Reviewers of the Manuscripts Sent
Dr Sławomir PasikowskiDr Katarzyna ŚlebarskaDr Anna WatołaProf� PhDr� Martin Bílek, Ph�D�PhDr� Martin Dlouhý, Ph�D�Mgr� Lenka Dovrtělová, Ph�D�Doc� PaedDr� Petr Franiok, Ph�D�Doc� PhDr� Blažena Gracová, CSc�PhDr� Tereza Kimplová, Ph�D�PhDr� Petr Kopečný, Ph�D�Mgr� Pavel Krákora� Ph�D�RNDr� Radek Krpec, Ph�D�Doc� PhDr� Petr Kutáč, Ph�D�Doc� PaedDr� Martina Maněnová, Ph�D�Doc� Dr� Ing� Miroslav MerendaProf� Ing� Zdeněk Mikoláš, CSc�Doc� PhDr� Jana Miňhová, CSc�Mgr� Hana Pernicová, Ph�D�Doc� PaedDr� Ladislav Podroužek, Ph�D�Doc� PhDr� Michaela Prášilová, Ph�D�PhDr� Zora Syslová, Ph�D�
Prof� Ing� Milan Turčáni, CSc�Prof� PhDr� Alena Vališová, Ph�D�Prof� PaedDr� Stanislav Bendl, PhD�Prof� PaedDr� Dana Hanesová, PhD�Prof� PaedDr� Anna Hudecová, PhD�Prof� PhDr� Igor Kominarec, CSc�Prof� PaedDr� Vojtech Korim, CSc�Prof� PhDr� Blahoslav Kraus, CSc�Prof� PhDr� Erich Mistrík, CSc�Prof� PhDr� Jozef Výrost, DrSc�Dr� h� c� prof� PhDr� Miron Zelina, DrSc�Doc� PaedDr� Ludvík Eger, CSc�Doc� PhDr� Hana Marešová, PhD�Doc� PaedDr� Ctibor Határ, PhD�Doc� PaedDr� Katarína Hollá, PhD�Doc� PhDr� PaedDr� Kamil Janiš, CSc�Doc� PhDr� Irena Plevová, Ph�D�Doc� PaedDr� Štefan Porubský, PhD�Doc� PhDr� Vladimír Salbot, CSc�Doc� PhDr� Jitka Skopalová, PhD�