2017 university report alumni survey introduction university … · the alumni survey is designed...
TRANSCRIPT
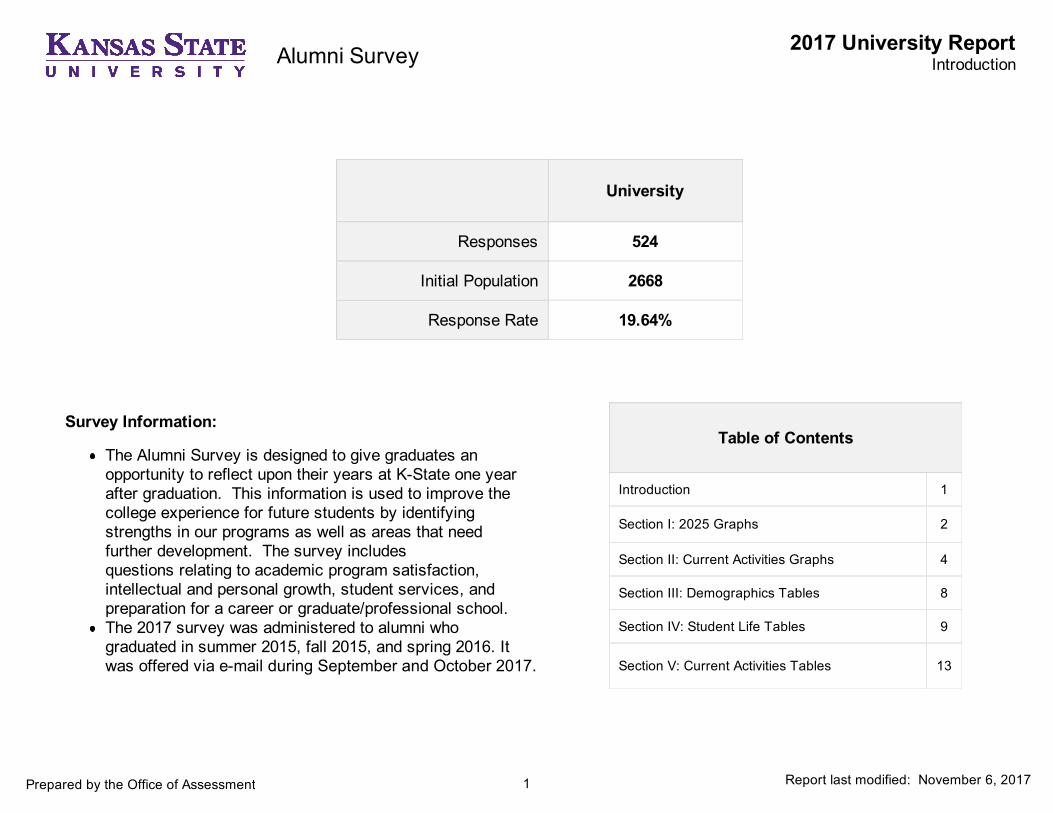
Table of Contents
Introduction 1
Section I: 2025 Graphs 2
Section II: Current Activities Graphs 4
Section III: Demographics Tables 8
Section IV: Student Life Tables 9
Section V: Current Activities Tables 13
University
Responses 524
Initial Population 2668
Response Rate 19.64%
Survey Information:
The Alumni Survey is designed to give graduates anopportunity to reflect upon their years at K-State one yearafter graduation. This information is used to improve thecollege experience for future students by identifyingstrengths in our programs as well as areas that needfurther development. The survey includesquestions relating to academic program satisfaction,intellectual and personal growth, student services, andpreparation for a career or graduate/professional school.The 2017 survey was administered to alumni whograduated in summer 2015, fall 2015, and spring 2016. Itwas offered via e-mail during September and October 2017.
1
2017 University Report
Report last modified: November 6, 2017Prepared by the Office of Assessment
IntroductionAlumni Survey
2
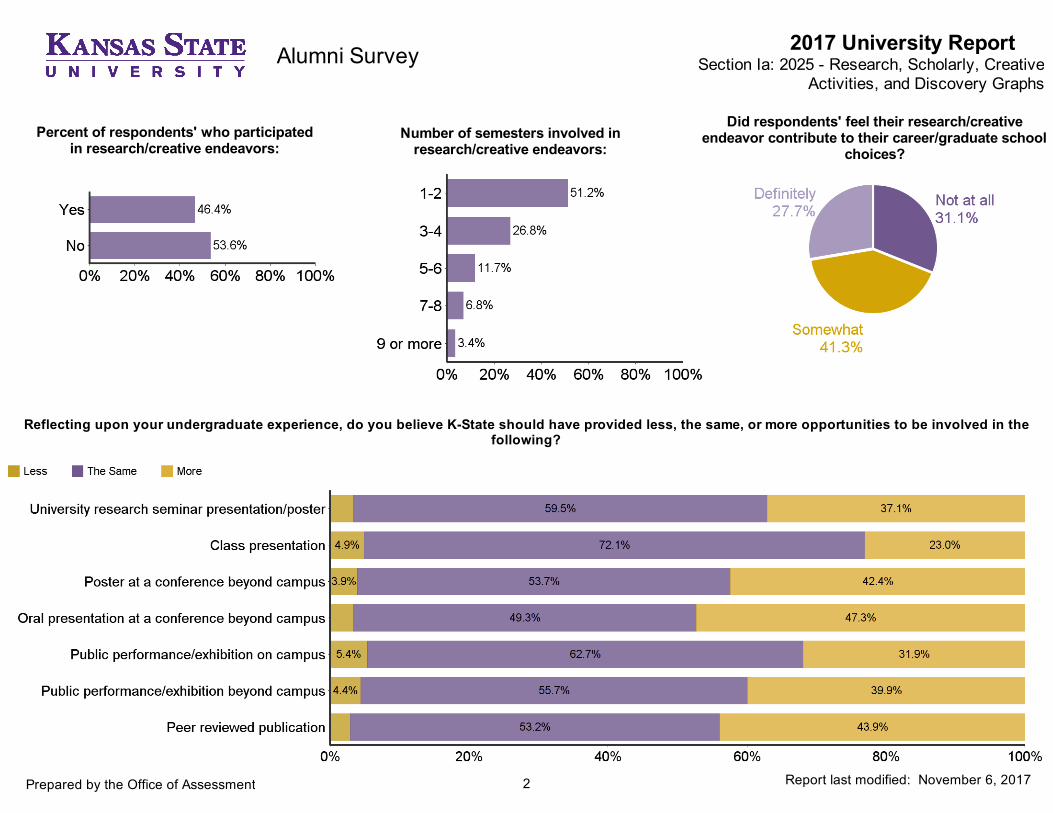
Reflecting upon your undergraduate experience, do you believe K-State should have provided less, the same, or more opportunities to be involved in thefollowing?
2017 University Report
Did respondents' feel their research/creativeendeavor contribute to their career/graduate school
choices?
Report last modified: November 6, 2017
Section Ia: 2025 - Research, Scholarly, CreativeActivities, and Discovery Graphs
Prepared by the Office of Assessment
Percent of respondents' who participatedin research/creative endeavors:
Number of semesters involved inresearch/creative endeavors:
Alumni Survey
3
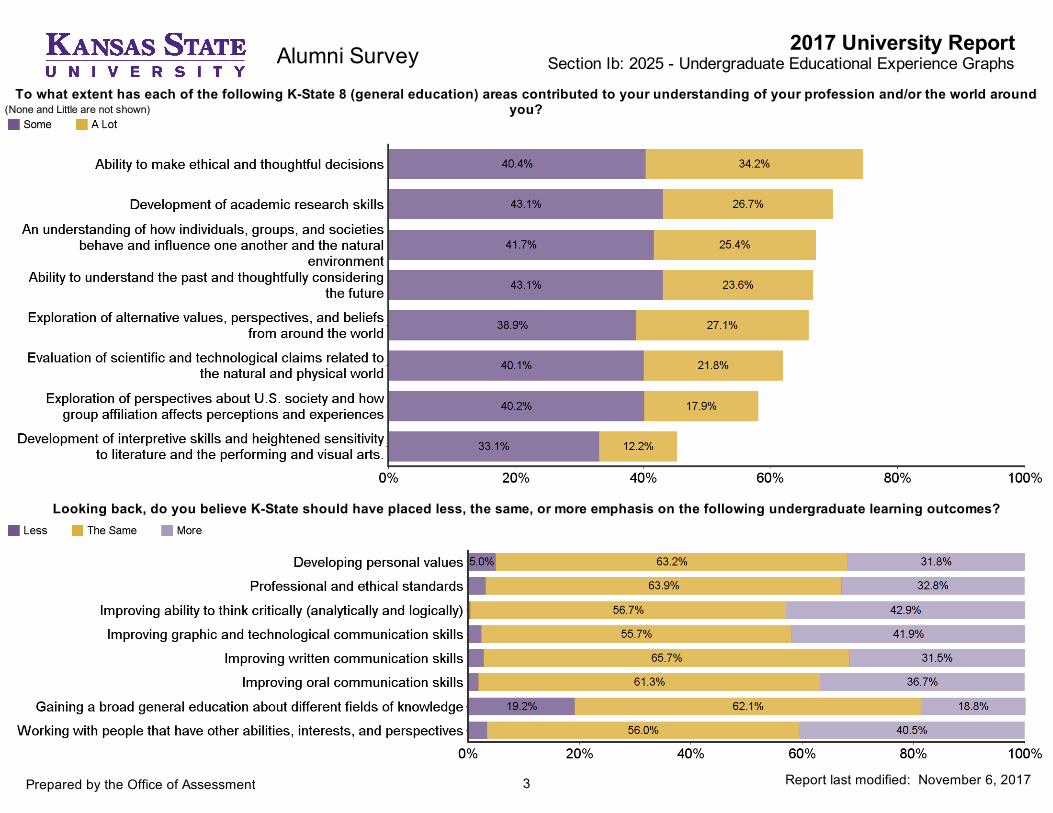
To what extent has each of the following K-State 8 (general education) areas contributed to your understanding of your profession and/or the world aroundyou?
Looking back, do you believe K-State should have placed less, the same, or more emphasis on the following undergraduate learning outcomes?
2017 University Report
Report last modified: November 6, 2017Prepared by the Office of Assessment
Section Ib: 2025 - Undergraduate Educational Experience GraphsAlumni Survey
(None and Little are not shown)
4
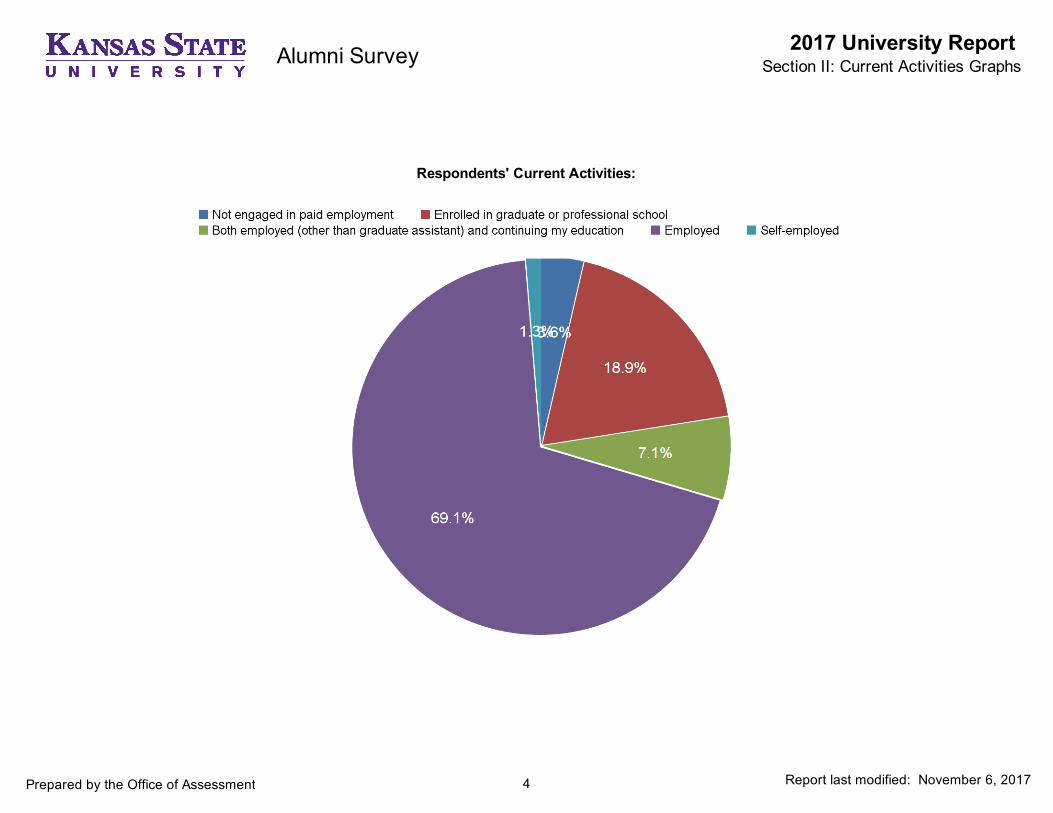
Respondents' Current Activities:
2017 University Report
Report last modified: November 6, 2017Prepared by the Office of Assessment
Section II: Current Activities Graphs
Alumni Survey
5
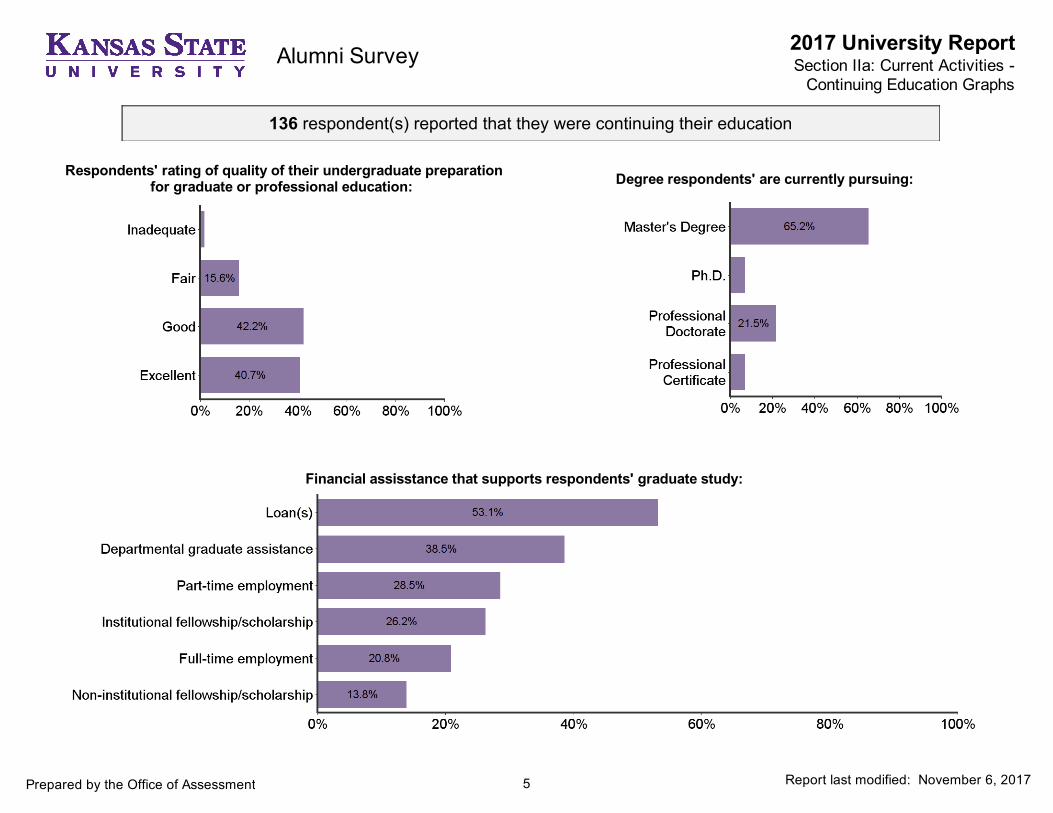
Financial assisstance that supports respondents' graduate study:
2017 University Report
136 respondent(s) reported that they were continuing their education
Degree respondents' are currently pursuing:Respondents' rating of quality of their undergraduate preparationfor graduate or professional education:
Report last modified: November 6, 2017Prepared by the Office of Assessment
Section IIa: Current Activities -Continuing Education Graphs
Alumni Survey
6
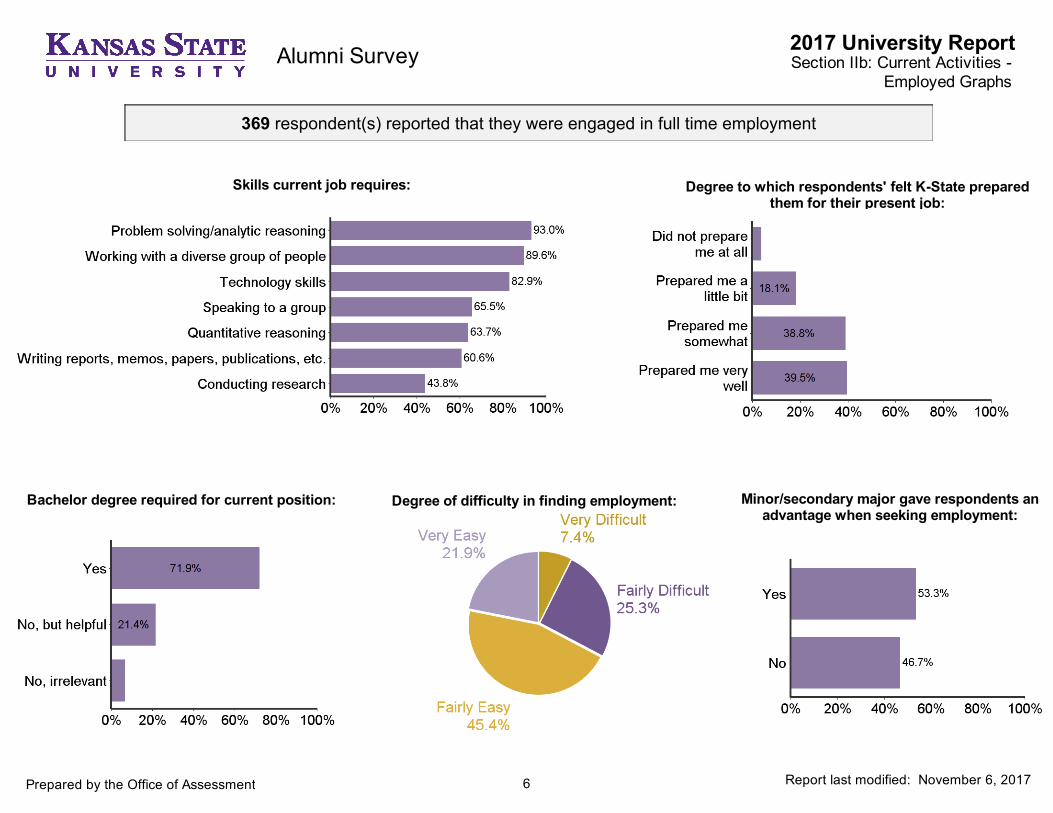
369 respondent(s) reported that they were engaged in full time employment
2017 University Report
Report last modified: November 6, 2017
Degree of difficulty in finding employment:
Skills current job requires:
Prepared by the Office of Assessment
Minor/secondary major gave respondents anadvantage when seeking employment:
Degree to which respondents' felt K-State preparedthem for their present job:
Bachelor degree required for current position:
Section IIb: Current Activities -Employed Graphs
Alumni Survey
7
2017 University Report
Report last modified: November 6, 2017
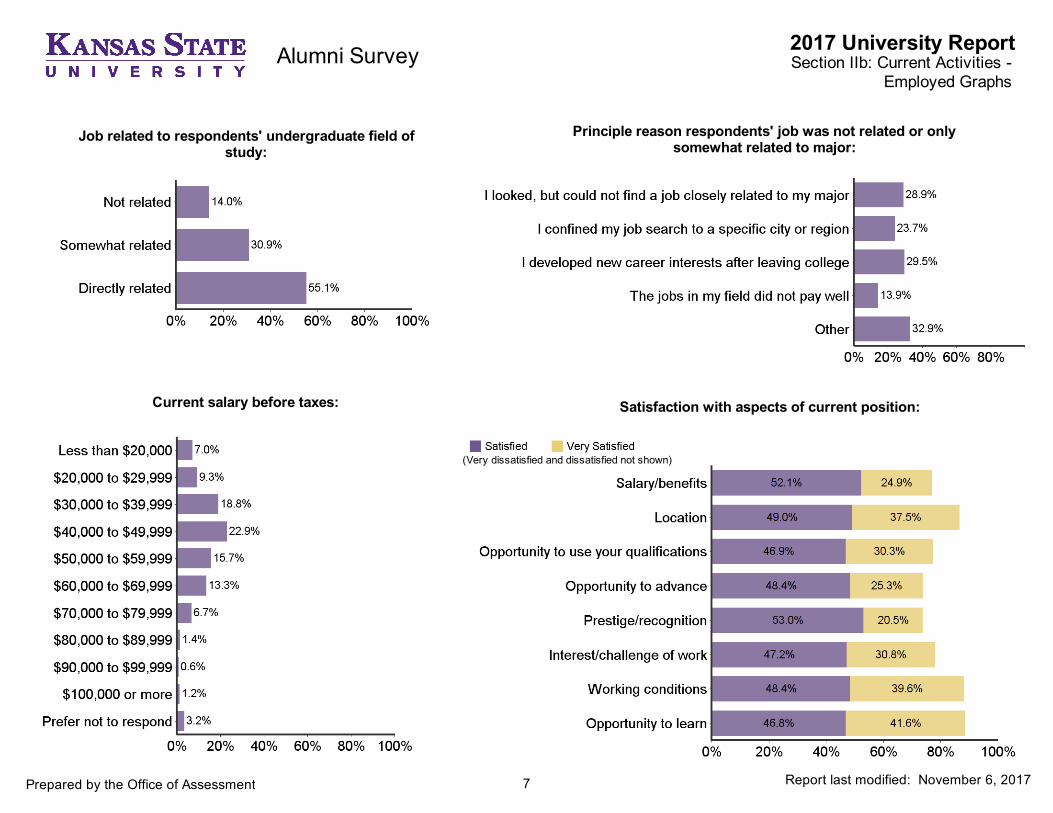
Principle reason respondents' job was not related or onlysomewhat related to major:
Job related to respondents' undergraduate field ofstudy:
Prepared by the Office of Assessment
Section IIb: Current Activities -Employed Graphs
Satisfaction with aspects of current position:Current salary before taxes:
Alumni Survey
(Very dissatisfied and dissatisfied not shown)
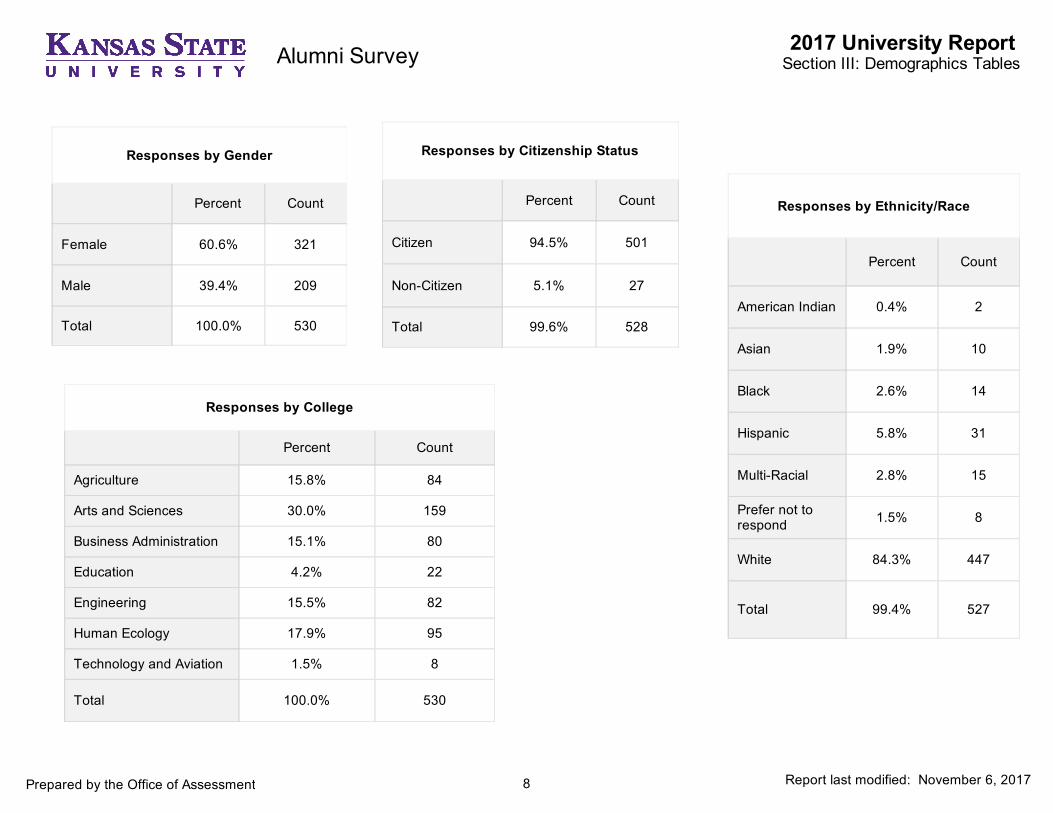
Responses by College
Percent Count
Agriculture 15.8% 84
Arts and Sciences 30.0% 159
Business Administration 15.1% 80
Education 4.2% 22
Engineering 15.5% 82
Human Ecology 17.9% 95
Technology and Aviation 1.5% 8
Total 100.0% 530
Responses by Ethnicity/Race
Percent Count
American Indian 0.4% 2
Asian 1.9% 10
Black 2.6% 14
Hispanic 5.8% 31
Multi-Racial 2.8% 15
Prefer not torespond 1.5% 8
White 84.3% 447
Total 99.4% 527
Responses by Citizenship Status
Percent Count
Citizen 94.5% 501
Non-Citizen 5.1% 27
Total 99.6% 528
Responses by Gender
Percent Count
Female 60.6% 321
Male 39.4% 209
Total 100.0% 530
8
2017 University Report
Report last modified: November 6, 2017Prepared by the Office of Assessment
Section III: Demographics TablesAlumni Survey
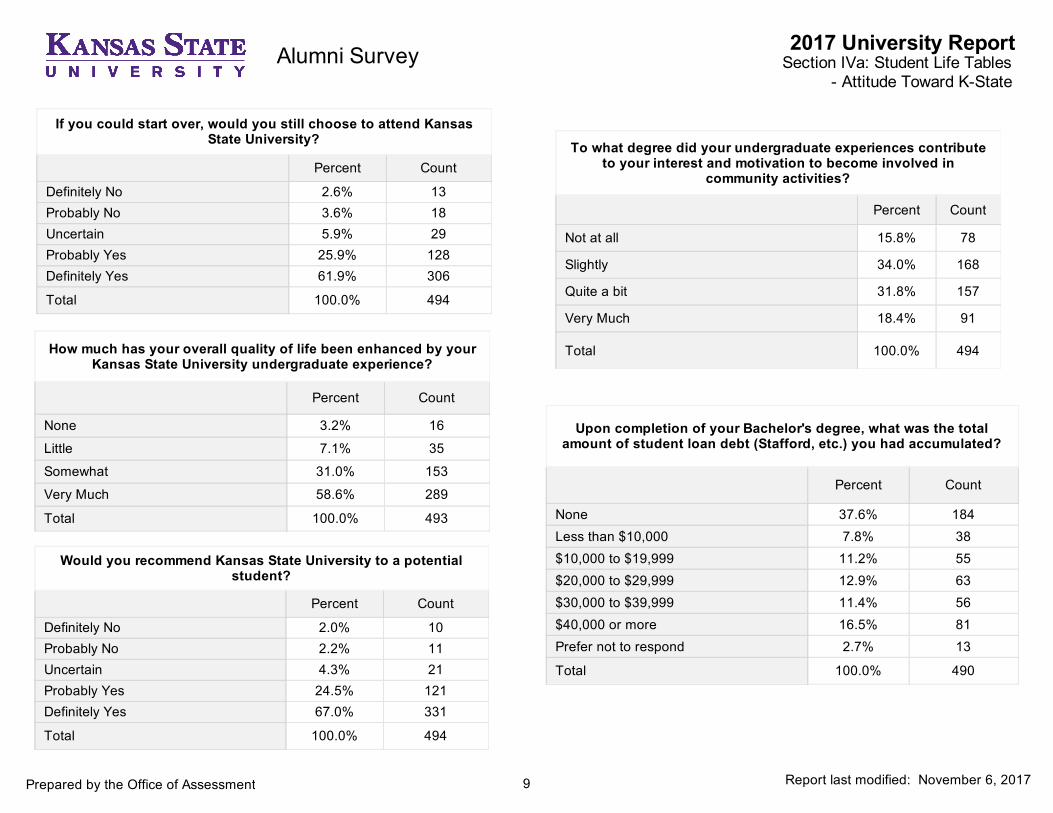
Upon completion of your Bachelor's degree, what was the totalamount of student loan debt (Stafford, etc.) you had accumulated?
Percent Count
None 37.6% 184Less than $10,000 7.8% 38$10,000 to $19,999 11.2% 55$20,000 to $29,999 12.9% 63$30,000 to $39,999 11.4% 56$40,000 or more 16.5% 81Prefer not to respond 2.7% 13
Total 100.0% 490
To what degree did your undergraduate experiences contributeto your interest and motivation to become involved in
community activities?
Percent Count
Not at all 15.8% 78
Slightly 34.0% 168
Quite a bit 31.8% 157
Very Much 18.4% 91
Total 100.0% 494
If you could start over, would you still choose to attend KansasState University?
Percent Count
Definitely No 2.6% 13Probably No 3.6% 18Uncertain 5.9% 29Probably Yes 25.9% 128Definitely Yes 61.9% 306
Total 100.0% 494
Would you recommend Kansas State University to a potentialstudent?
Percent Count
Definitely No 2.0% 10Probably No 2.2% 11Uncertain 4.3% 21Probably Yes 24.5% 121Definitely Yes 67.0% 331
Total 100.0% 494
How much has your overall quality of life been enhanced by yourKansas State University undergraduate experience?
Percent Count
None 3.2% 16
Little 7.1% 35
Somewhat 31.0% 153
Very Much 58.6% 289
Total 100.0% 493
9
2017 University Report
Report last modified: November 6, 2017Prepared by the Office of Assessment
Section IVa: Student Life Tables- Attitude Toward K-State
Alumni Survey
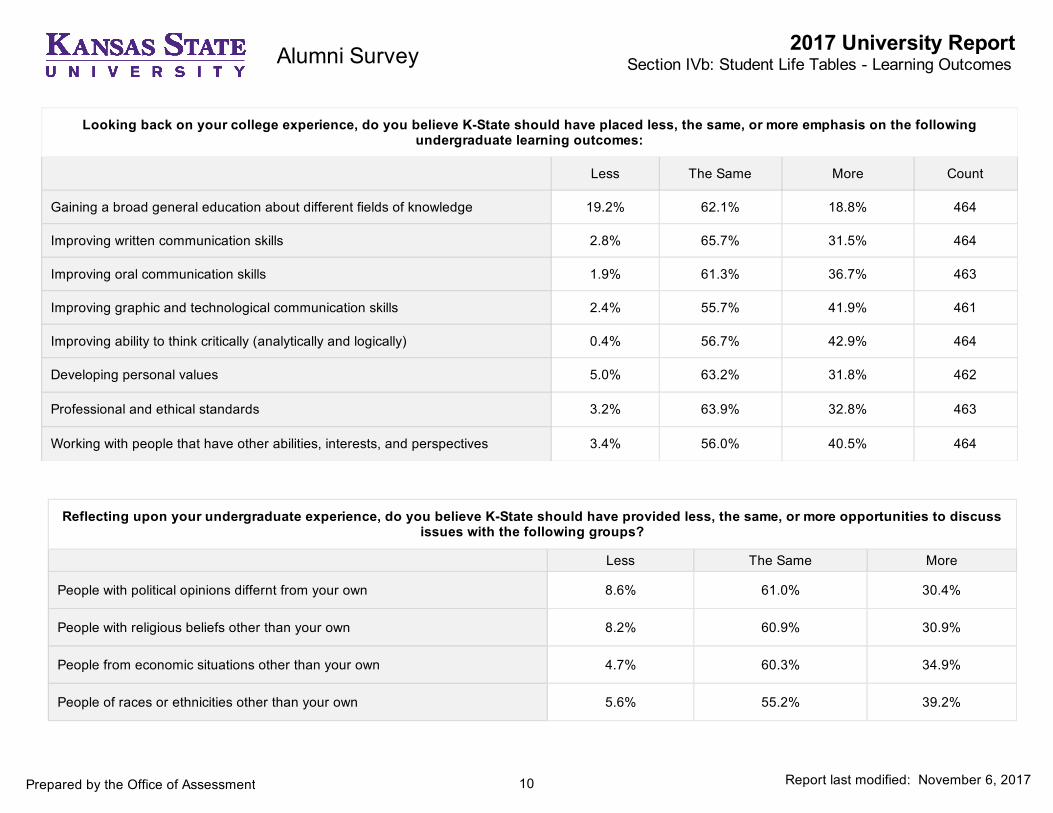
Looking back on your college experience, do you believe K-State should have placed less, the same, or more emphasis on the followingundergraduate learning outcomes:
Less The Same More Count
Gaining a broad general education about different fields of knowledge 19.2% 62.1% 18.8% 464
Improving written communication skills 2.8% 65.7% 31.5% 464
Improving oral communication skills 1.9% 61.3% 36.7% 463
Improving graphic and technological communication skills 2.4% 55.7% 41.9% 461
Improving ability to think critically (analytically and logically) 0.4% 56.7% 42.9% 464
Developing personal values 5.0% 63.2% 31.8% 462
Professional and ethical standards 3.2% 63.9% 32.8% 463
Working with people that have other abilities, interests, and perspectives 3.4% 56.0% 40.5% 464
Reflecting upon your undergraduate experience, do you believe K-State should have provided less, the same, or more opportunities to discussissues with the following groups?
Less The Same More
People with political opinions differnt from your own 8.6% 61.0% 30.4%
People with religious beliefs other than your own 8.2% 60.9% 30.9%
People from economic situations other than your own 4.7% 60.3% 34.9%
People of races or ethnicities other than your own 5.6% 55.2% 39.2%
10
2017 University Report
Report last modified: November 6, 2017
Section IVb: Student Life Tables - Learning Outcomes
Prepared by the Office of Assessment
Alumni Survey
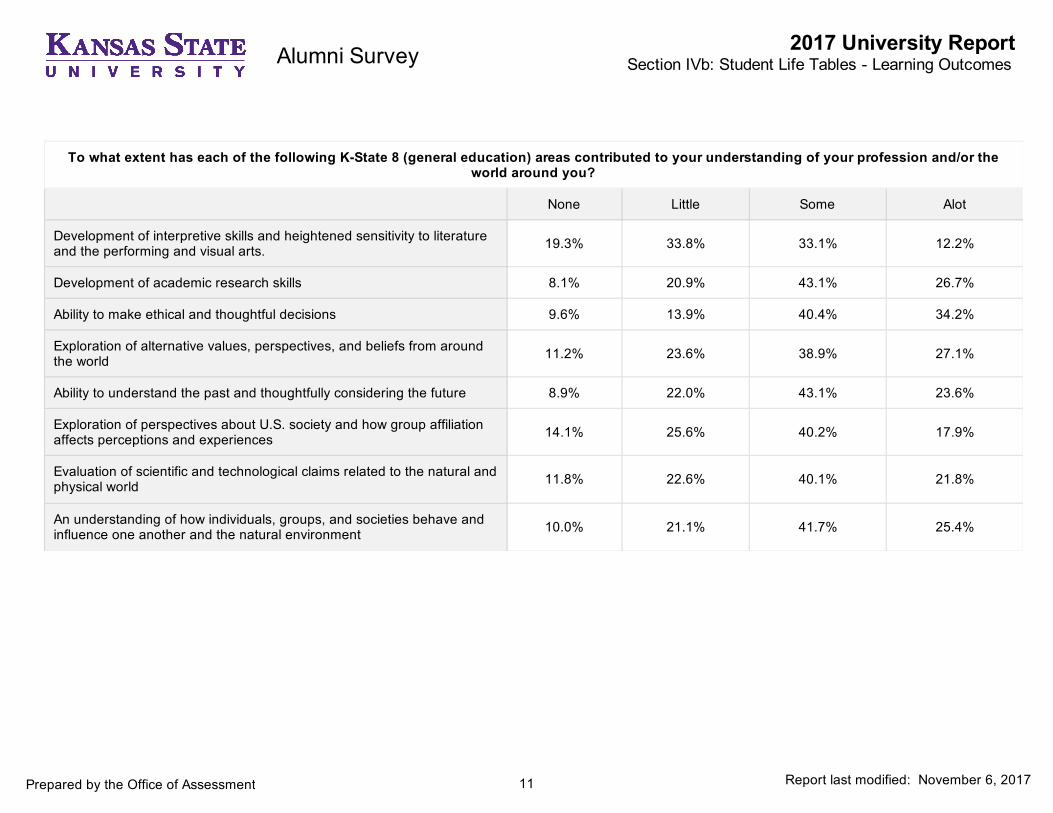
To what extent has each of the following K-State 8 (general education) areas contributed to your understanding of your profession and/or theworld around you?
None Little Some Alot
Development of interpretive skills and heightened sensitivity to literatureand the performing and visual arts. 19.3% 33.8% 33.1% 12.2%
Development of academic research skills 8.1% 20.9% 43.1% 26.7%
Ability to make ethical and thoughtful decisions 9.6% 13.9% 40.4% 34.2%
Exploration of alternative values, perspectives, and beliefs from aroundthe world 11.2% 23.6% 38.9% 27.1%
Ability to understand the past and thoughtfully considering the future 8.9% 22.0% 43.1% 23.6%
Exploration of perspectives about U.S. society and how group affiliationaffects perceptions and experiences 14.1% 25.6% 40.2% 17.9%
Evaluation of scientific and technological claims related to the natural andphysical world 11.8% 22.6% 40.1% 21.8%
An understanding of how individuals, groups, and societies behave andinfluence one another and the natural environment 10.0% 21.1% 41.7% 25.4%
11
2017 University Report
Report last modified: November 6, 2017
Section IVb: Student Life Tables - Learning Outcomes
Prepared by the Office of Assessment
Alumni Survey
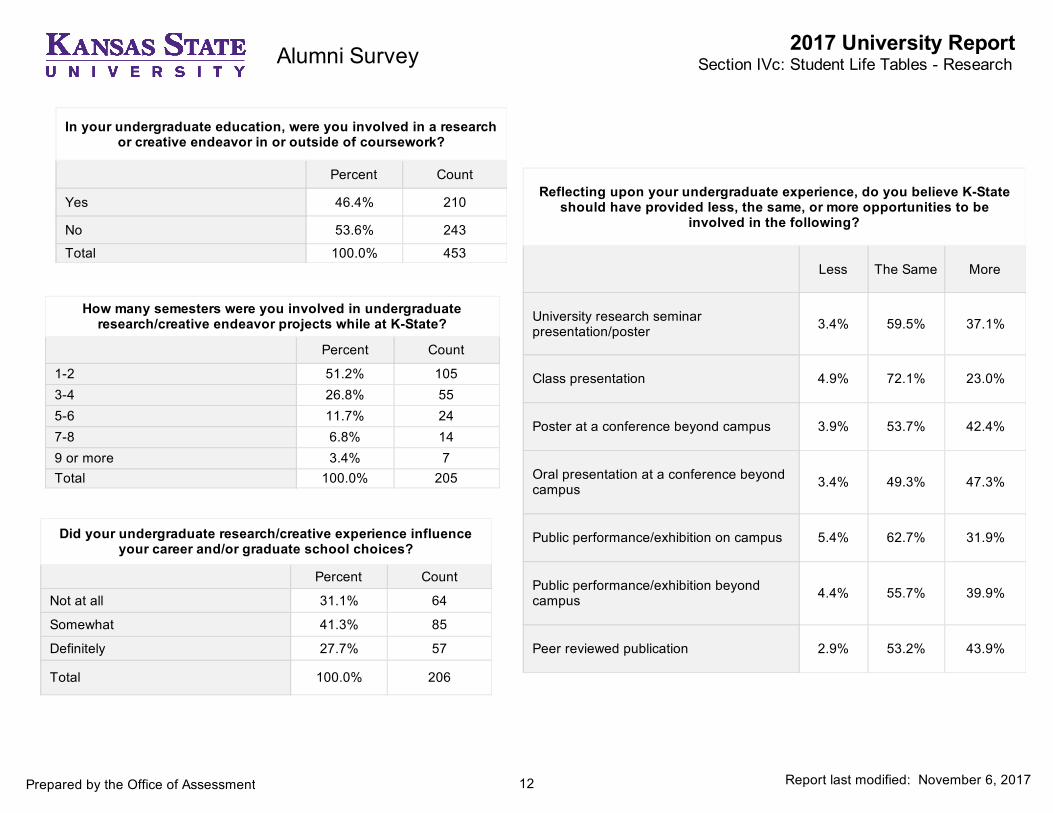
Reflecting upon your undergraduate experience, do you believe K-Stateshould have provided less, the same, or more opportunities to be
involved in the following?
Less The Same More
University research seminarpresentation/poster 3.4% 59.5% 37.1%
Class presentation 4.9% 72.1% 23.0%
Poster at a conference beyond campus 3.9% 53.7% 42.4%
Oral presentation at a conference beyondcampus 3.4% 49.3% 47.3%
Public performance/exhibition on campus 5.4% 62.7% 31.9%
Public performance/exhibition beyondcampus 4.4% 55.7% 39.9%
Peer reviewed publication 2.9% 53.2% 43.9%
How many semesters were you involved in undergraduateresearch/creative endeavor projects while at K-State?
Percent Count
1-2 51.2% 1053-4 26.8% 555-6 11.7% 247-8 6.8% 149 or more 3.4% 7Total 100.0% 205
Did your undergraduate research/creative experience influenceyour career and/or graduate school choices?
Percent Count
Not at all 31.1% 64
Somewhat 41.3% 85
Definitely 27.7% 57
Total 100.0% 206
In your undergraduate education, were you involved in a researchor creative endeavor in or outside of coursework?
Percent Count
Yes 46.4% 210
No 53.6% 243
Total 100.0% 453
12
2017 University Report
Report last modified: November 6, 2017Prepared by the Office of Assessment
Section IVc: Student Life Tables - ResearchAlumni Survey
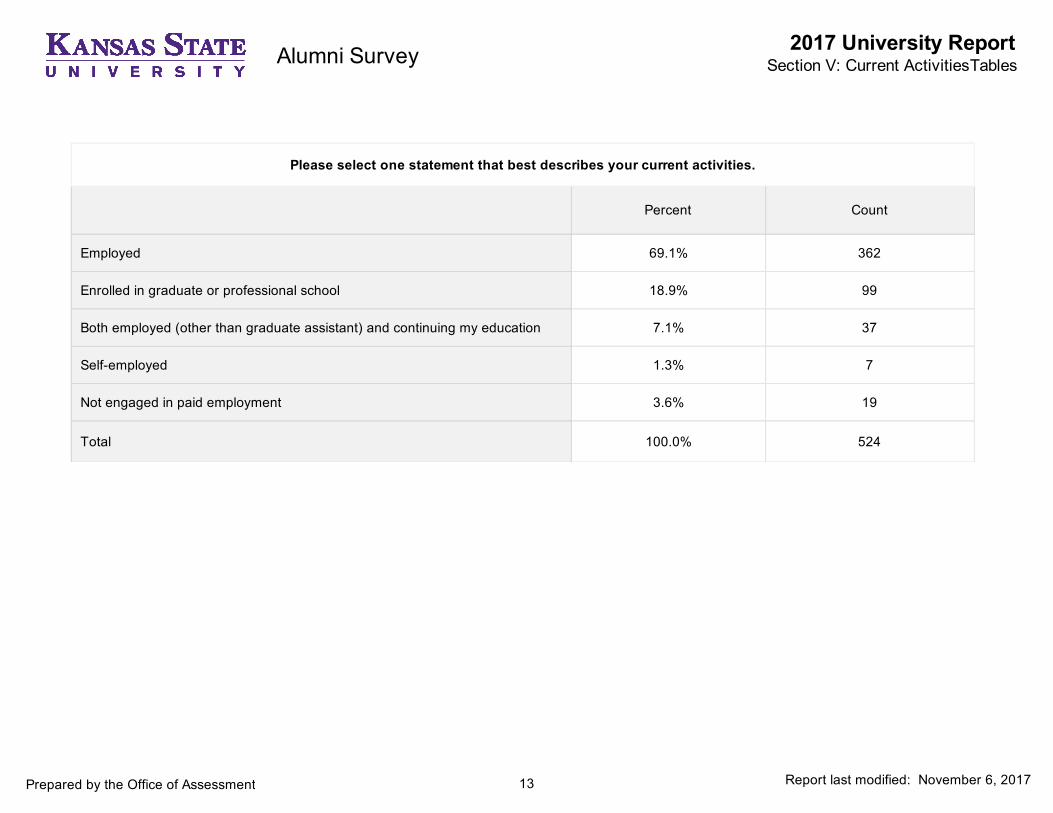
Please select one statement that best describes your current activities.
Percent Count
Employed 69.1% 362
Enrolled in graduate or professional school 18.9% 99
Both employed (other than graduate assistant) and continuing my education 7.1% 37
Self-employed 1.3% 7
Not engaged in paid employment 3.6% 19
Total 100.0% 524
13
2017 University Report
Report last modified: November 6, 2017Prepared by the Office of Assessment
Section V: Current ActivitiesTablesAlumni Survey
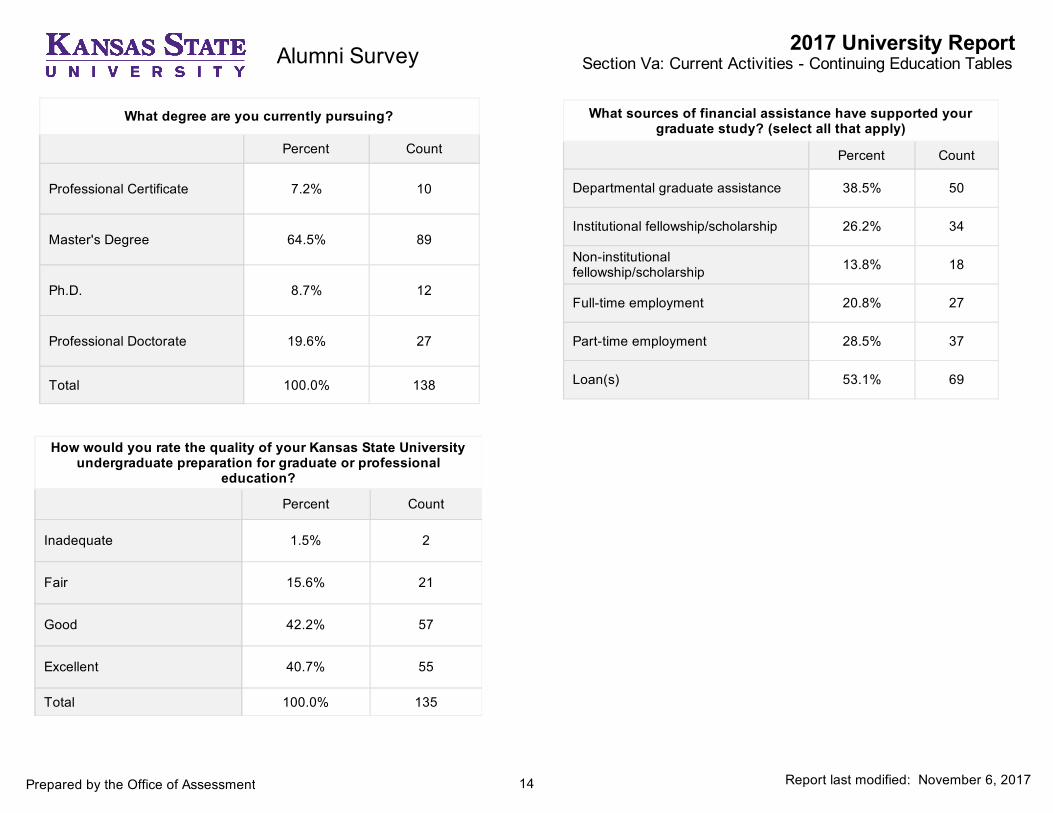
What degree are you currently pursuing?
Percent Count
Professional Certificate 7.2% 10
Master's Degree 64.5% 89
Ph.D. 8.7% 12
Professional Doctorate 19.6% 27
Total 100.0% 138
What sources of financial assistance have supported yourgraduate study? (select all that apply)
Percent Count
Departmental graduate assistance 38.5% 50
Institutional fellowship/scholarship 26.2% 34
Non-institutionalfellowship/scholarship 13.8% 18
Full-time employment 20.8% 27
Part-time employment 28.5% 37
Loan(s) 53.1% 69
How would you rate the quality of your Kansas State Universityundergraduate preparation for graduate or professional
education?
Percent Count
Inadequate 1.5% 2
Fair 15.6% 21
Good 42.2% 57
Excellent 40.7% 55
Total 100.0% 135
14
2017 University Report
Report last modified: November 6, 2017
Section Va: Current Activities - Continuing Education Tables
Prepared by the Office of Assessment
Alumni Survey
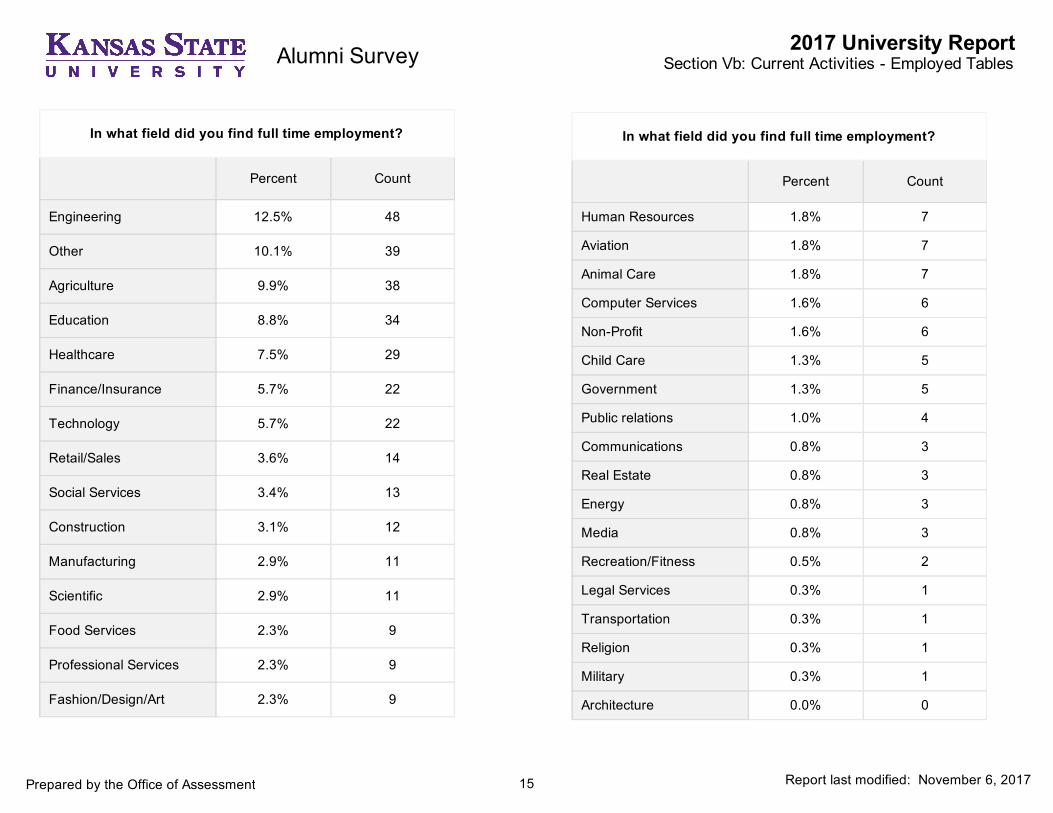
In what field did you find full time employment?
Percent Count
Human Resources 1.8% 7
Aviation 1.8% 7
Animal Care 1.8% 7
Computer Services 1.6% 6
Non-Profit 1.6% 6
Child Care 1.3% 5
Government 1.3% 5
Public relations 1.0% 4
Communications 0.8% 3
Real Estate 0.8% 3
Energy 0.8% 3
Media 0.8% 3
Recreation/Fitness 0.5% 2
Legal Services 0.3% 1
Transportation 0.3% 1
Religion 0.3% 1
Military 0.3% 1
Architecture 0.0% 0
In what field did you find full time employment?
Percent Count
Engineering 12.5% 48
Other 10.1% 39
Agriculture 9.9% 38
Education 8.8% 34
Healthcare 7.5% 29
Finance/Insurance 5.7% 22
Technology 5.7% 22
Retail/Sales 3.6% 14
Social Services 3.4% 13
Construction 3.1% 12
Manufacturing 2.9% 11
Scientific 2.9% 11
Food Services 2.3% 9
Professional Services 2.3% 9
Fashion/Design/Art 2.3% 9
15
2017 University Report
Report last modified: November 6, 2017Prepared by the Office of Assessment
Section Vb: Current Activities - Employed TablesAlumni Survey
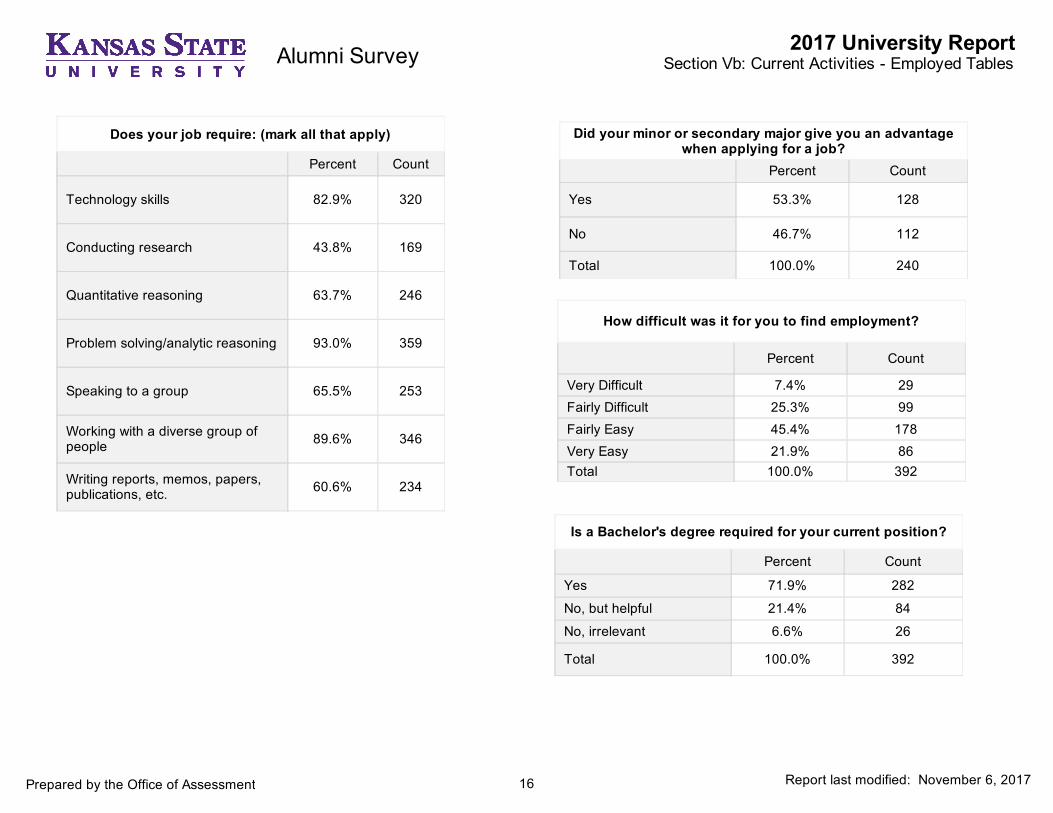
Does your job require: (mark all that apply)
Percent Count
Technology skills 82.9% 320
Conducting research 43.8% 169
Quantitative reasoning 63.7% 246
Problem solving/analytic reasoning 93.0% 359
Speaking to a group 65.5% 253
Working with a diverse group ofpeople 89.6% 346
Writing reports, memos, papers,publications, etc. 60.6% 234
How difficult was it for you to find employment?
Percent Count
Very Difficult 7.4% 29Fairly Difficult 25.3% 99Fairly Easy 45.4% 178Very Easy 21.9% 86Total 100.0% 392
Is a Bachelor's degree required for your current position?
Percent Count
Yes 71.9% 282
No, but helpful 21.4% 84
No, irrelevant 6.6% 26
Total 100.0% 392
Did your minor or secondary major give you an advantagewhen applying for a job?
Percent Count
Yes 53.3% 128
No 46.7% 112
Total 100.0% 240
16
2017 University Report
Report last modified: November 6, 2017Prepared by the Office of Assessment
Section Vb: Current Activities - Employed TablesAlumni Survey
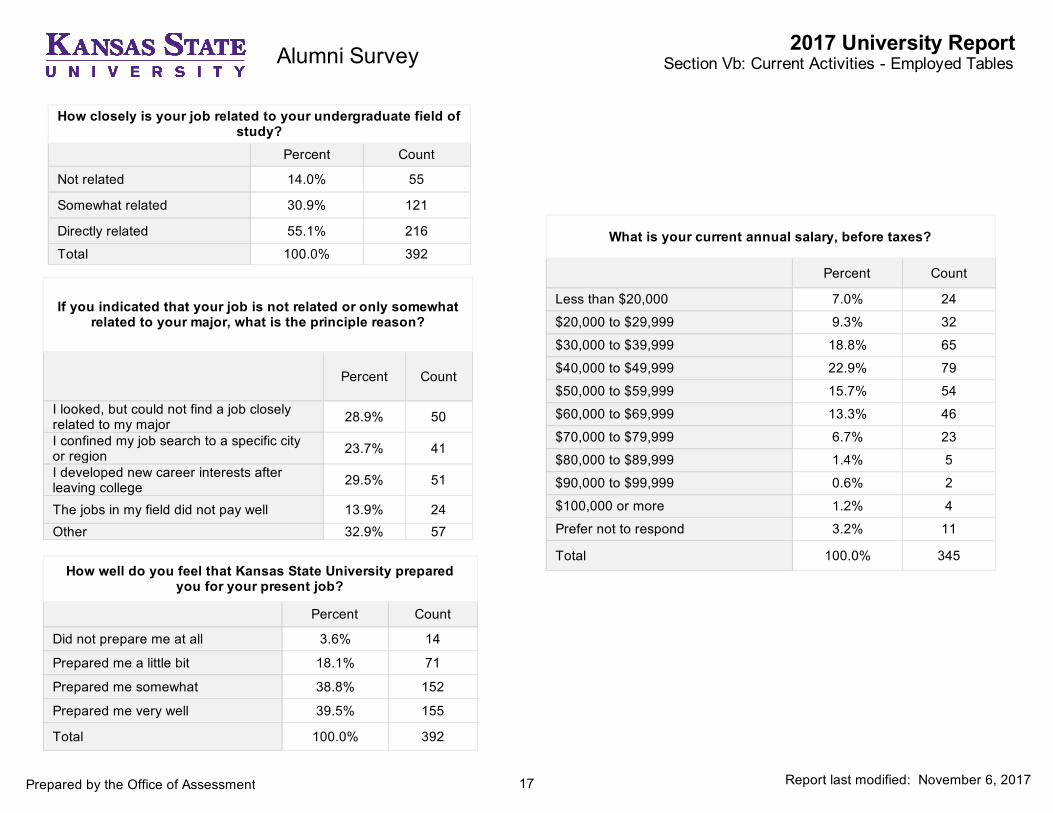
What is your current annual salary, before taxes?
Percent Count
Less than $20,000 7.0% 24
$20,000 to $29,999 9.3% 32
$30,000 to $39,999 18.8% 65
$40,000 to $49,999 22.9% 79
$50,000 to $59,999 15.7% 54
$60,000 to $69,999 13.3% 46
$70,000 to $79,999 6.7% 23
$80,000 to $89,999 1.4% 5
$90,000 to $99,999 0.6% 2
$100,000 or more 1.2% 4
Prefer not to respond 3.2% 11
Total 100.0% 345
If you indicated that your job is not related or only somewhatrelated to your major, what is the principle reason?
Percent Count
I looked, but could not find a job closelyrelated to my major 28.9% 50
I confined my job search to a specific cityor region 23.7% 41
I developed new career interests afterleaving college 29.5% 51
The jobs in my field did not pay well 13.9% 24Other 32.9% 57
How well do you feel that Kansas State University preparedyou for your present job?
Percent Count
Did not prepare me at all 3.6% 14
Prepared me a little bit 18.1% 71
Prepared me somewhat 38.8% 152
Prepared me very well 39.5% 155
Total 100.0% 392
How closely is your job related to your undergraduate field ofstudy?
Percent Count
Not related 14.0% 55
Somewhat related 30.9% 121
Directly related 55.1% 216
Total 100.0% 392
17
2017 University Report
Report last modified: November 6, 2017Prepared by the Office of Assessment
Section Vb: Current Activities - Employed TablesAlumni Survey
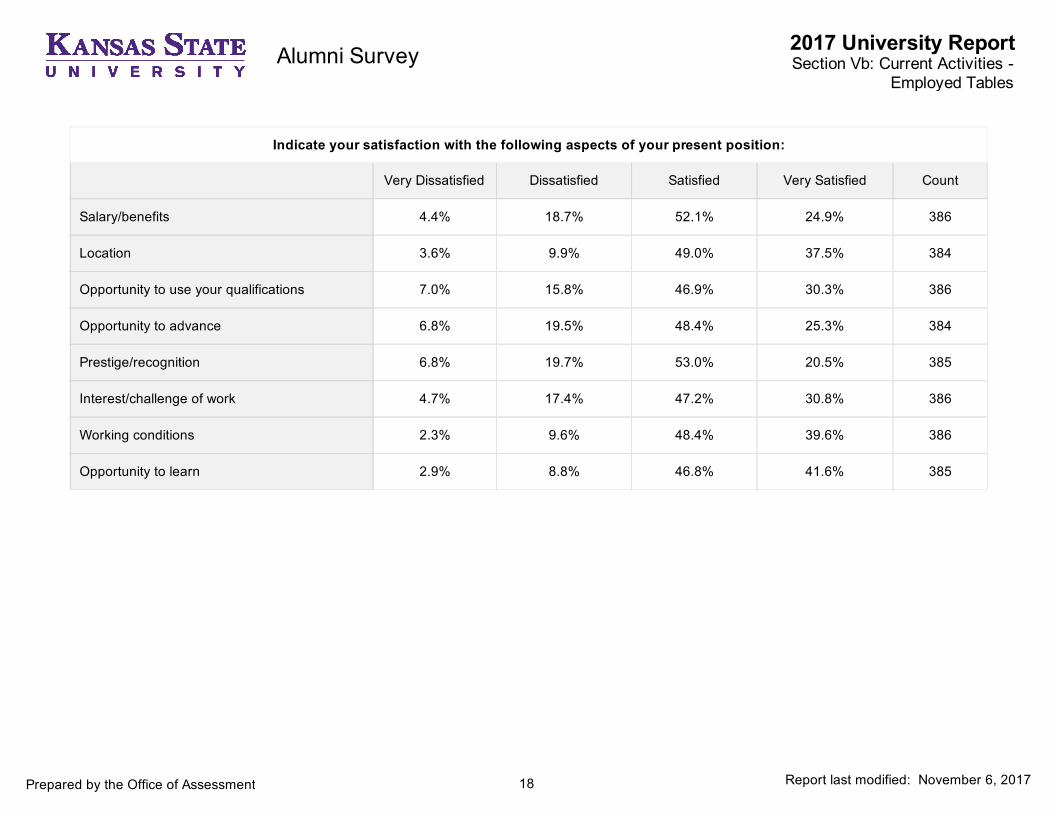
Indicate your satisfaction with the following aspects of your present position:
Very Dissatisfied Dissatisfied Satisfied Very Satisfied Count
Salary/benefits 4.4% 18.7% 52.1% 24.9% 386
Location 3.6% 9.9% 49.0% 37.5% 384
Opportunity to use your qualifications 7.0% 15.8% 46.9% 30.3% 386
Opportunity to advance 6.8% 19.5% 48.4% 25.3% 384
Prestige/recognition 6.8% 19.7% 53.0% 20.5% 385
Interest/challenge of work 4.7% 17.4% 47.2% 30.8% 386
Working conditions 2.3% 9.6% 48.4% 39.6% 386
Opportunity to learn 2.9% 8.8% 46.8% 41.6% 385
18
2017 University Report
Report last modified: November 6, 2017Prepared by the Office of Assessment
Section Vb: Current Activities -Employed Tables
Alumni Survey
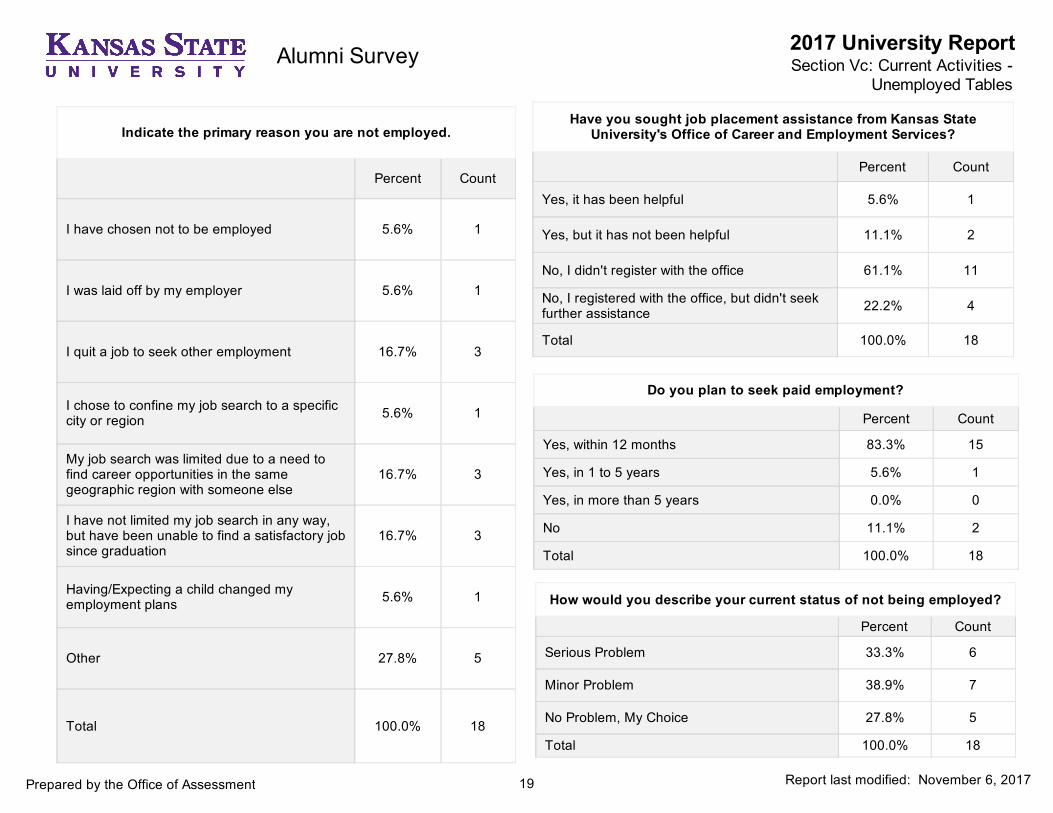
Indicate the primary reason you are not employed.
Percent Count
I have chosen not to be employed 5.6% 1
I was laid off by my employer 5.6% 1
I quit a job to seek other employment 16.7% 3
I chose to confine my job search to a specificcity or region 5.6% 1
My job search was limited due to a need tofind career opportunities in the samegeographic region with someone else
16.7% 3
I have not limited my job search in any way,but have been unable to find a satisfactory jobsince graduation
16.7% 3
Having/Expecting a child changed myemployment plans 5.6% 1
Other 27.8% 5
Total 100.0% 18
Have you sought job placement assistance from Kansas StateUniversity's Office of Career and Employment Services?
Percent Count
Yes, it has been helpful 5.6% 1
Yes, but it has not been helpful 11.1% 2
No, I didn't register with the office 61.1% 11
No, I registered with the office, but didn't seekfurther assistance 22.2% 4
Total 100.0% 18
Do you plan to seek paid employment?
Percent Count
Yes, within 12 months 83.3% 15
Yes, in 1 to 5 years 5.6% 1
Yes, in more than 5 years 0.0% 0
No 11.1% 2
Total 100.0% 18
How would you describe your current status of not being employed?
Percent Count
Serious Problem 33.3% 6
Minor Problem 38.9% 7
No Problem, My Choice 27.8% 5
Total 100.0% 18
19
2017 University Report
Report last modified: November 6, 2017Prepared by the Office of Assessment
Section Vc: Current Activities -Unemployed Tables
Alumni Survey