2017 state physician workforce data report state physician workforc… · the 2017 state physician...
TRANSCRIPT

Association ofAmerican Medical Colleges
2017 State Physician Workforce Data Report
November 2017
This is a publication of the Association of American Medical Colleges. The AAMC serves and leads the academic medicine community to improve the health of all. aamc.org
© 2017 Association of American Medical Colleges. May be reproduced and distributed with attribution for educational and noncommercial purposes only.
Acknowledgments
We would like to express our appreciation to our AAMC colleagues for their collaborative efforts. The publication was produced under the direction of Michael Dill, Karen Jones, and Kara Fisher. We are grateful to the AAMC Data and Operations and Data Warehouse teams, without whose help the data analysis would not be possible, as well as to the AAMC Editorial Services, Creative Services, and Communications teams.
We also owe special thanks to the American Medical Association for making the Physician Masterfile available to the AAMC for research purposes and the American Association of Colleges of Osteopathic Medicine for providing data on students in DO-granting institutions.
The Workforce Studies team welcomes your comments and suggestions for future editions of this report.
Please send comments, suggestions, or questions to: Michael Dill, Director AAMC Workforce Studies [email protected]
Contents
Executive Summary 1State Snapshots 2Key Definitions 2Commonly Used Acronyms 3
Section 1: Physician Supply
Key Findings 41. Active Physicians per 100,000 Population by Degree Type, 2016 5
Map 1.1 5 Figure 1.1 6 Table 1.1 7
2. Active Patient Care Physicians per 100,000 Population by Degree Type, 2016 8Figure 1.2 8 Table 1.2 9
3. Active Primary Care Physicians per 100,000 Population by Degree Type, 2016 10Map 1.3 10 Figure 1.3 11 Table 1.3 12
4. Active Patient Care Primary Care Physicians per 100,000 Population by Degree Type, 2016 13Figure 1.4 13 Table 1.4 14
5. Active General Surgeons per 100,000 Population by Degree Type, 2016 15Map 1.5 15 Figure 1.5 16 Table 1.5 17
6. Active Patient Care General Surgeons per 100,000 Population by Degree Type, 2016 18Figure 1.6 18 Table 1.6 19
7. Active Female Physicians, 2016 20Figure 1.7 20 Table 1.7 21
8. Active Physicians by School Type, 2016 22Map 1.8 22 Figure 1.8 23 Table 1.8 24
9. Active Physicians by Selected Age Groups, 2016 25Figure 1.9 25 Table 1.9 26
Association of American Medical Collegesii

Section 2: Undergraduate Medical Education (UME)
Key Findings 271. Student Enrollment per 100,000 Population by School Type,
Academic Year 2016–2017 28Map 2.1 28 Figure 2.1 29 Table 2.1 30
2. Student Enrollment in Public Schools per 100,000 Population by School Type, Academic Year 2016–2017 31Map 2.2 31 Figure 2.2 32 Table 2.2 33
3. Percentage Change in Student Enrollment by School Type, 2006–2016 34Figure 2.3 34 Table 2.3 35
4. Percentage of Students Matriculating in State, Academic Year 2016–2017 36Figure 2.4 36 Table 2.4 37
Section 3: Graduate Medical Education (GME)
Key Findings 381. Residents and Fellows on Duty as of December 31, 2016, in ACGME-Accredited Programs
per 100,000 Population by Degree Type 39Map 3.1 39 Figure 3.1 40 Table 3.1 41
2. Residents and Fellows on Duty as of December 31, 2016, in ACGME-Accredited Primary Care Programs per 100,000 Population by Degree Type 42
Map 3.2 42 Figure 3.2 43 Table 3.2 44
3. Residents and Fellows on Duty as of December 31, 2016, in ACGME-Accredited Programs by School Type 45Figure 3.3 45 Table 3.3 46
4. Ratio of Graduate Medical Education (GME) to Undergraduate Medical Education (UME), Academic Year 2015–2016 47
Map 3.4 47 Figure 3.4 48 Table 3.4 49
5. Change in Number of Residents and Fellows in ACGME-Accredited Programs, 2006–2016 50Map 3.5.1 50 Map 3.5.2 51 Figure 3.5 52 Table 3.5 53
Association of American Medical Collegesiii
2017 State Physician Workforce Data Report
Section 4: Retention
Key Findings 541. Physicians Retained From Undergraduate Medical Education (UME), 2016 55
Map 4.1 55 Figure 4.1 56 Table 4.1 57
2. Physicians Retained From Public Undergraduate Medical Education (UME), 2016 58Figure 4.2 58 Table 4.2 59
3. Physicians Retained From Graduate Medical Education (GME), 2016 60Map 4.3 60 Figure 4.3 61 Table 4.3 62
4. Physicians Retained From Undergraduate Medical Education (UME) and Graduate Medical Education (GME) Combined, 2016 63
Figure 4.4 63 Table 4.4 64
Summary
Key Findings 65Summary Table 65
Association of American Medical Collegesiv
2017 State Physician Workforce Data Report

I 1 I
Executive Summary
The 2017 State Physician Workforce Data Report, which is an update of the 2015 State Physician Workforce Data Book, examines current physician supply, medical school enrollment, and graduate medical education (GME) in the United States. The report provides the most current data available for each state, the District of Columbia (D.C.), and Puerto Rico in a series of maps, figures, and tables, including the U.S. average (excluding Puerto Rico), state median (excluding D.C. and Puerto Rico),1 and state rank. Additionally, this edition includes a summary table that compares the state median for each physician workforce measure in 2008, 2010, 2012, 2014, and 2016.
The Data Report is divided into four sections:
Section 1: Physician Supply. This section includes data on active physicians in each state, including physician-to-population ratios, percentage who are female, age distribution, and school type. Data by race and ethnicity are not available.
Section 2: Undergraduate Medical Education. This section provides information on enrollment at both MD-granting and DO-granting institutions, as well as data on in-state matriculation. Alaska, Delaware, Idaho, Montana, and Wyoming do not have medical schools, but four of those states (Alaska, Idaho, Montana, and Wyoming) have an agreement with the University of Washington School of Medicine to reserve undergraduate medical education (UME) slots for residents of those states. For this report, all students at the University of Washington Medical School are counted in the Washington enrollment and not in other states.
Section 3: Graduate Medical Education. This section presents data on physicians in residency and fellowship positions in each state, including physician-to-population ratios and medical school type. This section includes data on MDs and DOs training in programs accredited by the Accreditation Council for Graduate Medical Education (ACGME). Where possible, data for physicians training in programs accredited by the American Osteopathic Association (AOA) are also included.
Section 4: Retention. This section presents data on states’ retention of the physicians they educate in medical schools and GME programs.
The primary data sources for this report are:• The American Medical Association (AMA) Physician Masterfile (December 31, 2016)• 2016 population estimates from the U.S. Census Bureau• The AAMC Student Record System• The American Association of Colleges of Osteopathic Medicine • The American Osteopathic Association• The National GME Census, conducted jointly by the AAMC and the AMA• The AAMC Applicant Matriculant File
1. The U.S. average differs from the state median. The U.S. average is calculated by summing the values for all 50 states and D.C. and dividing the sum by 51. The state median, on the other hand, excludes D.C. and Puerto Rico, and is the value directly in the middle of the 50 states so that 25 states are above the state median, and 25 states are below the state median.
Association of American Medical Colleges1
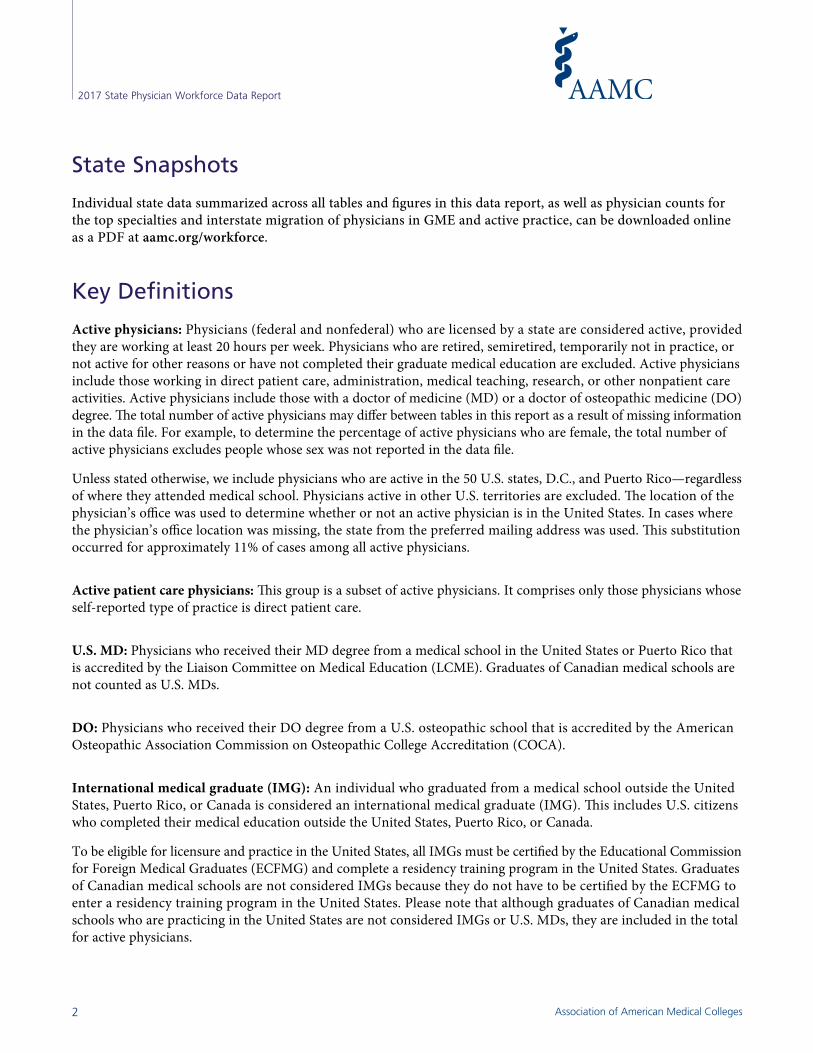
State Snapshots
Individual state data summarized across all tables and figures in this data report, as well as physician counts for the top specialties and interstate migration of physicians in GME and active practice, can be downloaded online as a PDF at aamc.org/workforce.
Key Definitions
Active physicians: Physicians (federal and nonfederal) who are licensed by a state are considered active, provided they are working at least 20 hours per week. Physicians who are retired, semiretired, temporarily not in practice, or not active for other reasons or have not completed their graduate medical education are excluded. Active physicians include those working in direct patient care, administration, medical teaching, research, or other nonpatient care activities. Active physicians include those with a doctor of medicine (MD) or a doctor of osteopathic medicine (DO) degree. The total number of active physicians may differ between tables in this report as a result of missing information in the data file. For example, to determine the percentage of active physicians who are female, the total number of active physicians excludes people whose sex was not reported in the data file.
Unless stated otherwise, we include physicians who are active in the 50 U.S. states, D.C., and Puerto Rico—regardless of where they attended medical school. Physicians active in other U.S. territories are excluded. The location of the physician’s office was used to determine whether or not an active physician is in the United States. In cases where the physician’s office location was missing, the state from the preferred mailing address was used. This substitution occurred for approximately 11% of cases among all active physicians.
Active patient care physicians: This group is a subset of active physicians. It comprises only those physicians whose self-reported type of practice is direct patient care.
U.S. MD: Physicians who received their MD degree from a medical school in the United States or Puerto Rico that is accredited by the Liaison Committee on Medical Education (LCME). Graduates of Canadian medical schools are not counted as U.S. MDs.
DO: Physicians who received their DO degree from a U.S. osteopathic school that is accredited by the American Osteopathic Association Commission on Osteopathic College Accreditation (COCA).
International medical graduate (IMG): An individual who graduated from a medical school outside the United States, Puerto Rico, or Canada is considered an international medical graduate (IMG). This includes U.S. citizens who completed their medical education outside the United States, Puerto Rico, or Canada.
To be eligible for licensure and practice in the United States, all IMGs must be certified by the Educational Commission for Foreign Medical Graduates (ECFMG) and complete a residency training program in the United States. Graduates of Canadian medical schools are not considered IMGs because they do not have to be certified by the ECFMG to enter a residency training program in the United States. Please note that although graduates of Canadian medical schools who are practicing in the United States are not considered IMGs or U.S. MDs, they are included in the total for active physicians.
Association of American Medical Colleges2
2017 State Physician Workforce Data Report

Primary care physicians: Physicians are counted as primary care physicians if their self-designated primary specialty is one of the following: adolescent medicine (pediatrics), family medicine, general practice, geriatric medicine (family practice), geriatric medicine (internal medicine), internal medicine, internal medicine/pediatrics, or pediatrics. Residents and fellows are counted as primary care residents and fellows if they are in one of the following programs: adolescent medicine (pediatrics), family medicine, family practice, geriatric medicine (family practice), geriatric medicine (internal medicine), geriatric medicine/family practice, geriatric medicine/internal medicine, internal medicine, internal medicine/family practice, internal medicine/pediatrics, or pediatrics.
Residents: Physicians who have completed undergraduate medical education and are in a core ACGME- or AOA-accredited training program.
Fellows: Physicians who have completed a residency and are pursuing further training in a subspecialty through a fellowship program accredited by the ACGME.
Commonly Used Acronyms
AACOM American Association of Colleges of Osteopathic Medicine
AAMC Association of American Medical Colleges
ACGME Accreditation Council for Graduate Medical Education
AMA American Medical Association
AOA American Osteopathic Association
DO Doctor of Osteopathic Medicine
GME Graduate Medical Education
IMG International Medical Graduate
MD Doctor of Medicine
OGME Osteopathic Graduate Medical Education
UME Undergraduate Medical Education
Association of American Medical Colleges3
2017 State Physician Workforce Data Report

Section 1: Physician Supply
Key Findings
• In 2016, there were 271.6 active physicians per 100,000 population in the United States, ranging from a high of 443.5 in Massachusetts to a low of 186.1 in Mississippi. The states with the highest number of physicians per 100,000 population are concentrated in the Northeast (see Map 1.1, Figure 1.1, and Table 1.1).
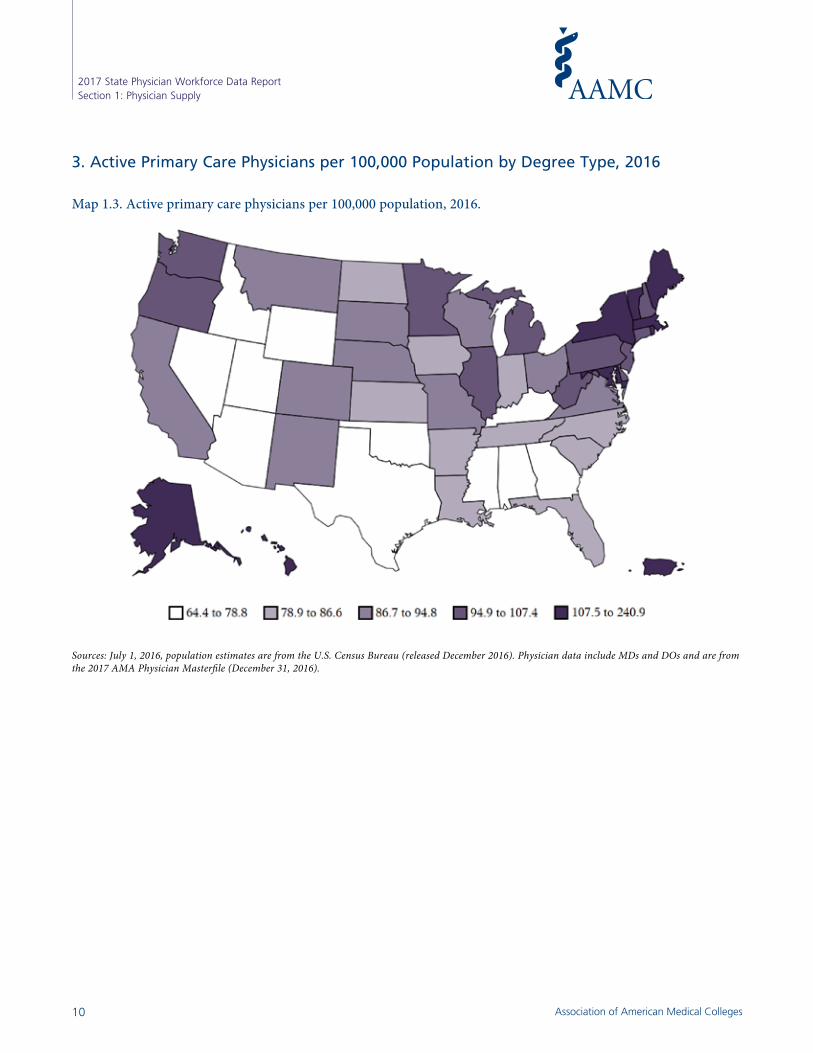
• There were 91.7 active primary care physicians per 100,000 population in the United States in 2016 (see Map 1.3, Figure 1.3, and Table 1.3). Once again, Massachusetts was at the top, with a value of 134.4, while Mississippi had the lowest number of primary care physicians per 100,000 population (64.4).
• Nationally, there were 7.8 active general surgeons per 100,000 population in 2016 (see Map 1.5, Figure 1.5, and Table 1.5). Maine and Vermont had the highest number of general surgeons per 100,000 population (12.0), while Utah and Nevada had the lowest number of general surgeons per 100,000 population (5.7 and 6.1, respectively).
• Nationally, 24.5% of active physicians were IMGs (see Map 1.8, Figure 1.8, and Table 1.8). States varied widely in the percentage of their physician workforce that graduated from an international medical school.1 New Jersey and New York had the highest percentages (38.7% and 37.2%, respectively), while Idaho and Montana had the lowest (5.1% and 5.2%, respectively).
• In 2016, 34.6% of active physicians in the United States were female (see Figure 1.7 and Table 1.7). More than a third of active physicians in 28 states, Puerto Rico, and the District of Columbia were female, while Utah had the lowest percentage of female physicians (23.8%).
• Nationally, almost one-third (30.9%) of active physicians were age 60 or older. There was some variation among the states in the percentage of physicians who were age 60 or older in 2016. New Mexico had the highest percentage (37.0%), while Utah had the lowest percentage of physicians 60 or older (26.0%) (see Figure 1.9 and Table 1.9).
1. Graduates from Canadian medical schools are not considered IMGs. See Key Definitions for more information.
Association of American Medical Colleges4

1. Active Physicians per 100,000 Population by Degree Type, 2016
Map 1.1. Active physicians per 100,000 population, 2016.
Sources: July 1, 2016, population estimates are from the U.S. Census Bureau (released December 2016). Physician data include MDs and DOs and are from the 2017 AMA Physician Masterfile (December 31, 2016).
The SAS System 15:06 Tuesday, August 8, 2017 1The SAS System 15:06 Tuesday, August 8, 2017 1The SAS System 15:06 Tuesday, August 8, 2017 1The SAS System 15:06 Tuesday, August 8, 2017 1The SAS System 15:06 Tuesday, August 8, 2017 1The SAS System 15:06 Tuesday, August 8, 2017 1The SAS System 15:06 Tuesday, August 8, 2017 1The SAS System 15:06 Tuesday, August 8, 2017 1The SAS System 15:06 Tuesday, August 8, 2017 1The SAS System 15:06 Tuesday, August 8, 2017 1The SAS System 15:06 Tuesday, August 8, 2017 1The SAS System 15:06 Tuesday, August 8, 2017 1
Association of American Medical Colleges5
2017 State Physician Workforce Data ReportSection 1: Physician Supply
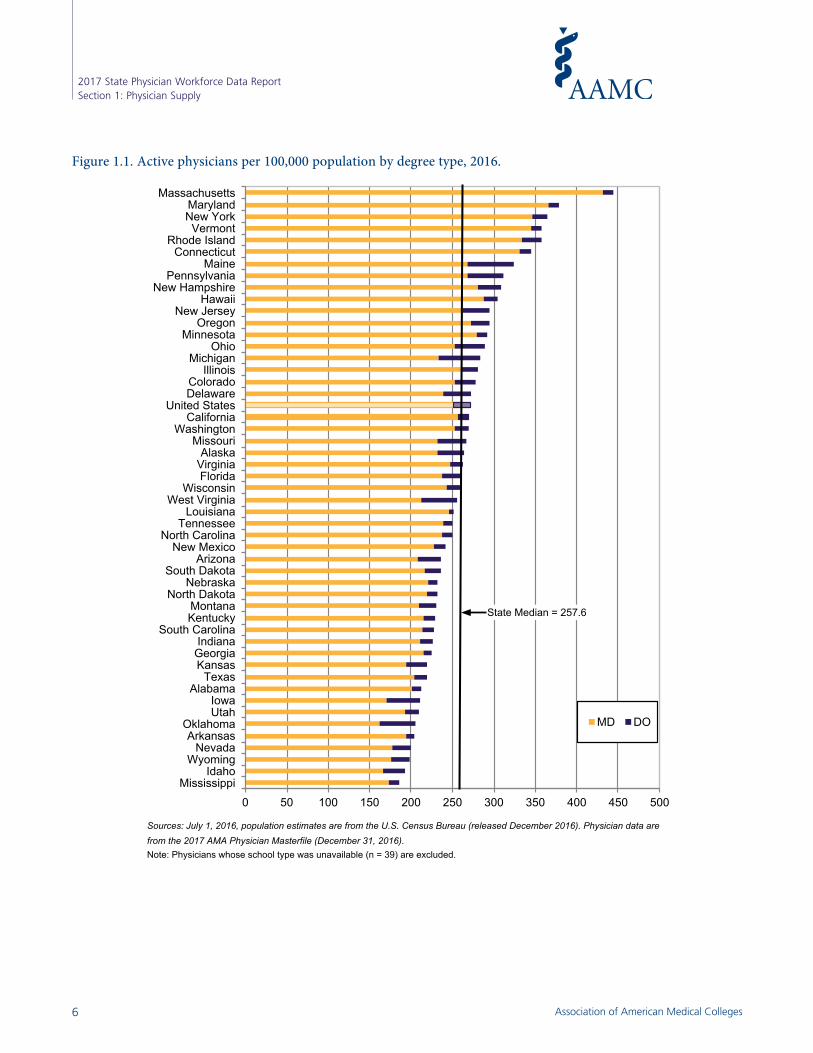
Figure 1.1. Active physicians per 100,000 population by degree type, 2016.
Sources: July 1, 2016, population estimates are from the U.S. Census Bureau (released December 2016). Physician data are from the 2017 AMA Physician Masterfile (December 31, 2016).Note: Physicians whose school type was unavailable (n = 39) are excluded.
0 50 100 150 200 250 300 350 400 450 500Mississippi
IdahoWyoming
NevadaArkansas
OklahomaUtahIowa
AlabamaTexas
KansasGeorgiaIndiana
South CarolinaKentuckyMontana
North DakotaNebraska
South DakotaArizona
New MexicoNorth Carolina
TennesseeLouisiana
West VirginiaWisconsin
FloridaVirginiaAlaska
MissouriWashington
CaliforniaUnited States
DelawareColorado
IllinoisMichigan
OhioMinnesota
OregonNew Jersey
HawaiiNew Hampshire
PennsylvaniaMaine
ConnecticutRhode Island
VermontNew YorkMaryland
Massachusetts
MD DO
State Median = 257.6
Figure 1.1. Active physicians per 100,000 population by degree type, 2016.
Association of American Medical Colleges6
2017 State Physician Workforce Data ReportSection 1: Physician Supply
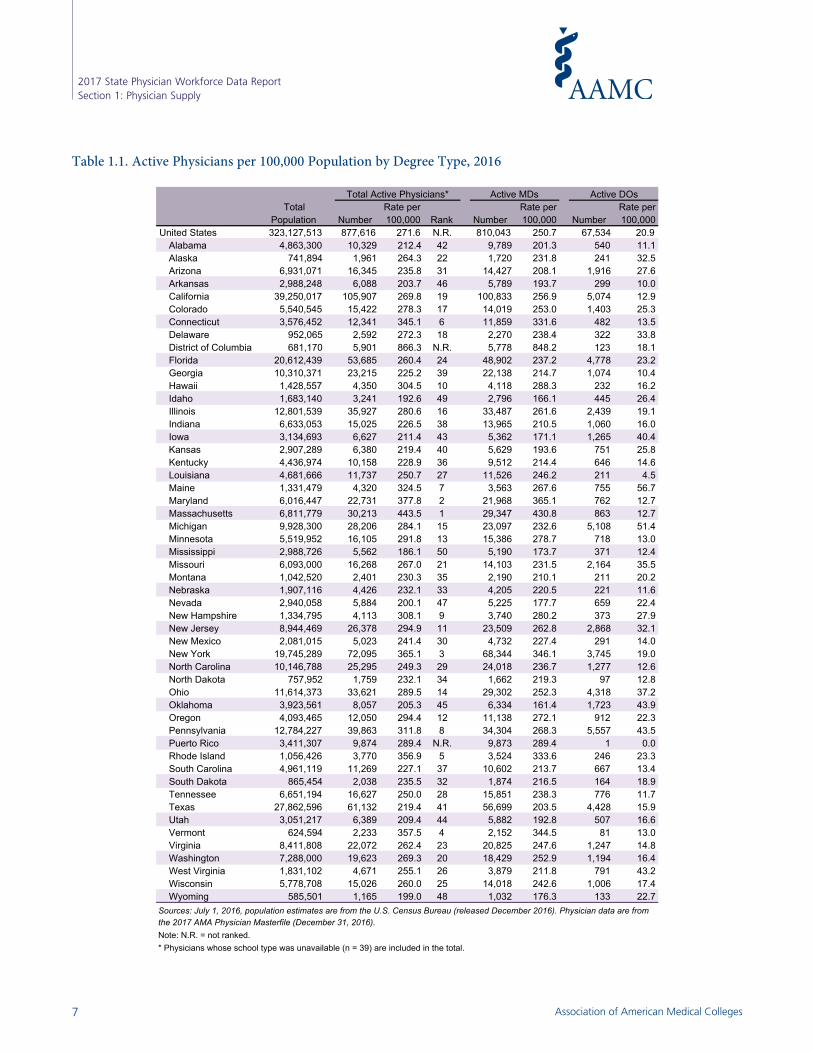
Table 1.1. Active Physicians per 100,000 Population by Degree Type, 2016
Total Rate per Rate per Rate perPopulation Number 100,000 Rank Number 100,000 Number 100,000
United States 323,127,513 877,616 271.6 N.R. 810,043 250.7 67,534 20.9Alabama 4,863,300 10,329 212.4 42 9,789 201.3 540 11.1Alaska 741,894 1,961 264.3 22 1,720 231.8 241 32.5Arizona 6,931,071 16,345 235.8 31 14,427 208.1 1,916 27.6Arkansas 2,988,248 6,088 203.7 46 5,789 193.7 299 10.0California 39,250,017 105,907 269.8 19 100,833 256.9 5,074 12.9Colorado 5,540,545 15,422 278.3 17 14,019 253.0 1,403 25.3Connecticut 3,576,452 12,341 345.1 6 11,859 331.6 482 13.5Delaware 952,065 2,592 272.3 18 2,270 238.4 322 33.8District of Columbia 681,170 5,901 866.3 N.R. 5,778 848.2 123 18.1Florida 20,612,439 53,685 260.4 24 48,902 237.2 4,778 23.2Georgia 10,310,371 23,215 225.2 39 22,138 214.7 1,074 10.4Hawaii 1,428,557 4,350 304.5 10 4,118 288.3 232 16.2Idaho 1,683,140 3,241 192.6 49 2,796 166.1 445 26.4Illinois 12,801,539 35,927 280.6 16 33,487 261.6 2,439 19.1Indiana 6,633,053 15,025 226.5 38 13,965 210.5 1,060 16.0Iowa 3,134,693 6,627 211.4 43 5,362 171.1 1,265 40.4Kansas 2,907,289 6,380 219.4 40 5,629 193.6 751 25.8Kentucky 4,436,974 10,158 228.9 36 9,512 214.4 646 14.6Louisiana 4,681,666 11,737 250.7 27 11,526 246.2 211 4.5Maine 1,331,479 4,320 324.5 7 3,563 267.6 755 56.7Maryland 6,016,447 22,731 377.8 2 21,968 365.1 762 12.7Massachusetts 6,811,779 30,213 443.5 1 29,347 430.8 863 12.7Michigan 9,928,300 28,206 284.1 15 23,097 232.6 5,108 51.4Minnesota 5,519,952 16,105 291.8 13 15,386 278.7 718 13.0Mississippi 2,988,726 5,562 186.1 50 5,190 173.7 371 12.4Missouri 6,093,000 16,268 267.0 21 14,103 231.5 2,164 35.5Montana 1,042,520 2,401 230.3 35 2,190 210.1 211 20.2Nebraska 1,907,116 4,426 232.1 33 4,205 220.5 221 11.6Nevada 2,940,058 5,884 200.1 47 5,225 177.7 659 22.4New Hampshire 1,334,795 4,113 308.1 9 3,740 280.2 373 27.9New Jersey 8,944,469 26,378 294.9 11 23,509 262.8 2,868 32.1New Mexico 2,081,015 5,023 241.4 30 4,732 227.4 291 14.0New York 19,745,289 72,095 365.1 3 68,344 346.1 3,745 19.0North Carolina 10,146,788 25,295 249.3 29 24,018 236.7 1,277 12.6North Dakota 757,952 1,759 232.1 34 1,662 219.3 97 12.8Ohio 11,614,373 33,621 289.5 14 29,302 252.3 4,318 37.2Oklahoma 3,923,561 8,057 205.3 45 6,334 161.4 1,723 43.9Oregon 4,093,465 12,050 294.4 12 11,138 272.1 912 22.3Pennsylvania 12,784,227 39,863 311.8 8 34,304 268.3 5,557 43.5Puerto Rico 3,411,307 9,874 289.4 N.R. 9,873 289.4 1 0.0Rhode Island 1,056,426 3,770 356.9 5 3,524 333.6 246 23.3South Carolina 4,961,119 11,269 227.1 37 10,602 213.7 667 13.4South Dakota 865,454 2,038 235.5 32 1,874 216.5 164 18.9Tennessee 6,651,194 16,627 250.0 28 15,851 238.3 776 11.7Texas 27,862,596 61,132 219.4 41 56,699 203.5 4,428 15.9Utah 3,051,217 6,389 209.4 44 5,882 192.8 507 16.6Vermont 624,594 2,233 357.5 4 2,152 344.5 81 13.0Virginia 8,411,808 22,072 262.4 23 20,825 247.6 1,247 14.8Washington 7,288,000 19,623 269.3 20 18,429 252.9 1,194 16.4West Virginia 1,831,102 4,671 255.1 26 3,879 211.8 791 43.2Wisconsin 5,778,708 15,026 260.0 25 14,018 242.6 1,006 17.4Wyoming 585,501 1,165 199.0 48 1,032 176.3 133 22.7
Note: N.R. = not ranked.* Physicians whose school type was unavailable (n = 39) are included in the total.
Total Active Physicians* Active MDs Active DOs
Sources: July 1, 2016, population estimates are from the U.S. Census Bureau (released December 2016). Physician data are from the 2017 AMA Physician Masterfile (December 31, 2016).
Table 1.1. Active Physicians per 100,000 Population by Degree Type, 2016
Association of American Medical Colleges7
2017 State Physician Workforce Data ReportSection 1: Physician Supply
2. Active Patient Care Physicians per 100,000 Population by Degree Type, 2016
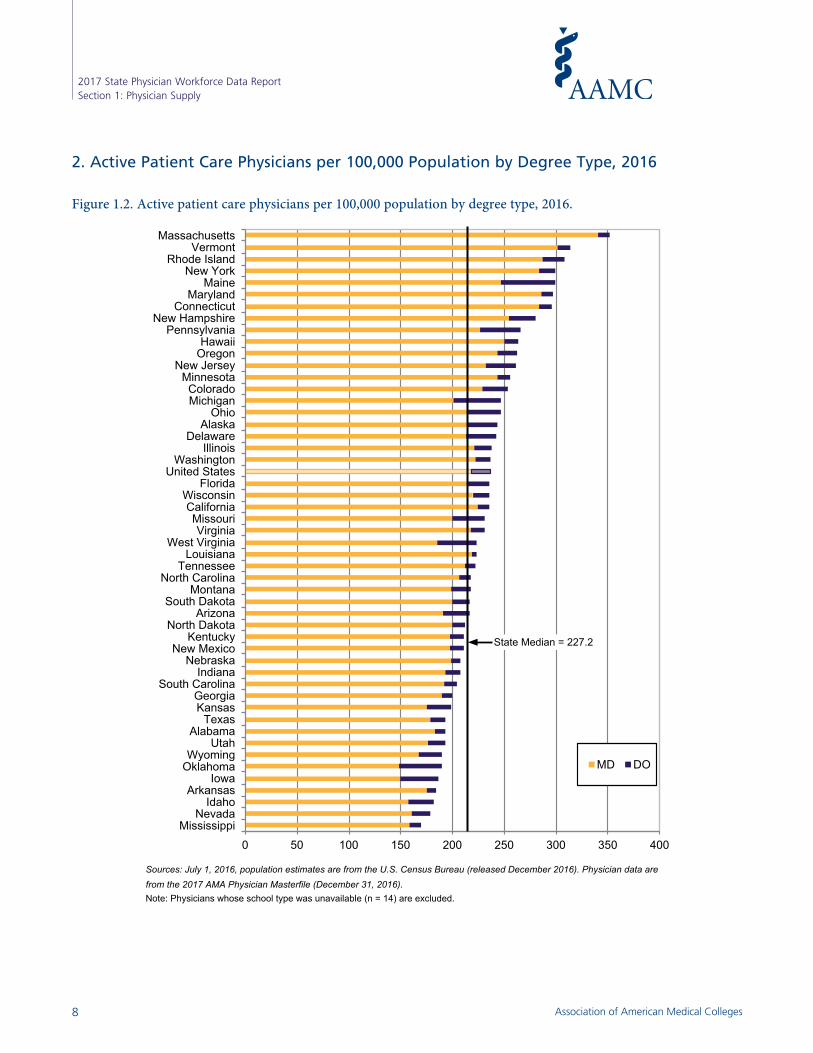
Figure 1.2. Active patient care physicians per 100,000 population by degree type, 2016.
Figure 1.2. Active patient care physicians per 100,000 population by degree type, 2016.
Sources: July 1, 2016, population estimates are from the U.S. Census Bureau (released December 2016). Physician data are from the 2017 AMA Physician Masterfile (December 31, 2016).Note: Physicians whose school type was unavailable (n = 14) are excluded.
0 50 100 150 200 250 300 350 400Mississippi
NevadaIdaho
ArkansasIowa
OklahomaWyoming
UtahAlabama
TexasKansasGeorgia
South CarolinaIndiana
NebraskaNew Mexico
KentuckyNorth Dakota
ArizonaSouth Dakota
MontanaNorth Carolina
TennesseeLouisiana
West VirginiaVirginia
MissouriCalifornia
WisconsinFlorida
United StatesWashington
IllinoisDelaware
AlaskaOhio
MichiganColorado
MinnesotaNew Jersey
OregonHawaii
PennsylvaniaNew Hampshire
ConnecticutMaryland
MaineNew York
Rhode IslandVermont
Massachusetts
MD DO
State Median = 227.2
Association of American Medical Colleges8
2017 State Physician Workforce Data ReportSection 1: Physician Supply

Table 1.2. Active Patient Care Physicians per 100,000 Population by Degree Type, 2016Table 1.2. Active Patient-Care Physicians per 100,000 Population by Degree Type, 2016
Total Rate per Rate per Rate perPopulation Number 100,000 Rank Number 100,000 Number 100,000
United States 323,127,513 765,115 236.8 N.R. 704,573 218.0 60,528 18.7Alabama 4,863,300 9,398 193.2 42 8,893 182.9 505 10.4Alaska 741,894 1,806 243.4 17 1,593 214.7 213 28.7Arizona 6,931,071 15,007 216.5 32 13,207 190.5 1,800 26.0Arkansas 2,988,248 5,518 184.7 47 5,243 175.5 275 9.2California 39,250,017 92,614 236.0 23 88,167 224.6 4,447 11.3Colorado 5,540,545 14,033 253.3 14 12,709 229.4 1,324 23.9Connecticut 3,576,452 10,579 295.8 7 10,146 283.7 433 12.1Delaware 952,065 2,306 242.2 18 2,026 212.8 280 29.4District of Columbia 681,170 4,263 625.8 N.R. 4,175 612.9 88 12.9Florida 20,612,439 48,666 236.1 21 44,278 214.8 4,385 21.3Georgia 10,310,371 20,583 199.6 39 19,630 190.4 951 9.2Hawaii 1,428,557 3,772 264.0 10 3,577 250.4 195 13.7Idaho 1,683,140 3,058 181.7 48 2,646 157.2 412 24.5Illinois 12,801,539 30,503 238.3 19 28,355 221.5 2,148 16.8Indiana 6,633,053 13,780 207.7 37 12,794 192.9 986 14.9Iowa 3,134,693 5,860 186.9 46 4,694 149.7 1,166 37.2Kansas 2,907,289 5,770 198.5 40 5,087 175.0 683 23.5Kentucky 4,436,974 9,391 211.7 34 8,795 198.2 596 13.4Louisiana 4,681,666 10,451 223.2 27 10,264 219.2 187 4.0Maine 1,331,479 3,986 299.4 5 3,286 246.8 698 52.4Maryland 6,016,447 17,850 296.7 6 17,216 286.1 634 10.5Massachusetts 6,811,779 23,933 351.3 1 23,199 340.6 734 10.8Michigan 9,928,300 24,462 246.4 15 19,947 200.9 4,515 45.5Minnesota 5,519,952 14,122 255.8 13 13,469 244.0 653 11.8Mississippi 2,988,726 5,075 169.8 50 4,747 158.8 328 11.0Missouri 6,093,000 14,085 231.2 24 12,170 199.7 1,915 31.4Montana 1,042,520 2,272 217.9 30 2,076 199.1 196 18.8Nebraska 1,907,116 3,971 208.2 36 3,783 198.4 188 9.9Nevada 2,940,058 5,250 178.6 49 4,719 160.5 531 18.1New Hampshire 1,334,795 3,742 280.3 8 3,395 254.3 347 26.0New Jersey 8,944,469 23,389 261.5 12 20,778 232.3 2,611 29.2New Mexico 2,081,015 4,396 211.2 35 4,126 198.3 270 13.0New York 19,745,289 59,201 299.8 4 55,972 283.5 3,227 16.3North Carolina 10,146,788 22,155 218.3 29 21,021 207.2 1,134 11.2North Dakota 757,952 1,606 211.9 33 1,518 200.3 88 11.6Ohio 11,614,373 28,616 246.4 16 24,908 214.5 3,708 31.9Oklahoma 3,923,561 7,432 189.4 45 5,823 148.4 1,609 41.0Oregon 4,093,465 10,763 262.9 11 9,950 243.1 813 19.9Pennsylvania 12,784,227 34,035 266.2 9 28,947 226.4 5,087 39.8Puerto Rico 3,411,307 8,060 236.3 N.R. 8,059 236.2 1 0.0Rhode Island 1,056,426 3,255 308.1 3 3,034 287.2 221 20.9South Carolina 4,961,119 10,129 204.2 38 9,537 192.2 592 11.9South Dakota 865,454 1,878 217.0 31 1,730 199.9 148 17.1Tennessee 6,651,194 14,817 222.8 28 14,113 212.2 704 10.6Texas 27,862,596 53,962 193.7 41 49,952 179.3 4,007 14.4Utah 3,051,217 5,881 192.7 43 5,389 176.6 492 16.1Vermont 624,594 1,957 313.3 2 1,885 301.8 72 11.5Virginia 8,411,808 19,417 230.8 25 18,346 218.1 1,071 12.7Washington 7,288,000 17,280 237.1 20 16,189 222.1 1,091 15.0West Virginia 1,831,102 4,094 223.6 26 3,400 185.7 694 37.9Wisconsin 5,778,708 13,636 236.0 22 12,685 219.5 950 16.4Wyoming 585,501 1,110 189.6 44 984 168.1 126 21.5
Note: N.R. = not ranked.* Physicians whose school type was unavailable (n = 14) are included in the total.
Sources: July 1, 2016, population estimates are from the U.S. Census Bureau (Release date: December 2016). Physician data are from the 2017 AMA Physician Masterfile (December 31, 2016).
Care MDs Care DOsActive Patient Active PatientTotal Active Patient
Care Physicians*
Association of American Medical Colleges9
2017 State Physician Workforce Data ReportSection 1: Physician Supply
3. Active Primary Care Physicians per 100,000 Population by Degree Type, 2016
Map 1.3. Active primary care physicians per 100,000 population, 2016.
Sources: July 1, 2016, population estimates are from the U.S. Census Bureau (released December 2016). Physician data include MDs and DOs and are from the 2017 AMA Physician Masterfile (December 31, 2016).
The SAS System 15:06 Tuesday, August 8, 2017 1The SAS System 15:06 Tuesday, August 8, 2017 1The SAS System 15:06 Tuesday, August 8, 2017 1The SAS System 15:06 Tuesday, August 8, 2017 1The SAS System 15:06 Tuesday, August 8, 2017 1The SAS System 15:06 Tuesday, August 8, 2017 1
Association of American Medical Colleges10
2017 State Physician Workforce Data ReportSection 1: Physician Supply
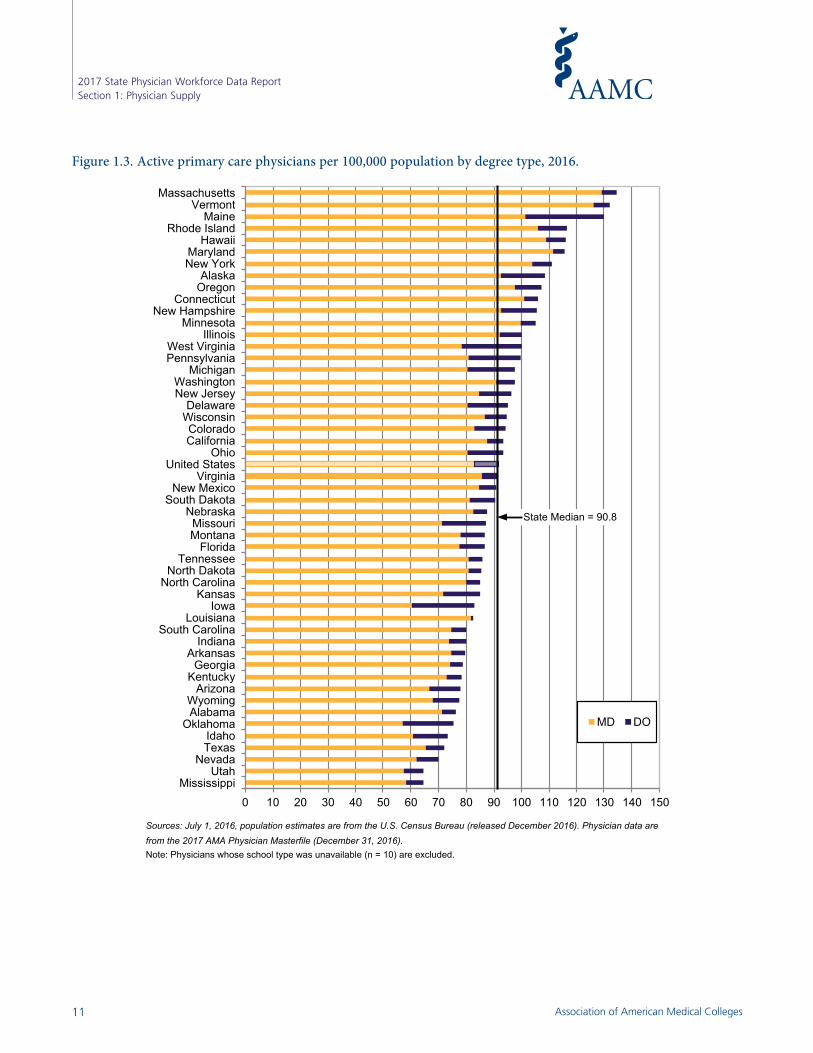
Figure 1.3. Active primary care physicians per 100,000 population by degree type, 2016.
Figure 1.3. Active primary care physicians per 100,000 population by degree type, 2016.
Sources: July 1, 2016, population estimates are from the U.S. Census Bureau (released December 2016). Physician data are from the 2017 AMA Physician Masterfile (December 31, 2016).Note: Physicians whose school type was unavailable (n = 10) are excluded.
0 10 20 30 40 50 60 70 80 90 100 110 120 130 140 150Mississippi
UtahNevada
TexasIdaho
OklahomaAlabamaWyoming
ArizonaKentucky
GeorgiaArkansas
IndianaSouth Carolina
LouisianaIowa
KansasNorth CarolinaNorth Dakota
TennesseeFlorida
MontanaMissouri
NebraskaSouth Dakota
New MexicoVirginia
United StatesOhio
CaliforniaColorado
WisconsinDelaware
New JerseyWashington
MichiganPennsylvaniaWest Virginia
IllinoisMinnesota
New HampshireConnecticut
OregonAlaska
New YorkMaryland
HawaiiRhode Island
MaineVermont
Massachusetts
MD DO
State Median = 90.8
Association of American Medical Colleges11
2017 State Physician Workforce Data ReportSection 1: Physician Supply

Table 1.3. Active Primary Care Physicians per 100,000 Population by Degree Type, 2016Table 1.3. Active Primary Care Physicians per 100,000 Population by Degree Type, 2016
Total Rate per Rate per Rate perPopulation Number 100,000 Rank Number 100,000 Number 100,000
United States 323,127,513 296,353 91.7 N.R. 268,384 83.1 27,959 8.7Alabama 4,863,300 3,713 76.3 44 3,468 71.3 245 5.0Alaska 741,894 806 108.6 8 688 92.7 118 15.9Arizona 6,931,071 5,396 77.9 42 4,628 66.8 768 11.1Arkansas 2,988,248 2,377 79.5 39 2,223 74.4 154 5.2California 39,250,017 36,700 93.5 22 34,289 87.4 2,411 6.1Colorado 5,540,545 5,218 94.2 21 4,603 83.1 615 11.1Connecticut 3,576,452 3,786 105.9 10 3,613 101.0 173 4.8Delaware 952,065 904 95.0 19 764 80.2 140 14.7District of Columbia 681,170 1,641 240.9 N.R. 1,605 235.6 36 5.3Florida 20,612,439 17,851 86.6 30 15,981 77.5 1,869 9.1Georgia 10,310,371 8,123 78.8 40 7,665 74.3 456 4.4Hawaii 1,428,557 1,660 116.2 5 1,556 108.9 104 7.3Idaho 1,683,140 1,231 73.1 46 1,020 60.6 211 12.5Illinois 12,801,539 12,808 100.1 13 11,802 92.2 1,006 7.9Indiana 6,633,053 5,301 79.9 38 4,880 73.6 421 6.3Iowa 3,134,693 2,597 82.8 35 1,895 60.5 702 22.4Kansas 2,907,289 2,467 84.9 34 2,077 71.4 390 13.4Kentucky 4,436,974 3,467 78.1 41 3,228 72.8 239 5.4Louisiana 4,681,666 3,873 82.7 36 3,816 81.5 57 1.2Maine 1,331,479 1,731 130.0 3 1,349 101.3 381 28.6Maryland 6,016,447 6,955 115.6 6 6,710 111.5 245 4.1Massachusetts 6,811,779 9,156 134.4 1 8,783 128.9 373 5.5Michigan 9,928,300 9,701 97.7 16 7,975 80.3 1,726 17.4Minnesota 5,519,952 5,806 105.2 12 5,513 99.9 292 5.3Mississippi 2,988,726 1,925 64.4 50 1,743 58.3 182 6.1Missouri 6,093,000 5,301 87.0 28 4,342 71.3 959 15.7Montana 1,042,520 903 86.6 29 812 77.9 91 8.7Nebraska 1,907,116 1,673 87.7 27 1,574 82.5 99 5.2Nevada 2,940,058 2,060 70.1 48 1,818 61.8 242 8.2New Hampshire 1,334,795 1,407 105.4 11 1,235 92.5 172 12.9New Jersey 8,944,469 8,613 96.3 18 7,570 84.6 1,042 11.6New Mexico 2,081,015 1,892 90.9 25 1,760 84.6 132 6.3New York 19,745,289 21,949 111.2 7 20,480 103.7 1,468 7.4North Carolina 10,146,788 8,644 85.2 33 8,112 79.9 532 5.2North Dakota 757,952 647 85.4 32 613 80.9 34 4.5Ohio 11,614,373 10,842 93.3 23 9,360 80.6 1,482 12.8Oklahoma 3,923,561 2,954 75.3 45 2,242 57.1 712 18.1Oregon 4,093,465 4,397 107.4 9 3,989 97.4 408 10.0Pennsylvania 12,784,227 12,744 99.7 15 10,321 80.7 2,423 19.0Puerto Rico 3,411,307 3,985 116.8 N.R. 3,984 116.8 1 0.0Rhode Island 1,056,426 1,230 116.4 4 1,121 106.1 109 10.3South Carolina 4,961,119 3,976 80.1 37 3,699 74.6 277 5.6South Dakota 865,454 784 90.6 26 705 81.5 79 9.1Tennessee 6,651,194 5,706 85.8 31 5,369 80.7 337 5.1Texas 27,862,596 20,076 72.1 47 18,170 65.2 1,904 6.8Utah 3,051,217 1,974 64.7 49 1,755 57.5 219 7.2Vermont 624,594 823 131.8 2 787 126.0 36 5.8Virginia 8,411,808 7,692 91.4 24 7,211 85.7 481 5.7Washington 7,288,000 7,113 97.6 17 6,614 90.8 499 6.8West Virginia 1,831,102 1,830 99.9 14 1,434 78.3 396 21.6Wisconsin 5,778,708 5,477 94.8 20 5,020 86.9 456 7.9Wyoming 585,501 453 77.4 43 397 67.8 56 9.6
Note: N.R. = not ranked.* Physicians whose school type was unavailable (n = 10) are included in the total.
Sources: July 1, 2016, population estimates are from the U.S. Census Bureau (released December 2016). Physician data are from the 2017 AMA Physician Masterfile (December 31, 2016).
Primary Care Physicians* Care MDs Care DOsTotal Active Active Primary Active Primary
Association of American Medical Colleges12
2017 State Physician Workforce Data ReportSection 1: Physician Supply

4. Active Patient Care Primary Care Physicians per 100,000 Population by Degree Type, 2016
Figure 1.4. Active patient care primary care physicians per 100,000 population by degree type, 2016.
Figure 1.4. Active patient care primary care physicians per 100,000 population by degree type, 2016.
Sources: July 1, 2016, population estimates are from the U.S. Census Bureau (released December 2016). Physician data are
from the 2017 AMA Physician Masterfile (December 31, 2016).
Note: Physicians whose school type was unavailable (n = 7) are excluded.
0 10 20 30 40 50 60 70 80 90 100 110 120 130Mississippi
UtahNevada
TexasIdaho
OklahomaAlabamaGeorgiaArizona
South CarolinaKentuckyWyomingLouisiana
IndianaArkansas
IowaNorth Carolina
KansasTennessee
North DakotaMissouri
NebraskaFlorida
MontanaNew Mexico
United StatesVirginia
South DakotaOhio
CaliforniaNew Jersey
DelawareColorado
WisconsinPennsylvania
MichiganIllinois
WashingtonWest Virginia
ConnecticutNew YorkMaryland
MinnesotaNew Hampshire
OregonAlaskaHawaii
Rhode IslandMassachusetts
MaineVermont
MD DO
State Median = 82.5
Association of American Medical Colleges13
2017 State Physician Workforce Data ReportSection 1: Physician Supply
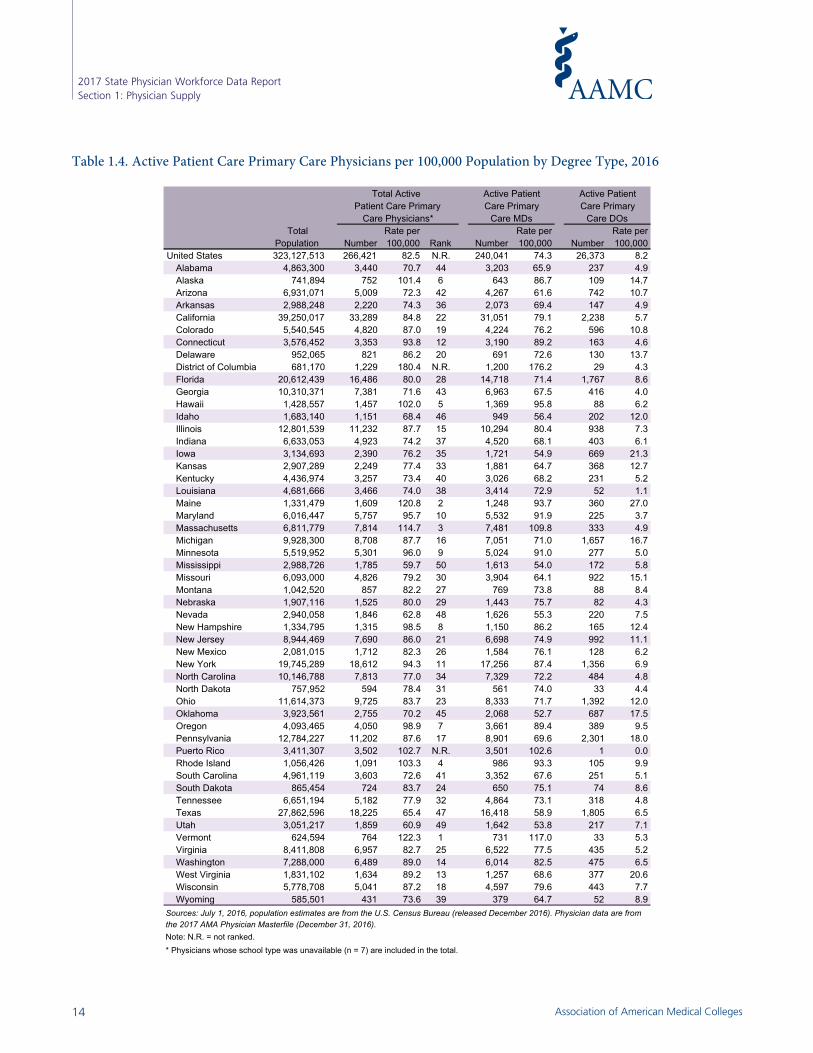
Table 1.4. Active Patient Care Primary Care Physicians per 100,000 Population by Degree Type, 2016Table 1.4. Active Patient Care Primary Care Physicians per 100,000 Population by Degree Type, 2016
Total Rate per Rate per Rate perPopulation Number 100,000 Rank Number 100,000 Number 100,000
United States 323,127,513 266,421 82.5 N.R. 240,041 74.3 26,373 8.2Alabama 4,863,300 3,440 70.7 44 3,203 65.9 237 4.9Alaska 741,894 752 101.4 6 643 86.7 109 14.7Arizona 6,931,071 5,009 72.3 42 4,267 61.6 742 10.7Arkansas 2,988,248 2,220 74.3 36 2,073 69.4 147 4.9California 39,250,017 33,289 84.8 22 31,051 79.1 2,238 5.7Colorado 5,540,545 4,820 87.0 19 4,224 76.2 596 10.8Connecticut 3,576,452 3,353 93.8 12 3,190 89.2 163 4.6Delaware 952,065 821 86.2 20 691 72.6 130 13.7District of Columbia 681,170 1,229 180.4 N.R. 1,200 176.2 29 4.3Florida 20,612,439 16,486 80.0 28 14,718 71.4 1,767 8.6Georgia 10,310,371 7,381 71.6 43 6,963 67.5 416 4.0Hawaii 1,428,557 1,457 102.0 5 1,369 95.8 88 6.2Idaho 1,683,140 1,151 68.4 46 949 56.4 202 12.0Illinois 12,801,539 11,232 87.7 15 10,294 80.4 938 7.3Indiana 6,633,053 4,923 74.2 37 4,520 68.1 403 6.1Iowa 3,134,693 2,390 76.2 35 1,721 54.9 669 21.3Kansas 2,907,289 2,249 77.4 33 1,881 64.7 368 12.7Kentucky 4,436,974 3,257 73.4 40 3,026 68.2 231 5.2Louisiana 4,681,666 3,466 74.0 38 3,414 72.9 52 1.1Maine 1,331,479 1,609 120.8 2 1,248 93.7 360 27.0Maryland 6,016,447 5,757 95.7 10 5,532 91.9 225 3.7Massachusetts 6,811,779 7,814 114.7 3 7,481 109.8 333 4.9Michigan 9,928,300 8,708 87.7 16 7,051 71.0 1,657 16.7Minnesota 5,519,952 5,301 96.0 9 5,024 91.0 277 5.0Mississippi 2,988,726 1,785 59.7 50 1,613 54.0 172 5.8Missouri 6,093,000 4,826 79.2 30 3,904 64.1 922 15.1Montana 1,042,520 857 82.2 27 769 73.8 88 8.4Nebraska 1,907,116 1,525 80.0 29 1,443 75.7 82 4.3Nevada 2,940,058 1,846 62.8 48 1,626 55.3 220 7.5New Hampshire 1,334,795 1,315 98.5 8 1,150 86.2 165 12.4New Jersey 8,944,469 7,690 86.0 21 6,698 74.9 992 11.1New Mexico 2,081,015 1,712 82.3 26 1,584 76.1 128 6.2New York 19,745,289 18,612 94.3 11 17,256 87.4 1,356 6.9North Carolina 10,146,788 7,813 77.0 34 7,329 72.2 484 4.8North Dakota 757,952 594 78.4 31 561 74.0 33 4.4Ohio 11,614,373 9,725 83.7 23 8,333 71.7 1,392 12.0Oklahoma 3,923,561 2,755 70.2 45 2,068 52.7 687 17.5Oregon 4,093,465 4,050 98.9 7 3,661 89.4 389 9.5Pennsylvania 12,784,227 11,202 87.6 17 8,901 69.6 2,301 18.0Puerto Rico 3,411,307 3,502 102.7 N.R. 3,501 102.6 1 0.0Rhode Island 1,056,426 1,091 103.3 4 986 93.3 105 9.9South Carolina 4,961,119 3,603 72.6 41 3,352 67.6 251 5.1South Dakota 865,454 724 83.7 24 650 75.1 74 8.6Tennessee 6,651,194 5,182 77.9 32 4,864 73.1 318 4.8Texas 27,862,596 18,225 65.4 47 16,418 58.9 1,805 6.5Utah 3,051,217 1,859 60.9 49 1,642 53.8 217 7.1Vermont 624,594 764 122.3 1 731 117.0 33 5.3Virginia 8,411,808 6,957 82.7 25 6,522 77.5 435 5.2Washington 7,288,000 6,489 89.0 14 6,014 82.5 475 6.5West Virginia 1,831,102 1,634 89.2 13 1,257 68.6 377 20.6Wisconsin 5,778,708 5,041 87.2 18 4,597 79.6 443 7.7Wyoming 585,501 431 73.6 39 379 64.7 52 8.9
Note: N.R. = not ranked.* Physicians whose school type was unavailable (n = 7) are included in the total.
Sources: July 1, 2016, population estimates are from the U.S. Census Bureau (released December 2016). Physician data are from the 2017 AMA Physician Masterfile (December 31, 2016).
Care Physicians* Care MDs Care DOs
Total Active Active Patient Active PatientPatient Care Primary Care Primary Care Primary
Association of American Medical Colleges14
2017 State Physician Workforce Data ReportSection 1: Physician Supply

5. Active General Surgeons per 100,000 Population by Degree Type, 2016
Map 1.5. Active general surgeons per 100,000 population, 2016.
Sources: July 1, 2016, population estimates are from the U.S. Census Bureau (released December 2016). Physician data include MDs and DOs and are from the 2017 AMA Physician Masterfile (December 31, 2016).
The SAS System 15:06 Tuesday, August 8, 2017 1The SAS System 15:06 Tuesday, August 8, 2017 1
Association of American Medical Colleges15
2017 State Physician Workforce Data ReportSection 1: Physician Supply

Figure 1.5. Active general surgeons per 100,000 population by degree type, 2016.
Figure 1.5. Active general surgeons per 100,000 population by degree type, 2016.
Sources: July 1, 2016, population estimates are from the U.S. Census Bureau (released December 2016). Physician data are from the 2017 AMA Physician Masterfile (December 31, 2016).Note: Physicians whose school type was unavailable (n = 3) are excluded.
0 2 4 6 8 10 12 14Utah
NevadaOklahoma
TexasIdaho
DelawareWashington
IndianaMissouri
IowaMississippi
ArkansasNebraska
ArizonaFlorida
KansasGeorgia
MinnesotaIllinois
CaliforniaSouth Carolina
New JerseyNorth Carolina
AlabamaVirginia
United StatesColoradoMichigan
WisconsinKentucky
New MexicoTennessee
OhioConnecticut
LouisianaHawaii
PennsylvaniaMontana
OregonMarylandWyoming
South DakotaAlaska
MassachusettsNew York
New HampshireWest VirginiaRhode IslandNorth Dakota
VermontMaine
MD DO
State Median = 7.7
Association of American Medical Colleges16
2017 State Physician Workforce Data ReportSection 1: Physician Supply
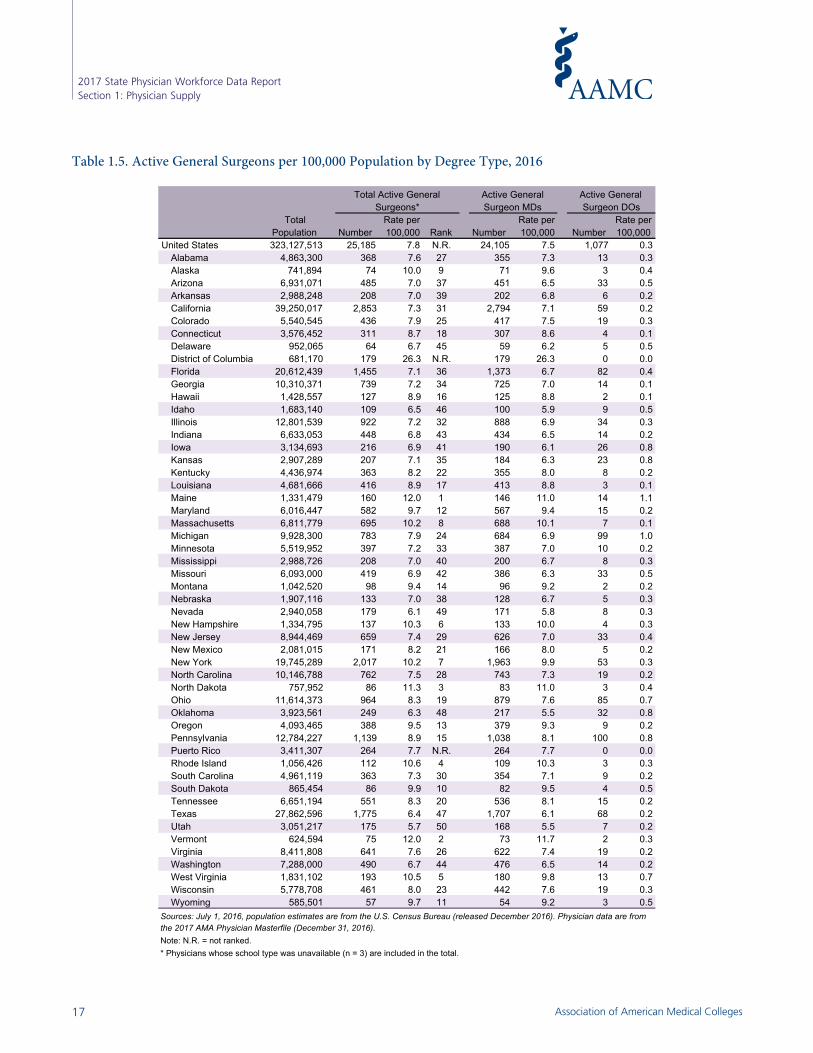
Table 1.5. Active General Surgeons per 100,000 Population by Degree Type, 2016Table 1.5. Active General Surgeons per 100,000 Population by Degree Type, 2016
Total Rate per Rate per Rate perPopulation Number 100,000 Rank Number 100,000 Number 100,000
United States 323,127,513 25,185 7.8 N.R. 24,105 7.5 1,077 0.3Alabama 4,863,300 368 7.6 27 355 7.3 13 0.3Alaska 741,894 74 10.0 9 71 9.6 3 0.4Arizona 6,931,071 485 7.0 37 451 6.5 33 0.5Arkansas 2,988,248 208 7.0 39 202 6.8 6 0.2California 39,250,017 2,853 7.3 31 2,794 7.1 59 0.2Colorado 5,540,545 436 7.9 25 417 7.5 19 0.3Connecticut 3,576,452 311 8.7 18 307 8.6 4 0.1Delaware 952,065 64 6.7 45 59 6.2 5 0.5District of Columbia 681,170 179 26.3 N.R. 179 26.3 0 0.0Florida 20,612,439 1,455 7.1 36 1,373 6.7 82 0.4Georgia 10,310,371 739 7.2 34 725 7.0 14 0.1Hawaii 1,428,557 127 8.9 16 125 8.8 2 0.1Idaho 1,683,140 109 6.5 46 100 5.9 9 0.5Illinois 12,801,539 922 7.2 32 888 6.9 34 0.3Indiana 6,633,053 448 6.8 43 434 6.5 14 0.2Iowa 3,134,693 216 6.9 41 190 6.1 26 0.8Kansas 2,907,289 207 7.1 35 184 6.3 23 0.8Kentucky 4,436,974 363 8.2 22 355 8.0 8 0.2Louisiana 4,681,666 416 8.9 17 413 8.8 3 0.1Maine 1,331,479 160 12.0 1 146 11.0 14 1.1Maryland 6,016,447 582 9.7 12 567 9.4 15 0.2Massachusetts 6,811,779 695 10.2 8 688 10.1 7 0.1Michigan 9,928,300 783 7.9 24 684 6.9 99 1.0Minnesota 5,519,952 397 7.2 33 387 7.0 10 0.2Mississippi 2,988,726 208 7.0 40 200 6.7 8 0.3Missouri 6,093,000 419 6.9 42 386 6.3 33 0.5Montana 1,042,520 98 9.4 14 96 9.2 2 0.2Nebraska 1,907,116 133 7.0 38 128 6.7 5 0.3Nevada 2,940,058 179 6.1 49 171 5.8 8 0.3New Hampshire 1,334,795 137 10.3 6 133 10.0 4 0.3New Jersey 8,944,469 659 7.4 29 626 7.0 33 0.4New Mexico 2,081,015 171 8.2 21 166 8.0 5 0.2New York 19,745,289 2,017 10.2 7 1,963 9.9 53 0.3North Carolina 10,146,788 762 7.5 28 743 7.3 19 0.2North Dakota 757,952 86 11.3 3 83 11.0 3 0.4Ohio 11,614,373 964 8.3 19 879 7.6 85 0.7Oklahoma 3,923,561 249 6.3 48 217 5.5 32 0.8Oregon 4,093,465 388 9.5 13 379 9.3 9 0.2Pennsylvania 12,784,227 1,139 8.9 15 1,038 8.1 100 0.8Puerto Rico 3,411,307 264 7.7 N.R. 264 7.7 0 0.0Rhode Island 1,056,426 112 10.6 4 109 10.3 3 0.3South Carolina 4,961,119 363 7.3 30 354 7.1 9 0.2South Dakota 865,454 86 9.9 10 82 9.5 4 0.5Tennessee 6,651,194 551 8.3 20 536 8.1 15 0.2Texas 27,862,596 1,775 6.4 47 1,707 6.1 68 0.2Utah 3,051,217 175 5.7 50 168 5.5 7 0.2Vermont 624,594 75 12.0 2 73 11.7 2 0.3Virginia 8,411,808 641 7.6 26 622 7.4 19 0.2Washington 7,288,000 490 6.7 44 476 6.5 14 0.2West Virginia 1,831,102 193 10.5 5 180 9.8 13 0.7Wisconsin 5,778,708 461 8.0 23 442 7.6 19 0.3Wyoming 585,501 57 9.7 11 54 9.2 3 0.5
Note: N.R. = not ranked.* Physicians whose school type was unavailable (n = 3) are included in the total.
Total Active General Surgeons*
Active General Surgeon MDs
Active General Surgeon DOs
Sources: July 1, 2016, population estimates are from the U.S. Census Bureau (released December 2016). Physician data are from the 2017 AMA Physician Masterfile (December 31, 2016).
Association of American Medical Colleges17
2017 State Physician Workforce Data ReportSection 1: Physician Supply
6. Active Patient Care General Surgeons per 100,000 Population by Degree Type, 2016
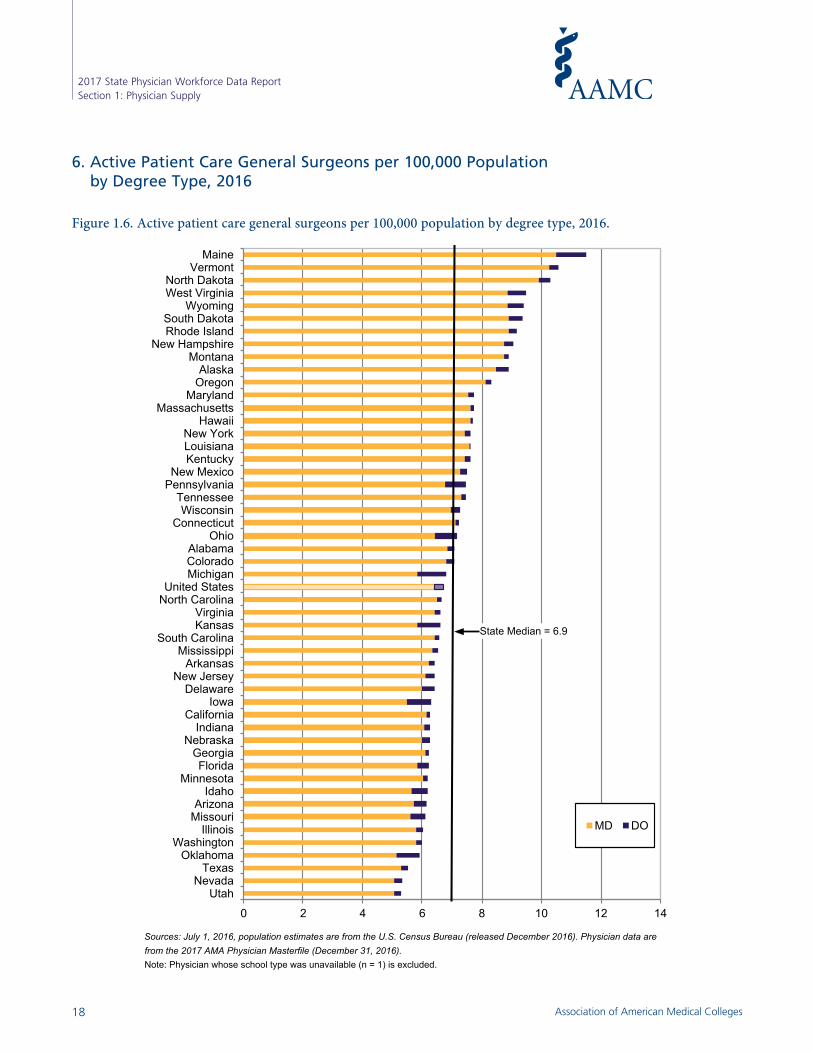
Figure 1.6. Active patient care general surgeons per 100,000 population by degree type, 2016.
Figure 1.6. Active patient care general surgeons per 100,000 population by degree type, 2016.
Sources: July 1, 2016, population estimates are from the U.S. Census Bureau (released December 2016). Physician data are
from the 2017 AMA Physician Masterfile (December 31, 2016).Note: Physician whose school type was unavailable (n = 1) is excluded.
0 2 4 6 8 10 12 14
UtahNevada
TexasOklahoma
WashingtonIllinois
MissouriArizona
IdahoMinnesota
FloridaGeorgia
NebraskaIndiana
CaliforniaIowa
DelawareNew Jersey
ArkansasMississippi
South CarolinaKansasVirginia
North CarolinaUnited States
MichiganColoradoAlabama
OhioConnecticut
WisconsinTennessee
PennsylvaniaNew Mexico
KentuckyLouisianaNew York
HawaiiMassachusetts
MarylandOregonAlaska
MontanaNew Hampshire
Rhode IslandSouth Dakota
WyomingWest VirginiaNorth Dakota
VermontMaine
MD DO
State Median = 6.9
Association of American Medical Colleges18
2017 State Physician Workforce Data ReportSection 1: Physician Supply
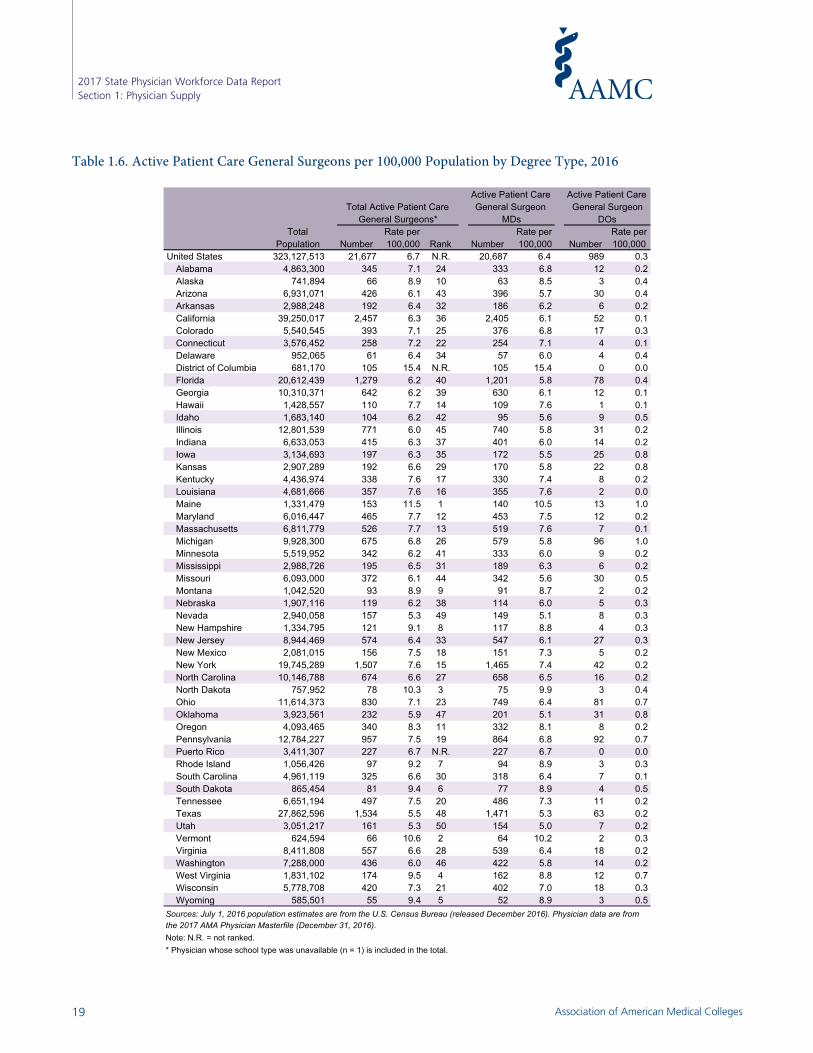
Table 1.6. Active Patient Care General Surgeons per 100,000 Population by Degree Type, 2016Table 1.6. Active Patient Care General Surgeons per 100,000 Population by Degree Type, 2016
Total Rate per Rate per Rate perPopulation Number 100,000 Rank Number 100,000 Number 100,000
United States 323,127,513 21,677 6.7 N.R. 20,687 6.4 989 0.3Alabama 4,863,300 345 7.1 24 333 6.8 12 0.2Alaska 741,894 66 8.9 10 63 8.5 3 0.4Arizona 6,931,071 426 6.1 43 396 5.7 30 0.4Arkansas 2,988,248 192 6.4 32 186 6.2 6 0.2California 39,250,017 2,457 6.3 36 2,405 6.1 52 0.1Colorado 5,540,545 393 7.1 25 376 6.8 17 0.3Connecticut 3,576,452 258 7.2 22 254 7.1 4 0.1Delaware 952,065 61 6.4 34 57 6.0 4 0.4District of Columbia 681,170 105 15.4 N.R. 105 15.4 0 0.0Florida 20,612,439 1,279 6.2 40 1,201 5.8 78 0.4Georgia 10,310,371 642 6.2 39 630 6.1 12 0.1Hawaii 1,428,557 110 7.7 14 109 7.6 1 0.1Idaho 1,683,140 104 6.2 42 95 5.6 9 0.5Illinois 12,801,539 771 6.0 45 740 5.8 31 0.2Indiana 6,633,053 415 6.3 37 401 6.0 14 0.2Iowa 3,134,693 197 6.3 35 172 5.5 25 0.8Kansas 2,907,289 192 6.6 29 170 5.8 22 0.8Kentucky 4,436,974 338 7.6 17 330 7.4 8 0.2Louisiana 4,681,666 357 7.6 16 355 7.6 2 0.0Maine 1,331,479 153 11.5 1 140 10.5 13 1.0Maryland 6,016,447 465 7.7 12 453 7.5 12 0.2Massachusetts 6,811,779 526 7.7 13 519 7.6 7 0.1Michigan 9,928,300 675 6.8 26 579 5.8 96 1.0Minnesota 5,519,952 342 6.2 41 333 6.0 9 0.2Mississippi 2,988,726 195 6.5 31 189 6.3 6 0.2Missouri 6,093,000 372 6.1 44 342 5.6 30 0.5Montana 1,042,520 93 8.9 9 91 8.7 2 0.2Nebraska 1,907,116 119 6.2 38 114 6.0 5 0.3Nevada 2,940,058 157 5.3 49 149 5.1 8 0.3New Hampshire 1,334,795 121 9.1 8 117 8.8 4 0.3New Jersey 8,944,469 574 6.4 33 547 6.1 27 0.3New Mexico 2,081,015 156 7.5 18 151 7.3 5 0.2New York 19,745,289 1,507 7.6 15 1,465 7.4 42 0.2North Carolina 10,146,788 674 6.6 27 658 6.5 16 0.2North Dakota 757,952 78 10.3 3 75 9.9 3 0.4Ohio 11,614,373 830 7.1 23 749 6.4 81 0.7Oklahoma 3,923,561 232 5.9 47 201 5.1 31 0.8Oregon 4,093,465 340 8.3 11 332 8.1 8 0.2Pennsylvania 12,784,227 957 7.5 19 864 6.8 92 0.7Puerto Rico 3,411,307 227 6.7 N.R. 227 6.7 0 0.0Rhode Island 1,056,426 97 9.2 7 94 8.9 3 0.3South Carolina 4,961,119 325 6.6 30 318 6.4 7 0.1South Dakota 865,454 81 9.4 6 77 8.9 4 0.5Tennessee 6,651,194 497 7.5 20 486 7.3 11 0.2Texas 27,862,596 1,534 5.5 48 1,471 5.3 63 0.2Utah 3,051,217 161 5.3 50 154 5.0 7 0.2Vermont 624,594 66 10.6 2 64 10.2 2 0.3Virginia 8,411,808 557 6.6 28 539 6.4 18 0.2Washington 7,288,000 436 6.0 46 422 5.8 14 0.2West Virginia 1,831,102 174 9.5 4 162 8.8 12 0.7Wisconsin 5,778,708 420 7.3 21 402 7.0 18 0.3Wyoming 585,501 55 9.4 5 52 8.9 3 0.5
Note: N.R. = not ranked.* Physician whose school type was unavailable (n = 1) is included in the total.
Total Active Patient Care General Surgeons*
Active Patient Care General Surgeon
MDs
Active Patient Care General Surgeon
DOs
Sources: July 1, 2016 population estimates are from the U.S. Census Bureau (released December 2016). Physician data are from the 2017 AMA Physician Masterfile (December 31, 2016).
Association of American Medical Colleges19
2017 State Physician Workforce Data ReportSection 1: Physician Supply
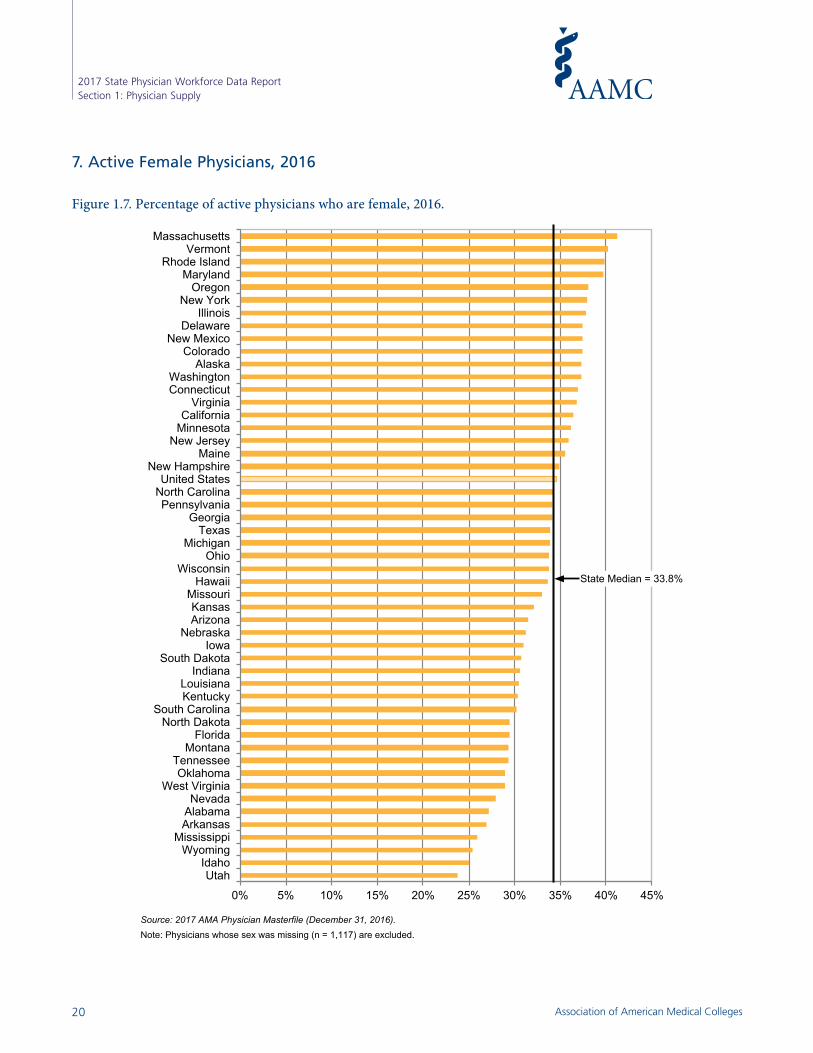
Figure 1.7. Percentage of active physicians who are female, 2016.
Source: 2017 AMA Physician Masterfile (December 31, 2016).Note: Physicians whose sex was missing (n = 1,117) are excluded.
0% 5% 10% 15% 20% 25% 30% 35% 40% 45%
UtahIdaho
WyomingMississippi
ArkansasAlabamaNevada
West VirginiaOklahoma
TennesseeMontana
FloridaNorth Dakota
South CarolinaKentuckyLouisiana
IndianaSouth Dakota
IowaNebraska
ArizonaKansas
MissouriHawaii
WisconsinOhio
MichiganTexas
GeorgiaPennsylvania
North CarolinaUnited States
New HampshireMaine
New JerseyMinnesotaCalifornia
VirginiaConnecticutWashington
AlaskaColorado
New MexicoDelaware
IllinoisNew York
OregonMaryland
Rhode IslandVermont
Massachusetts
State Median = 33.8%
7. Active Female Physicians, 2016
Figure 1.7. Percentage of active physicians who are female, 2016.
Association of American Medical Colleges20
2017 State Physician Workforce Data ReportSection 1: Physician Supply

Table 1.7. Active Female Physicians, 2016Table 1.7. Active Female Physicians, 2016
Total ActivePhysicians* Number Percent Rank
United States 876,529 303,306 34.6% N.R.Alabama 10,325 2,808 27.2% 45Alaska 1,959 730 37.3% 11Arizona 16,315 5,141 31.5% 30Arkansas 6,084 1,640 27.0% 46California 105,708 38,524 36.4% 15Colorado 15,409 5,764 37.4% 10Connecticut 12,332 4,554 36.9% 13Delaware 2,592 971 37.5% 8District of Columbia 5,895 2,760 46.8% N.R.Florida 53,610 15,757 29.4% 39Georgia 23,200 7,910 34.1% 22Hawaii 4,344 1,463 33.7% 27Idaho 3,238 812 25.1% 49Illinois 35,880 13,543 37.7% 7Indiana 15,008 4,590 30.6% 34Iowa 6,615 2,051 31.0% 32Kansas 6,375 2,047 32.1% 29Kentucky 10,149 3,083 30.4% 36Louisiana 11,731 3,568 30.4% 35Maine 4,317 1,533 35.5% 18Maryland 22,706 9,013 39.7% 4Massachusetts 30,179 12,455 41.3% 1Michigan 28,160 9,535 33.9% 24Minnesota 16,092 5,817 36.1% 16Mississippi 5,559 1,444 26.0% 47Missouri 16,256 5,372 33.0% 28Montana 2,399 705 29.4% 40Nebraska 4,423 1,380 31.2% 31Nevada 5,873 1,640 27.9% 44New Hampshire 4,111 1,436 34.9% 19New Jersey 26,321 9,444 35.9% 17New Mexico 5,019 1,878 37.4% 9New York 71,985 27,279 37.9% 6North Carolina 25,280 8,645 34.2% 20North Dakota 1,757 518 29.5% 38Ohio 33,586 11,345 33.8% 25Oklahoma 8,041 2,332 29.0% 42Oregon 12,036 4,577 38.0% 5Pennsylvania 39,815 13,596 34.1% 21Puerto Rico 9,844 3,665 37.2% N.R.Rhode Island 3,768 1,501 39.8% 3South Carolina 11,257 3,406 30.3% 37South Dakota 2,037 627 30.8% 33Tennessee 16,622 4,867 29.3% 41Texas 61,047 20,712 33.9% 23Utah 6,384 1,521 23.8% 50Vermont 2,233 897 40.2% 2Virginia 22,049 8,099 36.7% 14Washington 19,602 7,303 37.3% 12West Virginia 4,663 1,349 28.9% 43Wisconsin 15,019 5,068 33.7% 26Wyoming 1,164 296 25.4% 48
Source: 2017 AMA Physician Masterfile (December 31, 2016).Note: N.R. = not ranked.* Physicians whose sex was missing (n = 1,117) are excluded.
Active Female Physicians
Association of American Medical Colleges21
2017 State Physician Workforce Data ReportSection 1: Physician Supply

8. Active Physicians by School Type, 2016
Map 1.8. Percentage of active physicians who are international medical graduates (IMGs), 2016.
Source: Data are from the 2017 AMA Physician Masterfile (December 31, 2016).
The SAS System 15:06 Tuesday, August 8, 2017 1The SAS System 15:06 Tuesday, August 8, 2017 1The SAS System 15:06 Tuesday, August 8, 2017 1The SAS System 15:06 Tuesday, August 8, 2017 1The SAS System 15:06 Tuesday, August 8, 2017 1The SAS System 15:06 Tuesday, August 8, 2017 1The SAS System 15:06 Tuesday, August 8, 2017 1The SAS System 15:06 Tuesday, August 8, 2017 1The SAS System 15:06 Tuesday, August 8, 2017 1The SAS System 15:06 Tuesday, August 8, 2017 1The SAS System 15:06 Tuesday, August 8, 2017 1The SAS System 15:06 Tuesday, August 8, 2017 1
Association of American Medical Colleges22
2017 State Physician Workforce Data ReportSection 1: Physician Supply
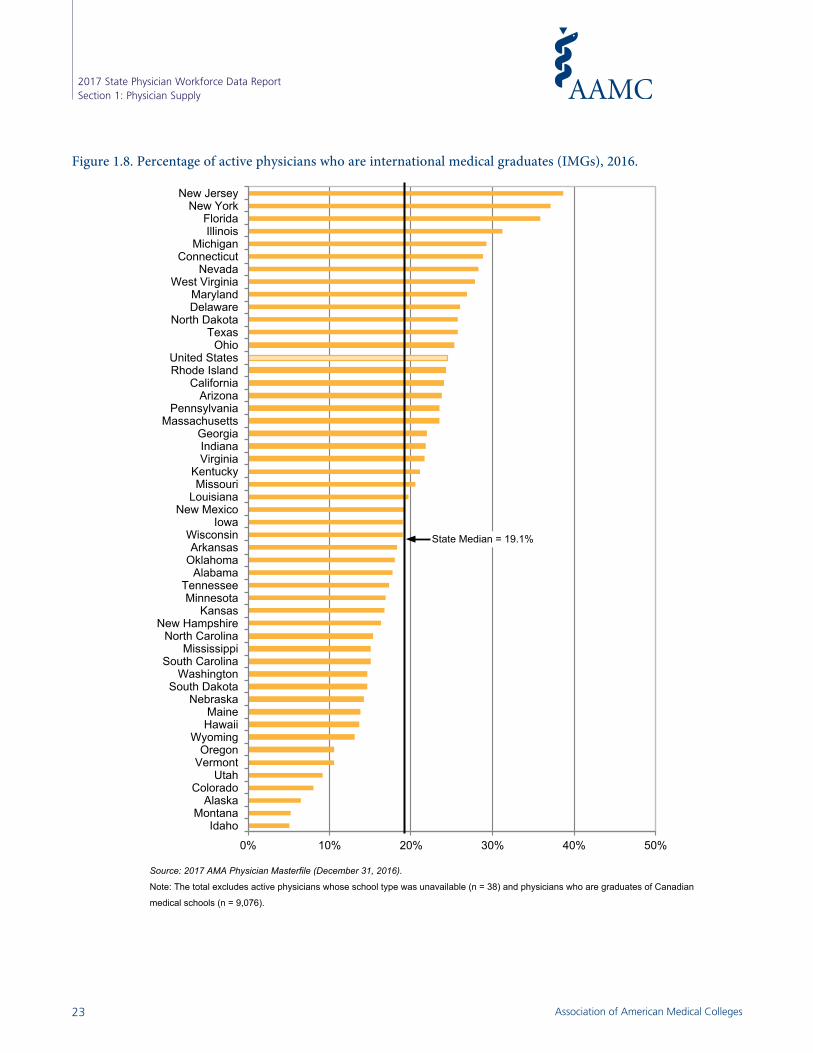
Figure 1.8. Percentage of active physicians who are international medical graduates (IMGs), 2016.
Source: 2017 AMA Physician Masterfile (December 31, 2016).
Note: The total excludes active physicians whose school type was unavailable (n = 38) and physicians who are graduates of Canadian
medical schools (n = 9,076).
0% 10% 20% 30% 40% 50%
IdahoMontana
AlaskaColorado
UtahVermontOregon
WyomingHawaiiMaine
NebraskaSouth Dakota
WashingtonSouth Carolina
MississippiNorth Carolina
New HampshireKansas
MinnesotaTennessee
AlabamaOklahomaArkansas
WisconsinIowa
New MexicoLouisiana
MissouriKentucky
VirginiaIndianaGeorgia
MassachusettsPennsylvania
ArizonaCalifornia
Rhode IslandUnited States
OhioTexas
North DakotaDelawareMaryland
West VirginiaNevada
ConnecticutMichigan
IllinoisFlorida
New YorkNew Jersey
State Median = 19.1%
Figure 1.8. Percentage of active physicians who are international medical graduates (IMGs), 2016.
Association of American Medical Colleges23
2017 State Physician Workforce Data ReportSection 1: Physician Supply
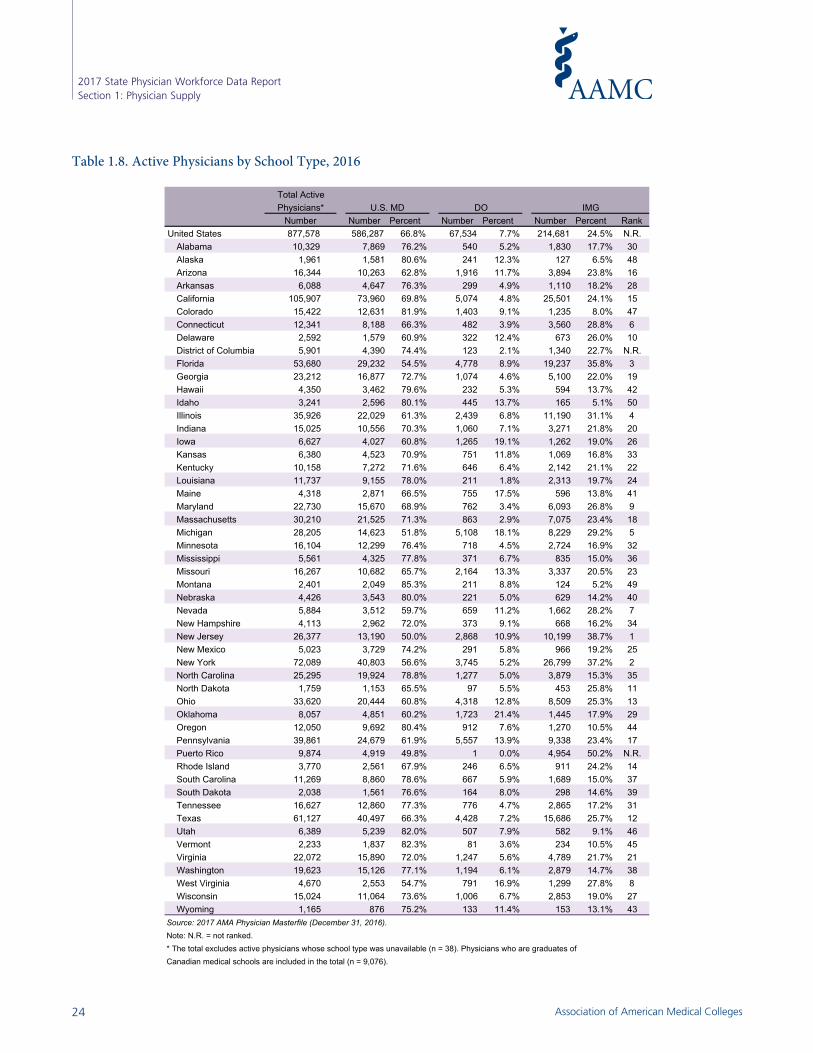
Table 1.8. Active Physicians by School Type, 2016Table 1.8. Active Physicians by School Type, 2016
Number Percent Number Percent Number Percent RankUnited States 877,578 586,287 66.8% 67,534 7.7% 214,681 24.5% N.R.
Alabama 10,329 7,869 76.2% 540 5.2% 1,830 17.7% 30Alaska 1,961 1,581 80.6% 241 12.3% 127 6.5% 48Arizona 16,344 10,263 62.8% 1,916 11.7% 3,894 23.8% 16Arkansas 6,088 4,647 76.3% 299 4.9% 1,110 18.2% 28California 105,907 73,960 69.8% 5,074 4.8% 25,501 24.1% 15Colorado 15,422 12,631 81.9% 1,403 9.1% 1,235 8.0% 47Connecticut 12,341 8,188 66.3% 482 3.9% 3,560 28.8% 6Delaware 2,592 1,579 60.9% 322 12.4% 673 26.0% 10District of Columbia 5,901 4,390 74.4% 123 2.1% 1,340 22.7% N.R.Florida 53,680 29,232 54.5% 4,778 8.9% 19,237 35.8% 3Georgia 23,212 16,877 72.7% 1,074 4.6% 5,100 22.0% 19Hawaii 4,350 3,462 79.6% 232 5.3% 594 13.7% 42Idaho 3,241 2,596 80.1% 445 13.7% 165 5.1% 50Illinois 35,926 22,029 61.3% 2,439 6.8% 11,190 31.1% 4Indiana 15,025 10,556 70.3% 1,060 7.1% 3,271 21.8% 20Iowa 6,627 4,027 60.8% 1,265 19.1% 1,262 19.0% 26Kansas 6,380 4,523 70.9% 751 11.8% 1,069 16.8% 33Kentucky 10,158 7,272 71.6% 646 6.4% 2,142 21.1% 22Louisiana 11,737 9,155 78.0% 211 1.8% 2,313 19.7% 24Maine 4,318 2,871 66.5% 755 17.5% 596 13.8% 41Maryland 22,730 15,670 68.9% 762 3.4% 6,093 26.8% 9Massachusetts 30,210 21,525 71.3% 863 2.9% 7,075 23.4% 18Michigan 28,205 14,623 51.8% 5,108 18.1% 8,229 29.2% 5Minnesota 16,104 12,299 76.4% 718 4.5% 2,724 16.9% 32Mississippi 5,561 4,325 77.8% 371 6.7% 835 15.0% 36Missouri 16,267 10,682 65.7% 2,164 13.3% 3,337 20.5% 23Montana 2,401 2,049 85.3% 211 8.8% 124 5.2% 49Nebraska 4,426 3,543 80.0% 221 5.0% 629 14.2% 40Nevada 5,884 3,512 59.7% 659 11.2% 1,662 28.2% 7New Hampshire 4,113 2,962 72.0% 373 9.1% 668 16.2% 34New Jersey 26,377 13,190 50.0% 2,868 10.9% 10,199 38.7% 1New Mexico 5,023 3,729 74.2% 291 5.8% 966 19.2% 25New York 72,089 40,803 56.6% 3,745 5.2% 26,799 37.2% 2North Carolina 25,295 19,924 78.8% 1,277 5.0% 3,879 15.3% 35North Dakota 1,759 1,153 65.5% 97 5.5% 453 25.8% 11Ohio 33,620 20,444 60.8% 4,318 12.8% 8,509 25.3% 13Oklahoma 8,057 4,851 60.2% 1,723 21.4% 1,445 17.9% 29Oregon 12,050 9,692 80.4% 912 7.6% 1,270 10.5% 44Pennsylvania 39,861 24,679 61.9% 5,557 13.9% 9,338 23.4% 17Puerto Rico 9,874 4,919 49.8% 1 0.0% 4,954 50.2% N.R.Rhode Island 3,770 2,561 67.9% 246 6.5% 911 24.2% 14South Carolina 11,269 8,860 78.6% 667 5.9% 1,689 15.0% 37South Dakota 2,038 1,561 76.6% 164 8.0% 298 14.6% 39Tennessee 16,627 12,860 77.3% 776 4.7% 2,865 17.2% 31Texas 61,127 40,497 66.3% 4,428 7.2% 15,686 25.7% 12Utah 6,389 5,239 82.0% 507 7.9% 582 9.1% 46Vermont 2,233 1,837 82.3% 81 3.6% 234 10.5% 45Virginia 22,072 15,890 72.0% 1,247 5.6% 4,789 21.7% 21Washington 19,623 15,126 77.1% 1,194 6.1% 2,879 14.7% 38West Virginia 4,670 2,553 54.7% 791 16.9% 1,299 27.8% 8Wisconsin 15,024 11,064 73.6% 1,006 6.7% 2,853 19.0% 27Wyoming 1,165 876 75.2% 133 11.4% 153 13.1% 43
Source: 2017 AMA Physician Masterfile (December 31, 2016).Note: N.R. = not ranked.* The total excludes active physicians whose school type was unavailable (n = 38). Physicians who are graduates ofCanadian medical schools are included in the total (n = 9,076).
Total ActiveU.S. MD DO IMG
NumberPhysicians*
Association of American Medical Colleges24
2017 State Physician Workforce Data ReportSection 1: Physician Supply

Figure 1.9. Percentage of active physicians who are age 60 or older, 2016.
Source: 2017 AMA Physician Masterfile (December 31, 2016).Note: Physicians whose age was missing (n = 2,191) are excluded.
0% 5% 10% 15% 20% 25% 30% 35% 40%Utah
North CarolinaMinnesota
North DakotaTexas
OhioWisconsin
South DakotaNebraska
IdahoDelaware
IowaOregon
Rhode IslandColoradoGeorgiaVirginia
South CarolinaNevadaMissouri
IllinoisMassachusetts
IndianaKentucky
KansasAlaska
MichiganArizona
United StatesWashington
New HampshireLouisiana
TennesseeArkansas
PennsylvaniaMississippi
West VirginiaAlabama
ConnecticutMaryland
OklahomaWyomingNew YorkCalifornia
FloridaVermont
MaineMontana
New JerseyHawaii
New Mexico
State Median = 30.3%
9. Active Physicians by Selected Age Groups, 2016
Figure 1.9. Percentage of active physicians who are age 60 or older, 2016.
Association of American Medical Colleges25
2017 State Physician Workforce Data ReportSection 1: Physician Supply
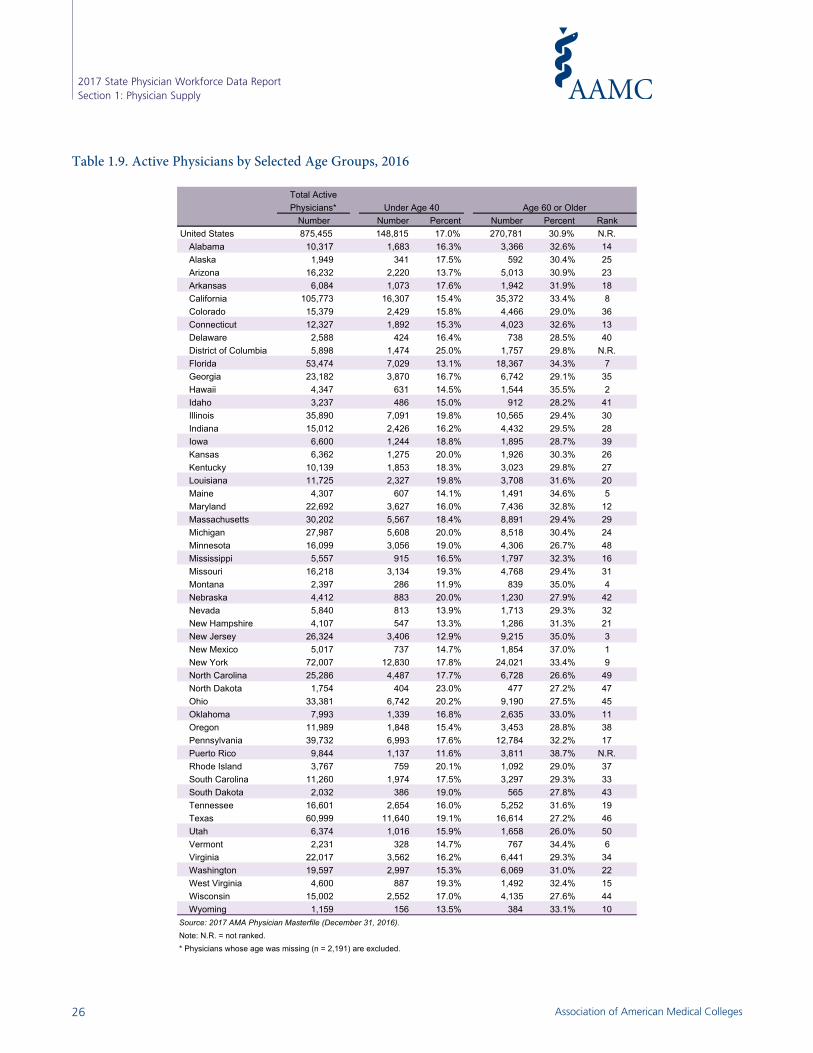
Table 1.9. Active Physicians by Selected Age Groups, 2016Table 1.9. Active Physicians by Selected Age Groups, 2016
Number Percent Number Percent RankUnited States 875,455 148,815 17.0% 270,781 30.9% N.R.
Alabama 10,317 1,683 16.3% 3,366 32.6% 14Alaska 1,949 341 17.5% 592 30.4% 25Arizona 16,232 2,220 13.7% 5,013 30.9% 23Arkansas 6,084 1,073 17.6% 1,942 31.9% 18California 105,773 16,307 15.4% 35,372 33.4% 8Colorado 15,379 2,429 15.8% 4,466 29.0% 36Connecticut 12,327 1,892 15.3% 4,023 32.6% 13Delaware 2,588 424 16.4% 738 28.5% 40District of Columbia 5,898 1,474 25.0% 1,757 29.8% N.R.Florida 53,474 7,029 13.1% 18,367 34.3% 7Georgia 23,182 3,870 16.7% 6,742 29.1% 35Hawaii 4,347 631 14.5% 1,544 35.5% 2Idaho 3,237 486 15.0% 912 28.2% 41Illinois 35,890 7,091 19.8% 10,565 29.4% 30Indiana 15,012 2,426 16.2% 4,432 29.5% 28Iowa 6,600 1,244 18.8% 1,895 28.7% 39Kansas 6,362 1,275 20.0% 1,926 30.3% 26Kentucky 10,139 1,853 18.3% 3,023 29.8% 27Louisiana 11,725 2,327 19.8% 3,708 31.6% 20Maine 4,307 607 14.1% 1,491 34.6% 5Maryland 22,692 3,627 16.0% 7,436 32.8% 12Massachusetts 30,202 5,567 18.4% 8,891 29.4% 29Michigan 27,987 5,608 20.0% 8,518 30.4% 24Minnesota 16,099 3,056 19.0% 4,306 26.7% 48Mississippi 5,557 915 16.5% 1,797 32.3% 16Missouri 16,218 3,134 19.3% 4,768 29.4% 31Montana 2,397 286 11.9% 839 35.0% 4Nebraska 4,412 883 20.0% 1,230 27.9% 42Nevada 5,840 813 13.9% 1,713 29.3% 32New Hampshire 4,107 547 13.3% 1,286 31.3% 21New Jersey 26,324 3,406 12.9% 9,215 35.0% 3New Mexico 5,017 737 14.7% 1,854 37.0% 1New York 72,007 12,830 17.8% 24,021 33.4% 9North Carolina 25,286 4,487 17.7% 6,728 26.6% 49North Dakota 1,754 404 23.0% 477 27.2% 47Ohio 33,381 6,742 20.2% 9,190 27.5% 45Oklahoma 7,993 1,339 16.8% 2,635 33.0% 11Oregon 11,989 1,848 15.4% 3,453 28.8% 38Pennsylvania 39,732 6,993 17.6% 12,784 32.2% 17Puerto Rico 9,844 1,137 11.6% 3,811 38.7% N.R.Rhode Island 3,767 759 20.1% 1,092 29.0% 37South Carolina 11,260 1,974 17.5% 3,297 29.3% 33South Dakota 2,032 386 19.0% 565 27.8% 43Tennessee 16,601 2,654 16.0% 5,252 31.6% 19Texas 60,999 11,640 19.1% 16,614 27.2% 46Utah 6,374 1,016 15.9% 1,658 26.0% 50Vermont 2,231 328 14.7% 767 34.4% 6Virginia 22,017 3,562 16.2% 6,441 29.3% 34Washington 19,597 2,997 15.3% 6,069 31.0% 22West Virginia 4,600 887 19.3% 1,492 32.4% 15Wisconsin 15,002 2,552 17.0% 4,135 27.6% 44Wyoming 1,159 156 13.5% 384 33.1% 10
Source: 2017 AMA Physician Masterfile (December 31, 2016).Note: N.R. = not ranked.* Physicians whose age was missing (n = 2,191) are excluded.
Total ActiveUnder Age 40 Age 60 or Older
NumberPhysicians*
Association of American Medical Colleges26
2017 State Physician Workforce Data ReportSection 1: Physician Supply
Section 2: Undergraduate Medical Education (UME)
Key Findings
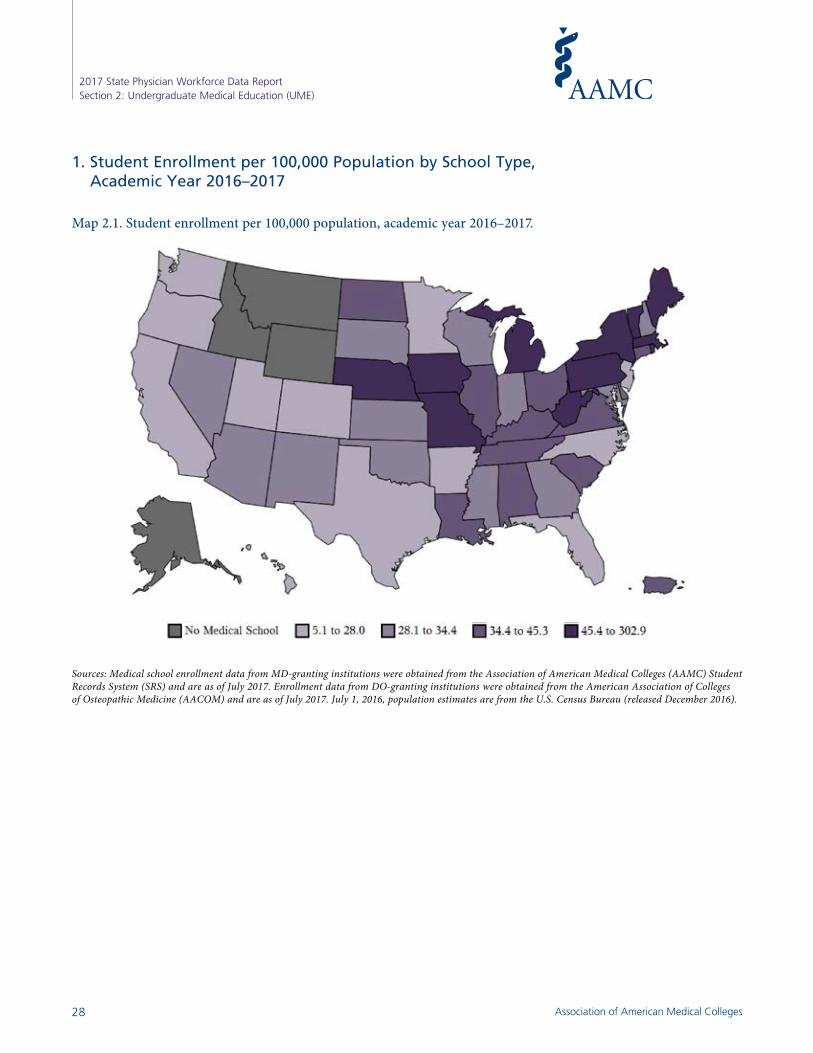
• During the 2016–2017 academic year, there were 35.4 students per 100,000 population enrolled in MD-granting and DO-granting schools in the United States. The states with the highest student-to-population ratio were concentrated in the Northeast and the Midwest (see Map 2.1, Figure 2.1, and Table 2.1)
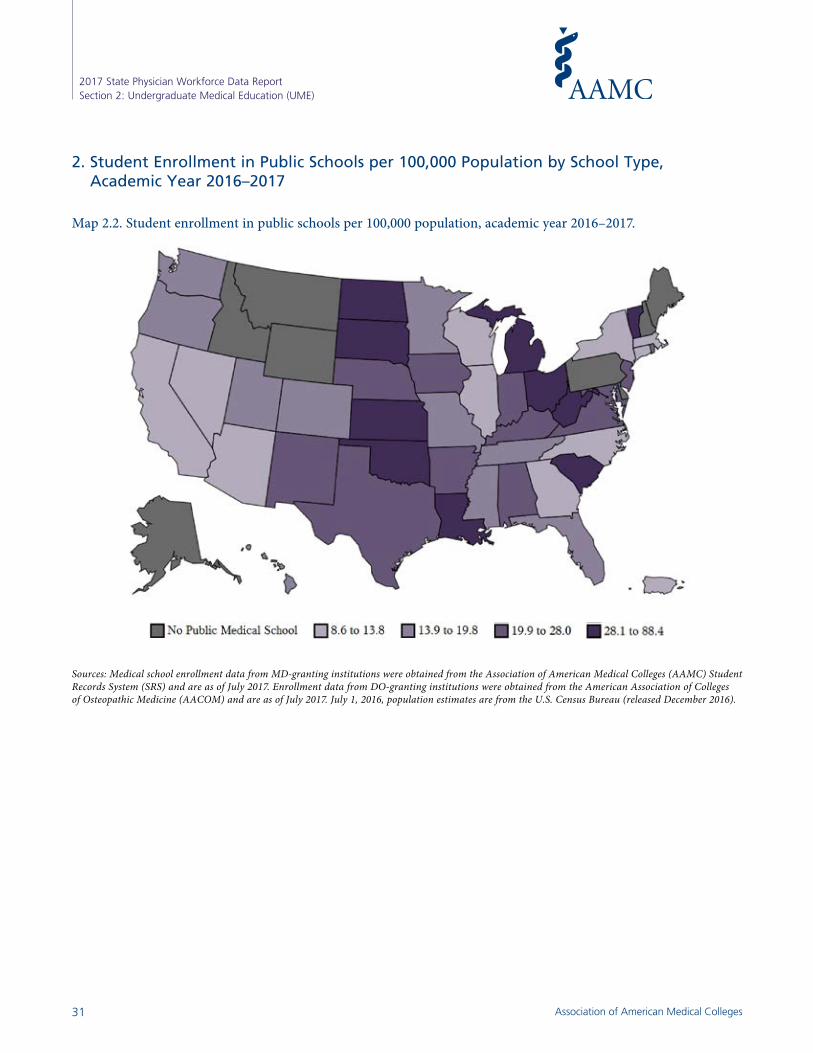
• More than half (60.9%) of the students enrolled in MD-granting institutions in the United States were enrolled in public schools, while less than one-fifth of students enrolled in DO-granting institutions (18.2%) were enrolled in public schools. The rate of students enrolled in public schools per 100,000 population varied widely across states where a public school exists, from a low of 8.6 in California to a high of 88.4 in West Virginia (see Map 2.2, Figure 2.2, and Table 2.2). In the United States overall, there were 17.9 students per 100,000 population enrolled in public schools.
• Between the 2006–2007 and 2016–2017 academic years, the total number of students enrolled in MD-granting and DO-granting schools increased by 32.8% in the United States. The growth was driven by a slightly greater increase in the total number of students enrolled in MD-granting schools (15,204) compared to DO-granting schools (13,076). This represents a 21.2% increase in MD enrollment and a 90.7% increase in DO enrollment during the 10-year period. Every state experienced an increase in enrollment, and 32 states had enrollment increases of 20% or more (see Figure 2.3 and Table 2.3).
• For the 2016–2017 academic year, 60.7% of new students in MD-granting schools matriculated in their home state. West Virginia, Puerto Rico, and South Carolina had the highest in-state matriculation rates—more than 90% of new medical students matriculated in state. In contrast, New Hampshire had the lowest in-state matriculation rate of states with a medical school—only 15.4% of the new medical students from New Hampshire matriculated in state (see Figure 2.4 and Table 2.4).
Association of American Medical Colleges27
1. Student Enrollment per 100,000 Population by School Type, Academic Year 2016–2017
Map 2.1. Student enrollment per 100,000 population, academic year 2016–2017.
Sources: Medical school enrollment data from MD-granting institutions were obtained from the Association of American Medical Colleges (AAMC) Student Records System (SRS) and are as of July 2017. Enrollment data from DO-granting institutions were obtained from the American Association of Colleges of Osteopathic Medicine (AACOM) and are as of July 2017. July 1, 2016, population estimates are from the U.S. Census Bureau (released December 2016).
The SAS System 15:06 Tuesday, August 8, 2017 1The SAS System 15:06 Tuesday, August 8, 2017 1
The SAS System 15:06 Tuesday, August 8, 2017 1The SAS System 15:06 Tuesday, August 8, 2017 1The SAS System 15:06 Tuesday, August 8, 2017 1The SAS System 15:06 Tuesday, August 8, 2017 1The SAS System 15:06 Tuesday, August 8, 2017 1The SAS System 15:06 Tuesday, August 8, 2017 1The SAS System 15:06 Tuesday, August 8, 2017 1The SAS System 15:06 Tuesday, August 8, 2017 1The SAS System 15:06 Tuesday, August 8, 2017 1The SAS System 15:06 Tuesday, August 8, 2017 1
Association of American Medical Colleges28
2017 State Physician Workforce Data ReportSection 2: Undergraduate Medical Education (UME)
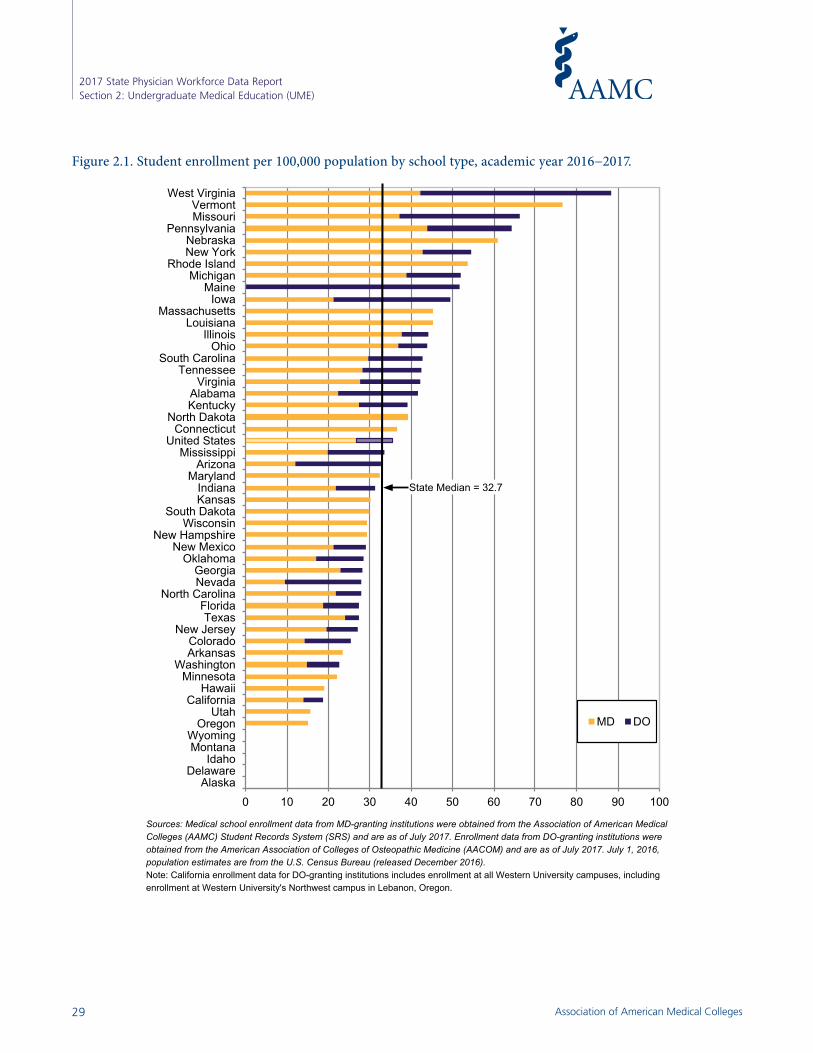
Figure 2.1. Student enrollment per 100,000 population by school type, academic year 2016−2017.
Sources: Medical school enrollment data from MD-granting institutions were obtained from the Association of American Medical Colleges (AAMC) Student Records System (SRS) and are as of July 2017. Enrollment data from DO-granting institutions were obtained from the American Association of Colleges of Osteopathic Medicine (AACOM) and are as of July 2017. July 1, 2016, population estimates are from the U.S. Census Bureau (released December 2016). Note: California enrollment data for DO-granting institutions includes enrollment at all Western University campuses, including enrollment at Western University's Northwest campus in Lebanon, Oregon.
0 10 20 30 40 50 60 70 80 90 100Alaska
DelawareIdaho
MontanaWyoming
OregonUtah
CaliforniaHawaii
MinnesotaWashington
ArkansasColorado
New JerseyTexas
FloridaNorth Carolina
NevadaGeorgia
OklahomaNew Mexico
New HampshireWisconsin
South DakotaKansasIndiana
MarylandArizona
MississippiUnited States
ConnecticutNorth Dakota
KentuckyAlabama
VirginiaTennessee
South CarolinaOhio
IllinoisLouisiana
MassachusettsIowa
MaineMichigan
Rhode IslandNew YorkNebraska
PennsylvaniaMissouriVermont
West Virginia
MD DO
State Median = 32.7
Figure 2.1. Student enrollment per 100,000 population by school type, academic year 2016−2017.
Association of American Medical Colleges29
2017 State Physician Workforce Data ReportSection 2: Undergraduate Medical Education (UME)

Table 2.1. Student Enrollment per 100,000 Population by School Type, Academic Year 2016−2017
Rate per Rate per Rate perNumber 100,000 Rank Number 100,000 Number 100,000
United States 323,127,513 114,395 35.4 N.R. 86,910 26.9 27,485 8.5Alabama 4,863,300 2,020 41.5 18 1,094 22.5 926 19.0Alaska 741,894 --- --- --- --- --- --- ---Arizona 6,931,071 2,269 32.7 23 843 12.2 1,426 20.6Arkansas 2,988,248 702 23.5 39 702 23.5 --- ---California 39,250,017 7,387 18.8 43 5,540 14.1 1,847 5Colorado 5,540,545 1,416 25.6 38 786 14.2 630 11.4Connecticut 3,576,452 1,308 36.6 21 1,308 36.6 --- ---Delaware 952,065 --- --- --- --- --- --- ---District of Columbia 681,170 2,063 302.9 N.R. 2,063 302.9 --- ---Florida 20,612,439 5,676 27.5 35 3,883 18.8 1,793 8.7Georgia 10,310,371 2,911 28.2 32 2,377 23.1 534 5.2Hawaii 1,428,557 270 18.9 42 270 18.9 --- ---Idaho 1,683,140 --- --- --- --- --- --- ---Illinois 12,801,539 5,649 44.1 13 4,842 37.8 807 6.3Indiana 6,633,053 2,069 31.2 25 1,448 21.8 621 9.4Iowa 3,134,693 1,549 49.4 10 663 21.2 886 28.3Kansas 2,907,289 876 30.1 26 876 30.1 --- ---Kentucky 4,436,974 1,737 39.1 19 1,210 27.3 527 11.9Louisiana 4,681,666 2,121 45.3 12 2,121 45.3 --- ---Maine 1,331,479 690 51.8 9 --- --- 690 51.8Maryland 6,016,447 1,950 32.4 24 1,950 32.4 --- ---Massachusetts 6,811,779 3,088 45.3 11 3,088 45.3 --- ---Michigan 9,928,300 5,169 52.1 8 3,856 38.8 1,313 13.2Minnesota 5,519,952 1,215 22.0 41 1,215 22.0 --- ---Mississippi 2,988,726 1,000 33.5 22 592 19.8 408 14Missouri 6,093,000 4,031 66.2 3 2,270 37.3 1,761 28.9Montana 1,042,520 --- --- --- --- --- --- ---Nebraska 1,907,116 1,160 60.8 5 1,160 60.8 --- ---Nevada 2,940,058 826 28.1 33 280 9.5 546 19New Hampshire 1,334,795 393 29.4 29 393 29.4 --- ---New Jersey 8,944,469 2,429 27.2 37 1,753 19.6 676 7.6New Mexico 2,081,015 603 29.0 30 441 21.2 162 7.8New York 19,745,289 10,743 54.4 6 8,427 42.7 2,316 12North Carolina 10,146,788 2,841 28.0 34 2,204 21.7 637 6.3North Dakota 757,952 296 39.1 20 296 39.1 --- ---Ohio 11,614,373 5,112 44.0 14 4,297 37.0 815 7.0Oklahoma 3,923,561 1,116 28.4 31 670 17.1 446 11Oregon 4,093,465 621 15.2 45 621 15.2 --- ---Pennsylvania 12,784,227 8,206 64.2 4 5,625 44.0 2,581 20.2Puerto Rico 3,411,307 1,394 40.9 N.R. 1,394 40.9 --- ---Rhode Island 1,056,426 568 53.8 7 568 53.8 --- ---South Carolina 4,961,119 2,117 42.7 15 1,473 29.7 644.0 13.0South Dakota 865,454 258 29.8 27 258 29.8 --- ---Tennessee 6,651,194 2,832 42.6 16 1,883 28.3 949 14.3Texas 27,862,596 7,632 27.4 36 6,716 24.1 916 3.3Utah 3,051,217 474 15.5 44 474 15.5 --- ---Vermont 624,594 478 76.5 2 478 76.5 --- ---Virginia 8,411,808 3,546 42.2 17 2,333 27.7 1,213 14.4Washington 7,288,000 1,657 22.7 40 1,089 14.9 568 7.8West Virginia 1,831,102 1,618 88.4 1 771 42.1 847 46Wisconsin 5,778,708 1,703 29.5 28 1,703 29.5 --- ---Wyoming 585,501 --- --- --- --- --- --- ---
Note: N.R. = not ranked. --- Indicates that the data are not applicable. Some states do not have an MD-granting or DO-granting institution. California enrollment data for DO-granting institutions includes enrollment at all Western University campuses, including enrollment at Western University's Northwest campus in Lebanon, Oregon.
Sources: Medical school enrollment data from MD-granting institutions were obtained from the Association of American Medical Colleges (AAMC) Student Records System (SRS) and are as of July 2017. Enrollment data from DO-granting institutions were obtained from the American Association of Colleges of Osteopathic Medicine (AACOM) and are as of July 2017. July 1, 2016, population estimates are from the U.S. Census Bureau (released December 2016).
PopulationTotal
Total Students Enrolled in Students Enrolled in Students Enrolled inMD- or DO-Granting Institutions MD-Granting Institutions DO-Granting Institutions
Table 2.1. Student Enrollment per 100,000 Population by School Type, Academic Year 2016−2017
Association of American Medical Colleges30
2017 State Physician Workforce Data ReportSection 2: Undergraduate Medical Education (UME)
Sources: Medical school enrollment data from MD-granting institutions were obtained from the Association of American Medical Colleges (AAMC) Student Records System (SRS) and are as of July 2017. Enrollment data from DO-granting institutions were obtained from the American Association of Colleges of Osteopathic Medicine (AACOM) and are as of July 2017. July 1, 2016, population estimates are from the U.S. Census Bureau (released December 2016).
2. Student Enrollment in Public Schools per 100,000 Population by School Type, Academic Year 2016–2017
Map 2.2. Student enrollment in public schools per 100,000 population, academic year 2016–2017.The SAS System 15:06 Tuesday, August 8, 2017 1The SAS System 15:06 Tuesday, August 8, 2017 1
The SAS System 15:06 Tuesday, August 8, 2017 1The SAS System 15:06 Tuesday, August 8, 2017 1The SAS System 15:06 Tuesday, August 8, 2017 1The SAS System 15:06 Tuesday, August 8, 2017 1The SAS System 15:06 Tuesday, August 8, 2017 1The SAS System 15:06 Tuesday, August 8, 2017 1The SAS System 15:06 Tuesday, August 8, 2017 1The SAS System 15:06 Tuesday, August 8, 2017 1The SAS System 15:06 Tuesday, August 8, 2017 1The SAS System 15:06 Tuesday, August 8, 2017 1
Association of American Medical Colleges31
2017 State Physician Workforce Data ReportSection 2: Undergraduate Medical Education (UME)
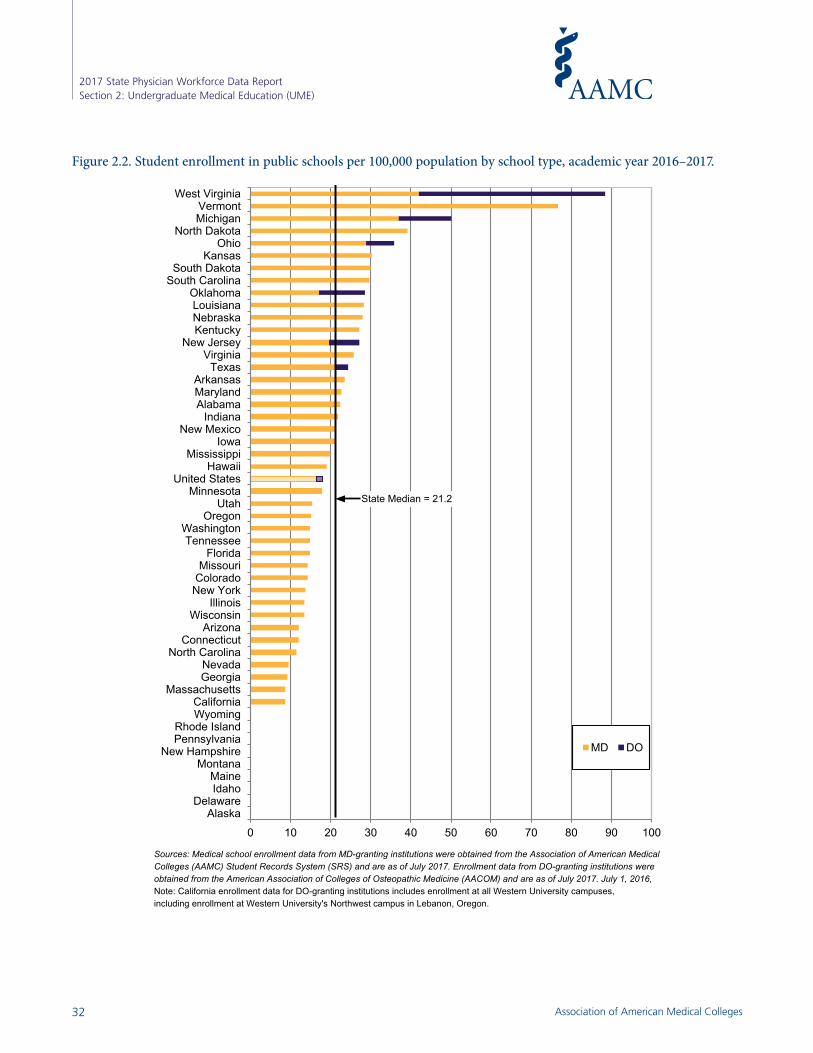
Figure 2.2. Student enrollment in public schools per 100,000 population by school type, academic year 2016−2017. Students
Note: California enrollment data for DO-granting institutions includes enrollment at all Western University campuses,including enrollment at Western University's Northwest campus in Lebanon, Oregon.
Sources: Medical school enrollment data from MD-granting institutions were obtained from the Association of American Medical Colleges (AAMC) Student Records System (SRS) and are as of July 2017. Enrollment data from DO-granting institutions were obtained from the American Association of Colleges of Osteopathic Medicine (AACOM) and are as of July 2017. July 1, 2016,
0 10 20 30 40 50 60 70 80 90 100
AlaskaDelaware
IdahoMaine
MontanaNew Hampshire
PennsylvaniaRhode Island
WyomingCalifornia
MassachusettsGeorgiaNevada
North CarolinaConnecticut
ArizonaWisconsin
IllinoisNew YorkColoradoMissouri
FloridaTennessee
WashingtonOregon
UtahMinnesota
United StatesHawaii
MississippiIowa
New MexicoIndiana
AlabamaMarylandArkansas
TexasVirginia
New JerseyKentuckyNebraskaLouisianaOklahoma
South CarolinaSouth Dakota
KansasOhio
North DakotaMichiganVermont
West Virginia
MD DO
State Median = 21.2
Figure 2.2. Student enrollment in public schools per 100,000 population by school type, academic year 2016–2017.
Association of American Medical Colleges32
2017 State Physician Workforce Data ReportSection 2: Undergraduate Medical Education (UME)

Table 2.2. Students Enrollment in Public Schools per 100,000 Population by School Type, Academic Year 2016−2017
Rate per Rate per Rate perNumber 100,000 Rank Number 100,000 Number 100,000
United States 323,127,513 57,976 17.9 N.R. 52,963 16.4 5,013 1.6Alabama 4,863,300 1,094 22.5 18 1,094 22.5 --- ---Alaska 741,894 --- --- --- --- --- --- ---Arizona 6,931,071 843 12.2 35 843 12.2 --- ---Arkansas 2,988,248 702 23.5 16 702 23.5 --- ---California 39,250,017 3,370 8.6 41 3,370 8.6 --- ---Colorado 5,540,545 786 14.2 31 786 14.2 --- ---Connecticut 3,576,452 430 12.0 36 430 12.0 --- ---Delaware 952,065 --- --- --- --- --- --- ---District of Columbia 681,170 --- --- N.R. --- --- --- ---Florida 20,612,439 3,031 14.7 29 3,031 14.7 --- ---Georgia 10,310,371 950 9.2 39 950 9.2 --- ---Hawaii 1,428,557 270 18.9 23 270 18.9 --- ---Idaho 1,683,140 --- --- --- --- --- --- ---Illinois 12,801,539 1,710 13.4 33 1,710 13.4 --- ---Indiana 6,633,053 1,448 21.8 19 1,448 21.8 --- ---Iowa 3,134,693 663 21.2 21 663 21.2 --- ---Kansas 2,907,289 876 30.1 6 876 30.1 --- ---Kentucky 4,436,974 1,210 27.3 12 1,210 27.3 --- ---Louisiana 4,681,666 1,317 28.1 10 1,317 28.1 --- ---Maine 1,331,479 --- --- --- --- --- --- ---Maryland 6,016,447 1,359 22.6 17 1,359 22.6 --- ---Massachusetts 6,811,779 598 8.8 40 598 8.8 --- ---Michigan 9,928,300 4,985 50.2 3 3,672 37.0 1,313 13.2Minnesota 5,519,952 981 17.8 24 981 17.8 --- ---Mississippi 2,988,726 592 19.8 22 592 19.8 --- ---Missouri 6,093,000 877 14.4 30 877 14.4 --- ---Montana 1,042,520 --- --- --- --- --- --- ---Nebraska 1,907,116 534 28.0 11 534 28.0 --- ---Nevada 2,940,058 280 9.5 38.0 280 9.5 --- ---New Hampshire 1,334,795 --- --- --- --- --- --- ---New Jersey 8,944,469 2,429 27.2 13 1,753 19.6 676 7.6New Mexico 2,081,015 441 21.2 20 441 21.2 --- ---New York 19,745,289 2,733 13.8 32 2,733 13.8 --- ---North Carolina 10,146,788 1,162 11.5 37 1,162 11.5 --- ---North Dakota 757,952 296 39.1 4 296 39.1 --- ---Ohio 11,614,373 4,152 35.7 5 3,337 28.7 815 7.0Oklahoma 3,923,561 1,116 28.4 9 670 17.1 446 11Oregon 4,093,465 621 15.2 26 621 15.2 --- ---Pennsylvania 12,784,227 --- --- --- --- --- --- ---Puerto Rico 3,411,307 472 13.8 N.R. 472 13.8 --- ---Rhode Island 1,056,426 --- --- --- --- --- --- ---South Carolina 4,961,119 1,473 29.7 8 1,473 29.7 --- ---South Dakota 865,454 258 29.8 7 258 29.8 --- ---Tennessee 6,651,194 980 14.7 28 980 14.7 --- ---Texas 27,862,596 6,816 24.5 15 5,900 21.2 916 3.3Utah 3,051,217 474 15.5 25 474 15.5 --- ---Vermont 624,594 478 76.5 2 478 76.5 --- ---Virginia 8,411,808 2,165 25.7 14 2,165 25.7 --- ---Washington 7,288,000 1,089 14.9 27 1,089 14.9 --- ---West Virginia 1,831,102 1,618 88.4 1 771 42.1 847 46Wisconsin 5,778,708 769 13.3 34 769 13.3 --- ---Wyoming 585,501 --- --- --- --- --- --- ---
Note: N.R. = not ranked. --- Indicates that the data are not applicable. Some states do not have a public MD-granting or DO-granting institution. California enrollment data for DO-granting institutions includes enrollment at all Western University campuses, including enrollment at Western University's Northwest campus in Lebanon, Oregon.
Students Enrolled Students Enrolled
Sources: Medical school enrollment data from MD-granting institutions were obtained from the Association of American Medical Colleges (AAMC) Student Records System (SRS) and are as of July 2017. Enrollment data from DO-granting institutions were obtained from the American Association of Colleges of Osteopathic Medicine (AACOM) and are as of July 2017. July 1, 2016, population estimates are from the U.S. Census Bureau (released December 2016).
PopulationTotal
Total Students Enrolled in Public in Public in PublicMD- or DO-Granting Institutions MD-Granting Institutions DO-Granting Institutions
Table 2.2. Student Enrollment in Public Schools per 100,000 Population by School Type, Academic Year 2016–2017
Association of American Medical Colleges33
2017 State Physician Workforce Data ReportSection 2: Undergraduate Medical Education (UME)

3. Percentage Change in Student Enrollment, 2006–2016
Figure 2.3. Percentage change in student enrollment, 2006–2016.
State Median = 24.6%
Figure 2.3 Percentage Change in Student Enrollment by School Type, 2006-2016
Sources: Medical school enrollment data from MD-granting institutions were obtained from the Association of American Medical Colleges (AAMC) Student Records System (SRS) and are as of July 2017. Enrollment data from DO-granting institutions were obtained from the American Association of Colleges of Osteopathic Medicine (AACOM) and are as of July 2017. July 1, 2016, population estimates are from the U.S. Census Bureau (Release date: December 2016).Note: California enrollment data for DO-granting institutions includes enrollment at Western University’s Northwest campus in Lebanon, Oregon.
-10% 10% 30% 50% 70% 90% 110% 130% 150%Alaska
DelawareIdaho
MontanaWyoming
IllinoisMaryland
HawaiiIowa
MinnesotaUtah
MissouriMassachusetts
VermontWisconsinOklahomaArkansasNebraskaLouisiana
New HampshireNorth Dakota
OregonCalifornia
OhioNew York
PennsylvaniaKansas
South DakotaKentucky
TexasUnited States
New JerseyWest Virginia
MaineNorth Carolina
VirginiaRhode Island
NevadaGeorgia
ConnecticutTennessee
MichiganFloridaIndiana
New MexicoWashington
AlabamaArizona
South CarolinaColorado
Mississippi
State Median =24.6%
0–
Association of American Medical Colleges34
2017 State Physician Workforce Data ReportSection 2: Undergraduate Medical Education (UME)

Table 2.3 Percentage Change in Student Enrollment by School Type, 2006-2016
2006 2016 Rank 2006 2016 2006 2016United States 86,115 114,395 32.8% N.R. 71,706 86,910 14,409 27,485
Alabama 971 2,020 108.0% 5 971 1,094 --- 926Alaska --- --- --- --- --- --- --- ---Arizona 1,076 2,269 110.9% 4 493 843 583 1,426Arkansas 605 702 16.0% 34 605 702 --- ---California 6,120 7,387 20.7% 28 4,809 5,540 1,311 1,847Colorado 611 1,416 131.8% 2 611 786 --- 630Connecticut 843 1,308 55.2% 12 843 1,308 --- ---Delaware --- --- --- --- --- --- --- ---District of Columbia 1,954 2,063 5.6% N.R. 1,954 2,063 --- ---Florida 3,325 5,676 70.7% 9 1,966 3,883 1,359 1,793Georgia 1,888 2,911 54.2% 13 1,719 2,377 169 534Hawaii 255 270 5.9% 43 255 270 --- ---Idaho --- --- --- --- --- --- --- ---Illinois 5,556 5,649 1.7% 45 4,866 4,842 690 807Indiana 1,164 2,069 77.7% 8 1,164 1,448 --- 621Iowa 1,444 1,549 7.3% 42 630 663 814 886Kansas 704 876 24.4% 24 704 876 --- ---Kentucky 1,327 1,737 30.9% 22 1,026 1,210 301 527Louisiana 1,769 2,121 19.9% 32 1,769 2,121 --- ---Maine 496 690 39.1% 18 --- --- 496 690Maryland 1,889 1,950 3.2% 44 1,889 1,950 --- ---Massachusetts 2,762 3,088 11.8% 38 2,762 3,088 --- ---Michigan 3,071 5,169 68.3% 10 2,363 3,856 708 1,313Minnesota 1,122 1,215 8.3% 41 1,122 1,215 --- ---Mississippi 427 1,000 134.2% 1 427 592 --- 408Missouri 3,646 4,031 10.6% 39 1,996 2,270 1,650 1,761Montana --- --- --- --- --- --- --- ---Nebraska 991 1,160 17.1% 33 991 1,160 --- ---Nevada 538 826 53.5% 14 218 280 320 546New Hampshire 327 393 20.2% 31 327 393 --- ---New Jersey 1,800 2,429 34.9% 20 1,402 1,753 398 676New Mexico 329 603 83.3% 7 329 441 --- 162New York 8,755 10,743 22.7% 26 7,535 8,427 1,220 2,316North Carolina 1,953 2,841 45.5% 17 1,953 2,204 --- 637North Dakota 246 296 20.3% 30 246 296 --- ---Ohio 4,192 5,112 21.9% 27 3,764 4,297 428 815Oklahoma 969 1,116 15.2% 35 617 670 352 446Oregon 516 621 20.3% 29 516 621 --- ---Pennsylvania 6,682 8,206 22.8% 25 4,736 5,625 1,946 2,581Puerto Rico 1,191 1,394 17.0% N.R. 1,191 1,394 --- ---Rhode Island 372 568 52.7% 15 372 568 --- ---South Carolina 931 2,117 127.4% 3 931 1,473 --- 644South Dakota 207 258 24.6% 23 207 258 --- ---Tennessee 1,757 2,832 61.2% 11 1,757 1,883 --- 949Texas 5,798 7,632 31.6% 21 5,243 6,716 555 916Utah 429 474 10.5% 40 429 474 --- ---Vermont 426 478 12.2% 37 426 478 --- ---Virginia 2,410 3,546 47.1% 16 1,803 2,333 607 1,213Washington 805 1,657 105.8% 6 805 1,089 --- 568West Virginia 1,165 1,618 38.9% 19 663 771 502 847Wisconsin 1,492 1,703 14.1% 36 1,492 1,703 --- ---Wyoming --- --- --- --- --- --- --- ---
N.R. = Not Ranked --- Indicates that the data are not applicable. Some states do not have a MD-granting or DO-granting institution.California enrollment data for DO-granting institutions includes enrollment at Western University's Northwest campus in Lebanon, Oregon.
Sources: Medical school enrollment data from MD-granting institutions were obtained from the Association of American Medical Colleges (AAMC) Student Records Systems (SRS) and are as of July 2017. Enrollment data from DO-granting institutions were obtained from the American Association of Colleges of Osteopathic Medicine (AACOM) and are as of July 2017. July 1, 2016, population estimates are from the U.S. Census Bureau (Release date: December 2016).
Total Students Enrolled in UME Students Enrolled inMD-Granting Institution
Students Enrolled inDO-Granting InstitutionPercent
Change
Table 2.3. Percentage Change in Student Enrollment by School Type, 2006–2016
Association of American Medical Colleges35
2017 State Physician Workforce Data ReportSection 2: Undergraduate Medical Education (UME)
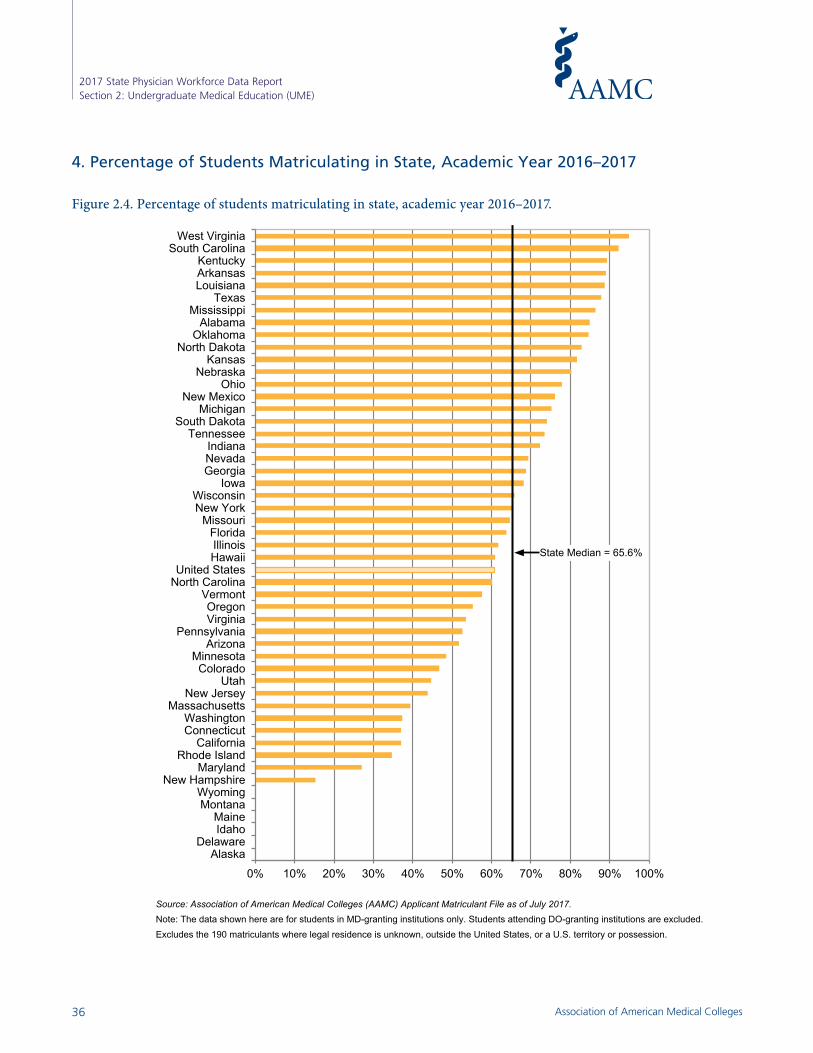
Figure 2.4. Percentage of students matriculating in-state, academic year 2016−2017.
Source: Association of American Medical Colleges (AAMC) Applicant Matriculant File as of July 2017.Note: The data shown here are for students in MD-granting institutions only. Students attending DO-granting institutions are excluded.
Excludes the 190 matriculants where legal residence is unknown, outside the United States, or a U.S. territory or possession.
0% 10% 20% 30% 40% 50% 60% 70% 80% 90% 100%Alaska
DelawareIdahoMaine
MontanaWyoming
New HampshireMaryland
Rhode IslandCalifornia
ConnecticutWashington
MassachusettsNew Jersey
UtahColorado
MinnesotaArizona
PennsylvaniaVirginiaOregon
VermontNorth CarolinaUnited States
HawaiiIllinois
FloridaMissouri
New YorkWisconsin
IowaGeorgiaNevadaIndiana
TennesseeSouth Dakota
MichiganNew Mexico
OhioNebraska
KansasNorth Dakota
OklahomaAlabama
MississippiTexas
LouisianaArkansasKentucky
South CarolinaWest Virginia
State Median = 65.6%
4. Percentage of Students Matriculating in State, Academic Year 2016–2017
Figure 2.4. Percentage of students matriculating in state, academic year 2016–2017.
Figure 2.4. Percentage of students matriculating in-state, academic year 2016−2017.
Source: Association of American Medical Colleges (AAMC) Applicant Matriculant File as of July 2017.Note: The data shown here are for students in MD-granting institutions only. Students attending DO-granting institutions are excluded.
Excludes the 190 matriculants where legal residence is unknown, outside the United States, or a U.S. territory or possession.
0% 10% 20% 30% 40% 50% 60% 70% 80% 90% 100%Alaska
DelawareIdahoMaine
MontanaWyoming
New HampshireMaryland
Rhode IslandCalifornia
ConnecticutWashington
MassachusettsNew Jersey
UtahColorado
MinnesotaArizona
PennsylvaniaVirginiaOregon
VermontNorth CarolinaUnited States
HawaiiIllinois
FloridaMissouri
New YorkWisconsin
IowaGeorgiaNevadaIndiana
TennesseeSouth Dakota
MichiganNew Mexico
OhioNebraska
KansasNorth Dakota
OklahomaAlabama
MississippiTexas
LouisianaArkansasKentucky
South CarolinaWest Virginia
State Median = 65.6%
Association of American Medical Colleges36
2017 State Physician Workforce Data ReportSection 2: Undergraduate Medical Education (UME)
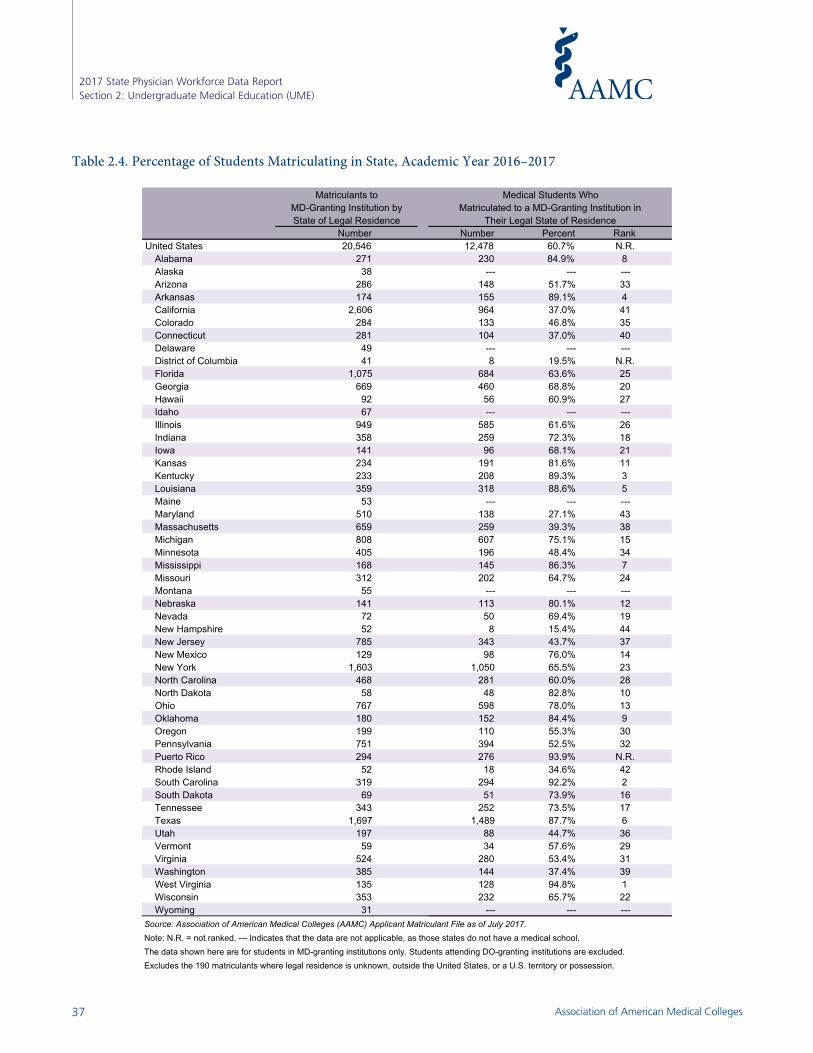
Table 2.4. Percentage of Students Matriculating In-State, Academic Year 2016−2017*
Number Number Percent RankUnited States 20,546 12,478 60.7% N.R.
Alabama 271 230 84.9% 8Alaska 38 --- --- ---Arizona 286 148 51.7% 33Arkansas 174 155 89.1% 4California 2,606 964 37.0% 41Colorado 284 133 46.8% 35Connecticut 281 104 37.0% 40Delaware 49 --- --- ---District of Columbia 41 8 19.5% N.R.Florida 1,075 684 63.6% 25Georgia 669 460 68.8% 20Hawaii 92 56 60.9% 27Idaho 67 --- --- ---Illinois 949 585 61.6% 26Indiana 358 259 72.3% 18Iowa 141 96 68.1% 21Kansas 234 191 81.6% 11Kentucky 233 208 89.3% 3Louisiana 359 318 88.6% 5Maine 53 --- --- ---Maryland 510 138 27.1% 43Massachusetts 659 259 39.3% 38Michigan 808 607 75.1% 15Minnesota 405 196 48.4% 34Mississippi 168 145 86.3% 7Missouri 312 202 64.7% 24Montana 55 --- --- ---Nebraska 141 113 80.1% 12Nevada 72 50 69.4% 19New Hampshire 52 8 15.4% 44New Jersey 785 343 43.7% 37New Mexico 129 98 76.0% 14New York 1,603 1,050 65.5% 23North Carolina 468 281 60.0% 28North Dakota 58 48 82.8% 10Ohio 767 598 78.0% 13Oklahoma 180 152 84.4% 9Oregon 199 110 55.3% 30Pennsylvania 751 394 52.5% 32Puerto Rico 294 276 93.9% N.R.Rhode Island 52 18 34.6% 42South Carolina 319 294 92.2% 2South Dakota 69 51 73.9% 16Tennessee 343 252 73.5% 17Texas 1,697 1,489 87.7% 6Utah 197 88 44.7% 36Vermont 59 34 57.6% 29Virginia 524 280 53.4% 31Washington 385 144 37.4% 39West Virginia 135 128 94.8% 1Wisconsin 353 232 65.7% 22Wyoming 31 --- --- ---
Source: Association of American Medical Colleges (AAMC) Applicant Matriculant File as of July 2017.Note: N.R. = not ranked. --- Indicates that the data are not applicable, as those states do not have a medical school. The data shown here are for students in MD-granting institutions only. Students attending DO-granting institutions are excluded. Excludes the 190 matriculants where legal residence is unknown, outside the United States, or a U.S. territory or possession.
Matriculants to Medical Students WhoMD-Granting Institution by Matriculated to a MD-Granting Institution inState of Legal Residence Their Legal State of Residence
Table 2.4. Percentage of Students Matriculating in State, Academic Year 2016–2017
Association of American Medical Colleges37
2017 State Physician Workforce Data ReportSection 2: Undergraduate Medical Education (UME)
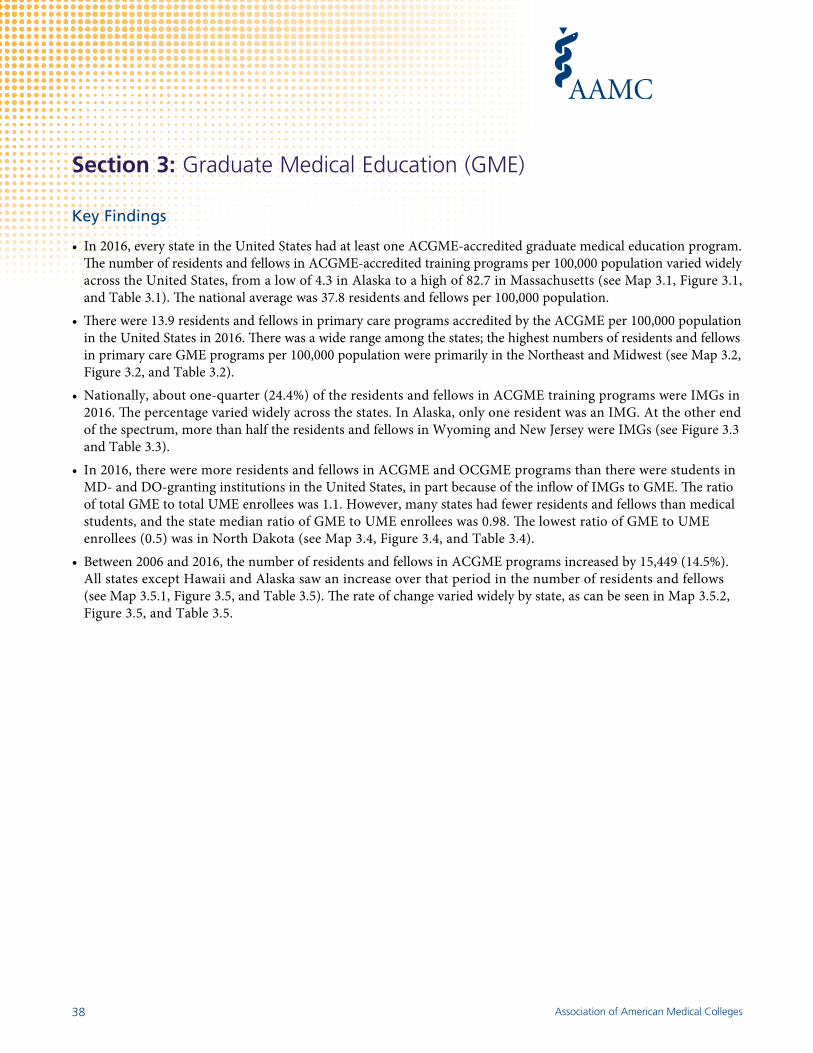
Section 3: Graduate Medical Education (GME)
Key Findings
• In 2016, every state in the United States had at least one ACGME-accredited graduate medical education program. The number of residents and fellows in ACGME-accredited training programs per 100,000 population varied widely across the United States, from a low of 4.3 in Alaska to a high of 82.7 in Massachusetts (see Map 3.1, Figure 3.1, and Table 3.1). The national average was 37.8 residents and fellows per 100,000 population.
• There were 13.9 residents and fellows in primary care programs accredited by the ACGME per 100,000 population in the United States in 2016. There was a wide range among the states; the highest numbers of residents and fellows in primary care GME programs per 100,000 population were primarily in the Northeast and Midwest (see Map 3.2, Figure 3.2, and Table 3.2).
• Nationally, about one-quarter (24.4%) of the residents and fellows in ACGME training programs were IMGs in 2016. The percentage varied widely across the states. In Alaska, only one resident was an IMG. At the other end of the spectrum, more than half the residents and fellows in Wyoming and New Jersey were IMGs (see Figure 3.3 and Table 3.3).
• In 2016, there were more residents and fellows in ACGME and OCGME programs than there were students in MD- and DO-granting institutions in the United States, in part because of the inflow of IMGs to GME. The ratio of total GME to total UME enrollees was 1.1. However, many states had fewer residents and fellows than medical students, and the state median ratio of GME to UME enrollees was 0.98. The lowest ratio of GME to UME enrollees (0.5) was in North Dakota (see Map 3.4, Figure 3.4, and Table 3.4).
• Between 2006 and 2016, the number of residents and fellows in ACGME programs increased by 15,449 (14.5%). All states except Hawaii and Alaska saw an increase over that period in the number of residents and fellows (see Map 3.5.1, Figure 3.5, and Table 3.5). The rate of change varied widely by state, as can be seen in Map 3.5.2, Figure 3.5, and Table 3.5.
Association of American Medical Colleges38
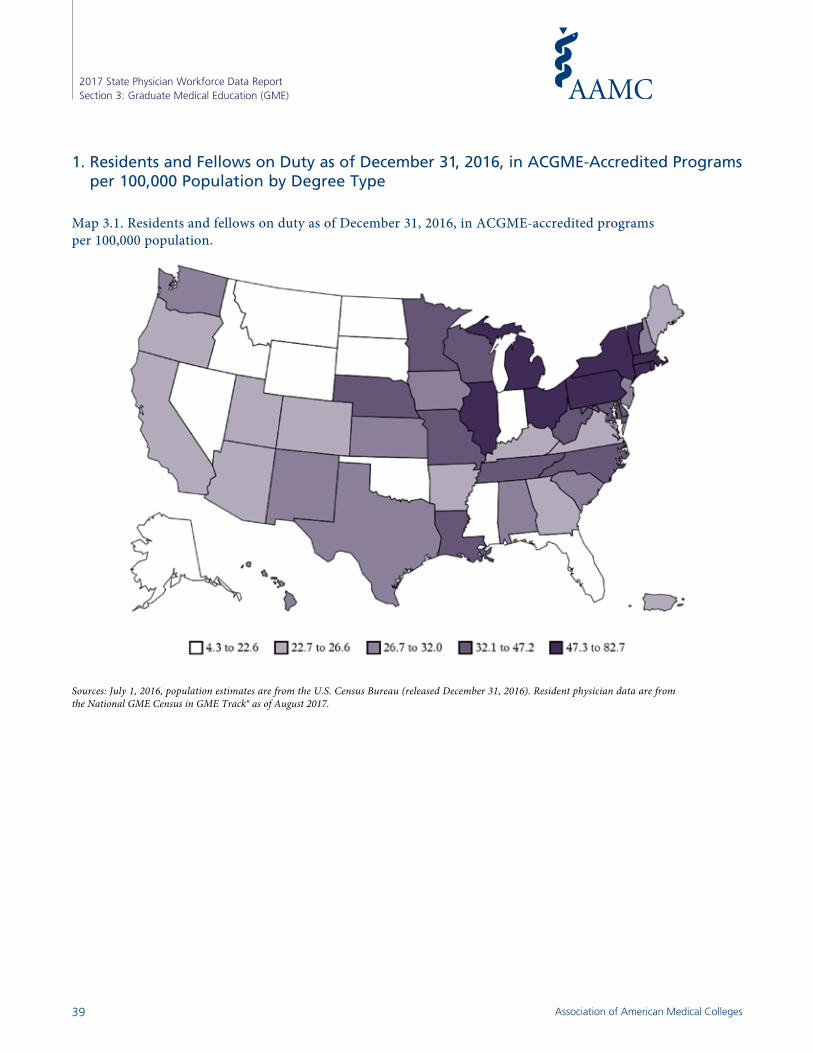
Sources: July 1, 2016, population estimates are from the U.S. Census Bureau (released December 31, 2016). Resident physician data are from the National GME Census in GME Track® as of August 2017.
Footnote for Table 16 13:47 Monday, September 18, 2017 1Footnote for Table 16 13:47 Monday, September 18, 2017 1Footnote for Table 16 13:47 Monday, September 18, 2017 1Footnote for Table 16 13:47 Monday, September 18, 2017 1Footnote for Table 16 13:47 Monday, September 18, 2017 1Footnote for Table 16 13:47 Monday, September 18, 2017 1Footnote for Table 16 13:47 Monday, September 18, 2017 1Footnote for Table 16 13:47 Monday, September 18, 2017 1Footnote for Table 16 13:47 Monday, September 18, 2017 1Footnote for Table 16 13:47 Monday, September 18, 2017 1Footnote for Table 16 13:47 Monday, September 18, 2017 1Footnote for Table 16 13:47 Monday, September 18, 2017 1
1. Residents and Fellows on Duty as of December 31, 2016, in ACGME-Accredited Programs per 100,000 Population by Degree Type
Map 3.1. Residents and fellows on duty as of December 31, 2016, in ACGME-accredited programs per 100,000 population.
Association of American Medical Colleges39
2017 State Physician Workforce Data ReportSection 3: Graduate Medical Education (GME)
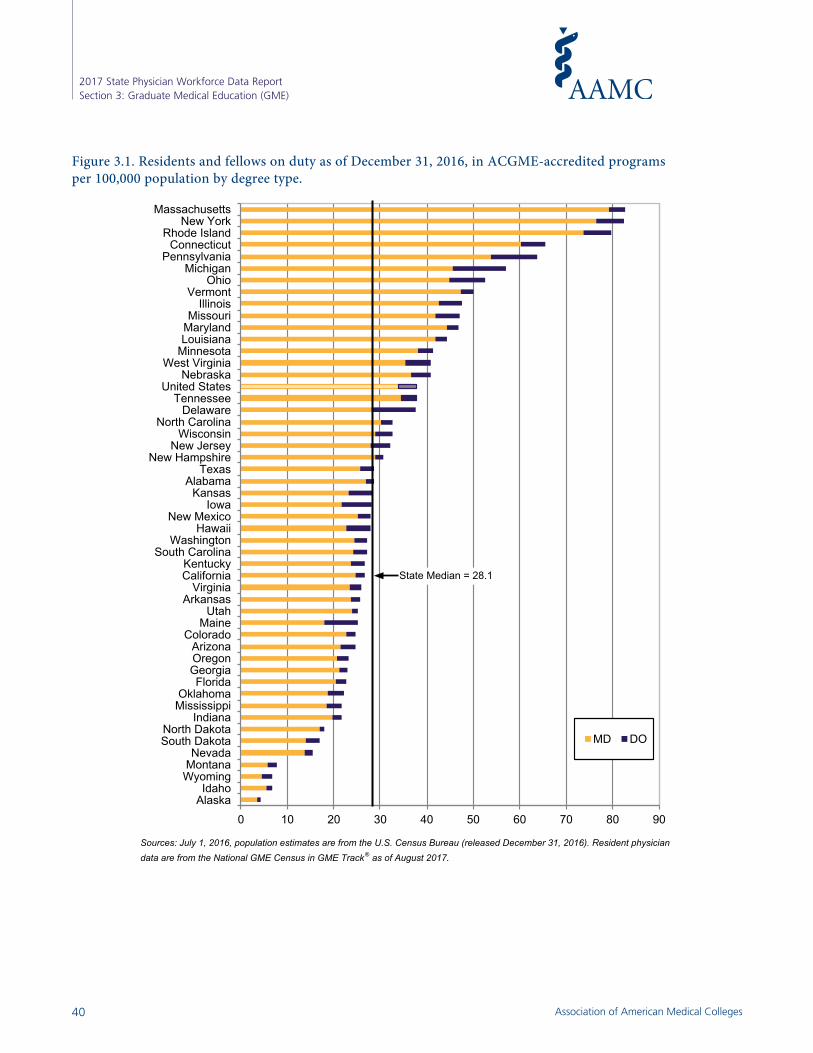
Figure 3.1. Residents and fellows on duty as of December 31, 2016, in ACGME-accredited programs per 100,000 population by degree type.
Figure 3.1. Residents and fellows on duty as of December 31, 2016, in ACGME-accredited programsper 100,000 population by degree type.
Sources: July 1, 2016, population estimates are from the U.S. Census Bureau (released December 31, 2016). Resident physiciandata are from the National GME Census in GME Track® as of August 2017.
0 10 20 30 40 50 60 70 80 90AlaskaIdaho
WyomingMontanaNevada
South DakotaNorth Dakota
IndianaMississippiOklahoma
FloridaGeorgiaOregonArizona
ColoradoMaine
UtahArkansas
VirginiaCaliforniaKentucky
South CarolinaWashington
HawaiiNew Mexico
IowaKansas
AlabamaTexas
New HampshireNew Jersey
WisconsinNorth Carolina
DelawareTennessee
United StatesNebraska
West VirginiaMinnesotaLouisianaMarylandMissouri
IllinoisVermont
OhioMichigan
PennsylvaniaConnecticut
Rhode IslandNew York
Massachusetts
MD DO
State Median = 28.1
Association of American Medical Colleges40
2017 State Physician Workforce Data ReportSection 3: Graduate Medical Education (GME)

Table 3.1. Residents and Fellows on Duty as of December 31, 2016, in ACGME-Accredited Programs per 100,000 Population by Degree Type
Rate per Rate perNumber 100,000 Rank Number 100,000 Number
United States 323,127,513 122,002 37.8 N.R. 109,540 33.9 12,462 3.9Alabama 4,863,300 1,392 28.6 23 1,304 26.8 88 1.8Alaska 741,894 32 4.3 50 25 3.4 7 0.9Arizona 6,931,071 1,704 24.6 37 1,481 21.4 223 3.2Arkansas 2,988,248 768 25.7 33 704 23.6 64 2.1California 39,250,017 10,429 26.6 31 9,707 24.7 722 1.8Colorado 5,540,545 1,370 24.7 36 1,251 22.6 119 2.1Connecticut 3,576,452 2,344 65.5 4 2,156 60.3 188 5.3Delaware 952,065 357 37.5 17 267 28.0 90 9.5District of Columbia 681,170 1,646 241.6 N.R. 1,576 231.4 70 10.3Florida 20,612,439 4,652 22.6 40 4,190 20.3 462 2.2Georgia 10,310,371 2,375 23.0 39 2,175 21.1 200 1.9Hawaii 1,428,557 400 28.0 27 323 22.6 77 5.4Idaho 1,683,140 113 6.7 49 94 5.6 19 1.1Illinois 12,801,539 6,092 47.6 9 5,445 42.5 647 5.1Indiana 6,633,053 1,433 21.6 43 1,297 19.6 136 2.1Iowa 3,134,693 882 28.1 25 683 21.8 199 6.3Kansas 2,907,289 826 28.4 24 670 23.0 156 5.4Kentucky 4,436,974 1,180 26.6 30 1,051 23.7 129 2.9Louisiana 4,681,666 2,074 44.3 12 1,963 41.9 111 2.4Maine 1,331,479 334 25.1 35 240 18.0 94 7.1Maryland 6,016,447 2,814 46.8 11 2,669 44.4 145 2.4Massachusetts 6,811,779 5,630 82.7 1 5,391 79.1 239 3.5Michigan 9,928,300 5,655 57.0 6 4,526 45.6 1,129 11.4Minnesota 5,519,952 2,285 41.4 13 2,108 38.2 177 3.2Mississippi 2,988,726 648 21.7 42 551 18.4 97 3.2Missouri 6,093,000 2,873 47.2 10 2,556 41.9 317 5.2Montana 1,042,520 80 7.7 47 61 5.9 19 1.8Nebraska 1,907,116 779 40.8 15 696 36.5 83 4.4Nevada 2,940,058 455 15.5 46 401 13.6 54 1.8New Hampshire 1,334,795 409 30.6 21 384 28.8 25 1.9New Jersey 8,944,469 2,865 32.0 20 2,489 27.8 376 4.2New Mexico 2,081,015 583 28.0 26 522 25.1 61 2.9New York 19,745,289 16,276 82.4 2 15,081 76.4 1,195 6.1North Carolina 10,146,788 3,308 32.6 18 3,067 30.2 241 2.4North Dakota 757,952 136 17.9 44 128 16.9 8 1.1Ohio 11,614,373 6,104 52.6 7 5,210 44.9 894 7.7Oklahoma 3,923,561 873 22.3 41 732 18.7 141 3.6Oregon 4,093,465 953 23.3 38 842 20.6 111 2.7Pennsylvania 12,784,227 8,139 63.7 5 6,864 53.7 1,275 10.0Puerto Rico 3,411,307 782 22.9 N.R. 782 22.9 0 0.0Rhode Island 1,056,426 841 79.6 3 778 73.6 63 6.0South Carolina 4,961,119 1,344 27.1 29 1,198 24.1 146 2.9South Dakota 865,454 147 17.0 45 120 13.9 27 3.1Tennessee 6,651,194 2,506 37.7 16 2,303 34.6 203 3.1Texas 27,862,596 7,997 28.7 22 7,154 25.7 843 3.0Utah 3,051,217 768 25.2 34 728 23.9 40 1.3Vermont 624,594 312 50.0 8 296 47.4 16 2.6Virginia 8,411,808 2,174 25.8 32 1,962 23.3 212 2.5Washington 7,288,000 1,975 27.1 28 1,774 24.3 201 2.8West Virginia 1,831,102 748 40.8 14 646 35.3 102 5.6Wisconsin 5,778,708 1,881 32.6 19 1,673 29.0 208 3.6Wyoming 585,501 40 6.8 48 27 4.6 13 2.2
Sources: July 1, 2016, population estimates are from the U.S. Census Bureau (released December 31, 2016). Resident physician data are from the National GME Census in GME Track® as of August 2017.Note: N.R. = not ranked. * Includes MDs from international medical schools.
TotalPopulation
Rate per100,000
Total Residents/Fellows inACGME Programs
MDs in ACGMEPrograms*
DOs in ACGMEPrograms
Table 3.1. Residents and Fellows on Duty as of December 31, 2016, in ACGME-Accredited Programs per 100,000 Population by Degree Type
Association of American Medical Colleges41
2017 State Physician Workforce Data ReportSection 3: Graduate Medical Education (GME)
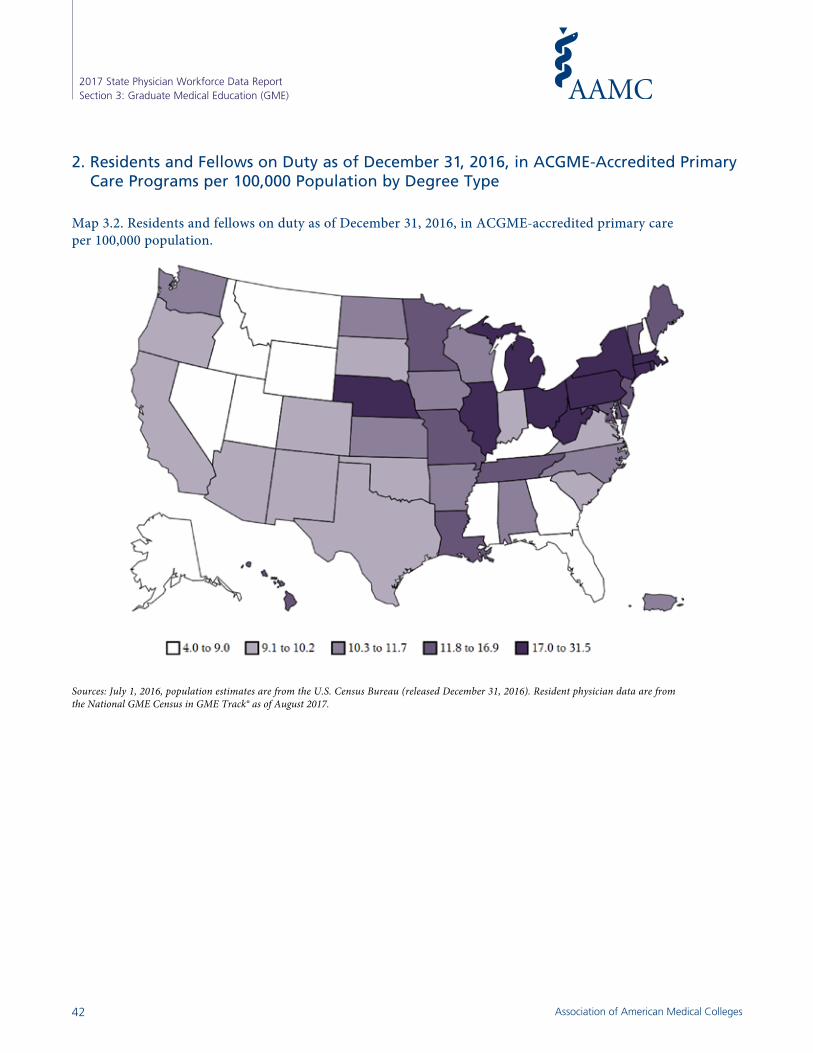
Sources: July 1, 2016, population estimates are from the U.S. Census Bureau (released December 31, 2016). Resident physician data are from the National GME Census in GME Track® as of August 2017.
Footnote for Table 16 13:47 Monday, September 18, 2017 1Footnote for Table 16 13:47 Monday, September 18, 2017 1Footnote for Table 16 13:47 Monday, September 18, 2017 1Footnote for Table 16 13:47 Monday, September 18, 2017 1Footnote for Table 16 13:47 Monday, September 18, 2017 1Footnote for Table 16 13:47 Monday, September 18, 2017 1Footnote for Table 16 13:47 Monday, September 18, 2017 1Footnote for Table 16 13:47 Monday, September 18, 2017 1Footnote for Table 16 13:47 Monday, September 18, 2017 1Footnote for Table 16 13:47 Monday, September 18, 2017 1Footnote for Table 16 13:47 Monday, September 18, 2017 1Footnote for Table 16 13:47 Monday, September 18, 2017 1
2. Residents and Fellows on Duty as of December 31, 2016, in ACGME-Accredited Primary Care Programs per 100,000 Population by Degree Type
Map 3.2. Residents and fellows on duty as of December 31, 2016, in ACGME-accredited primary care per 100,000 population.
Association of American Medical Colleges42
2017 State Physician Workforce Data ReportSection 3: Graduate Medical Education (GME)
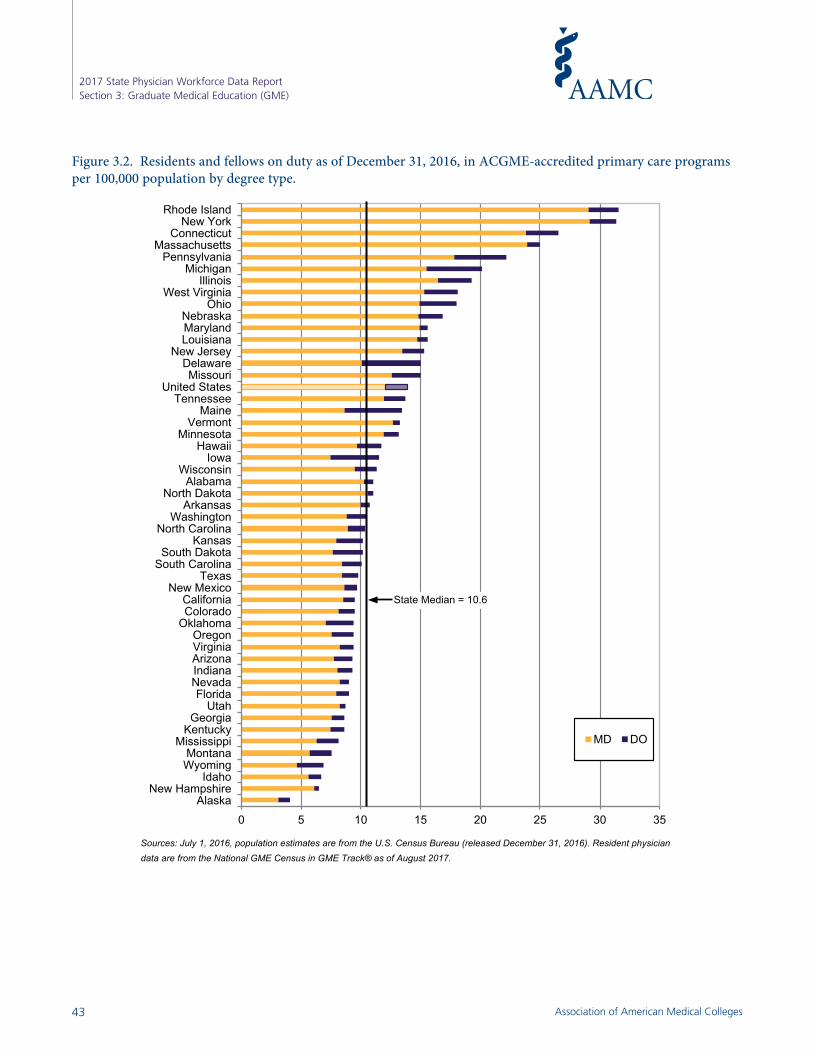
Figure 3.2. Residents and fellows on duty as of December 31, 2016, in ACGME-accredited primary care programs per 100,000 population by degree type.
Figure 3.2. Residents and fellows on duty as of December 31, 2016, in ACGME-accredited primary care programs per 100,000 population by degree type.
Sources: July 1, 2016, population estimates are from the U.S. Census Bureau (released December 31, 2016). Resident physician data are from the National GME Census in GME Track® as of August 2017.
0 5 10 15 20 25 30 35Alaska
New HampshireIdaho
WyomingMontana
MississippiKentucky
GeorgiaUtah
FloridaNevadaIndianaArizonaVirginiaOregon
OklahomaColoradoCalifornia
New MexicoTexas
South CarolinaSouth Dakota
KansasNorth Carolina
WashingtonArkansas
North DakotaAlabama
WisconsinIowa
HawaiiMinnesota
VermontMaine
TennesseeUnited States
MissouriDelaware
New JerseyLouisianaMarylandNebraska
OhioWest Virginia
IllinoisMichigan
PennsylvaniaMassachusetts
ConnecticutNew York
Rhode Island
MD DO
State Median = 10.6
Association of American Medical Colleges43
2017 State Physician Workforce Data ReportSection 3: Graduate Medical Education (GME)
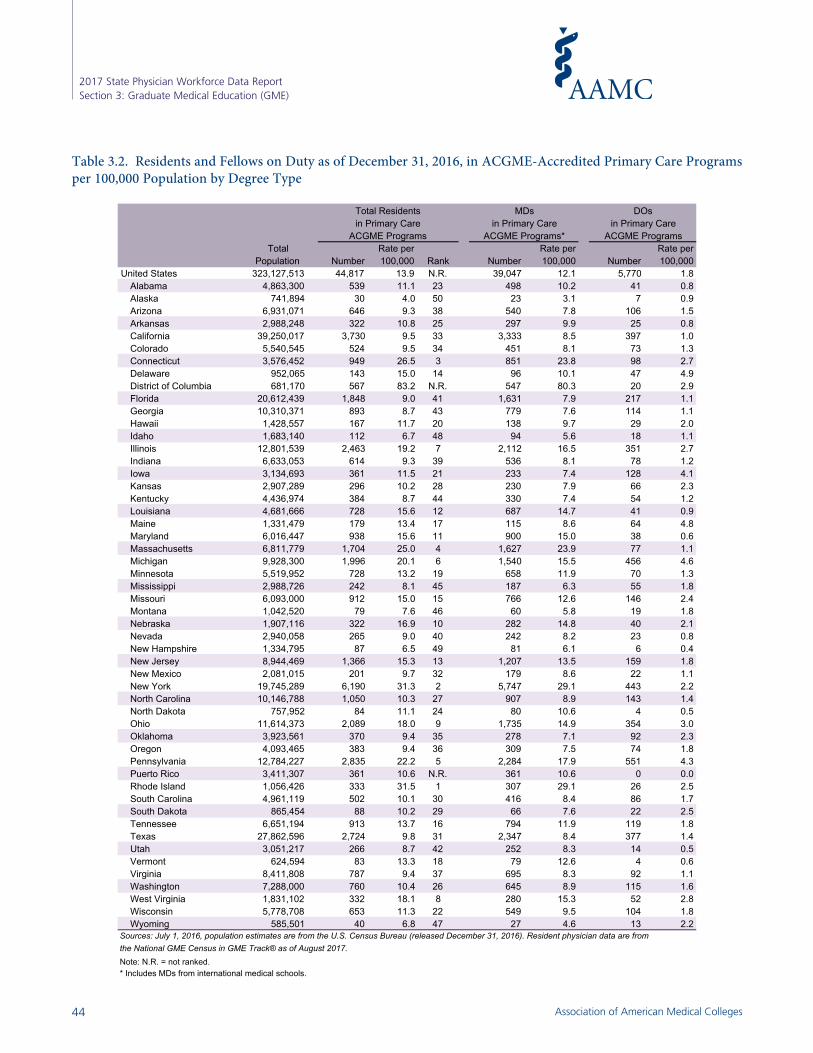
Table 3.2. Residents and Fellows on Duty as of December 31, 2016, in ACGME-Accredited Primary CarePrograms per 100,000 Population by Degree Type
Rate per Rate per Rate perNumber 100,000 Rank Number 100,000 Number 100,000
United States 323,127,513 44,817 13.9 N.R. 39,047 12.1 5,770 1.8Alabama 4,863,300 539 11.1 23 498 10.2 41 0.8Alaska 741,894 30 4.0 50 23 3.1 7 0.9Arizona 6,931,071 646 9.3 38 540 7.8 106 1.5Arkansas 2,988,248 322 10.8 25 297 9.9 25 0.8California 39,250,017 3,730 9.5 33 3,333 8.5 397 1.0Colorado 5,540,545 524 9.5 34 451 8.1 73 1.3Connecticut 3,576,452 949 26.5 3 851 23.8 98 2.7Delaware 952,065 143 15.0 14 96 10.1 47 4.9District of Columbia 681,170 567 83.2 N.R. 547 80.3 20 2.9Florida 20,612,439 1,848 9.0 41 1,631 7.9 217 1.1Georgia 10,310,371 893 8.7 43 779 7.6 114 1.1Hawaii 1,428,557 167 11.7 20 138 9.7 29 2.0Idaho 1,683,140 112 6.7 48 94 5.6 18 1.1Illinois 12,801,539 2,463 19.2 7 2,112 16.5 351 2.7Indiana 6,633,053 614 9.3 39 536 8.1 78 1.2Iowa 3,134,693 361 11.5 21 233 7.4 128 4.1Kansas 2,907,289 296 10.2 28 230 7.9 66 2.3Kentucky 4,436,974 384 8.7 44 330 7.4 54 1.2Louisiana 4,681,666 728 15.6 12 687 14.7 41 0.9Maine 1,331,479 179 13.4 17 115 8.6 64 4.8Maryland 6,016,447 938 15.6 11 900 15.0 38 0.6Massachusetts 6,811,779 1,704 25.0 4 1,627 23.9 77 1.1Michigan 9,928,300 1,996 20.1 6 1,540 15.5 456 4.6Minnesota 5,519,952 728 13.2 19 658 11.9 70 1.3Mississippi 2,988,726 242 8.1 45 187 6.3 55 1.8Missouri 6,093,000 912 15.0 15 766 12.6 146 2.4Montana 1,042,520 79 7.6 46 60 5.8 19 1.8Nebraska 1,907,116 322 16.9 10 282 14.8 40 2.1Nevada 2,940,058 265 9.0 40 242 8.2 23 0.8New Hampshire 1,334,795 87 6.5 49 81 6.1 6 0.4New Jersey 8,944,469 1,366 15.3 13 1,207 13.5 159 1.8New Mexico 2,081,015 201 9.7 32 179 8.6 22 1.1New York 19,745,289 6,190 31.3 2 5,747 29.1 443 2.2North Carolina 10,146,788 1,050 10.3 27 907 8.9 143 1.4North Dakota 757,952 84 11.1 24 80 10.6 4 0.5Ohio 11,614,373 2,089 18.0 9 1,735 14.9 354 3.0Oklahoma 3,923,561 370 9.4 35 278 7.1 92 2.3Oregon 4,093,465 383 9.4 36 309 7.5 74 1.8Pennsylvania 12,784,227 2,835 22.2 5 2,284 17.9 551 4.3Puerto Rico 3,411,307 361 10.6 N.R. 361 10.6 0 0.0Rhode Island 1,056,426 333 31.5 1 307 29.1 26 2.5South Carolina 4,961,119 502 10.1 30 416 8.4 86 1.7South Dakota 865,454 88 10.2 29 66 7.6 22 2.5Tennessee 6,651,194 913 13.7 16 794 11.9 119 1.8Texas 27,862,596 2,724 9.8 31 2,347 8.4 377 1.4Utah 3,051,217 266 8.7 42 252 8.3 14 0.5Vermont 624,594 83 13.3 18 79 12.6 4 0.6Virginia 8,411,808 787 9.4 37 695 8.3 92 1.1Washington 7,288,000 760 10.4 26 645 8.9 115 1.6West Virginia 1,831,102 332 18.1 8 280 15.3 52 2.8Wisconsin 5,778,708 653 11.3 22 549 9.5 104 1.8Wyoming 585,501 40 6.8 47 27 4.6 13 2.2
Sources: July 1, 2016, population estimates are from the U.S. Census Bureau (released December 31, 2016). Resident physician data are from the National GME Census in GME Track® as of August 2017.Note: N.R. = not ranked. * Includes MDs from international medical schools.
Total Residents MDs DOsin Primary Care in Primary Care in Primary Care
TotalPopulation
ACGME Programs ACGME Programs* ACGME Programs
Table 3.2. Residents and Fellows on Duty as of December 31, 2016, in ACGME-Accredited Primary Care Programs per 100,000 Population by Degree Type
Association of American Medical Colleges44
2017 State Physician Workforce Data ReportSection 3: Graduate Medical Education (GME)

Figure 3.3. Percentage of residents and fellows on duty as of December 31, 2016, in ACGME-accredited programs who are international medical graduates (IMGs).
Source: National GME Census in GME Track ® as of August 2017.
0% 10% 20% 30% 40% 50% 60%Alaska
ColoradoWashington
OregonUtah
CaliforniaNorth CarolinaSouth Carolina
MaineIndiana
VermontNew Hampshire
DelawareIdaho
WisconsinVirginiaHawaii
Rhode IslandMississippiMinnesota
TennesseeMassachusetts
KentuckyIowa
TexasKansas
New MexicoMissouriAlabama
ArizonaGeorgia
PennsylvaniaMaryland
United StatesOhio
IllinoisNebraskaLouisianaOklahoma
South DakotaFlorida
MontanaMichiganArkansas
West VirginiaConnecticut
New YorkNorth Dakota
NevadaNew Jersey
Wyoming
State Median = 20.5%
3. Residents and Fellows on Duty as of December 31, 2016, in ACGME-Accredited Programs by School Type
Figure 3.3. Percentage of residents and fellows on duty as of December 31, 2016, in ACGME-accredited programs who are international medical graduates (IMGs).
Association of American Medical Colleges45
2017 State Physician Workforce Data ReportSection 3: Graduate Medical Education (GME)
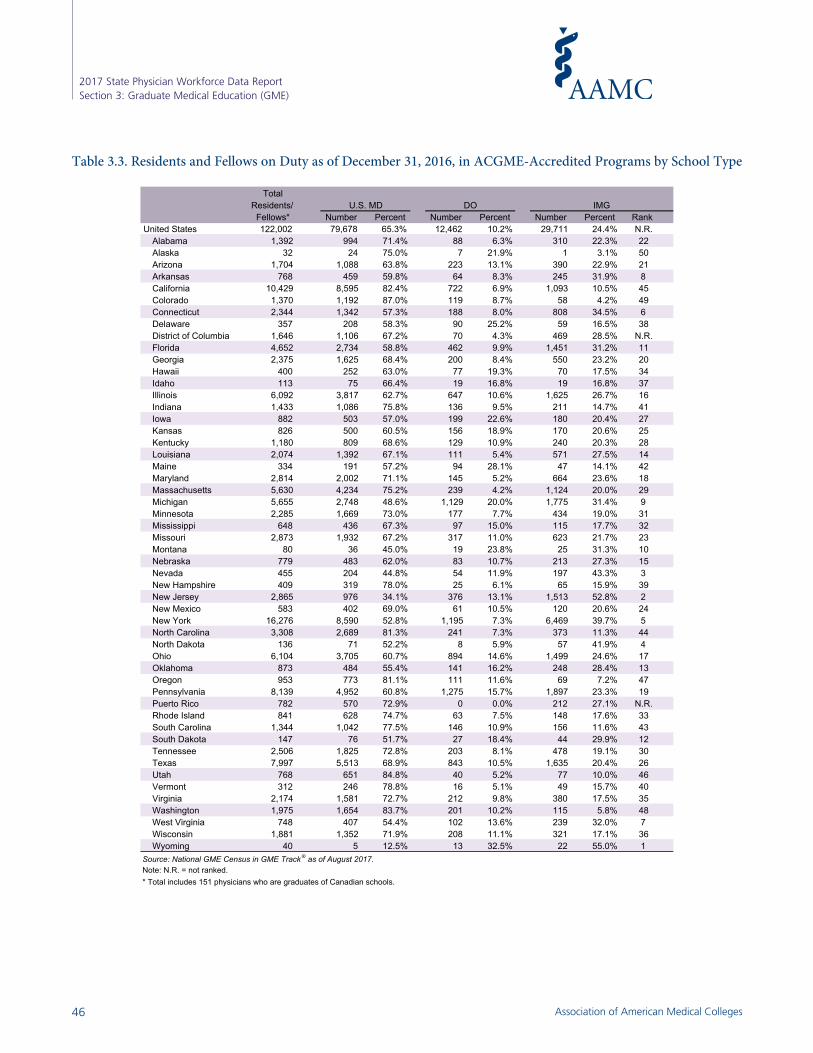
Table 3.3. Residents and Fellows on Duty as of December 31, 2016, in ACGME-Accredited Programs by School TypeTable 3.3. Residents and Fellows on Duty as of December 31, 2016, in ACGME-Accredited Programs by School Type
Number Percent Number Percent Number PercentUnited States 122,002 79,678 65.3% 12,462 10.2% 29,711 24.4% N.R.
Alabama 1,392 994 71.4% 88 6.3% 310 22.3% 22Alaska 32 24 75.0% 7 21.9% 1 3.1% 50Arizona 1,704 1,088 63.8% 223 13.1% 390 22.9% 21Arkansas 768 459 59.8% 64 8.3% 245 31.9% 8California 10,429 8,595 82.4% 722 6.9% 1,093 10.5% 45Colorado 1,370 1,192 87.0% 119 8.7% 58 4.2% 49Connecticut 2,344 1,342 57.3% 188 8.0% 808 34.5% 6Delaware 357 208 58.3% 90 25.2% 59 16.5% 38District of Columbia 1,646 1,106 67.2% 70 4.3% 469 28.5% N.R.Florida 4,652 2,734 58.8% 462 9.9% 1,451 31.2% 11Georgia 2,375 1,625 68.4% 200 8.4% 550 23.2% 20Hawaii 400 252 63.0% 77 19.3% 70 17.5% 34Idaho 113 75 66.4% 19 16.8% 19 16.8% 37Illinois 6,092 3,817 62.7% 647 10.6% 1,625 26.7% 16Indiana 1,433 1,086 75.8% 136 9.5% 211 14.7% 41Iowa 882 503 57.0% 199 22.6% 180 20.4% 27Kansas 826 500 60.5% 156 18.9% 170 20.6% 25Kentucky 1,180 809 68.6% 129 10.9% 240 20.3% 28Louisiana 2,074 1,392 67.1% 111 5.4% 571 27.5% 14Maine 334 191 57.2% 94 28.1% 47 14.1% 42Maryland 2,814 2,002 71.1% 145 5.2% 664 23.6% 18Massachusetts 5,630 4,234 75.2% 239 4.2% 1,124 20.0% 29Michigan 5,655 2,748 48.6% 1,129 20.0% 1,775 31.4% 9Minnesota 2,285 1,669 73.0% 177 7.7% 434 19.0% 31Mississippi 648 436 67.3% 97 15.0% 115 17.7% 32Missouri 2,873 1,932 67.2% 317 11.0% 623 21.7% 23Montana 80 36 45.0% 19 23.8% 25 31.3% 10Nebraska 779 483 62.0% 83 10.7% 213 27.3% 15Nevada 455 204 44.8% 54 11.9% 197 43.3% 3New Hampshire 409 319 78.0% 25 6.1% 65 15.9% 39New Jersey 2,865 976 34.1% 376 13.1% 1,513 52.8% 2New Mexico 583 402 69.0% 61 10.5% 120 20.6% 24New York 16,276 8,590 52.8% 1,195 7.3% 6,469 39.7% 5North Carolina 3,308 2,689 81.3% 241 7.3% 373 11.3% 44North Dakota 136 71 52.2% 8 5.9% 57 41.9% 4Ohio 6,104 3,705 60.7% 894 14.6% 1,499 24.6% 17Oklahoma 873 484 55.4% 141 16.2% 248 28.4% 13Oregon 953 773 81.1% 111 11.6% 69 7.2% 47Pennsylvania 8,139 4,952 60.8% 1,275 15.7% 1,897 23.3% 19Puerto Rico 782 570 72.9% 0 0.0% 212 27.1% N.R.Rhode Island 841 628 74.7% 63 7.5% 148 17.6% 33South Carolina 1,344 1,042 77.5% 146 10.9% 156 11.6% 43South Dakota 147 76 51.7% 27 18.4% 44 29.9% 12Tennessee 2,506 1,825 72.8% 203 8.1% 478 19.1% 30Texas 7,997 5,513 68.9% 843 10.5% 1,635 20.4% 26Utah 768 651 84.8% 40 5.2% 77 10.0% 46Vermont 312 246 78.8% 16 5.1% 49 15.7% 40Virginia 2,174 1,581 72.7% 212 9.8% 380 17.5% 35Washington 1,975 1,654 83.7% 201 10.2% 115 5.8% 48West Virginia 748 407 54.4% 102 13.6% 239 32.0% 7Wisconsin 1,881 1,352 71.9% 208 11.1% 321 17.1% 36Wyoming 40 5 12.5% 13 32.5% 22 55.0% 1
Note: N.R. = not ranked. * Total includes 151 physicians who are graduates of Canadian schools.
Source: National GME Census in GME Track ® as of August 2017.
Fellows*Residents/
TotalU.S. MD DO IMG
Rank
Association of American Medical Colleges46
2017 State Physician Workforce Data ReportSection 3: Graduate Medical Education (GME)
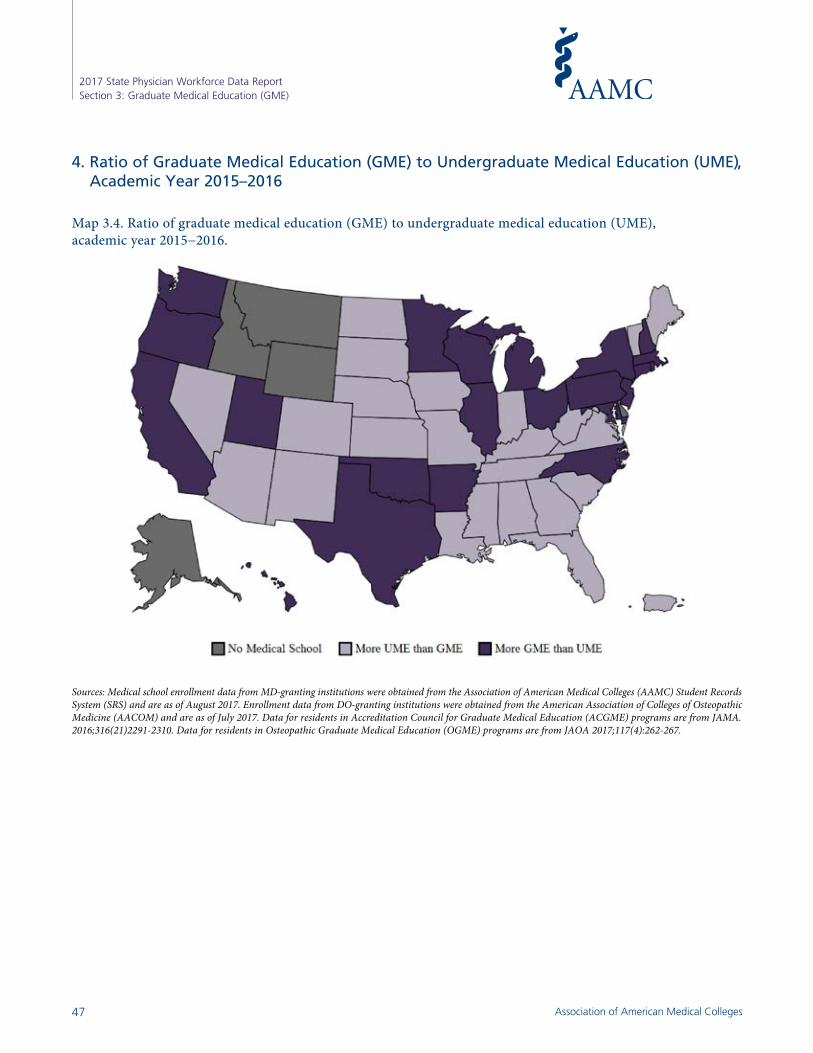
Sources: Medical school enrollment data from MD-granting institutions were obtained from the Association of American Medical Colleges (AAMC) Student Records System (SRS) and are as of August 2017. Enrollment data from DO-granting institutions were obtained from the American Association of Colleges of Osteopathic Medicine (AACOM) and are as of July 2017. Data for residents in Accreditation Council for Graduate Medical Education (ACGME) programs are from JAMA. 2016;316(21)2291-2310. Data for residents in Osteopathic Graduate Medical Education (OGME) programs are from JAOA 2017;117(4):262-267.
The SAS System 15:05 Friday, September 15, 2017 1The SAS System 15:05 Friday, September 15, 2017 1The SAS System 15:05 Friday, September 15, 2017 1The SAS System 15:05 Friday, September 15, 2017 1The SAS System 15:05 Friday, September 15, 2017 1The SAS System 15:05 Friday, September 15, 2017 1The SAS System 15:05 Friday, September 15, 2017 1The SAS System 15:05 Friday, September 15, 2017 1
4. Ratio of Graduate Medical Education (GME) to Undergraduate Medical Education (UME), Academic Year 2015–2016
Map 3.4. Ratio of graduate medical education (GME) to undergraduate medical education (UME), academic year 2015−2016.
Association of American Medical Colleges47
2017 State Physician Workforce Data ReportSection 3: Graduate Medical Education (GME)
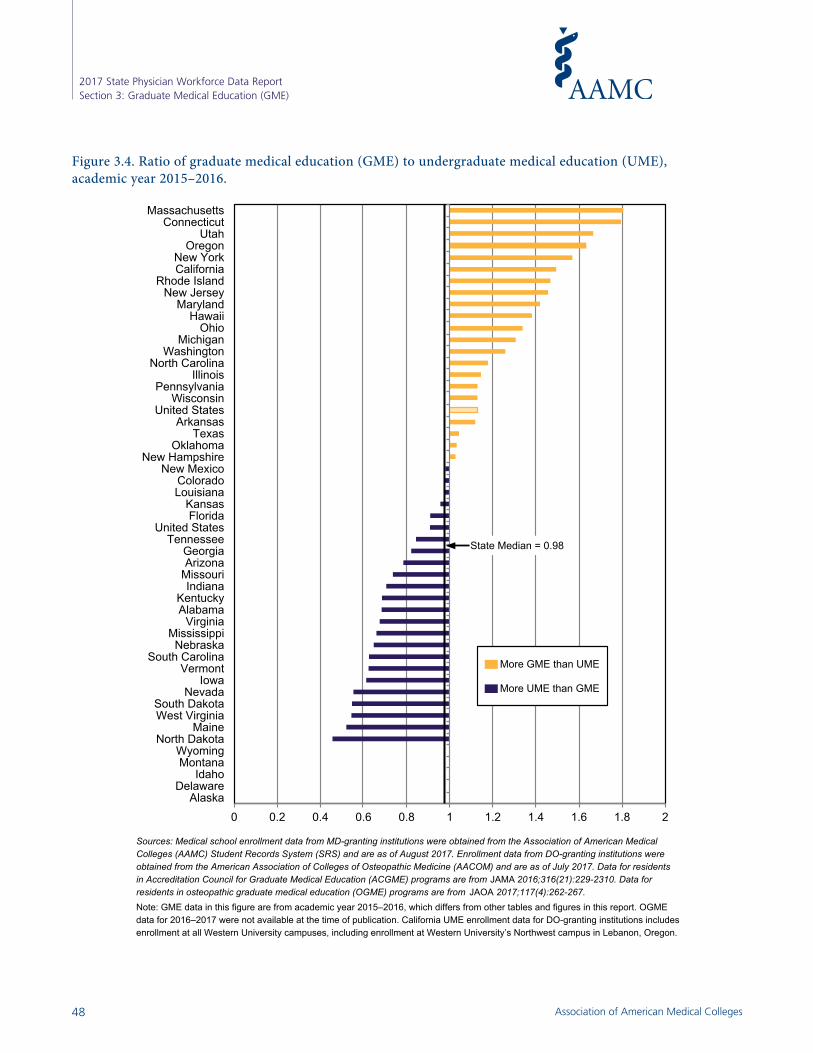
Figure 3.4. Ratio of graduate medical education (GME) to undergraduate medical education (UME), academic year 2015–2016.Figure 3.4. Ratio of graduate medical education (GME) to undergraduate medical education (UME), academic year 2015−2016.
Sources: Medical school enrollment data from MD-granting institutions were obtained from the Association of American Medical Colleges (AAMC) Student Records System (SRS) and are as of August 2017. Enrollment data from DO-granting institutions were obtained from the American Association of Colleges of Osteopathic Medicine (AACOM) and are as of July 2017. Data for residents in Accreditation Council for Graduate Medical Education (ACGME) programs are from JAMA 2016;316(21):229-2310. Data for residents in osteopathic graduate medical education (OGME) programs are from JAOA 2017;117(4):262-267. Note: GME data in this figure are from academic year 2015–2016, which differs from other tables and figures in this report. OGME data for 2016–2017 were not available at the time of publication. California UME enrollment data for DO-granting institutions includes enrollment at all Western University campuses, including enrollment at Western University’s Northwest campus in Lebanon, Oregon.
0 0.2 0.4 0.6 0.8 1 1.2 1.4 1.6 1.8 2Alaska
DelawareIdaho
MontanaWyoming
North DakotaMaine
West VirginiaSouth Dakota
NevadaIowa
VermontSouth Carolina
NebraskaMississippi
VirginiaAlabamaKentucky
IndianaMissouriArizonaGeorgia
TennesseeUnited States
FloridaKansas
LouisianaColorado
New MexicoNew Hampshire
OklahomaTexas
ArkansasUnited States
WisconsinPennsylvania
IllinoisNorth Carolina
WashingtonMichigan
OhioHawaii
MarylandNew Jersey
Rhode IslandCaliforniaNew York
OregonUtah
ConnecticutMassachusetts
State Median = 0.98
More GME than UME
More UME than GME
Association of American Medical Colleges48
2017 State Physician Workforce Data ReportSection 3: Graduate Medical Education (GME)
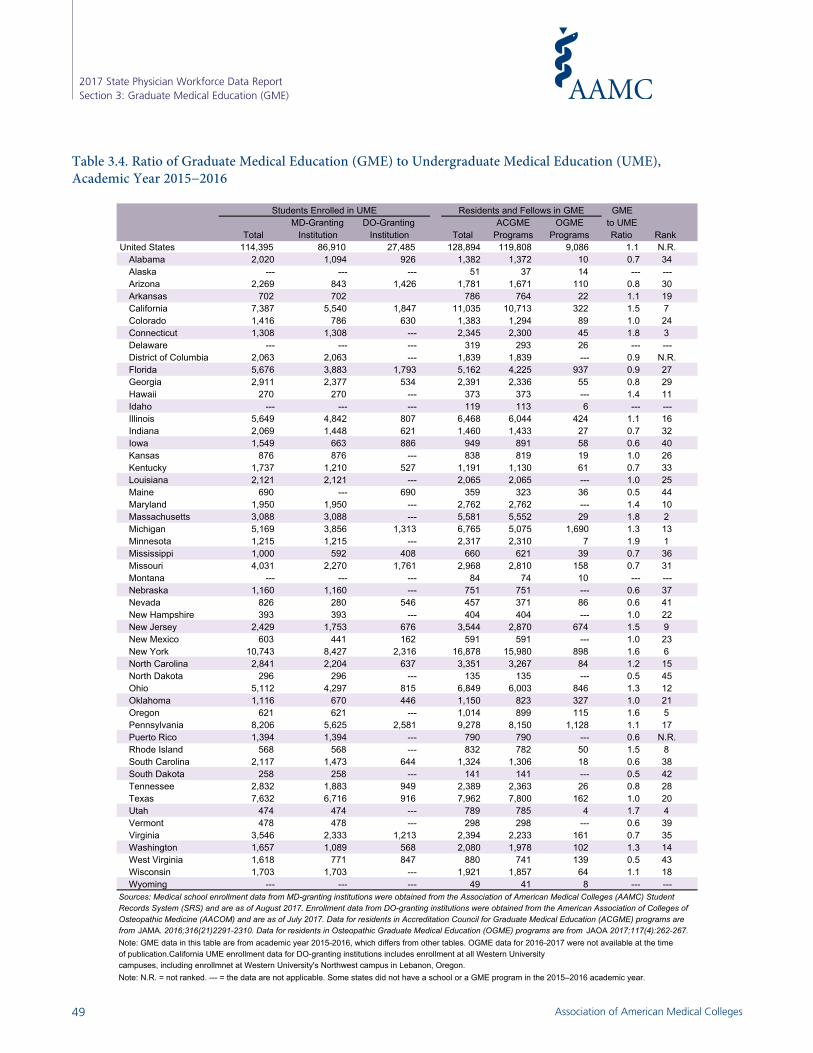
Table 3.4. Ratio of Graduate Medical Education (GME) to Undergraduate Medical Education (UME), Academic Year 2015−2016
GMEMD-Granting DO-Granting ACGME OGME to UME
Institution Institution Total Programs Programs RatioUnited States 114,395 86,910 27,485 128,894 119,808 9,086 1.1 N.R.
Alabama 2,020 1,094 926 1,382 1,372 10 0.7 34Alaska --- --- --- 51 37 14 --- ---Arizona 2,269 843 1,426 1,781 1,671 110 0.8 30Arkansas 702 702 786 764 22 1.1 19California 7,387 5,540 1,847 11,035 10,713 322 1.5 7Colorado 1,416 786 630 1,383 1,294 89 1.0 24Connecticut 1,308 1,308 --- 2,345 2,300 45 1.8 3Delaware --- --- --- 319 293 26 --- ---District of Columbia 2,063 2,063 --- 1,839 1,839 --- 0.9 N.R.Florida 5,676 3,883 1,793 5,162 4,225 937 0.9 27Georgia 2,911 2,377 534 2,391 2,336 55 0.8 29Hawaii 270 270 --- 373 373 --- 1.4 11Idaho --- --- --- 119 113 6 --- ---Illinois 5,649 4,842 807 6,468 6,044 424 1.1 16Indiana 2,069 1,448 621 1,460 1,433 27 0.7 32Iowa 1,549 663 886 949 891 58 0.6 40Kansas 876 876 --- 838 819 19 1.0 26Kentucky 1,737 1,210 527 1,191 1,130 61 0.7 33Louisiana 2,121 2,121 --- 2,065 2,065 --- 1.0 25Maine 690 --- 690 359 323 36 0.5 44Maryland 1,950 1,950 --- 2,762 2,762 --- 1.4 10Massachusetts 3,088 3,088 --- 5,581 5,552 29 1.8 2Michigan 5,169 3,856 1,313 6,765 5,075 1,690 1.3 13Minnesota 1,215 1,215 --- 2,317 2,310 7 1.9 1Mississippi 1,000 592 408 660 621 39 0.7 36Missouri 4,031 2,270 1,761 2,968 2,810 158 0.7 31Montana --- --- --- 84 74 10 --- ---Nebraska 1,160 1,160 --- 751 751 --- 0.6 37Nevada 826 280 546 457 371 86 0.6 41New Hampshire 393 393 --- 404 404 --- 1.0 22New Jersey 2,429 1,753 676 3,544 2,870 674 1.5 9New Mexico 603 441 162 591 591 --- 1.0 23New York 10,743 8,427 2,316 16,878 15,980 898 1.6 6North Carolina 2,841 2,204 637 3,351 3,267 84 1.2 15North Dakota 296 296 --- 135 135 --- 0.5 45Ohio 5,112 4,297 815 6,849 6,003 846 1.3 12Oklahoma 1,116 670 446 1,150 823 327 1.0 21Oregon 621 621 --- 1,014 899 115 1.6 5Pennsylvania 8,206 5,625 2,581 9,278 8,150 1,128 1.1 17Puerto Rico 1,394 1,394 --- 790 790 --- 0.6 N.R.Rhode Island 568 568 --- 832 782 50 1.5 8South Carolina 2,117 1,473 644 1,324 1,306 18 0.6 38South Dakota 258 258 --- 141 141 --- 0.5 42Tennessee 2,832 1,883 949 2,389 2,363 26 0.8 28Texas 7,632 6,716 916 7,962 7,800 162 1.0 20Utah 474 474 --- 789 785 4 1.7 4Vermont 478 478 --- 298 298 --- 0.6 39Virginia 3,546 2,333 1,213 2,394 2,233 161 0.7 35Washington 1,657 1,089 568 2,080 1,978 102 1.3 14West Virginia 1,618 771 847 880 741 139 0.5 43Wisconsin 1,703 1,703 --- 1,921 1,857 64 1.1 18Wyoming --- --- --- 49 41 8 --- ---
Note: N.R. = not ranked. --- = the data are not applicable. Some states did not have a school or a GME program in the 2015–2016 academic year.
Students Enrolled in UME Residents and Fellows in GME
Sources: Medical school enrollment data from MD-granting institutions were obtained from the Association of American Medical Colleges (AAMC) Student Records System (SRS) and are as of August 2017. Enrollment data from DO-granting institutions were obtained from the American Association of Colleges of Osteopathic Medicine (AACOM) and are as of July 2017. Data for residents in Accreditation Council for Graduate Medical Education (ACGME) programs are from JAMA. 2016;316(21)2291-2310. Data for residents in Osteopathic Graduate Medical Education (OGME) programs are from JAOA 2017;117(4):262-267. Note: GME data in this table are from academic year 2015−2016, which differs from other tables. OGME data for 2016−2017 were not available at the time of publication.California UME enrollment data for DO-granting institutions includes enrollment at all Western University campuses, including enrollmnet at Western University's Northwest campus in Lebanon, Oregon.
Total Rank
Table 3.4. Ratio of Graduate Medical Education (GME) to Undergraduate Medical Education (UME), Academic Year 2015−2016
Association of American Medical Colleges49
2017 State Physician Workforce Data ReportSection 3: Graduate Medical Education (GME)
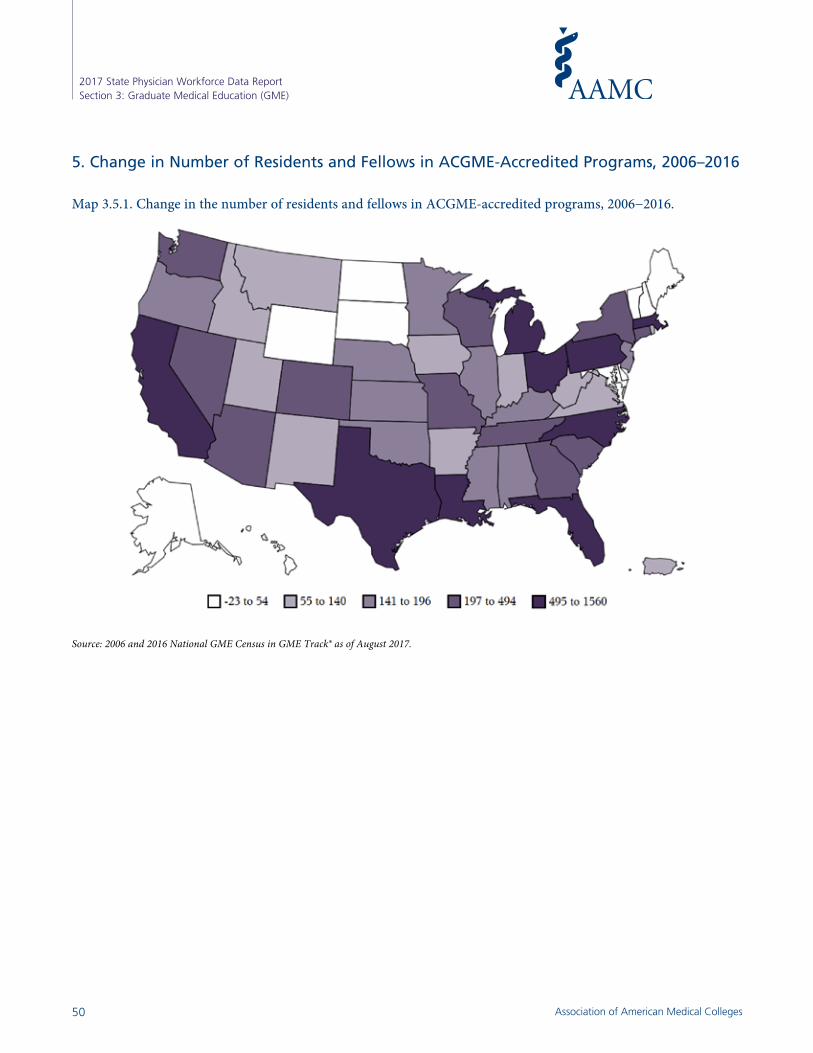
Source: 2006 and 2016 National GME Census in GME Track® as of August 2017.
The SAS System 15:05 Friday, September 15, 2017 1The SAS System 15:05 Friday, September 15, 2017 1The SAS System 15:05 Friday, September 15, 2017 1The SAS System 15:05 Friday, September 15, 2017 1The SAS System 15:05 Friday, September 15, 2017 1The SAS System 15:05 Friday, September 15, 2017 1The SAS System 15:05 Friday, September 15, 2017 1The SAS System 15:05 Friday, September 15, 2017 1The SAS System 15:05 Friday, September 15, 2017 1The SAS System 15:05 Friday, September 15, 2017 1The SAS System 15:05 Friday, September 15, 2017 1The SAS System 15:05 Friday, September 15, 2017 1
5. Change in Number of Residents and Fellows in ACGME-Accredited Programs, 2006–2016
Map 3.5.1. Change in the number of residents and fellows in ACGME-accredited programs, 2006−2016.
Association of American Medical Colleges50
2017 State Physician Workforce Data ReportSection 3: Graduate Medical Education (GME)
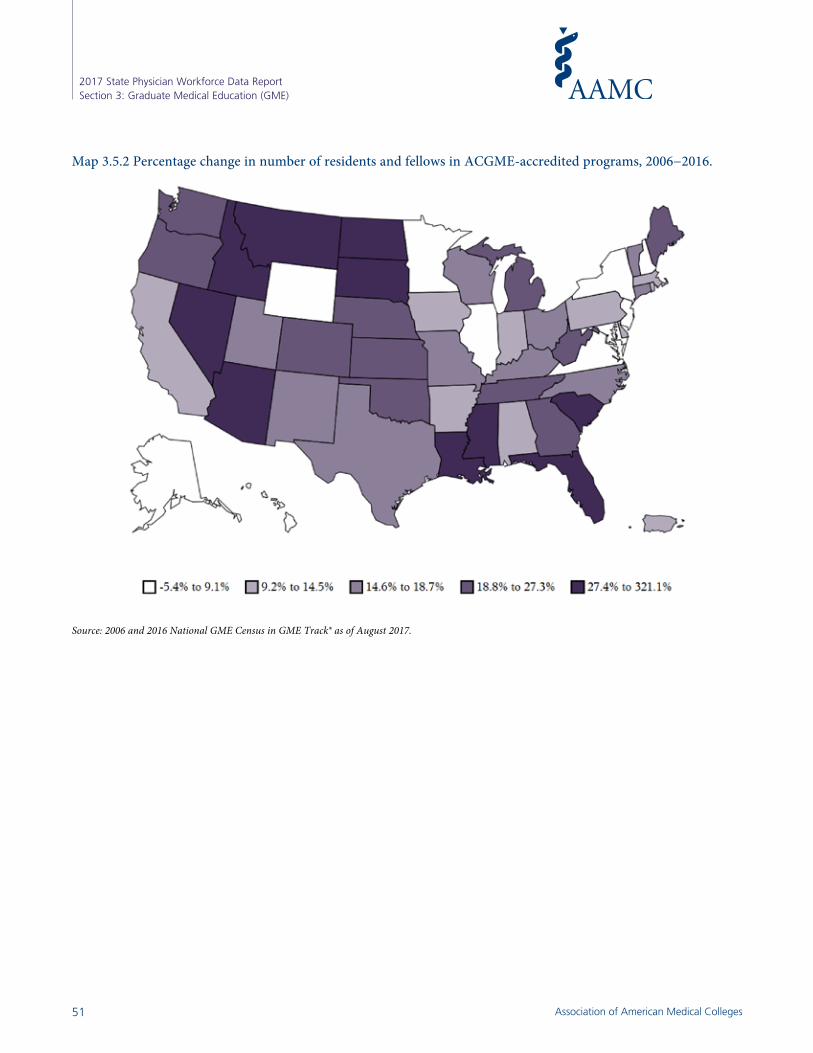
Source: 2006 and 2016 National GME Census in GME Track® as of August 2017.
The SAS System 15:05 Friday, September 15, 2017 1The SAS System 15:05 Friday, September 15, 2017 1
The SAS System 15:05 Friday, September 15, 2017 1The SAS System 15:05 Friday, September 15, 2017 1The SAS System 15:05 Friday, September 15, 2017 1The SAS System 15:05 Friday, September 15, 2017 1The SAS System 15:05 Friday, September 15, 2017 1The SAS System 15:05 Friday, September 15, 2017 1The SAS System 15:05 Friday, September 15, 2017 1The SAS System 15:05 Friday, September 15, 2017 1The SAS System 15:05 Friday, September 15, 2017 1The SAS System 15:05 Friday, September 15, 2017 1Map 3.5.2 Percentage change in number of residents and fellows in ACGME-accredited programs, 2006−2016.
Association of American Medical Colleges51
2017 State Physician Workforce Data ReportSection 3: Graduate Medical Education (GME)
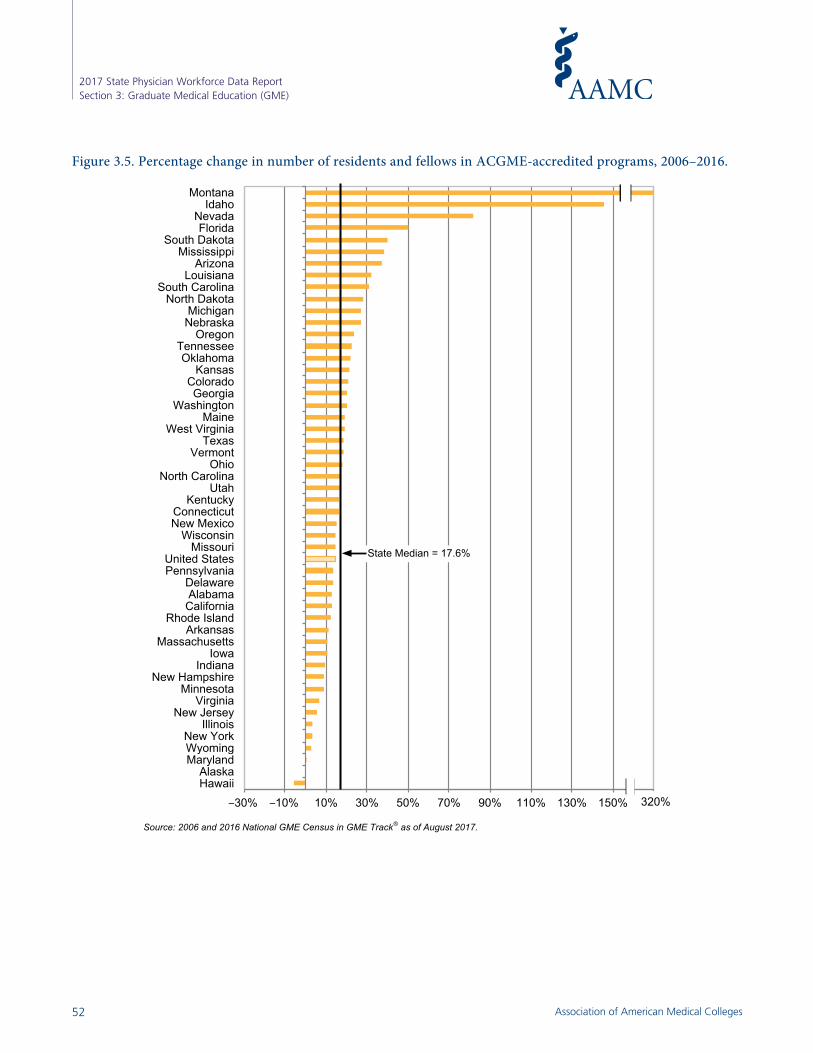
Figure 3.5. Percentage change in number of residents and fellows in ACGME-accredited programs, 2006–2016.
Figure 3.5. Percentage change in number of residents and fellows in ACGME-accredited programs, 2006−2016.
a
Source: 2006 and 2016 National GME Census in GME Track® as of August 2017.
-30% -10% 10% 30% 50% 70% 90% 110% 130% 150% 170%HawaiiAlaska
MarylandWyomingNew York
IllinoisNew Jersey
VirginiaMinnesota
New HampshireIndiana
IowaMassachusetts
ArkansasRhode Island
CaliforniaAlabamaDelaware
PennsylvaniaUnited States
MissouriWisconsin
New MexicoConnecticut
KentuckyUtah
North CarolinaOhio
VermontTexas
West VirginiaMaine
WashingtonGeorgia
ColoradoKansas
OklahomaTennessee
OregonNebraskaMichigan
North DakotaSouth Carolina
LouisianaArizona
MississippiSouth Dakota
FloridaNevada
IdahoMontana
State Median = 17.6%
320%– –
Association of American Medical Colleges52
2017 State Physician Workforce Data ReportSection 3: Graduate Medical Education (GME)

Table 3.5. Change in Number of Residents and Fellows in ACGME-Accredited Programs, 2006−2016Table 3.5. Change in Number of Residents and Fellows in ACGME-Accredited Programs, 2006−2016
Number Percent 2006 2016 Change Change Rank
United States 106,553 122,002 15,449 14.5% N.R.Alabama 1,234 1,392 158 12.8% 34Alaska 32 32 0 0.0% 49Arizona 1,240 1,704 464 37.4% 7Arkansas 689 768 79 11.5% 37California 9,249 10,429 1,180 12.8% 35Colorado 1,132 1,370 238 21.0% 17Connecticut 2,016 2,344 328 16.3% 28Delaware 315 357 42 13.3% 33District of Columbia 1,605 1,646 41 2.6% N.R.Florida 3,092 4,652 1,560 50.5% 4Georgia 1,973 2,375 402 20.4% 18Hawaii 423 400 -23 -5.4% 50Idaho 46 113 67 145.7% 2Illinois 5,896 6,092 196 3.3% 45Indiana 1,308 1,433 125 9.6% 40Iowa 799 882 83 10.4% 39Kansas 682 826 144 21.1% 16Kentucky 1,014 1,180 166 16.4% 27Louisiana 1,569 2,074 505 32.2% 8Maine 280 334 54 19.3% 20Maryland 2,804 2,814 10 0.4% 48Massachusetts 5,092 5,630 538 10.6% 38Michigan 4,442 5,655 1,213 27.3% 11Minnesota 2,096 2,285 189 9.0% 42Mississippi 469 648 179 38.2% 6Missouri 2,508 2,873 365 14.6% 31Montana 19 80 61 321.1% 1Nebraska 614 779 165 26.9% 12Nevada 250 455 205 82.0% 3New Hampshire 375 409 34 9.1% 41New Jersey 2,708 2,865 157 5.8% 44New Mexico 505 583 78 15.4% 29New York 15,782 16,276 494 3.1% 46North Carolina 2,811 3,308 497 17.7% 25North Dakota 106 136 30 28.3% 10Ohio 5,166 6,104 938 18.2% 24Oklahoma 716 873 157 21.9% 15Oregon 772 953 181 23.4% 13Pennsylvania 7,161 8,139 978 13.7% 32Puerto Rico 715 782 67 9.4% N.R.Rhode Island 748 841 93 12.4% 36South Carolina 1,025 1,344 319 31.1% 9South Dakota 105 147 42 40.0% 5Tennessee 2,047 2,506 459 22.4% 14Texas 6,740 7,997 1,257 18.6% 22Utah 653 768 115 17.6% 26Vermont 263 312 49 18.6% 23Virginia 2,034 2,174 140 6.9% 43Washington 1,642 1,975 333 20.3% 19West Virginia 629 748 119 18.9% 21Wisconsin 1,638 1,881 243 14.8% 30Wyoming 39 40 1 2.6% 47
Note: N.R. = not ranked.
in ACGME-Accredited ProgramsTotal Residents and Fellows
Source: 2006 and 2016 National GME Census in GME Track® as of August 2017.
Association of American Medical Colleges53
2017 State Physician Workforce Data ReportSection 3: Graduate Medical Education (GME)
Section 4: Retention
Key Findings
• In 2016, 38.5% of physicians were active in the same state where they received their UME. Seven of the top 10 states in terms of UME retention were in the South (see Map 4.1, Figure 4.1, and Table 4.1).
• In 2016, 46.6% of the physicians who graduated from a public school were active in the same state where they completed UME (see Figure 4.2 and Table 4.2).
• In 2016, 47.5% of physicians were active in the state where they completed their most recent GME. Five of the top 10 states with the highest GME retention rates were in the West (see Map 4.3, Figure 4.3, and Table 4.3).
• Retention rates were highest among physicians who completed both UME and GME in the same state. Two-thirds (67.1%) of the physicians who completed UME and GME in the same state remained in the state to practice. In terms of overall retention (that is, both UME and GME were completed in the same state), 8 of the top 10 states were in the South and West (see Figure 4.4 and Table 4.4).
Association of American Medical Colleges54
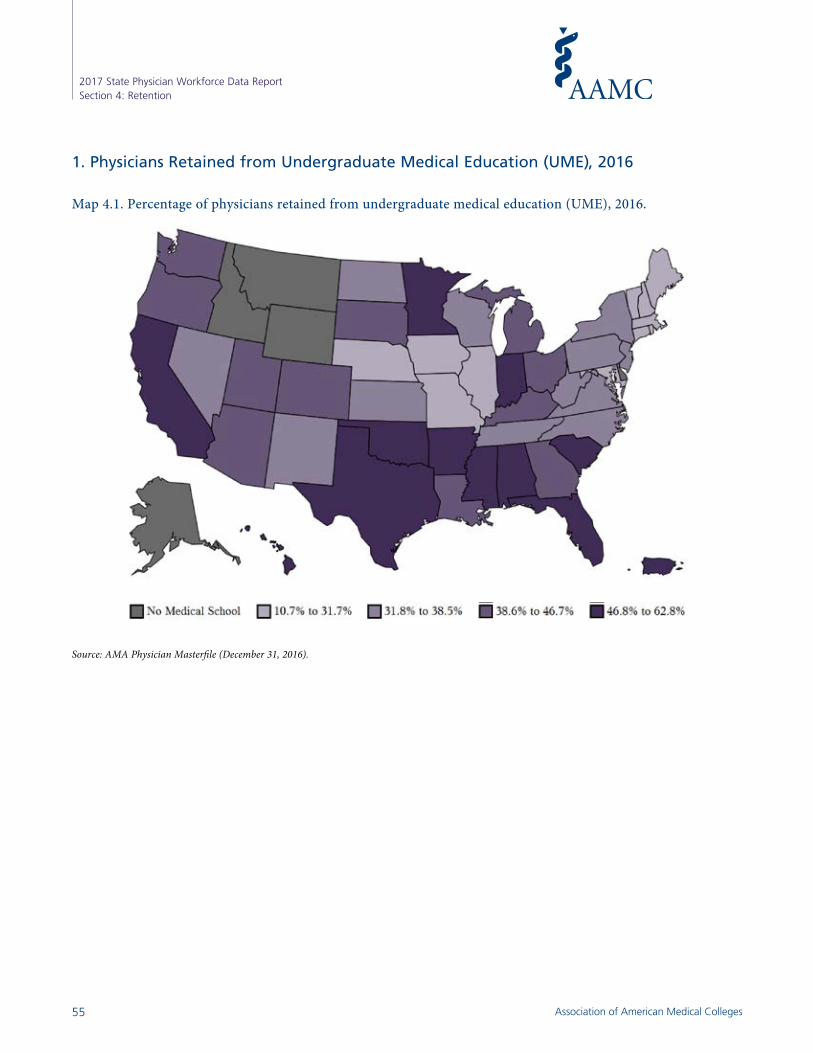
1. Physicians Retained from Undergraduate Medical Education (UME), 2016
Map 4.1. Percentage of physicians retained from undergraduate medical education (UME), 2016.
Source: AMA Physician Masterfile (December 31, 2016).
The SAS System 13:17 Monday, September 18, 2017 1The SAS System 13:17 Monday, September 18, 2017 1
The SAS System 13:17 Monday, September 18, 2017 1The SAS System 13:17 Monday, September 18, 2017 1The SAS System 13:17 Monday, September 18, 2017 1The SAS System 13:17 Monday, September 18, 2017 1The SAS System 13:17 Monday, September 18, 2017 1The SAS System 13:17 Monday, September 18, 2017 1The SAS System 13:17 Monday, September 18, 2017 1The SAS System 13:17 Monday, September 18, 2017 1
The SAS System 13:17 Monday, September 18, 2017 1The SAS System 13:17 Monday, September 18, 2017 1
Association of American Medical Colleges55
2017 State Physician Workforce Data ReportSection 4: Retention
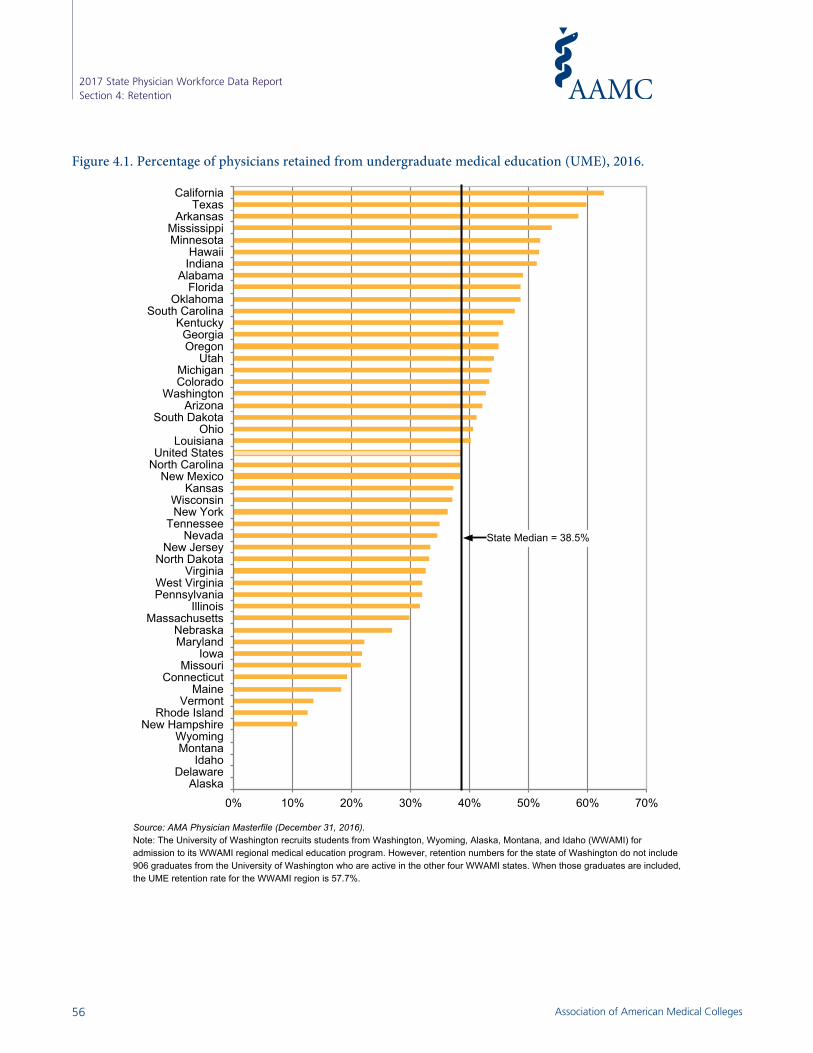
Figure 4.1. Percentage of physicians retained from undergraduate medical education (UME), 2016.
Figure 4.1. Percentage of physicians retained from undergraduate medical education (UME), 2016.
z
Source: AMA Physician Masterfile (December 31, 2016).Note: The University of Washington recruits students from Washington, Wyoming, Alaska, Montana, and Idaho (WWAMI) for admission to its WWAMI regional medical education program. However, retention numbers for the state of Washington do not include 906 graduates from the University of Washington who are active in the other four WWAMI states. When those graduates are included, the UME retention rate for the WWAMI region is 57.7%.
0% 10% 20% 30% 40% 50% 60% 70%Alaska
DelawareIdaho
MontanaWyoming
New HampshireRhode Island
VermontMaine
ConnecticutMissouri
IowaMarylandNebraska
MassachusettsIllinois
PennsylvaniaWest Virginia
VirginiaNorth Dakota
New JerseyNevada
TennesseeNew YorkWisconsin
KansasNew Mexico
North CarolinaUnited States
LouisianaOhio
South DakotaArizona
WashingtonColoradoMichigan
UtahOregonGeorgia
KentuckySouth Carolina
OklahomaFlorida
AlabamaIndianaHawaii
MinnesotaMississippi
ArkansasTexas
California
State Median = 38.5%
Association of American Medical Colleges56
2017 State Physician Workforce Data ReportSection 4: Retention
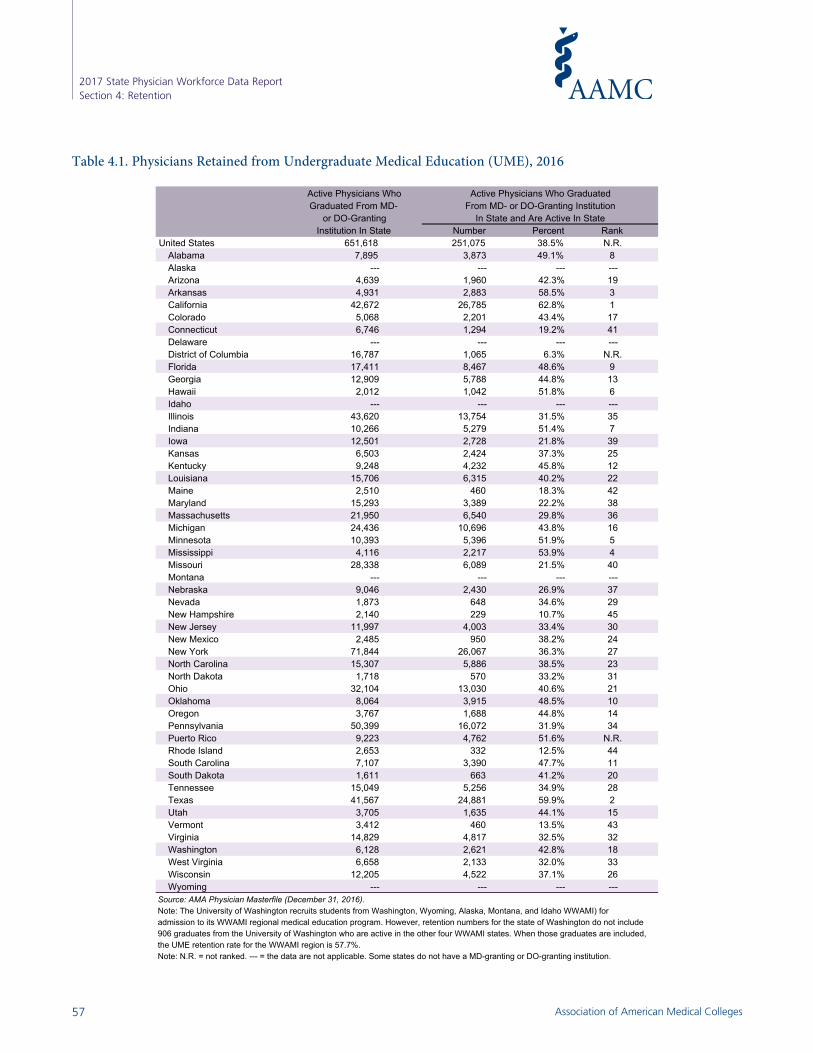
Table 4.1. Physicians Retained from Undergraduate Medical Education (UME), 2016Table 4.1. Physicians Retained from Undergraduate Medical Education (UME), 2016
Number Percent RankUnited States 651,618 251,075 38.5% N.R.
Alabama 7,895 3,873 49.1% 8Alaska --- --- --- ---Arizona 4,639 1,960 42.3% 19Arkansas 4,931 2,883 58.5% 3California 42,672 26,785 62.8% 1Colorado 5,068 2,201 43.4% 17Connecticut 6,746 1,294 19.2% 41Delaware --- --- --- ---District of Columbia 16,787 1,065 6.3% N.R.Florida 17,411 8,467 48.6% 9Georgia 12,909 5,788 44.8% 13Hawaii 2,012 1,042 51.8% 6Idaho --- --- --- ---Illinois 43,620 13,754 31.5% 35Indiana 10,266 5,279 51.4% 7Iowa 12,501 2,728 21.8% 39Kansas 6,503 2,424 37.3% 25Kentucky 9,248 4,232 45.8% 12Louisiana 15,706 6,315 40.2% 22Maine 2,510 460 18.3% 42Maryland 15,293 3,389 22.2% 38Massachusetts 21,950 6,540 29.8% 36Michigan 24,436 10,696 43.8% 16Minnesota 10,393 5,396 51.9% 5Mississippi 4,116 2,217 53.9% 4Missouri 28,338 6,089 21.5% 40Montana --- --- --- ---Nebraska 9,046 2,430 26.9% 37Nevada 1,873 648 34.6% 29New Hampshire 2,140 229 10.7% 45New Jersey 11,997 4,003 33.4% 30New Mexico 2,485 950 38.2% 24New York 71,844 26,067 36.3% 27North Carolina 15,307 5,886 38.5% 23North Dakota 1,718 570 33.2% 31Ohio 32,104 13,030 40.6% 21Oklahoma 8,064 3,915 48.5% 10Oregon 3,767 1,688 44.8% 14Pennsylvania 50,399 16,072 31.9% 34Puerto Rico 9,223 4,762 51.6% N.R.Rhode Island 2,653 332 12.5% 44South Carolina 7,107 3,390 47.7% 11South Dakota 1,611 663 41.2% 20Tennessee 15,049 5,256 34.9% 28Texas 41,567 24,881 59.9% 2Utah 3,705 1,635 44.1% 15Vermont 3,412 460 13.5% 43Virginia 14,829 4,817 32.5% 32Washington 6,128 2,621 42.8% 18West Virginia 6,658 2,133 32.0% 33Wisconsin 12,205 4,522 37.1% 26Wyoming --- --- --- ---
Source: AMA Physician Masterfile (December 31, 2016).
Note: N.R. = not ranked. --- = the data are not applicable. Some states do not have a MD-granting or DO-granting institution.
Note: The University of Washington recruits students from Washington, Wyoming, Alaska, Montana, and Idaho WWAMI) for admission to its WWAMI regional medical education program. However, retention numbers for the state of Washington do not include 906 graduates from the University of Washington who are active in the other four WWAMI states. When those graduates are included, the UME retention rate for the WWAMI region is 57.7%.
Institution In State
Active Physicians Who Active Physicians Who GraduatedGraduated From MD- From MD- or DO-Granting Institution
or DO-Granting In State and Are Active In State
Association of American Medical Colleges57
2017 State Physician Workforce Data ReportSection 4: Retention

Figure 4.2. Percentage of physicians retained from public undergraduate medical education (UME), 2016.
Source: AMA Physician Masterfile (December 31, 2016).Note: The University of Washington recruits students from Washington, Wyoming, Alaska, Montana, and Idaho (WWAMI) for admission to its WWAMI regional medical education program. However, retention numbers for the state of Washington do not include 906 graduates from the University of Washington who are active in the other four WWAMI states. When those graduates are included, the UME retention rate for the WWAMI region is 57.7%.
0% 10% 20% 30% 40% 50% 60% 70% 80%Alaska
DelawareIdahoMaine
MontanaNew Hampshire
PennsylvaniaRhode Island
WyomingVermont
MarylandIowa
ConnecticutWest Virginia
VirginiaNew Jersey
North DakotaKansas
New MexicoNevada
NebraskaMissouri
South DakotaIllinois
New YorkWisconsinMichigan
OhioColorado
WashingtonOregon
UtahUnited States
KentuckySouth CarolinaNorth Carolina
ArizonaAlabama
OklahomaGeorgia
TennesseeIndiana
MassachusettsFloridaHawaii
MississippiLouisiana
MinnesotaArkansas
TexasCalifornia
State Median = 44.1%
2. Physicians Retained from Public Undergraduate Medical Education (UME), 2016
Figure 4.2. Percentage of physicians retained from public undergraduate medical education (UME), 2016.
Association of American Medical Colleges58
2017 State Physician Workforce Data ReportSection 4: Retention

Table 4.2. Physicians Retained from Public Undergraduate Medical Education, 2016Table 4.2. Physicians Retained from Public Undergraduate Medical Education, 2016
Number Percent RankUnited States 358,234 167,073 46.6% N.R.
Alabama 7,895 3,873 49.1% 15Alaska --- --- --- ---Arizona 3,328 1,658 49.8% 13Arkansas 4,931 2,883 58.5% 3California 22,901 15,724 68.7% 1Colorado 4,860 2,144 44.1% 21Connecticut 2,752 875 31.8% 38Delaware --- --- --- ---District of Columbia --- --- --- N.R.Florida 7,884 4,075 51.7% 9Georgia 6,488 3,194 49.2% 14Hawaii 2,012 1,042 51.8% 8Idaho --- --- --- ---Illinois 13,536 5,507 40.7% 28Indiana 10,266 5,279 51.4% 10Iowa 5,945 1,794 30.2% 39Kansas 6,503 2,424 37.3% 33Kentucky 8,591 4,006 46.6% 18Louisiana 9,757 5,309 54.4% 5Maine --- --- --- ---Maryland 10,635 2,649 24.9% 40Massachusetts 3,210 1,674 52.1% 7Michigan 24,436 10,696 43.8% 22Minnesota 9,062 4,934 54.4% 4Mississippi 4,116 2,217 53.9% 6Missouri 6,637 2,655 40.0% 30Montana --- --- --- ---Nebraska 4,802 1,937 40.3% 29Nevada 1,500 582 38.8% 31New Hampshire --- --- --- ---New Jersey 11,997 4,003 33.4% 34New Mexico 2,485 950 38.2% 32New York 22,719 9,711 42.7% 25North Carolina 7,446 3,632 48.8% 16North Dakota 1,718 570 33.2% 35Ohio 26,671 11,556 43.3% 23Oklahoma 7,747 3,886 50.2% 12Oregon 3,763 1,688 44.9% 19Pennsylvania --- --- --- ---Puerto Rico 4,566 2,506 54.9% N.R.Rhode Island --- --- --- ---South Carolina 7,106 3,390 47.7% 17South Dakota 1,611 663 41.2% 27Tennessee 8,065 4,067 50.4% 11Texas 35,414 22,001 62.1% 2Utah 3,705 1,635 44.1% 20Vermont 3,412 460 13.5% 41Virginia 14,169 4,680 33.0% 36Washington 6,055 2,590 42.8% 24West Virginia 6,658 2,133 32.0% 37Wisconsin 5,446 2,327 42.7% 26Wyoming --- --- --- ---
Source: AMA Physician Masterfile (December 31, 2016).
Note: N.R. = not ranked. --- = the data are not applicable. Some states do not have an MD-granting or a DO-granting institution.
Note: The University of Washington recruits students from Washington, Wyoming, Alaska, Montana, and Idaho (WWAMI) for admission to its WWAMI regional medical education program. However, retention numbers for the state of Washington do not include 906 graduates from the University of Washington who are active in the other four WWAMI states. When those graduates are included, the UME retention rate for the WWAMI region is 57.7%.
Institution In State
Active Physicians Who Active Physicians Who GraduatedGraduated from Public from Public MD- or DO-Granting InstitutionMD- or DO-Granting In State and Are Active In State
Association of American Medical Colleges59
2017 State Physician Workforce Data ReportSection 4: Retention

The SAS System 13:17 Monday, September 18, 2017 1The SAS System 13:17 Monday, September 18, 2017 13. Physicians Retained from Graduate Medical Education (GME), 2016
Map 4.3. Percentage of physicians retained from graduate medical education (GME), 2016.
Source: AMA Physician Masterfile (December 31, 2016).
The SAS System 13:17 Monday, September 18, 2017 1The SAS System 13:17 Monday, September 18, 2017 1The SAS System 13:17 Monday, September 18, 2017 1The SAS System 13:17 Monday, September 18, 2017 1The SAS System 13:17 Monday, September 18, 2017 1The SAS System 13:17 Monday, September 18, 2017 1The SAS System 13:17 Monday, September 18, 2017 1The SAS System 13:17 Monday, September 18, 2017 1The SAS System 13:17 Monday, September 18, 2017 1The SAS System 13:17 Monday, September 18, 2017 1
Association of American Medical Colleges60
2017 State Physician Workforce Data ReportSection 4: Retention
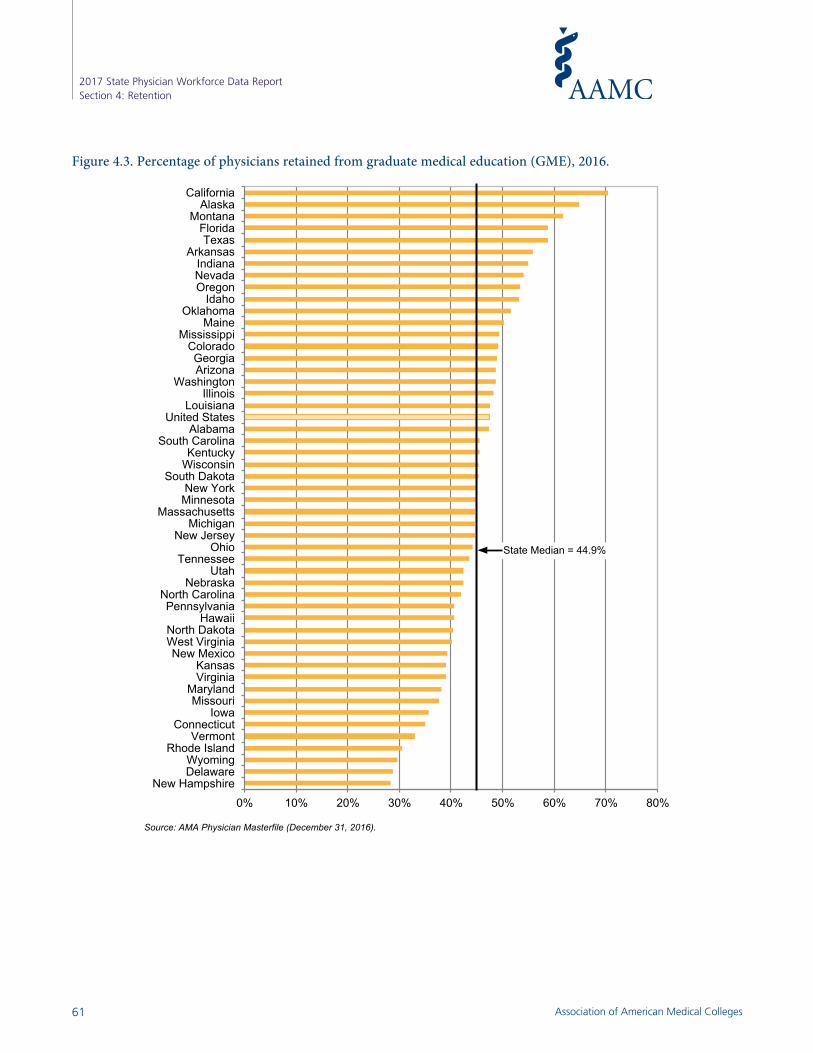
Figure 4.3. Percentage of physicians retained from graduate medical education (GME), 2016.
Figure 4.3. Percentage of physicians retained from graduate medical education (GME), 2016.
Source: AMA Physician Masterfile (December 31, 2016).
0% 10% 20% 30% 40% 50% 60% 70% 80%New Hampshire
DelawareWyoming
Rhode IslandVermont
ConnecticutIowa
MissouriMaryland
VirginiaKansas
New MexicoWest VirginiaNorth Dakota
HawaiiPennsylvania
North CarolinaNebraska
UtahTennessee
OhioNew Jersey
MichiganMassachusetts
MinnesotaNew York
South DakotaWisconsinKentucky
South CarolinaAlabama
United StatesLouisiana
IllinoisWashington
ArizonaGeorgia
ColoradoMississippi
MaineOklahoma
IdahoOregonNevadaIndiana
ArkansasTexas
FloridaMontana
AlaskaCalifornia
State Median = 44.9%
Association of American Medical Colleges61
2017 State Physician Workforce Data ReportSection 4: Retention

Table 4.3. Physicians Retained from Graduate Medical Education (GME), 2016Table 4.3. Physicians Retained from Graduate Medical Education (GME), 2016
Number Percent RankUnited States 829,266 393,827 47.5% N.R.
Alabama 9,011 4,267 47.4% 20Alaska 162 105 64.8% 2Arizona 8,642 4,208 48.7% 16Arkansas 5,019 2,802 55.8% 6California 82,262 57,893 70.4% 1Colorado 10,104 4,968 49.2% 14Connecticut 14,231 4,982 35.0% 45Delaware 1,585 453 28.6% 49District of Columbia 16,526 2,714 16.4% N.R.Florida 24,375 14,324 58.8% 4Georgia 15,654 7,658 48.9% 15Hawaii 3,070 1,245 40.6% 36Idaho 418 222 53.1% 10Illinois 44,382 21,371 48.2% 18Indiana 10,691 5,871 54.9% 7Iowa 6,840 2,442 35.7% 44Kansas 5,918 2,312 39.1% 40Kentucky 8,306 3,773 45.4% 22Louisiana 13,699 6,511 47.5% 19Maine 2,088 1,050 50.3% 12Maryland 20,470 7,779 38.0% 42Massachusetts 37,817 16,893 44.7% 27Michigan 35,272 15,748 44.6% 28Minnesota 18,797 8,411 44.7% 26Mississippi 3,751 1,848 49.3% 13Missouri 19,372 7,285 37.6% 43Montana 125 77 61.6% 3Nebraska 4,527 1,917 42.3% 33Nevada 1,316 711 54.0% 8New Hampshire 2,147 604 28.1% 50New Jersey 19,137 8,516 44.5% 29New Mexico 3,546 1,391 39.2% 39New York 117,284 52,782 45.0% 25North Carolina 20,451 8,578 41.9% 34North Dakota 927 374 40.3% 37Ohio 41,364 18,234 44.1% 30Oklahoma 6,105 3,144 51.5% 11Oregon 5,832 3,115 53.4% 9Pennsylvania 55,255 22,452 40.6% 35Puerto Rico 7,100 5,294 74.6% N.R.Rhode Island 4,813 1,465 30.4% 47South Carolina 8,380 3,807 45.4% 21South Dakota 795 359 45.2% 24Tennessee 14,983 6,527 43.6% 31Texas 51,026 29,942 58.7% 5Utah 5,021 2,132 42.5% 32Vermont 1,741 573 32.9% 46Virginia 15,545 6,073 39.1% 41Washington 12,632 6,138 48.6% 17West Virginia 4,421 1,773 40.1% 38Wisconsin 13,023 5,887 45.2% 23Wyoming 408 121 29.7% 48
Source: AMA Physician Masterfile (December 31, 2016).Note: N.R. = not ranked.
GME In Stateand Are Active In State
Who Completed GME In StateActive Physicians
Who CompletedActive Physicians
Association of American Medical Colleges62
2017 State Physician Workforce Data ReportSection 4: Retention
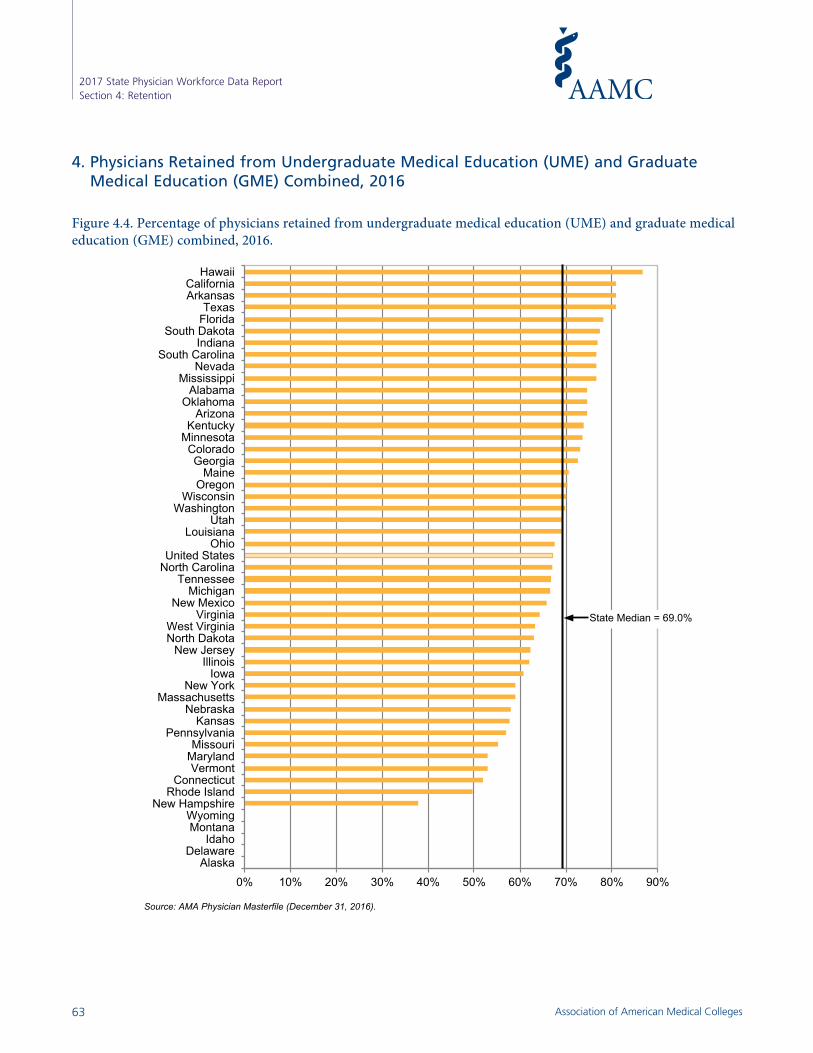
Figure 4.4. Percentage of physicians retained from undergraduate medical education (UME) and graduate medical education (GME) combined, 2016.
Source: AMA Physician Masterfile (December 31, 2016).
0% 10% 20% 30% 40% 50% 60% 70% 80% 90%Alaska
DelawareIdaho
MontanaWyoming
New HampshireRhode Island
ConnecticutVermont
MarylandMissouri
PennsylvaniaKansas
NebraskaMassachusetts
New YorkIowa
IllinoisNew Jersey
North DakotaWest Virginia
VirginiaNew Mexico
MichiganTennessee
North CarolinaUnited States
OhioLouisiana
UtahWashington
WisconsinOregon
MaineGeorgia
ColoradoMinnesotaKentucky
ArizonaOklahoma
AlabamaMississippi
NevadaSouth Carolina
IndianaSouth Dakota
FloridaTexas
ArkansasCalifornia
Hawaii
State Median = 69.0%
4. Physicians Retained from Undergraduate Medical Education (UME) and Graduate Medical Education (GME) Combined, 2016
Figure 4.4. Percentage of physicians retained from undergraduate medical education (UME) and graduate medical education (GME) combined, 2016.
Association of American Medical Colleges63
2017 State Physician Workforce Data ReportSection 4: Retention

Table 4.4. Physicians Retained from Undergraduate Medical Education (UME) and GraduateMedical Education (GME) Combined, 2016
Number Percent RankUnited States 246,079 165,023 67.1% N.R.
Alabama 3,151 2,354 74.7% 11Alaska --- --- --- ---Arizona 1,446 1,078 74.6% 13Arkansas 2,383 1,928 80.9% 3California 26,181 21,211 81.0% 2Colorado 1,764 1,288 73.0% 16Connecticut 1,555 806 51.8% 43Delaware --- --- --- ---District of Columbia 3,461 716 20.7% N.R.Florida 5,768 4,511 78.2% 5Georgia 4,327 3,143 72.6% 17Hawaii 612 530 86.6% 1Idaho --- --- --- ---Illinois 15,714 9,744 62.0% 33Indiana 4,735 3,642 76.9% 7Iowa 2,373 1,441 60.7% 34Kansas 2,360 1,362 57.7% 38Kentucky 3,118 2,304 73.9% 14Louisiana 6,224 4,297 69.0% 23Maine 248 175 70.6% 18Maryland 3,603 1,910 53.0% 41Massachusetts 8,206 4,836 58.9% 36Michigan 10,514 7,005 66.6% 27Minnesota 5,165 3,806 73.7% 15Mississippi 1,674 1,282 76.6% 10Missouri 6,041 3,339 55.3% 40Montana --- --- --- ---Nebraska 2,296 1,329 57.9% 37Nevada 257 197 76.7% 9New Hampshire 188 71 37.8% 45New Jersey 3,158 1,964 62.2% 32New Mexico 725 477 65.8% 28New York 35,200 20,766 59.0% 35North Carolina 4,899 3,284 67.0% 25North Dakota 330 208 63.0% 31Ohio 13,447 9,080 67.5% 24Oklahoma 2,775 2,073 74.7% 12Oregon 1,056 743 70.4% 19Pennsylvania 19,189 10,934 57.0% 39Puerto Rico 4,123 3,155 76.5% N.R.Rhode Island 364 181 49.7% 44South Carolina 2,507 1,922 76.7% 8South Dakota 258 200 77.5% 6Tennessee 4,749 3,168 66.7% 26Texas 21,147 17,100 80.9% 4Utah 934 645 69.1% 22Vermont 346 183 52.9% 42Virginia 3,907 2,513 64.3% 29Washington 2,058 1,438 69.9% 21West Virginia 1,938 1,224 63.2% 30Wisconsin 3,728 2,615 70.1% 20Wyoming --- --- --- ---
Source: AMA Physician Masterfile (December 31, 2016).Note: N.R. = not ranked. --- = the data are not applicable. Some states do not have an MD-granting or a DO-granting institution.
Completed GME In State
Active Physicians Who Active Physicians Who Graduated fromGraduated from MD- MD- or DO-Granting Institution In State,
or DO-Granting Institution Completed GME In State, and In State and Are Active In State
Table 4.4. Physicians Retained from Undergraduate Medical Education (UME) and Graduate Medical Education (GME) Combined, 2016
Association of American Medical Colleges64
2017 State Physician Workforce Data ReportSection 4: Retention
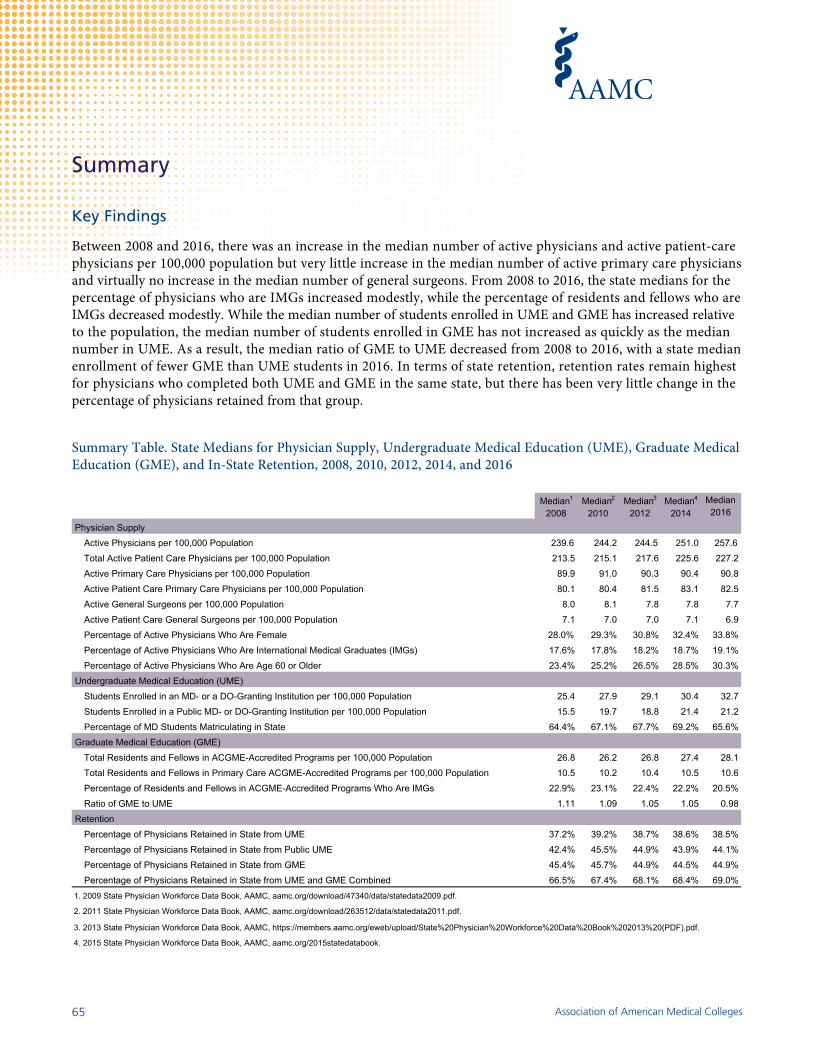
.
.
Summary
Key Findings
Between 2008 and 2016, there was an increase in the median number of active physicians and active patient-care physicians per 100,000 population but very little increase in the median number of active primary care physicians and virtually no increase in the median number of general surgeons. From 2008 to 2016, the state medians for the percentage of physicians who are IMGs increased modestly, while the percentage of residents and fellows who are IMGs decreased modestly. While the median number of students enrolled in UME and GME has increased relative to the population, the median number of students enrolled in GME has not increased as quickly as the median number in UME. As a result, the median ratio of GME to UME decreased from 2008 to 2016, with a state median enrollment of fewer GME than UME students in 2016. In terms of state retention, retention rates remain highest for physicians who completed both UME and GME in the same state, but there has been very little change in the percentage of physicians retained from that group.
Summary Table. State Medians for Physician Supply, Undergraduate Medical Education (UME), Graduate Medical Education (GME), and In-State Retention, 2008, 2010, 2012, 2014, and 2016Summary Table. State Medians for Key Physician Workforce Measures, 2008, 2010, 2012, 2014, and 2016.
Median1
2008Median2
2010Median3
2012Median4
2014Median
2016Physician Supply
Active Physicians per 100,000 Population 239.6 244.2 244.5 251.0 257.6Total Active Patient Care Physicians per 100,000 Population 213.5 215.1 217.6 225.6 227.2Active Primary Care Physicians per 100,000 Population 89.9 91.0 90.3 90.4 90.8Active Patient Care Primary Care Physicians per 100,000 Population 80.1 80.4 81.5 83.1 82.5Active General Surgeons per 100,000 Population 8.0 8.1 7.8 7.8 7.7Active Patient Care General Surgeons per 100,000 Population 7.1 7.0 7.0 7.1 6.9Percentage of Active Physicians Who Are Female 28.0% 29.3% 30.8% 32.4% 33.8%Percentage of Active Physicians Who Are International Medical Graduates (IMGs) 17.6% 17.8% 18.2% 18.7% 19.1%Percentage of Active Physicians Who Are Age 60 or Older 23.4% 25.2% 26.5% 28.5% 30.3%
Undergraduate Medical Education (UME)Students Enrolled in an MD- or a DO-Granting Institution per 100,000 Population 25.4 27.9 29.1 30.4 32.7Students Enrolled in a Public MD- or DO-Granting Institution per 100,000 Population 15.5 19.7 18.8 21.4 21.2Percentage of MD Students Matriculating in State 64.4% 67.1% 67.7% 69.2% 65.6%
Graduate Medical Education (GME)Total Residents and Fellows in ACGME-Accredited Programs per 100,000 Population 26.8 26.2 26.8 27.4 28.1Total Residents and Fellows in Primary Care ACGME-Accredited Programs per 100,000 Population 10.5 10.2 10.4 10.5 10.6Percentage of Residents and Fellows in ACGME-Accredited Programs Who Are IMGs 22.9% 23.1% 22.4% 22.2% 20.5%Ratio of GME to UME 1.11 1.09 1.05 1.05 0.98
RetentionPercentage of Physicians Retained in State from UME 37.2% 39.2% 38.7% 38.6% 38.5%Percentage of Physicians Retained in State from Public UME 42.4% 45.5% 44.9% 43.9% 44.1%Percentage of Physicians Retained in State from GME 45.4% 45.7% 44.9% 44.5% 44.9%Percentage of Physicians Retained in State from UME and GME Combined 66.5% 67.4% 68.1% 68.4% 69.0%
1. 2009 State Physician Workforce Data Book, AAMC, aamc.org/download/47340/data/statedata2009.pdf.
2. 2011 State Physician Workforce Data Book, AAMC, aamc.org/download/263512/data/statedata2011.pdf.
3. 2013 State Physician Workforce Data Book, AAMC, https://members.aamc.org/eweb/upload/State%20Physician%20Workforce%20Data%20Book%202013%20(PDF).pdf.
4. 2015 State Physician Workforce Data Book, AAMC, aamc.org/2015statedatabook.
Association of American Medical Colleges65

17-162 (11/17)